managing reverse logistics or reversing logistics management? · 2016-03-10 · managing reverse...
TRANSCRIPT

MARISA P. DE BRITO
Managing ReverseLogistics or ReversingLogistics Management?

Managing Reverse Logistics
or
Reversing Logistics Management?
Marisa P. de Brito
ERIM PhD Series Research in Management, 35
Erasmus Research Institute of Management (ERIM)
Erasmus University Rotterdam
Internet: http://www.erim.eur.nl
Cover photo: ‘Reverse’http://images.google.nloriginally frompantransit.reptiles.org/images/nsorted/photo/animal/
ISBN 90-5892-058-6
c© 2003, Marisa P. de Brito
All rights reserved. No part of this publication may be reproducedor transmitted in any form or by any means, electronic or material,including photocopying, recording, or by any information storageand retrieval system, without permission from the author.
Managing Reverse Logisticsor
Reversing Logistics Management?
Beheersing van retourlogistiekof
omgekeerde beheersing van logistiek?
Thesis
to obtain the degree of Doctor fromthe Erasmus University Rotterdam
by command of theRector Magnificus
Prof.dr. S.W.J. Lambertsand according to the decision of the Doctorate Board
The public defense shall be held onThursday 12 February, 2004 at 16.00 hrs.
by
Marisa Paula de Brito Pereira Maduro
born at Luanda, Angola

Promoters: Prof.dr.ir. R. Dekker
Prof.dr. M. B. M. de Koster
Other members: Prof.dr.ir. J.A.E.E. van NunenProf.dr.ir. L.N. van WassenhoveProf.dr. T. Spengler
Acknowledgements
Finishing a PhD dissertation is certainly a moment to cheer. My PhD tra-jectory was full of many other happy moments because along the way I hadthe privilege to work with highly skilled colleagues, to enjoy the friendshipof many and the love of the ones most close to me. I will not mention youall, neither I will acknowledge you enough, but I can assure you that my trueacknowledgements are ampler than these few pages.
First of all, I would like to thank my promoters. I want to thank RommertDekker for giving me enough freedom in carrying out my research and forwelcoming my initiatives. I thank Rene de Koster for all his enthusiasm andfor making me feel we really worked as a team.
I also would like to acknowledge the contribution of the co-authors of mypapers, Beril Toktay, Dan Guide, Erwin van der Laan, Luk van Wassenhoveand Simme Douwe Flapper: I have learned much with all of you! Othershave also directly contributed to my research in various forms, as follows:Dr. Krever provided me with the CERN data and Lehel Nagy helped me toget the data from the database; Eric Porras Musalem assisted me in organiz-ing the data of the refinery; Julien Mostard was a helpful contact with themail-order-company; Marcin Paweska gave me a hand with information aboutEuropean legislation and Ruud Teunter and Pelin Bayindir co-monitored theNGT study.
During the past years of research I was affiliated with the EconometricInstitute (EI) from Rotterdam School of Economics, and I belonged as aPhD candidate to the Erasmus Research Institute of Management (ERIM).Both Institutes were very supportive during my PhD track, either at theprofessional or at the social level (leuke uitjes, hoor! ).
My research project was also very much embedded in the European Work-ing Group for Reverse Logistics (RevLog), which was financially supported bythe European Commission. I want to thank all RevLoggers for sharing withme their expertise, for the more and less formal conversations, and for thegreat time we had in every single workshop (I will never forget the Pedipaperin Costa da Caparica!) .
Belonging to RevLog gave me the opportunity to visit INSEAD and towork on a research project with Luk van Wassenhove, who I would like tothank for his prompt hospitality. During my time there I could experiencethe professionalism of the staff and the warmness of the PhD students. Mywarm thanks go especially to Evrim.
During my PhD’s ups and downs, I always had a special source of enjoy-ment and support: “the girls” and “the boys.” Anna, Daina, Fernanda, Gabi,

6
Helga, Julia, Laura, Lenny, Viara, ... : cheers for all the lunches, dinners,cocktails, parties, laughs, for the serious and less-serious conversations, andespecially for all the non-sense that made us wiser. Dennis, Julien, Eric, Ger-ard, Guillermo, Manolo, Paolo, Ruud, Willem, Wybe, ... : urra for all thebarbecues, picnics, movies, sportive events, and so forth.
I mainly met those mentioned above during my PhD trajectory. Yet, Iwould like to mention, what I believe was the conception of a potential PhD inthe Netherlands: my exchange period as an undergraduate student in the aca-demic year 1996/97, at the Econometric Institute of the Erasmus UniversityRotterdam. Then, I wrote my thesis on inventory control with Hans Frenkand closely watched by Marcel Kleijn. The proof of the success is that this isone of the areas I deal with in this PhD dissertation. I would like to thank onceagain the Department of Statistics and Operations Research (DEIO), Facultyof Sciences, University of Lisbon, for facilitating the exchange. In particular, Iwould like to thank the support and encouragement of my Professors JoaquimGromicho, Ivette Gomes, Antonia Turkman and Antonio Rodrigues.
I also want to acknowledge the precious financial support of the PortugueseFoundation for the Development of Science and Technology, Fundacao Paraa Ciencia e a Tecnologia (FCT).
I want to express my gratitude to my family, above all my parents: portudo, obrigada! In particular, I want to mention what I have learned frommy close family, which has proved most relevant for my research work. Thus:Pai, obrigada for impregnating me with the “what-if” state of mind, whichmakes so natural the act of thinking beyond current reality. Mae, obrigada foryour multi-functional way of carrying life, (a precious inherited talent, whichhelped me a lot in writing this thesis!). Obrigada mano Ze for influencing meon “always knowing exactly how things are/ work/ etc,” which started in myearly youth with looking up words in the dictionary and their whereabouts inthe encyclopedia. Obrigada mano Rui for teaching me to give my max whileworking in a team because, after all, every single thing is about people.
Finally, I would like to acknowledge who was much supportive during myPhD as a friend, as a partner, as a colleague, and even as a co-author: Er-win. We had so many moments related with my PhD that I deeply cherish.To mention only a few: going to conferences together, participating in groupdiscussions, making presentations together and most especially our disagree-ments about the Quans vs. the Quals in Science. Even the latter were verymuch enjoyable!
For all of you: ’brigada, dank, dziekuje, gracias, grazie, kiitt, ksznet, tank,tesekkr !
Contents
1 Introduction 171.1 Reverse Logistics: definition and scope . . . . . . . . . . . . . . 19
1.1.1 Definition and a brief history . . . . . . . . . . . . . . . 191.1.2 Delineation and scope . . . . . . . . . . . . . . . . . . . 201.1.3 The European dimension . . . . . . . . . . . . . . . . . 22
1.2 Literature on Reverse Logistics . . . . . . . . . . . . . . . . . . 231.2.1 Books on reverse logistics . . . . . . . . . . . . . . . . . 241.2.2 PhD theses on reverse logistics . . . . . . . . . . . . . . 251.2.3 Review articles on reverse logistics . . . . . . . . . . . . 261.2.4 Some literature on areas related to reverse logistics . . . 27
1.3 About the thesis . . . . . . . . . . . . . . . . . . . . . . . . . . 281.3.1 The structure . . . . . . . . . . . . . . . . . . . . . . . . 281.3.2 The process: aims, objectives and methods . . . . . . . 291.3.3 Research paradigms and this thesis . . . . . . . . . . . . 36
2 A Framework for Reverse Logistics 392.1 Introduction . . . . . . . . . . . . . . . . . . . . . . . . . . . . . 392.2 Methodology . . . . . . . . . . . . . . . . . . . . . . . . . . . . 412.3 Reverse Logistics: a review of literature on theoretical devel-
opments . . . . . . . . . . . . . . . . . . . . . . . . . . . . . . . 432.4 Reverse Logistics: the basic dimensions . . . . . . . . . . . . . 452.5 Reverse Logistics: why? what? how? who? . . . . . . . . . . . 48
2.5.1 Why-returning: drivers . . . . . . . . . . . . . . . . . . 482.5.2 Why-returning: return reasons . . . . . . . . . . . . . . 532.5.3 What: types and characteristics . . . . . . . . . . . . . . 552.5.4 How: processes and recovery options . . . . . . . . . . . 592.5.5 Who: actors and roles . . . . . . . . . . . . . . . . . . . 65
2.6 The framework . . . . . . . . . . . . . . . . . . . . . . . . . . . 672.7 Summary and conclusions . . . . . . . . . . . . . . . . . . . . . 77
7
8 Contents
3 Reverse Logistics: a review of case studies 793.1 Introduction . . . . . . . . . . . . . . . . . . . . . . . . . . . . . 793.2 Methodology . . . . . . . . . . . . . . . . . . . . . . . . . . . . 813.3 Statistics . . . . . . . . . . . . . . . . . . . . . . . . . . . . . . 823.4 Case studies on Reverse Logistics Networks . . . . . . . . . . . 84
3.4.1 The case studies . . . . . . . . . . . . . . . . . . . . . . 843.4.2 Preliminary insights . . . . . . . . . . . . . . . . . . . . 88
3.5 Case studies on Reverse Logistics Relationships . . . . . . . . . 893.5.1 The case studies . . . . . . . . . . . . . . . . . . . . . . 893.5.2 Preliminary Insights . . . . . . . . . . . . . . . . . . . . 92
3.6 Case studies on Inventory Management . . . . . . . . . . . . . 953.6.1 The case studies . . . . . . . . . . . . . . . . . . . . . . 953.6.2 Preliminary Insights . . . . . . . . . . . . . . . . . . . . 99
3.7 Case studies on Planning and Controlof recovery activities . . . . . . . . . . . . . . . . . . . . . . . . 993.7.1 The case studies . . . . . . . . . . . . . . . . . . . . . . 1003.7.2 Preliminary Insights . . . . . . . . . . . . . . . . . . . . 104
3.8 Case studies on IT for Reverse Logistics . . . . . . . . . . . . . 1053.8.1 The case studies . . . . . . . . . . . . . . . . . . . . . . 1053.8.2 Preliminary Insights . . . . . . . . . . . . . . . . . . . . 108
3.9 Overall insights . . . . . . . . . . . . . . . . . . . . . . . . . . . 1113.10 Summary and research opportunities . . . . . . . . . . . . . . . 115
3.10.1 Research opportunities . . . . . . . . . . . . . . . . . . . 119
4 Return Handling: decision-making and quantitative support1234.1 Introduction . . . . . . . . . . . . . . . . . . . . . . . . . . . . . 1234.2 Return Handling . . . . . . . . . . . . . . . . . . . . . . . . . . 1244.3 Return Handling: an illustrative case . . . . . . . . . . . . . . . 1254.4 Return Handling: a framework of decisions . . . . . . . . . . . 127
4.4.1 Long-term decisions . . . . . . . . . . . . . . . . . . . . 1274.4.2 Medium-term decisions . . . . . . . . . . . . . . . . . . 1304.4.3 Short-term decisions . . . . . . . . . . . . . . . . . . . . 133
4.5 Models and research opportunities . . . . . . . . . . . . . . . . 1334.5.1 Long-term decisions . . . . . . . . . . . . . . . . . . . . 1344.5.2 Medium-term decisions . . . . . . . . . . . . . . . . . . 1354.5.3 Short-term decisions . . . . . . . . . . . . . . . . . . . . 141
4.6 Summary and conclusions . . . . . . . . . . . . . . . . . . . . . 143
Contents 9
5 Return Handling: an exploratory study 1475.1 Introduction . . . . . . . . . . . . . . . . . . . . . . . . . . . . . 1475.2 Handling returns . . . . . . . . . . . . . . . . . . . . . . . . . . 1495.3 The case studies: brief description and design . . . . . . . . . . 1515.4 The case studies: analysis and comparison . . . . . . . . . . . . 153
5.4.1 Contextual factors . . . . . . . . . . . . . . . . . . . . . 1535.4.2 The process . . . . . . . . . . . . . . . . . . . . . . . . . 1575.4.3 Manpower, space and associated costs . . . . . . . . . . 161
5.5 Discussion and implications . . . . . . . . . . . . . . . . . . . . 1645.6 Conclusions . . . . . . . . . . . . . . . . . . . . . . . . . . . . . 170
5.6.1 Recommendations for practice . . . . . . . . . . . . . . 1725.6.2 Research opportunities . . . . . . . . . . . . . . . . . . . 174
6 Inventory Management: a critical analysis of assumptions 1776.1 Introduction . . . . . . . . . . . . . . . . . . . . . . . . . . . . . 1776.2 Inventory models with returns:
a literature review . . . . . . . . . . . . . . . . . . . . . . . . . 1786.2.1 Deterministic models . . . . . . . . . . . . . . . . . . . . 1796.2.2 Stochastic models . . . . . . . . . . . . . . . . . . . . . 179
6.3 Methodology . . . . . . . . . . . . . . . . . . . . . . . . . . . . 1836.3.1 Testing HCPP . . . . . . . . . . . . . . . . . . . . . . . 1846.3.2 Testing exponentiality of the time to return . . . . . . . 1846.3.3 Statistical tests: more details . . . . . . . . . . . . . . . 185
6.4 The data . . . . . . . . . . . . . . . . . . . . . . . . . . . . . . 1886.5 Data analysis . . . . . . . . . . . . . . . . . . . . . . . . . . . . 1906.6 Summary and conclusions . . . . . . . . . . . . . . . . . . . . . 199
6.6.1 Theoretical insights . . . . . . . . . . . . . . . . . . . . 2006.6.2 Managerial implications . . . . . . . . . . . . . . . . . . 2016.6.3 Research needs . . . . . . . . . . . . . . . . . . . . . . . 202
7 Inventory Management with product returns: the value ofinformation 205
7.1 Introduction . . . . . . . . . . . . . . . . . . . . . . . . . . . . . 2057.2 (Mis)information in practice . . . . . . . . . . . . . . . . . . . . 2067.3 Literature review . . . . . . . . . . . . . . . . . . . . . . . . . . 2087.4 Forecasting methods . . . . . . . . . . . . . . . . . . . . . . . . 2097.5 Forecasting performance . . . . . . . . . . . . . . . . . . . . . . 214
7.5.1 Analysis regarding the expectation of lead timenet demand . . . . . . . . . . . . . . . . . . . . . . . . . 215
7.5.2 Analysis regarding the variance of lead time net demand 216
10 Contents
7.6 Cost performance . . . . . . . . . . . . . . . . . . . . . . . . . . 2197.6.1 Experimental design . . . . . . . . . . . . . . . . . . . . 2197.6.2 Numerical study . . . . . . . . . . . . . . . . . . . . . . 220
7.7 Discussion and managerial implications . . . . . . . . . . . . . 2287.8 Summary of conclusions and further research . . . . . . . . . . 230
8 Reverse Logistics research: what does the future bring? 2458.1 Introduction . . . . . . . . . . . . . . . . . . . . . . . . . . . . . 2458.2 Methodology . . . . . . . . . . . . . . . . . . . . . . . . . . . . 246
8.2.1 An exploratory study . . . . . . . . . . . . . . . . . . . 2478.2.2 The Delphi study . . . . . . . . . . . . . . . . . . . . . . 247
8.3 An exploratory study . . . . . . . . . . . . . . . . . . . . . . . . 2488.3.1 Implementation and discussion . . . . . . . . . . . . . . 2488.3.2 Observations and input for the Delphi Study . . . . . . 251
8.4 Design and implementation of the Delphi . . . . . . . . . . . . 2528.5 Reverse Logistics researchers and the panel . . . . . . . . . . . 2538.6 Reverse Logistics: past, present and future . . . . . . . . . . . . 254
8.6.1 Research . . . . . . . . . . . . . . . . . . . . . . . . . . . 2548.6.2 Trends and breakthroughs . . . . . . . . . . . . . . . . . 2578.6.3 Pedagogy . . . . . . . . . . . . . . . . . . . . . . . . . . 259
8.7 The senior, the junior and the accidental . . . . . . . . . . . . . 2618.8 European vs. North American researchers . . . . . . . . . . . . 2628.9 A glimpse on the rest of the world . . . . . . . . . . . . . . . . 2668.10 Summary and conclusions . . . . . . . . . . . . . . . . . . . . . 267
9 Concluding remarks 2719.1 Summary and conclusions . . . . . . . . . . . . . . . . . . . . . 2719.2 Raising questions and further research . . . . . . . . . . . . . . 282
Bibliography 287
Samenvatting (Summary in Dutch) 313
Curriculum Vitae 319
List of Figures
1.1 The body of the thesis . . . . . . . . . . . . . . . . . . . . . . . 30
2.1 Building the framework . . . . . . . . . . . . . . . . . . . . . . 422.2 The five basic dimensions of reverse logistics. . . . . . . . . . . 472.3 Driving triangle for reverse logistics. . . . . . . . . . . . . . . . 492.4 The typology ‘drivers’ for the dimension ‘why-receiving’. . . . . 522.5 The typology ‘return reasons’ for the dimension ‘why-returning’. 562.6 The typologies ‘product characteristics’ and ‘product types’ for
the dimension ‘what’. . . . . . . . . . . . . . . . . . . . . . . . 602.7 The typologies ‘processes’ and ‘recovery options’ for the dimen-
sion ‘how’. . . . . . . . . . . . . . . . . . . . . . . . . . . . . . . 632.8 Recovery option inverted pyramid . . . . . . . . . . . . . . . . 642.9 Reverse logistics processes . . . . . . . . . . . . . . . . . . . . . 652.10 The typologies ‘actors’ and ‘roles’ for the dimension ‘who’. . . . 662.11 Who is who in reverse logistics . . . . . . . . . . . . . . . . . . 672.12 A framework for reverse logistics. . . . . . . . . . . . . . . . . . 692.13 Illustrative example of by-product returns. . . . . . . . . . . . . 702.14 Illustrative example of functional returns. . . . . . . . . . . . . 712.15 Illustrative example of reimbursement returns. . . . . . . . . . 722.16 Illustrative example of service returns. . . . . . . . . . . . . . . 732.17 Illustrative example of end-of-use returns. . . . . . . . . . . . . 742.18 Illustrative example of end-of-life returns. . . . . . . . . . . . . 75
3.1 IT support for Reverse Logistics in different phases of the life-cycle of the product. . . . . . . . . . . . . . . . . . . . . . . . . 110
4.1 Return handling in the warehouse. . . . . . . . . . . . . . . . . 124
5.1 Reverse flows in the supply chain. . . . . . . . . . . . . . . . . . 1485.2 The process of handling returns. . . . . . . . . . . . . . . . . . 1505.3 The process of handling returns, with and without returns. . . 163
11
12 List of Figures
5.4 Decision-scheme on general long- and medium-term warehous-ing decisions. . . . . . . . . . . . . . . . . . . . . . . . . . . . . 173
5.5 Decision-making scheme on combining vs. separating forwardand reverse flows during transport, receipt and storage. . . . . 174
6.1 Statistical analysis scheme to test if a process is an HCPP. . . . 1856.2 Stabilizer gas: date of purchase vs. purchased quantity. . . . . 1926.3 Large agenda: date of purchase vs. purchased quantity. . . . . 1926.4 Large agenda: dot-plot of the purchased quantity. . . . . . . . . 1956.5 Large agenda: histogram of the purchased quantity. . . . . . . 1956.6 Group 2 of products: four probability plots. . . . . . . . . . . . 1966.7 MOC Fashion 2000: histogram of the return lag. . . . . . . . . 1976.8 RF: histogram of the return lag. . . . . . . . . . . . . . . . . . 198
7.1 Relation between data and decision-making. . . . . . . . . . . . 2077.2 Method A (it uses the overall return probability to compute
the expected returns coming from demand during the lead time.2117.3 Method B (it uses past demand and return probabilities p′js to
compute returns coming from past demand and it employeesexpected values for returns coming from demand during thelead time). . . . . . . . . . . . . . . . . . . . . . . . . . . . . . . 212
7.4 Method C (it uses information on past demand and past re-turns to compute the returns coming from past demand; ituses information on current demand to compute returns com-ing from period t; and it uses expected value to compute returnscoming from demand during the lead time). . . . . . . . . . . . 212
7.5 Method D (it uses information on past demand and observedreturns from each past demand to compute the returns comingfrom past demand; it uses information on current demand tocompute returns coming from period t; and it uses expectedvalue to compute returns coming from demand during the leadtime). . . . . . . . . . . . . . . . . . . . . . . . . . . . . . . . . 213
7.6 Preference regions for F{V } in terms of a and Ri; πi = βi = 0.6,p = 0.7. . . . . . . . . . . . . . . . . . . . . . . . . . . . . . . . 217
7.7 Preference regions in terms of a and Ri for various values of πi
and p. . . . . . . . . . . . . . . . . . . . . . . . . . . . . . . . . 2187.8 Misinformation (-30%,+30%) of the expected time-to-return
(Geometric time-to-return distribution, p = 0.8, q = 0.6, µD =30, cvD = 0.2, L = 4, h = 1, b = 50). . . . . . . . . . . . . . . . . 225
List of Figures 13
7.9 Performance of Method A both under perfect correlation andzero correlation (Geometric time-to-return distribution, p =0.5, q = 0.6, µD = 30, cvD = 0.2, L = 4, h = 1, b = 50). . . . . . . 228
8.1 Representation of the sheet of paper given to the participants. . 2508.2 Past research contributions: relative ratings; 100% corresponds
to the highest sum of ratings . . . . . . . . . . . . . . . . . . . 2638.3 Current research limitations: relative ratings; 100% corresponds
to the highest sum of ratings. . . . . . . . . . . . . . . . . . . . 2638.4 Future research opportunities: relative ratings; 100% corre-
sponds to the highest sum of ratings. . . . . . . . . . . . . . . . 2658.5 Achieving relevance for Reverse Logistics. . . . . . . . . . . . . 269
List of Tables
1.1 Recycling quotas in Europe (data collected in 2003 with * beinga prognosis). . . . . . . . . . . . . . . . . . . . . . . . . . . . . 23
1.2 List of aims . . . . . . . . . . . . . . . . . . . . . . . . . . . . . 311.3 Motivation, objectives, methods and aims (by project) . . . . . 321.4 Basic beliefs of four main research paradigms. . . . . . . . . . . 37
3.1 Key words used for the search of case studies . . . . . . . . . . 813.2 United Nations classifications for Industry (see http://esa.un.org) 833.3 United Nations classifications for Product (see http://esa.un.org) 833.4 Case Studies on Reverse Logistics Networks . . . . . . . . . . . 853.5 Case Studies on Relationships . . . . . . . . . . . . . . . . . . . 903.6 Case studies: return-reason vs. incentive . . . . . . . . . . . . . 943.7 Case Studies on Inventory Management . . . . . . . . . . . . . 963.8 Case Studies on Production, Planning and Control . . . . . . . 1013.9 Case Studies on IT . . . . . . . . . . . . . . . . . . . . . . . . . 1073.10 Case studies: IT tools, requirements and benefits for reverse
logistics . . . . . . . . . . . . . . . . . . . . . . . . . . . . . . . 1093.11 The cases: return reasons vs. recovery options . . . . . . . . . . 1123.12 The cases: drivers vs. return reasons . . . . . . . . . . . . . . . 1133.13 The kind of elements to be considered in more detail . . . . . . 115
4.1 A framework of decisions for return handling. . . . . . . . . . . 1294.2 Research opportunities for long-term decisions . . . . . . . . . . 1354.3 Research opportunities for medium-term decisions. . . . . . . . 1404.4 Research opportunities for short-term decisions . . . . . . . . . 143
5.1 Outgoing and return flows (in roll cages, per week) at the foodretailers. . . . . . . . . . . . . . . . . . . . . . . . . . . . . . . . 155
5.2 Outgoing and return flows (in roll cages, per year) at SC1, SC2and SC3. . . . . . . . . . . . . . . . . . . . . . . . . . . . . . . 156
5.3 Return type and policy at nine retailers. . . . . . . . . . . . . . 158
14
List of Tables 15
5.4 The return process at the nine retailers. . . . . . . . . . . . . . 1605.5 Manpower (in FTE) and space (m2) at the retailers with stores.1615.6 Simple estimation of the costs for mail order companies, with
and without returns in euros (see Figure 5.3). . . . . . . . . . . 1635.7 Material flow per manpower (in FTE): forward vs. return flow. 1665.8 Material flow per area (in m2): forward vs. reverse flow. . . . . 1675.9 Decision on whether to combine (C) vs. to separate (S) the
forward and the reverse flows. . . . . . . . . . . . . . . . . . . . 1685.10 To combine (C) vs. to separate (S) the forward and the reverse
flows: critical factors and implications. . . . . . . . . . . . . . . 171
6.1 The assumptions of the literature on inventory models withreturns. . . . . . . . . . . . . . . . . . . . . . . . . . . . . . . . 181
6.2 Statistical analysis of two products of CERN’s database. . . . . 1916.3 Outcome of the investigation whether, or not, time until return
is negative exponentially distributed. . . . . . . . . . . . . . . . 194
7.1 Notation. . . . . . . . . . . . . . . . . . . . . . . . . . . . . . . 2107.2 Comparison of Methods A–D in the case of perfect information;
Geometric time-to-return distribution; µD = 30. ∗) resultsbelow 1% are not significant. . . . . . . . . . . . . . . . . . . . 221
7.3 Comparison of Methods A–D in the case of perfect information;Uniform time-to-return distribution; µD = 30. ∗) results below1% are not significant. . . . . . . . . . . . . . . . . . . . . . . . 222
7.4 Comparison of Methods B–D in the case of misestimation ofthe return probability; Geometric time-to-return distribution;µD = 30. ∗) results below 1% are not significant. . . . . . . . . 223
7.5 Comparison of Methods B–D in the case of misestimation of thereturn probability; Uniform time-to-return distribution; µD =30. ∗) results below 1% are not significant. . . . . . . . . . . . . 224
7.6 Comparison of Methods B–D in the case of misestimation ofthe expected time-to-return; Geometric time-to-return distri-bution; µD = 30. ∗) results below 1% are not significant. . . . . 226
7.7 Comparison of Methods B–D in the case of misestimation of theexpected time-to-return; Uniform time-to-return distribution;µD = 30. ∗) results below 1% are not significant. . . . . . . . . 227
8.1 Employed arguments during NGT. . . . . . . . . . . . . . . . . 2508.2 Topics covered by the Delphi questionnaire. . . . . . . . . . . . 2528.3 Reverse Logistics: describing three kinds of researchers. . . . . 2548.4 Reverse Logistics research: past, present and future. . . . . . . 255

16 List of Tables
8.5 Top research trends and breakthroughs with high impact andlikelihood. . . . . . . . . . . . . . . . . . . . . . . . . . . . . . . 258
8.6 Top pedagogic challenges and utilities with high priority. . . . . 2598.7 Realism, rigor and links: average ratings. . . . . . . . . . . . . 2618.8 Top research trends: North America vs. Europe. . . . . . . . . 2648.9 Top research breakthroughs with high likelihood: North Amer-
ica vs. Europe. . . . . . . . . . . . . . . . . . . . . . . . . . . . 265
Chapter 1
Introduction
“A long trip starts with the first step”Lao Tse
Twenty years ago, supply chains were diligently fine-tuning the logistics fromraw materials to the end customer. Today an increasing flow of products isgoing back in the chain.
Thus, companies have to manage reverse logistics as well. Yet, logis-tic managers typically think “forward,” putting the emphasis on moving thegoods to the clients. The issue is, whether or not, companies can go on, andmanage reverse logistics, with a purely forward-based thinking. Or, perhaps,there is a need for a considerable share in focus with respect to reverse flows.The question is then: is it a matter of simply managing reverse logistics or ofreversing logistics management?
Reverse logistics practices are in the position of being an asset ratherthan a liability. When a consumer gets rid of a product, this does not meanthat the product is valueless. For instance, computers might contain preciousmetals such as gold, palladium, platinum, and silver, and these materials arestill intact when the computer reaches obsolescence. Actually, one metric tonof electronic scrap from personal computers (PC’s) has more gold than thatextracted from a 17 ton of gold ore. Taking into account that millions of PC’sbecome obsolete every year, it is not surprising that many consider obsoletecomputers a “Gold Mine” (USGS, 2001). Global Investment Recovery, Inc. isone of the many companies providing services in this area. Global InvestmentRecovery, Inc. was funded in 1992 and it processes millions of circuit boardsevery year (see Global Investment Recovery, 2003).
17
18 Chapter 1. Introduction
Many other examples can be given, as the role of reverse logistics is in-creasing in the whole range of industries, covering electronic goods, pharma-ceutical products, beverages and so on. For more than a decade, Kodak sellsremanufactured single-use photo cameras and ReCellular has a mobile phoneremanufacturing business; all sorts of companies handle many of their prod-ucts in reusable packaging, like Coca-cola (refillable bottles), Philip Morris(pallets), and Estee Lauder’s Aveda (merchandize displays), see Kodak, 2003;Recellular, 2003; Coca-cola, 2003; Andriesse, 1999.
Companies are also investing on information technology dedicated to re-verse logistics, like Estee Lauder’s, which recovered the investment in oneyear. Other companies, like L’Oreal push high quantities of products to theretailers, because what is not sold can always be brought back (see Meyer,1999; Coenen, 2000).
Reverse logistics is therefore a key competence in modern supply chains.Accordingly, the importance of reverse logistics is widely recognized. Reverselogistics has renowned professional organizations, like the Reverse LogisticsExecutive Council (RLEC) in the U.S., which collaborates with academia.In Europe, the European Commission has shown, for long, interest in thedevelopment of the field by sponsoring international scientific projects onreverse logistics, such as RevLog and Reloop (see Revlog, 2003; ReLoop,2003).
This thesis is from the beginning rooted in one of these pan-Europeanprojects, namely RevLog, the European Working Group on Reverse Logistics.
This thesis contributes to a better understanding of reverse logistics. Webring insights to reverse logistics decision-making and to the field of reverselogistics as a whole. With respect to the initial question, is it a matter ofsimply managing reverse logistics or of reversing logistics management?, weencourage the reader to bear it in mind along the whole thesis. We will comeback to it in the last chapter.
In the next section we put forward the definition and scope of reverselogistics. Then, we review some of the literature on the topic, including keymonographs, PhD theses and reviews. After that, we present the structureof the thesis, and we put forward the aims, objectives and the methods em-ployed.
1.1. Reverse Logistics: definition and scope 19
1.1 Reverse Logistics: definition and scope
1.1.1 Definition and a brief history
“In the sweat of your face you shall eat breadTill you return to the ground,For out of it you were taken;For dust you are,And to dust you shall return.”Genesis 3:19
Though the idea of reverse logistics dates from long ago (as the citationabove attests), the naming is difficult to trace with exactness. Though sys-tematically related with recycling, terms like Reverse Channels or ReverseFlow already emerge in scientific literature of the seventies (Guiltinan andNwokoye, 1974; Ginter and Starling, 1978).
During the eighties, the definition was inspired by the movement of flowsagainst the traditional flows in the supply chain, or as put by Lambert andStock, 1981 “going the wrong way” (see also Murphy, 1986 and Murphy andPoist, 1989).
In the early nineties, a formal definition of Reverse Logistics was put to-gether by the Council of Logistics Management, stressing the recovery aspectsof reverse logistics (Stock, 1992):
“...the term often used to refer to the role of logistics in recycling, wastedisposal, and management of hazardous materials; a broader perspective in-cludes all issues relating to logistics activities to be carried out in source re-duction, recycling, substitution, reuse of materials and disposal.”
The previous definition is rather broad, as it is manifest in the followingexcerpts “the role of logistics in ... all relating ... activities.” (see also Kopickyet al., 1998). Besides this, it has origins in a waste management standpoint.In the same year Pohlen and Farris (1992) define Reverse Logistics, givingagain notice of a direction in a distribution channel, as follows:
“...the movement of goods from a consumer towards a producer in a chan-nel of distribution.”
Carter and Ellram (1998) keep the concept linked to environmental pur-poses, as follows: “the process whereby companies can become environmen-tally efficient through recycling, reusing, and reducing the amount of materialsused.”
20 Chapter 1. Introduction
At the end of the nineties, Rogers and Tibben-Lembke (1999) portrayedReverse Logistics by stressing the goal and the intrinsic (logistics) processes:
“The process of planning, implementing, and controlling the efficient, cost-effective flow of raw materials, in-process inventory, finished goods, and re-lated information from the point of consumption to the point of origin for thepurpose of recapturing value or proper disposal.”
The European Working Group on Reverse Logistics, (see De Brito andDekker, 2004), puts forward the following definition, which is used in thisthesis:
“The process of planning, implementing and controlling backward flowsof raw materials, in-process inventory, packaging and finished goods, from amanufacturing, distribution or use point, to a point of recovery or point ofproper disposal”.
This perspective on Reverse Logistics keeps the essence of the definition asput forward by Rogers and Tibben-Lembke (1999), which is logistics. Howeverit generalizes “point of consumption” to “a manufacturing, distribution oruse point” and “point of origin” to “a point of recovery or point of properdisposal.” In this way we give margin to return flows that were not consumedfirst (for instance, stock adjustments due to overstocks or spare parts whichwere not used). We employ the expression “point of recovery” instead of“point of origin” since flows may go back to other points of recovery thanthe original (e.g. collected computer chips may enter another chain). Besidesthis, “point of recovery” stresses the distinction we want to make betweenreverse logistics and pure waste management activities (see next section).Furthermore, we include the reverse direction through the term “backwardflows,” to exclude what can be considered as forward recovery. For instance,when a consumer gives his/her personal computer to the neighbor.
In summary, the definition of Reverse Logistics has changed over time,starting with a sense of reverse direction, going through an overemphasis onenvironmental aspects, coming back to the original pillars of the concept,and finally widening its scope. For other discussions on the evolution of thedefinition of reverse logistics, we refer to Rogers and Tibben-Lembke (2001)and to Fernandez (2003).
1.1.2 Delineation and scope
Since Reverse Logistics is a relatively new research and empirical area, thereader may encounter other terms in the literature, like reversed logistics,
1.1. Reverse Logistics: definition and scope 21
return logistics and retro logistics or reverse distribution, sometimes referringto roughly the same. In fact, the diversity of definitions with respect torecovery practices is a well-recognized source of misunderstandings both inresearch as in practice (Melissen and De Ron, 1999).
It is important to observe that Reverse Logistics is different from wastemanagement as the latter mainly refers to collecting and processing productsor materials that are to be discarded. The crux in this matter is the definitionof waste. This is a major issue, as the term has severe legal consequences,e.g. with respect to regulations on import/export of waste. Reverse Logisticsconcentrates on those streams where there is some value to be recovered andthe outcome enters a (new) supply chain.
Reverse Logistics also differs from Green Logistics as the latter considersenvironmental aspects to all logistics activities and it has been focused specif-ically on forward logistic, i.e. from producer to customer (see Rodrigue etal., 2001). The prominent environmental issues in logistics are consumptionof nonrenewable natural resources, air emissions, congestion and road usage,noise pollution, and both hazardous and non-hazardous waste disposal (seeCamm, 2001).
Industrial Ecology is another field that relates to Reverse Logistics. Asexplained in Garner and Keoleian (1995), Industrial Ecology is primarily ded-icated to the study of the interactions between industrial systems and theenvironment. The underlying aim is to change the linearity of industrial sys-tems, from raw materials to waste, into a cyclical system, i.e. with productor materials recovery. In the latter, Reverse Logistics undoubtedly plays amajor role.
Finally, reverse logistics can be seen as part of Sustainable Development.The latter has been defined by Brundland (1998) in a report to the EuropeanUnion as “to meet the needs of the present without compromising the abilityof future generations to meet their own needs.” In fact one could regardReverse Logistics as the implementation at the company level of processesthat guarantee that society uses and re-uses both efficiently and effectivelyall the value which has been put into products.
The border between Forward Logistics, from raw materials to end user,and Reverse Logistics, from e.g. the end user to recovery or to a new user, isnot strictly defined. One can wonder about for instance what “raw materials”are in certain supply chains. For instance, used/recovered glass constitutesconsiderable material input for new production of glass.
A holistic view on supply chains combining both forward and reverse logis-tics is embraced by the concept of Closed-Loop Supply Chains (Guide and vanWassenhove, 2003). Recovery practices are framed within the supply chain,
22 Chapter 1. Introduction
and the encircling aspect of the process as a whole is therefore stressed: hav-ing either 1) a physical closed-loop: to the original user (see Fleischmann etal., 1997); or 2) a functional closed-loop: to the original functionality; or 3)an open-loop, when neither the original user or original functionality are inthe reverse logistics process. The denomination closed-loop supply chains em-phasizes the importance of coordinating the forward with the reverse streams.
Reverse Logistics is different but relates with other fields of research suchas green logistics and industrial ecology, as discussed above. In the academicworld, these fields inhabit separate islands, but they lay in the same sea. Theknowledge in each field has been growing quite independently of the knowledgein related fields, but commonalities persist due to the similarities of the overallenvironment. We believe that we only have to gain by establishing structurallinks among the fields, even though we have to cross a period of confusion asindicated in the previous section.
1.1.3 The European dimension
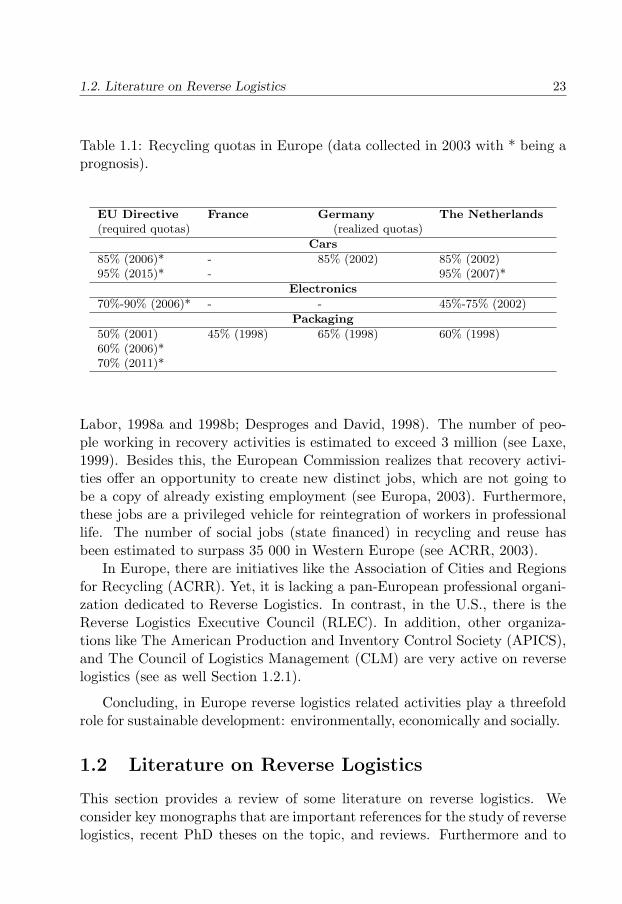
In Europe, the European Union has stimulated sustainable development foryears, including recovery practices through environmental legislation. Recentdevelopments show that this legislation and its consequences are ever increas-ing. Priority product flows include: cars (Directive 00/53/EC), electronics(Directive 02/96/EC) and packaging (Directive 99/31/EC). Table 1.1 summa-rizes the state-of-the-art of recycling quotas (required, realized or expected)in some of the EU countries (see Jordan et al., 2001; European EnvironmentalAgency, 2002; Auto Recycling Nederland, 2003; Arge Altauto, 2003; Doppeltand Nelson, 2001; Europa, 2003).
Though the Member States are also encouraged to introduce preven-tion and reuse systems, they have some more freedom on this than on themandatory recycling quotas (Greece, Ireland and Portugal are allowed toset lower targets). Concerning packaging waste, for instance, The Nether-lands, Spain and Belgium launched prevention targets (some in the form ofcovenants), while Denmark, Germany and Portugal introduced reuse targets.Joint recycling-reuse targets are in force in Austria and Finland (the latteralso has explicit prevention targets).
The link between reverse logistics activities and employment has not yetbeen thoroughly investigated. We do know that some of the recovery activ-ities like recycling are labor intensive. Studies have indicated that recyclingactivities create 5 to 7 times the number of jobs than incineration and morethan 10 times than land filling operations. (See Austrian Federal Chamber of
1.2. Literature on Reverse Logistics 23
Table 1.1: Recycling quotas in Europe (data collected in 2003 with * being aprognosis).
EU Directive France Germany The Netherlands(required quotas) (realized quotas)
Cars
85% (2006)* - 85% (2002) 85% (2002)95% (2015)* - 95% (2007)*
Electronics
70%-90% (2006)* - - 45%-75% (2002)
Packaging
50% (2001) 45% (1998) 65% (1998) 60% (1998)60% (2006)*70% (2011)*
Labor, 1998a and 1998b; Desproges and David, 1998). The number of peo-ple working in recovery activities is estimated to exceed 3 million (see Laxe,1999). Besides this, the European Commission realizes that recovery activi-ties offer an opportunity to create new distinct jobs, which are not going tobe a copy of already existing employment (see Europa, 2003). Furthermore,these jobs are a privileged vehicle for reintegration of workers in professionallife. The number of social jobs (state financed) in recycling and reuse hasbeen estimated to surpass 35 000 in Western Europe (see ACRR, 2003).
In Europe, there are initiatives like the Association of Cities and Regionsfor Recycling (ACRR). Yet, it is lacking a pan-European professional organi-zation dedicated to Reverse Logistics. In contrast, in the U.S., there is theReverse Logistics Executive Council (RLEC). In addition, other organiza-tions like The American Production and Inventory Control Society (APICS),and The Council of Logistics Management (CLM) are very active on reverselogistics (see as well Section 1.2.1).
Concluding, in Europe reverse logistics related activities play a threefoldrole for sustainable development: environmentally, economically and socially.
1.2 Literature on Reverse Logistics
This section provides a review of some literature on reverse logistics. Weconsider key monographs that are important references for the study of reverselogistics, recent PhD theses on the topic, and reviews. Furthermore and to
24 Chapter 1. Introduction
give an idea of opportunities for multidisciplinary reverse logistics studies, wepresent a snap overview of research in related areas.
1.2.1 Books on reverse logistics
In the nineties, the Council of Logistics Management (CLM) published threerelevant studies on reverse logistics. The first one, actually one of the firststudies making a thorough exam of reverse logistics, introduced the subjectfrom a waste reduction perspective (Stock, 1992). Based on interviews withUS industry and governmental organizations, the author concluded that re-verse logistics was still at its very beginning. Accordingly, the companies wererather reactive in dealing with it. Shortly after this first study, CLM pub-lished the second study, now dedicated to the opportunities offered by reverselogistics in the context of reuse and recycling (Kopicky et al., 1993). Theauthors concluded that reverse logistics was evolving very fast with manycompanies having pioneer programs on waste reduction. After introducingthe field, and having showed the opportunities, CLM brought forward a thirdstudy dedicated to the implementation and development of reverse logistics(Stock et al., 1998). This study gave form to relevant issues for successfulreverse logistics programs, like management and control, measurement andfinance.
Kostecki (1998) took a marketing approach to reflect on the optimal useof consumer durable products. The approach linked consumers’ preferencesand the business challenge of reuse. The book reported on several businessexamples of product stewardship programmes such as the ones of Kodak andXerox.
Also in the late nineties, Rogers and Tibben-Lembke (1999) conductedinterviews in the U.S. with 150 managers and a survey with hundreds ofothers. The study focused on the economic and supply chain issues of reverselogistics and how to reduce costs related with product returns.
Three more books are likely to join this year the collection of key-referencesfor reverse logistics research: Guide and van Wassenhove edit a book aboutClosed-Loop Supply Chains, and the European Working Group on ReverseLogistics, RevLog, brings out two more books, one on quantitative methodsand the other on cases from practice (Dekker et al., 2003; Flapper et al.,2003). Next, we describe in more detail the contents of these three books.
Guide and van Wassenhove (2003) closely consider the business aspectsof closed-loop supply chains. The book handles subjects such as the recov-ery options and the relations between parties, namely questions related withcontracting. Particular issues include logistics, production planning and in-
1.2. Literature on Reverse Logistics 25
ventory control in the supply chain. Other embraced aspects are forecasting,information technology, technology diffusion and product design, where thefulcrum is the customer. From a more business perspective, the economicsof closed-loop supply chains and the issue of acquisition management are dis-cussed.
One of the RevLog books is dedicated to quantitative modelling as foraiding reverse logistics decision-making (Dekker et al., 2003). Models arebrought together, compared with traditional literature, related to each otherand linked to real life examples. The models cover collection, distribution,inventory control, production planning and supply chain management issues.The book embraces particular subjects such as forecasting of returns, networkdesign, vehicle routing, return handling, lot-sizing decisions, co-ordination,environmental and information management. The other RevLog book (Flap-per et al., 2003) is on managing closed-loop supply chains and it is a collectionof case studies with the respective lessons for managing reverse logistics prac-tices.
1.2.2 PhD theses on reverse logistics
There have been a number of PhD theses on the field of reverse logistics.Next, we describe a sample of those.
Thierry (1995) studied the impact of product recovery management in theelectronics and car industries. Special attention was given to the impact onproduct design, logistics, and relations between actors. The author made useof two real life cases: a copy remanufacturing company and product recoveryby the car manufacturer BMW.
Jahre (1995) investigated the performance of collection and recycling sys-tems of household waste, with specific emphasizes on packaging materials.Two main aspects were taken into account: the degree of separation at thesource and co-collection. The author employed data provided by the Euro-pean Recovery and Recycling Association (ERRA).
Van der Laan (1997) analyzed the effects of remanufacturing on inven-tory control. Special attention went to coordination mechanisms between themanufacturing and remanufacturing operations and to which actions deal tocost-efficiency. The findings were tested with real data from Volkswagen oncar parts remanufacturing.
Krikke (1998) addressed the determination of recovery strategies and thelogistics network design. For each of the issues, a case study was discussed indetail. On the recovery strategies, for the recycling of computer monitors, theauthor considerd Roteb, the municipal waste company of the city of Rotter-
26 Chapter 1. Introduction
dam, in the Netherlands. On logistics network design, the author dealt withthe copier reverse logistics network of the international company Oce, withheadquarters in Venlo, the Netherlands.
Fleischmann (2000) dealt with quantitative models for reverse logisticsnetwork design and for inventory management with returns. In particular,the thesis inquired under which conditions a network can be split into twoseparate networks, the forward and the reverse. In addition, the practicalissues arising from reverse logistics were illustrated with a case study at IBM.
Beullens (2001) focused on the use of Operations Research (OR) tools forsupporting the facility location decision, process planning and vehicle routingin reverse logistics. All the issues were illustrated with real life examples.
Kobeissi (2001) considered the evaluation of options for recovery of end-of-life products. The thesis described the required resources and the differentactivities of the evaluation process. Also the dissertation of Landrieu (2001) isabout end-of-life products. The focus was on the collection strategies, takinginto account the product, or the geographic zone of collection. The measuresof performance were maximization of profit and the satisfaction of the client.Besides this, particular informational issues were considered as follows: howto integrate information in the collection schemes and what is the impact onefficiency.
Brodin (2002) analyzed the influence of both the product and the relation-ship between actors on the efficiency of logistics systems for recycling. To doso, the author made use of 1) a case study of the electronics recycling in theNetherlands; 2) a survey of the Swedish recycling market; and 3) interviewswith Ericsson, Telia (large customer of telecommunications equipment), StenaTechnoworld (recycling company) and Tekpak (a US package producer).
As expected, each of the reviewed PhD dissertation dealt with a set of par-ticular issues within reverse logistics. A diversity of subjects can be found suchas recycling systems, inventory control of remanufacturing, recovery strate-gies, network design and vehicle routing. Furthermore, most of the thesesmade a link with practice. The theses included studies on the electronics andcommunication industries (IBM, Ericsson), automobile industry (BMW andVolkswagen), and packaging industry (Tekpak), among others.
1.2.3 Review articles on reverse logistics
Fleischmann et al. (1997) compiled a review on Operations Research (OR)models for reverse logistics. The review is organized in terms of distribution,inventory control and production planning models. The authors pointed outthe need for comprehensive approaches, taking into account both the economic
1.2. Literature on Reverse Logistics 27
and the ecological aspects in the supply chain.Gungor and Gupta (1999) presented an exhaustive review of more than
300 articles or books on environmentally conscious manufacturing and prod-uct recovery. The authors observe that environmental issues are becomingpopular among society, governments and industry. In addition, they identifythe need to develop both qualitative and quantitative tools to support properenvironmental conscious manufacturing decision-making.
Carter and Ellram (1998) put together a review of transportation andpackaging, purchasing and other literature on reverse logistics. The authorsdeduce from the literature that there were both internal and external factorsaffecting the behavior of organizations with respect to reverse logistics. Next,they build up a model with a combination of determinants for reverse logistics,and based on it they indicate opportunities for future investigation.
Bras and McIntosh (1999) reviewed the literature specifically dedicatedto remanufacturing. The authors distinguish between descriptive and devel-opmental work, i.e. work simply meant to characterize the current state andthe future of remanufacturing and work aiming at improving remanufacturingaspects. The authors conclude that the work up to then intended: to describepractice; to motivate remanufacturing; to improve product and design for re-manufacturing; to learn from traditional manufacturing; and, to improve theprocess.
De Brito et al. (2003) put forward a review of case studies on reverselogistics, covering various aspects like network design, inventory control andinformation technology. This review and its findings are central in Chapter 3of this thesis.
1.2.4 Some literature on areas related to reverse logistics
Here we present a snap overview of other research work that, though it isrelated with reverse logistics, it is focused mainly on other research area.This gives an idea of the existing opportunities for multidisciplinary reverselogistics studies.
Van Nes (2003) focus on product design as a mean of influencing productlifetime. The author first checks whether, or not, it is desirable to extend thelife cycle of products. For most of the products investigated an increase inlifetime is desirable. The next step in the research is directed to provide anunderstanding of the motivation of consumers to substitute their products.Finally, the author provides insights on how to extend the product lifetimeby changing product design.
28 Chapter 1. Introduction
Beukering (2001) investigates the economic and the environmental impor-tance of recycling for international trade mechanisms. The author discussesthe trade of waste paper for recycling in India, the recycling and trade inwaste plastics in China and the trade and recycling of truck tyres in Europe.
Hirsch et al. (1998) show how a simulation tool, called LOCOMOTIVEcan aid on reverse logistics decision making. The tool is able to simulatethe whole life cycle and to assess environmental impacts of different logis-tics operations within a globally distributed production network. The toolis meant to support middle and upper management, assisting on strategicdecision-making.
Stroeker (1995) gives the marketing and economics perspective on second-hand consumer durable goods from. Demographic and lifestyle consumercharacteristics are taken into account as context variables as the price struc-ture and the bargaining process in second-hand markets were studied. Fur-thermore, the author presents a model to predict the purchase of second-handdurable goods.
This section on work related to reverse logistics accommodates studieson research areas such as Design (for end-of-life), Trade (with respect torecycling), Computer Science (simulation tools to support decision-making),and Economics and Marketing (analysis of second-hand markets).
1.3 About the thesis
1.3.1 The structure
Besides the existing areas “affiliated” to reverse logistics, the previous reviewof literature shows that there are many subjects of research inherent to reverselogistics. The review embraced studies on recovery systems; studies dedicatedto a particular form of recovery like recycling, or to a specific decision-arealike network design, inventory management or vehicle routing; another setreviewed work was on structuring the field, or on pulling lessons from real-lifeexamples.
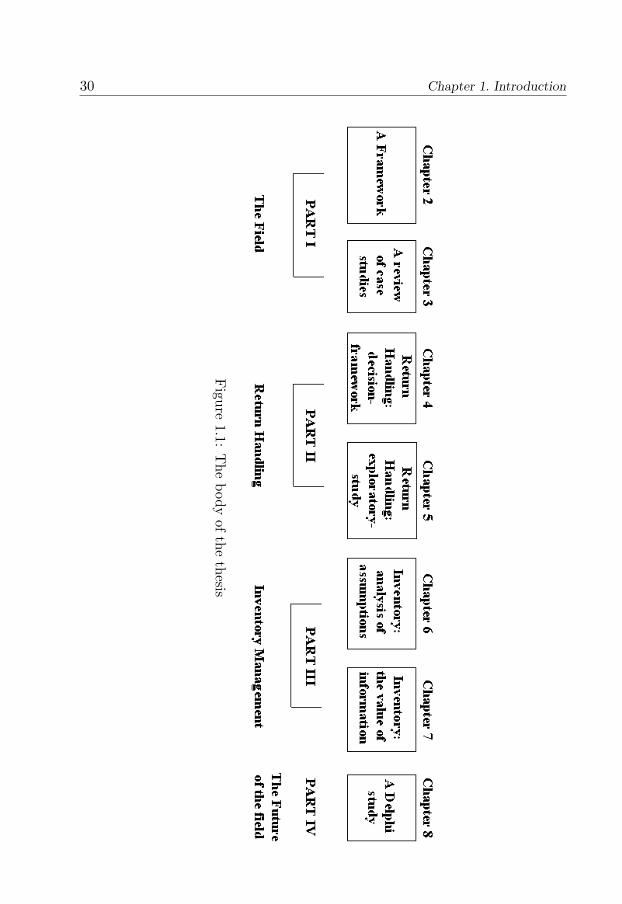
The set of topics we could elect to carry out research is very vast. Weopted to become engaged with a number of projects, divided in 4 blocks, asfollows (see Figure 1.1):
• Part I on the theoretical development of the field;
• Part II on decision-making and return handling;
• Part III on decision-making and inventory management;
1.3. About the thesis 29
• Part IV on the future development of the field.
In the reverse logistics field, return handling is an emerging cluster ofknowledge, while inventory management is a well-established cluster of knowl-edge. Both offer many possibilities for research. As the first gives the oppor-tunity to explore fresh issues, the second poses the challenge of being ableto contribute to on-going discussions. This explains our choices of topics forblocks II and III.
Next, we explain more about how this structure was born, which arethe aims, what are the particular objectives and which was the employedmethodology to achieve them.
1.3.2 The process: aims, objectives and methods
With this doctoral thesis, we committed to make a contribution according tothe following two main lines:
• 1) reverse logistics as a research/academic field;
• 2) reverse logistics decision-making and practice.
Next, we present the correspondent aims.
Aims
To put together the aims we employ two sorts of input: on the one hand,researchers with expertise on reverse logistics; and on the other hand, reverselogistics (related) literature. Both the contact with experienced researchersand a scan of the literature lead to the following conclusions:
• reverse logistics is a young field, growing fast, but with scattered andfragmented theoretical contributions (see e.g. Melissen and Ron, 1999);
• besides this, there is a strong need to better understand reverse logisticsdecision-making processes and to learn from them;
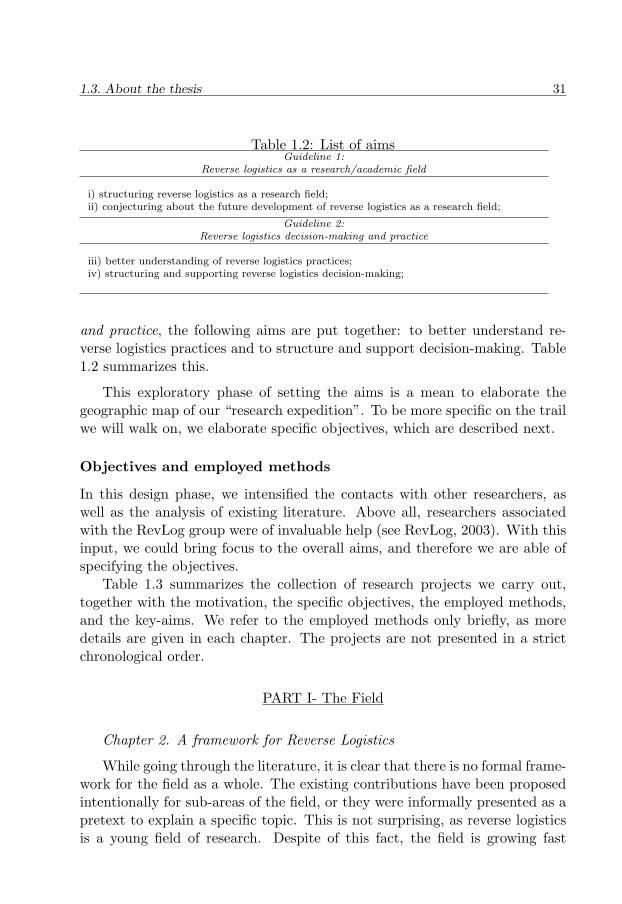
Aligned with our first main line, reverse logistics as a research/academicfield, we establish the following aims: to structure reverse logistics as a re-search field. Furthermore, since reverse logistics is a young field of research, wealso plan to look ahead, and to conjecture about the future development of thefield. With respect to the second main line, reverse logistics decision-making
30 Chapter 1. Introduction
Figure
1.1:T
hebody
ofthe
thesis
1.3. About the thesis 31
Table 1.2: List of aimsGuideline 1:
Reverse logistics as a research/academic field
i) structuring reverse logistics as a research field;ii) conjecturing about the future development of reverse logistics as a research field;
Guideline 2:Reverse logistics decision-making and practice
iii) better understanding of reverse logistics practices;iv) structuring and supporting reverse logistics decision-making;
and practice, the following aims are put together: to better understand re-verse logistics practices and to structure and support decision-making. Table1.2 summarizes this.
This exploratory phase of setting the aims is a mean to elaborate thegeographic map of our “research expedition”. To be more specific on the trailwe will walk on, we elaborate specific objectives, which are described next.
Objectives and employed methods
In this design phase, we intensified the contacts with other researchers, aswell as the analysis of existing literature. Above all, researchers associatedwith the RevLog group were of invaluable help (see RevLog, 2003). With thisinput, we could bring focus to the overall aims, and therefore we are able ofspecifying the objectives.
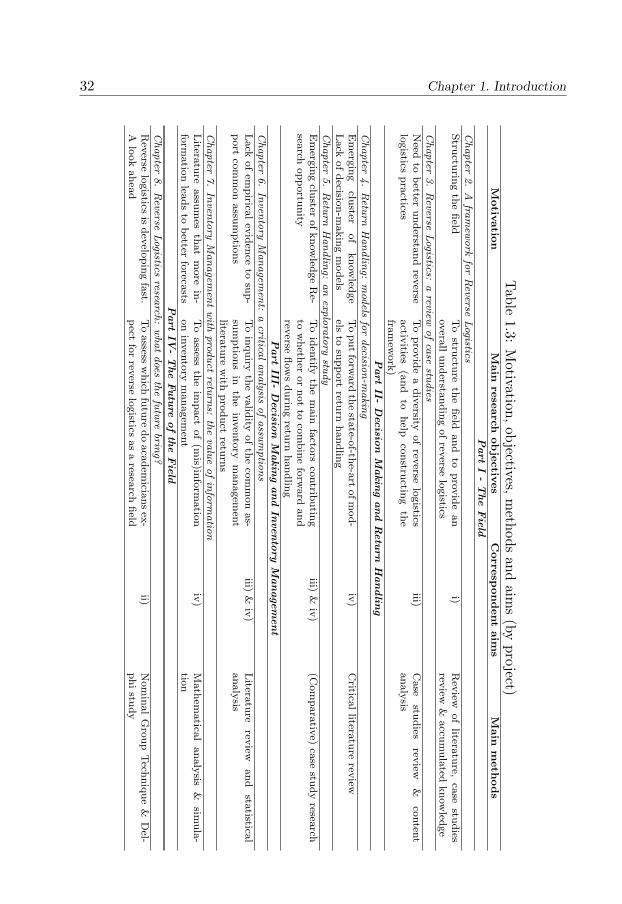
Table 1.3 summarizes the collection of research projects we carry out,together with the motivation, the specific objectives, the employed methods,and the key-aims. We refer to the employed methods only briefly, as moredetails are given in each chapter. The projects are not presented in a strictchronological order.
PART I- The Field
Chapter 2. A framework for Reverse Logistics
While going through the literature, it is clear that there is no formal frame-work for the field as a whole. The existing contributions have been proposedintentionally for sub-areas of the field, or they were informally presented as apretext to explain a specific topic. This is not surprising, as reverse logisticsis a young field of research. Despite of this fact, the field is growing fast
32 Chapter 1. Introduction
Table
1.3:M
otivation,ob
jectives,m
ethodsand
aims
(byproject)
Motiv
atio
nM
ain
rese
arch
obje
ctiv
es
Corresp
ondent
aim
sM
ain
meth
ods
Part
I-
The
Fie
ldChapter
2.
Afra
mew
ork
for
Reverse
Logistics
Stru
cturin
gth
efield
To
structu
reth
efield
and
topro
vid
ean
overa
llundersta
ndin
gofrev
erselo
gistics
i)R
eview
of
literatu
re,ca
sestu
dies
review
&accu
mula
tedknow
ledge
Chapter
3.
Reverse
Logistics:
areview
ofca
sestu
dies
Need
tobetter
understa
nd
reverse
logistics
pra
cticesTo
pro
vid
ea
div
ersityof
reverse
logistics
activ
ities(a
nd
tohelp
constru
cting
the
fram
ework
)
iii)C
ase
studies
review
&co
nten
tanaly
sis
Part
II-D
ecisio
nM
akin
gand
Retu
rnH
andlin
gChapter
4.
Retu
rnH
andlin
g:m
odels
for
decisio
n-m
akin
gE
merg
ing
cluster
of
know
ledge
Lack
ofdecisio
n-m
akin
gm
odels
To
putfo
rward
the
state-o
f-the-a
rtofm
od-
elsto
support
return
handlin
giv
)C
riticallitera
ture
review
Chapter
5.
Retu
rnH
andlin
g:an
explo
rato
rystu
dy
Em
ergin
gclu
sterofknow
ledge
Re-
search
opportu
nity
To
iden
tifyth
em
ain
facto
rsco
ntrib
utin
gto
wheth
eror
not
toco
mbin
efo
rward
and
reverse
flow
sdurin
gretu
rnhandlin
g
iii)&
iv)
(Com
para
tive)
case
study
research
Part
III-D
ecisio
nM
akin
gand
Invento
ry
Managem
ent
Chapter
6.
Inven
tory
Managem
ent:
acritica
lanaly
sisofassu
mptio
ns
Lack
ofem
pirica
lev
iden
ceto
sup-
port
com
mon
assu
mptio
ns
To
inquiry
the
valid
ityofth
eco
mm
on
as-
sum
ptio
ns
inth
ein
ven
tory
managem
ent
literatu
rew
ithpro
duct
return
s
iii)&
iv)
Litera
ture
review
and
statistica
lanaly
sis
Chapter
7.
Inven
tory
Managem
entwith
prod
uct
return
s:th
eva
lue
ofin
form
atio
nLitera
ture
assu
mes
that
more
in-
form
atio
nlea
ds
tobetter
foreca
stsTo
assess
the
impact
of
(mis)in
form
atio
non
inven
tory
managem
ent
iv)
Math
ematica
lanaly
sis&
simula
-tio
nPart
IV-
The
Futu
reofth
eFie
ld
Chapter
8.
Reverse
Logistics
research
:whatdoes
the
futu
rebrin
g?R
everse
logistics
isdev
elopin
gfa
st.A
look
ahea
dTo
assess
which
futu
redo
aca
dem
iciansex
-pect
for
reverse
logistics
as
aresea
rchfield
ii)N
om
inal
Gro
up
Tech
niq
ue
&D
el-phistu
dy
1.3. About the thesis 33
demanding to be formally structured. With this research project, we makea close re-examination of the field and we propose a framework, providing aformal structure and with it an overall understanding about reverse logisticsmanagement and decision-making.
To build-up the framework we use three basic inputs: 1) a review of theliterature dealing with the organization of the field throughout classifications,2) an interactive process with a review of case studies as a tool to groundthe development of the framework in empirical evidence, and 3) generatedknowledge.
By the latter we refer to all the knowledge acquired during this doctoraltrajectory. The whole process of conducting other research projects provided“data” to build the framework. This “data” takes the form of accumulatedknowledge, and it results from collaborating with senior researchers, fromattending conferences and from carrying out several other different projectsabout reverse logistics. Another source of knowledge is non-scientific litera-ture, as well as the unavoidable awareness of real-life reverse logistics situa-tions.
Chapter 2 gives insights on the diversity of reverse logistics systems and onits complexity by putting together a framework for reverse logistics. Reverselogistics is characterized via four basic aspects: why companies get involvedwith reverse logistics and why products go back in the supply chain; how areproducts recovered and which are the main recovery options; what is actuallybeing returned; and finally, who are the main players in a reverse logisticssystem. More on the methodology behind this research project, can be foundin a section of Chapter 2. Another version of this chapter has appeared in DeBrito and Dekker (2003).
Please bear in mind that the research projects are not presented in chrono-logical order.
Chapter 3. Reverse Logistics: a review of case studies
The motivation for this research project is in essence the need to better un-derstand reverse logistics practices. One finds however quite some literatureon case studies applied to a diversity of industries. This literature is howeverscattered over journals for very different research communities. Besides this,in countries in the forefront of reverse logistics a substantial number of casestudies have been published in other languages than the lingua franca and aretherefore not accessible for the majority of the research community. To givea fair idea of the diversity of reverse logistics practices, we employ a contentanalysis of more than sixty real reverse logistics cases. The analysis is basedon the framework of Chapter 2. Thus, Chapter 3 is also a life test of the
34 Chapter 1. Introduction
applicability of the framework, and of the completeness of the classificationsproposed by the framework. Chapter 3 presents the case studies accordingthe following decision-making focus: Network Structures, Relationships, In-ventory Management, and Planning and Control. We remark particular issuesand unanswered questions, which we link with a research agenda. For someof these decision making groups, some of the aforementioned questions arepredominantly important. We also discuss that and we provide research di-rections to test these premisses. A previous version of Chapter 3 can be foundin De Brito, et al. (2003).
PART II- Decision-making and return handling
Chapter 4. Return Handling: models for decision-making
Return handling is an emerging cluster of knowledge. Since this cluster isin the looming phase, there are not many models supporting decision-makingin this area. This motivates an investigation on the opportunities that forwardquantitative models for material handling offer for return handling models.To do so, we put together a decision-making framework for return handlingand we proceed to a critical analysis of the literature. The chapter reviewsthe main findings of general material handling literature giving suggestionsto adapt such models for return handling. An early version has appeared inDe Brito and De Koster (2004).
Chapter 5. Return Handling: an exploratory study
The details of return handling operations have been so far overlooked inthe scientific literature. More specifically, there is a need to better understanddecision-making regarding the transport, the actual handling and the storageof product returns. In particular, insights are missing on the factors influ-encing the decision of combining, or not, forward and reverse flows duringthese processes. Chapter 5 focuses on this by comparing the return handlingprocesses of nine retailer warehouses. The analysis gives insights into criticalfactors, complicating issues, possible simplifying solutions and practical im-plications. The chapter ends with a discussion of propositions that can feedfuture studies on return handling efficiency. This research project was pub-lished in the International Journal of Retail and Distribution Management(De Koster et al., 2002).
1.3. About the thesis 35
PART III- Decision-making and inventory management
Chapter 6. Inventory Management: a critical analysis of assumptions
In contrast with return handling, inventory management with productreturns is, for some time, a well-established cluster of knowledge. Much lit-erature is available on the subject. An analysis of this literature shows thatcertain assumptions are very often used. At the same time, the trustworthi-ness of these assumptions has been repeatedly challenged due to the lack ofempirical evidence. With this research project we inquire on the validity ofthe common assumptions, by proceeding to a statistical analysis of real data.
Chapter 6 checks empirically the validity of common assumptions in theliterature dealing with inventory control with product returns. This chapterfirst proposes a general methodology to check the assumptions empiricallyand then it describes actual practice in companies with respect to informa-tion storage on returns and inventory control. Furthermore, the methodologyis employed to real data from three companies and the practical implicationsare discussed. The companies are the European Organization for Nuclear Re-search (CERN) in Switzerland, and a mail order company and a refinery, bothin the Netherlands. The findings have practical relevance, for instance withrespect to information management on inventory systems with returns. Thefindings of this research were earlier published in the International Journal ofProduction Economics (De Brito and Dekker, 2003).
Chapter 7. Inventory Management and product returns: the value of in-formation
Chapter 7 evaluates the impact of misinformation for inventory systemswith product returns. If one could exactly know how much is going to be re-turned and when, one would certainly benefit from incorporating this perfectinformation a priori in the management of production, inventory, and distri-bution. In practice, one has to attempt to forecast the timing and the amountof product returns, by hypothesizing about the return flow properties. To doso, historic data on demand and returns can be used. The available literatureon information and inventory management with product returns commonly1) assumes known return probabilities; or 2) considers specific cases wherethe most-informed method leads to the best forecast. Chapter 7 identifiessituations in which the most informed method does not necessarily lead tothe best performance, investigating the impact on inventory related costs. Seealso related publications: De Brito and van der Laan (2003) and Toktay etal. (2004).
36 Chapter 1. Introduction
PART IV- The future of the field
Chapter 8. Reverse logistics research: what does the future bring?
Since reverse logistics is a rapidly progressing field, with this researchproject we look ahead and are able to conjecture on the future developmentof reverse logistics. This project is developed in two phases. The first and ex-ploratory phase employs the Nominal Group Technique. The second is basedon a Delphi study with an international panel of academics working on re-verse logistics issues. Some of the outcomes are recommendations concerningresearch and teaching about reverse logistics. In this way, this study assistsdecision-making concerning proposals, and research priorities with respect toreverse logistics. Furthermore, the chapter reports on the contrasts and/orsimilarities between the European and North American researchers’ perspec-tives. The exploratory study is also reported in De Brito (2003) and thesecond part is in De Brito and van Wassenhove (2003).
Finally Chapter 9 summarizes the main findings, discusses the limitationsand proposes guidelines for future research on reverse logistics.
1.3.3 Research paradigms and this thesis
No research is conducted without a set of underlying beliefs, held more or lessconsciously by the one carrying it out. Besides this, others will also judge hisor her research based on a set of own beliefs.
Table 1.4 summarizes the basic beliefs of the four main streams of paradigms,which have been traditionally identified in the literature (for more details seeGuba and Lincoln, 1994; Tashakkori and Teddlie, 1998; Healy and Perry,2000).
Instead of strictly following one paradigm, this research takes a pragmaticapproach in the sense that the research question is primordial in each researchproject, and the method is chosen accordingly. In this context, pragmatismis an attractive paradigm because it welcomes a priory any methodology,including mixed methodologies. Besides this, it stays clear of interminableand ineffectual discussions on metaphysical concepts like “truth” or “reality.”Furthermore, pragmatism has also been proposed as a departing reference fordecision-making in management (see Fontrodona, 2002). Finally it exemptsthe reader from an in-depth knowledge on extensive criteria to assess thequality of the research. This is because the criterion for assessing the qualityof pragmatic inquire relies on asking whether, or not, the employed methodsfulfill the objective of answering the research question.
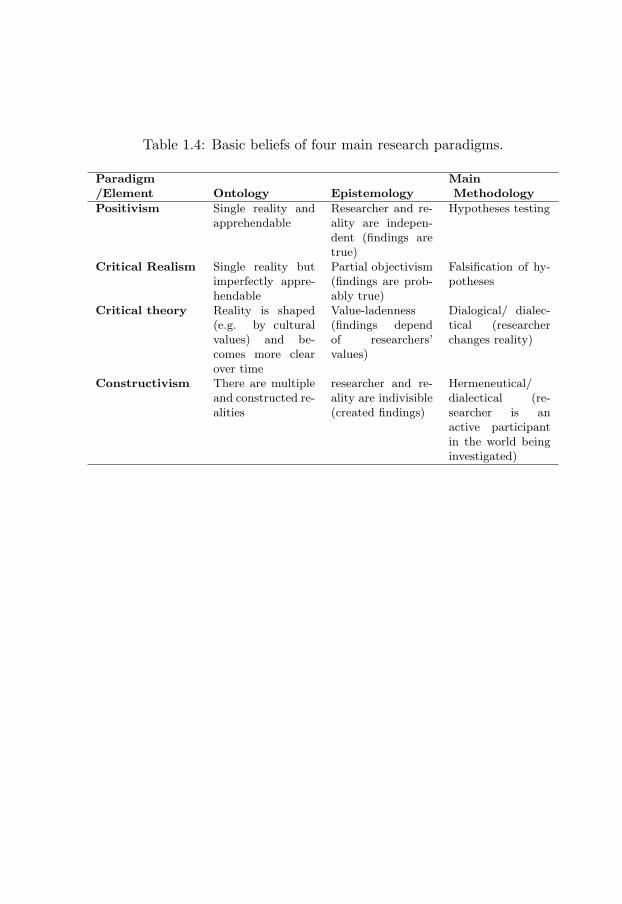
Table 1.4: Basic beliefs of four main research paradigms.
Paradigm Main/Element Ontology Epistemology Methodology
Positivism Single reality andapprehendable
Researcher and re-ality are indepen-dent (findings aretrue)
Hypotheses testing
Critical Realism Single reality butimperfectly appre-hendable
Partial objectivism(findings are prob-ably true)
Falsification of hy-potheses
Critical theory Reality is shaped(e.g. by culturalvalues) and be-comes more clearover time
Value-ladenness(findings dependof researchers’values)
Dialogical/ dialec-tical (researcherchanges reality)
Constructivism There are multipleand constructed re-alities
researcher and re-ality are indivisible(created findings)
Hermeneutical/dialectical (re-searcher is anactive participantin the world beinginvestigated)

Chapter 2
A Framework for ReverseLogistics
“We adore chaos because we love to produce order.”
M. C. Escher
2.1 Introduction
The objective of this chapter is to provide an overall understanding of reverselogistics by structuring the field. In fact, we put together a framework forreverse logistics. A framework is “a basic conceptional structure” (see theMerrian Encyclopedia, 2003). Ergo, here we put forward a basic conceptionalstructure for reverse logistics, i.e. we identify the elementary ingredients(dimensions) of reverse logistics, we structure them, and we describe theirrelation to each other. With the framework we provide a basic understandingabout reverse logistics situations, since we
1. identify the basic dimensions of reverse logistics,
2. classify different types for each dimension (we provide typologies),
3. explain the relations between the basic dimensions of reverse logistics,and
4. illustrate how the characterization of the basic dimensions helps us toidentify the problematic issues and the associated decision-making areasof a given reverse logistics situation.
39
40 Chapter 2. A Framework for Reverse Logistics
In spite of many genuine efforts, up to now the contributions to organizethe field are scattered and fragmented. This is not a surprise, since reverselogistics is a young field of research. Despite of this, the field is growingfast, demanding thus to be formally structured. This is because one cannotprovide substantial insights into reverse logistics without first being familiarwith its basics elements. Neither a theory on critical factors for successfulreverse logistics can be properly developed. Thus, the framework is valuableas
1. a means to provide a holistic view on reverse logistics situations,
2. a tool to characterize the basic features of reverse logistics situations,
3. an instrument to understand the demands of different reverse logisticssituations with respect to the type of decisions that are crucial, and as
4. a necessary platform to provide further insights in the field, possiblyincluding the development of theory.
To build the framework we employ three sources of input: selective litera-ture that brings structure to the field, a review of case studies (Chapter 3of this thesis), and the knowledge on reverse logistics that was accumulatedthroughout the whole PhD trajectory.
To extract data from the inputs, we proceed to a content analysis of theaforementioned literature, an interactive process with the case study review(which was carried out simultaneously), and a tacit intellectual record of thebasic dimensions of reverse logistics. The next section describes the method-ology in more detail.
Summarizing, the main contributions of this chapter are as follows.
1. We put forward a framework for reverse logistics as a whole.
2. We build the framework with an underlying methodology.
3. We ground the typologies of the framework in empirical evidence (casestudies).
The remainder of the chapter is organized as follows. First, we clarify whatthe methodology behind the project is (Section 2.2). Section 2.3 reviewsspecific literature that contributes to the organization of the field. Next,Section 2.4 puts together the skeleton of the framework by identifying thebasic dimensions of reverse logistics. Section 2.5 provides the “mass” for
2.2. Methodology 41
the skeleton by presenting the typologies for each of the basic dimensions.Section 2.6 articulates the framework by describing the relations between thebasic dimensions and showing the research opportunities. Finally, Section 2.7provides a summary and conclusions.
2.2 Methodology
The overall approach of this research project is very much inline with theprinciples of Grounded Theory. As described in Strauss and Corbin (2000):“Grounded theory is a general methodology for developing theory that isgrounded in data systematically gathered and analyzed.” Furthermore, theauthors explain that it is “a way of thinking about and conceptualizing data”and an attempt to generate theory that is grounded in the data. We wouldlike to stress that it is a way of thinking about data, as well as a way ofconceptualizing data.
Since Grounded Theory grounds findings on data, it is thus an appropriatemethodology to build-up a framework, which is a means to understand thefield. To put together the framework, we make use of the following threesources of data (see also Figure 2.1).
1. We employ existing literature,
- to re-examine the field,
- to identify the basic dimensions of reverse logistics, and
- to have a start-up for the typologies (when possible).
2. We employ the case study review in an interactive way, mainly as
- a means to empirically ground the typologies,
- a means to improve the completeness and adequateness of the ty-pologies, and
- a means to refine the naming of the elements of each of the typolo-gies.
3. We employ the knowledge accumulated during the whole PhD trajectoryto strengthen the research with another source of data (triangulation).
The first procedure is rather explicit. In Section 2.3 we explain how theliterature leads to the skeleton of the framework, i.e. the basic dimensions.
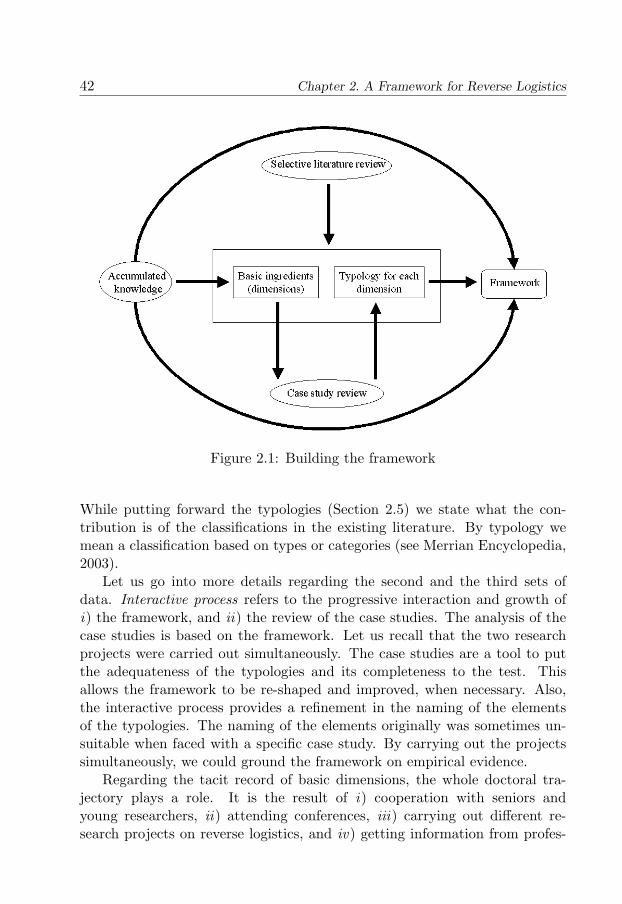
42 Chapter 2. A Framework for Reverse Logistics
Figure 2.1: Building the framework
While putting forward the typologies (Section 2.5) we state what the con-tribution is of the classifications in the existing literature. By typology wemean a classification based on types or categories (see Merrian Encyclopedia,2003).
Let us go into more details regarding the second and the third sets ofdata. Interactive process refers to the progressive interaction and growth ofi) the framework, and ii) the review of the case studies. The analysis of thecase studies is based on the framework. Let us recall that the two researchprojects were carried out simultaneously. The case studies are a tool to putthe adequateness of the typologies and its completeness to the test. Thisallows the framework to be re-shaped and improved, when necessary. Also,the interactive process provides a refinement in the naming of the elementsof the typologies. The naming of the elements originally was sometimes un-suitable when faced with a specific case study. By carrying out the projectssimultaneously, we could ground the framework on empirical evidence.
Regarding the tacit record of basic dimensions, the whole doctoral tra-jectory plays a role. It is the result of i) cooperation with seniors andyoung researchers, ii) attending conferences, iii) carrying out different re-search projects on reverse logistics, and iv) getting information from profes-
2.3. Reverse Logistics: a review of literature on theoretical developments 43
sional journals on the field, newspapers and internet sites. During the wholePhD-trajectory there was awareness about this being the third source of datafor building the framework. It is important to note that this awareness isactually the crux regarding this third source of data, so at all the momentsdata could be gathered for the project. In addition, notice that a plurality ofapproaches is employed, known as triangulation.
Triangulation is further achieved by carrying out research projects in twodifferent areas of the field: on the one end, research on an emerging clusterof knowledge, and, on the other end, research in a well-established cluster ofknowledge. The contents of these projects can be found respectively in PartII (Return Handling) and Part III (Inventory Management) of this thesis.
Furthermore, the criteria to choose the structure and to build-up theframework can be summarized as follows (see Tashakkori and Teddlie, 1998;Fleischman and Mumford, 1991).
- The structure has to be based on primary dimensions that characterizereverse logistics.
- The framework has to be parsimonious, i.e. simplicity will be favored.
- The internal validity needs to be preserved by preserving consistency.
- The construct validity needs to be preserved. This is taken care ofby selecting the basic constructs, i.e. the dimensions of the frameworkaccording to their meaningfulness to the understanding of the field.
2.3 Reverse Logistics: a review of literature on the-oretical developments
The focus of this section is on literature contributing to structuring the field.
Thierry et al. (1995) describe strategic issues in product recovery manage-ment. To facilitate the analysis, the authors first give a list of the options forproduct recovery management. The options are characterized according to thelevel of disassembly (product/ module/ part, etc.), the quality required (high/upgrade to new, etc.), and the resulting product (parts/ modules/ materials,etc.). The paper uses three case studies (BMW, IBM, and an anonymouscopier remanufacturer) to illustrate strategic product recovery management.The authors do so by highlighting the changes in operations when the threecompanies got engaged in recovery.
44 Chapter 2. A Framework for Reverse Logistics
Fleischmann et al. (1997) present a review on quantitative models forreverse logistics. Before coming to the review itself, the authors put forwarda classification of the situations in which reuse occurs. The classification isgiven according to the following dimensions: motivation for reuse, the typeof recovered items, the form of reuse, and the involved actors. The paperthen goes over the available models to support reverse distribution, inventorycontrol in systems with return flows and production planning with reuse ofparts and materials.
Fuller and Allen (1997) put together a review of several important conceptsin the context of recycling of post-consumer solid waste. Thus, a classificationof the following recycling systems is given: manufacturer-integrated systems,waste-hauler systems, specialized dealer-processor systems, forward retailer-wholesaler systems, and temporary/facilitator systems. The authors arguethat the classification shows that the reverse distribution channels are makinga link between the source (post-consumer waste) and the market. The articlethen continues with a discussion whether, or not, the reviewed variety ofsystems are likely to be able to deal with the challenges of the future.
Carter and Ellram (1998) review the literature on reverse logistics to iden-tify existing gaps and accordingly to propose an agenda for future investiga-tion. While doing so, the authors identify drivers (regulators, customers,and entrepreneurs), and constraints (such as stakeholder commitment, topmanagement, and vertical integration) regarding reverse logistics. The au-thors distinguish between internal and external forces, i.e. company factorsand the task environment. Then a research agenda is built based on a setof propositions, such as “successful reverse logistics programs require effec-tive policy making,” or “top management support is necessary to ensure thecontinued success of reverse logistics.”
Gungor and Gupta (1999) present an extensive review of the literature(more than 300 articles and books) on environmentally conscious manufac-turing and product recovery. They subdivide the literature in categories, out-lining a framework. The authors look upon product recovery from the pointof view of environmentally conscious manufacturing. Both the regulationsand the pressure caused by government and customers are mentioned.
Goggin and Browne (2000) suggest a classification for resource recovery, fo-cused on the electronics industry and on products at the end of their life. Theclassification is given according to the following main lines: generic options,operations (order or planning driven activities), and specific characteristics(input and output complexity; degree of involvement by the OEM; collection,
2.4. Reverse Logistics: the basic dimensions 45
process and distribution complexity; and routing variability). Furthermorethe paper discusses electronic equipment manufacturing situations.
The existing categorizations in the field of reverse logistics, are
1. intentionally proposed for a solitarily restricted sub-area of the field, or
2. informally put forward to facilitate the analysis of a specific topic
Implicitly, these categorizations lack generalizability for reverse logisticsas a whole, as they constitute partial characterizations of reverse logisticssituations. Since, however reverse logistics is not yet a well-structured researcharea, the aforementioned references are actually important seeds in organizingthe field. Next section describes how we use them in more detail.
Ultimately, let us emphasize that, in contrast with the previous literature,this chapter does not focus on any specific form of reverse logistics. Instead,we put forward overall basic dimensions of reverse logistics, such that a frame-work on reverse logistics as a whole is put forward. Besides this, none of thereviewed references explicitly describes which was the methodology to comeup with the suggested ingredients and the proposed classifications. Here, weground the framework on previous knowledge and on empirical evidence, asdescribed in the previous section, and as attested in the next sections.
2.4 Reverse Logistics: the basic dimensions
The reviewed literature brings order with respect to some identified ingredi-ents in the universe of reverse logistics. As the review shows, for some ingre-dients a typology is given, others are simply used to introduce the analysis.Next we list the ingredients.
- motivation (Fleischmann, 1997)- drivers (Carter and Ellram, 1998)- environmental forces (Gungor and Gupta, 1999).
- type of items (Fleischmann, 1997)
- recovery options (Thierry, 1995)- generic (recovery) options (Goggin and Browne, 2000)- forms of reuse (Fleischmann, 1997)
46 Chapter 2. A Framework for Reverse Logistics
- actors (Fleischmann, 1997)- recycling systems classified according to the actors in the system (Fuller
and Allen, 1997)
Some of the ingredients are common to several of the references, though some-times they are phrased differently. As the above list already suggests, theingredients can be clustered as follows.
• drivers (also called ‘motivation’ or ‘environmental forces’)
• type of items
• recovery options (also called ‘forms of reuse’)
• actors
A closer look shows that actually these are answers to the following funda-mental questions:
• why is there recovery?
• what is recovered?
• how is the recovery done?
• who is doing the recovery?
These fundamental questions constitute basic dimensions of reverse logistics.Yet, the literature does not give a formal classification of answers to all thefour questions. Besides this, though there are some formalized classificationsthat are rather complete, others are not, or the structure behind it was neverexplained. For instance, the list of recovery options put forward by Thierry etal. (1995) is logically explained, rather complete, and generally accepted. Incontrast, the semi-formalized classification of type of items (see Fleischmannet al., 1999) includes only packaging, spare parts, and consumer goods. Indus-trial goods, and others, are kept out. This is not a surprise, as many authorsdo not intend to formally structure the field. Besides this, the existing litera-ture does not attempt to ground the classifications in empirical evidence forreverse logistics as a whole.
Section 2.5 provides typologies for the basic dimensions of reverse logistics.There we state what is the contribution from existing classifications, or welogically argue how we arrive to them. To this end, the contribution of thecase study review is very important. The framework and the case study
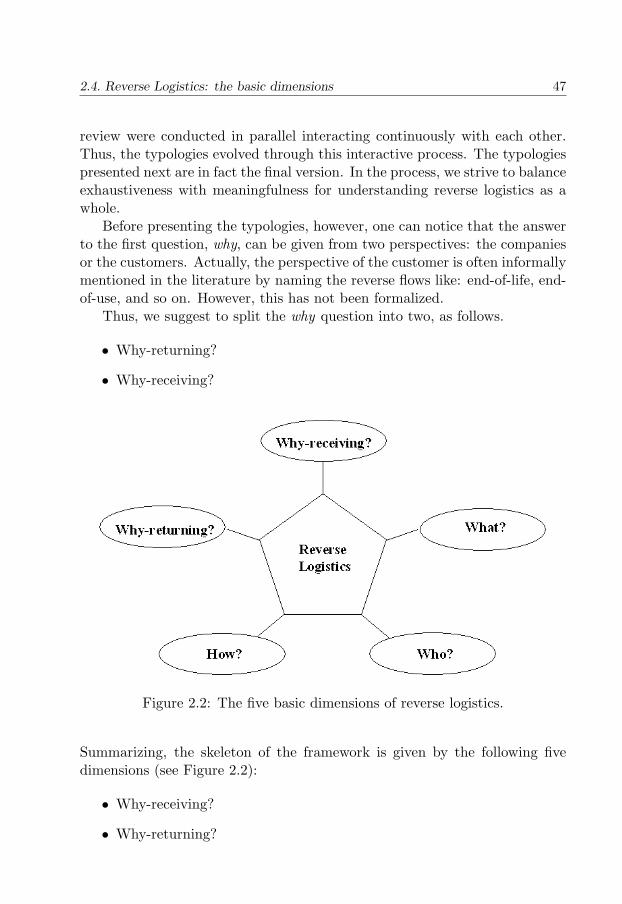
2.4. Reverse Logistics: the basic dimensions 47
review were conducted in parallel interacting continuously with each other.Thus, the typologies evolved through this interactive process. The typologiespresented next are in fact the final version. In the process, we strive to balanceexhaustiveness with meaningfulness for understanding reverse logistics as awhole.
Before presenting the typologies, however, one can notice that the answerto the first question, why, can be given from two perspectives: the companiesor the customers. Actually, the perspective of the customer is often informallymentioned in the literature by naming the reverse flows like: end-of-life, end-of-use, and so on. However, this has not been formalized.
Thus, we suggest to split the why question into two, as follows.
• Why-returning?
• Why-receiving?
Figure 2.2: The five basic dimensions of reverse logistics.
Summarizing, the skeleton of the framework is given by the following fivedimensions (see Figure 2.2):
• Why-receiving?
• Why-returning?
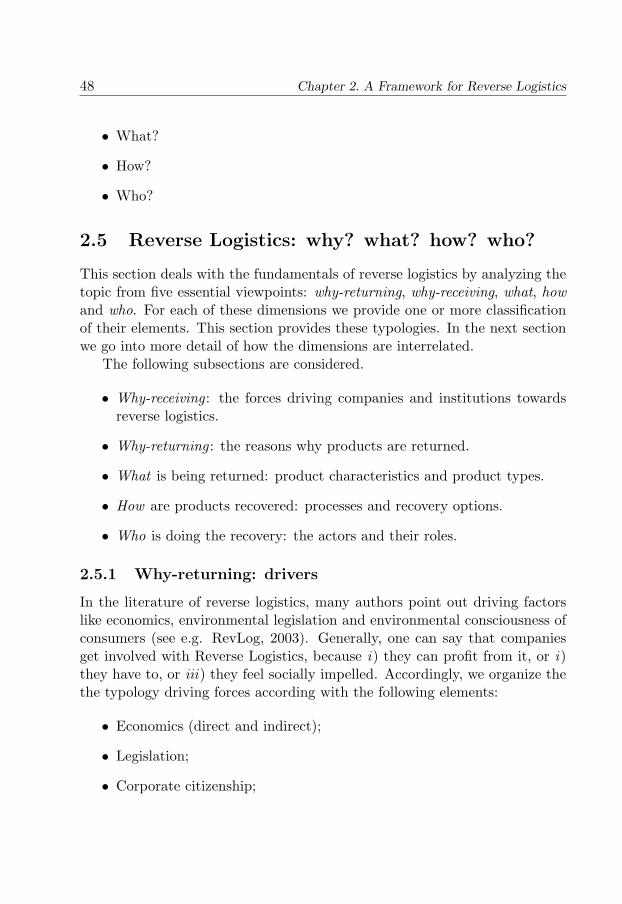
48 Chapter 2. A Framework for Reverse Logistics
• What?
• How?
• Who?
2.5 Reverse Logistics: why? what? how? who?
This section deals with the fundamentals of reverse logistics by analyzing thetopic from five essential viewpoints: why-returning, why-receiving, what, howand who. For each of these dimensions we provide one or more classificationof their elements. This section provides these typologies. In the next sectionwe go into more detail of how the dimensions are interrelated.
The following subsections are considered.
• Why-receiving : the forces driving companies and institutions towardsreverse logistics.
• Why-returning : the reasons why products are returned.
• What is being returned: product characteristics and product types.
• How are products recovered: processes and recovery options.
• Who is doing the recovery: the actors and their roles.
2.5.1 Why-returning: drivers
In the literature of reverse logistics, many authors point out driving factorslike economics, environmental legislation and environmental consciousness ofconsumers (see e.g. RevLog, 2003). Generally, one can say that companiesget involved with Reverse Logistics, because i) they can profit from it, or i)they have to, or iii) they feel socially impelled. Accordingly, we organize thethe typology driving forces according with the following elements:
• Economics (direct and indirect);
• Legislation;
• Corporate citizenship;
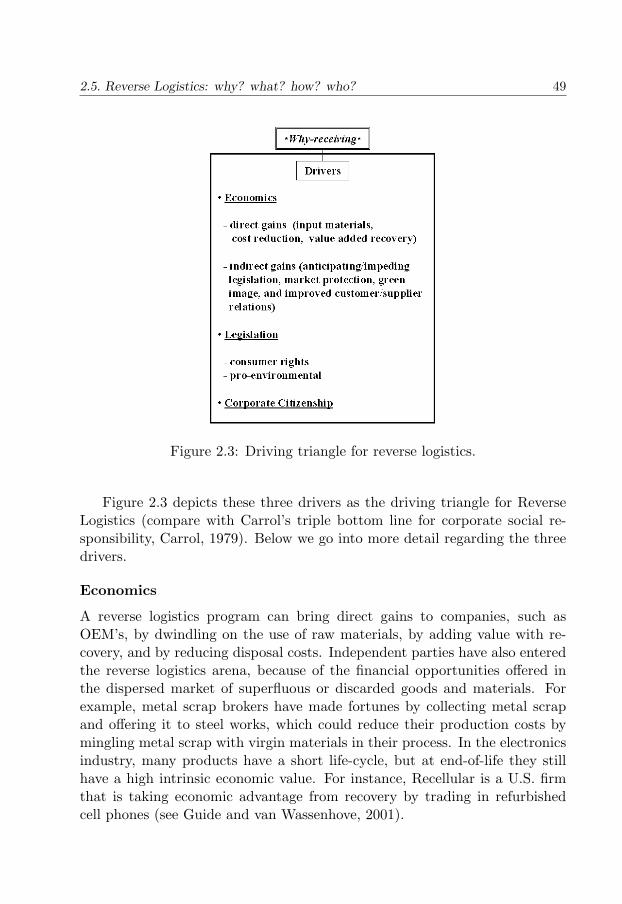
2.5. Reverse Logistics: why? what? how? who? 49
Figure 2.3: Driving triangle for reverse logistics.
Figure 2.3 depicts these three drivers as the driving triangle for ReverseLogistics (compare with Carrol’s triple bottom line for corporate social re-sponsibility, Carrol, 1979). Below we go into more detail regarding the threedrivers.
Economics
A reverse logistics program can bring direct gains to companies, such asOEM’s, by dwindling on the use of raw materials, by adding value with re-covery, and by reducing disposal costs. Independent parties have also enteredthe reverse logistics arena, because of the financial opportunities offered inthe dispersed market of superfluous or discarded goods and materials. Forexample, metal scrap brokers have made fortunes by collecting metal scrapand offering it to steel works, which could reduce their production costs bymingling metal scrap with virgin materials in their process. In the electronicsindustry, many products have a short life-cycle, but at end-of-life they stillhave a high intrinsic economic value. For instance, Recellular is a U.S. firmthat is taking economic advantage from recovery by trading in refurbishedcell phones (see Guide and van Wassenhove, 2001).
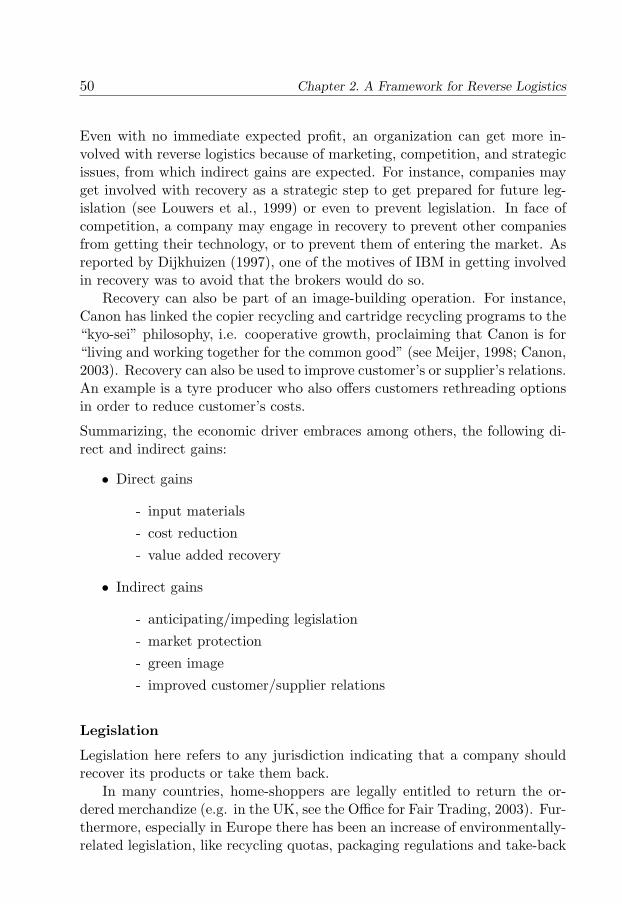
50 Chapter 2. A Framework for Reverse Logistics
Even with no immediate expected profit, an organization can get more in-volved with reverse logistics because of marketing, competition, and strategicissues, from which indirect gains are expected. For instance, companies mayget involved with recovery as a strategic step to get prepared for future leg-islation (see Louwers et al., 1999) or even to prevent legislation. In face ofcompetition, a company may engage in recovery to prevent other companiesfrom getting their technology, or to prevent them of entering the market. Asreported by Dijkhuizen (1997), one of the motives of IBM in getting involvedin recovery was to avoid that the brokers would do so.
Recovery can also be part of an image-building operation. For instance,Canon has linked the copier recycling and cartridge recycling programs to the“kyo-sei” philosophy, i.e. cooperative growth, proclaiming that Canon is for“living and working together for the common good” (see Meijer, 1998; Canon,2003). Recovery can also be used to improve customer’s or supplier’s relations.An example is a tyre producer who also offers customers rethreading optionsin order to reduce customer’s costs.
Summarizing, the economic driver embraces among others, the following di-rect and indirect gains:
• Direct gains
- input materials- cost reduction- value added recovery
• Indirect gains
- anticipating/impeding legislation- market protection- green image- improved customer/supplier relations
Legislation
Legislation here refers to any jurisdiction indicating that a company shouldrecover its products or take them back.
In many countries, home-shoppers are legally entitled to return the or-dered merchandize (e.g. in the UK, see the Office for Fair Trading, 2003). Fur-thermore, especially in Europe there has been an increase of environmentally-related legislation, like recycling quotas, packaging regulations and take-back
2.5. Reverse Logistics: why? what? how? who? 51
responsibility for manufacturers. For instance, the European Directive onWaste of Electronics and Electrical Equipment (WEEE) was approved by theEuropean Parliament in 2002 and sets the recovery quotas at 70%-90% (seeEuropa, 2003). In fact, industries, like the electronics and the automobile in-dustry, are under special legal pressure (see Bloemhof-Ruwaard et al., 2004).Sometimes, companies participate “voluntarily” in covenants, either to dealwith (or to get prepared for) legislation.
Summarizing, the legal driver embraces the following two elements.
• Consumer rights
• Pro-environmental legislation
Corporate citizenship
Companies use this term ‘corporate citizenship’ to express that they respectsociety out of good principles. Note, that there are also other terms used suchas social responsibility or ethics. Though the term ‘corporate citizenship’many not be generally accepted yet, it fits well our purposes, i.e. it representswhen a firm is “feeling” socially impelled to act in certain way (see also Tichyet al., 1997).
In the context of reverse logistics, corporate citizenship concerns a set ofvalues or principles that impels a company or an organization to become re-sponsibly engaged with reverse logistics. For instance, the concern of PaulFarrow, the founder of Walden Paddlers, Inc., with “the velocity at whichconsumer products travel through the market to the landfill,” pushed him toan innovative project of a 100%- recyclable kayak (see, Farrow et al., 2000).Indeed, many firms have extensive programs on responsible corporate citizen-ship where both social and environmental issues become the priorities (seeShell 2003).
Figure 2.4 summarizes the typology ‘drivers’ for the dimension ‘why-receiving’as described in this section.
Companies are often involved with reverse logistics for a mix of thesedriving forces and in reality it is sometimes hard to set the boundary. Forexample, in many countries customers have the right to return products pur-chased via a distant seller like mail-order-companies or e-tailers. Thus, thesecompanies are legally obliged to give the customer the opportunity to returnmerchandize. At the same time, this is also perceived as an opportunity toattract customers, bringing potential benefits to the company.
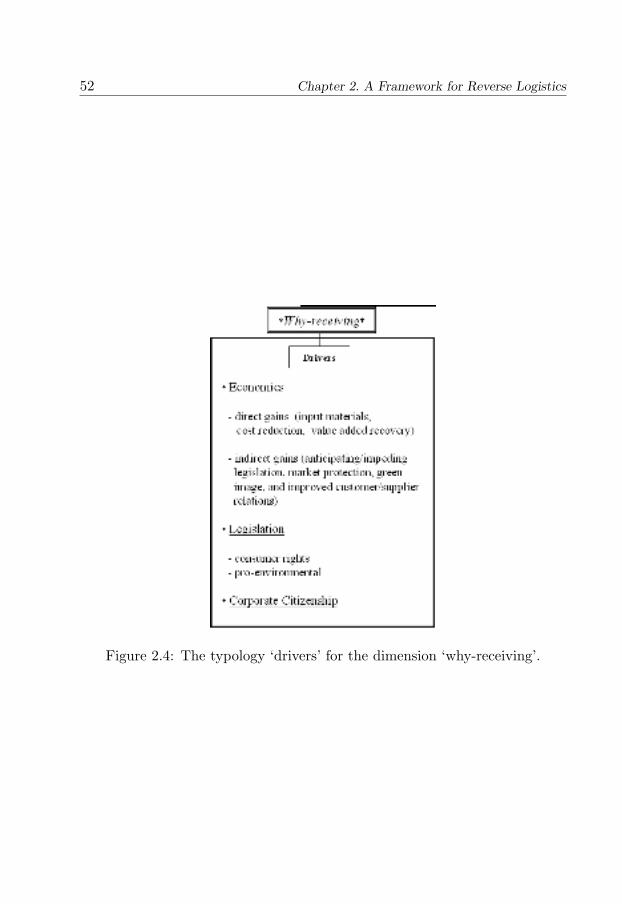
52 Chapter 2. A Framework for Reverse Logistics
Figure 2.4: The typology ‘drivers’ for the dimension ‘why-receiving’.
2.5. Reverse Logistics: why? what? how? who? 53
2.5.2 Why-returning: return reasons
Roughly speaking, products are returned or discarded because either they donot function properly or because their function is no longer needed. Thesereturn reasons are here presented in conformity with the usual supply chainphases: starting with manufacturing, going to distribution until the productsreach the customer. Therefore, three groups are differentiated: manufacturingreturns, distribution returns and customer returns.
Manufacturing returns
Manufacturing returns are here defined as all those returns for which the needfor recovery of components or products is identified during the productionphase. This occurs for a variety of reasons. Raw materials may be left over,intermediate or final products may fail quality checks and have to be reworkedand products may be left over during production, or by-products may resultfrom production. Raw material surplus and production leftovers representthe ‘product not-needed’ category, while quality-control returns fit in the ‘do-not-function’ category.
Summarizing, manufacturing returns include:
• raw material surplus
• quality-control returns
• production leftovers/by-products
Distribution Returns
Distribution/supply returns refers to all those returns that are initiated duringthe distribution phase. It refers to product recalls, commercial returns, stockadjustments, and functional returns.
Product recalls are products recollected because of safety or health prob-lems with the products, and the manufacturer or a supplier is usually theinitiator, and not the customer (see Smith et al., 1996). Product recalls fallin ‘distribution returns’ as they are usually initiated during this phase andthey are anyway specially demanding with respect to distribution.
B2B commercial returns are all those returns for which a buyer has acontractual option to return products to the seller (see a review of supplychain contracts at e.g. Tsay et al., 1999). This can refer to wrong/damageddeliveries, or to unsold products that retailers or distributors return to, e.g.the wholesaler or manufacturer. The latter include outdated products, i.e.
54 Chapter 2. A Framework for Reverse Logistics
those products for which the shelf life is too short and may no longer be sold(e.g. pharmaceutical products and food).
Stock adjustments occur when an actor in the chain re-distributes stocks.For instance stock adjustments also occur between warehouses or shops forinstance in the case of seasonal products (see De Koster et al., 2002). Thus,stock adjustments occur within a company while commercial returns involvemore than one company alone.
Finally, there are products for which their inherent function makes them goback and forward in the chain. We suggest to call these as ‘functional returns’.An obvious example is distribution carriers like pallets: their function is tocarry other products and they can serve this purpose several times (see e.gKroon and Vrijens, 1995 and Duhaime et al., 2000).
Summarizing, distribution returns comprehend:
• product recalls,
• B2B commercial returns (e.g. unsold products, wrong deliveries,)
• stock adjustments, and
• functional returns (distribution items/carriers/packaging).
Customer Returns
The third group consists of customer returns, i.e. those returns initiatedonce the product has reached the final customer. Again, there is a variety ofreasons to return the products, viz.
• B2C commercial returns (reimbursement/other guarantees),
• warranty returns,
• service returns (repairs, spare-parts, etc.),
• end-of-use returns, and
• end-of-life returns.
As much as possible, the reasons have been listed according to the life cy-cle of a product. B2C commercial returns, like reimbursement guarantees,give customers the opportunity to change their minds about purchasing whentheir needs or expectations are not met (usually shortly after having re-ceived/acquired the product). The list of underlying causes is long. For
2.5. Reverse Logistics: why? what? how? who? 55
instance, with respect to clothes dissatisfaction it may be due to size, color,fabric’s properties, and so forth. Independent of the underlying causes, whena customer returns a new product, benefiting from a money-back-guaranteeor an equivalent, we are in the presence of B2C commercial returns. Thenext two reasons, warranty and service returns, refer mostly to an incorrectfunctioning of the product during use, or to a service that is associated withthe product and from which the customer can benefit.
Initially, customers benefiting from a warranty can return products that donot (seem to) meet the promised quality standards. Sometimes, these returnscan be repaired. Otherwise, a customer may get a new product or his/hermoney back after which the returned product can be recovered. After thewarranty period has expired, customers can still benefit from maintenance orrepair services, but they no longer have the right to get a substitute productfor free. Products can be repaired at the customer’s site or sent back forrepair. In the former case, returns commonly occur in the form of spare-parts, since in advance it is hard to know precisely which components aregoing to be needed for the repair.
End-of-use returns refer to those situations where the user has a returnopportunity at a certain life stage of the product. This refers to leased prod-ucts and returnable containers like bottles, but also to returns to second-handmarkets as the one of Bibliofind, a division of Amazon.com for used books(see Amazon.com, online).
Finally, end-of-life returns refer to those returns for which the product assuch is at the end of its economic or physical life. They are either returned tothe OEM because of legal product-take-back obligations, or other companieslike brokers, collect them for value-added recovery (see Section 2.5.4).
Figure 2.5 summarizes the typology ‘return reasons’ for reverse logistics inthe three stages of a supply chain: manufacturing, distribution, and customer.One should note however that the distinction between these three stages mightbe factitious. In practice it is not always easy to pinpoint exactly wheremanufacturing ends and distribution starts, as value may be added whensome sort of distribution has already begun.
2.5.3 What: types and characteristics
A third viewpoint on reverse logistics can be obtained by considering what isactually being discarded or returned. Standard logistics product properties,such as size, weight, value, easiness of transportation and so on, play also arole for reverse logistics.
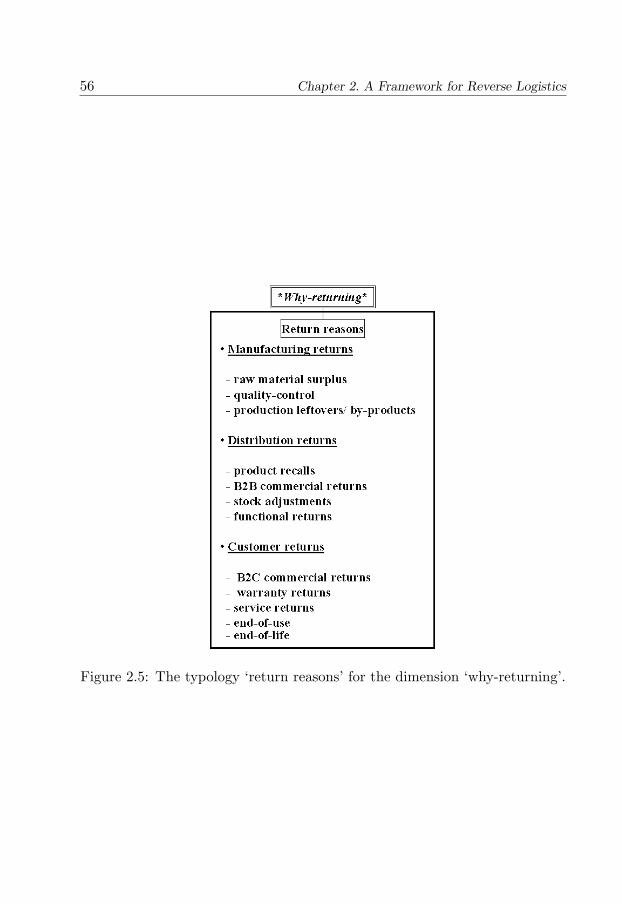
56 Chapter 2. A Framework for Reverse Logistics
Figure 2.5: The typology ‘return reasons’ for the dimension ‘why-returning’.
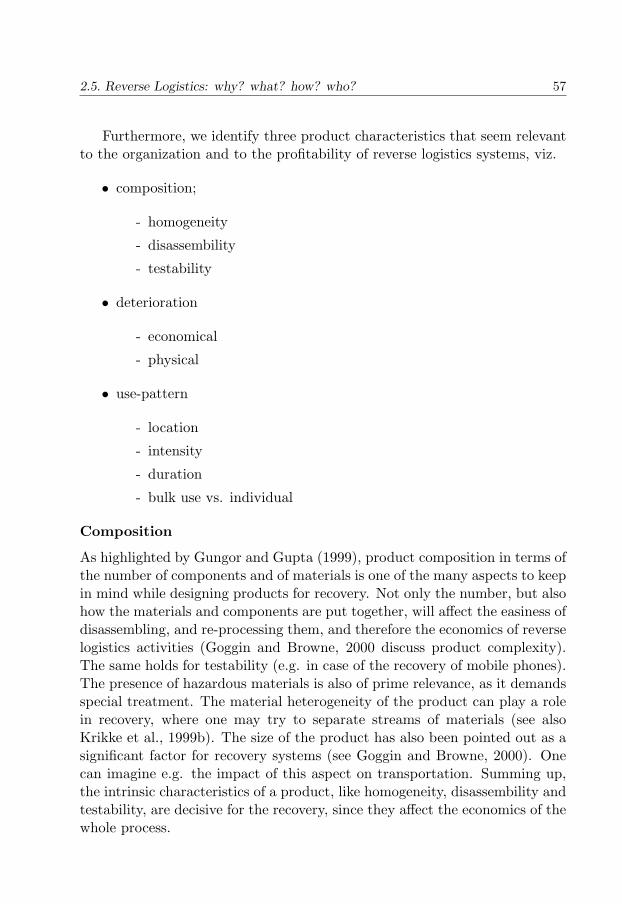
2.5. Reverse Logistics: why? what? how? who? 57
Furthermore, we identify three product characteristics that seem relevantto the organization and to the profitability of reverse logistics systems, viz.
• composition;
- homogeneity
- disassembility
- testability
• deterioration
- economical
- physical
• use-pattern
- location
- intensity
- duration
- bulk use vs. individual
Composition
As highlighted by Gungor and Gupta (1999), product composition in terms ofthe number of components and of materials is one of the many aspects to keepin mind while designing products for recovery. Not only the number, but alsohow the materials and components are put together, will affect the easiness ofdisassembling, and re-processing them, and therefore the economics of reverselogistics activities (Goggin and Browne, 2000 discuss product complexity).The same holds for testability (e.g. in case of the recovery of mobile phones).The presence of hazardous materials is also of prime relevance, as it demandsspecial treatment. The material heterogeneity of the product can play a rolein recovery, where one may try to separate streams of materials (see alsoKrikke et al., 1999b). The size of the product has also been pointed out as asignificant factor for recovery systems (see Goggin and Browne, 2000). Onecan imagine e.g. the impact of this aspect on transportation. Summing up,the intrinsic characteristics of a product, like homogeneity, disassembility andtestability, are decisive for the recovery, since they affect the economics of thewhole process.
58 Chapter 2. A Framework for Reverse Logistics
Deterioration
Next, product and materials undergo deterioration processes, viz. physical(homogeneous or not) and economic. This strongly affects the recovery option.Several questions have to be asked in order to evaluate the recovery potentialof a product: does the product age during use? (intrinsic deterioration); doall parts age equally, or not? (homogeneity of deterioration); does the value ofthe product decline fast? (economic deterioration). Deterioration eventuallycauses a non-functioning status of the product, but also determines whetherthere is enough functionality left to make further use of the product, eitheras a whole or as parts.
In fact, products may become obsolete because their functionality becomesoutdated due to the introduction of new products in the market, as it happenswith computers. This will restrict the recovery options that are economicallyviable. The same can be said for the intrinsic deterioration and whether ornot it is homogeneous. If a product is consumed totally during use, such asgasoline, or if it ages fast, like a battery, or if some parts are very sensitive todeterioration, reuse of the product as such is out of the question. If however,only a part of the product deteriorates, then other recovery options like repair,or parts retrieval and replacement, may be considered.
Use-pattern
The product use pattern, with respect to location, intensity, and durationof use, is an important group of characteristics as it affects for instance thecollection phase (see Section 2.5.4). It will make a difference whether theend-user is an individual or an institution (bulk-use), demanding differentlocations for collection or different degrees of effort from the end-user (e.g.bring the product to a collection-point), see also Chapter 3. The use canalso be less or more intensive. Let us consider the case of leased medicalequipment, which is commonly used for a small time period, and it is likely tobe leased again after proper operations like sterilization. Time is not the onlycomponent describing intensity of use, but also the degree of consumptionduring use. Consider for instance the example of reading a book. Quiteoften one reads a book only once after the purchase and keeps it, but doesnot do anything more with it. This has stimulated Amazon.com to start hersuccessful second-hand trading of books.
The characteristics of the product are related with the type of product inquestion. The product type in fact gives the first global impression on thepotential status of the product when it reaches recovery. Zhiquiang (2003)uses for instance a typology for products in order to sketch the planning of
2.5. Reverse Logistics: why? what? how? who? 59
reverse logistics activities. Fleischmann et al. (1997) distinguish the followingtypes: spare parts, packaging, and consumer goods. A natural addition isthe class of industrial goods, which in general are more complex and have adifferent use pattern than consumer goods. Furthermore, by looking at theUnited Nations (UN) classification of products (see UN, 2003), and at therelevant characteristics for reverse logistics (as described previously) we haveto discriminate a few more classes of products, like: ores, oils, and chemicals;civil objects, and other transportable materials. Everyone knows that civilobjects have a long useful life. Besides this, recovery has to be mostly in-site as objects like bridges and roads are not easily removed and transported,though there are cases where this has happened. Ores, oils, and chemicalsare a special category due to their common hazardous composition needingspecialized handling during any recovery process. Finally, a separate categoryis of other materials, such as pulp, glass, and scraps. In sum, the followingmain product categories can be discriminated:
• civil objects (buildings, dikes, bridges, roads, etc.),
• consumer goods (apparel, furniture, and a vast variety of goods),
• industrial goods (e.g. military and professional equipment, etc.),
• ores, oils, and chemicals,
• packaging and distribution items (like product carriers),
• spare-parts, and
• other materials (like pulp, glass, and scraps).
Figure 2.6 summarizes the typologies ‘product characteristics’ and ‘producttypes’ for the what dimension.
2.5.4 How: processes and recovery options
This section deals with how reverse logistics works in practice, i.e. how isvalue recovered from products.
Recovery is actually only one of the activities of reverse logistics. Otherprocesses include collection, inspection/testing selection, and sorting. Collec-tion refers to bringing the products from the customer to a point of recovery.At this point the products are inspected, i.e. their quality is assessed and adecision is made on the type of recovery. Products can then be sorted androuted according to the recovery decision. Thus, we have:
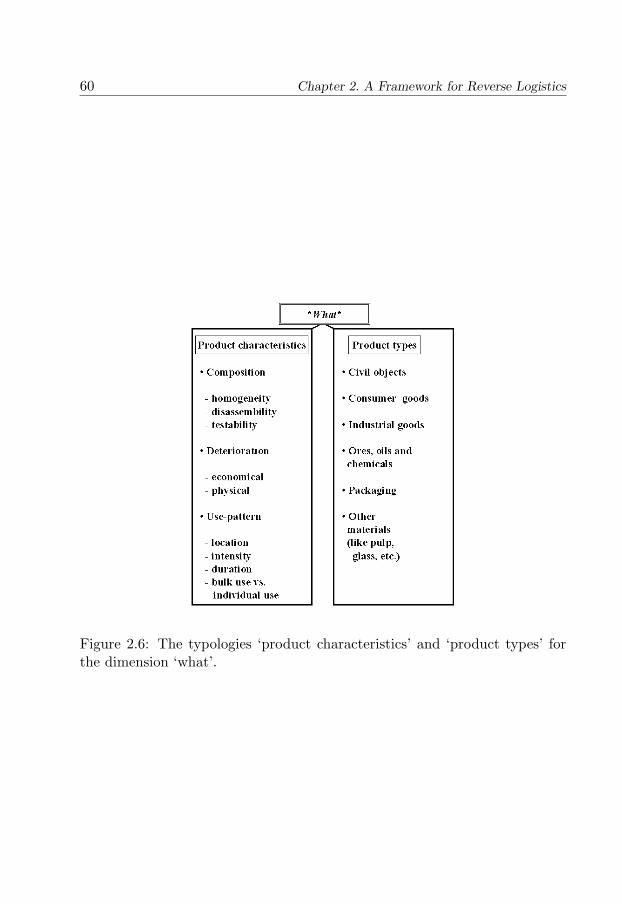
60 Chapter 2. A Framework for Reverse Logistics
Figure 2.6: The typologies ‘product characteristics’ and ‘product types’ forthe dimension ‘what’.
2.5. Reverse Logistics: why? what? how? who? 61
• collection,
• inspection/ testing,
• selection,
• sorting, and
• recovery itself.
If the quality is “as-good-as-new,” products can be fed into the marketalmost immediately through direct recovery. If not, other types of recoverymay be involved but now demanding more action, i.e. a form of re-processing.Thus, we distinguish two groups of recovery, which we discuss next (Thierryet al., 1995 have used the term ‘direct reuse’ and Fleischman et al., 1997employed the term ‘ reused directly’).
• Direct Recovery
• Process Recovery
Direct Recovery
Note that re-use, re-sale and re-distribution are slightly different. Re-saleapplies to situations where the product is sold again. Re-use is a situationin which the product is used again, but there is no purchase, e.g. unusedspare parts. Re-distribution refers to products like carriers, that are simplydistributed again and again. Direct recovery involves the three followingoptions:
- Re-use
- Re-sale
- Re-distribution
Process Recovery
Process recovery can involve several operations such as cleaning, disassem-bling, and re-assembling. In spite of the detailed operations, process recoverycan be said to occur at different levels as explained next. For complete defi-nitions, please see Thierry et al. (1995). For more on recovery/re-processinglevels, please have a look at Fleischmann et al. (1997), and Goggin andBrowne, (2000).
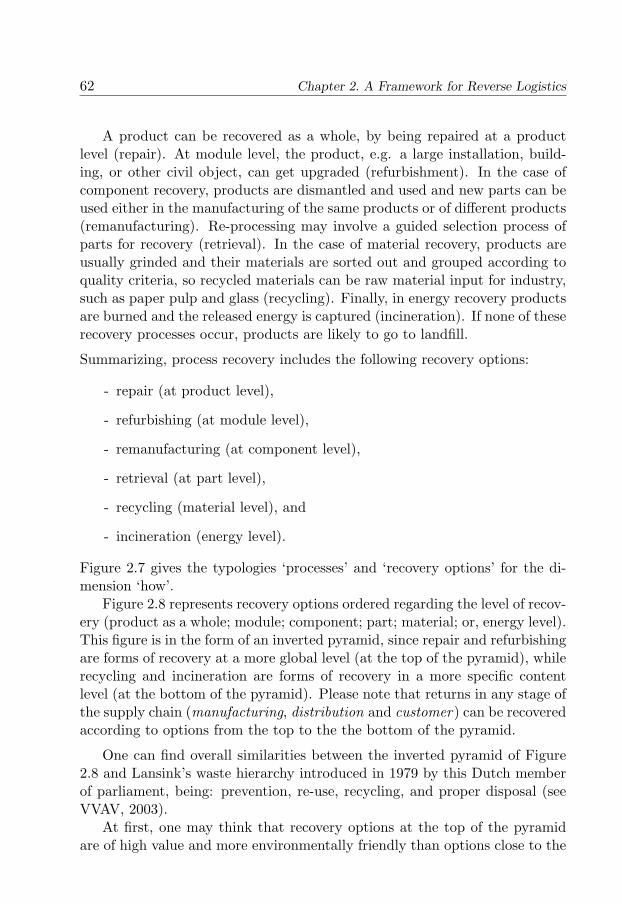
62 Chapter 2. A Framework for Reverse Logistics
A product can be recovered as a whole, by being repaired at a productlevel (repair). At module level, the product, e.g. a large installation, build-ing, or other civil object, can get upgraded (refurbishment). In the case ofcomponent recovery, products are dismantled and used and new parts can beused either in the manufacturing of the same products or of different products(remanufacturing). Re-processing may involve a guided selection process ofparts for recovery (retrieval). In the case of material recovery, products areusually grinded and their materials are sorted out and grouped according toquality criteria, so recycled materials can be raw material input for industry,such as paper pulp and glass (recycling). Finally, in energy recovery productsare burned and the released energy is captured (incineration). If none of theserecovery processes occur, products are likely to go to landfill.
Summarizing, process recovery includes the following recovery options:
- repair (at product level),
- refurbishing (at module level),
- remanufacturing (at component level),
- retrieval (at part level),
- recycling (material level), and
- incineration (energy level).
Figure 2.7 gives the typologies ‘processes’ and ‘recovery options’ for the di-mension ‘how’.
Figure 2.8 represents recovery options ordered regarding the level of recov-ery (product as a whole; module; component; part; material; or, energy level).This figure is in the form of an inverted pyramid, since repair and refurbishingare forms of recovery at a more global level (at the top of the pyramid), whilerecycling and incineration are forms of recovery in a more specific contentlevel (at the bottom of the pyramid). Please note that returns in any stage ofthe supply chain (manufacturing, distribution and customer) can be recoveredaccording to options from the top to the the bottom of the pyramid.
One can find overall similarities between the inverted pyramid of Figure2.8 and Lansink’s waste hierarchy introduced in 1979 by this Dutch memberof parliament, being: prevention, re-use, recycling, and proper disposal (seeVVAV, 2003).
At first, one may think that recovery options at the top of the pyramidare of high value and more environmentally friendly than options close to the
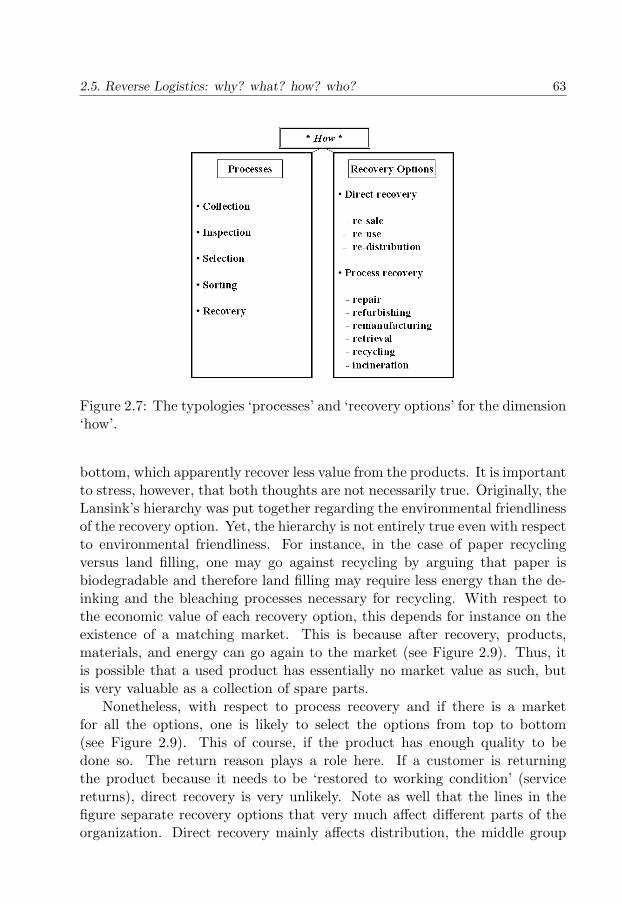
2.5. Reverse Logistics: why? what? how? who? 63
Figure 2.7: The typologies ‘processes’ and ‘recovery options’ for the dimension‘how’.
bottom, which apparently recover less value from the products. It is importantto stress, however, that both thoughts are not necessarily true. Originally, theLansink’s hierarchy was put together regarding the environmental friendlinessof the recovery option. Yet, the hierarchy is not entirely true even with respectto environmental friendliness. For instance, in the case of paper recyclingversus land filling, one may go against recycling by arguing that paper isbiodegradable and therefore land filling may require less energy than the de-inking and the bleaching processes necessary for recycling. With respect tothe economic value of each recovery option, this depends for instance on theexistence of a matching market. This is because after recovery, products,materials, and energy can go again to the market (see Figure 2.9). Thus, itis possible that a used product has essentially no market value as such, butis very valuable as a collection of spare parts.
Nonetheless, with respect to process recovery and if there is a marketfor all the options, one is likely to select the options from top to bottom(see Figure 2.9). This of course, if the product has enough quality to bedone so. The return reason plays a role here. If a customer is returningthe product because it needs to be ‘restored to working condition’ (servicereturns), direct recovery is very unlikely. Note as well that the lines in thefigure separate recovery options that very much affect different parts of theorganization. Direct recovery mainly affects distribution, the middle group
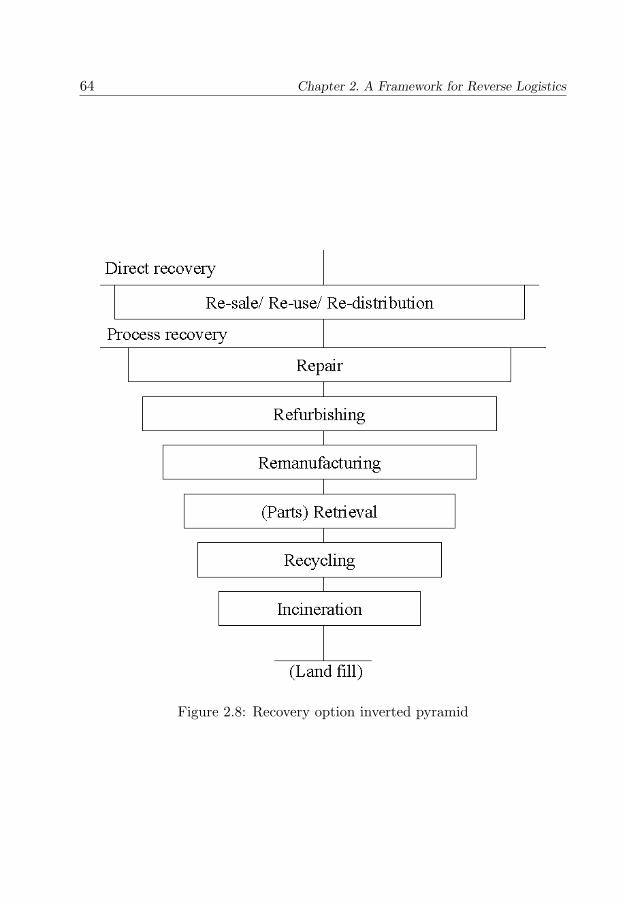
64 Chapter 2. A Framework for Reverse Logistics
Figure 2.8: Recovery option inverted pyramid
2.5. Reverse Logistics: why? what? how? who? 65
Figure 2.9: Reverse logistics processes
affects production planning, and the third group is most likely outsourcedby the organization. So, also depending of the recovery option, there areopportunities in the reverse logistics arena for certain type of players. This isfurther illustrated in Section 2.6.
2.5.5 Who: actors and roles
Essentially, the following players are the most crucial (see also the viewpointof Fuller and Allen, 1997):
• forward supply chain actors, (supplier, manufacturer, wholesaler, re-tailer, and sector organizations),
• specialized reverse chain players (such as jobbers, recycling specialists,dedicated sector organizations or foundations, pool operators, etc.),
• governmental institutions (EU, national governments, etc.), and
• opportunistic players (such as a charity organization).
These players can have the following roles:
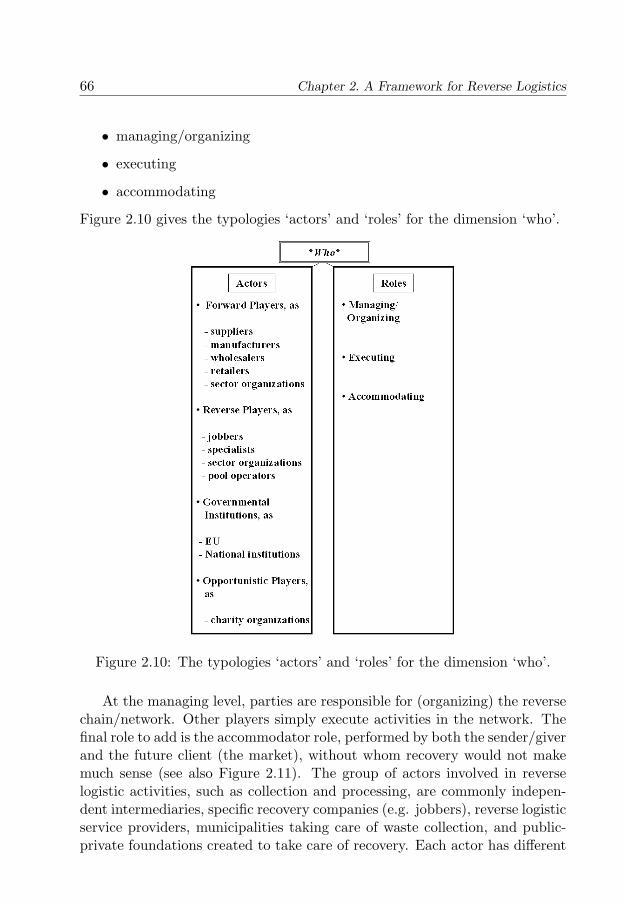
66 Chapter 2. A Framework for Reverse Logistics
• managing/organizing
• executing
• accommodating
Figure 2.10 gives the typologies ‘actors’ and ‘roles’ for the dimension ‘who’.
Figure 2.10: The typologies ‘actors’ and ‘roles’ for the dimension ‘who’.
At the managing level, parties are responsible for (organizing) the reversechain/network. Other players simply execute activities in the network. Thefinal role to add is the accommodator role, performed by both the sender/giverand the future client (the market), without whom recovery would not makemuch sense (see also Figure 2.11). The group of actors involved in reverselogistic activities, such as collection and processing, are commonly indepen-dent intermediaries, specific recovery companies (e.g. jobbers), reverse logisticservice providers, municipalities taking care of waste collection, and public-private foundations created to take care of recovery. Each actor has different
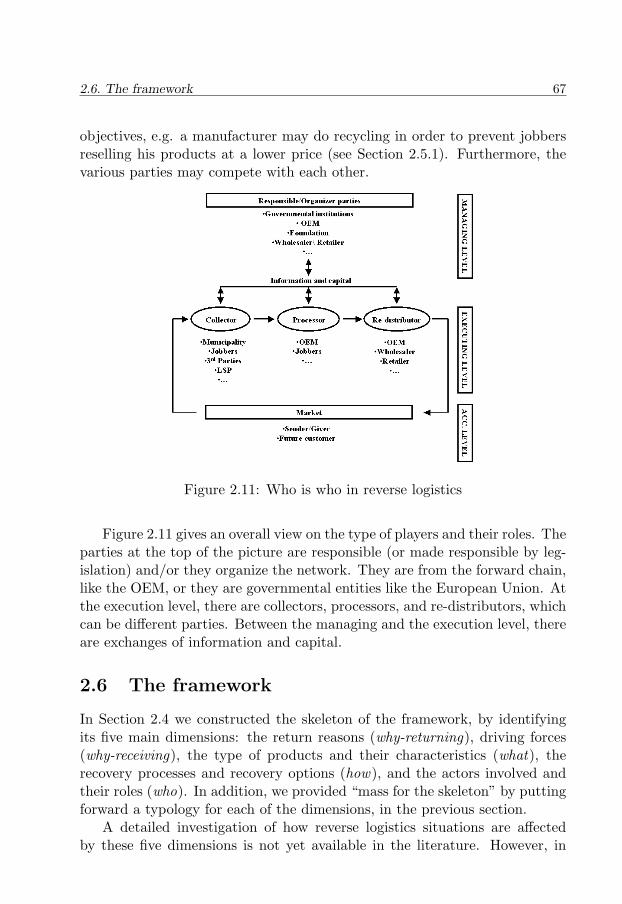
2.6. The framework 67
objectives, e.g. a manufacturer may do recycling in order to prevent jobbersreselling his products at a lower price (see Section 2.5.1). Furthermore, thevarious parties may compete with each other.
Figure 2.11: Who is who in reverse logistics
Figure 2.11 gives an overall view on the type of players and their roles. Theparties at the top of the picture are responsible (or made responsible by leg-islation) and/or they organize the network. They are from the forward chain,like the OEM, or they are governmental entities like the European Union. Atthe execution level, there are collectors, processors, and re-distributors, whichcan be different parties. Between the managing and the execution level, thereare exchanges of information and capital.
2.6 The framework
In Section 2.4 we constructed the skeleton of the framework, by identifyingits five main dimensions: the return reasons (why-returning), driving forces(why-receiving), the type of products and their characteristics (what), therecovery processes and recovery options (how), and the actors involved andtheir roles (who). In addition, we provided “mass for the skeleton” by puttingforward a typology for each of the dimensions, in the previous section.
A detailed investigation of how reverse logistics situations are affectedby these five dimensions is not yet available in the literature. However, in
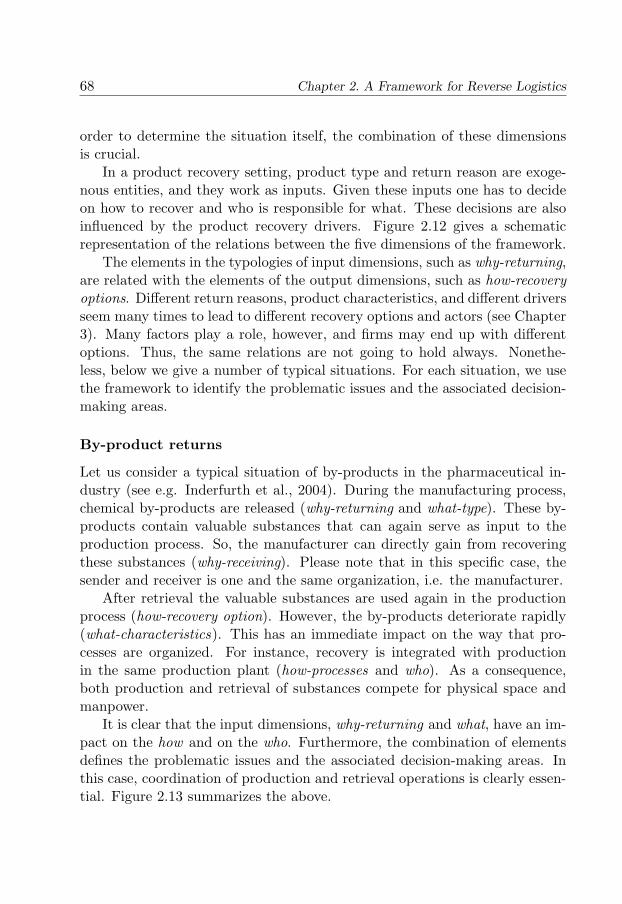
68 Chapter 2. A Framework for Reverse Logistics
order to determine the situation itself, the combination of these dimensionsis crucial.
In a product recovery setting, product type and return reason are exoge-nous entities, and they work as inputs. Given these inputs one has to decideon how to recover and who is responsible for what. These decisions are alsoinfluenced by the product recovery drivers. Figure 2.12 gives a schematicrepresentation of the relations between the five dimensions of the framework.
The elements in the typologies of input dimensions, such as why-returning,are related with the elements of the output dimensions, such as how-recoveryoptions. Different return reasons, product characteristics, and different driversseem many times to lead to different recovery options and actors (see Chapter3). Many factors play a role, however, and firms may end up with differentoptions. Thus, the same relations are not going to hold always. Nonethe-less, below we give a number of typical situations. For each situation, we usethe framework to identify the problematic issues and the associated decision-making areas.
By-product returns
Let us consider a typical situation of by-products in the pharmaceutical in-dustry (see e.g. Inderfurth et al., 2004). During the manufacturing process,chemical by-products are released (why-returning and what-type). These by-products contain valuable substances that can again serve as input to theproduction process. So, the manufacturer can directly gain from recoveringthese substances (why-receiving). Please note that in this specific case, thesender and receiver is one and the same organization, i.e. the manufacturer.
After retrieval the valuable substances are used again in the productionprocess (how-recovery option). However, the by-products deteriorate rapidly(what-characteristics). This has an immediate impact on the way that pro-cesses are organized. For instance, recovery is integrated with productionin the same production plant (how-processes and who). As a consequence,both production and retrieval of substances compete for physical space andmanpower.
It is clear that the input dimensions, why-returning and what, have an im-pact on the how and on the who. Furthermore, the combination of elementsdefines the problematic issues and the associated decision-making areas. Inthis case, coordination of production and retrieval operations is clearly essen-tial. Figure 2.13 summarizes the above.
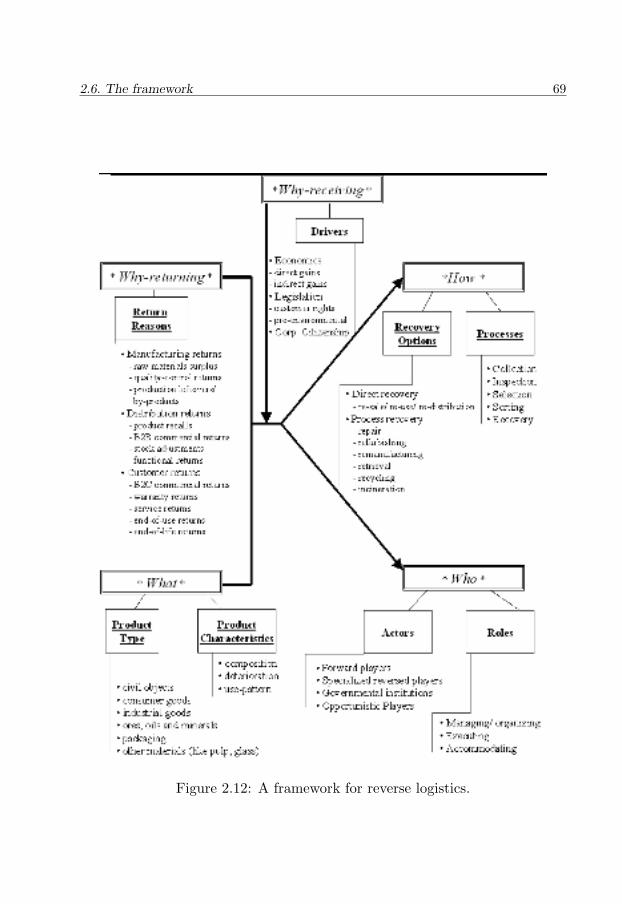
2.6. The framework 69
Figure 2.12: A framework for reverse logistics.
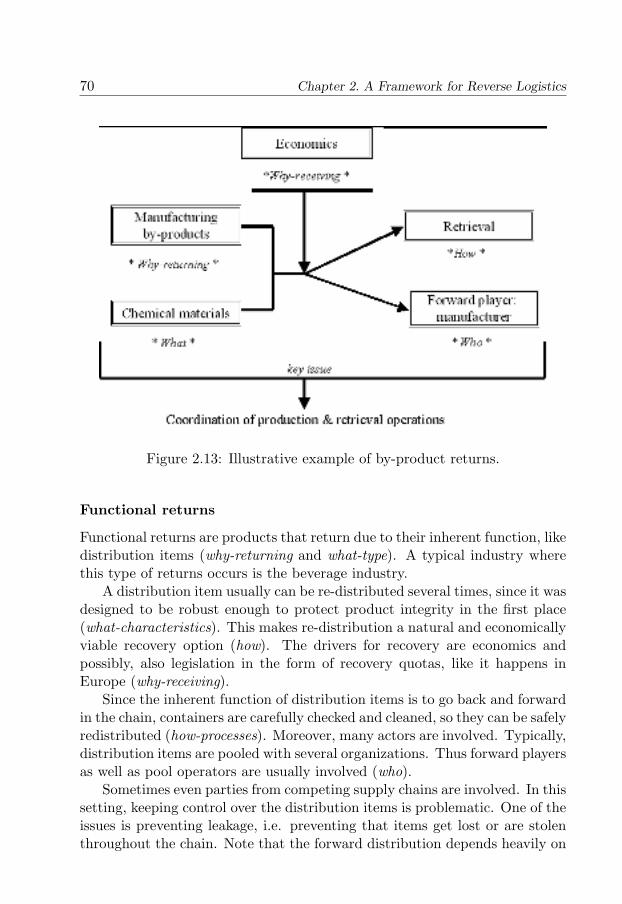
70 Chapter 2. A Framework for Reverse Logistics
Figure 2.13: Illustrative example of by-product returns.
Functional returns
Functional returns are products that return due to their inherent function, likedistribution items (why-returning and what-type). A typical industry wherethis type of returns occurs is the beverage industry.
A distribution item usually can be re-distributed several times, since it wasdesigned to be robust enough to protect product integrity in the first place(what-characteristics). This makes re-distribution a natural and economicallyviable recovery option (how). The drivers for recovery are economics andpossibly, also legislation in the form of recovery quotas, like it happens inEurope (why-receiving).
Since the inherent function of distribution items is to go back and forwardin the chain, containers are carefully checked and cleaned, so they can be safelyredistributed (how-processes). Moreover, many actors are involved. Typically,distribution items are pooled with several organizations. Thus forward playersas well as pool operators are usually involved (who).
Sometimes even parties from competing supply chains are involved. In thissetting, keeping control over the distribution items is problematic. One of theissues is preventing leakage, i.e. preventing that items get lost or are stolenthroughout the chain. Note that the forward distribution depends heavily on
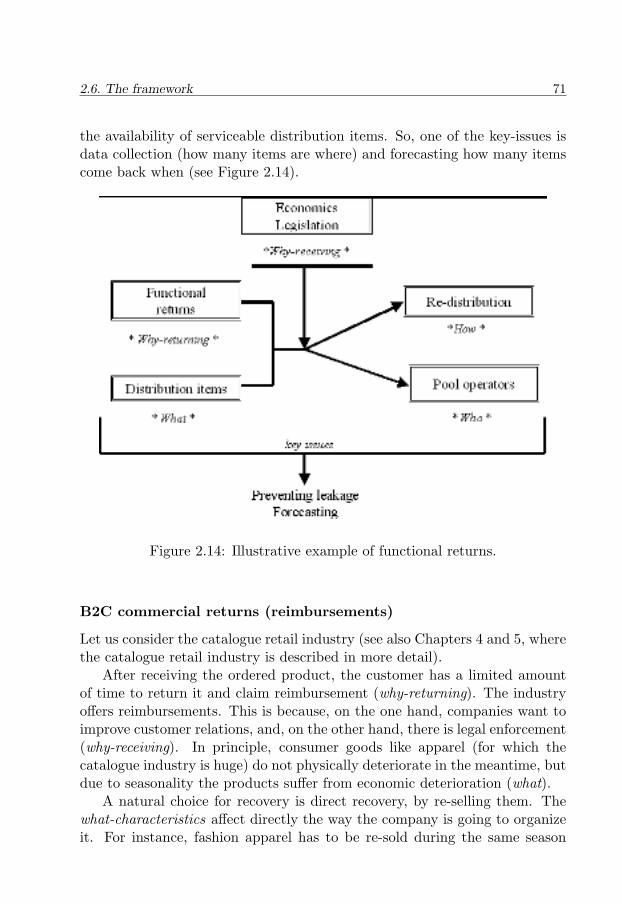
2.6. The framework 71
the availability of serviceable distribution items. So, one of the key-issues isdata collection (how many items are where) and forecasting how many itemscome back when (see Figure 2.14).
Figure 2.14: Illustrative example of functional returns.
B2C commercial returns (reimbursements)
Let us consider the catalogue retail industry (see also Chapters 4 and 5, wherethe catalogue retail industry is described in more detail).
After receiving the ordered product, the customer has a limited amountof time to return it and claim reimbursement (why-returning). The industryoffers reimbursements. This is because, on the one hand, companies want toimprove customer relations, and, on the other hand, there is legal enforcement(why-receiving). In principle, consumer goods like apparel (for which thecatalogue industry is huge) do not physically deteriorate in the meantime, butdue to seasonality the products suffer from economic deterioration (what).
A natural choice for recovery is direct recovery, by re-selling them. Thewhat-characteristics affect directly the way the company is going to organizeit. For instance, fashion apparel has to be re-sold during the same season
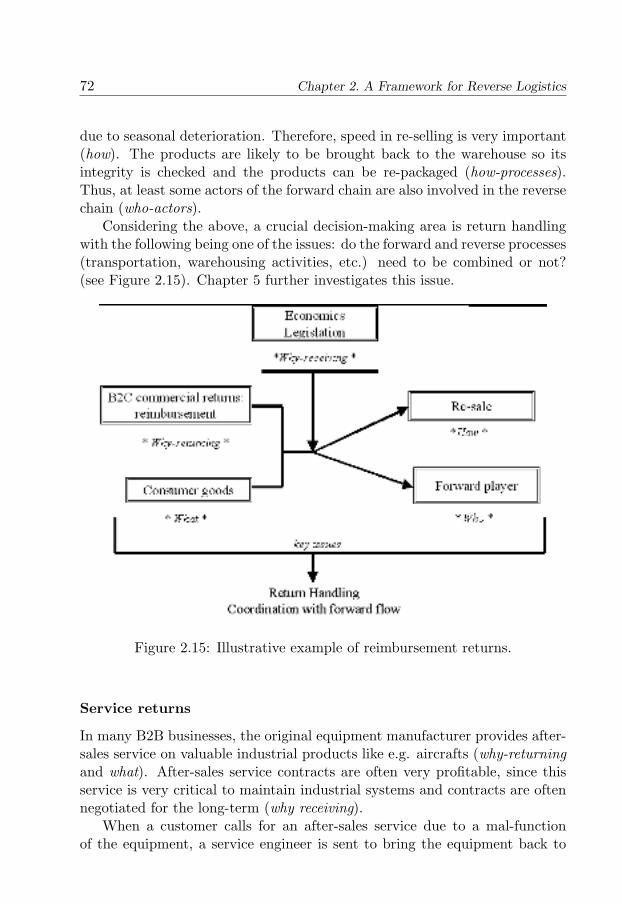
72 Chapter 2. A Framework for Reverse Logistics
due to seasonal deterioration. Therefore, speed in re-selling is very important(how). The products are likely to be brought back to the warehouse so itsintegrity is checked and the products can be re-packaged (how-processes).Thus, at least some actors of the forward chain are also involved in the reversechain (who-actors).
Considering the above, a crucial decision-making area is return handlingwith the following being one of the issues: do the forward and reverse processes(transportation, warehousing activities, etc.) need to be combined or not?(see Figure 2.15). Chapter 5 further investigates this issue.
Figure 2.15: Illustrative example of reimbursement returns.
Service returns
In many B2B businesses, the original equipment manufacturer provides after-sales service on valuable industrial products like e.g. aircrafts (why-returningand what). After-sales service contracts are often very profitable, since thisservice is very critical to maintain industrial systems and contracts are oftennegotiated for the long-term (why receiving).
When a customer calls for an after-sales service due to a mal-functionof the equipment, a service engineer is sent to bring the equipment back to
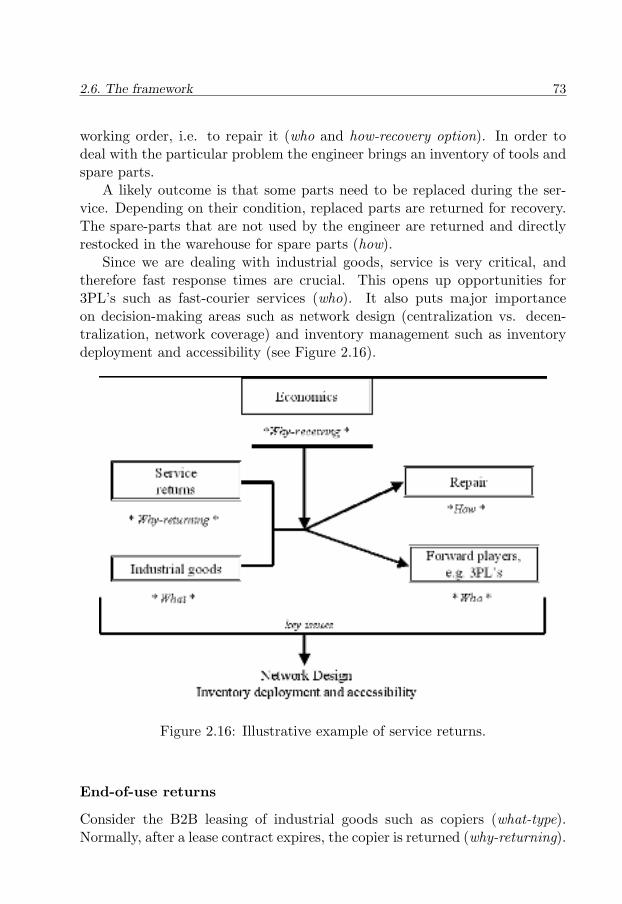
2.6. The framework 73
working order, i.e. to repair it (who and how-recovery option). In order todeal with the particular problem the engineer brings an inventory of tools andspare parts.
A likely outcome is that some parts need to be replaced during the ser-vice. Depending on their condition, replaced parts are returned for recovery.The spare-parts that are not used by the engineer are returned and directlyrestocked in the warehouse for spare parts (how).
Since we are dealing with industrial goods, service is very critical, andtherefore fast response times are crucial. This opens up opportunities for3PL’s such as fast-courier services (who). It also puts major importanceon decision-making areas such as network design (centralization vs. decen-tralization, network coverage) and inventory management such as inventorydeployment and accessibility (see Figure 2.16).
Figure 2.16: Illustrative example of service returns.
End-of-use returns
Consider the B2B leasing of industrial goods such as copiers (what-type).Normally, after a lease contract expires, the copier is returned (why-returning).
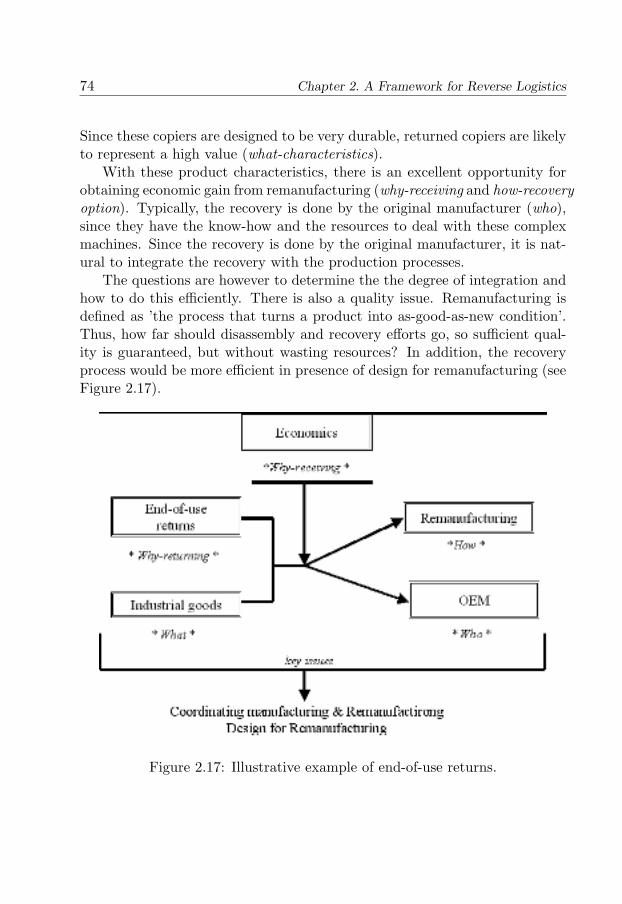
74 Chapter 2. A Framework for Reverse Logistics
Since these copiers are designed to be very durable, returned copiers are likelyto represent a high value (what-characteristics).
With these product characteristics, there is an excellent opportunity forobtaining economic gain from remanufacturing (why-receiving and how-recoveryoption). Typically, the recovery is done by the original manufacturer (who),since they have the know-how and the resources to deal with these complexmachines. Since the recovery is done by the original manufacturer, it is nat-ural to integrate the recovery with the production processes.
The questions are however to determine the the degree of integration andhow to do this efficiently. There is also a quality issue. Remanufacturing isdefined as ’the process that turns a product into as-good-as-new condition’.Thus, how far should disassembly and recovery efforts go, so sufficient qual-ity is guaranteed, but without wasting resources? In addition, the recoveryprocess would be more efficient in presence of design for remanufacturing (seeFigure 2.17).
Figure 2.17: Illustrative example of end-of-use returns.
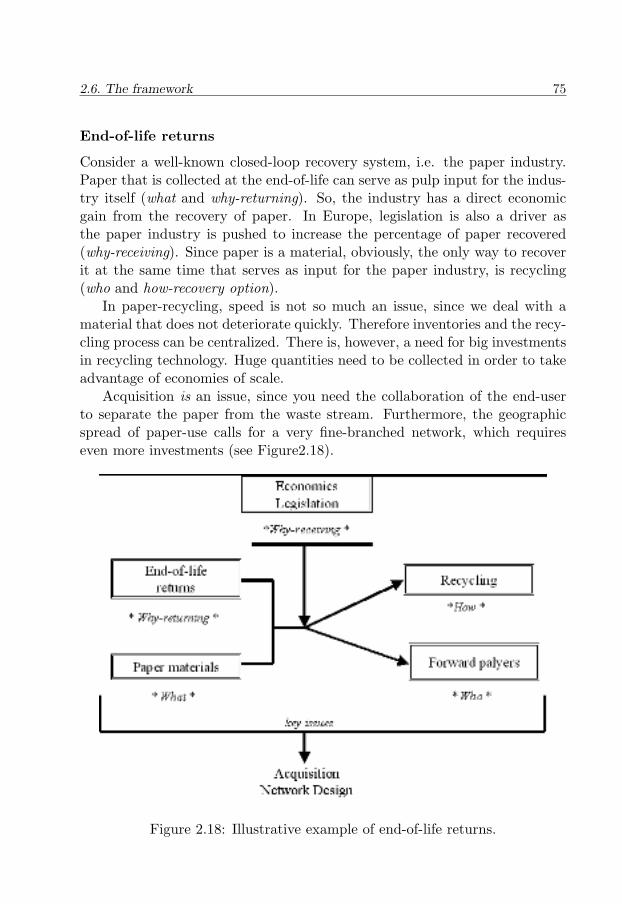
2.6. The framework 75
End-of-life returns
Consider a well-known closed-loop recovery system, i.e. the paper industry.Paper that is collected at the end-of-life can serve as pulp input for the indus-try itself (what and why-returning). So, the industry has a direct economicgain from the recovery of paper. In Europe, legislation is also a driver asthe paper industry is pushed to increase the percentage of paper recovered(why-receiving). Since paper is a material, obviously, the only way to recoverit at the same time that serves as input for the paper industry, is recycling(who and how-recovery option).
In paper-recycling, speed is not so much an issue, since we deal with amaterial that does not deteriorate quickly. Therefore inventories and the recy-cling process can be centralized. There is, however, a need for big investmentsin recycling technology. Huge quantities need to be collected in order to takeadvantage of economies of scale.
Acquisition is an issue, since you need the collaboration of the end-userto separate the paper from the waste stream. Furthermore, the geographicspread of paper-use calls for a very fine-branched network, which requireseven more investments (see Figure2.18).
Figure 2.18: Illustrative example of end-of-life returns.
76 Chapter 2. A Framework for Reverse Logistics
Above, we illustrated with typical situations that filling the five dimensionsof the framework with information helps to identify the problematic issuesand the associated decision-making areas. The exact influence and relationsof the five dimensions of the framework presented here (why-receiving, why-returning, how, what and who) is still an open question that requires moreinvestigation. There are nonetheless some leads in the literature, which wediscuss next.
Goggin and Browne (2000) developed typologies to assist to determinethe recovery level (in their case, remanufacturing, component recovery, andmaterial recovery) from product characteristics, like input product complex-ity and output product complexity, together with some other factors. Theproduct complexity is defined after the number of levels and constituents inthe Bill of Materials describing the product. Future research can extend thistype of research. The authors restricted themselves to one kind of consumergoods (electronic products) and two recovery options (reuse and refurbish-ing). Future studies can embrace more recovery options and more producttypes, covering a diversity of reverse logistics systems.
Krikke et al. (2003) study how value can be regained from returns. Theauthors identify seven typical returns. They characterize them according tothe 1) features of the product (obsolescence, complexity, and remaining life-time), 2) the influence of legislation, 3) the most associated recovery option,and 4) market characteristics. Then, the authors try to match each reverseflow with a specific type of reverse chain. They characterize this reverse chainsto 1) the main driver, 2) degree of centralization, 3) type of processes, and4) the IT support. The main conclusion is that integration with the forwardchain provides the best opportunities, in particular when based on modularreuse. The framework proposed in this chapter can be used in similar studies.
Chapter 3 indicates that per decision-making area, certain dimensions ofthe framework have a predominant role in identifying the problematic issues.The chapter puts forward the following predominant relations:
• Networks ⇔ Recovery option (How) and type of Actors (Who)
• Relationships ⇔ Actors (Who)
• Inventory Management ⇔ Return reason (Why-returning) and Producttype (What)
• Production Planning ⇔ Recovery option (How) and type of Actors(Who)
2.7. Summary and conclusions 77
If one wants to get more in-depth details, build-up theory, or explain phenom-ena, one has to go into more depth regarding some aspects of the framework.
2.7 Summary and conclusions
This chapter provided a framework for reverse logistics directly contributingto
• structuring the field and
• providing an overall understanding of reverse logistics issues.
Five key dimensions were considered, with their respective typologies (see alsoFigures 2.4, 2.5, 2.6, 2.7 and 2.10):
1. Why-receiving?, i.e. why companies get involved reverse logistics (drivers),
2. Why-returning?, i.e. the reasons for products being returned (returnreasons),
3. How?, i.e. how is recovery carried out (processes and recovery options),
4. What?, i.e. what is being returned (product characteristics and producttypes)
5. Who?, i.e. who is doing the recovery (actors and their roles).
Finally, we have pointed out that the five dimensions and the typologies of thereverse logistics framework not only give context to reverse logistics situations.Also their combination determines to a large extent the kind of issues thatarise in implementing, monitoring, and managing such situations. This wasillustrated with a collection of typical reverse logistics situations.
The framework is also a means to raise questions. For instance, the pre-cise influence of the five dimensions of the framework presented here (why-receiving, (why-returning, how, what and who) is still an open question thatrequires more investigation. Some of the work going in this direction, suchas Goggin and Browne (2000) can be extended by taking into account moreproduct types and return options. The typologies presented in this chaptercan provide a basis for this.
Furthermore, Chapter 3, a review of more than sixty case studies, touchesupon this issue. There, the framework is used to facilitate the analysis, shed-ding more light on the relations between the five dimensions, and on theirimportance with respect to characterizing reverse logistics situations.

78 Chapter 2. A Framework for Reverse Logistics
We are confident that the framework presented here is going to be a plat-form for making further progress in the field, by inspiring hypotheses that,once tested, can provide the roots for reverse logistics theory.
Chapter 3
Reverse Logistics: a review ofcase studies
“Practice is everything”
Periander
3.1 Introduction
This chapter reviews more than 60 case studies on the field of reverse logistics,giving a fair idea of the diversity of reverse logistics practices. The reviewnot only gives an overview of real life situations, but it is also a source ofcase support for researchers. This is important because one cannot provideproper insights into reverse logistics without being familiar with how firms aredealing with it in practice, what are the trade-offs during decision-making,how decisions are being supported, and so on.
Field studies and surveys can be extremely helpful in getting this knowl-edge. At the end of the nineties, Rogers and Tibben-Lembke (1999) presenteda broad collection of reverse logistics business practices, giving special atten-tion to the U.S. experience, in which the authors carried out a comprehensivequestionnaire. One year later, Guide (2000) published a study on researchneeds based on an extensive survey within the remanufacturing industry inthe U.S. Also, quite some case studies on reverse logistics have been describedin the literature dealing with different industries, recovery options and drivers.This literature is however scattered over journals for very different researchcommunities. Besides this, in countries in the forefront of reverse logistics
79
80 Chapter 3. Reverse Logistics: a review of case studies
a substantial number of case studies have been published in other languagesthan the lingua franca and are therefore not accessible for the majority ofthe research community. This chapter can also be used as a check list forresearchers willing to conduct (comparative) case studies.
The analysis of the case studies is based on the framework of Chapter 2.Concisely, according to the framework, a first characterization of reverse lo-gistics situations starts with answering the following questions: what?, how?,who?, and why?. I.e., what products/materials are being returned? how arethey being recovered?, who is involved?, and why is all this happening?
Actually the two research projects, the framework and the case studiesreview were carried out in parallel, and in an interactive way. The analysisof the case studies is facilitated by the framework. At the same time, thecase studies put the adequateness of the typologies and its completeness attest, leading to a refinement of the framework when necessary. So, on theone hand, the case studies review is a means to ground the framework onempirical evidence, and on the other hand, the framework is a means to “seethrough” the case studies. The framework of Chapter 2 constitutes the “lastwords” of the interaction between this research work and the framework.
We present the case studies according to the following decision-makingareas, widely used in Operations Management: Network Structures, Relation-ships, Inventory Management, and Planning and Control. For each sectionwe describe and organize the cases and we put forward preliminary insights aswell as research gaps, which we link with a research agenda. For some of thedecision-making areas, some of the dimensions of the framework are predom-inantly important. We also discuss this and we provide research directionsto further investigate this, by indicating the kind of elements that could beconsidered in more detail, depending on the decision-making area.
The remainder of the chapter is organized as follows. Section 3.2 describesthe methodology employed for finding and classifying the case studies. Sec-tion 3.3 provides statistics regarding the type of industry, the product and thegeographic area of the cases. After that, Sections 3.4 to 3.8 present the casestudies, and preliminary insights related to the state of the art of research inthe field. Section 3.9 presents the overall insights of this review. Finally inSection 3.10 we present the conclusions and we put forward research direc-tions. An earlier version of this work has been reported in De Brito et al.(2003).
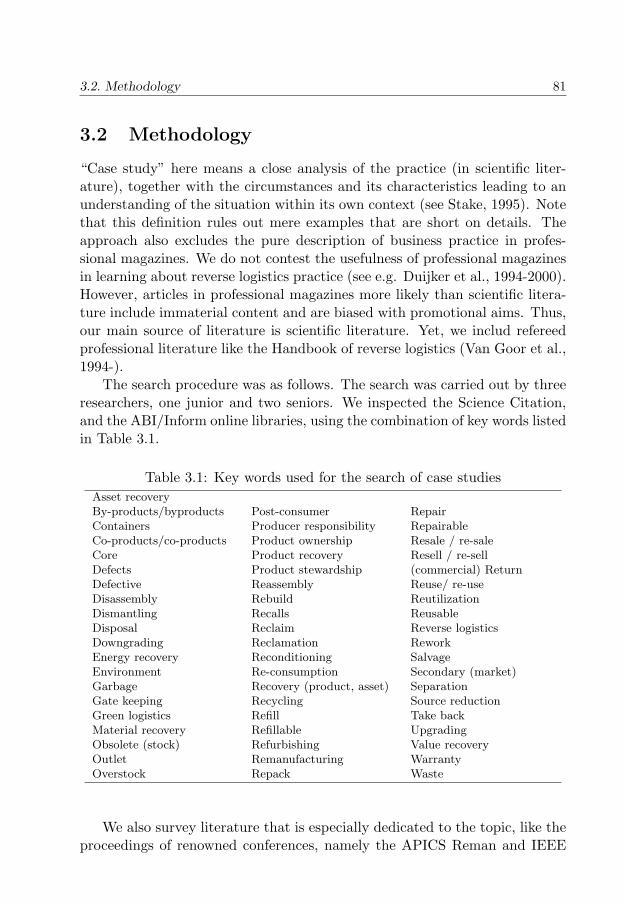
3.2. Methodology 81
3.2 Methodology
“Case study” here means a close analysis of the practice (in scientific liter-ature), together with the circumstances and its characteristics leading to anunderstanding of the situation within its own context (see Stake, 1995). Notethat this definition rules out mere examples that are short on details. Theapproach also excludes the pure description of business practice in profes-sional magazines. We do not contest the usefulness of professional magazinesin learning about reverse logistics practice (see e.g. Duijker et al., 1994-2000).However, articles in professional magazines more likely than scientific litera-ture include immaterial content and are biased with promotional aims. Thus,our main source of literature is scientific literature. Yet, we includ refereedprofessional literature like the Handbook of reverse logistics (Van Goor et al.,1994-).
The search procedure was as follows. The search was carried out by threeresearchers, one junior and two seniors. We inspected the Science Citation,and the ABI/Inform online libraries, using the combination of key words listedin Table 3.1.
Table 3.1: Key words used for the search of case studiesAsset recoveryBy-products/byproducts Post-consumer RepairContainers Producer responsibility RepairableCo-products/co-products Product ownership Resale / re-saleCore Product recovery Resell / re-sellDefects Product stewardship (commercial) ReturnDefective Reassembly Reuse/ re-useDisassembly Rebuild ReutilizationDismantling Recalls ReusableDisposal Reclaim Reverse logisticsDowngrading Reclamation ReworkEnergy recovery Reconditioning SalvageEnvironment Re-consumption Secondary (market)Garbage Recovery (product, asset) SeparationGate keeping Recycling Source reductionGreen logistics Refill Take backMaterial recovery Refillable UpgradingObsolete (stock) Refurbishing Value recoveryOutlet Remanufacturing WarrantyOverstock Repack Waste
We also survey literature that is especially dedicated to the topic, like theproceedings of renowned conferences, namely the APICS Reman and IEEE
82 Chapter 3. Reverse Logistics: a review of case studies
on Electronics and the Environment (see APICS, 2003, and IEEE, 2003).The main search took place in early 2001 and continued till end 2002.
Note that we report only on the literature that fit the case study criteria,i.e. leading to an understanding of reverse logistics issues, through a closeanalysis of a real case.
To give the reader the overall reverse logistics context, we gathered, foreach case study, information on the five dimensions of reverse logistics, i.e.what, how, who, and why-returning, why-receiving as introduced in Chapter2.
In order to be engaged in, or to anticipate recovery activities, firms haveto consider several strategic, tactical and operational matters. At the strate-gic level, the design of the recovery network has to be decided upon first. Atthe tactical level, relationships with partners have to be developed. Relevantissues here concern measures to ensure that the actors involved follow a cer-tain behavior. At the operational level, inventories and the recovery activitieshave to be managed and controlled (see Ganeshan et al., 1999; Fleischmannet al, 1997). Information and communication technologies play an impor-tant role to achieve this. Thus, we present the case studies according tothe following decision-making focus: Network Structures, Relationships, In-ventory Management, and Planning and Control. Furthermore, there is anoverview of Information and Technology (IT) for reverse logistics. By ITwe denote technological means to process and transmit information (see ITdefinitions by OECD, 2003, and NAICS, 2003). If a case focuses on multipledecisions, then the case study is discussed in more than one section. With oursearch procedure, we found 26 case studies on Network Structures,10 caseson Relationships, 14 cases on Inventory Management, 25 cases on ProductionPlanning and Control, and 7 cases dedicated to IT issues.
3.3 Statistics
We have found more than sixty cases involving reverse logistics. Using theUnited Nations classifications for Industry (see http://esa.un.org), roughly60% of the cases are in the manufacturing category; about 20% are withinwholesale and retail trade and about 10% in construction. We have alsofound cases in the following categories: transport and communication, publicadministration and defense, and other community services (see Table 3.2).
We also use here the United Nations classifications for Products (seehttp://esa.un.org). In Chapter 2 we actually expanded this classification(what-types) as for thorough research, a more detailed typology is necessary.For an overall perspective, we state here the statistics according to the United
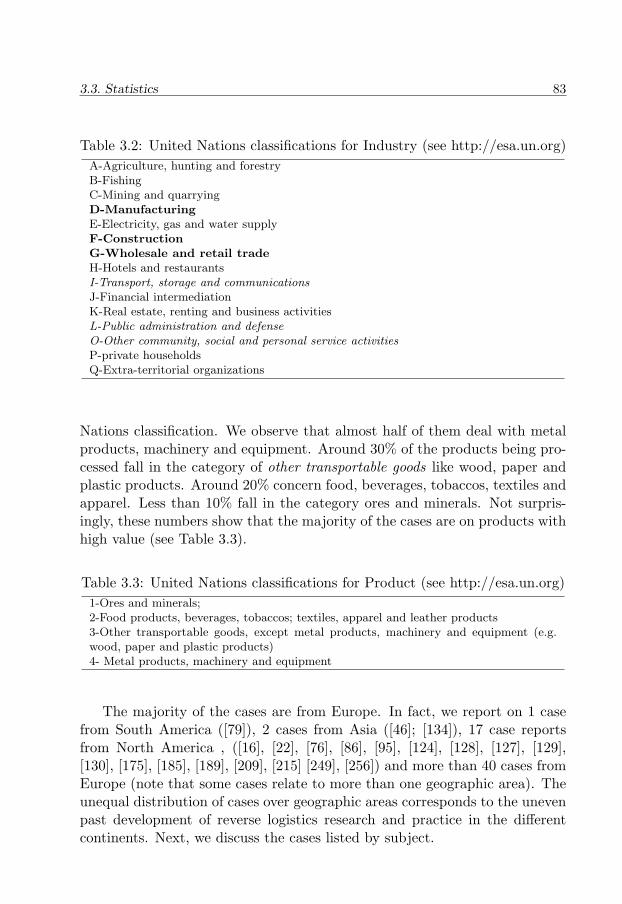
3.3. Statistics 83
Table 3.2: United Nations classifications for Industry (see http://esa.un.org)A-Agriculture, hunting and forestryB-FishingC-Mining and quarryingD-ManufacturingE-Electricity, gas and water supplyF-ConstructionG-Wholesale and retail tradeH-Hotels and restaurantsI-Transport, storage and communicationsJ-Financial intermediationK-Real estate, renting and business activitiesL-Public administration and defenseO-Other community, social and personal service activitiesP-private householdsQ-Extra-territorial organizations
Nations classification. We observe that almost half of them deal with metalproducts, machinery and equipment. Around 30% of the products being pro-cessed fall in the category of other transportable goods like wood, paper andplastic products. Around 20% concern food, beverages, tobaccos, textiles andapparel. Less than 10% fall in the category ores and minerals. Not surpris-ingly, these numbers show that the majority of the cases are on products withhigh value (see Table 3.3).
Table 3.3: United Nations classifications for Product (see http://esa.un.org)1-Ores and minerals;2-Food products, beverages, tobaccos; textiles, apparel and leather products3-Other transportable goods, except metal products, machinery and equipment (e.g.wood, paper and plastic products)4- Metal products, machinery and equipment
The majority of the cases are from Europe. In fact, we report on 1 casefrom South America ([79]), 2 cases from Asia ([46]; [134]), 17 case reportsfrom North America , ([16], [22], [76], [86], [95], [124], [128], [127], [129],[130], [175], [185], [189], [209], [215] [249], [256]) and more than 40 cases fromEurope (note that some cases relate to more than one geographic area). Theunequal distribution of cases over geographic areas corresponds to the unevenpast development of reverse logistics research and practice in the differentcontinents. Next, we discuss the cases listed by subject.
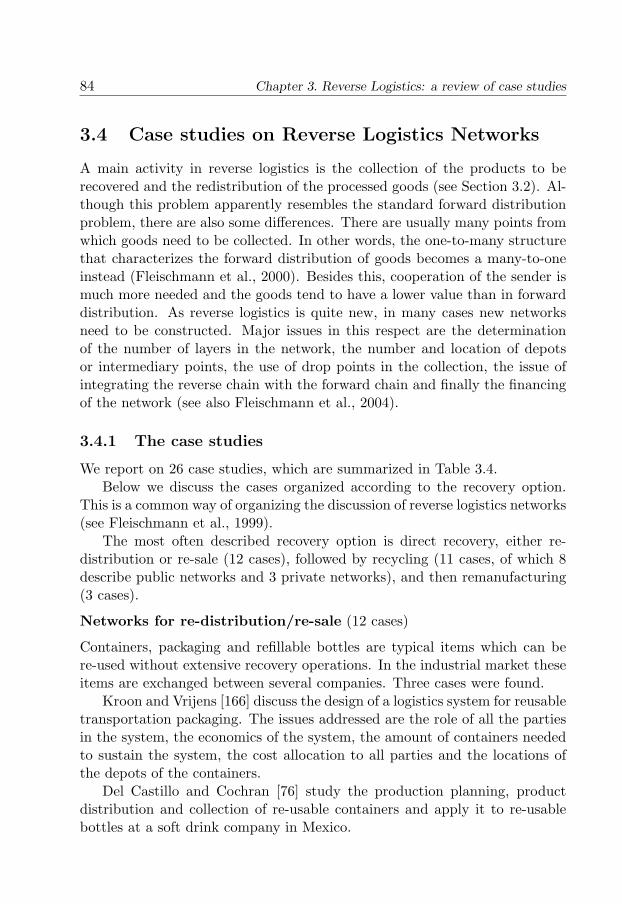
84 Chapter 3. Reverse Logistics: a review of case studies
3.4 Case studies on Reverse Logistics Networks
A main activity in reverse logistics is the collection of the products to berecovered and the redistribution of the processed goods (see Section 3.2). Al-though this problem apparently resembles the standard forward distributionproblem, there are also some differences. There are usually many points fromwhich goods need to be collected. In other words, the one-to-many structurethat characterizes the forward distribution of goods becomes a many-to-oneinstead (Fleischmann et al., 2000). Besides this, cooperation of the sender ismuch more needed and the goods tend to have a lower value than in forwarddistribution. As reverse logistics is quite new, in many cases new networksneed to be constructed. Major issues in this respect are the determinationof the number of layers in the network, the number and location of depotsor intermediary points, the use of drop points in the collection, the issue ofintegrating the reverse chain with the forward chain and finally the financingof the network (see also Fleischmann et al., 2004).
3.4.1 The case studies
We report on 26 case studies, which are summarized in Table 3.4.Below we discuss the cases organized according to the recovery option.
This is a common way of organizing the discussion of reverse logistics networks(see Fleischmann et al., 1999).
The most often described recovery option is direct recovery, either re-distribution or re-sale (12 cases), followed by recycling (11 cases, of which 8describe public networks and 3 private networks), and then remanufacturing(3 cases).
Networks for re-distribution/re-sale (12 cases)
Containers, packaging and refillable bottles are typical items which can bere-used without extensive recovery operations. In the industrial market theseitems are exchanged between several companies. Three cases were found.
Kroon and Vrijens [166] discuss the design of a logistics system for reusabletransportation packaging. The issues addressed are the role of all the partiesin the system, the economics of the system, the amount of containers neededto sustain the system, the cost allocation to all parties and the locations ofthe depots of the containers.
Del Castillo and Cochran [76] study the production planning, productdistribution and collection of re-usable containers and apply it to re-usablebottles at a soft drink company in Mexico.
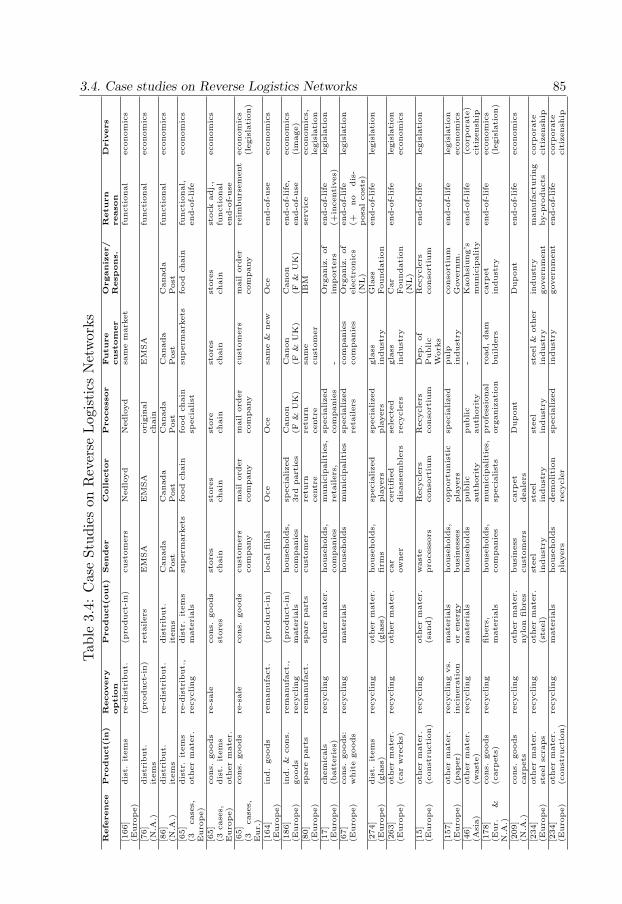
3.4. Case studies on Reverse Logistics Networks 85Tab
le3.
4:C
ase
Stud
ies
onR
ever
seLog
isti
csN
etw
orks
Refe
rence
Product(in
)R
ecovery
Product(out)
Sender
Collector
Processor
Future
Organiz
er/
Return
Driv
ers
optio
ncustom
er
Respons.
reason
[166]
dis
t.it
em
sre
-dis
trib
ut.
(pro
duct-
in)
cust
om
ers
Nedlo
yd
Nedlo
yd
sam
em
ark
et
functi
onal
econom
ics
(Euro
pe)
[76]
dis
trib
ut.
(pro
duct-
in)
reta
ilers
EM
SA
EM
SA
ori
gin
al
EM
SA
functi
onal
econom
ics
(N.A
.)it
em
schain
[86]
dis
trib
ut.
re-d
istr
ibut.
dis
trib
ut.
Canada
Canada
Canada
Canada
Canada
functi
onal
econom
ics
(N.A
.)it
em
sit
em
sPost
Post
Post
Post
Post
[65]
dis
tr.
item
sre
-dis
trib
ut.
,dis
tr.
item
ssu
perm
ark
ets
food
chain
food
chain
superm
ark
ets
food
chain
functi
onal,
econom
ics
(3case
s,Euro
pe)
oth
er
mate
r.re
cycling
mate
rials
specia
list
end-o
f-life
[65]
cons.
goods
re-s
ale
cons.
goods
store
sst
ore
sst
ore
store
sst
ore
sst
ock
adj.,
econom
ics
(3case
s,dis
t.it
em
sst
ore
schain
chain
chain
chain
chain
functi
onal
Euro
pe)
oth
er
mate
r.end-o
f-use
[65]
cons.
goods
re-s
ale
cons.
goods
cust
om
ers
ord
er
ord
er
cust
om
ers
ord
er
reim
burs
em
ent
econom
ics
(3case
s,Eur.
)com
pany
com
pany
com
pany
com
pany
(legis
lati
on)
[164]
ind.
goods
rem
anufa
ct.
(pro
duct-
in)
localfilial
Oce
Oce
sam
e&
new
Oce
end-o
f-use
econom
ics
(Euro
pe)
[186]
ind.
&cons.
rem
anufa
ct.
,(p
roduct-
in)
house
hold
s,sp
ecia
lized
Canon
Canon
Canon
end-o
f-life
,econom
ics
(Euro
pe)
goods
recycling
mate
rials
com
panie
s3rd
part
ies
(F&
UK
)(F
&U
K)
(F&
UK
)end-o
f-use
(im
age)
[80]
spare
part
sre
manufa
ct.
spare
part
scust
om
er
retu
rnre
turn
sam
eIB
Mse
rvic
eeconom
ics,
(Euro
pe)
centr
ecentr
ecust
om
er
legis
lati
on
[17]
chem
icals
recycling
oth
er
mate
r.house
hold
s,m
unic
ipaliti
es,
specia
lized
Org
aniz
.of
end-o
f-life
legis
lati
on
(Euro
pe)
(batt
eri
es)
com
panie
sre
tailers
,com
panie
s-
import
ers
(+in
centi
ves)
[67]
cons.
goods:
recycling
mate
rials
house
hold
sm
unic
ipaliti
es
specia
lized
com
panie
sO
rganiz
.of
end-o
f-life
legis
lati
on
(Euro
pe)
whit
egoods
reta
ilers
com
panie
sele
ctr
onic
s(N
L)
(+no
dis
-posa
lcost
s)[2
74]
dis
t.it
em
sre
cycling
oth
er
mate
r.house
hold
s,sp
ecia
lized
specia
lized
gla
ssG
lass
end-o
f-life
legis
lati
on
(Euro
pe)
(gla
ss)
(gla
ss)
firm
spla
yers
pla
yers
indust
ryFoundati
on
[263]
oth
er
mate
r.re
cycling
oth
er
mate
r.car
cert
ified
sele
cte
dgla
ssC
ar
end-o
f-life
legis
lati
on
(Euro
pe)
(car
wre
cks)
ow
ner
dis
ass
em
ble
rsre
cycle
rsin
dust
ryFoundati
on
(NL)
econom
ics
[15]
oth
er
mate
r.re
cycling
oth
er
mate
r.w
ast
eR
ecycle
rsR
ecycle
rsD
ep.
of
Recycle
rsend-o
f-life
legis
lati
on
(Euro
pe)
(const
ructi
on)
(sand)
pro
cess
ors
conso
rtiu
mconso
rtiu
mPublic
Work
sconso
rtiu
m
[157]
oth
er
mate
r.re
cycling
vs.
mate
rials
house
hold
s,opport
unis
tic
specia
lized
pulp
conso
rtiu
mend-o
f-life
legis
lati
on
(Euro
pe)
(paper)
incin
era
tion
or
energ
ybusi
ness
es
pla
yers
indust
ryG
overn
m.
econom
ics
[46]
oth
er
mate
r.re
cycling
mate
rials
house
hold
spublic
public
-K
aohsi
ung’s
end-o
f-life
(corp
ora
te)
(Asi
a)
(wast
e)
auth
ori
tyauth
ori
tym
unic
ipality
cit
izensh
ip[1
78]
cons.
goods
recycling
fibers
,house
hold
s,m
unic
ipaliti
es,
pro
fess
ional
road,dam
carp
et
end-o
f-life
econom
ics
(Eur.
&N
.A.)
(carp
ets
)m
ate
rials
com
panie
ssp
ecia
list
sorg
aniz
ati
on
builders
indust
ry(l
egis
lati
on)
[209]
cons.
goods
recycling
oth
er
mate
r.busi
ness
carp
et
Dupont
Dupont
end-o
f-life
econom
ics
(N.A
.)carp
ets
nylo
nfibre
scust
om
ers
deale
rs[2
34]
oth
er
mate
r.re
cycling
oth
er
mate
r.st
eel
steel
steel
steel&
oth
er
indust
rym
anufa
ctu
ring
corp
ora
te(E
uro
pe)
steelsc
raps
(ste
el)
indust
ryin
dust
ryin
dust
ryin
dust
rygovern
ment
by-p
roducts
cit
izensh
ip[2
34]
oth
er
mate
r.re
cycling
mate
rials
house
hold
sdem
oliti
on
specia
lized
indust
rygovern
ment
end-o
f-life
corp
ora
te(E
uro
pe)
(const
ructi
on)
pla
yers
recycle
rcit
izensh
ip
86 Chapter 3. Reverse Logistics: a review of case studies
Duhaime et al. [86] discuss the collection and distribution of returnablecontainers for Canada Post. Again the inventory balance between the differentlocations is a major problem. The last two cases also have production planningand control issues and are also discussed in Section 3.6.
De Koster et al. [65] describe return handling operations of three food re-tailers, three department chains, and three mail-order companies (see Chapter5).
Networks for remanufacturing (3 cases)
Remanufacturing is typically applied to complex equipment or machinerywith many modules and parts. It is usually a labor-intensive activity, whichrequires much testing. Fleischmann et al. (2000) makes a further distinctioninto networks set up by the OEM and by independents, as in the latter casethere can be no integration with the forward chain. We found the followingcases.
Krikke et al. [164] discuss the remanufacturing of photocopiers. Theauthors consider two options for the remanufacturing facility, one coincidingwith the manufacturing facility and one in a cheap labor country. Theyevaluate the costs of both options, including the transportation effects.
Meijer [186] discusses the remanufacturing of used scanners, printers,copiers, faxes at Canon.
Dijkhuizen [80] discusses the remanufacturing network of IBM. He dealswith the problem of where to re-process the products: in each country, orcentrally at one place in Europe.
Networks for Recycling (11 cases)
One can distinguish two types of networks depending on the organizer/ re-sponsible party, viz. private and public. Fleischmann et al. (1999) andGoggin and Browne (2000) have also made this kind of differentiation whileclassifying networks for recovery.
Public Networks (7 cases)
There are several papers describing the set-up and organization of recyclingnetworks in The Netherlands.
Bartels [17] describes the Dutch nationwide system for the recycling ofbatteries. Since 1995, it is legally required that all Dutch battery manu-facturers and importers have the batteries they sell retrieved and recycled.Stichting Batterijen (Stibat), was put together to make possible for Dutchbattery manufacturers and importers to fulfil these legal requirements. Stibatis a non-profit organization, of which batteries manufacturers and importers
3.4. Case studies on Reverse Logistics Networks 87
are members. The Stibat Plan describing how batteries are collected andprocessed was approved by the Dutch ministry of Environment (VROM).
De Koster et al. [67] deal with recycling of white and brown goods. Whitegoods are large consumer appliances, like washers, dryers, and refrigerators.Brown goods are small domestic appliances, such as a video recorder. Theauthors also describe the details of network for end-of-life large white goods inDe Koster et al. (2003). The consumer pays a disposal fee when purchasingthe good, and the sector organization is responsible for “distributing” themoney among the parties involved.
Van Notten [274] explains the glass recycling system in the Netherlands.The rules are legally established by the Dutch Ministry for the Environment(VROM). The glass industry formed a Glass Recycling Foundation to dealwith them. The authors discuss the bring and pickup systems for the collec-tion of glass scrap from households.
Van Burik [263] describes the car-recycling nation-wide scheme in theNetherlands. Again a society, Auto Recycling Nederland (ARN) was raisedby the car manufacturers, importers, and other players in the network of thecar industry to address car recycling. A tax on new purchased cars, paid bythe consumer to the car importer is used to pay for the recycling. Discardedcars are first assembled at car dismantling centers. Resulting materials arecollected and centrally recycled. Recycling companies are paid for processingvolumes.
Barros et al [15] discuss the design of a network for the recycling of sandcase that comes free during the sieving of building waste, in the Netherlands.Sand recycling in large-scale infrastructure projects, e.g. road construction,is considered a potential alternative to land fill and furthermore aligned withenvironmental legislation. The Department of Public Works is responsible forthe destination of the recycled sand, since it coordinates large-scale infrastruc-ture projects. As the Dutch government aims to increase the recycling quotaof building waste from 70% to 90%, a consortium of construction waste pro-cessing companies is interested in improving efficiency in the sand-recyclingnetwork. The main problem tackled in the paper is the determination of thenumber and location of depots of the sand.
Kleineidam et al. [157] consider the structure of the recycling network ofthe paper industry in the Netherlands. Paper recycling in the Netherlands isbounded by the rules put down by the Dutch Ministry for the Environment(VROM). Companies selling or importing paper and cardboard in/to theDutch market are members of the Dutch Corporation of Paper Recycling.This corporation is in charge of the control mechanisms. The recycling systemresembles a close-loop, with used paper being collected, processed, and turned
88 Chapter 3. Reverse Logistics: a review of case studies
into pulp, which is raw material for the paper industry. Paper from householdsis mainly collected by a network kept up by non-profit organizations. Theauthors investigate the dynamic behavior of the chain and use it to evaluatethe system. In the analysis, both incineration costs and paper taxes areconsidered.
Chang and Wei [46] discuss the recycling network for household waste ofthe city of Kaohsiung in Taiwan, Waste management is maneuvered by theEnvironmental Protection Bureau of the city. This bureau has the challengeto have in place an effective planning recycling program. The authors dealwith the allocation of the recycling drop-off stations.
Private Networks (4 cases)
Louwers et al. [178] discuss the set up of a carpet recycling system. Itconcerns a special type of carpets, of which the output is used as feedstockin the chemical industry. Both the organization and the collection networkare discussed. Realff et al. [209] discuss a similar network, using the sametechnology, but now in the U.S.
Spengler et al. [234] discuss two cases, one for recycling building debrisand one for the recycling of by products in the German steel industry. Theauthors consider the effect of various variables, like the cooperation betweencompanies.
3.4.2 Preliminary insights
The outline of the previous section is organized around two dimensions of theframework, as follows: the how and the who (see Chapter 2). In more detail,we presented cases for
• Networks for re-distribution/re-sale,
• Networks for remanufacturing,
• Networks for Recycling - Public Networks,
• Networks for Recycling - Private Networks.
Typologies of the how and the who, also have been (more or less con-sciously) employed in previous literature to distinguish reverse logistics net-works (see Fleischmann et al., 1999; Goggin and Browne, 2000; Fleishmannet al., 2000; and Fleischman et al., 2004). Thus, the how and the who are twoprominent elements when one characterizes reverse logistics networks. Wecome back to this on Section 3.9.
3.5. Case studies on Reverse Logistics Relationships 89
In general, within reverse logistics networks, the models to determine thelocation of facilities are based on deterministic integer programming models(Fleischman et al., 2004). However, it is commonly accepted that reverselogistics is characterized by much more uncertainty than in forward logistics(see Dekker et al., 2004). With this in mind, there is space for stochasticprogramming modelling with respect to reverse logistics network design (seee.g. Listes and Dekker 2001).
3.5 Case studies on Reverse Logistics Relationships
It is typical for reverse logistics that several parties are involved, such as thesender of the product, the collector, the processor and the organizer/initiator(see Chapter 2). To stimulate/enforce a certain behavior of their partners,parties in the reverse chain make use of various incentive tools. In this subsec-tion we discuss our findings with respect to the tools that are used in practiceto stimulate/enforce a desired behavior of partners in the context of productrecovery. A summary of the cases is provided in Table 3.5.
A distinction should be made between two categories of incentives to stim-ulate/enforce a certain behavior of other players in the supply chain:
1. incentives to acquire products for recovery, and
2. incentives to force others to accept the products a company wants toget rid of.
To be more concrete, two examples follow: in the first situation, a producerof toner cartridges may be interested in getting back its empty cartridges; inthe second situation, a company buying chemical raw materials in kegs, maywish that a supplier takes back these kegs (avoiding in this way potentiallyhigh disposal costs, once the kegs are empty). Accordingly, these companiesare looking for incentives to make “their wishes come true” but against thelowest costs.
The cases embrace incentives regarding functional returns, service returns,end-of-use returns and end-of-life returns.
3.5.1 The case studies
We have found ten cases illustrating the employment of eight different incen-tive tools, as follows:
1) Deposit fee: This fee may concern the product itself or the distributionitem like a bottle, box, and pallet. An example of the former is the deposit
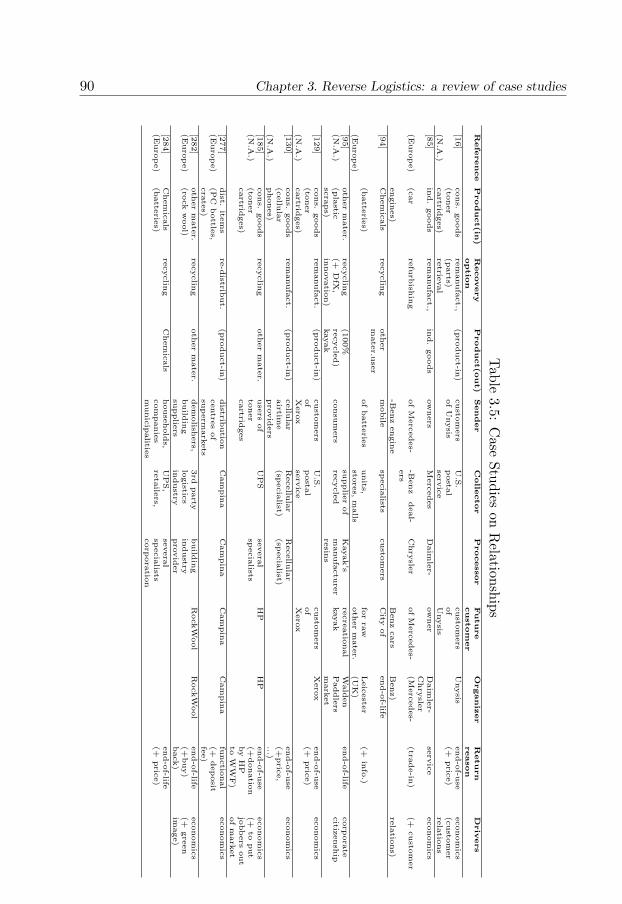
90 Chapter 3. Reverse Logistics: a review of case studies
Table
3.5:C
aseStudies
onR
elationshipsR
efe
rence
Product(in
)R
ecovery
Product(out)
Sender
Colle
ctor
Processor
Future
Organiz
er
Return
Driv
ers
optio
ncustom
er
reason
[16]
cons.
goods
rem
anufa
ct.,
(pro
duct-in
)custo
mers
U.S
.custo
mers
Unysis
end-o
f-use
econom
ics
(toner
(parts)
ofU
nysis
posta
lof
(+pric
e)
(custo
mer
(N.A
.)cartrid
ges)
retrie
val
serv
ice
Unysis
rela
tions
[85]
ind.
goods
rem
anufa
ct.,
ind.
goods
ow
ners
Merc
edes
Daim
ler-
ow
ner
Daim
ler-
Chry
sler
serv
ice
econom
ics
(Euro
pe)
(car
refu
rbish
ing
ofM
erc
edes-
-Benz
deal-
ers
Chry
sler
ofM
erc
edes-
(Merc
edes-
(trade-in
)(+
custo
mer
engin
es)
-Benz
engin
eB
enz
cars
Benz)
rela
tions)
[94]
Chem
icals
recyclin
goth
er
mate
r.use
rm
obile
specia
listscusto
mers
City
of
end-o
f-life
(batte
ries)
ofbatte
ries
units,
for
raw
Leic
este
r(+
info
.)(E
uro
pe)
store
s,m
alls
oth
er
mate
r.(U
K)
[95]
oth
er
mate
r.re
cyclin
g(1
00%
supplie
rof
Kayak’s
recre
atio
nal
Wald
en
end-o
f-lifecorp
ora
te(N
.A.)
(pla
stic(+
DfX
,re
cycle
d)
consu
mers
recycle
dm
anufa
ctu
rer
kayak
Paddle
rscitiz
ensh
ipsc
raps)
innovatio
n)
kayak
resin
sm
ark
et
[129]
cons.
goods
rem
anufa
ct.
(pro
duct-in
)custo
mers
U.S
.custo
mers
Xero
xend-o
f-use
econom
ics
(toner
of
posta
lof
(+pric
e)
(N.A
.)cartrid
ges)
Xero
xse
rvic
eX
ero
x[1
30]
cons.
goods
rem
anufa
ct.
(pro
duct-in
)cellu
lar
Recellu
lar
Recellu
lar
end-o
f-use
econom
ics
(cellu
lar
airtim
e(sp
ecia
list)(sp
ecia
list)(+
pric
e,
(N.A
.)phones)
pro
vid
ers
...)[1
85]
cons.
goods
recyclin
goth
er
mate
r.use
rsof
UPS
severa
lH
PH
Pend-o
f-use
econom
ics
(N.A
.)(to
ner
toner
specia
lists(+
donatio
n(+
toput
cartrid
ges)
cartrid
ges
by
HP
jobbers
out
toW
WF)
ofm
ark
et
[277]
dist.
item
sre
-distrib
ut.
(pro
duct-in
)distrib
utio
nC
am
pin
aC
am
pin
aC
am
pin
aC
am
pin
afu
nctio
nal
econom
ics
(Euro
pe)
(PC
bottle
s,centre
sof
(+deposit
cra
tes)
superm
ark
ets
fee)
[282]
oth
er
mate
r.re
cyclin
goth
er
mate
r.dem
olish
ers,
3rd
party
build
ing
RockW
ool
RockW
ool
end-o
f-lifeeconom
ics
(Euro
pe)
(rock
wool)
build
ing
logistic
sin
dustry
(+buy)
(+gre
en
supplie
rsin
dustry
pro
vid
er
back)
image)
[284]
Chem
icals
recyclin
gC
hem
icals
house
hold
s,U
PS,
severa
lend-o
f-life(E
uro
pe)
(batte
ries)
com
panie
sre
taile
rs,sp
ecia
lists(+
pric
e)
munic
ipalitie
scorp
ora
tion
3.5. Case studies on Reverse Logistics Relationships 91
fee that has to be paid when renting a car, whereas an example of the latteris the deposit fee on certain bottles from glass and PET bottles (functionalreturns), see e.g. Vroom et al [277].
2) Buy back option: At the moment that a product is sold, the buyer isoffered the possibility to sell back the product on a later moment in time.Some conditions can be imposed, such as kilometers driven.
For instance, Ford has a program called Options, which gives the clientsome advantages in exchanging his/her car, after two years, for another newcar Ford (end-of-use returns).
Rockwool Lapinus, the Dutch subsidiary of the Danish Rockwool Com-pany, gives the client the opportunity to return rock wool for free or for alower price than he/she would else have to pay to get rid of it (end-of-lifereturns), see Wijshof [282]. Numerous examples of buy back options for un-used products (commercial returns) are presented in the literature, where noexplicit attention is paid to what happens to these products thereafter (seee.g. Tsay (2001)).
3) Trade-in: One can only get a new product if a used one is returned.This incentive is among others used by Daimler-Benz for the engines thatthey produce for Mercedes-Benz passenger cars and small vans (Driesch et al,[85]). Owners of a Mercedes-Benz (MB) passenger car or small van with anMB engine can go to an authorized MB dealer in order to have their presentengine replaced by a reconditioned engine (service returns). The MB dealerremoves the engine and sends it to the central parts Distribution Center (DC)of the center of Daimler-benz motor recycling (DB-MTR). From this DC, areconditioned engine is sent to the dealer where the engine is available within24 hours. The MB-dealer puts the reconditioned engine in the MB passengercar or van, after which its owner can use the car again.
4) Acquisition price: This is paid to the sender/giver when he or shedelivers a product for recovery. Some suppliers for toner cartridges, includingUNISYS, deliver their cartridge in a box that can be returned for free tothem either by post (Bartel [16]) or via another third party logistics serviceprovider like Hewlett Packard or Xerox do (see McGavis [185], Guide andvan Wassenhove, [129]). Recellular, a U.S. cellular phone remanufactureris also very active in setting prices to buy used mobile phones in the B2Benvironment (see Guide and van Wassenhove [130]). These are cases of end-of-use returns.
Also manufacturers of batteries use this type of incentive, see Yender [284].Another example is Varta, the German battery manufacturer, that pays 50pin the UK for every returned rechargeable battery (end-of-life returns) send
92 Chapter 3. Reverse Logistics: a review of case studies
to a collection point (see Faria de Almeida and Robertson [94]).
5) Supplying timely and clear information about the recovery program:How important this incentive is, is illustrated by a pilot system for the col-lection of different types of batteries in Denmark and Germany (end-of-lifereturns), where it turned out that it was too difficult for a number of suppliersto understand clearly which type of battery they have (see Faria de Almeidaand Robertson [94]).
6) Power : As always, power can be used to force desired behavior. Anexample is New England Foam of Windsor. One of the customers of thiscompany, Walden Paddlers uses her power as a customer to force her supplier,New England Foam of Windsor, to take back their cardboard boxes (end-of-life returns), see Farrow and Johnson. [95].
7) Environmental responsibility : The idea is to appeal to the consumer’senvironmental responsibility. This incentive is likely to require a lot of ad-vertising, and its reliability is questionable, as is illustrated by the collectionof toner cartridges (end-of-use returns), by Hewlett Packard (see McGavis[185]).
8) Social responsibility : The idea is to appeal to charity donors. Basically,it works as follows: for each product received for recovery, a non-profit orga-nization receives an amount of money. This incentive was used by HewlettPackard in the beginning of the nineties but it did not result in a satisfy-ing number of returns (McGavis, [185]). A drawback of this incentive isthat the company is going to accept the products without any guarantee ofquality. This also applies to the previous tool, i.e. appealing for the con-sumers’environmental responsibility.
Very recently, this incentive was revived by Recellular (see Recellular,2003) in the U.S. and by the retailer chain Tesco in the U.K. (see Tesco,2003), to acquire used mobile phones. All these are examples of end-of-usereturns.
3.5.2 Preliminary Insights
Among the ten cases, there are quite different incentive tools:
1) Deposit fees (Vroom et al.[277]),2) Buy back options (Wijshof [282])3) Trade-in (Driesch et al, [85]),4) Acquisition price (Faria de Almeida and Robertson [94], Bartel [16],
McGavis [185], Guide and van Wassenhove [130], [129]; Yender [284]),
3.5. Case studies on Reverse Logistics Relationships 93
5) Timely and clear information (Faria de Almeida and Robertson [94]),6) Power (Farrow and Johnson [95]),7) Environmental responsibility (McGavis [185]), and8) Social responsibility (McGavis [185])
In the beginning of this section we distinguished two type of incentives:
1) incentives to acquire products for recovery, and2) incentives to force others to accept the products a company wants to
get rid of.
Actually only one among the ten cases found was on the latter type ofincentive. This is the case of Walden Paddlers using its power to force itssupplier of foam to take back the cardboard boxes (see Farrow and Johnson[95]). Besides this, not all the other cases are examples of incentives exclu-sively dedicated to acquire products for recovery. Many of the tools are alsomeant to keep customers. One example is the buy back option offered byFord (www.ford.nl), when the customer buys another new Ford after 2 years.Another example is the case of the engine trade-in option offered by DaimlerChrysler (Driesch et al [85]). Other tools are not directly coupled to a sellingactivity and they can involve more than just own customers. For instance,a gift to a non-profit organization (see McGavis [185]) as used by Tesco toget back used mobile phones. Or, deposit fees on beverages, where customersfrom one shop may return the empty bottles in another shop. Actually, thelatter seems to be the only incentive that is specific for product recovery.Other incentives can serve other objectives than recovery alone.
Next, we make some observations regarding the incentives in the cases andthe return reason why-returning. The cases do not report on manufacturingreturns. These are usually handled internally, or they are not a matter ofacquisition anyway. A similar argument can be used for the absence of stockadjustments. None of the cases include product recalls, as in this situationsafety is a key-issue thus the parties involved have to take their responsibility.Regarding B2B and B2C commercial returns, these are documented in the lit-erature on contracts for unused products with a return option (see Anupindiand Bassok, 1999; Corbett and Tang, 1999; Debo et al., 2004; Tsay et al.,1999; Tsay, 2001; Lariviere, 1999). The cases presented here embraced incen-tives to acquire products from functional, service, end-of-use and end-of-lifereturns (see Table 3.6). The table shows that for several return reasons, itseems to exist different incentives to choose from.
Although all the aforementioned incentives can be found in practice, thereare no models in the literature supporting the choice of incentive. The litera-
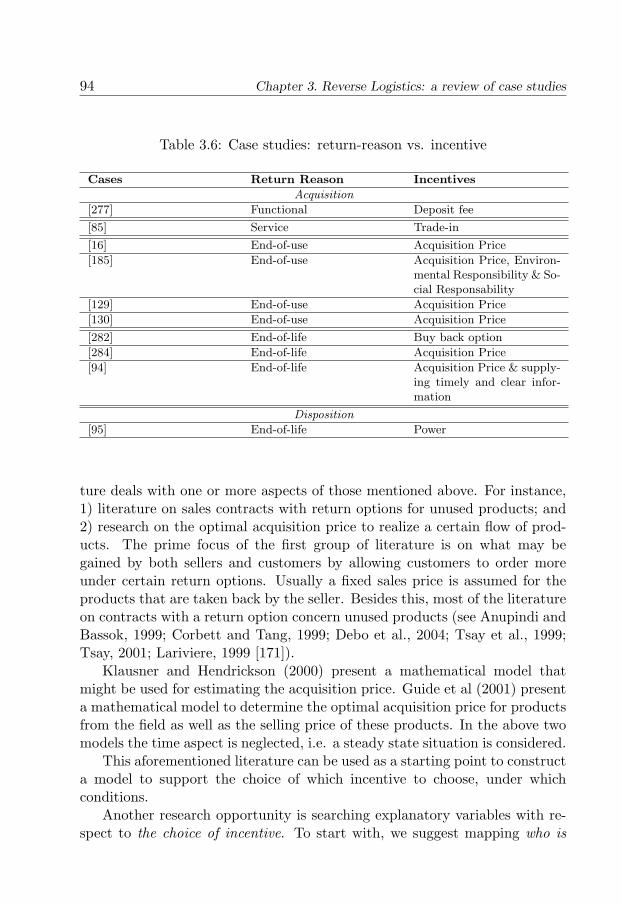
94 Chapter 3. Reverse Logistics: a review of case studies
Table 3.6: Case studies: return-reason vs. incentive
Cases Return Reason Incentives
Acquisition
[277] Functional Deposit fee
[85] Service Trade-in
[16] End-of-use Acquisition Price
[185] End-of-use Acquisition Price, Environ-mental Responsibility & So-cial Responsability
[129] End-of-use Acquisition Price
[130] End-of-use Acquisition Price
[282] End-of-life Buy back option
[284] End-of-life Acquisition Price
[94] End-of-life Acquisition Price & supply-ing timely and clear infor-mation
Disposition
[95] End-of-life Power
ture deals with one or more aspects of those mentioned above. For instance,1) literature on sales contracts with return options for unused products; and2) research on the optimal acquisition price to realize a certain flow of prod-ucts. The prime focus of the first group of literature is on what may begained by both sellers and customers by allowing customers to order moreunder certain return options. Usually a fixed sales price is assumed for theproducts that are taken back by the seller. Besides this, most of the literatureon contracts with a return option concern unused products (see Anupindi andBassok, 1999; Corbett and Tang, 1999; Debo et al., 2004; Tsay et al., 1999;Tsay, 2001; Lariviere, 1999 [171]).
Klausner and Hendrickson (2000) present a mathematical model thatmight be used for estimating the acquisition price. Guide et al (2001) presenta mathematical model to determine the optimal acquisition price for productsfrom the field as well as the selling price of these products. In the above twomodels the time aspect is neglected, i.e. a steady state situation is considered.
This aforementioned literature can be used as a starting point to constructa model to support the choice of which incentive to choose, under whichconditions.
Another research opportunity is searching explanatory variables with re-spect to the choice of incentive. To start with, we suggest mapping who is
3.6. Case studies on Inventory Management 95
who in each network. This is because an important factor in choosing betweenincentive tools is to be informed on the alternatives that other players haveand the costs associated with them. Therefore, the type of players and theirinterrelations are likely to determine the type of incentive tools employed.
3.6 Case studies on Inventory Management
The 14 cases on inventory management within reverse logistics are given inTable 3.6. They can be classified according to the return reasons (see Section3.2). We did not find cases for all the return reasons. We did find casesfor functional returns, B2C commercial returns, service returns, end-of-usereturns and end-of-life returns. Omissions can be explained as follows. Man-ufacturing returns are often treated in production planning contexts. Productrecalls are often special events, which are left out of consideration in inven-tory management. Warranty returns have similar characteristics as repairs.They differ mainly in the contractual side and accordingly one cannot expectmany publications with an inventory management focus. Stock adjustmentsare somewhat similar to some of B2B commercial returns (bulk returns) andmight even not be distinguished from them in the case descriptions. Belowwe go over the cases in more detail.
3.6.1 The case studies
Functional returns (2 cases)
This category corresponds to distribution items, that is, products like con-tainers, bottles, railcars and crates, which are used for distribution purposes.On this we report two cases, viz. Swinkels and van Esch [242] and Del Castilloand Cochran [76]. Here the location of the distribution items is a major issuein the inventory decision.
Del Castillo and Cochran [76] study production and distribution planningfor products delivered in reusable containers. Their model includes trans-portation of empty containers back to the plants. Availability of empty con-tainers is modelled as a resource constraint for the production of the originalproduct. The model is applied to a case study of a soft drink company usingreturnable bottles.
Swinkels and Van Esch [242] describe how the optimal stock of refillablebeer kegs is determined within Bavaria, a Dutch beer brewery.
96 Chapter 3. Reverse Logistics: a review of case studies
Table
3.7:C
aseStudies
onInventory
Managem
entR
efe
rence
Product(in
)R
ecovery
Product(out)
Sender
Colle
ctor
Processor
Future
Organiz
er
Return
Driv
ers
optio
ncustom
er
reason
[59]
ind.g
oods
re-u
sein
d.g
oods
inte
rnal
custo
mer
CER
Nin
tern
al
CER
Nre
ium
burse
ment,e
conom
ics
(Euro
pe)
custo
mers
(brin
g-b
ack)
custo
mers
end-o
f-use
[59]
cons.
goods
re-sa
lecons.
goods
custo
mers
ord
er
ord
er
custo
mers
ord
er
reim
burse
ment
econom
ics,
(Euro
pe)
com
pany
com
pany
(sam
em
ar-
ket)
com
pany
legisla
tion
[59]
spare
parts
repair,
spare
parts
serv
ice
serv
ice
Refinery
inte
rnal
serv
ice
econom
ics
(Euro
pe)
(refinary
)re
-use
engin
eers
engin
eers
custo
mer
[76]
distrib
ut.
re-d
istribut.
(pro
duct-in
)re
taile
rsC
oca-C
ola
Coca-C
ola
orig
inal
Coca
Cola
functio
nal
econom
ics
(N.A
.)ite
ms
chain
chain
[79]
spare
parts
repair
spare
parts
Cara
cas
Cara
cas
Cara
cas
Cara
cas
Cara
cas
serv
ice
econom
ics
(S.A
.)(ra
ilways)
subw
ay
subw
ay
subw
ay
subw
ay
subw
ay
[82]
spare
parts
repair
spare
parts
tele
phone
Lucent
Lucent
sam
eLucent
serv
ice
econom
ics
(Euro
pe)
(tele
phones)
com
panie
sTechnolo
gie
sN
ederla
nd
Technolo
gie
sN
ederla
nd
chain
Technolo
gie
sN
ederla
nd
[101]
ind.
goods
repair,
ind.
goods
busin
ess
IBM
end-o
f-lifeeconom
ics
(Euro
pe)
(IBM
)re
furb
ish.
spare
-parts
custo
mers
etc
.[1
54]
cons.
goods
rem
anufa
ct.,
(pro
duct-in
)custo
mers
specia
lized
specia
lized
manufa
ctu
rers
end-o
f-lifeeconom
ics
(Euro
pe)
(pow
er
tools)
recyclin
goth
er
mate
r.party
facility
(pro
-activ
e)
[192]
ind.
goods
repair,
ind.
goods
UK
UK
UK
UK
UK
serv
ice
econom
ics
(Euro
pe)
(airc
raft
en-
gin
e)
refu
rbish
ing
Air
Forc
eA
irForc
eA
irForc
eA
irForc
eA
irForc
e
[222]
cons.
goods
reuse
,(p
roduct-in
)use
rsN
orw
egia
nTA
Cor
sam
eN
orw
egia
nend-o
f-use
econom
ics,
(aid
equip
.)re
furb
ish.,
Technic
al
Aid
specia
lized
mark
et
Natio
nal
serv
ice
corp
ora
te
(Euro
pe)
retrie
val,...
Cente
rs(T
AC
)pla
yer
Insu
rance
Adm
inistra
-tio
n
citiz
ensh
ip
[223]
cons.
goods
re-sa
lecons.
goods
custo
mer
3rd
party
Wehkam
psa
me
Wehkam
pre
imburse
ment
econom
ics
(Euro
pe)
log.
pro
vid
er
(cata
logue)
mark
et
(legisla
tion)
[242]
distrib
ut.
item
sre
-distrib
ut.
distrib
ut.
item
sbusin
ess
Bavaria
Bavaria
Bavaria
functio
nal
econom
ics
(Euro
pe)
(beer
kegs)
custo
mers
agents
Bavaria
[256]
cons.
goods
rem
anufa
ct.
cons.
goods
consu
mer
photo
Kodak
sam
eK
odak
serv
ice
econom
ics
(single
-use
shops,
chain
(Euro
pe,
photo
oth
er
N.A
.)cam
era
s)re
taile
rs[2
66]
spare
parts
rem
anufa
ct.
spare
parts
Importe
rVolk
swagen
Volk
swagen
Importe
rVolk
swagen
serv
ice
econom
ics
(Euro
pe)
(cars)
org
aniz
atio
ns
(inK
asse
l)(in
Kasse
l)org
aniz
atio
ns
(inK
asse
l)
3.6. Case studies on Inventory Management 97
Commercial returns (3 cases)
Commercial returns occur in a B2B or in a B2C setting (see Section 3.2),where the buyer has a right to return the product, usually within a certainperiod. In the B2B setting, there are all kind of contracts lowering the riskof e.g. the retailer by giving him the opportunity to return what is not sold.In this situations, returns are likely to be in bulk and at the end of a season.In the B2C setting, consumers are given, or they have by law, the right toreturn a product if the product does not really meets his/her expectations.
Sanders et al. [223] describe how the inventories of products are controlledwithin Wehkamp, a Dutch mail order company, selling all kinds of consumergoods to the Dutch and Belgium market. Two types of products are dis-tinguished: seasonal and non-seasonal products. For the first, the companyemploys an amended version of the newsboy model taking into account re-turns. For the latter, the inventory management is done according to an (R,S) policy.
De Brito and Dekker [59] investigate the distribution of the return lag, i.e.the time between the purchase and the return of an item, and its consequencesfor inventory management (see Chapter 6). Two cases of commercial returnsare considered, viz. a mail order company and and the warehouse at thecenter for nuclear research, CERN.
Service return (6 cases)
Within service systems like repair systems returns occur basically in two ways.First of all, the products themselves may be brought or sent to a center forrepair. If the repair is successful, they are brought back, else, a new productor system needs to be bought and the one that failed is discarded. Secondly,if one needs a continuous functioning of the product or system, one maydirectly restore functionality by replacing a spare part. The failed part isthen repaired, after which it will enter the inventory of spare parts. The casesfound are described below in detail.
Diaz and Fu [79] study a 2-echelon repairable item inventory model withlimited repair capacity. For several classes of arrival processes they develop ananalytic expression for the number of items in queue at the different stages ofthe system. They analyze the impact of the capacity limitation and comparethe performance of their approach with an uncapacitated METRIC type ofmodel. Both models are applied to the case of spare parts management atthe Caracas subway system.
Donker and Van der Ploeg [82] describe how the optimal stock of reparableservice parts of telephone exchanges is determined within Lucent Technolo-gies Netherlands. They use an amended METRIC model, where the service
98 Chapter 3. Reverse Logistics: a review of case studies
measure is fill rate (i.e. the percentage of demand that can immediately befulfilled from stock) and there is no budget restriction for service parts.
Moffat [192] provides a brief summary of a Markov chain model for ana-lyzing the performance of repair and maintenance policies of aircraft enginesat the Royal Air force.
Van der Laan [266] describes the remanufacturing chain of engines andautomotive parts for Volkswagen. It is somewhat similar to the engine re-manufacturing case with Mercedes Benz in the previous section (see Drieschet al. [85]).
A special example of service returns is the one described by Toktay etal. [256] on Kodak’s single use camera. Customers return it, so they candevelop the film. Printed circuit boards for the production of these camerasare either bought from overseas suppliers or remanufactured from the camerasreturned by the customers via photo laboratories. The issue is to determinea cost-efficient order policy for the external supplies. Major difficulties arisefrom the fact that return probabilities and market sojourn-time distributionare largely unknown and difficult to observe. The authors propose a closedqueuing network model to address these issues. They assess the importanceof information on the returns for the control of the network.
De Brito and Dekker [59] investigate the distribution of the return lag, i.e.the time between the purchase and the return of an item for a spare partswarehouse at a petrochemical plant.
End-of-use returns (1 case)
This return reason concerns items that are only temporarily with the user.The product may e.g. be leased or rented.
Rudi et al. [222] discuss the product recovery actions of the Norwegian na-tional insurance administration. This public entity retrieves no longer neededwheel chairs, hearing aids and similar products provided to people with hand-icaps. They assess how many are needed to meet all demands.
End-of-life returns (2 cases)
Fleischmann [101] describes the dismantling of computers at the end of theirlife-cycle into useable spare parts with IBM. This source nicely combineswith return obligations and it is a cheap source for spare parts for systems onwhich one does not want to spend too much. The problems identified were alack of knowledge of the content of the computers, as well as, an insufficientinformation system to handle the operations.
Klausner and Hendrickson [154] develop a model to determine the optimalbuy-back amount to guarantee a continuous flow to remanufacturing power-
3.7. Case studies on Planning and Control of recovery activities 99
tools. The authors apply the model to the actual voluntary take-back programin Germany.
3.6.2 Preliminary Insights
We have grouped the presentation of the cases according to the why-returningtypology, i.e. according to the return reason as follows:
• Functional returns,
• Commercial returns,
• Service returns,
• End-of-use,
• End-of-life
This is because this seems a natural way of grouping and discriminatingthe reverse logistics issues raising from each inventory system. Other authorshave done roughly the same (see Dekker and van der Laan, 2003).
Many have defended that product data are essential for efficient handlingof returns. For instance, Kokkinaki et al. (2004) provide an example of thevalue of information for disassembly. Other authors have investigated theimpact of data, with respect to returns, on inventory management perfor-mance (Kelle and Silver, 1989 ; Toktay et al., 2000; De Brito and Van derLaan, 2003). Yet, there is still room to model the impact of having a prioriinformation on what can be recovered, i.e. on which parts are likely to berecoverable. In practice, techniques to forecast return behavior would haveto be enriched with broader explanatory variables. We refer to Toktay (2003)for a discussion of factors influencing returns, which are potential explanatoryvariables in advanced forecasting models.
Concluding, it remains to be investigated in which degree inventory sys-tems’ characteristics like timing, quality and degree of control, are determinedby the return reason why-returning, as well as on the type of product (what).
3.7 Case studies on Planning and Controlof recovery activities
This subsection deals with the planning and control of the recovery activities,i.e. collection for recovery and the recovery itself.
100 Chapter 3. Reverse Logistics: a review of case studies
Part of the planning and control of product recovery concerns the planningand control of supply of goods to be recovered in which incentives play animportant contextual role. This important aspect has already been dealt within subsection 3.5. In this subsection the incentives and their effect on supplyand acceptance are assumed to be given.
Planning and control of recovery activities is strongly related to inventorymanagement, the topic of the previous section. The latter includes the lev-els triggering recovery activities. Hereafter it is assumed that the inventorystrategy has already been decided on. What are left are decisions concerningthe planning of activities, such as on lot sizes, re-processing priorities andscheduling.
The 23 case studies on planning and control of product recovery activitiesthat we found in the literature (see Table 3.8) can be subdivided into casestudies dealing specifically with:
1) collection for recovery (13 cases), and2) recovery itself (9 cases).
The cases are succinctly presented in Table 3.7.
3.7.1 The case studies
Collection for recovery (13 cases)
In a number of case studies the lot size used for collection is given, usuallywithout explaining how these lot sizes have been determined. All the casestudies that we found concern end-of-use or end-of-life returns.
Andriesse [6] describes the Packaging Return System of Philip Morris forreusable pallets and sheets used to cover pallets. Philip Morris Holland BVand most of its suppliers agreed that the lot size for returning reusable palletsshould be a full truck.
Del Castillo and Cochran [76] describe the model used by EMSA, a softdrink producer in Mexico City, for determining the quantities of refillablebottles to be returned to the bottling plants. First the final customers returnthe bottles to the stores, which return them to the depots.
Duhaime et al [86] present a model that is used by Canada Post to deter-mine the number of empty containers that should be distributed and returnedeach month, as well as the number of containers stored each month per region.
Klausner and Hendrickson [154] mention the lot size used for the collectionof power tools by Robert Bosch GmbH.
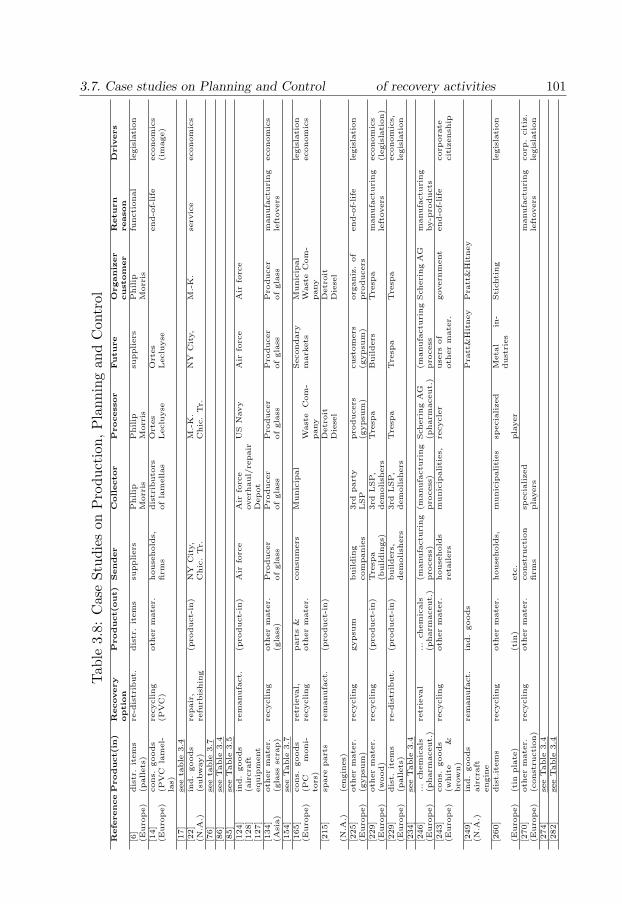
3.7. Case studies on Planning and Control of recovery activities 101Tab
le3.
8:C
ase
Stud
ies
onP
rodu
ctio
n,P
lann
ing
and
Con
trol
Refe
rence
Product(in
)R
ecovery
Product(out)
Sender
Collector
Processor
Future
Organiz
er
Return
Driv
ers
optio
ncustom
er
reason
[6]
dis
tr.
item
sre
-dis
trib
ut.
dis
tr.
item
ssu
ppliers
Philip
Philip
suppliers
Philip
functi
onal
legis
lati
on
(Euro
pe)
(pallets
)M
orr
isM
orr
isM
orr
is[1
4]
cons.
goods
recycling
oth
er
mate
r.house
hold
s,dis
trib
uto
rsO
rtes
Ort
es
end-o
f-life
econom
ics
(Euro
pe)
(PV
Cla
mel-
las)
(PV
C)
firm
sofla
mellas
Leclu
yse
Leclu
yse
(im
age)
[17]
see
table
3.4
[22]
ind.
goods
repair
,(p
roduct-
in)
NY
City,
M.-K
.N
YC
ity,
M.-K
.se
rvic
eeconom
ics
(N.A
.)(s
ubw
ay)
refu
rbis
hin
gC
hic
.Tr.
Chic
.Tr.
[76]
see
table
3.7
[86]
see
Table
3.4
[85]
see
Table
3.5
[124]
ind.
goods
rem
anufa
ct.
(pro
duct-
in)
Air
forc
eA
irfo
rce
US
Navy
Air
forc
eA
irfo
rce
[128]
(air
cra
ftoverh
aul/
repair
[127]
equip
ment
Depot
[134]
oth
er
mate
r.re
cycling
oth
er
mate
r.Pro
ducer
Pro
ducer
Pro
ducer
Pro
ducer
Pro
ducer
manufa
ctu
ring
econom
ics
(Asi
a)
(gla
sssc
rap)
(gla
ss)
ofgla
ssofgla
ssofgla
ssofgla
ssofgla
ssle
ftovers
[154]
see
Table
3.7
[165]
cons.
goods
retr
ieval,
part
s&
consu
mers
Munic
ipal
Secondary
Munic
ipal
legis
lati
on
(Euro
pe)
(PC
moni-
tors
)re
cycling
oth
er
mate
r.W
ast
eC
om
-pany
mark
ets
Wast
eC
om
-pany
econom
ics
[215]
spare
part
sre
manufa
ct.
(pro
duct-
in)
Detr
oit
Die
sel
Detr
oit
Die
sel
(N.A
.)(e
ngin
es)
[225]
oth
er
mate
r.re
cycling
gypsu
mbuildin
g3rd
part
ypro
ducers
cust
om
ers
org
aniz
.of
end-o
f-life
legis
lati
on
(Euro
pe)
(gypsu
m)
com
panie
sLSP
(gypsu
m)
(gypsu
m)
pro
ducers
[229]
oth
er
mate
r.re
cycling
(pro
duct-
in)
Tre
spa
3rd
LSP,
Tre
spa
Builders
Tre
spa
manufa
ctu
ring
econom
ics
(Euro
pe)
(wood)
(buildin
gs)
dem
olish
ers
left
overs
(legis
lati
on)
[229]
dis
t.it
em
sre
-dis
trib
ut.
(pro
duct-
in)
builders
,3rd
LSP,
Tre
spa
Tre
spa
Tre
spa
econom
ics,
(Euro
pe)
(pallets
)dem
olish
ers
dem
olish
ers
legis
lati
on
[234]
see
Table
3.4
[246]
...
chem
icals
retr
ieval
...
chem
icals
(manufa
ctu
ring
(manufa
ctu
ring
Scheri
ng
AG
(manufa
ctu
ring
Scheri
ng
AG
manufa
ctu
ring
(Euro
pe)
(pharm
aceut.
)(p
harm
aceut.
)pro
cess
)pro
cess
)(p
harm
aceut.
)pro
cess
by-p
roducts
[243]
cons.
goods
recycling
oth
er
mate
r.house
hold
sm
unic
ipaliti
es,
recycle
ruse
rsof
govern
ment
end-o
f-life
corp
ora
te(E
uro
pe)
(whit
e&
bro
wn)
reta
ilers
oth
er
mate
r.cit
izensh
ip
[249]
ind.
goods
rem
anufa
ct.
ind.
goods
Pra
tt&
Hit
ney
Pra
tt&
Hit
ney
(N.A
.)air
cra
ftengin
e[2
60]
dis
t.it
em
sre
cycling
oth
er
mate
r.house
hold
s,m
unic
ipaliti
es
specia
lized
Meta
lin
-dust
ries
Sti
chti
ng
legis
lati
on
(Euro
pe)
(tin
pla
te)
(tin
)etc
.pla
yer
[270]
oth
er
mate
r.re
cycling
oth
er
mate
r.const
ructi
on
specia
lized
manufa
ctu
ring
corp
.cit
iz.
(Euro
pe)
(const
ructi
on)
firm
spla
yers
left
overs
legis
lati
on
[274]
see
Table
3.4
[282]
see
Table
3.4
102 Chapter 3. Reverse Logistics: a review of case studies
Bartels [17] describes the Dutch nation wide collection and processing ofdisposed batteries. Among others, attention is paid to the collection of batter-ies at municipality collection points. These depots call one of the contractedcollectors to collect the batteries, what has to happen within one month.
Van Donk [270] describes the system set up by Nelis Utiliteitsbouw B.V.,a Dutch construction company. The system has as objective to raise the levelof reuse of different types of materials by separating them at the buildinglocations. Among other things, attention is paid to the number and sizes ofcontainers used for collection. Whenever at a building location it is expectedthat a container will be filled soon, a recycling company is called who replacesthe filled container by an empty one.
Van Notten [274] describes the recovery of glass in The Netherlands. Thebring and pickup systems for the collection of glass scrap from householdsare discussed, including the sizes of the containers used and the collectionscheme, usually being once a week.
Schinkel [225] describes the Dutch nation wide system for the recyclingof gypsum. Attention is paid to the actual collection of gypsum via specialcontainers and bags.
’T Slot and Ploos van Amstel [243] describe the pilot project in the regionof Eindhoven, the Netherlands preceding the introduction of a nation widesystem for the collection and processing of discarded white and brown goods.Among others attention is paid to the collection scheme at households (fixed,once per month or quarter), and the collection frequency at sales points ofwhite and brown goods.
Ubbens [260] describes the recovery of metal from metal packaging mate-rials in The Netherlands. Among others attention is paid to the number andsizes of special containers for collecting from households.
Wijshof [282] describes the system setup by Rockwool Benelux in theNetherlands for the collection and processing of rockwool production scrapand waste, as well as for the rockwool disposed after use. Among othersattention is paid to the sizes of the bags that are used for collection, and thenumber of bags that has to be filled before a third party is collecting themfor Rockwool. The disposer has to contact the third party to do this.
Simons [229] describes the recycling system set up by Trespa InternationalB.V. This company is a producer of sheets made from resins and wood fibers,which are used in the building industry. The recycling system was estab-lished to recycle(or alternatively to incinerate) these sheets, or parts of them.Attention is paid to the collection of leftover sheets at building sites. Theseleftovers are put into containers supplied by Trespa. The customer lets Trespaknow when a container is filled. Empty containers replace filled containers
3.7. Case studies on Planning and Control of recovery activities 103
when new Trespa sheets are delivered to the customer. The reusable palletsused for the distribution of the Trespa sheets to the customers are collectedby third party logistics service providers (3rd LSP’s).
Bakkers and Ploos van Amstel Jr [14] describe the recycling system setupby Ortes Lecluyse, a Dutch producer of PVC window blinds. Attention ispaid to the sizes of the containers used for collection and to the frequencyfor emptying these containers. The containers are located at their directcustomers, and they are collected once a week, when new window blinds aredelivered.
Recovery itself (9 cases)
Two cases have been found on disassembly that deal with the sequence inwhich products should be disassembled as well as the method and degreeof disassembly, i.e. the choice between destructive and nondestructive dis-assembly and the extent of the disassembly. Krikke et al. [165] discuss thedisassembly of PC monitors, where it appears difficult to determine in advancethe level of disassembly. This is due to the heterogeneity of the products tobe recovered. Kobeissi (2001) determines the optimal disassembly plan forwashing machines.
Bentley et al [22] mention that Morrison-Knudsen uses MRP II to plan theremanufacturing of subway/transit overhaul, but the authors do not explainexactly how. The latter also holds for Robinson [215] who mentions the use ofMRP by Detroit Diesel Remanufacturing West, that remanufactures DetroitDiesel engines.
Driesch et al [85] describe the car engine recovery network set up byMercedes-Benz For Europe, including the actual planning and control of therecovery activities in the plant in Berlin. Among other things it is mentionedthat the disassembly, cleaning, test, remanufacturing and reassembly activi-ties are dealt with in lots, and that the number of engines that are disassem-bled is related to the number of reconditioned engines that are reassembled.No further details are given, nor is explained how these lot sizes have beendetermined.
Guide and Spencer [124] and Guide and Srivastava [125], [126] discussa method for rough cut capacity planning to the Air Force overhaul de-pot. Guide and Srivastava [127] discuss a method to determine the inven-tory buffers between the disassembly and the remanufacturing shop, and theinventory buffer between the remanufacturing and the reassembly shop.
Thomas Jr. [249] mentions that the Pratt Whitney Aircraft remanufac-turing facility in West Virginia uses MRP to schedule inspection and rebuildof military and commercial aircraft engines. The batch size is one because
104 Chapter 3. Reverse Logistics: a review of case studies
different engines have to go through different routings. The bottleneck is theengine reassembly. Buffer time is used to protect this activity form variationsin foregoing activities. This time is determined via Linear Progamming, butno formulas are given.
Spengler et al. [234] discuss an Mixed Integer Linear Programming modelused for the planning of processing components arising from the dismantlingof buildings in the Upper Rhine Valley.
Next there are two case studies where the resources used for productionare also partly used for processing as described.
Gupta and Chakraborty [134] describe the processing of glass scrap gen-erated during the production of glass. A mathematical model is presented todetermine the optimal production lot size, taking into account the recyclingactivities. Teunter et al [246] describe the mathematical model presently usedby Schering AG, a German producer of pharmaceutical products, includingthe re-processing of by-products.
3.7.2 Preliminary Insights
The case studies on planning and control of product recovery activities thatwe found in literature can be subdivided into case studies dealing with:
• collection for recovery (13 cases)
- separate collection for recovery (Andriesse [6], Del Castillo andCochran [76], Duhaime et al [86], Klausner and Hendrickson [154], Bar-tels [17], Van Donk [270], Van Notten [274], Schinkel [225], ’t Slot andPloos van Amstel [243], Ubbens [260], and Wijshof [282]).
- combined collection and distribution (Simons [229], Bakkers andPloos van Amstel Jr [14]).
• recovery (9 cases)
- separate recovery (Krikke et al. [165], Bakkers and Ploos [14],Bentley et al. [22], Robison [215], Guide and Spencer [124]; Guide andSrivastava [125]- [126]-Guide and Srivastava [127], Thomas Jr, [249],Spengler et al. [234]).
- recovery combined with production (Gupta and Chakraborty [134],Teunter et al. [246]).
Quite a number of planning and control concepts for product recovery havebeen presented in academic literature. However, the supply of recoverables
3.8. Case studies on IT for Reverse Logistics 105
is often assumed to be autonomous, except for some literature on repair (foran overview see e.g. Guide and Srivastava, 1997b) and remanufacturing (seeGuide, 2000; Guide et al., 2001; Guide and van Wassenhove, 2001; Minnerand Kiesmuller, 2002). No direct relation between sold/leased and recoveredproducts is assumed. Besides this, uncertainty has been incorporated only asfar as the arrival of products for recovery and the duration of repair relatedactivities are concerned. Uncertainty with respect to the result of the pro-cessing activities has hardly been taken into account (for an exception, seeSouza et al, 2002)
Planning and control is all about deciding on how things are going to bedone and by whom. These are stressed aspects in the case studies. Naturally,the most relevant elements of the framework for this decision-area are likelyto be precisely the how and the who. This poses a research opportunity. Wecome back to it on Section 3.9.
3.8 Case studies on IT for Reverse Logistics
We have found six cases concentrating on various applications of IT for reverselogistics activities (see Table 3.9). IT is used to support reverse logisticsduring different stages of the life cycle of a product, namely manufacturing,distribution and customer (see Kokkinaki et al., 2004 and Hendrickson et al,2003).
3.8.1 The case studies
Manufacturing (2 cases)
Regarding the phase of product development and manufacturing there are twovariables to consider within the what dimension: material content and productstructure. The materials that are used and how they are combined determinethe degree and the type of a potential recovery once the product is at theend of its life. Marking parts with manufacture identification are also helpfulwhen a product has to be pulled out of the market due to defect, i.e. in caseof product recalls (see Smith, 1996). Many companies have already in placeproduct development programs encompassing design for the environment, forrecovery, for disassembly, and so on: generally called as Design for X, or justDfX. This is the case for Xerox Europe as reported by Maslennikova and Foley[183]. Xerox has an extensive Design-for-the-Environment program in place.The design of each new component has to be accompanied with instructionsfor the end-of-use.
106 Chapter 3. Reverse Logistics: a review of case studies
Recovery can also be the starting point for product development, as isthe case for Walden Paddlers, who launched a 100% recycled kayak project(Farrow et al. [95]). The project had to rely much on computer experimentsas no available design then suited recycled resins. The company was able toattract a manufacturer to invest in advanced rotational molding technologyand to convince the supplier to proceed to further resins’ separation.
Distribution (3 cases)
Landers et al. [169] highlight the importance of tracking component’s ordersin the case of a closed-loop business telephones supply chain. The authorsuse a concept called “virtual warehousing” where real-time information feedsexpeditious algorithms to support decisions. The use of IT leads to an im-provement in stock levels, routing and picking processes when compared withthe pre-IT scenario. Xerox (Maslennikova and Foley [183]) uses bar code labelsto track packaging material with the aim of achieving resources’ preservation.
Fraunhofer IML has developed software to embed data on recovery pro-cesses as reported in Nagel and Meyer [201]. The authors consider two chainsin Germany: the national refrigerator and the computer recycling networks.Costs could be minimized with the optimization of the location of facilities,vehicle routing and operations’ scheduling supported by the software. For thecase of the German computer-recycling network, transport volume (in tonsper km) could be reduced by almost 20%.
Customer (4 cases)
After the customer has accepted the product and starts using it, the productmay need maintenance. Xerox has a remote faulty detection system in placecalled the Sixth Sense (see Maslennikova and Foley [183]). In some situations,the problem is remotely identified and solved. Customers are assisted by amulti-functional database that permits them to get thorough acquaintancewith product characteristics.
In the case of Nortel Networks, a Decision Support System (DSS) wasdeveloped to assist remanufacturing (see Linton and Jonhson, [175]). Thetool permits to apprehend the interrelations between the production and theremanufacturing of products. By this means both processes can be betterplanned and controlled resulting in a more efficient allocation of resources.
Estee Lauder is another firm that has developed specialized software tohandle product returns (see Meyer [189]). The system checks the cosmeticitems for expiration date and damages. In this way recovery-related decisionsare accelerated. The software is linked to an automatic sorting system, whichsmoothes away labor costs. Estee Lauder could reclaim the investment on ITin one year’s time.
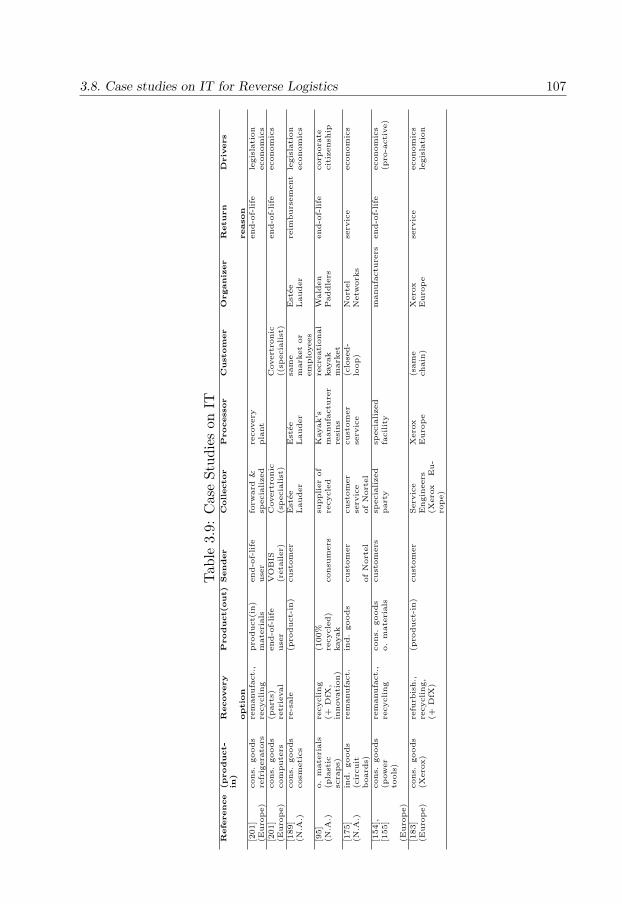
3.8. Case studies on IT for Reverse Logistics 107
Tab
le3.
9:C
ase
Stud
ies
onIT
Refe
rence
(product-
in)
Recovery
Product(out)
Sender
Collector
Processor
Custom
er
Organiz
er
Return
Driv
ers
optio
nreason
[201]
cons.
goods
rem
anufa
ct.
,pro
duct(
in)
end-o
f-life
forw
ard
&re
covery
end-o
f-life
legis
lati
on
(Euro
pe)
refr
igera
tors
recycling
mate
rials
use
rsp
ecia
lized
pla
nt
econom
ics
[201]
cons.
goods
(part
s)end-o
f-life
VO
BIS
Covert
ronic
Covert
ronic
end-o
f-life
econom
ics
(Euro
pe)
com
pute
rsre
trie
val
use
r(r
eta
iler)
(specia
list
)((
specia
list
)[1
89]
cons.
goods
re-s
ale
(pro
duct-
in)
cust
om
er
Est
ee
Est
ee
sam
eEst
ee
reim
burs
em
ent
legis
lati
on
(N.A
.)cosm
eti
cs
Lauder
Lauder
mark
et
or
Lauder
econom
ics
em
plo
yees
[95]
o.
mate
rials
recycling
(100%
supplier
of
Kayak’s
recre
ati
onal
Wald
en
end-o
f-life
corp
ora
te(N
.A.)
(pla
stic
(+D
fX,
recycle
d)
consu
mers
recycle
dm
anufa
ctu
rer
kayak
Paddle
rscit
izensh
ipsc
raps)
innovati
on)
kayak
resi
ns
mark
et
[175]
ind.
goods
rem
anufa
ct.
ind.
goods
cust
om
er
cust
om
er
cust
om
er
(clo
sed-
Nort
el
serv
ice
econom
ics
(N.A
.)(c
ircuit
serv
ice
serv
ice
loop)
Netw
ork
sboard
s)ofN
ort
el
ofN
ort
el
[154],
cons.
goods
rem
anufa
ct.
,cons.
goods
cust
om
ers
specia
lized
specia
lized
manufa
ctu
rers
end-o
f-life
econom
ics
[155]
(pow
er
tools
)re
cycling
o.
mate
rials
part
yfa
cility
(pro
-acti
ve)
(Euro
pe)
[183]
cons.
goods
refu
rbis
h.,
(pro
duct-
in)
cust
om
er
Serv
ice
Xero
x(s
am
eX
ero
xse
rvic
eeconom
ics
(Euro
pe)
(Xero
x)
recycling,
Engin
eers
Euro
pe
chain
)Euro
pe
legis
lati
on
(+D
fX)
(Xero
xEu-
rope)
108 Chapter 3. Reverse Logistics: a review of case studies
Nagel and Meyer [201] report real software development by the Germanrecycler Covertronic to read the configuration of a computer and to computecosts and revenues of subsequent recovery. Based on this, an appropriatebonus is offered to the final user when the computer is returned. Covertronicoperates this software in tandem with Vobis, a large computer retailer in Ger-many. Another technology available is the so-called Electronic Data Loggers(EDL, see also EUREKA, 2003). These devices are able to store data onphysical parameters, which can be retrieved later. The idea is to put theminto products or equipment (as is done for some coffee machines) and to reg-ister information about heat or other parameters as they are used. Thus, atthe point of recovery, one could make use of this information to decide whichdestiny to give to a certain product without first investing resources in disas-sembling and testing components. Klausner et al. [155] have investigated thebenefits of collecting information via this chip technology in electric motors.Likewise Simon et al. (2001) apply both steady state and transient models toevaluate the benefits of using a data logger in washing machines.
3.8.2 Preliminary Insights
Table 3.10 summarizes the IT tools to support reverse logistics activities de-scribed in the case studies presented above.
The case studies illustrate IT applications in all the phases of the lifecycle of a product and show improvements for reverse logistics. E.g., Xerox(Maslennikova and Foley [183]) has an integrated solution for reverse logisticsfrom product development to recovery or proper disposal. Furthermore, allthe case studies provide in one way or another an evaluation on the benefitsof IT. However, the investments on such technologies or on gathering infor-mation are not reported, except for the Estee Lauder case (Meyer [189]) andpartially for Walden Paddlers (Farrow and Jonhson [95]). The real benefitof IT investment is therefore difficult to assess as the case studies stress thebenefits while the investments and operational costs are left out. In face oflimited investment capacity, it would be helpful to know in which phase theinvestment would have most earnings. In addition, if alternative technologiesare available, one can investigate which one is the best. To do so, one hasto take into account costs and benefits of collecting and managing data andcosts of investing and managing the technology.
The following literature is an excellent starting point, as the potential ad-vantages or bottlenecks of some type of information are partially analyzed:Kelle and Silver (1989), Inderfurth and Jensen (1999), Klausner et al., (1998)Simon et al. (2001), De Brito and Van der Laan (2003), Ferrer and Ketzen-

3.8. Case studies on IT for Reverse Logistics 109
Table 3.10: Case studies: IT tools, requirements and benefits for reverselogistics
IT Tool Information’s Type of support Life cycle phaserequirements
EDL for electric mo-tors reuse
Info. on potentialcost savings)
Reuse decisionsthrough
Customer
[154], [155]
DSS for end-of-use Info. on operations’costs and recyclingrevenues
Cost optimization,facilities location,vehicle routing, etc.
Customer
[201] Distribution
Computer’s configu-ration reader
Info. on operations’costs &recycling rev-enues
“Setting buy-backprice”
Customer
[201] Distribution,
Software specializedon return handling
Product’s expirationdata, damage check
Recovery-related de-cisions
Customer
[189]
DSS for In-depth Remanufacturing Customerremanufacturing information on[175] processes -related decisions
DfX, remote main-tenance, etc.(X=Recyclability)[183]
Recovery options, en-vironment’s sustain-ability, and so forth.
Extensive data-baseon products
All phases
DfX(X=Recyclability)
Further separation ofresins;
Developing a 100%recycled
Manufacturing
[95] (& recyclable) Kayak
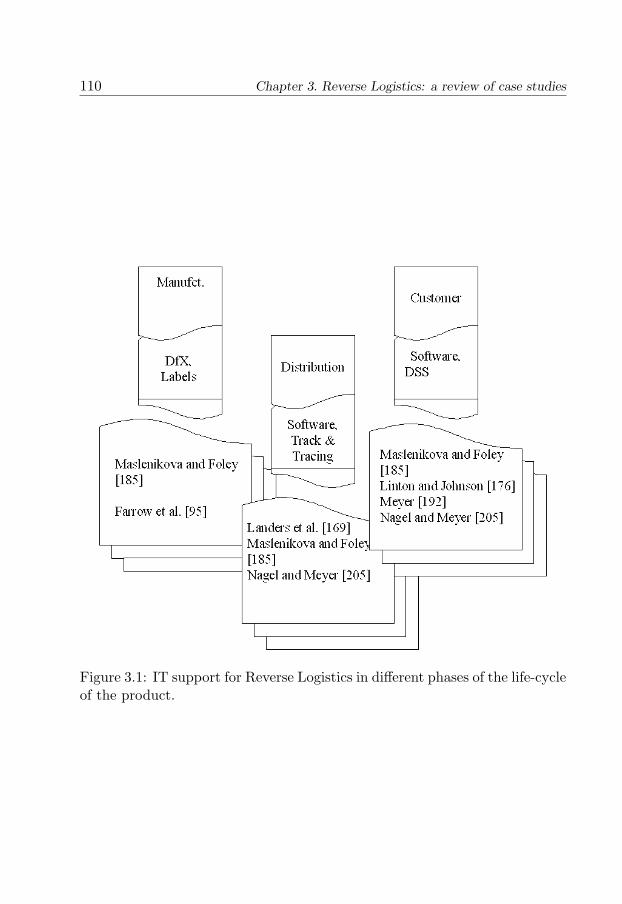
110 Chapter 3. Reverse Logistics: a review of case studies
Figure 3.1: IT support for Reverse Logistics in different phases of the life-cycleof the product.
3.9. Overall insights 111
berg(2003), Kiesmuller (2003), and [254]Toktay (2003).Besides investments, IT tools are very demanding regarding data on re-
verse logistic processes and associated costs and earnings. This data is how-ever often not available. Nagel and Meyer [201] declare that the lack ofinformation is a bottleneck, which complicates the management of recyclingsystems. Furthermore, on the Nortel Networks case the DSS could not be de-signed as desired due to a shortage of data on customer’s returns (see Lintonand Jonhson [175]). Besides this, to acquire and to manage the data is veryexpensive.
3.9 Overall insights
The framework presents a structuring and classification of reverse logistics. Inour opinion the typologies in the framework are not only useful for describingreverse logistics but also to establish relations between attributes of reverselogistics. Below we present some findings.
Table 3.11 presents the cases organized by return reason (Why-returning)and the recovery option (How). No cases of recalls were found. This isnot surprising, since these cases are not typically documented in OperationsManagement literature.
From the above table we make now some observations and remarks about thereturn reason and the recovery option.
- Among the return flows that may occur during manufacturing, there arethree cases of manufacturing leftovers, and two cases of manufacturingby-products. They are all associated with materials or chemicals andtherefore the corresponding recovery option is recycling.
- The B2C commercial returns are associated with re-sale and with directre-use. The latter is a form of internal returns, as the customers belongto the same organization as the supplier of the products.
- Functional returns, by definition, are re-distributed. This actually justi-fies the element ‘re-distribution’ in the recovery option typology (How)that we suggested in the framework of Chapter 2.
- Service returns are mainly associated with repair, and to a lower degreerefurbishing, and remanufacturing. Let us recall that service returnsoccur in the first place, because customers need it to be serviced. Thisusually means ‘restore it to working order’.
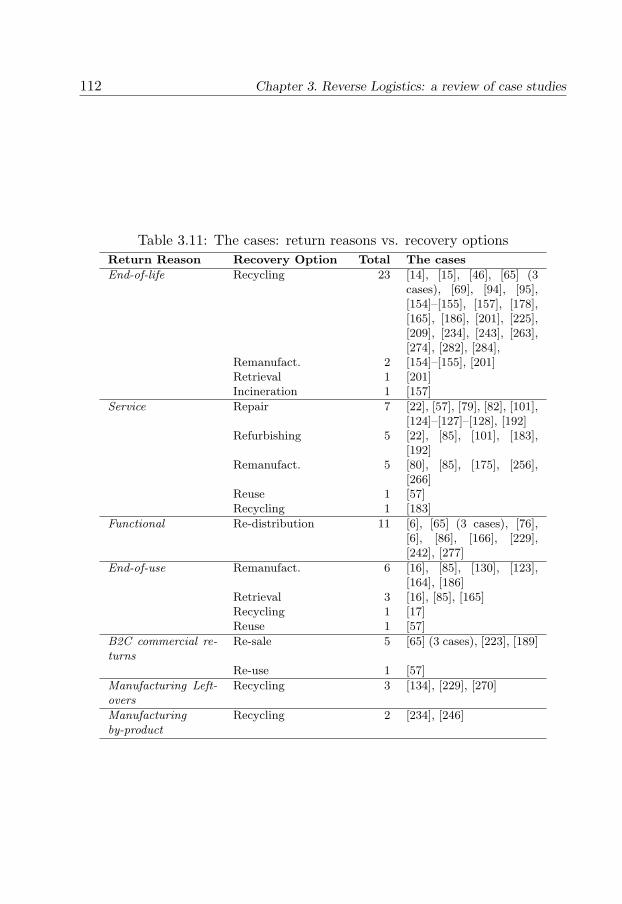
112 Chapter 3. Reverse Logistics: a review of case studies
Table 3.11: The cases: return reasons vs. recovery optionsReturn Reason Recovery Option Total The cases
End-of-life Recycling 23 [14], [15], [46], [65] (3cases), [69], [94], [95],[154]–[155], [157], [178],[165], [186], [201], [225],[209], [234], [243], [263],[274], [282], [284],
Remanufact. 2 [154]–[155], [201]Retrieval 1 [201]Incineration 1 [157]
Service Repair 7 [22], [57], [79], [82], [101],[124]–[127]–[128], [192]
Refurbishing 5 [22], [85], [101], [183],[192]
Remanufact. 5 [80], [85], [175], [256],[266]
Reuse 1 [57]Recycling 1 [183]
Functional Re-distribution 11 [6], [65] (3 cases), [76],[6], [86], [166], [229],[242], [277]
End-of-use Remanufact. 6 [16], [85], [130], [123],[164], [186]
Retrieval 3 [16], [85], [165]Recycling 1 [17]Reuse 1 [57]
B2C commercial re-turns
Re-sale 5 [65] (3 cases), [223], [189]
Re-use 1 [57]
Manufacturing Left-overs
Recycling 3 [134], [229], [270]
Manufacturingby-product
Recycling 2 [234], [246]
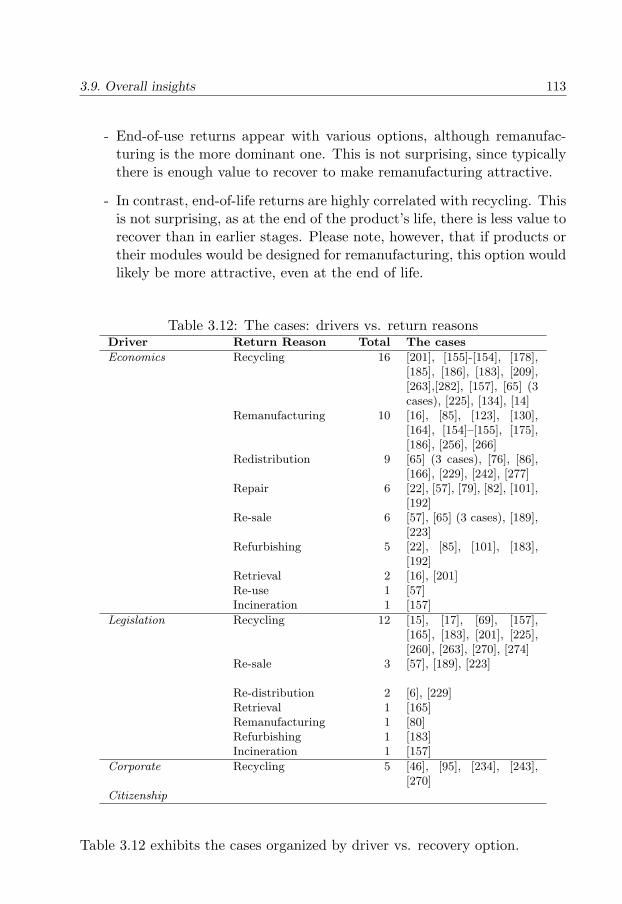
3.9. Overall insights 113
- End-of-use returns appear with various options, although remanufac-turing is the more dominant one. This is not surprising, since typicallythere is enough value to recover to make remanufacturing attractive.
- In contrast, end-of-life returns are highly correlated with recycling. Thisis not surprising, as at the end of the product’s life, there is less value torecover than in earlier stages. Please note, however, that if products ortheir modules would be designed for remanufacturing, this option wouldlikely be more attractive, even at the end of life.
Table 3.12: The cases: drivers vs. return reasonsDriver Return Reason Total The cases
Economics Recycling 16 [201], [155]-[154], [178],[185], [186], [183], [209],[263],[282], [157], [65] (3cases), [225], [134], [14]
Remanufacturing 10 [16], [85], [123], [130],[164], [154]–[155], [175],[186], [256], [266]
Redistribution 9 [65] (3 cases), [76], [86],[166], [229], [242], [277]
Repair 6 [22], [57], [79], [82], [101],[192]
Re-sale 6 [57], [65] (3 cases), [189],[223]
Refurbishing 5 [22], [85], [101], [183],[192]
Retrieval 2 [16], [201]Re-use 1 [57]Incineration 1 [157]
Legislation Recycling 12 [15], [17], [69], [157],[165], [183], [201], [225],[260], [263], [270], [274]
Re-sale 3 [57], [189], [223]
Re-distribution 2 [6], [229]Retrieval 1 [165]Remanufacturing 1 [80]Refurbishing 1 [183]Incineration 1 [157]
Corporate Recycling 5 [46], [95], [234], [243],[270]
Citizenship
Table 3.12 exhibits the cases organized by driver vs. recovery option.
114 Chapter 3. Reverse Logistics: a review of case studies
- Economics is associated with all recovery options, of which recyclingand remanufacturing are the most documented ones. This shows thatin principle all recovery options have the potential of being economicallyviable.
- Legislation appears to be mainly associated with recycling. Some ofthe cases are associated with re-sale. In those cases, legislation givescustomers the right to return purchased products. The above raisesthe question whether environmental legislation is not able to stimulateother forms of recovery. As we stated before, if design for recoverywould be more common, other recovery options than recycling wouldlikely be more attractive. Concluding, there is indeed an opportunityto stimulate other forms of recovery through legislation. For instance,legislation could also pro-actively focus on product design issues, ratherthan dealing with recovery in a reactive way.
- There are not so many cases where the driver is corporate citizenship,but all of them appear consistently associated with recycling. They canbe divided into community services and private initiatives.
For each of the decision-making areas, such as Networks, Relationships,etc., some of the dimensions of the framework (see Chapter 2) are predomi-nantly important. These were mentioned at the end of each section under thepreliminary insights. These dimensions are more or less consciously empha-sized in the case studies presented here. We believe that this is because thesedimensions predominantly affect the organization of reverse logistics withineach of the discussed areas. We summarize the predominant dimensions perdecision-making area in Table 3.13.
To further investigate these relations, we suggest a dedicated case studyanalysis. In such research, one may also consider to add typologies per dimen-sion or to go into more depth regarding sub-characteristics of the typologiesin the framework. Please recall that the framework was constructed to beparsimonious and to facilitate a holistic view of reverse logistics. The lastcolumn of Table 3.13 exhibits the kinds of elements that could be consid-ered in more detail, depending on the decision-making area. Furthermore, wealso put forward what kind of variables can be added in relation to a giventypology.

3.10. Summary and research opportunities 115
Table 3.13: The kind of elements to be considered in more detail
Decision making area Dominant dimensions Additional elements
Networks How & Who Value of the product;Relationships Who The type of relation be-
tween the parties; Degree ofcontrol in acquisition;
Inventory Management Why-returning & What Why-returning + used vs.not; What -characteristics(in detail);
Production planning How & Who How-processes (in detail);Degree of involvementof the sender (bring andpickup systems); combinedwith forward, vs. not;
3.10 Summary and research opportunities
We have found more than sixty cases involving reverse logistics. Roughly60% of the cases are in the manufacturing category, about 20% are withinwholesale and retail trade and about 10% in construction.
Almost half of the cases deal with metal products, machinery and equip-ment. Around 30% of the products being processed are materials like paperand plastic. Around 20% concern food, beverages, tobaccos, textiles or ap-parel. Less than 10% fell in the category ores and minerals. Not surprisingly,these numbers show that the majority of the cases are on products with highvalue.
With this review we
1. give a substantial overview of the diversity of real life reverse logisticssituations, and
2. provide a reference guide for researchers that look for case support.
We observed a lack of cases on reimbursement returns. However, thegrowth of the catalogue industry including e-catalogues is posing new chal-lenges. Ergo, field research in this area is likely to grow as well.
The analysis of the cases was based in the framework for reverse logisticsproposed in Chapter 2. Thus, for each case study we answered the followingquestions:
- what products/materials are being returned?
116 Chapter 3. Reverse Logistics: a review of case studies
- why are they returned?
- why is the company involved in recovery?
- how are the products being recovered?
- who are the parties involved?
This review was also a means to improve the quality of the framework (Chap-ter 2). Both projects were carried out simultaneously and in an interactiveway. This means that on the one hand, the case studies review is a meansto ground the framework on empirical evidence, and on the other hand, theframework is a means to further analyze the case studies. The analysis ofthe case studies allowed us to establish relations between attributes of reverselogistics. We come back to this later in this section.
We presented the case studies according to the following decision-makingfocus: Network Structures, Relationships, Inventory Management, and Plan-ning and Control. We remarked particular issues and latent questions, forwhich we proposed topics for future research. For each group, some of theaforementioned questions gain a dominant role, as summarized below. Fur-thermore, there was an overview of Information and Technology (IT) for re-verse logistics.
Reverse Logistics Networks
The section on Reverse Logistics Network Structures was organized aroundthe typologies on the how and the who (see Section 2). In more detail, wepresented cases for
• Networks for Re-distribution/Re-sale,
• Networks for Remanufacturing,
• Networks for Recycling - Public Networks,
• Networks for Recycling - Private Networks.
Here, most of the cases fell under ‘Re-distribution’ and ‘Recycling - PublicNetworks’. Only a few cases relate to private networks, but at this time wedo not know to which degree private networks for recycling are successful.
Reverse Logistics Relationships
The cases report quite different incentive tools to stimulate/enforce a certainbehavior of other players in the supply chain (see Section 3.5):
3.10. Summary and research opportunities 117
• Deposit fees
• Buy back options
• Trade-in
• Acquisition price
• Timely and clear information
• Power
• Environmental responsibility
• Social responsibility
Some incentives are also part of sales contracts, while others require the cus-tomer to buy another product in exchange. There are also tools that are notdirectly coupled to a selling activity like a gift to a non-profit organization.Furthermore, it seems that only deposit fees are specific for product recov-ery. The other mentioned tools are also used to attract or keep customers ingeneral.
Inventory Management for Reverse Logistics
We have grouped the presentation of the cases according to the why-returningtypology. The cases covered:
• Functional returns,
• Commercial returns,
• Service returns,
• End-of-use,
• End-of-life
We did not find cases for all the return reasons. Omissions can mainly beexplained, because some return reasons are treated in different contexts, likeproduction planning (see Section 3.6).
One of the complicating factors in Inventory Management is the uncer-tainty in the quality of reverse flows. Many have defended that product dataare essential for the efficient handling of returns. This offers various researchopportunities (see the next section).
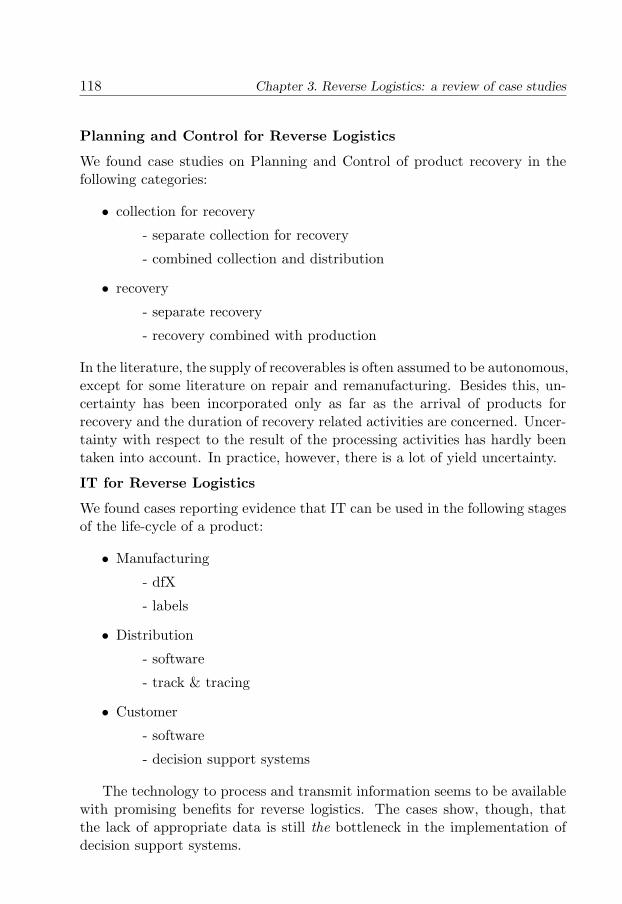
118 Chapter 3. Reverse Logistics: a review of case studies
Planning and Control for Reverse Logistics
We found case studies on Planning and Control of product recovery in thefollowing categories:
• collection for recovery
- separate collection for recovery
- combined collection and distribution
• recovery
- separate recovery
- recovery combined with production
In the literature, the supply of recoverables is often assumed to be autonomous,except for some literature on repair and remanufacturing. Besides this, un-certainty has been incorporated only as far as the arrival of products forrecovery and the duration of recovery related activities are concerned. Uncer-tainty with respect to the result of the processing activities has hardly beentaken into account. In practice, however, there is a lot of yield uncertainty.
IT for Reverse Logistics
We found cases reporting evidence that IT can be used in the following stagesof the life-cycle of a product:
• Manufacturing
- dfX
- labels
• Distribution
- software
- track & tracing
• Customer
- software
- decision support systems
The technology to process and transmit information seems to be availablewith promising benefits for reverse logistics. The cases show, though, thatthe lack of appropriate data is still the bottleneck in the implementation ofdecision support systems.
3.10. Summary and research opportunities 119
For each of the above decision-making areas, some of the dimensions of theframework (see Chapter 2) are predominantly important (see Sections 3.4–3.8). We summarize the predominant dimensions per decision-making area asfollows
• Networks ⇔ Recovery option (How) and Actor (Who)
• Relationships ⇔ Actor (Who)
• Inventory Management ⇔ Return reason (Why-returning) and Producttype (What)
• Production Planning ⇔ Recovery option (How) and Actor (Who)
In the next section we give directions to explore this further.
Besides the analysis per decision-making area, we also presented the casesorganized by return reason (why-returning) vs. recovery option (how), and thecases organized by driver vs. recovery option (see Section 3.9). This analysisrevealed some relations and issues. For instance, end-of-life returns appearto be highly correlated with recycling. If products or their modules wouldbe designed for remanufacturing, however, remanufacturing would likely bemore attractive, even at the end of life. The main driver for recycling islegislation. Actually, current legislation does not seem to be able to stimulateother forms of recovery. However, if legislation would also pro-actively focuson product design issues, rather than dealing with recovery in a reactive way,other recovery options than recycling would likely be more stimulated.
3.10.1 Research opportunities
If one wants to get more in-depth details, build-up theory, or explain phenom-ena, one has to go into more depth regarding some aspects of the framework.In Table 3.13 we put forward the kind of elements that can be consideredto further analyze the prominent dimensions of the framework per decisionmaking area. In order to do this, a dedicated case study analysis should beconducted. Next we continue with specific research opportunities regardingthe various decision making areas.
Reverse Logistics Networks
Commonly, the models to determine the location of reverse logistic facili-ties are based on deterministic integer programming models. However, it is
120 Chapter 3. Reverse Logistics: a review of case studies
commonly accepted that reverse logistics is characterized by much more un-certainty than in forward logistics. With this in mind, there is room for othertools like stochastic programming modelling for reverse logistics network de-sign.
Reverse Logistics Relationships
We pointed out the lack of literature supporting the choice of incentive. For-tunately, there is plenty of literature that can be used as a starting point.For instance, 1) literature on sales contracts with return options for unusedproducts, and 2) research on the optimal acquisition price to realize a certainflow of products.
Inventory Management for Reverse Logistics
Knowledge about returns is seen to be essential for efficient inventory man-agement of returns. With respect to modelling, it is critical to question thevalidity of the common assumptions in the literature (see Chapter 6). Fur-thermore, it is important to investigate the impact on inventory managementof having a priori information on product returns (see Chapter 7). Moreover,specialized forecasting techniques should be developed to deal with this issue.
Planning and Control for Reverse Logistics
In the literature, uncertainty with respect to recovery yield has hardly beentaken into account. In future research, yield uncertainty should be mod-elled explicitly. Furthermore, return handling operations have been so faroverlooked in the scientific literature (see Chapter 4). On this, Chapter 5provides insights regarding splitting vs. combining forward and reverse flowsduring transport, actual handling and the storage.
IT for Reverse Logistics
Almost all the cases that focus on IT report on the benefits only, while dis-regarding the required investment. It is important to broaden such partiallysighted reports.
In face of limited investment capacity, it would be helpful to know inwhich phase the investment would have most earnings. In addition, whenalternative technologies are available, one can investigate which one is best.To do so, one has to take into account the costs and benefits of collecting andmanaging data and the costs of investing and managing the technology.
The majority of the case studies deal with one aspect of a real reverselogistics situation but they do not give the overall business environment, whichmakes insights rather one-dimensional. Thus, there is a need for conducting

3.10. Summary and research opportunities 121
more integral case study research, by mapping the business context togetherwith more broad information on critical factors, trade-offs and implications.
Besides this, the lack of theory for reverse logistics (see Dowlatshahi, 2000)or even for supply chain management (Croom et al., 2000) adds to companies’inability of knowing what matters in reverse logistics. Therefore the devel-opment of theory should be on top of the research agenda to support reverselogistics decisions.

Chapter 4
Return Handling:decision-making andquantitative support
Consistently wise decisions can only be madeby those whose wisdom is constantly challenged.
Theodore C. Sorensen
4.1 Introduction
Return rates can be very high and very costly if not handled properly (seeMeyer, 1999 and Morphy, 2001). In spite of this, some managers have dis-regarded product returns or they handle returns extemporarily (see Meyer,1999). The fact that quantitative methods barely exist to support returnhandling decisions adds to this. In this chapter those issues are bridged, aswe
• put together a decision-framework for return handling, and
• identify models to support the decision-making process.
With respect to the second item, we often depart from existing quanti-tative models on general material handling. This is because of the lack ofquantitative methods dedicated to return handling.
123
124 Chapter 4. Return Handling: decision-making and quantitative support
The remainder of the chapter is organized as follows. First, Section 4.2gives a brief review of the return handling operations. Section 4.3 provides anillustrative example. Subsequently, in Section 4.4 we put forward a decision-making framework for return handling. After that, Section 4.5 identifies op-portunities to support warehousing decisions with quantitative models. Sec-tion 4.6 draws some overall conclusions.
This research was reported in De Brito and De Koster (2004).
4.2 Return Handling
Different actors in the supply chain face various return flow types (see theframework in Chapter 2). Independently of the return flow type, the followingwarehousing processes can be distinguished (see Figure 4.1):
• Receipt,
• Inspection, sorting & other handling,
• (Interim/Stock) Storage,
• Shipping.
Here we do not consider the last process in detail, since shipping is similarto forward flows. In general, operations can differ per return type (see Chapter2 for a description of return processes and operations). For instance productsthat come back in an as-good-as-new state can be restocked to be sold again(see De Brito and Dekker, 2003), while end-of-life products may only needinterim storage until they are sold to a recycling company.
Figure 4.1: Return handling in the warehouse.
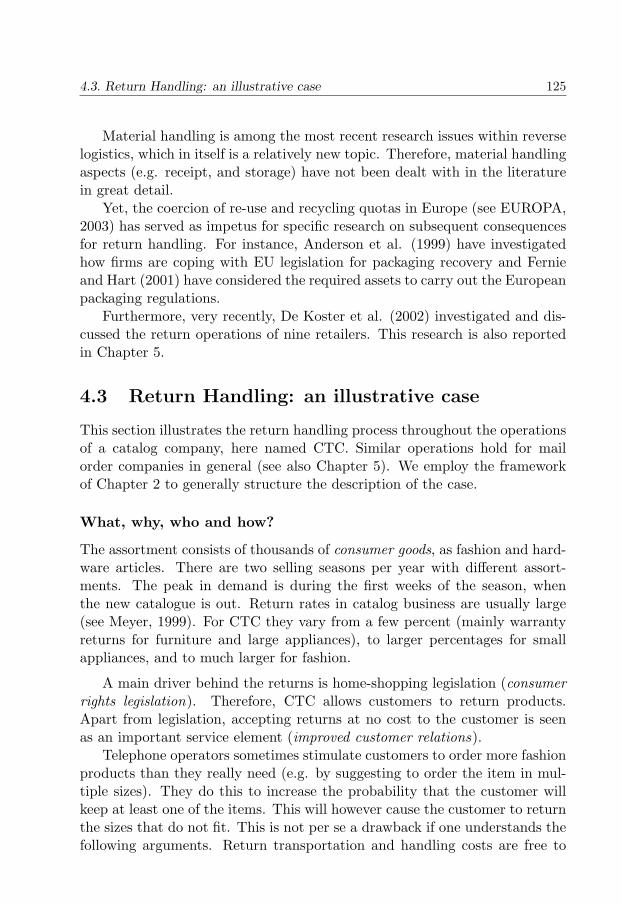
4.3. Return Handling: an illustrative case 125
Material handling is among the most recent research issues within reverselogistics, which in itself is a relatively new topic. Therefore, material handlingaspects (e.g. receipt, and storage) have not been dealt with in the literaturein great detail.
Yet, the coercion of re-use and recycling quotas in Europe (see EUROPA,2003) has served as impetus for specific research on subsequent consequencesfor return handling. For instance, Anderson et al. (1999) have investigatedhow firms are coping with EU legislation for packaging recovery and Fernieand Hart (2001) have considered the required assets to carry out the Europeanpackaging regulations.
Furthermore, very recently, De Koster et al. (2002) investigated and dis-cussed the return operations of nine retailers. This research is also reportedin Chapter 5.
4.3 Return Handling: an illustrative case
This section illustrates the return handling process throughout the operationsof a catalog company, here named CTC. Similar operations hold for mailorder companies in general (see also Chapter 5). We employ the frameworkof Chapter 2 to generally structure the description of the case.
What, why, who and how?
The assortment consists of thousands of consumer goods, as fashion and hard-ware articles. There are two selling seasons per year with different assort-ments. The peak in demand is during the first weeks of the season, whenthe new catalogue is out. Return rates in catalog business are usually large(see Meyer, 1999). For CTC they vary from a few percent (mainly warrantyreturns for furniture and large appliances), to larger percentages for smallappliances, and to much larger for fashion.
A main driver behind the returns is home-shopping legislation (consumerrights legislation). Therefore, CTC allows customers to return products.Apart from legislation, accepting returns at no cost to the customer is seenas an important service element (improved customer relations).
Telephone operators sometimes stimulate customers to order more fashionproducts than they really need (e.g. by suggesting to order the item in mul-tiple sizes). They do this to increase the probability that the customer willkeep at least one of the items. This will however cause the customer to returnthe sizes that do not fit. This is not per se a drawback if one understands thefollowing arguments. Return transportation and handling costs are free to
126 Chapter 4. Return Handling: decision-making and quantitative support
the customer. This also holds for the delivery cost, unless the customer buysat least one item. Thus, to suggest multiple sizes may still lead to lower costsfor CTC than when the customer places multiple orders of one unit each,keeping only one of them.
The home delivery of customer orders is outsourced to a Third PartyLogistics Provider (3PL) with a very dense network. When a customer wantsto return an item, CTC informs the 3PL, which schedules the pick-up in aroute carried out in the area of the customer (who-actors). If such a route isnot planned yet, the pick-up is delayed, or the customer can decide to bringit to a nearby post office and send it back herself. Pick-ups go back again viathe sorting centers with large trucks to CTC. The same trucks are used forpick-ups of the new orders at CTC’s warehouse.
The return handling operations of the warehouse of fashion and smallappliances is further described in more detail. The focus is on collection,inspection and recovery (storing for re-sale) (how-processes).
• Collection of returns at customers has been integrated with the distribu-tion of products to customers. The same third party logistics companycarries out both processes and the route planning is based on both typesof orders, although return collection has a slightly lower priority. Eventhe return drop-offs at CTC are integrated: the truck that brings re-turned items also collects new orders for distribution.
• Returned products are inspected and the receipt is confirmed in theinformation system, where it is decided whether the client should becredited or not (based on the condition of the product, payments made,and date of original purchase). The products are labelled, which permitsto trace the number of times each one of them were returned. Such alabel is however disguised so the customer cannot detect whether, or not,she is receiving a product that was once returned by another customer.
• Returned products with a ‘as-good-as-new’ status are re-sold. They arefirst consolidated with new products on a location in a forward pick area,whereas newly purchased items are stored in a reserved area. Other than‘as-good-as-new’ products are either returned to vendors or to brokers.
Considering additional decisions made by CTC to control the returns, herefollow some observations:
• The return handling process is completely separated from the regularreceipts of suppliers, with dedicated workstations and handling equip-
4.4. Return Handling: a framework of decisions 127
ment like conveyors. For administrative handling, a tailor-made soft-ware module is used.
• The forward storage differs from the regular receipts. For regular re-ceipts, one product carrier (usually a pallet) consists of one product.Returns on the other hand are regularly brought to the storage area inrolling bins.
• In the picking process, no explicit priority is given to returned items.
4.4 Return Handling: a framework of decisions
In the last section, the company CTC served to illustrate some of the re-turn handling related decisions. This section formally addresses the decision-making process according to:
• long-term decisions
• medium-term decisions
• short-term decisions
Table 4.1 provides an overview of the decision-making process. One shouldnote that the decision topics have many interdependencies. In practice, whendeliberating over a decision, the whole set of decisions should be kept in mind.
4.4.1 Long-term decisions
In supply chain management, the design of the supply chain is often con-sidered to be a strategic, or long-term, decision (see Ganeshan et al., 1999).Analogously we consider here that the design of the warehouse is a long-term decision for return handling. Intimately related to design decisions isthe outsourcing decision, which is therefore also considered to be a long-termone.
Facility Layout & Design
Facility layout and design is essentially a long-term decision regarding ware-housing. Companies have to ensure that sufficient storage and handling ca-pacity is going to be allowed for return handling and, additionally, how thespace in the facility is going to be organized. For instance, companies haveto decide if a facility dedicated to return handling is preferable, or, if returns
128 Chapter 4. Return Handling: decision-making and quantitative support
are going to be handled in a separate area of the warehouse facility. By in-tegrating return and forward handling, resources can be shared on the onehand, but on the other hand handling complexity increases.
In the illustrative example, returns were handled in the same facility, butin a separate area dedicated to returns. Actually, this is observed in retailersof other industries as well, as reported in the comparative study of Chapter 5.From the analysis there, a threshold on return volume is likely to determinewhether, or not, returns are allocated to a separate area: above the thresholdit is more efficient to handle returns in a dedicated area. In practice, one evenfinds companies with a separate facility dedicated to returns, such as Quellein Germany, Sears and Kmart in the US, which all have to deal with hugeamount of returns (Chain Store Age, 2002).
Fleischmann et al. (2004) further explains how the decision of openinga separate facility for return handling is affected by the amount and type ofreturns. An obvious trade off is between investments and capacity for returnhandling. In addition, the location of a return handling area within a facilityaffects the internal handling systems and therefore the related costs.
Concluding, return handling should be explicitly taken into account duringthe design of the warehouse.
Outsourcing
In the illustrative case, CTC keeps the warehousing operations in-house. Inthis case, outsourcing would be difficult since the activities take place withinthe warehouse and are closely related with order picking and storage activities.
A determinant factor is whether, or not, the return process can be clearlyseparated from the forward process. If so, return handling may be out-sourced. Examples include Albert Heijn (the return warehouse in Pijnacker,the Netherlands) and Sears and Kmart in the US, where the returns are han-dled by Genco (see De Koster and Neuteboom, 2001; Chain Store Age, 2002).
Other determinant factors are the value and type of product as well as theavailability of experienced third parties. At this moment such companies areemerging. Examples include Genco and Universal Solutions Incorporated (seee.g. Chain Store Age, 2002). The advantage of outsourcing is that one canfocus on its own competence and let other matters to proper professionals.On the other hand, when outsourcing, a company will always lose a certaindegree of control over the return handling operations.
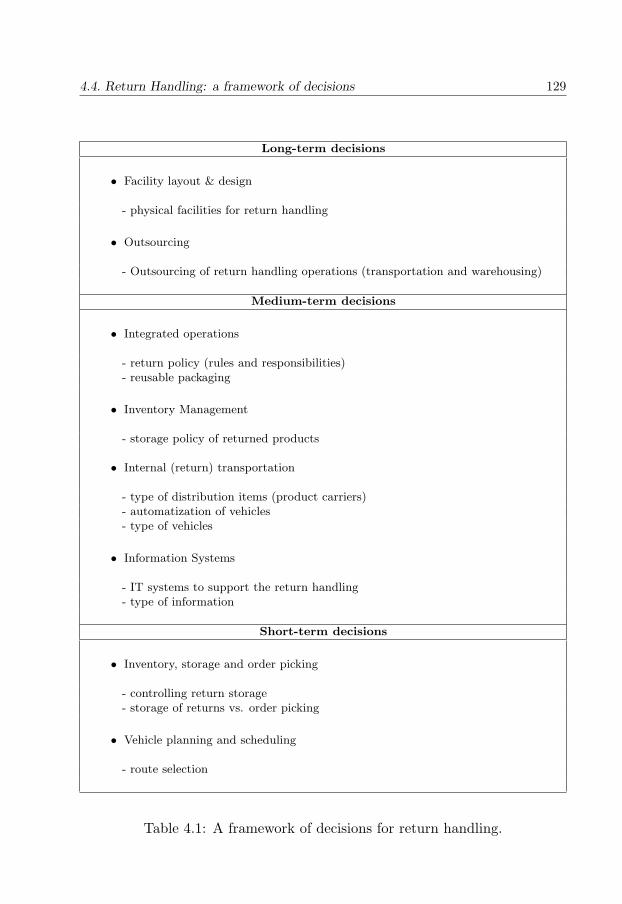
4.4. Return Handling: a framework of decisions 129
Long-term decisions
• Facility layout & design
- physical facilities for return handling
• Outsourcing
- Outsourcing of return handling operations (transportation and warehousing)
Medium-term decisions
• Integrated operations
- return policy (rules and responsibilities)- reusable packaging
• Inventory Management
- storage policy of returned products
• Internal (return) transportation
- type of distribution items (product carriers)- automatization of vehicles- type of vehicles
• Information Systems
- IT systems to support the return handling- type of information
Short-term decisions
• Inventory, storage and order picking
- controlling return storage- storage of returns vs. order picking
• Vehicle planning and scheduling
- route selection
Table 4.1: A framework of decisions for return handling.
130 Chapter 4. Return Handling: decision-making and quantitative support
4.4.2 Medium-term decisions
Often, medium-term decisions concern integrated operations, transportation,and information systems (see Ganeshan et al., 1999). In addition, we makea distinction between inventory management (medium-term) and inventorycontrol (short-term). The latter is considered in the next section.
Integrated Operations
Here we consider mainly two sets of decisions,with respect to i) return policy,and ii) reusable packaging.
Actors in the chain are assigned with responsibilities for returns. In thecase of chain stores, either a central facility (often the distribution center)collects and processes the products and materials that have been returnedfrom the stores, or the stores take care of it themselves.
According to IGD (2002), in the UK all major food retailers recycle pack-aging materials in a central facility: either a distribution center or a separaterecycling unit. Actors in the chain also have to establish whether differenttypes of returns incur different levels of accountability. For instance, the man-ufacturer takes the responsibility for all the processes related with end-of-lifereturns but no responsibility for reimbursement returns.
Another issue to decide upon is the rules for the return policy. For in-stance, stores have to know which products can or must be returned to thewarehouse, in which situations, or how to grant permission for this. In the il-lustrative example, the mail-order-company does not have much freedom withrespect to the return policy, as it is a legal requirement to allow for returns.
The urge to reduce packaging materials leads to the decision whether,or not, packaging materials are going to be replaced by reusable packages.Reusable packages will demand a higher initial investment, but have the in-herent benefit of the repetitive use. Many industries choose to reduce pack-aging waste by using standardized boxes (Schiffeleers, 2001), or by replacingpackaging materials by other materials involving less material handling.
Some retailers opt to start recycling their own packaging materials. AlbertHeijn, for example, recycles wrap foil into plastic bags, integrating the forwardand reverse flows for a practical purpose. Yet, this demands changes in itsoperations as follows. Stores have to separate the wrap foil, to put it in rollcages, and store it until collection. After recycling by a third party, bags arere-sent to the warehouse to be integrated with the distribution.
4.4. Return Handling: a framework of decisions 131
Inventory Management
Returned products may have a quality status that differs from new ones.Depending on the status and the timing, they may be, or not, sold in thesame market. Both newly supplied and as-good-as-new returned merchandizeare going to be stored for future sales as long as the season runs and takinginto account the shelf life of the product. The two streams can be storedseparately or the merchandize can be consolidated in the same location.
In the case of CTC, returned items are stored together with new mer-chandize. In the comparative analysis of Chapter 5, other retailers than mail-order-companies have mixed and hybrid storage policies. For instance, oneretailer would first store returns at a separate location and consolidate themonly when the location’s capacity would be exceeded. The analysis led to theconclusion that separate storage policies are mainly found among retailersthat wish for a high degree of control over returns. Returns can be consoli-dated if the future market is the same as for newly supplied merchandize. The‘future market’ is also a critical factor for other returns than the ‘as-good-as-new’ ones. Unsold products are usually consolidated in interim storagelocations per vendor or potential ‘customer’. A well-known example is unsoldbooks that go back to their respective publishers. End-of-life returns are alsousually separated and held together by potential brokers.
Internal (return) transport
An important issue in internal transport is the choice of reusable transportcarriers. Choosing the type depends on the willingness of the parties in thechain to adopt one of the available standards. This is usually a complex pro-cess, where power and trust play a major role. Once a standard is in place,the decision that is left to take is the amount needed. Product carriers requirecollection, transportation back to the warehouse, checking, storage, and possi-bly cleaning before being used again. In order to limit the amount of productcarriers needed, they should rotate rapidly. Since the timing and quality ofsuch returns are difficult to anticipate, many companies have searched forways to reduce such uncertainty.
Carriers can also leak from the system. A way to monitor this is toinvest on tracking and tracing systems. Chapter 3 reviews incentive toolsto persuade parties behaving in a desired way. A common incentive is tocharge a deposit fee between the different parties in the chain, especially ifthe material has some intrinsic value. Each receiver must pay this fee to itssupplier or a central party (see Lustrenbach, 1993 for a review of systemsfor returnable carriers). Often, when multiple companies participate in such
132 Chapter 4. Return Handling: decision-making and quantitative support
networks, there is a central organization that tracks the ownership of carriersand registers financial transactions. The deposit fee not only prevents itemsfrom being lost but it also provides a natural mechanism to motivate carefulhandling and therefore a minimum quality is ensured per returned item, astransactions have to be tracked.
Several international pools for pallets exist in Europe, like Deutsche Bahn(DB) and Chep. Many manufacturers supply their products on such pallets.In the case that the reusable packaging can be shared between different users,the benefits can sometimes be huge, since large savings can be achieved in thenumbers needed (Koehorst et al., 1999). For this reason, in the Netherlandsand in the UK food retailers have switched to reusable container systems(IGD, 2002). In food retailing, reusable crates are mostly used for productcategories such as produce and chilled, where warehouse stocks are small andsales volumes are high. This means the crates are used intensively, reducingthe cost per trip. However, wholesalers and retailers with many suppliersand different pallet types have considerable work in handling, sorting andstoring pallets returned from their customers (retail organizations or stores).In the case of large return volumes, mechanization or automation may becomeeconomically attractive. Choices to be made are the degree of mechanizationand the appropriate equipment for internal transport and storage.
Information Systems
One has to determine which information system is going to be used to registerproduct returns. Kokinakki et al. (2004) examine the overall needs and ex-isting supporting technology for managing information in the reverse logisticscontext.
Commercial software particularly designed for supporting return handlingis lacking (Caldwell, 1999). The commonly used ERP packages generallylack the ability to properly deal with returns (De Kool, 2002). At this stagedecision-makers may consider the in-house development of dedicated software.This has been the case at CTC and Estee Lauder (see Meyer, 1999). In thelatter case, the specialized software system checks returns for expiration dateand damages, speeding up return handling. Besides this, the software is linkedto an automatic sorting system, which has lowered labor costs.
In general, the type and the horizon of information to be registered hasto be determined, as well as how decisions with respect to returns can besupported. Also attention can be given to potential abusive returns (seeSchmidt et al, 1999) and how this affects warehousing operations.
In the case of CTC, though law enforces accepting returns, returned mer-
4.5. Models and research opportunities 133
chandize is first checked and only then it is decided whether or not the clientshould be credited for it.
4.4.3 Short-term decisions
Inventory, storage, order picking, and vehicle planning and schedul-ing
When storing returns, this has to be planned in coordination with forwardoperations such as order picking and internal transport. In the case of CTC,it is crucial to put returns back in inventory timely to prevent stock-outs.Another aspect is the organization of the picking process. In the case of CTCno explicit priority is given to returned items over regular stock. There are,however, cases where priority to returns might be given (see Chapter 5).
The former discussion put together a decision framework of long-, medium-,and short-term warehousing decisions with respect to return handling.
Long-term decisions embrace facility design and outsourcing. At a moretactical level, one finds the topics of integrated operations, inventory manage-ment, internal (return) transport, and information systems. Within a shorterhorizon, one has also the control of inventory and order picking, and theplanning and scheduling of vehicles for internal transport.
The discussion tackled one topic at a time, but the complete frameworkhas to be taken into account at any decision instant. Subsequent decisions arecircumscribed by previous decision-making. E.g., the layout of a warehouserestricts the possibilities regarding order picking and storing. Or, if part ofthe warehouse is likely to be outsourced, the facility design should take thisinto account.
The remainder of this chapter brings into focus the available and potentialmodels to support the decision-making process. To do so, we use the decision-framework to go over the existing models, and to identify opportunities forextensions. The decision-framework is also used in Chapter 5 to structuregeneral recommendations to practitioners (see Section 5.6.1).
4.5 Models and research opportunities
Quantitative models on return handling are practically non-existent. Thissection puts forward the state-of-the-art on quantitative support for materialhandling expounding opportunities for return handling models. An earlyoverview of the use of OR tools in material handling can be found in Matsonand White (1982).
134 Chapter 4. Return Handling: decision-making and quantitative support
The list of the main research areas in warehousing with respect to returnhandling can be drawn from the previous section (see also Van den Berg andZijm, 1999). For information systems for return handling, see Kokkinaki etal., 2004. Models for the remainder of the topics are now discussed. For amore detailed discussion, see De Brito and De Koster (2004).
4.5.1 Long-term decisions
Facility layout and design
A successful research area is facility layout. A well-known approach is Muther’s(1973) Systematic Layout Planning concept, for which many improvementalgorithms are known (see Tompkins et al., 1996; Bozer et al, 1994; andGoetschalckx, 1992). The major objective in the underlying models is tominimize the total cost of daily transport between the different areas in thefacility. For some facility types special layout models have been developedwith the reduction of travel time as primary objective (Bartholdi and Gue,2000; and Roodbergen, 2001).
An important shortcoming in the models is that many other relevant re-strictions and objectives are not taken into account, such as congestion re-duction. The models and solution methods can be applied straightforwardlyto facilities with return flows and handling areas. The existence of dedicatedareas to returns do not have to change the models fundamentally. However,it is important to incorporate returns operations from the start in layoutdecisions, since the solutions may change dramatically when compared to asituation without returns (think of crossing flows, or travel distances). Itwould be interesting to study the impact that taking into account returns hason layout. This is a topic that has not received attention from researchers sofar.
Outsourcing
Literature on process outsourcing is mostly of a qualitative or quantitative em-pirical nature. Although much literature deals with outsourcing of warehous-ing and transport to logistics service providers (see for example Rabinovichet al., 1999; Van Laarhoven et al., 2000), academics have not thoroughlyaddressed the outsourcing decision of return handling so far. Among the ex-ceptions are the works by Krumwiede and Sheu (2002) and Meade and Sarkis(2002). In the first, a model is presented to aid third-party logistics providersto decide whether, or not, to enter the reverse logistics market. Meade andSarkis (2002) address the selection of third-party logistics providers. The au-
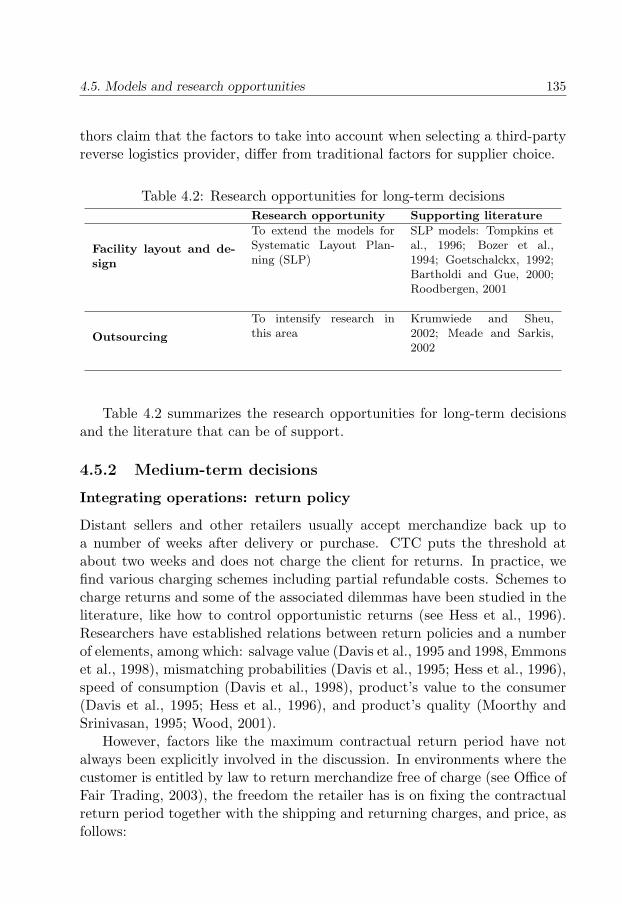
4.5. Models and research opportunities 135
thors claim that the factors to take into account when selecting a third-partyreverse logistics provider, differ from traditional factors for supplier choice.
Table 4.2: Research opportunities for long-term decisionsResearch opportunity Supporting literature
Facility layout and de-sign
To extend the models forSystematic Layout Plan-ning (SLP)
SLP models: Tompkins etal., 1996; Bozer et al.,1994; Goetschalckx, 1992;Bartholdi and Gue, 2000;Roodbergen, 2001
Outsourcing
To intensify research inthis area
Krumwiede and Sheu,2002; Meade and Sarkis,2002
Table 4.2 summarizes the research opportunities for long-term decisionsand the literature that can be of support.
4.5.2 Medium-term decisions
Integrating operations: return policy
Distant sellers and other retailers usually accept merchandize back up toa number of weeks after delivery or purchase. CTC puts the threshold atabout two weeks and does not charge the client for returns. In practice, wefind various charging schemes including partial refundable costs. Schemes tocharge returns and some of the associated dilemmas have been studied in theliterature, like how to control opportunistic returns (see Hess et al., 1996).Researchers have established relations between return policies and a numberof elements, among which: salvage value (Davis et al., 1995 and 1998, Emmonset al., 1998), mismatching probabilities (Davis et al., 1995; Hess et al., 1996),speed of consumption (Davis et al., 1998), product’s value to the consumer(Davis et al., 1995; Hess et al., 1996), and product’s quality (Moorthy andSrinivasan, 1995; Wood, 2001).
However, factors like the maximum contractual return period have notalways been explicitly involved in the discussion. In environments where thecustomer is entitled by law to return merchandize free of charge (see Office ofFair Trading, 2003), the freedom the retailer has is on fixing the contractualreturn period together with the shipping and returning charges, and price, asfollows:
136 Chapter 4. Return Handling: decision-making and quantitative support
• t, maximum contractual return period,
• p, price of the product,
• csc, shipping charges, and
• crc, returning charges.
The utility function of the retailer, here named Ur, is a function of addi-tional factors, like:
• ch, handling/warehousing costs,
• crh, return handling costs,
• x, quantity shipped, and
• y, quantity returned,
For the retailer, the decision variables are t, csc, crc and p, while ch, crh areinput variables, and x and y are output variables.
The utility functions of customers i= 1,..., m, here identified as ui willdepend of factors, such as:
• p, price of the product,
• t, maximum contractual return period,
• q, quality of the product,
• csc, shipping charges,
• crc, returning charges.
Naturally, customers will mostly prefer low prices, a long return period,high quality products, and low shipping charges. Based on these factors, eachcustomer i decides on
• xi, the quantity ordered by client i, and
• yi, the quantity returned by client i.
4.5. Models and research opportunities 137
All the actors involved intend to maximize their utility function. Theretailer is the leader as he/she sets a priori some of the parameters, such as t,p, csc and crc. In turn, customers will react to the values of these parametersand maximize their utilities.
The problem can be written in the following general form:
maxp,t,csc,crc Ur(p, t, csc, crc; y, x, ch, crh)
s.t.y = summ
i=1argmax ui(yi; p, t, xi, q, csc, crc)x = summ
i=1argmax ui(xi; p, t, yi, q, csc, crc)xi ≤ yi
Summing up, for a given strategy that the retailer may choose, customerswill have a ‘best’ strategy to follow. The retailer has to anticipate thesereactions while setting the decision variables.
The aforementioned model gives a holistic approach to return policies bygiving plenty of room to incorporate multiple critical factors. The format ofthe problem resembles a Mathematical Programming problem with Equilib-rium Constraints (MPEC), see Luo et al., 1996.
The MPEC is closely linked to the Stackelberg game-theoretical models(see e.g. Debo et al., 2004 on coordination of closed-loop supply chains).Solving the MPEC, demands first proper estimation of the utility functionsand inherent relations between individual factors. The following literatureon return policies can assist on this. The model by Hess et al. (1996) com-prises price, the value that the product has to the consumer, and the ship-ping costs. The authors infer from the results that the seller has an incen-tive to set a non-refundable charge to avoid opportunistic behavior and thathigher prices will have higher non-refundable charges. Moorthy and Srini-vasan (1995) investigate the role of return policies in signaling quality (e.g.customers may associate a priori high quality products with tolerant productpolicies). The authors consider the following variables: price, matching prob-ability (between customer’s wishes and product), depending on quality andvarious costs both for the retailer and for the costumer. Somewhat opposedto Hess et al. (1996)’s point of view, Moorthy and Srinivasan (1995) suggestthat high quality sellers (in principle associated with high prices) should con-sider taking up buyer’s transaction costs. This puts into evidence the needfor more research in this area. Davis et al. (1998) have specifically computedthe optimal level of ‘hassle’ for return policies. They included factors such asthe trial value of the product. They concluded that a retailer tends to offera low-hassle return policy when the product cannot be consumed during thetrial period, when there are opportunities of cross-selling, and the returned
138 Chapter 4. Return Handling: decision-making and quantitative support
merchandize has high salvage value. Though in these references, the maxi-mum contractual return period has not been included as a decision variable,the references are still helpful to draw relations between other variables.
Furthermore experiences similarly to the ones described by Wood (2001)can be conducted to tune the parameters’ relations. Wood (2001) carriedout experiences with undergraduate students for two types of return policies:lenient vs. restricted. The author examined the deliberation time for thedecisions of 1) order, and 2) keep-or-return. The author further examinesthe consumer’s evaluation of quality and the likelihood of continued searchwhile waiting for the product. The study shows that continued search is moreprobable in the case of restricted policies rather than lenient policies. Onecan judge this to be contradictory. Yet, the author explains it by defendingthat product ownership is more a perception than the factual possession.
Concluding, the point is that setting a return policy is a complex matterbecause of the many hidden elements that can influence profitability. Quan-titative support on the topic is more than welcome.
Integrated operations: reusable packaging
In order to determine economic benefits, the needed number of reusable pack-ages and the distribution over the network has to be determined. Kroon andVrijens (1995) and Duhaime et al. (2000) use respectively a location-allocationand a minimum-cost-flow model to minimize the empty reusable packaging.To determine the environmental impact of reusable crates, Life Cycle Analy-sis (LCA) can be used (see Pappis et al., 2004 and Bloemhof-Ruwaard et al.,2004). For every process (production, handling, transport) or material usagethe impact on the environment (for example global warming or acidification)can be established by calculating the emissions of different components. It isstill necessary to choose one of the existing methods to calculate these emis-sions. A priori there is no “best method” as its appropriateness depends onthe production cycle, the transport technologies, the country, and so on.
Inventory Management
If return rates are high, such as in distant selling businesses, it becomes nec-essary to manage return stocks explicitly. One can also look at this from acompletely different perspective: remote sellers are overselling to customersthat return merchandize (and possibly underselling to customers that do notreturn merchandize).
One can think about making two categories of customers: the ones that(systematically) return merchandize vs. the ones that do not. Or better, to
4.5. Models and research opportunities 139
discriminate between less and more profitable customers taking into accountpurchased and returned merchandize.
The above is an obvious simplification of reality since many other cat-egories can be distinguished. For instance, catalog companies carry largeamounts of historical customer data that can be employed to draw the profileof each customer class.
Existing inventory models with priority customers can be stretched tothis new application (see Kleijn and Dekker, 1999). Research has showedthat ‘... in some cases it is optimal to ... reserve inventory for possible ordersfrom higher-margin customers’ (Cattani and Souza, 2003). In other words, itmay be optimal to reserve inventory for customers that do not systematicallyreturn merchandize. This nurtures confidence in the opportunities that thissort of models can offer to retailers like catalog companies. Return-handlingcosts can be explicitly utilized to draw the line between the two classes. In thisway, return-handling costs are plugged in explicitly, bringing more realism toinventory management with product returns.
There are many other issues on inventory management with product re-turns for instance in remanufacturing settings. Recent reviews can be foundin Dekker et al. (2004).
Internal (return) transportation
Operations Research models (stochastic models, mixed-integer linear pro-gramming models or simulation) can be applied successfully in the evaluationof material handling systems, in particular estimating the number and typeof vehicles needed. By comparing multiple scenarios, with multiple types ofmaterial handling systems, an evaluation of the best system can be made.The underlying models try to determine the number of vehicles of a certaintype in a certain facility. Examples are the evaluation of single-load versusmultiple load vehicles (Van der Meer, 2000), or lifting versus non-lifting ve-hicles (Vis, 2002). Other, related, design areas are vehicle transport trackdesign, choice of pick-up and delivery points, design of deadlock-free tracks,track claim design, or design of battery loading areas. The paper by Goetzand Egbelu (1990) is an example. Material handling systems used for bothforward and return flows may have to meet different requirements. Dependingon the return volume, separate systems may be needed, that are better fit forreturn handling.
Information systems
On this we refer to Kokkinaki et al. (2004).
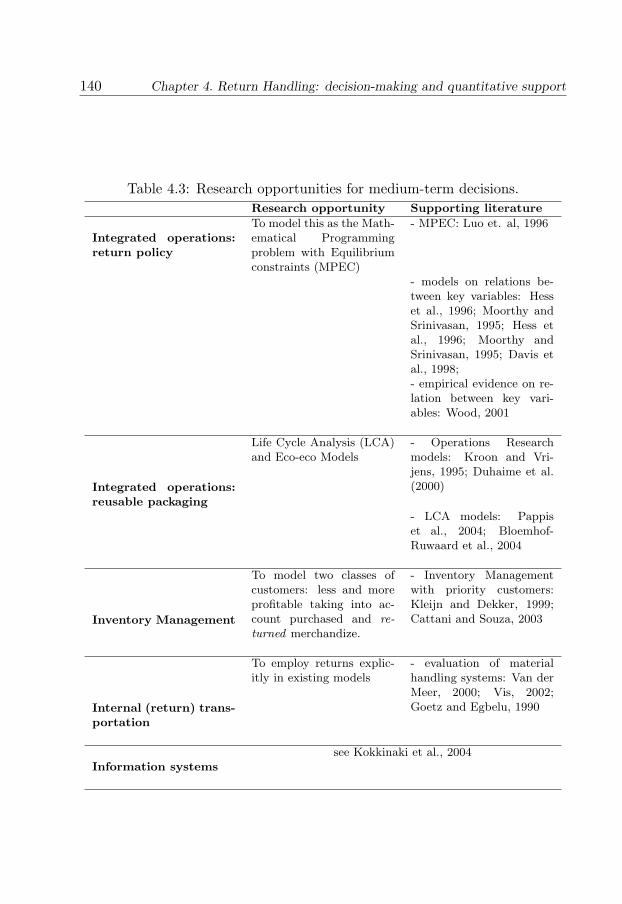
140 Chapter 4. Return Handling: decision-making and quantitative support
Table 4.3: Research opportunities for medium-term decisions.Research opportunity Supporting literature
Integrated operations:return policy
To model this as the Math-ematical Programmingproblem with Equilibriumconstraints (MPEC)
- MPEC: Luo et. al, 1996
- models on relations be-tween key variables: Hesset al., 1996; Moorthy andSrinivasan, 1995; Hess etal., 1996; Moorthy andSrinivasan, 1995; Davis etal., 1998;- empirical evidence on re-lation between key vari-ables: Wood, 2001
Integrated operations:reusable packaging
Life Cycle Analysis (LCA)and Eco-eco Models
- Operations Researchmodels: Kroon and Vri-jens, 1995; Duhaime et al.(2000)
- LCA models: Pappiset al., 2004; Bloemhof-Ruwaard et al., 2004
Inventory Management
To model two classes ofcustomers: less and moreprofitable taking into ac-count purchased and re-turned merchandize.
- Inventory Managementwith priority customers:Kleijn and Dekker, 1999;Cattani and Souza, 2003
Internal (return) trans-portation
To employ returns explic-itly in existing models
- evaluation of materialhandling systems: Van derMeer, 2000; Vis, 2002;Goetz and Egbelu, 1990
Information systemssee Kokkinaki et al., 2004
4.5. Models and research opportunities 141
Table 4.3 summarizes the research opportunities and the literature thatcan be supportive for medium-term decisions.
4.5.3 Short-term decisions
Inventory, storage and order picking models
This topic includes particular problems within warehouses, such as orderbatching, order picking, routing pickers in a warehouse, warehouse zoning(dividing a picking area in zones to achieve certain objectives), product stor-age allocation, forward versus reserve storage area decisions.
Many papers deal with warehouse planning and control. There are sev-eral overview papers in this area; recent ones are by Van den Berg (1999),Rouwenhorst et al. (2000) and Wascher (2002). The following topics havebeen addressed in Operations Research literature: product to storage alloca-tion, Heskett (1963); order batching, wave picking, De Koster et al. (1999);routing order pickers in a warehouse, Roodbergen (2001); warehouse zoning,worker balancing, De Koster (1994); Bartholdi and Eisenstein (1996); andBartholdi et al. (1999); forward - reserve problem, Hackman and Platzman(1990); pallet or container loading, Coffman et al. (2000).
All these topics are strongly interdependent in their impact on warehouseperformance (e.g. order through time). There is some literature on combi-nations of these above-mentioned problems (see Gademann et al., 2001; andRoodbergen, 2001). Recently, storage and routing received some more atten-tion (see, for example, Dekker et al. 2002).
Currently, no models exist that explicitly include return flows. Here is alist of relevant issues that should have priority:
• Whether or not to set-up separate storage areas for returns, or to con-solidate them with existing stock. Return volume seems to be a decisivefactor, as it is concluded in Chapter 5: above a threshold, returns aregoing to be dealt with in a separate area. Quantitative models can bringinsight on what is missing: for instance to identify where the thresholdis. The trade-off is in the size of the storage area and order pick traveltime, but also in the cost of a warehouse of increased size. Storing re-turns on separate locations may save time in storage, but potentiallyrequires more space, which in turn increases pick times.
• How long to buffer product returns before consolidating them on stock?Important factors that play a role in such decision are the quantity,variety and timing of the returned items. The larger the stored batch
142 Chapter 4. Return Handling: decision-making and quantitative support
size is, the more efficient the storage process becomes, while on theother hand the buffer space may become overcrowded and the stock isnot available in time.
• Storing returns versus order picking: how to sequence and route both re-turn storage with order picking? In many occasions, return job schedul-ing issues play a role, since picks can only be carried out when the(returned) products are at their location (this is the case at CTC, seesection 4.3). On the other hand picks are much more urgent, becauseof due times for shipment. This problem has received no attention fromresearchers so far.
Vehicle planning and scheduling
A large part of the literature on material handling equipment covers plan-ning and control issues of unit-load automated storage and retrieval systems,i.e. AS/RS (see Bozer and White, 1984; Bozer and White, 1984, 1990; andHausman et al., 1976).
Another large group of papers is on planning and control of automatedguided vehicle (AGV) systems. These internal transport systems are suited towork in highly dynamic, where the horizon over which information is availableof loads that need transportation is usually short. On a slightly longer horizon,information may be known in advance, but is uncertain. Load arrivals arestochastic and also transportation times are stochastic, due to congestion andintersection control policies.
The following activities have to be carried out by a controller of the sys-tem: dispatching of vehicles to pick up certain loads, selecting the route,scheduling the vehicle, and dispatching vehicles to parking positions. Whenreturns are involved, the planning and scheduling of such material handlingequipment will change. Returns can be modelled as another type of (storageor transport) job that has to be carried out. However, particular-sequencingrestrictions will apply. For example storage jobs resulting from returns mustbe carried out prior to retrieval jobs. Or, for unit load handling machines, itmust be attempted to combine jobs in a double play to increase machine uti-lization. Vis (2002) has developed a new control concept to schedule storageand retrieval for a unite load AS/RS working in multiple aisles. Unit loads arefor instance pallets. However, this does not apply necessarily to the situationof returns as products are mostly returned item by item (or at least in smallquantities). Products in small quantities are normally stored or retrieved bya worker travelling with proper equipment. As Vis (2002) describes, in thiscase retrieval and storage requests are not combined.
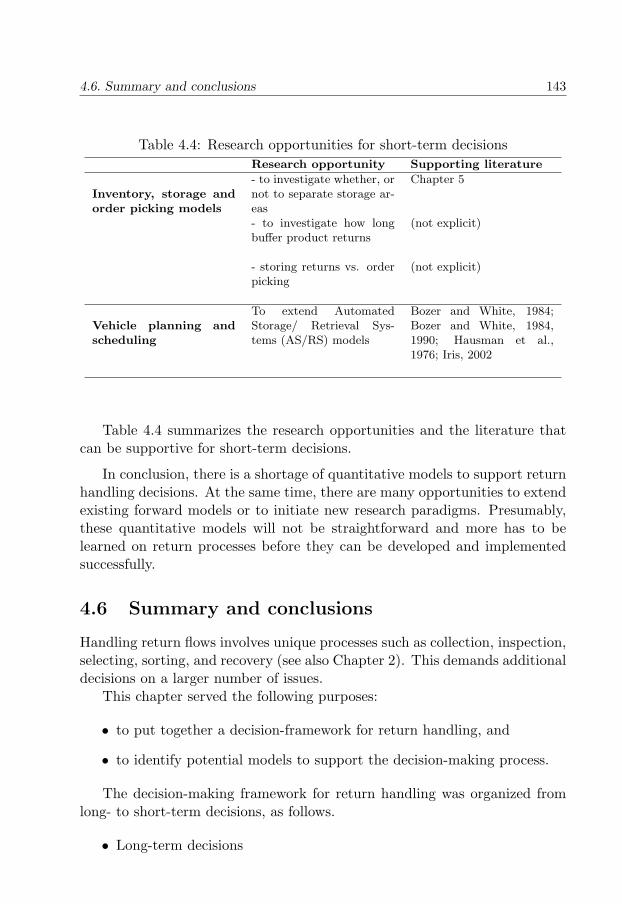
4.6. Summary and conclusions 143
Table 4.4: Research opportunities for short-term decisionsResearch opportunity Supporting literature
Inventory, storage andorder picking models
- to investigate whether, ornot to separate storage ar-eas
Chapter 5
- to investigate how longbuffer product returns
(not explicit)
- storing returns vs. orderpicking
(not explicit)
Vehicle planning andscheduling
To extend AutomatedStorage/ Retrieval Sys-tems (AS/RS) models
Bozer and White, 1984;Bozer and White, 1984,1990; Hausman et al.,1976; Iris, 2002
Table 4.4 summarizes the research opportunities and the literature thatcan be supportive for short-term decisions.
In conclusion, there is a shortage of quantitative models to support returnhandling decisions. At the same time, there are many opportunities to extendexisting forward models or to initiate new research paradigms. Presumably,these quantitative models will not be straightforward and more has to belearned on return processes before they can be developed and implementedsuccessfully.
4.6 Summary and conclusions
Handling return flows involves unique processes such as collection, inspection,selecting, sorting, and recovery (see also Chapter 2). This demands additionaldecisions on a larger number of issues.
This chapter served the following purposes:
• to put together a decision-framework for return handling, and
• to identify potential models to support the decision-making process.
The decision-making framework for return handling was organized fromlong- to short-term decisions, as follows.
• Long-term decisions
144 Chapter 4. Return Handling: decision-making and quantitative support
- facility layout & design
- outsourcing
• Medium-term decisions
- integrating operations (return policy and reusable packaging)
- inventory management
- internal (return) transport
- information systems
• Short-term decisions
- inventory, storage and order picking control
- vehicle planning and scheduling
Note that the decisions cannot be taken in isolation, because the manyinterdependencies.
Explicit models, to support the return handling decision-making process inthe warehouse, have been largely ignored up to now. For a number of researchareas, we highlighted in Section 4.5 how forward models can be extended, orhow new models can be launched, to include return handling. We identifiedseveral research gaps that can be turned into a research agenda, as describednext.
• Which impact do return flows have respectively on:
- the warehouse layout;
- material handling systems (e.g., whether dedicated return handlingsystems do pay off);
- storage and picking procedures (ex. route combination of returns’storage and pick ups).
Furthermore we suggested the use of the MPEC formulation to e.g. helpretailers deciding upon the return policy.
A new direction to inventory modelling was also put forward as by cate-gorizing customers in two classes, i.e. less and more profitable depending onwhether, or not, the customer (systematically) returns merchandize.
The environment that surrounds forward and return operations todayshould also have a place in academic research. To mention only two: pack-aging legislation in the European Union and e-commerce. It is a fact that
4.6. Summary and conclusions 145
packaging waste regulation has kindled research interest on material recov-ery. The impact of packaging legislation, both standardization and reuse,on present warehousing operations has however not been thoroughly inves-tigated. Regarding e-commerce, it is well known that fairly tolerant returnpolicies have impact on return flows (see Piron and Young, 2000). Yet, theimpact on warehouse operations still lacks investigation.
Most likely some of the ideas for future research laid down here are notstraightforwardly carried out. We believe that learning more about the prac-tice of return handling can subtract some of the modelling difficulties. Notonly quantitative models are needed, but in order to implement it success-fully, more qualitative, or empirical approaches are necessary. For example,research towards best practices may help decision makers to come up withsolutions for sorting, buffering, and storage. By conducting simultaneousdesk and field research, quantitative models will plausibly aid on real returnhandling decision-making.
Concluding, the handling of return flows is not as the usual handlingof forward flows coming into the warehouse. This was illustrated with anexample in Section 4.3 and further discussed in Section 4.4. It involves otherprocesses than forward logistics, thus it involves additional decisions that callfor explicit decision-making support tools.
Furthermore, the interactions between forward flows and return flowsshould also be taken into account in future research. Chapter 5 takes a firststep in this direction, by analyzing the specific decisions of combining vs.separating forward and reverse flows during transport, receipt, and storage.

Chapter 5
Return Handling: anexploratory study
We shall never cease from explorationAnd the end of all our exploringWill be to arrive where we startedAnd know the place for the first time
T. S. Eliot
5.1 Introduction
According to the Material Handling Industry of America (MHIA, 2002), ma-terial handling is the movement, storage, control and protection of material,goods and products throughout the process of manufacturing, warehousing,consumption and disposal. The focus is on the methods, mechanical equip-ment, systems and related controls used to achieve these functions, usuallyinternal, within the company (see, for example, Tompkins et al., 1996). Ac-cording to research of ELA (1999), 7.7% of the expenses of 500 interviewedEuropean companies consists of logistics costs, of which 2% is in warehousingand 3.1% is in transport (1.2% administration and 1.4% inventory costs).
Return handling is even more costly. In some businesses return ratescan be over 20% (for example in the catalogue industry and online sales),and returns can be especially costly when not handled properly (see Meyer,1999 and Morphy, 2001). As reported by O’Neill and Chu (2001), ForresterResearch concludes that in 1999 the value of returned goods purchased online
147
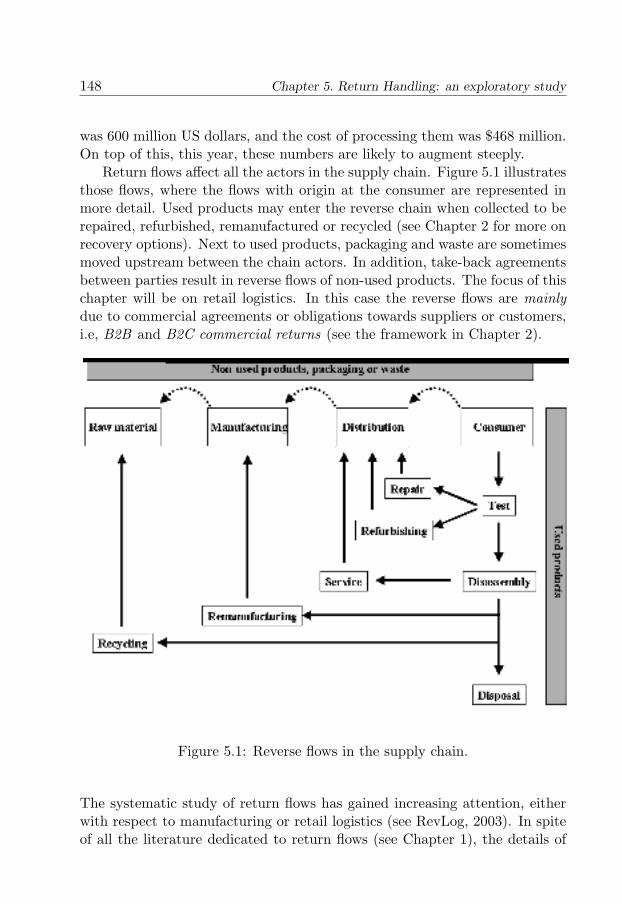
148 Chapter 5. Return Handling: an exploratory study
was 600 million US dollars, and the cost of processing them was $468 million.On top of this, this year, these numbers are likely to augment steeply.
Return flows affect all the actors in the supply chain. Figure 5.1 illustratesthose flows, where the flows with origin at the consumer are represented inmore detail. Used products may enter the reverse chain when collected to berepaired, refurbished, remanufactured or recycled (see Chapter 2 for more onrecovery options). Next to used products, packaging and waste are sometimesmoved upstream between the chain actors. In addition, take-back agreementsbetween parties result in reverse flows of non-used products. The focus of thischapter will be on retail logistics. In this case the reverse flows are mainlydue to commercial agreements or obligations towards suppliers or customers,i.e, B2B and B2C commercial returns (see the framework in Chapter 2).
Figure 5.1: Reverse flows in the supply chain.
The systematic study of return flows has gained increasing attention, eitherwith respect to manufacturing or retail logistics (see RevLog, 2003). In spiteof all the literature dedicated to return flows (see Chapter 1), the details of
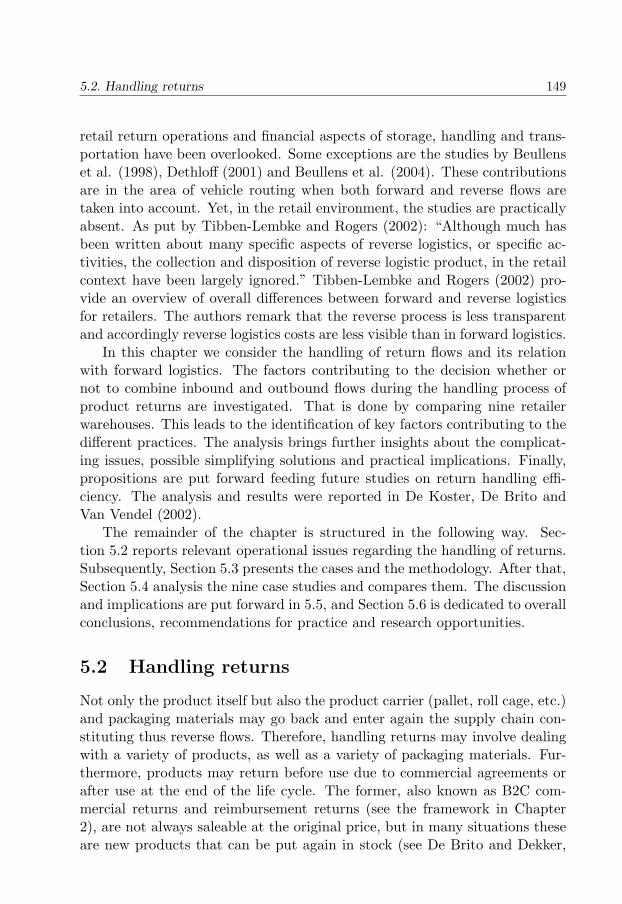
5.2. Handling returns 149
retail return operations and financial aspects of storage, handling and trans-portation have been overlooked. Some exceptions are the studies by Beullenset al. (1998), Dethloff (2001) and Beullens et al. (2004). These contributionsare in the area of vehicle routing when both forward and reverse flows aretaken into account. Yet, in the retail environment, the studies are practicallyabsent. As put by Tibben-Lembke and Rogers (2002): “Although much hasbeen written about many specific aspects of reverse logistics, or specific ac-tivities, the collection and disposition of reverse logistic product, in the retailcontext have been largely ignored.” Tibben-Lembke and Rogers (2002) pro-vide an overview of overall differences between forward and reverse logisticsfor retailers. The authors remark that the reverse process is less transparentand accordingly reverse logistics costs are less visible than in forward logistics.
In this chapter we consider the handling of return flows and its relationwith forward logistics. The factors contributing to the decision whether ornot to combine inbound and outbound flows during the handling process ofproduct returns are investigated. That is done by comparing nine retailerwarehouses. This leads to the identification of key factors contributing to thedifferent practices. The analysis brings further insights about the complicat-ing issues, possible simplifying solutions and practical implications. Finally,propositions are put forward feeding future studies on return handling effi-ciency. The analysis and results were reported in De Koster, De Brito andVan Vendel (2002).
The remainder of the chapter is structured in the following way. Sec-tion 5.2 reports relevant operational issues regarding the handling of returns.Subsequently, Section 5.3 presents the cases and the methodology. After that,Section 5.4 analysis the nine case studies and compares them. The discussionand implications are put forward in 5.5, and Section 5.6 is dedicated to overallconclusions, recommendations for practice and research opportunities.
5.2 Handling returns
Not only the product itself but also the product carrier (pallet, roll cage, etc.)and packaging materials may go back and enter again the supply chain con-stituting thus reverse flows. Therefore, handling returns may involve dealingwith a variety of products, as well as a variety of packaging materials. Fur-thermore, products may return before use due to commercial agreements orafter use at the end of the life cycle. The former, also known as B2C com-mercial returns and reimbursement returns (see the framework in Chapter2), are not always saleable at the original price, but in many situations theseare new products that can be put again in stock (see De Brito and Dekker,
150 Chapter 5. Return Handling: an exploratory study
2003). End-of-life returns, mainly a consequence of environmental legislationsteadily increasing in the European Union, may later be reused, remanufac-tured, recycled, or properly disposed. In this chapter, end-of-life returns arenot considered since they are currently negligible for the retailers in question.For further information on end-of-life return handling issues, see De Kosteret al. (2000).
Figure 5.2: The process of handling returns.
In order to handle returns in practice, several decisions about the logisticsprocess of the returned products have to be taken. The focus here is onthe decision whether or not to combine forward and reverse flows during thereturn handling process. In addition, and when appropriate, we comment onrelated warehousing decisions (see Chapter 4).
Figure 5.2 exhibits the three stages of this process, as considered in thischapter:
• Collection & transport to the warehouse
• Receipt & sorting in the warehouse
• Storage in the warehouse
In the first stage companies have to decide if they are going to simultaneouslypick up returns and distribute new goods. The trade-off here is between the
5.3. The case studies: brief description and design 151
exploitation of existing resources (trucks, route planning) and the increase ofcomplexity (e.g. new and returned products sharing truck capacity). Later,returned products have to be received and sorted at the warehouse. In this sec-ond stage, consisting of receipt and sorting, companies have to decide whetheror not these operations are to be done in the same area/facility where pro-cured products are handled. Finally, in the third stage products in goodcondition are put back in inventory to be sold again (a common practice inseveral businesses).
The decision on combining vs. splitting reverse and forward flows, islooked at from two perspectives: i) the physical storage and ii) the registra-tion of information in the management system. In general terms, firms haveto decide if they will use the same facilities and network structures to handleboth the forward and the return flow of products. This may imply addi-tional transport, space, or even buildings and specialized labor requirements.Moreover, all these decisions are subordinated to the overall objectives of thecompany such as minimizing costs, providing a high service level and keepinghigh controllability of operations. The different stages of handling returns arethe central aspects of the case study analysis. The next section considers thecase study methodology.
5.3 The case studies: brief description and design
The cases comprise the handling of returns in warehouses of three lines ofbusinesses: food stores, non-food store chains and mail order companies. Allof these are mature industries that deal with returns on a daily basis. In totalnine retailer warehouses were considered, three per industry branch allowinginter- and intra-industry comparison.
Food retailing is a business with large volumes and small profits. Themargin in the Netherlands is about 1% to 2% per item (see De Koster andNeuteboom, 2001). The three food retailers studied, identified as FR1, FR2,FR3, have full line warehouses. This means that the full line of products isstored in the warehouse, and is supplied via the warehouse to the supermar-kets.
The non-food store chains are here called SC1, SC2 and SC3. They are alllarge non-food store chains in the Netherlands. SC2 and SC3 are the largestdepartment stores. SC1 is a large speciality retailer in sports apparel andaccessories.
Finally, the mail order companies labelled as MO1, MO2 and MO3 arethe largest mail order companies in the Netherlands. Customers usually orderfrom catalogues, which are freely distributed. Nevertheless, the Internet is
152 Chapter 5. Return Handling: an exploratory study
also increasing its role as a market channel. As case candidates the mainplayers in the Netherlands were elected.
In the case of food-retailers however, also all national players have full-lineregional warehouses with assortment and sizes comparable to regional players(see De Koster and Neuteboom, 2001). Thus, for this study of warehouseoperations, it is indifferent to choose national or regional players in the foodsector.
In the first stage of the methodology design, more companies were con-tacted by phone in order to evaluate the feasibility of the research. Dataavailability and willingness to cooperate during the planned research periodwere decisive factors on whether, or not, to include a concrete case in thisstudy. In total nine retailer warehouses became suitable for research. In ad-dition to detailed interviews at each distribution center with logistic and otherspecialist managers, field surveys were carried out on site to gain an appreci-ation of the issues involved. After that, phone calls followed to clarify aspectswhen necessary. Subsequently, interviewees had the opportunity to check theinformation collected. The field research took place in 1999/2000. Informa-tion about the handling process (transport, receipt and storage regarding eachwarehouse) was gathered.
In addition and to facilitate the understanding of the conditions in whichdecisions are taken, the following additional data was collected: type of prod-uct and materials being returned (what-type, see Chapter 2), return policy,and return volume. Moreover, an estimative of the space and manpower as-signed to return handling, as well as the associated costs are given. This datawill help as a criteria to evaluate the performance of the retailers, with respectto return handling (see 5.5). Below we list all the elements.
Contextual factors
• Type of returned product or material (goods, carriers, materials)
• Return policy (time and other constraints)
• Return volume (per return flow, and compared with total outgoing flow)
The process
(focus: separation vs. combination of reverse and forward flows)
• Transport (combined vs. separated; also: self-executed or not)
• Receipt (combined vs. separated; also: automated vs. manual handling)
5.4. The case studies: analysis and comparison 153
• Storage (combined vs. separated)
Manpower, space and associated costs
• Manpower during receipt and storage (amount of labor dedicated toreturn handling)
• Space for receipt and storage (the area devoted to return handling)
• Personnel and space investment
The costs of stocking and handling returns were estimated on the basis ofthe space used for return handling and storage processes. The estimationwas carried out as follows. In the case there were areas dedicated to returns,these areas were simply measured. The same was done when return stor-age was combined with outbound storage. Next, the yearly facility costs forreturns were obtained by depreciating the total investment costs of the facil-ity in 30 years and taking a part of this amount proportional to the spacefor returns. In addition, personnel costs were considered, with an average ofapproximately 27,300 annual euros per employee (this is an estimated valuebased on the salaries in the Netherlands, 2002). These are not the total costsof handling returns, since transportation costs and inventory holding costsare not included. However, building/renting the warehouse and manpowercosts represent the large slice of total costs (presumably above 50% and 25%respectively, see De Koster, 1996). In addition, substantial investments ininformation systems for returns usually have to be made (Olsen, 2000; Lintonand Jonhston, 2000), which have a much shorter depreciation period than30 years. Finally, it is very difficult to include costs of internal transporta-tion personnel (for instance forklift truck drivers), since they are not solelydedicated to return handling. In the next section and for clarity purposes,information on other particularities, retailer specific, or directly related to thehandling of product returns is added.
5.4 The case studies: analysis and comparison
5.4.1 Contextual factors
Food retailers
Among the three investigated food retailers, FR3 is active in the whole coun-try, while FR1 and FR2 operate at a regional scale. A variety of consumer
154 Chapter 5. Return Handling: an exploratory study
goods, from dry groceries, dairy products, beverage and meat, to vegetables,fruit, and frozen products have to be stored in the warehouse.
FR1 has one central distribution center (DC). The national market share isabout 2%, and the 30 supermarkets are served from the DC. The supermarketsare totally owned and exploited by the FR1 organization. The majority ofthe 8,000- 9,000 stock keeping units (SKUs) are mainly shipped to the 30supermarkets via the DC. Fresh dairy products, bread and cheese are directlyshipped from the suppliers. The distribution center of FR1 deals with thefollowing what-type of returns: i) consumer goods (supermarket stock), ii)distribution items (various carriers such as roll cages, crates, pallets), iii)other (waste) materials (such as paper and plastic).
The food retailer FR2 is also a regional chain with a single DC. The na-tional market share is 1.4% and the 30 supermarkets are served from theDC, including the bread and the meat that are manufactured in in-house in-tegrated factories. In total, this supermarket organization deals with about11,000 SKUs. FR2 deals with return types identical to FR1 i.e. products, dif-ferent carriers and other (waste) materials. The warehouse has two buildings,one for cold store, return handling and waste, and the other for the remainingactivities including bread and a meat factory. The food retailer FR2 dealswith the same type of returns as FR1 (see previous paragraph).
FR3 is actually a wholesaler with about 500 franchised supermarkets, forwhich the operations of storage and distribution are similar to those of FR1and FR2. The national market share is 10.6% with an assortment of 12,000products including tobacco and cosmetics. FR3 has several warehouses. Forthis study, the newest warehouse is considered, from which 134 supermarketsare served. FR3 receives back few products and little waste material becausethe supermarkets are responsible for disposing the packaging materials andwaste. If the supermarkets wish the DC to handle it, they have to pay forit. Therefore, the returns are mainly product carriers. The warehouse has atwo-floor structure, with the top floor dedicated to freeze and cold storage.
Table 5.1. shows quantitative data concerning the return flows (expressedin roll cages) at the three food retailers. It is clear that the majority ofreturns at the food retailers consist of empty carriers, e.g. empty roll cagesand crates (more than 60% of the returns in all cases). Actually, almost allreturns at FR3 are empty carriers because independent entrepreneurs have topay if they want the DC to handle their returns. Materials (like paper andplastic) and waste handling is significant only at FR1 and FR2, both having apolicy to centrally collect and handle returns and waste. Furthermore, at allfood retailers, FR1, FR2 and FR3, return products have to be authorized toobtain money restitution (see Chapter 4 on integrating operations, medium-
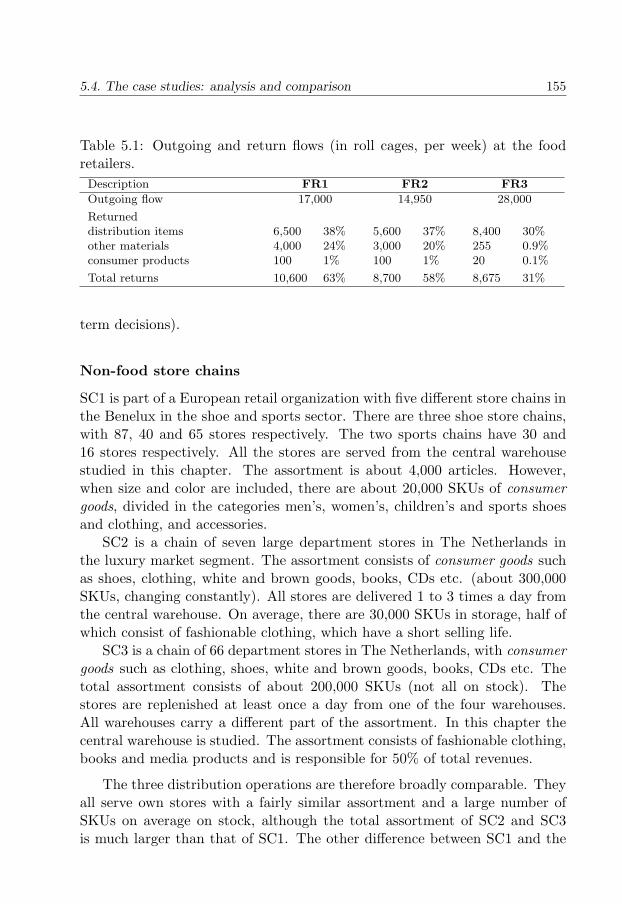
5.4. The case studies: analysis and comparison 155
Table 5.1: Outgoing and return flows (in roll cages, per week) at the foodretailers.Description FR1 FR2 FR3
Outgoing flow 17,000 14,950 28,000
Returneddistribution items 6,500 38% 5,600 37% 8,400 30%other materials 4,000 24% 3,000 20% 255 0.9%consumer products 100 1% 100 1% 20 0.1%
Total returns 10,600 63% 8,700 58% 8,675 31%
term decisions).
Non-food store chains
SC1 is part of a European retail organization with five different store chains inthe Benelux in the shoe and sports sector. There are three shoe store chains,with 87, 40 and 65 stores respectively. The two sports chains have 30 and16 stores respectively. All the stores are served from the central warehousestudied in this chapter. The assortment is about 4,000 articles. However,when size and color are included, there are about 20,000 SKUs of consumergoods, divided in the categories men’s, women’s, children’s and sports shoesand clothing, and accessories.
SC2 is a chain of seven large department stores in The Netherlands inthe luxury market segment. The assortment consists of consumer goods suchas shoes, clothing, white and brown goods, books, CDs etc. (about 300,000SKUs, changing constantly). All stores are delivered 1 to 3 times a day fromthe central warehouse. On average, there are 30,000 SKUs in storage, half ofwhich consist of fashionable clothing, which have a short selling life.
SC3 is a chain of 66 department stores in The Netherlands, with consumergoods such as clothing, shoes, white and brown goods, books, CDs etc. Thetotal assortment consists of about 200,000 SKUs (not all on stock). Thestores are replenished at least once a day from one of the four warehouses.All warehouses carry a different part of the assortment. In this chapter thecentral warehouse is studied. The assortment consists of fashionable clothing,books and media products and is responsible for 50% of total revenues.
The three distribution operations are therefore broadly comparable. Theyall serve own stores with a fairly similar assortment and a large number ofSKUs on average on stock, although the total assortment of SC2 and SC3is much larger than that of SC1. The other difference between SC1 and the
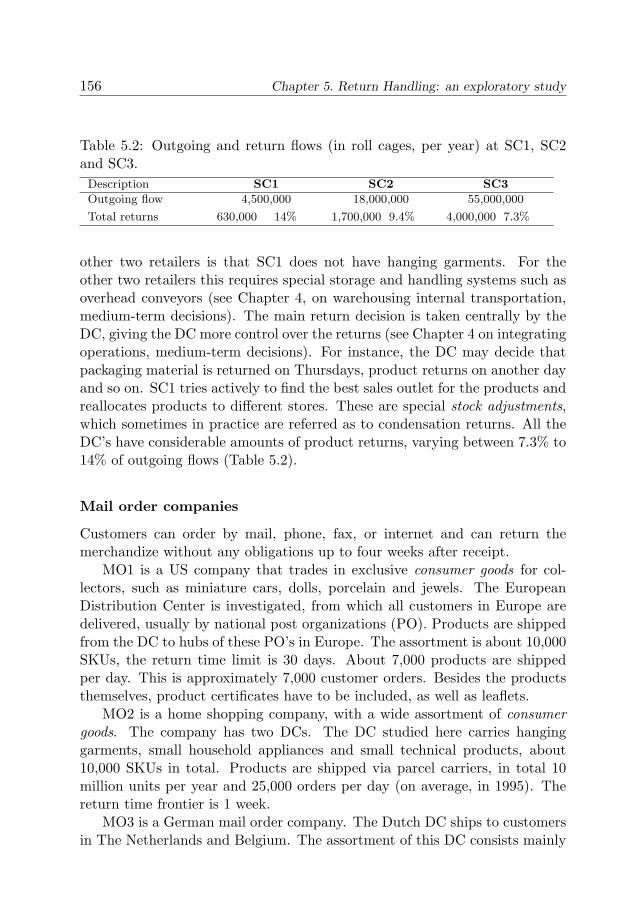
156 Chapter 5. Return Handling: an exploratory study
Table 5.2: Outgoing and return flows (in roll cages, per year) at SC1, SC2and SC3.Description SC1 SC2 SC3
Outgoing flow 4,500,000 18,000,000 55,000,000
Total returns 630,000 14% 1,700,000 9.4% 4,000,000 7.3%
other two retailers is that SC1 does not have hanging garments. For theother two retailers this requires special storage and handling systems such asoverhead conveyors (see Chapter 4, on warehousing internal transportation,medium-term decisions). The main return decision is taken centrally by theDC, giving the DC more control over the returns (see Chapter 4 on integratingoperations, medium-term decisions). For instance, the DC may decide thatpackaging material is returned on Thursdays, product returns on another dayand so on. SC1 tries actively to find the best sales outlet for the products andreallocates products to different stores. These are special stock adjustments,which sometimes in practice are referred as to condensation returns. All theDC’s have considerable amounts of product returns, varying between 7.3% to14% of outgoing flows (Table 5.2).
Mail order companies
Customers can order by mail, phone, fax, or internet and can return themerchandize without any obligations up to four weeks after receipt.
MO1 is a US company that trades in exclusive consumer goods for col-lectors, such as miniature cars, dolls, porcelain and jewels. The EuropeanDistribution Center is investigated, from which all customers in Europe aredelivered, usually by national post organizations (PO). Products are shippedfrom the DC to hubs of these PO’s in Europe. The assortment is about 10,000SKUs, the return time limit is 30 days. About 7,000 products are shippedper day. This is approximately 7,000 customer orders. Besides the productsthemselves, product certificates have to be included, as well as leaflets.
MO2 is a home shopping company, with a wide assortment of consumergoods. The company has two DCs. The DC studied here carries hanginggarments, small household appliances and small technical products, about10,000 SKUs in total. Products are shipped via parcel carriers, in total 10million units per year and 25,000 orders per day (on average, in 1995). Thereturn time frontier is 1 week.
MO3 is a German mail order company. The Dutch DC ships to customersin The Netherlands and Belgium. The assortment of this DC consists mainly
5.4. The case studies: analysis and comparison 157
of small household appliances and clothing. Registered customers receive acatalogue twice a year. The maximum allowed time in which customers mayreturn products is 2 weeks.
Product return flows are about 10%, 30% and 25% of the outgoing flowrespectively for MO1, MO2 and MO3. Apparently, all mail order compa-nies accept all returns and customers are usually credited (see Chapter 4 onintegrating operations, medium-term decisions).
Table 5.3 summarizes the aforementioned information regarding the returntype and policy of the nine retailers.
5.4.2 The process
Food retailers
FR1 uses small swap bodies with cooling capacity for transport between theDC and the stores several times per day. Transport is self-executed. Afterdropping off a full swap body at the store, the truck picks up the previousswap body, which is now loaded with returns, and transports it to the DC.All returns are received for inspection in a separate zone of the shipping area.After inspection, products are sorted and separated.
A third party will subsequently discard products in poor state, paper,bread, vegetables and other material waste. Product carriers are sorted man-ually and dispatched to separate storage areas (there are separate areas for thedistribution items, like empty roll cages, empty crates, and empty pallets).Products as-good-as-new are manually put back in the inventory togetherwith the procured products.
All packaging material and waste generated in the supermarkets is cen-trally collected at the DC, for scale advantage (see Stock, 2001).
Trailers are used to transport to and from the supermarkets in the case ofFR2. Although there are 4 deliveries per day, supermarkets can only returntwice a week. This has to do with the fact that returns are only picked up atthe last supermarket in each route with 2 or 3 supermarkets.
Returned products are received in a separate zone of the second building,while returned carriers are received at both buildings. Carriers will then beinspected in separate zones of each of the buildings. The integrated bakeryand butchery handle respectively bread and meat waste. Other waste materi-als are handled by third parties. Products in an as-good-as-new state go backto inventory. The collection of packaging material and waste is centralized atthe DC.
FR3 self-executes the transport by means of trailers, many with three
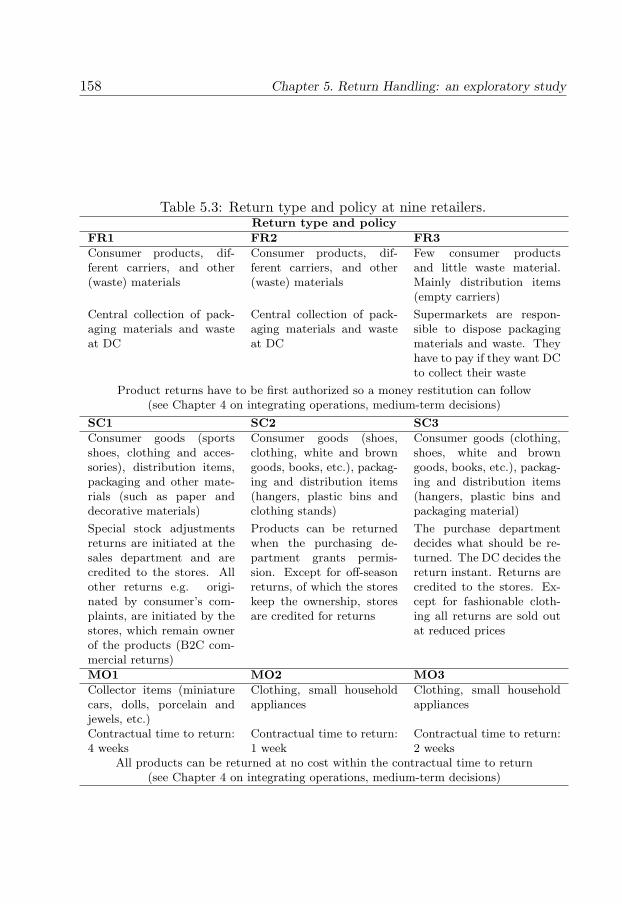
158 Chapter 5. Return Handling: an exploratory study
Table 5.3: Return type and policy at nine retailers.Return type and policy
FR1 FR2 FR3
Consumer products, dif-ferent carriers, and other(waste) materials
Consumer products, dif-ferent carriers, and other(waste) materials
Few consumer productsand little waste material.Mainly distribution items(empty carriers)
Central collection of pack-aging materials and wasteat DC
Central collection of pack-aging materials and wasteat DC
Supermarkets are respon-sible to dispose packagingmaterials and waste. Theyhave to pay if they want DCto collect their waste
Product returns have to be first authorized so a money restitution can follow(see Chapter 4 on integrating operations, medium-term decisions)
SC1 SC2 SC3
Consumer goods (sportsshoes, clothing and acces-sories), distribution items,packaging and other mate-rials (such as paper anddecorative materials)
Consumer goods (shoes,clothing, white and browngoods, books, etc.), packag-ing and distribution items(hangers, plastic bins andclothing stands)
Consumer goods (clothing,shoes, white and browngoods, books, etc.), packag-ing and distribution items(hangers, plastic bins andpackaging material)
Special stock adjustmentsreturns are initiated at thesales department and arecredited to the stores. Allother returns e.g. origi-nated by consumer’s com-plaints, are initiated by thestores, which remain ownerof the products (B2C com-mercial returns)
Products can be returnedwhen the purchasing de-partment grants permis-sion. Except for off-seasonreturns, of which the storeskeep the ownership, storesare credited for returns
The purchase departmentdecides what should be re-turned. The DC decides thereturn instant. Returns arecredited to the stores. Ex-cept for fashionable cloth-ing all returns are sold outat reduced prices
MO1 MO2 MO3
Collector items (miniaturecars, dolls, porcelain andjewels, etc.)
Clothing, small householdappliances
Clothing, small householdappliances
Contractual time to return:4 weeks
Contractual time to return:1 week
Contractual time to return:2 weeks
All products can be returned at no cost within the contractual time to return(see Chapter 4 on integrating operations, medium-term decisions)
5.4. The case studies: analysis and comparison 159
temperature compartments. Usually there are three deliveries per day persupermarket, giving opportunities to pick up the empty carriers. The re-turns are received in both floors of the warehouse, while the empty carriersare received through special dock-doors at the top floor. There is a specialshuttle truck that moves returns between the two storeys, to make sure thatthe returns are handled at the proper dock. Crates are sorted and palletizedthrough an automated system. All transport is daily and self-executed. How-ever, when excess capacity is needed, transport is outsourced.
Returns collection is included in the route, although this is done differentlyat all three retailers. The internal handling differs as well. All retailershave separate loading docks for empty (beer and soft drink) crates. All haveseparate areas where empty product carriers are stored. Waste materials atFR1 and FR2 are received and handled (sorted) in separate areas, as well.FR2 also disposes meat and bread waste. FR1 has outsourced this. Returns ofgood products, close to the keeping date, form a minority in all organizationsand are added to ordinary stock locations. These are usually sold at selectedoutlets at a lower price. At FR3, all waste material is weighed per store, sincethe stores have to pay for the disposal. This is not done at FR1 and FR2. Allreturns are handled manually, except empty product carriers at FR3, whichare sorted and palletized automatically. As exhibited in Table 5.1, the volumeof such returns is the largest at FR3. Table 5.4 summarizes the return processfor the food and other retailers.
Non-food store chains
Returns are picked up by the delivery truck and included in the route. SC3self-executes while SC1 and SC2 outsource the transport. Nevertheless, bothSC1 and SC2 keep control of the transport planning. Receipt and inspectionof returns is rather similar for the three store chains. However, while SC1 andSC3 have a separate storage area for returns, SC2 only has a separate storageplace for out of season products (see Table 5.4).
Mail order companies
After unpacking, inspection, packing and re-labelling, the ‘as-good-as-new’products are eventually added to regular stock. MO1 has a temporary locationfor returns, from where orders are first served. However, when capacity isreached in this location, product returns are stored together with initial stock.MO3 also has a hybrid storing strategy. It distinguishes on the one hand bulklocations for initial stock and on the other hand multi-SKU locations for
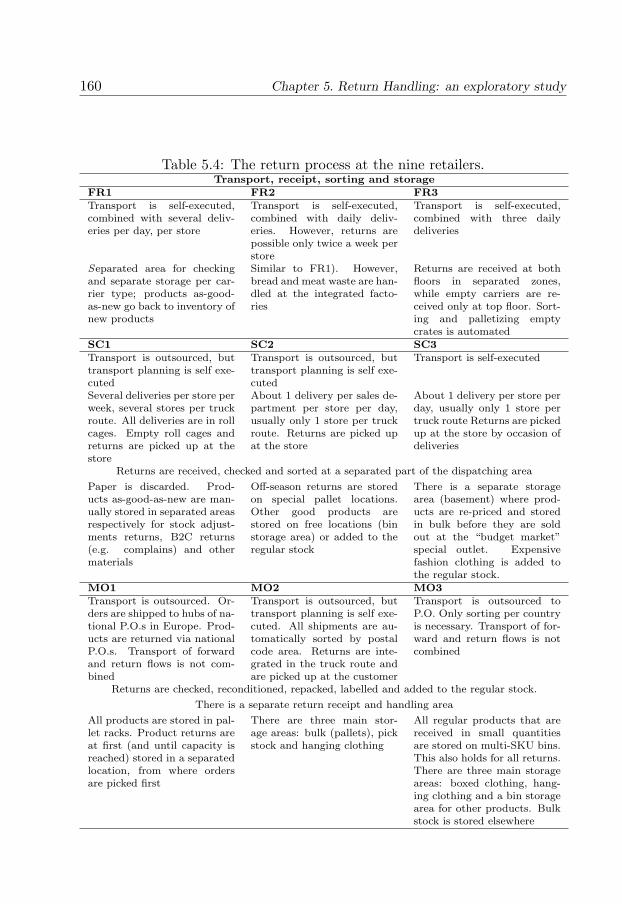
160 Chapter 5. Return Handling: an exploratory study
Table 5.4: The return process at the nine retailers.Transport, receipt, sorting and storage
FR1 FR2 FR3Transport is self-executed,combined with several deliv-eries per day, per store
Transport is self-executed,combined with daily deliv-eries. However, returns arepossible only twice a week perstore
Transport is self-executed,combined with three dailydeliveries
Separated area for checkingand separate storage per car-rier type; products as-good-as-new go back to inventory ofnew products
Similar to FR1). However,bread and meat waste are han-dled at the integrated facto-ries
Returns are received at bothfloors in separated zones,while empty carriers are re-ceived only at top floor. Sort-ing and palletizing emptycrates is automated
SC1 SC2 SC3Transport is outsourced, buttransport planning is self exe-cuted
Transport is outsourced, buttransport planning is self exe-cuted
Transport is self-executed
Several deliveries per store perweek, several stores per truckroute. All deliveries are in rollcages. Empty roll cages andreturns are picked up at thestore
About 1 delivery per sales de-partment per store per day,usually only 1 store per truckroute. Returns are picked upat the store
About 1 delivery per store perday, usually only 1 store pertruck route Returns are pickedup at the store by occasion ofdeliveries
Returns are received, checked and sorted at a separated part of the dispatching area
Paper is discarded. Prod-ucts as-good-as-new are man-ually stored in separated areasrespectively for stock adjust-ments returns, B2C returns(e.g. complains) and othermaterials
Off-season returns are storedon special pallet locations.Other good products arestored on free locations (binstorage area) or added to theregular stock
There is a separate storagearea (basement) where prod-ucts are re-priced and storedin bulk before they are soldout at the “budget market”special outlet. Expensivefashion clothing is added tothe regular stock.
MO1 MO2 MO3Transport is outsourced. Or-ders are shipped to hubs of na-tional P.O.s in Europe. Prod-ucts are returned via nationalP.O.s. Transport of forwardand return flows is not com-bined
Transport is outsourced, buttransport planning is self exe-cuted. All shipments are au-tomatically sorted by postalcode area. Returns are inte-grated in the truck route andare picked up at the customer
Transport is outsourced toP.O. Only sorting per countryis necessary. Transport of for-ward and return flows is notcombined
Returns are checked, reconditioned, repacked, labelled and added to the regular stock.
There is a separate return receipt and handling area
All products are stored in pal-let racks. Product returns areat first (and until capacity isreached) stored in a separatedlocation, from where ordersare picked first
There are three main stor-age areas: bulk (pallets), pickstock and hanging clothing
All regular products that arereceived in small quantitiesare stored on multi-SKU bins.This also holds for all returns.There are three main storageareas: boxed clothing, hang-ing clothing and a bin storagearea for other products. Bulkstock is stored elsewhere
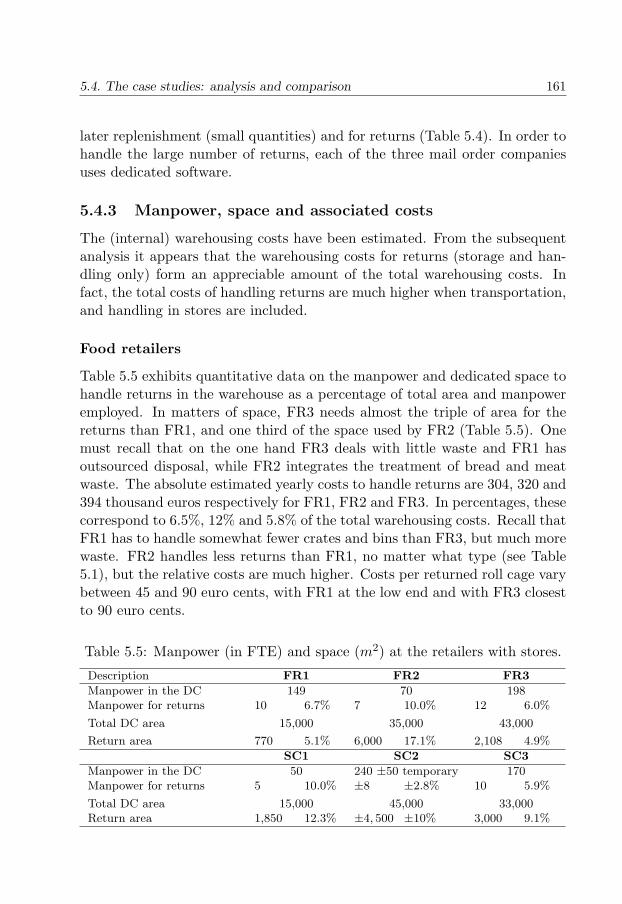
5.4. The case studies: analysis and comparison 161
later replenishment (small quantities) and for returns (Table 5.4). In order tohandle the large number of returns, each of the three mail order companiesuses dedicated software.
5.4.3 Manpower, space and associated costs
The (internal) warehousing costs have been estimated. From the subsequentanalysis it appears that the warehousing costs for returns (storage and han-dling only) form an appreciable amount of the total warehousing costs. Infact, the total costs of handling returns are much higher when transportation,and handling in stores are included.
Food retailers
Table 5.5 exhibits quantitative data on the manpower and dedicated space tohandle returns in the warehouse as a percentage of total area and manpoweremployed. In matters of space, FR3 needs almost the triple of area for thereturns than FR1, and one third of the space used by FR2 (Table 5.5). Onemust recall that on the one hand FR3 deals with little waste and FR1 hasoutsourced disposal, while FR2 integrates the treatment of bread and meatwaste. The absolute estimated yearly costs to handle returns are 304, 320 and394 thousand euros respectively for FR1, FR2 and FR3. In percentages, thesecorrespond to 6.5%, 12% and 5.8% of the total warehousing costs. Recall thatFR1 has to handle somewhat fewer crates and bins than FR3, but much morewaste. FR2 handles less returns than FR1, no matter what type (see Table5.1), but the relative costs are much higher. Costs per returned roll cage varybetween 45 and 90 euro cents, with FR1 at the low end and with FR3 closestto 90 euro cents.
Table 5.5: Manpower (in FTE) and space (m2) at the retailers with stores.
Description FR1 FR2 FR3
Manpower in the DC 149 70 198Manpower for returns 10 6.7% 7 10.0% 12 6.0%
Total DC area 15,000 35,000 43,000
Return area 770 5.1% 6,000 17.1% 2,108 4.9%
SC1 SC2 SC3
Manpower in the DC 50 240 ±50 temporary 170Manpower for returns 5 10.0% ±8 ±2.8% 10 5.9%
Total DC area 15,000 45,000 33,000Return area 1,850 12.3% ±4, 500 ±10% 3,000 9.1%
162 Chapter 5. Return Handling: an exploratory study
Non-food store chains
SC1 uses 12.3% of the total warehouse area and 10% of the total employeesto handle returns. The numbers for SC2 are 2.8% and 10%, and for SC3 areabout 6.0% and 9.1% for respectively area and manpower for product andmaterial returns. (Table 5.5) The estimated yearly costs to handle returnsare in absolute values 192, 324 and 369 thousand euros respectively for SC1,SC2 and SC3. These values correspond to 10.6%, 3.6% and 6.5% of the totalcosts in the respective warehouses. This corresponds to much less than 45euro cents per return unit, with SC3 and SC1 having respectively the lowestand the highest costs.
Mail order companies
The impression given by the visits to these companies is that they use between5% to just above 10% of the warehouse space to handle returns, and around10% to 15% of the working force. However, thorough estimation was notpossible for all mail order companies due to the way some handle returns.For this reason, return handling’s cost comparison is out of the question. Yet,it is feasible to provide a rough estimation of the costs. One should keepin mind the dimensions of mail order companies businesses and that theyhave large number of product returns (Meyer, 1999). Given the percentagesprovided above, and based on the costs per return unit of the non-food storechains, one can estimate the warehousing handling cost per return unit asbeing approximately 45 euro cents. This embraces the work dedicated toreturns as receipt, inspecting/sorting and bringing them to storage location.For simplicity one may assume that each individual operation corresponds toone third of the cost. Goods also have to be transported to the customer, andback, in the case of returns. In the Netherlands, several mail order companiescharge the customer with about 5 euros for transportation costs. Consideringthat customers order 2 or 3 items at a time, the transportation cost perproduct is estimated as being 1,50 euros.Figure 5.3 depicts the processes involved from purchasing to delivering thegoods to the customer, as well as the processes involved in the case of re-turns. Note that the operation inspection/sorting is much simpler for newlypurchased products than for returned products. In the latter instance, everyindividual return has to be checked and re-conditioned if necessary (for in-stance ironing returned clothes). With Figure 5.3 in mind, Table 5.6 displaysestimated costs for mail order companies, when a return occurs (constructedas described before).
In Table 5.6 one observes that the costs double (from 1.95 to 3.90 euros)
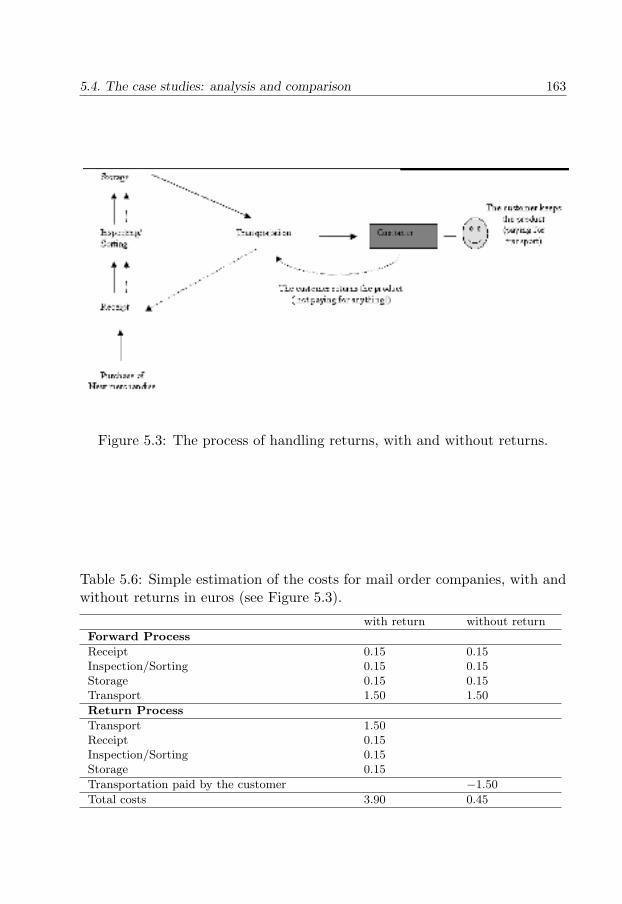
5.4. The case studies: analysis and comparison 163
Figure 5.3: The process of handling returns, with and without returns.
Table 5.6: Simple estimation of the costs for mail order companies, with andwithout returns in euros (see Figure 5.3).
with return without return
Forward Process
Receipt 0.15 0.15Inspection/Sorting 0.15 0.15Storage 0.15 0.15Transport 1.50 1.50
Return Process
Transport 1.50Receipt 0.15Inspection/Sorting 0.15Storage 0.15
Transportation paid by the customer −1.50
Total costs 3.90 0.45
164 Chapter 5. Return Handling: an exploratory study
when a return occurs, but due to the financial construction (the customer onlypays for transportation costs when he/she keeps merchandize), the “net cost”increases by more than a factor 7 (from 0.45 to 3.90). These numbers are notsurprising as in many industries, moving products back from the customer tothe producer costs between 5 to 9 times more than moving the same productforward (Stock and Lambert, 2001).
More costs are involved on top of those discussed above, as all the threemail order companies had a separate module in the Warehouse ManagementSystem dedicated to return handling. These systems demand substantialinvestment costs since it is hardly found as a standard functionality. Thissoftware helps to monitor returns as for instance the number of times an itemhas been returned.
5.5 Discussion and implications
In the previous section, we depicted the operational aspects of handling re-turns associated with nine retailer warehouses in the Netherlands. Next weput forward three general and three specific propositions, based both on liter-ature and on our empirical analysis, feeding future studies on return handlingefficiency.
P1: Converting product returns into a sold product more than triples thecosts of immediately selling a product in one-trip.
It is not new that a lot of money is involved in returns. The Reverse Lo-gistics Council have estimated that handicap return management costs everyyear billions of dollars to U.S. firms (Rogers and Tibben-Lembke, 1999).
In the previous section, the estimated handling costs for mail order com-panies doubled when products are returned. This follows naturally from theprocesses involved. All the forward processes have to be performed once again,but now for returns (transport, receipt, inspection/sorting, and storage). Yet,the increase in costs is likely to be underestimated since every returned prod-uct undergoes a thorough check followed by an indispensable reconditioningprocedure. In this respect, return handling is operationally more demand-ing than forward handling. Actually, return handling in the DC alone hasbeen estimated as being twice as expensive as forward handling (see Zuidemaand De Koster, 2002b). The point is that returns contribute substantially tooperational costs, emphasizing the need for return handling efficiency.
P2: Reducing uncertainty (not only on quality, quantity, and time, butalso on product diversity) is critical for large-scale return handling.

5.5. Discussion and implications 165
Reverse Logistics has been associated with high uncertainties on time, quan-tity and quality (see Dekker et al., 2004).
The empirical research allows us to state that not only when, how muchand the state of products, but that also the product diversity is a centralsource of uncertainty (see also conjecture P5). Moreover, one can expectthat different combination scenarios of those four factors are more or lessproblematic for return handling. For instance more of the same, i.e. largevolume of similar type of products is likely to be handled more efficiently thana group of products with very different characteristics.
Indeed, we could notice that all retailers had mechanisms to reduce theaforementioned uncertainty while steering the return scenario as much aspossible. Every retailer with stores centralized the return authorization. Al-though with limitations, this gives the possibility to determine the instant(time) for certain types and amounts of returns (quantity, quality and diver-sity) being collected. For example, a retailer may determine that only onestream of waste is being returned, or that complaint returns are collectedalone on Thursday, and so on.
Mail order companies have somewhat less chance of reducing uncertainty,especially the ones that use P.O. services. Yet, MO2 integrates the deliveryroute with return pick-ups at customers. In this case, the customer phonesthe retailer requiring a pick up, to which the retailer proposes the pick update. Although customers are entitled by law with the right of returningproducts, the mail order companies formally restrict the return period fromone to four weeks after the customer has received it. Still, there is evidencethat customers do not always respect the time of the return constraint (seeChapter 6 and Schmidt et al., 1999).
Though mail order companies have limited control over returns, all in-vested in information systems to register return data. Mail order companiesshowed concern in limiting the number of times a returned item goes back tothe market and in recognizing customers that repeatedly return merchandize.From the interviews it was not possible however to assess which action istaken in the case of customers that frequently return products. Nonetheless,each retailer was clearly involved in reducing uncertainty on quality, quantity,time, and product diversity of returned products.
P3: Return handling has special warehousing requirements that are fun-damentally different from those of forward flows, being of importance forefficient handling.
Both academics and practitioners have pointed out that Reverse Logisticsis likely to have different basic requirements than forward logistics either in
166 Chapter 5. Return Handling: an exploratory study
respect to infrastructure (Gentry, 1999) or knowledge (Meyer, 1999).This study gives empirical evidence to this type of assessments, in the
context of product flow handling in the warehouse. Table 5.7 was constructedwith the data of Table 5.1, Table 5.2 and Table 5.5. By observing Table 5.7(numbers were rounded to not create illusory accuracy), one can notice thatFR3 uses 33% more Full Time Equivalents (FTE) to deliver 65% more prod-ucts than FR1, per week (FR3 uses 186 FTE to deliver 28,000 roll cages perweek, while FR1 uses 139 to deliver 17,000). In contrast with this good rela-tive forward performance, FR3 uses more people than FR1 and FR2 to handleless volume of returns. This happens in spite of automatic crate handling inFR3 and manual handling at the other two food retailers. The direct impacton the cost per returned roll cage is the following: FR1 with a cost slightlyabove 45 euro cents and FR3 with a cost close to 90 euro cents per roll cage.One may suspect from these numbers that FR3 is not really being efficient.However, it is likely that FR3 is in a learning phase, since the correspondentinvestigated DC had started operations recently (see Section 5.4).
Table 5.7: Material flow per manpower (in FTE): forward vs. return flow.Description FR1 FR2 FR3 SC1 SC2 SC3
FORWARD flow
Flow (roll cages/week) 17,000 14,950 28,000 90,000 360,000 1,100,000Manpower (FTE) 139 63 186 50 (±)265 170
(1) Flow per FTE 122 237 150 1,800 1,358 6,471
RETURN flow
Flow (roll cages/week) 10,600 8,700 8,675 12,600 34,000 80,000Manpower (FTE) 10 7 12 5 (±)8 10
(2) Flow per FTE 1,060 1,243 723 2,520 3,400 8,000
RETURN relative to FORWARD (flow per FTE)
(2-1)/1 7.69 4.24 3.82 0.40 1.50 0.24
Another aspect is that for almost all retailers with stores an FTE handlesseveral times the flow, when it is reverse than when it is forward (see Table5.7). One should keep in mind that in the case of the food retailer, the bulkof returns are crates, bins, followed by wrap materials and waste. The DC ofeach of the food retailers handles less than 1% of products (see Table 5.1).In the case of the store chains, the return types were not discriminated (seeTable 5.2). Since the goods are mainly clothing, it is not unreasonable tothink that the shops already performed the initial check. Besides this, some
5.5. Discussion and implications 167
Table 5.8: Material flow per area (in m2): forward vs. reverse flow.Description FR1 FR2 FR3 SC1 SC2 SC3
FORWARD FLOW
Flow (roll cages/week) 17,000 14,950 28,000 86,538 346,154 1,057,692Area (m2) 15,000 35,000 43,000 15,000 45,000 33,000
(1) Flow per m2 1.13 0.43 0.65 5.77 7.69 32.05
RETURN FLOW
Flow (roll cages/week) 10,600 8,700 8,675 12,115 32,692 76,923Area (m2) 770 6,000 2,108 1,850 4,500 3,000
(2) Flow per m2 13.38 1.45 4.12 6.55 7.26 25.64
RETURN relative to FORWARD (flow per m2)
(2-1)/1 10.80 2.39 5.32 0.14 -0.06 -0.20
of these returns result from stock adjustments, basically not needing thoroughinspection. However, when space is considered, for some retailers productsrequire more average space for return handling than the space required foroutbound products (see Table 5.8, which was built with data from Table5.1, Table 5.2 and Table 5.5). This occurs with retailers SC2 and SC3 thatindeed have hybrid storage strategies (see the discussion on the process in theprevious section).
Apart from these mixed facts the point is that a retailer may have a verygood relative performance in forward flow, but the opposite relative perfor-mance with the reverse flow. As mentioned before, a FTE in FR3 handlesmore forward flow than a FTE in FR1, but the opposite happens with thereverse flow (similarly when comparing SC1 and SC2). All the above fitsin the context of our conjecture: return handling has different warehousingrequirements than those of forward flows. Indeed, return handling encom-passes operations as inspection, which is not part of forward handling. Yet,this implies that there is room for research to identify potential specific needsthat matter in efficient warehousing handling. As put by Tibben-Lembke andRogers (2002), “... and much future research is needed to discover how tobest structure reverse logistics operations.”
Table 5.9 sums up the decisions of combining (C) vs. separating (S) theforward from the reverse flows during the three stages of return handling:transport, receipt, and storage. All the retailers with stores (food and non-food store chains) combine the transport of product returns with outboundflows. All the warehouses have a separate area to receive returns. On storage,
168 Chapter 5. Return Handling: an exploratory study
Table 5.9: Decision on whether to combine (C) vs. to separate (S) the forwardand the reverse flows.
Food companies Store chains Mail order companiesFR1 FR2 FR3 SC1 SC2 SC3 MO1 MO2 MO3
Transport C C C C C C S C SReceipt S S S S S S S S SStorage C C C S C/S S/C C/S C C/S
the majority of the retailers combine the flows, one separates and three retail-ers have a mixed or hybrid arrangement. Below we discuss three conjectureswith these facts in mind.
P4: For retailers that supply (a sufficient number of) stores it is mostefficient to collect the returned material to the DC with the same truck thatdelivers the products.
The rationale behind this is very simple. The truck returns to the warehouseanyway and it also saves precious space for the stores, which are often placedin urban areas with little expansion possibility and very high land prices. Inaddition, in the case of waste or obsolete products, a number of stores shouldbe included in the return route to have economies of scale (Stock, 1992). Yet,one should notice that when more than one store is included per route, theloading of return material complicates the unloading of purchased productsat the stores that follow in the route. This is the case for FR2 and SC1.Nevertheless, FR2 was able to simplify the operation by allowing each storeto return material only when the store is the last in the route, which happensmaximally twice a week. This emphasizes the importance of self-executing thetruck route planning. Actually most of the retailers considered in this studykept control of the route planning. FR1, FR2, FR3 and SC3 self-execute thetransport operations. The store chains SC1 and SC2 outsource the transportbut they keep the route planning in-house. MO2 uses a delivery service butalso keeps the route planning in-house.
P5: For retailers that handle a high volume of returns, it is more efficientto unload and sort returns in a separate area of the DC.
All the warehouses separate the inbound and outbound flows during the re-ceipt phase and all the retailers deal daily with large volumes of product andmaterial returns. Product returns demand operations additional to those ofpurchased products, such as inspection. If the volume of returns is not sub-stantial it could still be reasonable to combine the forward and reverse flows,
5.5. Discussion and implications 169
but in the converse situation it is not likely. A complicating factor for returnhandling is the diversity of products. Yet, handling of large homogeneousflows may be automated. For instance at FR3 all empty crates are auto-matically unloaded from roll cages, sorted per type and stacked on pallets. Inpractice the design of the warehouse layout has to take into account the returnhandling. Comparing the numbers for return costs as part of total warehous-ing costs enforces this. They vary from 3.6% at SC2 to 12% at FR2. The factthat FR2 uses two separate buildings to receive product and material returnsdemanding transportation between the buildings is likely to contribute to thisrelatively higher relative cost.
Separating vs. combining storage is related with the market for returns,as follows:
P6 a: If the market for returns is different from the original marketthen product returns are stored in a different area from those of purchasedproducts.
P6 b: If the market for returns is the same then storage of product returnsis likely to be combined with purchased products. Exceptions will be foundin the case of high-intended control over returned products.
For food retailers all returned products in good condition are stored togetherwith new products and they are sold in the same market. The same holdsfor mail order company MO2. Department store SC2 combines storage apartfrom off-season products, which are sold in another market. SC3 mainly sellsreturns in “budget” outlets so they separate storage. This retailer only com-bines the storage for expensive articles, which are sold in the original market.SC1 is an exception in the sense that it separates storage but returned prod-ucts go back to the same market. This is related to the fact that SC1 is veryconcerned about keeping track of returns. This comes along with the activerole of SC1 in finding the best store to reallocate product returns. MO1stores returns at first in a separate location from which orders are pickedfirst. This goes with MO1’s aim of giving priority to returned products forshipment to customers. Such an approach provides a quick means to learnmore about the market, the product, and even the process. For instance,repeated returns may indicate that some aspect is being overlooked duringreturn check or that customer expectations are not being met at all. Whencapacity is reached in the temporary location, product returns are put to-gether with purchased products. MO3 uses a hybrid solution: small amountsof received products, including returns, are stored in a single bin (max 10SKUs) on one location. For MO3 the control over returns is an issue of greatimportance. Mail order companies have an additional difficulty because they
170 Chapter 5. Return Handling: an exploratory study
have a substantial volume of returns and elevated product diversity (numberof SKU’s) coming back in small quantities (per customer). Before we startedthis study we suspected that the combination of volume and product diver-sity would have an impact on the storage decision. From the analysis thoughthe complicating factor seems to be the decision of controlling returns. Yet,both volume and product diversity can be a point of further research sincethey might not be a complicating factor by itself but be so when combinedwith other factors. Furthermore, to have a relevant degree of return monitor-ing and control, a separate module for returns in the warehouse managementsystem is desirable as it is already the case for mail order companies.
5.6 Conclusions
This exploratory study facilitates the development of theory for return han-dling and supports both recommendations for practice and academic research.Return handling contributes considerably to operational costs. When prod-ucts are meant to be put again in inventory, they have to pass a close inspec-tion and inevitable reconditioning procedures, which are manpower-intensiveand therefore expensive. Not only quantity, quality and timing are relevantsources of uncertainty in the reverse stream but also product diversity, as thisstudy showed. Reducing these four fronts of uncertainty streamlines returnhandling operations, increasing efficiency. However, to master forward han-dling does not seem enough for efficient return handling. There is actuallyempirical evidence for the existence of different basic requirements in returnhandling vs. forward handling, also in the warehouse scene. Among thestudied companies, retailers having a good relative performance in handlingforward flows were not always able to perform as well with respect to reverseflows.
Regarding the focus on factors contributing to combine vs. to separatethe reverse and forward flows, three conjectures were put forward. In thosewe established relations between the following issues (see also Figure 5.5):
1. serving stores & the transport phase decision;
2. return volume & the receipt at the warehouse;
3. the market for returns & the storage decision.
In more detail, we conjuncture that:
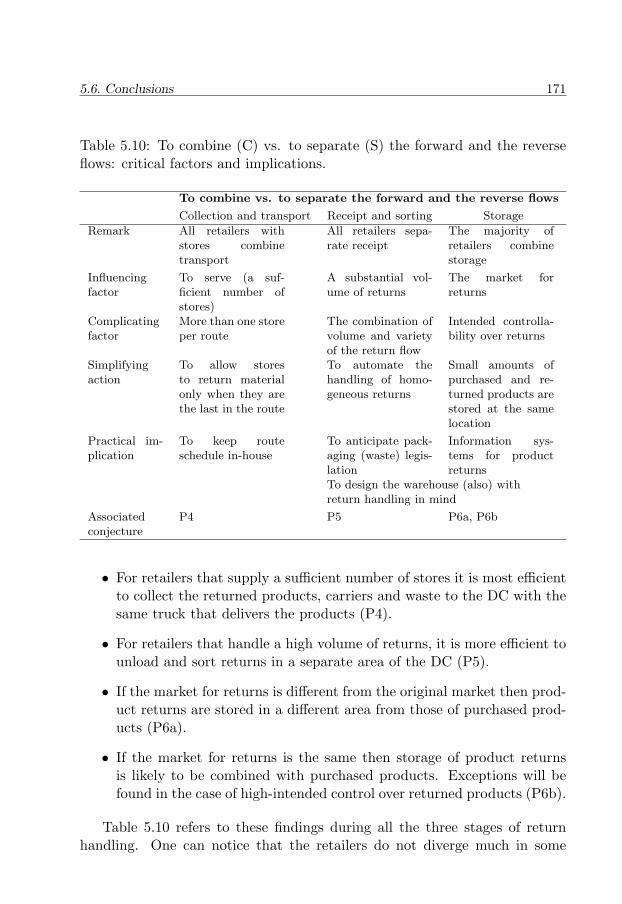
5.6. Conclusions 171
Table 5.10: To combine (C) vs. to separate (S) the forward and the reverseflows: critical factors and implications.
To combine vs. to separate the forward and the reverse flows
Collection and transport Receipt and sorting Storage
Remark All retailers withstores combinetransport
All retailers sepa-rate receipt
The majority ofretailers combinestorage
Influencingfactor
To serve (a suf-ficient number ofstores)
A substantial vol-ume of returns
The market forreturns
Complicatingfactor
More than one storeper route
The combination ofvolume and varietyof the return flow
Intended controlla-bility over returns
Simplifyingaction
To allow storesto return materialonly when they arethe last in the route
To automate thehandling of homo-geneous returns
Small amounts ofpurchased and re-turned products arestored at the samelocation
Practical im-plication
To keep routeschedule in-house
To anticipate pack-aging (waste) legis-lation
Information sys-tems for productreturns
To design the warehouse (also) withreturn handling in mind
Associatedconjecture
P4 P5 P6a, P6b
• For retailers that supply a sufficient number of stores it is most efficientto collect the returned products, carriers and waste to the DC with thesame truck that delivers the products (P4).
• For retailers that handle a high volume of returns, it is more efficient tounload and sort returns in a separate area of the DC (P5).
• If the market for returns is different from the original market then prod-uct returns are stored in a different area from those of purchased prod-ucts (P6a).
• If the market for returns is the same then storage of product returnsis likely to be combined with purchased products. Exceptions will befound in the case of high-intended control over returned products (P6b).
Table 5.10 refers to these findings during all the three stages of returnhandling. One can notice that the retailers do not diverge much in some
172 Chapter 5. Return Handling: an exploratory study
of the particular decisions. This finding has been one of the inputs for theaforementioned conjectures and it constitutes a valuable guideline for futureresearch. Besides that, some associated recommendations for practice andresearch opportunities derived from the detailed information about all thecases follow below.
5.6.1 Recommendations for practice
Here we make first recommendations for practice regarding the long- andmedium-term warehousing decisions. Figure 5.4 is structured according tothe decision-framework of Chapter 4 and it summarizes the general recom-mendations. After that, we pay attention to the specific focus of this chapter,i.e. the decisions on combining vs. separating forward and reverse flowsduring transport, receipt and storage.
While designing the warehouse layout, practitioners should take into ac-count return handling explicitly, i.e. returns receipt location and future stor-age locations.
For retailers with stores wishing to reduce return uncertainty there aretwo key-factors: to centralize return authorization and to keep routing in-house even when outsourcing transport. These actions give the retailers theopportunity to restrain return uncertainty by determining the exact momentof each pick up (taking into account the stores’ needs). Alternatively, theycan set it as a constraint to the third party, when outsourcing transport.
Furthermore, if forward handling is the only concern, the warehouse mayend up with undesirable high costs for return handling due to disregardedinternal transport. Automating the return handling for homogenous returnsmay simplify operations. However, this calls for substantial investment andit relates primarily to returned product carriers. This is a sensitive matter,especially with the enforcement of the directives on packaging and packagingwaste of the European Union. Therefore, retailers have to think thoroughlyon the consequences of packaging legislation before investing heavily on returnhandling automation. For instance, if manufacturers comply to the packag-ing standards launched by the European Committee for Standardization andpackaging gets lighter, is the automatic handling equipment able to deal withthis?
The last recommendation is to employ a dedicated module within thewarehouse management system for return handling monitoring. This sugges-tion is related to the indication of fundamental differences in handling thetwo types of flows and to deficiencies in standard software regarding returnhandling.
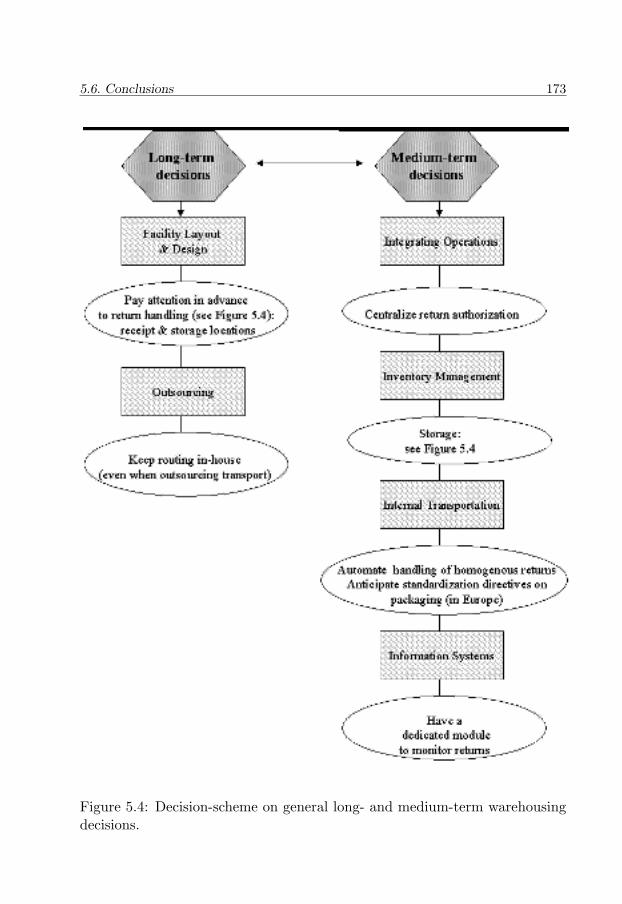
5.6. Conclusions 173
Figure 5.4: Decision-scheme on general long- and medium-term warehousingdecisions.
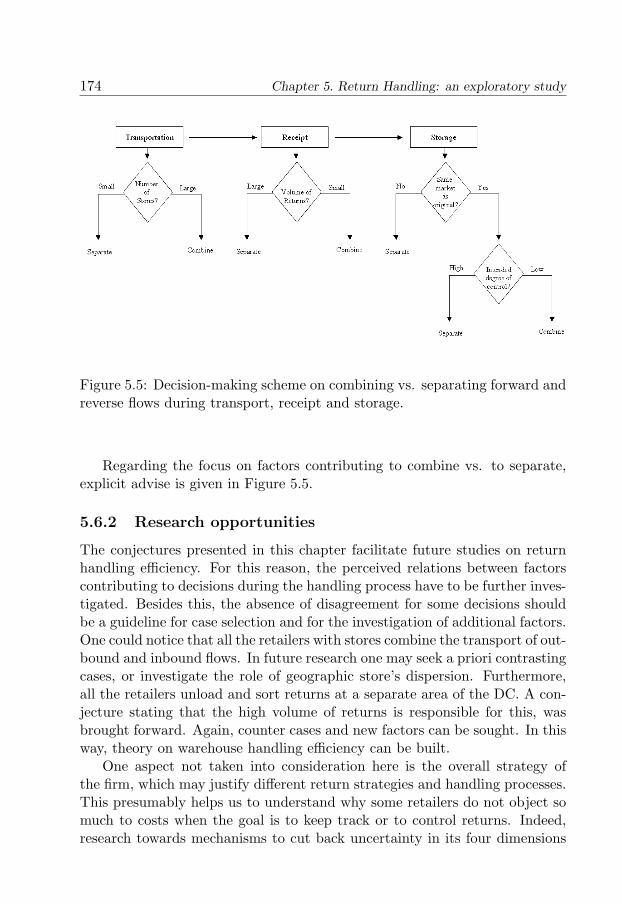
174 Chapter 5. Return Handling: an exploratory study
Figure 5.5: Decision-making scheme on combining vs. separating forward andreverse flows during transport, receipt and storage.
Regarding the focus on factors contributing to combine vs. to separate,explicit advise is given in Figure 5.5.
5.6.2 Research opportunities
The conjectures presented in this chapter facilitate future studies on returnhandling efficiency. For this reason, the perceived relations between factorscontributing to decisions during the handling process have to be further inves-tigated. Besides this, the absence of disagreement for some decisions shouldbe a guideline for case selection and for the investigation of additional factors.One could notice that all the retailers with stores combine the transport of out-bound and inbound flows. In future research one may seek a priori contrastingcases, or investigate the role of geographic store’s dispersion. Furthermore,all the retailers unload and sort returns at a separate area of the DC. A con-jecture stating that the high volume of returns is responsible for this, wasbrought forward. Again, counter cases and new factors can be sought. In thisway, theory on warehouse handling efficiency can be built.
One aspect not taken into consideration here is the overall strategy ofthe firm, which may justify different return strategies and handling processes.This presumably helps us to understand why some retailers do not object somuch to costs when the goal is to keep track or to control returns. Indeed,research towards mechanisms to cut back uncertainty in its four dimensions
5.6. Conclusions 175
(quantity, quality, time and product diversity) would be of practical value.Though, there are studies on the impact of return policies on a number ofelements like opportunistic behavior and speed of consumption (see Hess etal., 1996 and Davis et al., 1998), the impact on operations has not yet beenthoroughly investigated.
Another aspect lacking investigation is on the dispatching tactics whenboth returned items and new merchandize are in stock. A typical situationin a company is having the marketing department believing that new mer-chandize should be shipped first, while the logistical department may thinkotherwise (see Zuidema and De Koster, 2002a). In general terms, there is aneed for research on issues of monitoring and control return handling, bring-ing efficiency to operations (see also Chapter 4 on quantitative support forreturn handling). In addition, the technical literature, as mentioned in the in-troduction, may benefit from a close look at warehouse running costs. Whilemodelling warehouse operations and associated costs, researchers would bemore apt to explicitly de-couple forward from reverse costs if robust estimateswere found.

Chapter 6
Inventory Management: acritical analysis ofassumptions
Man is an animal suspendedin webs of significancehe himself has spun
Clifford Geertz,paraphrasing Max Weber
6.1 Introduction
As mentioned in the previous chapter, Inventory Management and Control isone of the key decision-making areas while managing product returns. Fleis-chmann et al. (2002), van der Laan et al. (1999) and Inderfurth and van derLaan (2001) are recent examples of scientific literature on inventory controlwith product returns. From a modelling perspective, one of the consequencesof reverse flows is the loss of monotonicity of inventory levels between replen-ishments of new products. That is, the inventory level does not only decreasebecause of demand but it may also increase in the case of returns. Sincethis makes the analysis much more difficult than traditional inventory con-trol, authors use simplifying assumptions regarding the return process. Theseassumptions typically are 1) the demand flow is a (compound) homogeneousPoisson process; 2) the return flow is a (compound) homogeneous Poisson
177
178 Chapter 6. Inventory Management: a critical analysis of assumptions
process, and 3) the return process is independent of the demand process (seeFleischmann et al., 1997; Dekker and van der Laan, 1999). However, thereis nearly no (scientific) literature providing empirical analysis of data on re-verse flows. Thus, in this chapter we explore the validity of these commonassumptions by means of real data. First of all, we present a methodologyto check the assumptions empirically. We describe actual practice in compa-nies with respect to information storage on returns and to inventory control.Moreover, we apply the methodology to real data and we discuss practicalimplications of our findings, for instance with respect to information man-agement on inventory systems with returns. We employ data from threecompanies here referred to as CERN, MOC and RF. Both CERN, the Euro-pean Organization for Nuclear Research (see Cern, 2000) and RF, a refineryin the Netherlands, deal with internal material returns. MOC, a mail-ordercompany, handles customer product returns. The results of this study haveappeared in De Brito and Dekker (2003b).
The remainder of the chapter is organized as follows. The next section isdedicated to a review of the main assumptions in the literature when it comesto inventory models with return flows. Then, in Section 6.3 the methodologyis put forward and the statistical analysis and tests are described. In Section6.4 the data of the three companies is described. The data analysis can befound in Section 6.5. The last section sums up the conclusions, practical andtheoretical implications and research needs.
6.2 Inventory models with returns:a literature review
Literature on inventory control models with return flows can be divided intotwo streams: 1) typical repair models; 2) other models with imperfect corre-lation between demand and returns. In the former models there is a perfectcorrelation between machine failure and the demand for a substitute, wherethe number of machines or parts in the system is constant. This chapterconcentrates on product returns that fit in the second group. For recent sur-veys on repairable inventory theory we refer to Cho and Parlar (1991) and toGuide and Srivastava (1997b).
This review considers two types of models: deterministic models andstochastic models.
6.2. Inventory models with returns: a literature review 179
6.2.1 Deterministic models
Schrady (1967) considers a deterministic inventory model in which a certainpercentage of sold products comes back, after a known period of time, to berepaired. Repaired items are put in inventory to be eventually re-used. Sincethe demand and the return processes are assumed to be continuous deter-ministic flows, the dependency relationship between the demand and returnprocess is not explicitly modelled. Later, Richter (1996) and Teunter (2001)extended this model with the option of product disposal. With respect tothe demand and return processes, Schrady’s assumptions remain roughly thesame in both extensions. Richter’s model however considers a discontinuousreturn flow as returned products are collected at variable moments in time.Also in a deterministic context, Minner and Kleber (2001) discuss the op-timal control for a production and remanufacturing system with continuousand non-stationary rates for both the demand and return processes.
6.2.2 Stochastic models
The stochastic models can be divided into two groups: periodic review modelsand continuous review models.
Periodic review models
This category of models typically focuses on proving the structure of theoptimal policy rather than finding optimal parameter values. For instance,Simpson (1978) provides the optimal policy structure for an inventory modelwith product returns in which product demands and returns can be stochasti-cally dependent within the same period only. Demand and returns are knownthrough a joint probability function, which can differ from period to period.Inderfurth (1997) extends the previous model with non-zero (re)manufacturingand procurement lead times. All other assumptions equal the ones of Simp-son. Inderfurth proves that there is a simple optimal control policy structureas long as the leadtimes for manufacturing and remanufacturing differ at mostone period. Buchanan and Abad (1998) consider a system with partial re-turns. Each period, a fixed fraction of products is lost while a stochasticfraction is returned. The authors establish an optimal policy for the casethat the time until return is exponentially distributed. Toktay et al. (2000)study ordering policies for a business case of single-use Kodak’s cameras. Themodel is as follows. After using the camera, customers take it to a shop/ lab-oratory to develop the film. The laboratories return the used cameras toKodak (but sometimes they go to the so-called jobbers). Kodak dismantles
180 Chapter 6. Inventory Management: a critical analysis of assumptions
the used cameras and reuses the flash circuit board of every camera in themanufacturing of new ones. A closed queueing network model is applied todecide on periodic ordering decisions. Custom demand is treated as a Homo-geneous Poisson Process (HPP) from which a known percentage is returned.The time the cameras are with respectively the customer and the lab are mod-elled by a queueing system with two infinite servers with general processingtimes. These two servers together model the time until the camera returns toKodak. Another important feature of this paper is the identification of theinformation’s value according to different scenarios. Kiesmuller and Van derLaan (2001) develop a periodic review inventory model where product returnsdepend on the demand process. Both the demand and the return streams fol-low a Poisson distribution. All returns depend on previous demands througha constant time until return, and two probabilities: the return probability(when demand occurs, it is assumed to be known whether, or not, an itemreturns) and the probability that a returned item is in a sufficiently goodcondition to be remanufactured. The authors compare this model with thesituation of independent demands and returns. The outcome supports that itis worth using information about the dependency structure between demandsand returns. Mahadevan et al. (2002) model a hybrid manufacturing andremanufacturing system with independent demand and return Poisson pro-cesses. The authors employ a push policy to combine the decision of whenand how much to (re)manufacture. Teunter and Vlachos (2002) inquire thenecessity of a disposal option for a similar model. The independent demandand return processes are modelled according to a Poisson or a Normal distri-bution. The conclusion is that only under certain circumstances the disposaloption brings economic benefits.
A special case of periodic review models is the newsboy model, where onlya single period is considered. Two newsboy models with returns have beenrespectively proposed by Vlachos and Dekker (2000) and Mostard and Teunter(2002). In the first, a constant fraction of the the sold items is returned andcan be re-sold only once. In the second, each item that is sold has a constantprobability of being returned and once returned it has a constant probabilityof being recovered. Returned items can be re-sold more than once. Botharticles investigate the optimal order quantity for the single period. Thesemodels are inspired by the order size decision that mail-order-companies ande-tailers face every season.
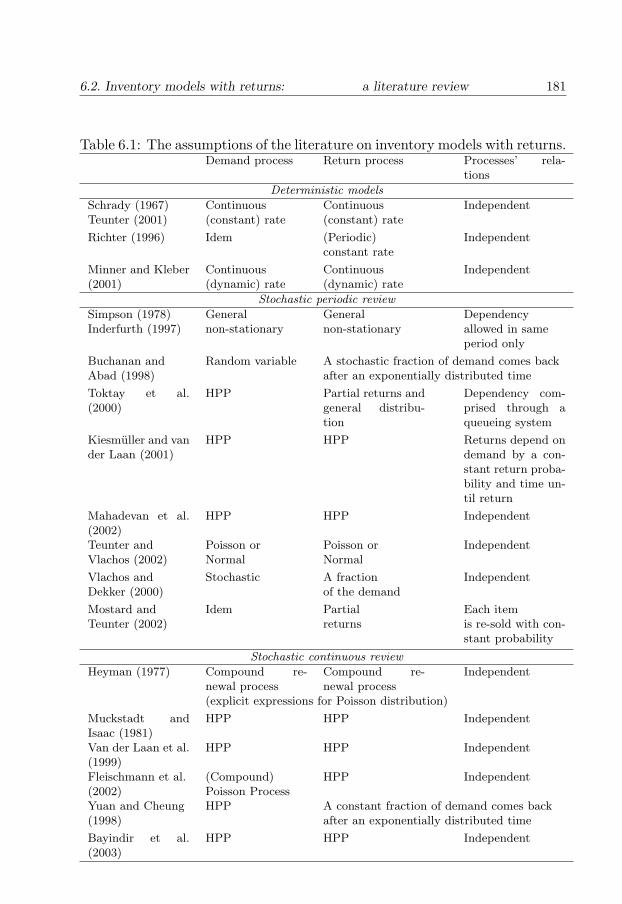
6.2. Inventory models with returns: a literature review 181
Table 6.1: The assumptions of the literature on inventory models with returns.Demand process Return process Processes’ rela-
tions
Deterministic models
Schrady (1967) Continuous Continuous IndependentTeunter (2001) (constant) rate (constant) rate
Richter (1996) Idem (Periodic) Independentconstant rate
Minner and Kleber Continuous Continuous Independent(2001) (dynamic) rate (dynamic) rate
Stochastic periodic review
Simpson (1978) General General DependencyInderfurth (1997) non-stationary non-stationary allowed in same
period only
Buchanan and Random variable A stochastic fraction of demand comes backAbad (1998) after an exponentially distributed time
Toktay et al.(2000)
HPP Partial returns andgeneral distribu-tion
Dependency com-prised through aqueueing system
Kiesmuller and vander Laan (2001)
HPP HPP Returns depend ondemand by a con-stant return proba-bility and time un-til return
Mahadevan et al.(2002)
HPP HPP Independent
Teunter and Poisson or Poisson or IndependentVlachos (2002) Normal Normal
Vlachos and Stochastic A fraction IndependentDekker (2000) of the demand
Mostard and Idem Partial Each itemTeunter (2002) returns is re-sold with con-
stant probability
Stochastic continuous review
Heyman (1977) Compound re-newal process
Compound re-newal process
Independent
(explicit expressions for Poisson distribution)
Muckstadt andIsaac (1981)
HPP HPP Independent
Van der Laan et al.(1999)
HPP HPP Independent
Fleischmann et al. (Compound) HPP Independent(2002) Poisson ProcessYuan and Cheung HPP A constant fraction of demand comes back(1998) after an exponentially distributed time
Bayindir et al.(2003)
HPP HPP Independent
182 Chapter 6. Inventory Management: a critical analysis of assumptions
Continuous review models
Heyman (1977) analyzes different disposal policies for a single-item inventorysystem with returns. He uses a model where demands and returns are inde-pendent compound renewal processes and all leadtimes are zero. An explicitexpression for the optimal disposal policy is given when the processes arePoisson. Also Muckstadt and Isaac (1981) investigate the control of a single-item inventory system with independent demands and returns following aPoisson Process. The authors derive some approximations. More recently,Van der Laan et al. (1999) deal with policies in the context of two inventoryfacilities, one of new products and the other of remanufactured items. Themodel is based on unit demand and unit returns with independent Poissonprocesses. Fleischmann et al. (2002) derive an optimal policy and optimalcontrol parameters for a basic inventory model with returns where demandand return are independent Poisson processes. Yuan and Cheung (1998) dis-cuss an (s,S) inventory system with returns and analyze the impact of partialreturns on rental systems. Demands are assumed to follow a homogeneousPoisson process and there are no lost customers. Customers keep the acquireditem during an exponentially distributed time. When this period ends, theitem is either returned or disposed, with a given probability already knownupon demand. They also assume that the return period is already known atthe time of demand. Bayindir et al. (2003) employ a queueing model to inves-tigate a hybrid (re)manufacturing system when the return ratio is a decisionvariable. Demand and return processes are independent and follow Poissondistribution. The time in market follows a general distribution. The authorsconclude that the remanufacturing facility is more or less used depending onwhether the production capacity is finite or not.
Although the above does not constitute an exhaustive review of the lit-erature on inventory models with returns, it serves to identify the commonassumptions of these models. Table 6.1 summarizes the main assumptions ofthe demand and return processes, and of the dependency structure betweenthese two processes. More information on inventory models with returns canbe found in Van der Laan et al. (2003).
The bulk of the literature, especially when uncertainty is modelled, as-sumes the following: 1) the demand is a homogeneous (compound) Poissonprocess; 2) the return process is also a homogeneous (compound) Poissonprocess, and 3) the two processes are independent. These choices have to dowith the tractability of the Poisson distribution. This is also the main reasonbehind the independence assumption. In fact, less restrictive assumptionscomplicate the analysis significantly. Besides, as the review of the literature
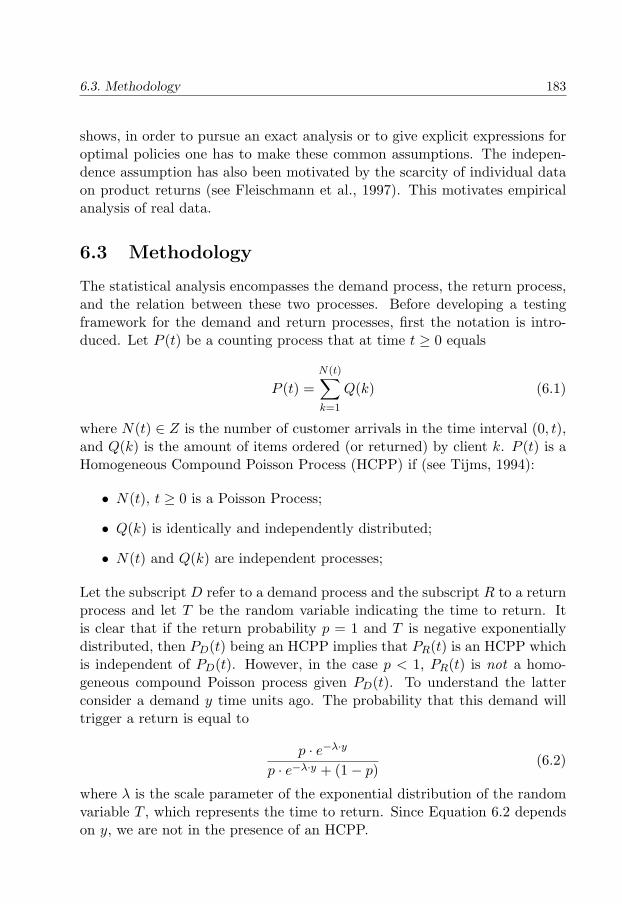
6.3. Methodology 183
shows, in order to pursue an exact analysis or to give explicit expressions foroptimal policies one has to make these common assumptions. The indepen-dence assumption has also been motivated by the scarcity of individual dataon product returns (see Fleischmann et al., 1997). This motivates empiricalanalysis of real data.
6.3 Methodology
The statistical analysis encompasses the demand process, the return process,and the relation between these two processes. Before developing a testingframework for the demand and return processes, first the notation is intro-duced. Let P (t) be a counting process that at time t ≥ 0 equals
P (t) =N(t)∑k=1
Q(k) (6.1)
where N(t) ∈ Z is the number of customer arrivals in the time interval (0, t),and Q(k) is the amount of items ordered (or returned) by client k. P (t) is aHomogeneous Compound Poisson Process (HCPP) if (see Tijms, 1994):
• N(t), t ≥ 0 is a Poisson Process;
• Q(k) is identically and independently distributed;
• N(t) and Q(k) are independent processes;
Let the subscript D refer to a demand process and the subscript R to a returnprocess and let T be the random variable indicating the time to return. Itis clear that if the return probability p = 1 and T is negative exponentiallydistributed, then PD(t) being an HCPP implies that PR(t) is an HCPP whichis independent of PD(t). However, in the case p < 1, PR(t) is not a homo-geneous compound Poisson process given PD(t). To understand the latterconsider a demand y time units ago. The probability that this demand willtrigger a return is equal to
p · e−λ·y
p · e−λ·y + (1− p)(6.2)
where λ is the scale parameter of the exponential distribution of the randomvariable T , which represents the time to return. Since Equation 6.2 dependson y, we are not in the presence of an HCPP.
184 Chapter 6. Inventory Management: a critical analysis of assumptions
6.3.1 Testing HCPP
One may still opt for approximating PR(t) with an HCPP if there are demandsoccurring regularly. To evaluate whether a process P (t) behaves as an HCPPconsists of checking the three sufficient and necessary conditions mentionedbefore. In order to first check whether it is acceptable that N(t) is a PoissonProcess, one can then check if
A) N(t) follows the Poisson distribution, and ifB) N(t) has independent increments.
The last item implies that the occurrence of events after any time t is in-dependent of the previous occurrences. For the first part, A), a chi-squaredgoodness-of-fit test can be used (see Bain and Engelhardt, 1967). To employthis test the potential outcome space has to be split into intervals. For a goodtest performance, the number of intervals should be as many as possible aslong as the expected number of observations is at least about 5 per interval.The second part, i.e. B), can be handled through a Ljung-Box Q test whichdirectly checks if the autocorrelations between increments are significant ornot. This test can be found in standard statistical packages, and can becarried out without sophisticated knowledge of time series theory (see Boxet al., 1994). The investigation over Q(k) can be carried out by applying aWald-Wolfowitz runs test for randomness (see Walpole et al., 1998) and againa Ljung-Box Q test. For the former test one finds in the literature tables ofcritical values from sample size 6 onwards. Finally, the test of independencebased on Pearson’s coefficient can be used to trace whether N(t) and Q(k)are independent or not (Bain and Engelhardt, 1967). This test gives thebest results when the sample is larger than 10 data observations. Next sub-section describes the technical details of the aforementioned statistical tests,which are summarized in Figure 6.1. The choice of those tests was madetargeting the following objectives: simplicity, parsimony, usefulness and testperformance (against small sample sizes).
6.3.2 Testing exponentiality of the time to return
Besides the assumptions in the literature regarding demand and return eachbeing a HCPP, these two processes are commonly assumed to be independent.In the proposed methodology there is no direct investigation about whetherthe demand and return processes can be dealt with as independent processes,because the data to be analyzed is likely to have only a small amount ofreturns. Instead, it is investigated whether it is reasonable to model thetime until return with an exponential distribution. The advantage of this is
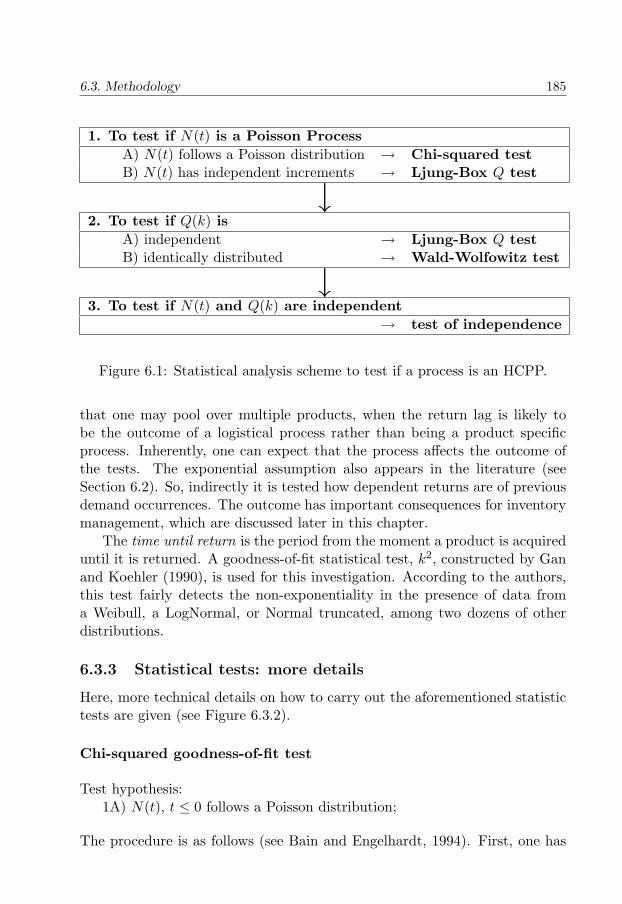
6.3. Methodology 185
1. To test if N(t) is a Poisson ProcessA) N(t) follows a Poisson distribution → Chi-squared testB) N(t) has independent increments → Ljung-Box Q test
↓2. To test if Q(k) is
A) independent → Ljung-Box Q testB) identically distributed → Wald-Wolfowitz test
↓3. To test if N(t) and Q(k) are independent
→ test of independence
Figure 6.1: Statistical analysis scheme to test if a process is an HCPP.
that one may pool over multiple products, when the return lag is likely tobe the outcome of a logistical process rather than being a product specificprocess. Inherently, one can expect that the process affects the outcome ofthe tests. The exponential assumption also appears in the literature (seeSection 6.2). So, indirectly it is tested how dependent returns are of previousdemand occurrences. The outcome has important consequences for inventorymanagement, which are discussed later in this chapter.
The time until return is the period from the moment a product is acquireduntil it is returned. A goodness-of-fit statistical test, k2, constructed by Ganand Koehler (1990), is used for this investigation. According to the authors,this test fairly detects the non-exponentiality in the presence of data froma Weibull, a LogNormal, or Normal truncated, among two dozens of otherdistributions.
6.3.3 Statistical tests: more details
Here, more technical details on how to carry out the aforementioned statistictests are given (see Figure 6.3.2).
Chi-squared goodness-of-fit test
Test hypothesis:1A) N(t), t ≤ 0 follows a Poisson distribution;
The procedure is as follows (see Bain and Engelhardt, 1994). First, one has
186 Chapter 6. Inventory Management: a critical analysis of assumptions
to divide the whole potential outcome space into c intervals A1, A2..., Ac; Letoj be the number of observations within interval j and pj the probability ofan observation falling in Aj and ej = n ∗ pj the expected number in the jth
interval with n being the sample size. For an error Type I equal to α (i.e. withthe probability of rejecting the hypothesis given that it is valid being equalto α) we reject the hypothesis if the value of test statistic is larger than the(1− α) quantile of a Chi-squared distribution with c− 2 degrees of freedom,i.e. if
c∑j=1
(oj − ej)2
ej≥ χ1−α(c− 2) (6.3)
To have an accurate test ej should be larger or equal than 5, or so, for eachinterval Aj . To have as many cells as possible is desired because it increasesthe degrees of freedom. For the test on the demand process we observedthe number of arrivals per month, and for the return process the number ofreturns per year. After that, the chi-squared test was employed.
Ljung-Box Q-test
Test hypotheses:1B) N(t) has independent increments;2A) Q(k) is independently distributed;
The test is based on a chi-squared test statistic (Box et al., 1994), which is anapproximated distribution of the autocorrelations. The MINITAB statisticalpackage was employed to carry out this test.
Wald-Wolfowitz test
Test hypothesis:2B) Q(k) is identically distributed.
To apply this test (see Walpole et al., 1998), one has to divide the sampleinto two mutually exclusive categories, e.g. above and below the median. Thetest statistic is the number of runs, i.e. groups of one or more observationsof the same category. The test detects deviation in randomness and it maysuggest non-randomness due to trends or periodicity. To test the hypothesis,one may rather divide the sample into two and then test if the distributionsare identical. However, these tests are only suitable for large enough samples(Kanji, 1999).
6.3. Methodology 187
Test of independence
Test hypothesis:3) N(t) and Q(k) are independent.
The test is based on Pearson’s correlation coefficient (see Bain and Engel-hardt, 1994). The time between arrival of clients and the amount ordered(or returned) constitute the samples. In this way, it can be tested whetherthe demand process is independent of the ordered quantities (and similarly tothe return process). For very small sample sizes, less than 10 observations, anon-parametric rank test is preferable, e.g. the Spearman’s rank correlationtest.
k2 goodness-of-fit test
Test hypothesis:Time until return has an exponential distribution
The test is based on the P −P probability plot (see Gan and Koehler, 1990).This plot is built drawing Zi = F (Xi/λ) versus pi, where
• F is the cumulative distribution function,
• Xi is the ith lower ordered observation, i = 1, ..., n with n being thesample dimension (i.e. the sample X is put in ascending order, X1
being the lowest observed number and Xn the highest),
• λ is the estimated scale parameter,
• pi is an appropriate plotting position.
The degree of fit is decided based upon the linearity featured in the graph.The statistic proposed is based on measures of linearity:
k2 =∑n
i=1((Zi − Z)(pi − p))2∑ni=1(Zi − Z)2(pi − p)2
(6.4)
Approximations for the lower pth percentile are obtained through the formulabelow:
1− kp2 =
1λp + n · βp
(6.5)
A table with the coefficients λp and βp can be found in Gan and Koehler(1990).
188 Chapter 6. Inventory Management: a critical analysis of assumptions
6.4 The data
Case 1 - CERN
CERN is a very large research center with more than 7 000 scientists. Thesescientists have several warehouses at their disposal with more than 15 000stock keeping units. Scientists have two ways of acquiring the products theyneed for their experiments: by going to the self-service stores or, by order-ing via the web from the main warehouse. The first is meant for low-valueregularly used items, i.e. the ‘consumer’ type of goods, and the latter for allother items (industrial goods. In both situations, scientists provide the budgetcode of the project they are working on. This code is therefore registered andthe project is charged for the delivery (CERN, 1999). For already 10 years,CERN registers inventory transactions through the LIMS package which hasbeen used on top of Baan’s TRITON system. Dr. B. Schorr and Dr. M. Kr-ever developed the LIMS package (CERN, 1997). The database encompassesthe following general information for each transaction occurrence:
• product identification by means of a code and a name;
• product quantity and its monetary value;
• store identification (main vs. self-service store);
• transaction types, e.g. replenishment from supplier, delivery to client,and returned by client;
In the case of products issued to scientists, the date of order placement, dateof planned and actual delivery, budget number and client code are in principleregistered.
In the case of a return, the date of transaction, the budget number andclient code can also be registered. Originally, an attribute was created inCERN’s database to register the reason for returning the product, but inpractice it is not used. The main return reason is actually reimbursement(see Chapter 2). In addition, the database had reason’s codes for wrongdeliveries, technical faults, delivered too late or even never ordered by theclient.
If the transaction is a replenishment, the supplier code and name is recordedin the database. CERN’s data is not only extraordinary by its dimension andlife span, but also due to the individual registration of transaction occurrences,including the identification of returns, client codes and budget numbers. Inmost other commercial packages, transaction data are stored only for a short
6.4. The data 189
time and are aggregated to e.g. monthly or yearly demand figures. Whena product is returned at the CERN, it is possible to trace back its date ofpurchase.
The procedure we used to trace back returns is as follows. If the clientnumber is registered, the return is associated with the most recent purchaseby this client whose amount is larger than the quantity returned. If not,but the budget number is known, the inspection is now done through theissues purchased under this budget number. The rationale behind this is thatsometimes the client who receives the product is not the one who returns it.Still, it is most likely that it is a client within the same project, i.e. with thesame budget number.
In several cases of return occurrences it is not possible to make a linkwith any previous delivery, because the client and budget identification aremissing. In other cases, there is no registration of previous deliveries to theseclients. Possible explanations are that the products are being returned underanother project, or that they were purchased before the implementation ofthe database.
Case 2 - Mail-order Company MOC
The second set of data comes from a mail-order company active in the Dutchmarket, here referred to as MOC. The main product line is fashion, but house-hold appliances and furniture are also found in MOC’s catalogues (consumergoods). Customers can order by mail, phone, fax or internet. Merchandizecan be returned at no cost up to a limited amount of time after delivery, yetthe company sometimes also accepts later returns. The returns correspondto the reimbursement returns type of the framework in Chapter 2.
MOC sends out two catalogues per year: spring/ summer and autumn/winter. Before the season starts, the catalogue is sent to a subset of recurrentcustomers, which can pose their orders even though the products are notdelivered before more than one month has passed. These orders help theexpert’s committee to point out an estimation of how many of each singleitem will be sold over the whole season. This estimated value is periodicallyupdated together with the return percentage, as more information becomesavailable on both sold and returned items.
MOC is very defensive towards making data on product demand and re-turns open to the public. The data made available by MOC for this researchis as follows: estimated values for the average return percentage per time unitboth for fashion and hardware products and for the years 2000 and 2001.Detailed information on the time unit and the return percentages remains
190 Chapter 6. Inventory Management: a critical analysis of assumptions
confidential throughout the chapter. Based on the provided information, 4samples of time until return are going to be constructed and used for thestatistical testing: fashion-2000; fashion-2001; hardware-2000; hardware-2001(more information can be found in Section 6.5). Then, for each of them istested whether, or not, it is reasonable that the underlining distribution con-sists of a negative exponential. Due to the character of the data, the demandand return processes are not investigated in isolation.
Case 3 - Refinery RF
The third case concerns a refinery in the Netherlands. The warehouse keepsthousands of materials in stock. The warehouse owns the majority of thesematerials while “customers” own the rest. In the latter situation, thoughmaterials are kept in stock in the warehouse of the refinery, there are nomonetary exchanges directly associated with a particular demand or materialreturn. Nevertheless, the transactions are registered in the database. Weconsider the spare parts inventory, which mainly consist of slow movers withconsumption in a maximum of four months per year. Product returns consistof spares that maintenance personnel did not need for a given maintenancejob or rotable spare parts previously repaired to an as-good-as-new condition.Thus, the returns reason correspond to the service returns category of theframework of Chapter 2.
The company uses the SAP R/3 material management module for their in-ventory control. In this system information on demand is stored on a monthlybasis. Accordingly, the immediate returns are netted. Only returns that occurin future months are visible (unless they have been netted with new demands).The return lag is determined by identifying for each return the latest monthwith a positive (netted) demand. Unlike the CERN case, we did not haveclient or budget codes for tracing. So, the tracing cannot be done with thecertainty of the CERN’s case. Yet, since in this case we are dealing withslow-movers, the extracted data is credibly very close to the real process.The inventory control policy of SAP employs basically the net demand andignores returns. The database consists of data from the last 4 years. We haveanalyzed data from some 800 materials.
6.5 Data analysis
The scarcity of data and, in many cases, its confidentiality explain the lackof publications on empirical analysis of return flows. Yet, this chapter testsreal data on demand and product returns. As mentioned previously, three
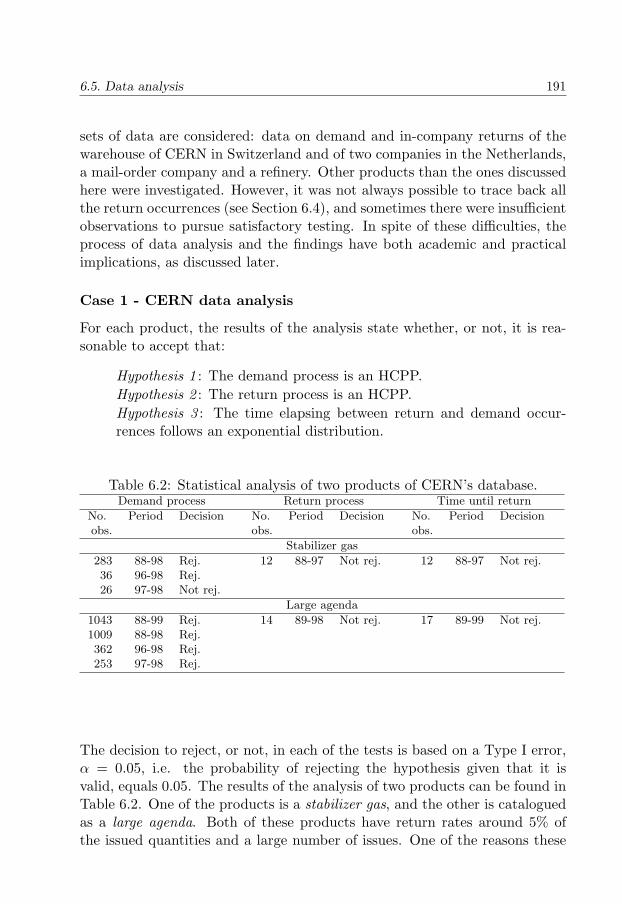
6.5. Data analysis 191
sets of data are considered: data on demand and in-company returns of thewarehouse of CERN in Switzerland and of two companies in the Netherlands,a mail-order company and a refinery. Other products than the ones discussedhere were investigated. However, it was not always possible to trace back allthe return occurrences (see Section 6.4), and sometimes there were insufficientobservations to pursue satisfactory testing. In spite of these difficulties, theprocess of data analysis and the findings have both academic and practicalimplications, as discussed later.
Case 1 - CERN data analysis
For each product, the results of the analysis state whether, or not, it is rea-sonable to accept that:
Hypothesis 1 : The demand process is an HCPP.Hypothesis 2 : The return process is an HCPP.Hypothesis 3 : The time elapsing between return and demand occur-rences follows an exponential distribution.
Table 6.2: Statistical analysis of two products of CERN’s database.Demand process Return process Time until return
No. Period Decision No. Period Decision No. Period Decisionobs. obs. obs.
Stabilizer gas
283 88-98 Rej. 12 88-97 Not rej. 12 88-97 Not rej.36 96-98 Rej.26 97-98 Not rej.
Large agenda
1043 88-99 Rej. 14 89-98 Not rej. 17 89-99 Not rej.1009 88-98 Rej.362 96-98 Rej.253 97-98 Rej.
The decision to reject, or not, in each of the tests is based on a Type I error,α = 0.05, i.e. the probability of rejecting the hypothesis given that it isvalid, equals 0.05. The results of the analysis of two products can be found inTable 6.2. One of the products is a stabilizer gas, and the other is cataloguedas a large agenda. Both of these products have return rates around 5% ofthe issued quantities and a large number of issues. One of the reasons these
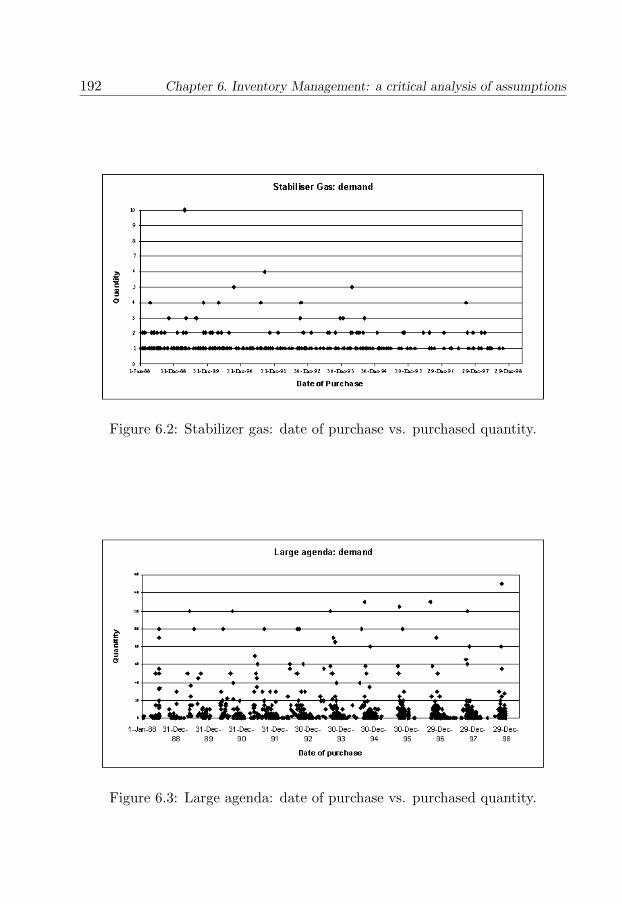
192 Chapter 6. Inventory Management: a critical analysis of assumptions
Figure 6.2: Stabilizer gas: date of purchase vs. purchased quantity.
Figure 6.3: Large agenda: date of purchase vs. purchased quantity.
6.5. Data analysis 193
products were chosen for analysis is the possibility of tracking a sufficientnumber of observations to pursue the required tests. In the case of unitpurchases and by assuming no lost or backlogged demand, one may opt forcarrying out the tests only for the demand and for the time until return. If thefirst two hypotheses are not rejected, and making an analogy with queueingsystems, one can consider the demand-return process as an M/M/∞, i.e.both the time between demand occurrences and the time until return followan exponential distribution. For such a queueing system the output flow willeventually behave as a Poisson Process (Ross, 1996), dispensing in this waythe need for testing it.
In the case of the stabilizer, it is rejected that the demand process followsa homogeneous Poisson Process for the periods 88-98 and 96-98, but notwhen only data from 97 and 98 is taken into account. Thus, demand does notremain stable for a period of 10 or even 3 years, but the opposite is acceptablefor a couple of years (see Figure 6.2). Regarding the return process, a HCPPis not rejected. It is also statistically not rejected that the time until returnis exponentially distributed. begincenter
The large agenda is a seasonal product, as observed in Figure 6.3. There-fore, for all the periods considered, the assumption of a HCPP demand isrejected. Actually the demand occurrences do not even behave as a PoissonProcess. However, it is accepted that the time in market is exponentiallydistributed and that the return process is a HCPP. One can explain this bythe fact that there are always enough products in the market. Making ananalogy with queueing systems this means that the server is always busy, sothe output flow does not depend so much on the demand process, but on theservice time.
Figure 6.4 is a dotplot of the ordered quantities of the product agenda.One can notice that there are on the one hand many orders of low quantitiesand on the other hand a few orders of large quantities. This puts forwarda division in two groups, namely small and large orders. Other graphicalrepresentations, among which the histogram of Figure 6.5 helped us to makethe division at the order quantity 20: large orders are the ones of quantitieslarger or equal than 20 (100 out of 1043). We proceed testing whether, ornot, the smaller orders follow an HCPP. The hypothesis is rejected. Theseasonality is likely to be the reason for this outcome. Regarding the largeorder, a tailor-made procedure to integrate these orders in a possible orderingpolicy is advisable.
Due to insufficient data of individual products, three groups of products(aggregated data) are investigated next. The existence of many, but infre-
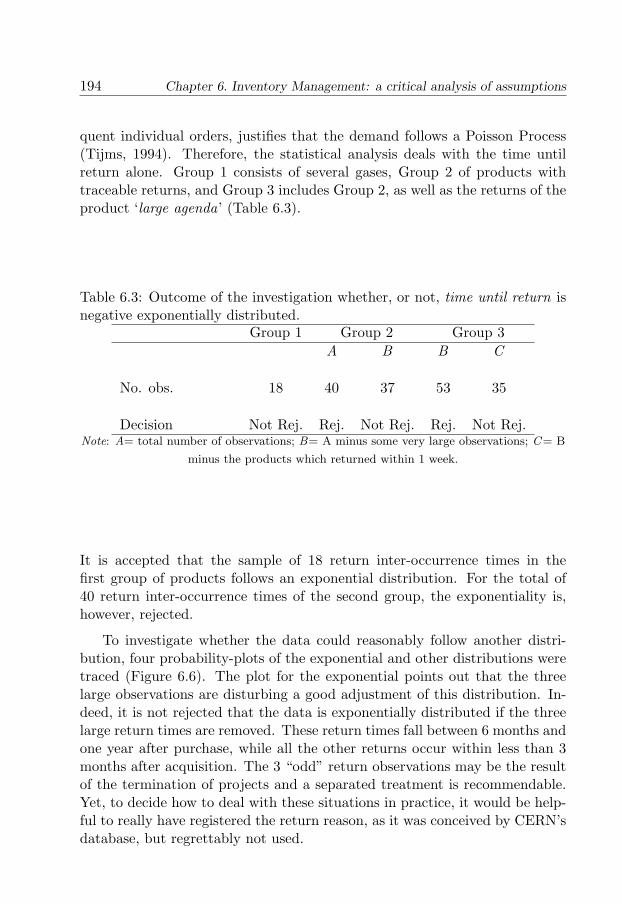
194 Chapter 6. Inventory Management: a critical analysis of assumptions
quent individual orders, justifies that the demand follows a Poisson Process(Tijms, 1994). Therefore, the statistical analysis deals with the time untilreturn alone. Group 1 consists of several gases, Group 2 of products withtraceable returns, and Group 3 includes Group 2, as well as the returns of theproduct ‘large agenda’ (Table 6.3).
Table 6.3: Outcome of the investigation whether, or not, time until return isnegative exponentially distributed.
Group 1 Group 2 Group 3A B B C
No. obs. 18 40 37 53 35
Decision Not Rej. Rej. Not Rej. Rej. Not Rej.Note: A= total number of observations; B= A minus some very large observations; C= B
minus the products which returned within 1 week.
It is accepted that the sample of 18 return inter-occurrence times in thefirst group of products follows an exponential distribution. For the total of40 return inter-occurrence times of the second group, the exponentiality is,however, rejected.
To investigate whether the data could reasonably follow another distri-bution, four probability-plots of the exponential and other distributions weretraced (Figure 6.6). The plot for the exponential points out that the threelarge observations are disturbing a good adjustment of this distribution. In-deed, it is not rejected that the data is exponentially distributed if the threelarge return times are removed. These return times fall between 6 months andone year after purchase, while all the other returns occur within less than 3months after acquisition. The 3 “odd” return observations may be the resultof the termination of projects and a separated treatment is recommendable.Yet, to decide how to deal with these situations in practice, it would be help-ful to really have registered the return reason, as it was conceived by CERN’sdatabase, but regrettably not used.
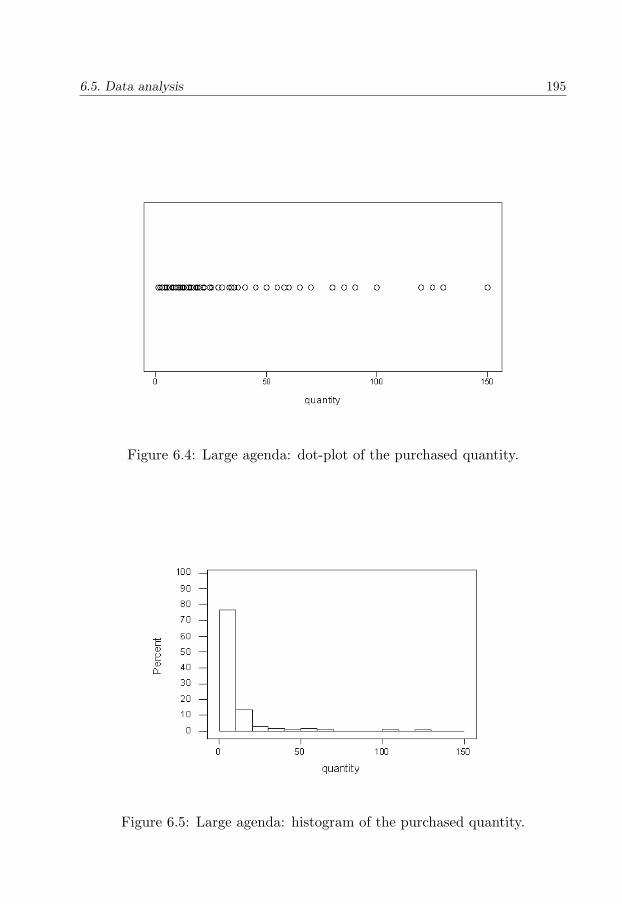
6.5. Data analysis 195
Figure 6.4: Large agenda: dot-plot of the purchased quantity.
Figure 6.5: Large agenda: histogram of the purchased quantity.
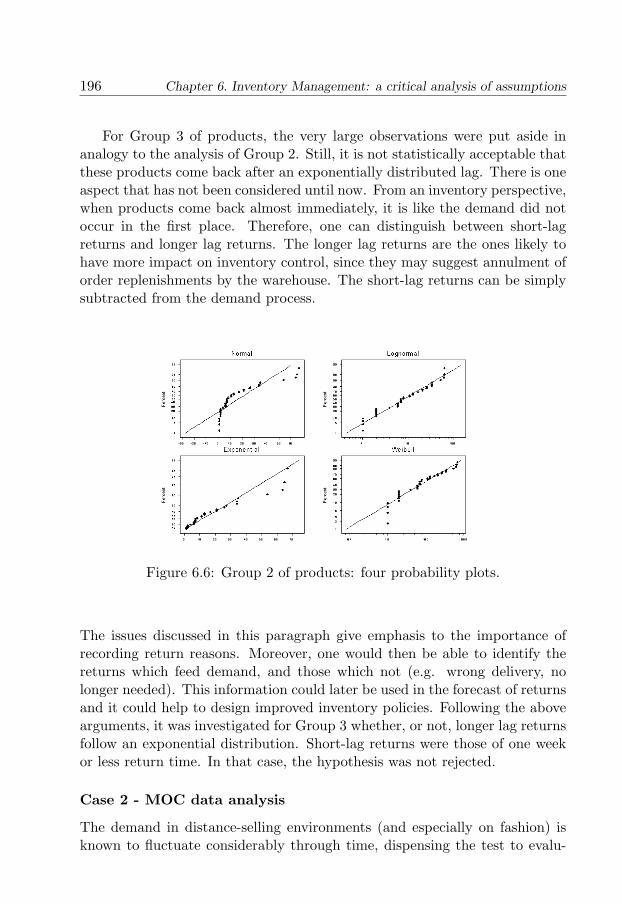
196 Chapter 6. Inventory Management: a critical analysis of assumptions
For Group 3 of products, the very large observations were put aside inanalogy to the analysis of Group 2. Still, it is not statistically acceptable thatthese products come back after an exponentially distributed lag. There is oneaspect that has not been considered until now. From an inventory perspective,when products come back almost immediately, it is like the demand did notoccur in the first place. Therefore, one can distinguish between short-lagreturns and longer lag returns. The longer lag returns are the ones likely tohave more impact on inventory control, since they may suggest annulment oforder replenishments by the warehouse. The short-lag returns can be simplysubtracted from the demand process.
Figure 6.6: Group 2 of products: four probability plots.
The issues discussed in this paragraph give emphasis to the importance ofrecording return reasons. Moreover, one would then be able to identify thereturns which feed demand, and those which not (e.g. wrong delivery, nolonger needed). This information could later be used in the forecast of returnsand it could help to design improved inventory policies. Following the abovearguments, it was investigated for Group 3 whether, or not, longer lag returnsfollow an exponential distribution. Short-lag returns were those of one weekor less return time. In that case, the hypothesis was not rejected.
Case 2 - MOC data analysis
The demand in distance-selling environments (and especially on fashion) isknown to fluctuate considerably through time, dispensing the test to evalu-
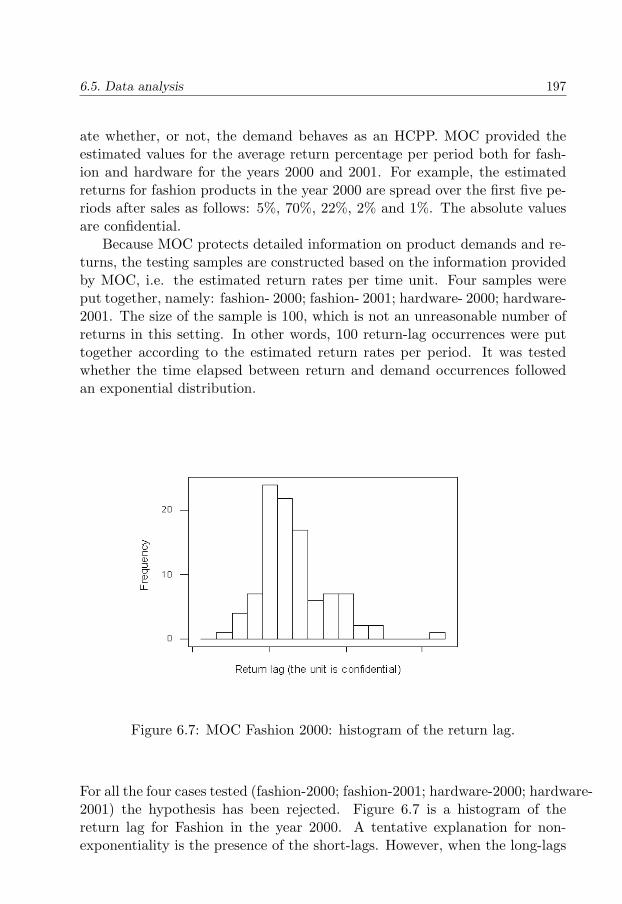
6.5. Data analysis 197
ate whether, or not, the demand behaves as an HCPP. MOC provided theestimated values for the average return percentage per period both for fash-ion and hardware for the years 2000 and 2001. For example, the estimatedreturns for fashion products in the year 2000 are spread over the first five pe-riods after sales as follows: 5%, 70%, 22%, 2% and 1%. The absolute valuesare confidential.
Because MOC protects detailed information on product demands and re-turns, the testing samples are constructed based on the information providedby MOC, i.e. the estimated return rates per time unit. Four samples wereput together, namely: fashion- 2000; fashion- 2001; hardware- 2000; hardware-2001. The size of the sample is 100, which is not an unreasonable number ofreturns in this setting. In other words, 100 return-lag occurrences were puttogether according to the estimated return rates per period. It was testedwhether the time elapsed between return and demand occurrences followedan exponential distribution.
Figure 6.7: MOC Fashion 2000: histogram of the return lag.
For all the four cases tested (fashion-2000; fashion-2001; hardware-2000; hardware-2001) the hypothesis has been rejected. Figure 6.7 is a histogram of thereturn lag for Fashion in the year 2000. A tentative explanation for non-exponentiality is the presence of the short-lags. However, when the long-lags
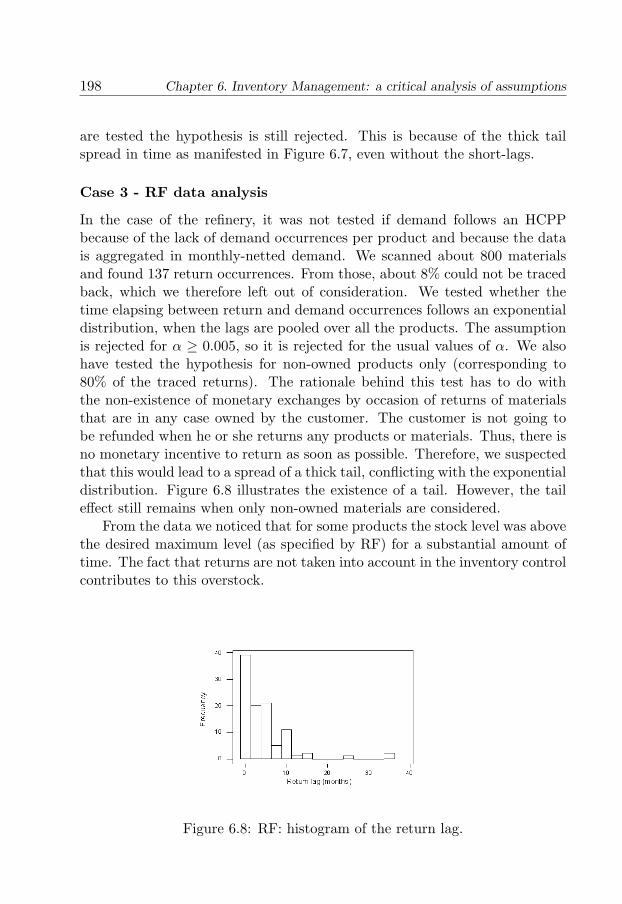
198 Chapter 6. Inventory Management: a critical analysis of assumptions
are tested the hypothesis is still rejected. This is because of the thick tailspread in time as manifested in Figure 6.7, even without the short-lags.
Case 3 - RF data analysis
In the case of the refinery, it was not tested if demand follows an HCPPbecause of the lack of demand occurrences per product and because the datais aggregated in monthly-netted demand. We scanned about 800 materialsand found 137 return occurrences. From those, about 8% could not be tracedback, which we therefore left out of consideration. We tested whether thetime elapsing between return and demand occurrences follows an exponentialdistribution, when the lags are pooled over all the products. The assumptionis rejected for α ≥ 0.005, so it is rejected for the usual values of α. We alsohave tested the hypothesis for non-owned products only (corresponding to80% of the traced returns). The rationale behind this test has to do withthe non-existence of monetary exchanges by occasion of returns of materialsthat are in any case owned by the customer. The customer is not going tobe refunded when he or she returns any products or materials. Thus, there isno monetary incentive to return as soon as possible. Therefore, we suspectedthat this would lead to a spread of a thick tail, conflicting with the exponentialdistribution. Figure 6.8 illustrates the existence of a tail. However, the taileffect still remains when only non-owned materials are considered.
From the data we noticed that for some products the stock level was abovethe desired maximum level (as specified by RF) for a substantial amount oftime. The fact that returns are not taken into account in the inventory controlcontributes to this overstock.
Figure 6.8: RF: histogram of the return lag.
6.6. Summary and conclusions 199
6.6 Summary and conclusions
In this chapter we presented a methodology for the statistical testing of thecommon assumptions in the literature on inventory modelling with productreturns. We proposed statistical tests (see Figure 6.1) to test the followinghypotheses:
• The demand process is a Homogeneous Compound Poisson Process.
• The return process is a Homogeneous Compound Poisson Process.
• The time elapsing between return and demand occurrences follows anegative exponential distribution.
With the developed methodology it is possible to carry out the desiredtesting even with small sample sizes (below 20). Obviously, for extremelysmall sample sizes no statistical test will be able to guarantee much rigor.
We applied the developed methodology to the following three sets of realdata.
Case 1: data from an in-company warehouse with internal returns inSwitzerland (CERN),
Case 2: data from a mail-order company with commercial returns inthe Netherlands (referred to as MOC), and
Case 3: data from an in-company refinery warehouse in the Netherlands(referred to as RF).
We found that for some products the common assumptions on the theo-retical models fit reasonably well. However, we also found products for whichthey do not. Regarding the (non-)validity of the common assumptions, weempirically observed the following.
A) Demand did not always behave as an HCPP due to seasonalityand/or non-stationarity (e.g. agenda and stabilizer gas- CERN).
B) In spite of non-stationary demand, there are products for which wedid not reject that the return process behaves as an HCPP (e.g. largeagenda- CERN). One can explain this by the fact that there are al-ways enough products in the market. Making an analogy with queueing
200 Chapter 6. Inventory Management: a critical analysis of assumptions
systems this means that the server is always busy, so the output flowdepends on the service process rather than the demand process.
C) In some cases we did not reject that the time to return behavesaccording to a negative exponentially distribution (e.g. stabilizer gasand Group 1- CERN). So, for these cases the assumption that the timeto return is negative exponentially distributed appears to hold.
D) There are products for which the time to return did not seem tobehave as an exponential distribution. This is likely caused by a thicktail (e.g. see RF analysis) or due to many short-lag returns (e.g. Fashion2000- MOC).
We employed data on products of in-company warehouses (CERN andRF) with internal returns and a mail-order company with commercial returns.However, we believe that the findings and its implications are transferable toa much larger group of demand-return processes. In the case of equipmentleasing, we conjecture that although the tail of the time to return distributionmay behave as an exponential, the same is unlikely to hold for the short-lagreturns. In maintenance settings, we believe that the validity of assumptionsdepends on whether the maintenance is corrective or preventive. In the firstcase the assumptions are likely to be valid.
6.6.1 Theoretical insights
There are 2 situations to consider.
1. When modelling, we assume independence between demands and re-turns.
- If demand follows a Poisson distribution we have, using standardresults for a M/G/∞ queuing system, that the return process isalso Poisson. If, when modelling, independence between demandsand returns is assumed this means that it is appropriate to assumePoisson process for both the demand and return streams.
- If demand is not a Poisson process, but the product is a fast-mover and the time to return is a negative exponential distribution,then we can use standard results from a G/M/∞ queuing system.Using the high-traffic argument (‘servers’ are always busy), we havethat the return process is Poisson. This implies that the Poissondistribution is a good approximation for the return process, as long
6.6. Summary and conclusions 201
as the product is a fast-mover and the time to return is negativeexponentially distributed.
2. When modelling, we explicitly take into account dependence betweendemands and returns.
In this case, and when the time to return is negative exponentially dis-tributed, one can exploit the memoryless property. If you know at themoment of sale if a product will return or not, the total number of prod-ucts in the market that will return is sufficient to forecast the number ofreturns. Note, however, that in practice this only occurs in very specificsituations. For example, if you not only sell to costumers, but also offerservice contracts to some of them, you know which products will return.Another example for which you know in advance which products returnis when some products are sold while others are leased. A drawback ofthis situation, however, is that the lease time is not likely to be negativeexponentially distributed.
If you do not know in advance if a sold product will return or not, youcannot make use of the memoryless property (see the introduction ofSection 6.3).
6.6.2 Managerial implications
Returns can be said to be a “necessary evil” as they complicate inventorycontrol. Generally, it is important to know how much will come back andwhen. This knowledge can be used to avoid superfluous replenishment ordersand the outdating of products. Therefore, it is important that companiesmonitor returns, investigate return reasons, and estimate (the distributionof) the return lag. Companies may then try to influence the return lag, forinstance to shorten it.
In the context of inventory management and control, we put forward thefollowing suggestions:
• First separate short-lag returns from long-lag returns. Then, proceedto netting of the short-lag returns, i.e. (D
′= D − R), so it is as
returns have never occurred. Especially for long-lag returns: monitorthe return distribution, the return rates and register return reasons.The latter helps to find return patterns that may be useful to find waysof shortening the lag and/or to fine-tune the inventory control policy(e.g. cancellation of replenishments when many products are expectedto return).
202 Chapter 6. Inventory Management: a critical analysis of assumptions
• When investing in product return information (e.g. tracking and trac-ing) and its storage, the following should be taken into account.
If you know in advance which products are going to return, then, accord-ing to the theoretical insights above, one should investigate whether, ornot, the return lag is likely to behave as a negative exponential distribu-tion. If it is, one only has to keep track of the total number of productsin the market that will return to forecast returns.
If you do not know in advance which products are going to return, or ifthe time to return is not negative exponential, you may wish to collectadvanced information on returns.
In a stationary environment investments on tracking and tracing maypay off. However, in a non-stationary environment or if information isnot reliable, an advanced use of information may have lower performancethan a more parsimonious use. Chapter 7 investigates this issue indepth.
It is important to note, however, that in practice there are other consid-erations regarding the investment in information systems then inventorymanagement alone. We mention customer relationship, product respon-sibility and control, and visibility.
From the process of acquiring data and from the data available for this re-search we conclude that detailed data on product and material returns isextremely scarce. When data on returns is found, it is most likely to beaggregated with demand, limiting statistical analysis. Besides this, we antici-pate that many companies are losing opportunities to improve their inventorymanagement due to lack of data on returns (see also Chapter 7).
6.6.3 Research needs
This chapter presented the first empirical analysis regarding the validity ofcommon assumptions in the literature on inventory management with productreturns. The data analysis only covered some specific situations and moreanalysis is needed to generalize the results.
We have used several real examples to verify whether the time to returnbehaves as a negative exponential. For some instances the hypothesis wasaccepted, for others rejected. In some situations the impact of using thewrong assumptions may be small, for others they may be large. Research isneeded to assess this impact. Also, for the cases for which the impact is large,models need to break with the traditional assumptions in the literature oninventory modelling with returns.

6.6. Summary and conclusions 203
Inventories for seasonal products with returns are very difficult to manage.Especially at the end of the season it is important to consider the productreturns, as the product’s value drops rapidly at the end of the season. Thisshould be considered in research on inventory modelling with product returns.Anyway, researchers can be more explicit about the situations in which theirassumptions hold or not.

Chapter 7
Inventory Management withproduct returns: the value ofinformation
In any decision situation,the amount of relevant information availableis inversely proportional to the importance of the decision.
(Cooke’s Law), Paul Dickson
7.1 Introduction
Products and packaging return into the supply chain for a diversity of rea-sons (see Chapter 2). For instance, beverage containers are returned by theconsumer to the retailer against reimbursement, single-use photo cameras areturned in for the film to be developed, and now millions of products pur-chased through mail-order-companies, e-tailers and other distant sellers, arebeing returned every day.
There is a lot of money involved with the handling of product returns(Rogers and Tibben-Lembke, 1999). One of the difficulties in handling re-turns efficiently is that return flows are often characterized by a considerableuncertainty essentially regarding time and quantity. If one could exactly knowhow much is going to be returned and when, one would certainly benefit fromincorporating this perfect information a priori in the management of produc-tion, inventory, and distribution. In many cases this is far from feasible (see
205
206Chapter 7. Inventory Management with product returns: the value of information
Trebilcock, 2002). Nevertheless, one may attempt to forecast the timing andthe amount of product returns. To do so, one has to hypothesize about thereturn flow properties based on historic demand and return data.
There are not many papers that investigate the impact of information oninventory management with product returns. The ones that do so assumeknown return probabilities or consider specific cases where the most-informedmethod leads to the best forecast. However, in environments where data isscarce or unreliable, or in environments that are volatile, information maybe misleading. This study reports on the impact that such (mis)informationhas on inventory management. This chapter identifies situations in whichthe most informed method does not necessarily lead to the best performance.Furthermore, the impact on inventory related costs of having inaccurate es-timates of the time-to-return distribution is investigated for a wide range ofparameters. In addition, the implications for the practice of inventory man-agement with returns will be discussed. This work has been reported in DeBrito and Van der Laan (2003).
The remainder of the chapter is structured as follows. First, Section 7.2illustrates that estimates of the return rate can be massively erroneous inpractice. Next Section 7.3 reviews the literature on the topic. SubsequentlySection 7.4 elaborates on procedures to estimate the net demand. By means ofan exact analysis, Section 7.5 identifies situations in which more informationdoes not necessarily lead to better performance. Section 7.6 then presentsa simulation study to quantify the impact of misinformation with respectto inventory related costs. In Section 7.7, the managerial implications arediscussed and Section 7.8 concludes by giving recommendations for futureresearch.
7.2 (Mis)information in practice
This chapter reports on the impact of (mis)information in an inventory systemwith product returns. Misinformation means here that the properties weassume for the future return flow do not correspond to the actual properties ofthe future return flow. Further attention is paid next on how misinformationcan occur in a given system.
Figure 7.1 illustrates how the “information” arrives to the decision-maker.A tool transforms data into “information” (e.g. system parameters), withwhich the decision-maker controls the system. On the one hand, data may beinsufficient, abundant, ambiguous or conflicting (see Zimmerman, 1999) caus-ing misinformation as input. On the other hand, the tool may be imperfectcreating some sort of distortion. The impact of misinformation on inventory
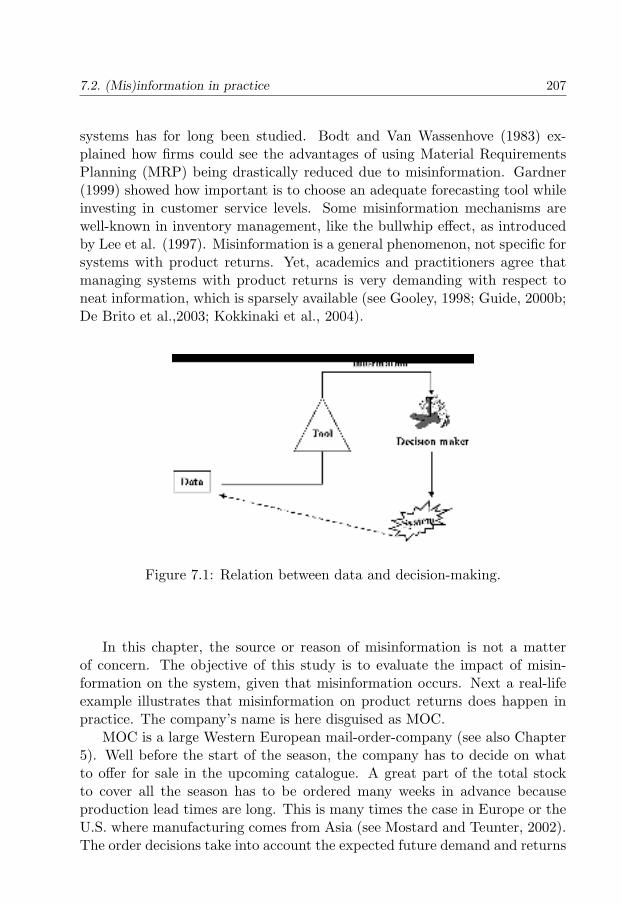
7.2. (Mis)information in practice 207
systems has for long been studied. Bodt and Van Wassenhove (1983) ex-plained how firms could see the advantages of using Material RequirementsPlanning (MRP) being drastically reduced due to misinformation. Gardner(1999) showed how important is to choose an adequate forecasting tool whileinvesting in customer service levels. Some misinformation mechanisms arewell-known in inventory management, like the bullwhip effect, as introducedby Lee et al. (1997). Misinformation is a general phenomenon, not specific forsystems with product returns. Yet, academics and practitioners agree thatmanaging systems with product returns is very demanding with respect toneat information, which is sparsely available (see Gooley, 1998; Guide, 2000b;De Brito et al.,2003; Kokkinaki et al., 2004).
Figure 7.1: Relation between data and decision-making.
In this chapter, the source or reason of misinformation is not a matterof concern. The objective of this study is to evaluate the impact of misin-formation on the system, given that misinformation occurs. Next a real-lifeexample illustrates that misinformation on product returns does happen inpractice. The company’s name is here disguised as MOC.
MOC is a large Western European mail-order-company (see also Chapter5). Well before the start of the season, the company has to decide on whatto offer for sale in the upcoming catalogue. A great part of the total stockto cover all the season has to be ordered many weeks in advance becauseproduction lead times are long. This is many times the case in Europe or theU.S. where manufacturing comes from Asia (see Mostard and Teunter, 2002).The order decisions take into account the expected future demand and returns
208Chapter 7. Inventory Management with product returns: the value of information
for each line of products. Since there is however no data available on the salesof the coming season, the forecast is not much more than a rough estimate.In particular, a mail-order-company in the Netherlands uses estimates thaton average are more than 20% off the real return rate and sometimes evenmore than 80%. The above illustrates that large mis-estimation of the returnrate does occur in practice. This chapter analyzes its impact on inventorymanagement.
7.3 Literature review
The literature dealing with product returns has been growing fast in thelast years. This literature falls in the general umbrella of closed-loop supplychain management. For contextual contents, see Rogers and Tibben-Lembke(1999); Guide and Van Wassenhove (2003); Dekker et al. (2004). InventoryManagement has received chief attention from the beginning until now, whichhas brought about a richness of studies (see e.g. the following recent ones:Van der Laan et al., 1999; Inderfurth et al., 2001; Fleischmann et al., 2002).In spite of these and many other contributions, there are few articles thatsimultaneously consider the forecasting of product returns, inventory man-agement and information issues. Below follows a review on specific literaturecontributing to close the aforementioned gap.
Goh & Varaprasad (1986) developed a methodology to compute life-cycleparameters of returned containers by employing data on demand and returns.The authors claim that a careful estimation of these parameters aids to effec-tive inventory management. They apply their method to data on soft drinksas Coca-Cola and Fanta from the Malaysia and Singapore markets. Theapproach requires a time series of aggregated demand and another one of ag-gregated return data. They used a 50-point time series of monthly data. Theprecision of the method depends on how accurate the estimation of the returndistribution is. This estimation has the Box-Jenkins time series techniquesas basis. The authors call the attention of the reader to the fact that a dataset with less than 50 points is too short to employ the methodology. Largetime series should also be avoided. Therefore, they recommend a time seriesof 50 points, or a 4-year period of data coming from a stable market environ-ment. Our research contributes to contrasting situations: with imperfect ormisleading data.
Kelle & Silver (1989) proposed four forecasting procedures of net demandduring lead time in the case of reusable containers. Every procedure has adifferent level of information requirement. The least-informed method usesthe expectation and the variance of the net demand together with the prob-
7.4. Forecasting methods 209
ability of return. The most-informed one calls for individual tracking andtracing of containers. The authors evaluate the forecasting methods takingthe most-informed method as a benchmark. The analysis, however, appliesonly to the case of perfect information on the return parameters. This chapteremploys the methods proposed by Kelle and Silver (1989) but it elaborateson the potential impact of (mis)information.
Toktay et al. (2000) consider the real case of new circuit boards for Ko-dak’s single use remanufactured camera. The goal is to have an ordering pol-icy that minimizes the procurement, inventory holding and lost sales costs.A six-node closed queueing network is employed to represent Kodak’s sup-ply chain. Accordingly, the returns of cameras depend on past sales by areturn probability and an exponential time lag distribution. Some of the pro-cedures of Kelle and Silver are used to predict the unobservable inventoryat the customer-use network node. The authors compare several forecastingmethodologies with different levels of information. This chapter provides anexact and more general analysis of the impact of (mis)information. Further-more, the four methods of Kelle and Silver are compared numerically for awide range of parameter values with respect to misinformation. Therefore,besides an intra-method comparison, here an inter-method analysis is alsopresented.
Marx-Gomez et al. (2002) consider a case of photocopiers that may re-turn to the producer after being used. The authors put forward a methodto forecast the number and time of returned photocopiers. Firstly, data isgenerated according to two scenarios: successful vs. not so successful returnincentives. These scenarios, together with expert knowledge, constitute thebasis for developing a set of forecasting rules. The expert evaluates factors,such as demand and life cycle parameters. An extended approach of themodel is suggested by allowing a follow-up period to self-learn the rules. Thisneuro-fuzzy process calls for data on demands and returns. Besides this, oneshould notice that the method of Marx-Gomez et al. depends on a prioriknowledge on product returns, which have been acquired by the producer.
Overall one can conclude that the proposed procedures are very demand-ing with respect to reliable data. This chapter takes the more realistic per-spective of misinformation and analyzes its impact.
7.4 Forecasting methods
The main notation used in this chapter is as in Table 7.1.
Consider a single product, single echelon, periodic review inventory sys-
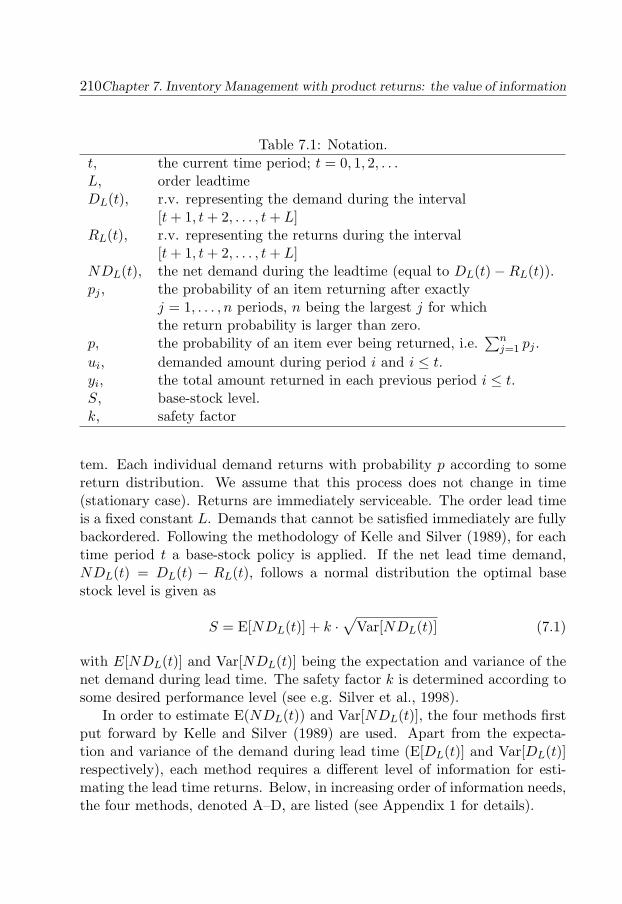
210Chapter 7. Inventory Management with product returns: the value of information
Table 7.1: Notation.t, the current time period; t = 0, 1, 2, . . .L, order leadtimeDL(t), r.v. representing the demand during the interval
[t + 1, t + 2, . . . , t + L]RL(t), r.v. representing the returns during the interval
[t + 1, t + 2, . . . , t + L]NDL(t), the net demand during the leadtime (equal to DL(t)−RL(t)).pj , the probability of an item returning after exactly
j = 1, . . . , n periods, n being the largest j for whichthe return probability is larger than zero.
p, the probability of an item ever being returned, i.e.∑n
j=1 pj .ui, demanded amount during period i and i ≤ t.yi, the total amount returned in each previous period i ≤ t.S, base-stock level.k, safety factor
tem. Each individual demand returns with probability p according to somereturn distribution. We assume that this process does not change in time(stationary case). Returns are immediately serviceable. The order lead timeis a fixed constant L. Demands that cannot be satisfied immediately are fullybackordered. Following the methodology of Kelle and Silver (1989), for eachtime period t a base-stock policy is applied. If the net lead time demand,NDL(t) = DL(t) − RL(t), follows a normal distribution the optimal basestock level is given as
S = E[NDL(t)] + k ·√
Var[NDL(t)] (7.1)
with E[NDL(t)] and Var[NDL(t)] being the expectation and variance of thenet demand during lead time. The safety factor k is determined according tosome desired performance level (see e.g. Silver et al., 1998).
In order to estimate E(NDL(t)) and Var[NDL(t)], the four methods firstput forward by Kelle and Silver (1989) are used. Apart from the expecta-tion and variance of the demand during lead time (E[DL(t)] and Var[DL(t)]respectively), each method requires a different level of information for esti-mating the lead time returns. Below, in increasing order of information needs,the four methods, denoted A–D, are listed (see Appendix 1 for details).
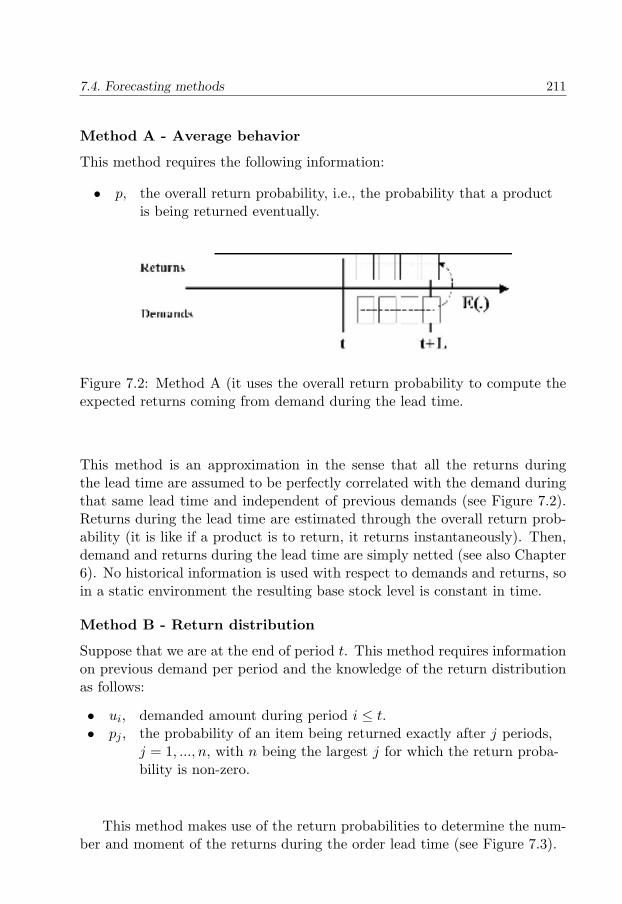
7.4. Forecasting methods 211
Method A - Average behavior
This method requires the following information:
• p, the overall return probability, i.e., the probability that a productis being returned eventually.
Figure 7.2: Method A (it uses the overall return probability to compute theexpected returns coming from demand during the lead time.
This method is an approximation in the sense that all the returns duringthe lead time are assumed to be perfectly correlated with the demand duringthat same lead time and independent of previous demands (see Figure 7.2).Returns during the lead time are estimated through the overall return prob-ability (it is like if a product is to return, it returns instantaneously). Then,demand and returns during the lead time are simply netted (see also Chapter6). No historical information is used with respect to demands and returns, soin a static environment the resulting base stock level is constant in time.
Method B - Return distribution
Suppose that we are at the end of period t. This method requires informationon previous demand per period and the knowledge of the return distributionas follows:
• ui, demanded amount during period i ≤ t.• pj , the probability of an item being returned exactly after j periods,
j = 1, ..., n, with n being the largest j for which the return proba-bility is non-zero.
This method makes use of the return probabilities to determine the num-ber and moment of the returns during the order lead time (see Figure 7.3).
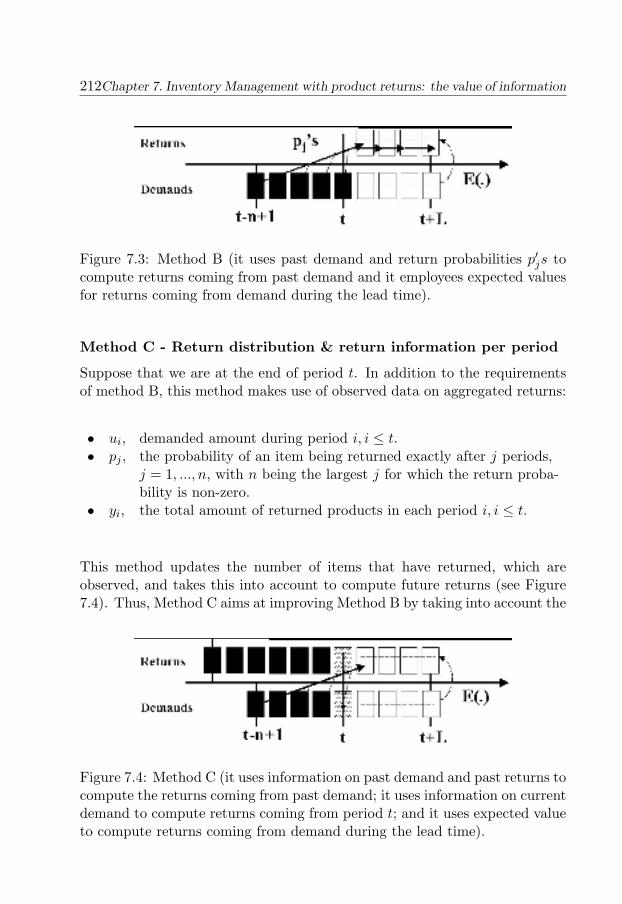
212Chapter 7. Inventory Management with product returns: the value of information
Figure 7.3: Method B (it uses past demand and return probabilities p′js tocompute returns coming from past demand and it employees expected valuesfor returns coming from demand during the lead time).
Method C - Return distribution & return information per period
Suppose that we are at the end of period t. In addition to the requirementsof method B, this method makes use of observed data on aggregated returns:
• ui, demanded amount during period i, i ≤ t.• pj , the probability of an item being returned exactly after j periods,
j = 1, ..., n, with n being the largest j for which the return proba-bility is non-zero.
• yi, the total amount of returned products in each period i, i ≤ t.
This method updates the number of items that have returned, which areobserved, and takes this into account to compute future returns (see Figure7.4). Thus, Method C aims at improving Method B by taking into account the
Figure 7.4: Method C (it uses information on past demand and past returns tocompute the returns coming from past demand; it uses information on currentdemand to compute returns coming from period t; and it uses expected valueto compute returns coming from demand during the lead time).
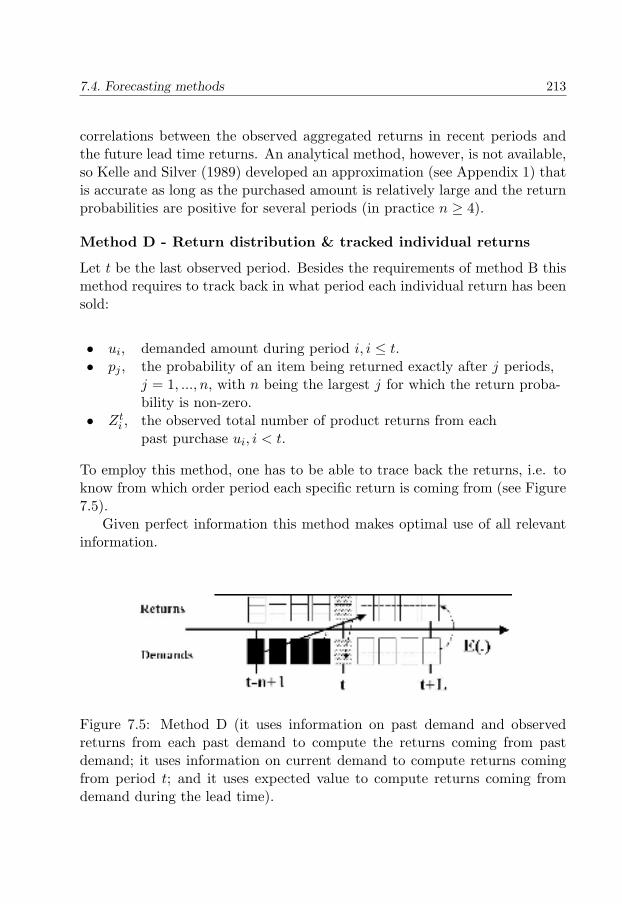
7.4. Forecasting methods 213
correlations between the observed aggregated returns in recent periods andthe future lead time returns. An analytical method, however, is not available,so Kelle and Silver (1989) developed an approximation (see Appendix 1) thatis accurate as long as the purchased amount is relatively large and the returnprobabilities are positive for several periods (in practice n ≥ 4).
Method D - Return distribution & tracked individual returns
Let t be the last observed period. Besides the requirements of method B thismethod requires to track back in what period each individual return has beensold:
• ui, demanded amount during period i, i ≤ t.• pj , the probability of an item being returned exactly after j periods,
j = 1, ..., n, with n being the largest j for which the return proba-bility is non-zero.
• Zti , the observed total number of product returns from each
past purchase ui, i < t.
To employ this method, one has to be able to trace back the returns, i.e. toknow from which order period each specific return is coming from (see Figure7.5).
Given perfect information this method makes optimal use of all relevantinformation.
Figure 7.5: Method D (it uses information on past demand and observedreturns from each past demand to compute the returns coming from pastdemand; it uses information on current demand to compute returns comingfrom period t; and it uses expected value to compute returns coming fromdemand during the lead time).
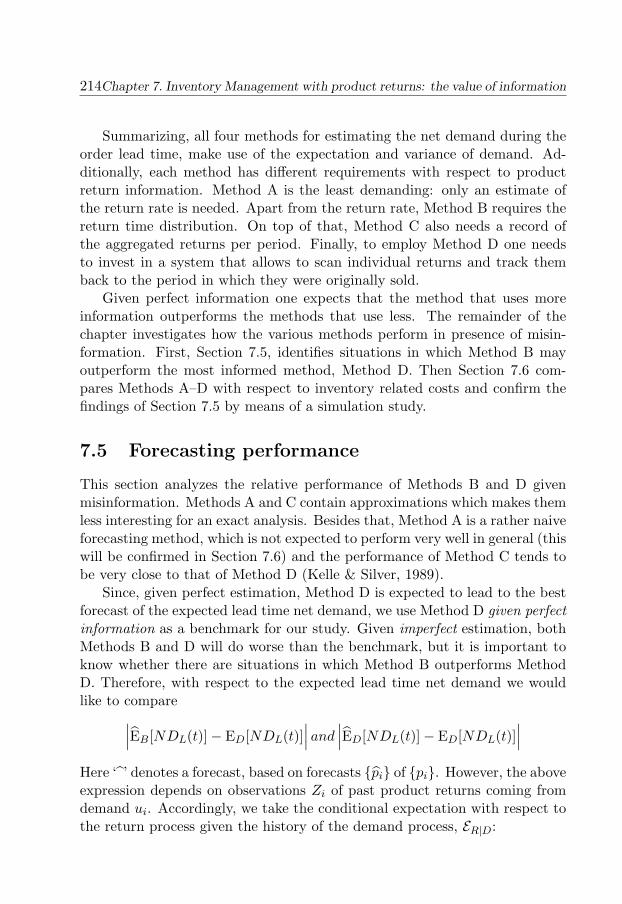
214Chapter 7. Inventory Management with product returns: the value of information
Summarizing, all four methods for estimating the net demand during theorder lead time, make use of the expectation and variance of demand. Ad-ditionally, each method has different requirements with respect to productreturn information. Method A is the least demanding: only an estimate ofthe return rate is needed. Apart from the return rate, Method B requires thereturn time distribution. On top of that, Method C also needs a record ofthe aggregated returns per period. Finally, to employ Method D one needsto invest in a system that allows to scan individual returns and track themback to the period in which they were originally sold.
Given perfect information one expects that the method that uses moreinformation outperforms the methods that use less. The remainder of thechapter investigates how the various methods perform in presence of misin-formation. First, Section 7.5, identifies situations in which Method B mayoutperform the most informed method, Method D. Then Section 7.6 com-pares Methods A–D with respect to inventory related costs and confirm thefindings of Section 7.5 by means of a simulation study.
7.5 Forecasting performance
This section analyzes the relative performance of Methods B and D givenmisinformation. Methods A and C contain approximations which makes themless interesting for an exact analysis. Besides that, Method A is a rather naiveforecasting method, which is not expected to perform very well in general (thiswill be confirmed in Section 7.6) and the performance of Method C tends tobe very close to that of Method D (Kelle & Silver, 1989).
Since, given perfect estimation, Method D is expected to lead to the bestforecast of the expected lead time net demand, we use Method D given perfectinformation as a benchmark for our study. Given imperfect estimation, bothMethods B and D will do worse than the benchmark, but it is important toknow whether there are situations in which Method B outperforms MethodD. Therefore, with respect to the expected lead time net demand we wouldlike to compare∣∣∣EB[NDL(t)]− ED[NDL(t)]
∣∣∣ and∣∣∣ED[NDL(t)]− ED[NDL(t)]
∣∣∣Here ‘ ’ denotes a forecast, based on forecasts {pi} of {pi}. However, the aboveexpression depends on observations Zi of past product returns coming fromdemand ui. Accordingly, we take the conditional expectation with respect tothe return process given the history of the demand process, ER|D:
7.5. Forecasting performance 215
F{E} = ER|D
{∣∣∣EB[NDL(t)]− ED[NDL(t)]∣∣∣− ∣∣∣ED[NDL(t)]− ED[NDL(t)]
∣∣∣}(7.2)
Note that if F{E} < 0 then, on average, Method B outperforms Method Dwith respect to the expected net leadtime demand and vice versa if F{E} > 0.Similarly, the performance measure with respect to the variance of the leadtime net demand is
F{V } = ER|D
{∣∣∣V (< t)B − V (< t)D
∣∣∣− ∣∣∣V (< t)D − V (< t)D
∣∣∣} (7.3)
To make the analysis more readable we define πi =∑t−i
j=1 pj
and we write ‘∑
’ for ‘∑t−1
i=t−n+1’. In section 7.5.1 we analyze the expectationof the net demand during leadtime and in section 7.5.2 its variance.
7.5.1 Analysis regarding the expectation of lead timenet demand
Define
E{BD} = EB[NDL(t)]− ED[NDL(t)],
E{DD} = ED[NDL(t)]− ED[NDL(t)]
Obviously, E{BD} = 0 implies that, given misinformation, Method B performsat least as good as Method D and E{DD} = 0 implies that, given misinforma-tion, Method D performs as good as the benchmark and therefore performs atleast Method B will not have a better performance. Conditioning on the signsof E{BD} and E{DD} we have 4 remaining cases, EXP1–EXP4, to analyze:
Case EXP1: E{BD} > 0 and E{DD} > 0
Case EXP2: E{BD} < 0 and E{DD} < 0
Case EXP3: E{BD} < 0 and E{DD} > 0
Case EXP4: E{BD} > 0 and E{DD} < 0
From the analysis of EXP1–EXP4 in Appendix 2 we conclude that, on av-erage, Method B results in a better forecast of the expected lead time netdemand in the case we consistently under- or overestimate the return proba-bilities pj′s.
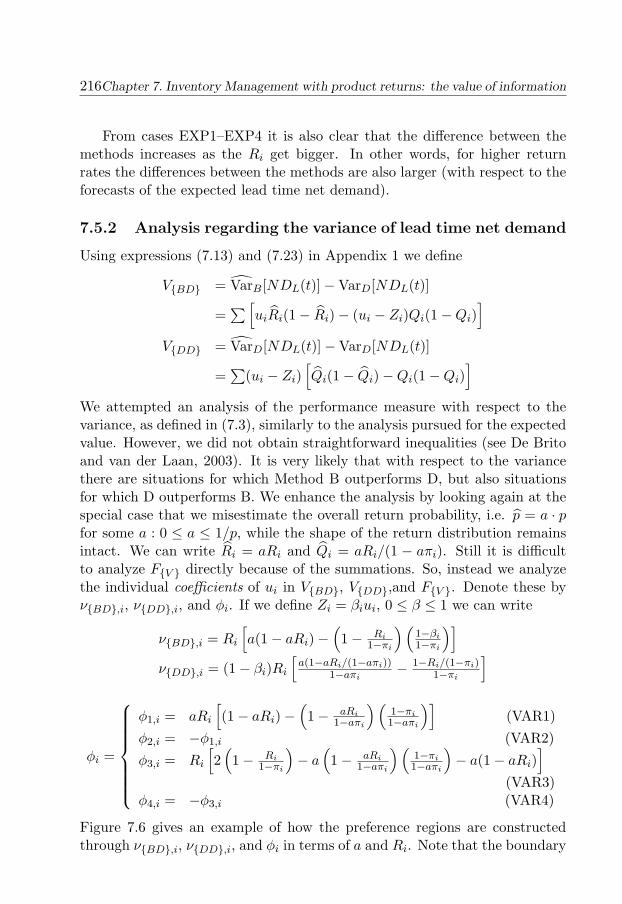
216Chapter 7. Inventory Management with product returns: the value of information
From cases EXP1–EXP4 it is also clear that the difference between themethods increases as the Ri get bigger. In other words, for higher returnrates the differences between the methods are also larger (with respect to theforecasts of the expected lead time net demand).
7.5.2 Analysis regarding the variance of lead time net demand
Using expressions (7.13) and (7.23) in Appendix 1 we define
V{BD} = VarB[NDL(t)]−VarD[NDL(t)]
=∑[
uiRi(1− Ri)− (ui − Zi)Qi(1−Qi)]
V{DD} = VarD[NDL(t)]−VarD[NDL(t)]
=∑
(ui − Zi)[Qi(1− Qi)−Qi(1−Qi)
]We attempted an analysis of the performance measure with respect to thevariance, as defined in (7.3), similarly to the analysis pursued for the expectedvalue. However, we did not obtain straightforward inequalities (see De Britoand van der Laan, 2003). It is very likely that with respect to the variancethere are situations for which Method B outperforms D, but also situationsfor which D outperforms B. We enhance the analysis by looking again at thespecial case that we misestimate the overall return probability, i.e. p = a · pfor some a : 0 ≤ a ≤ 1/p, while the shape of the return distribution remainsintact. We can write Ri = aRi and Qi = aRi/(1 − aπi). Still it is difficultto analyze F{V } directly because of the summations. So, instead we analyzethe individual coefficients of ui in V{BD}, V{DD},and F{V }. Denote these byν{BD},i, ν{DD},i, and φi. If we define Zi = βiui, 0 ≤ β ≤ 1 we can write
ν{BD},i = Ri
[a(1− aRi)−
(1− Ri
1−πi
) (1−βi
1−πi
)]ν{DD},i = (1− βi)Ri
[a(1−aRi/(1−aπi))
1−aπi− 1−Ri/(1−πi)
1−πi
]
φi =
φ1,i = aRi
[(1− aRi)−
(1− aRi
1−aπi
) (1−πi1−aπi
)](VAR1)
φ2,i = −φ1,i (VAR2)φ3,i = Ri
[2
(1− Ri
1−πi
)− a
(1− aRi
1−aπi
) (1−πi1−aπi
)− a(1− aRi)
](VAR3)
φ4,i = −φ3,i (VAR4)
Figure 7.6 gives an example of how the preference regions are constructedthrough ν{BD},i, ν{DD},i, and φi in terms of a and Ri. Note that the boundary
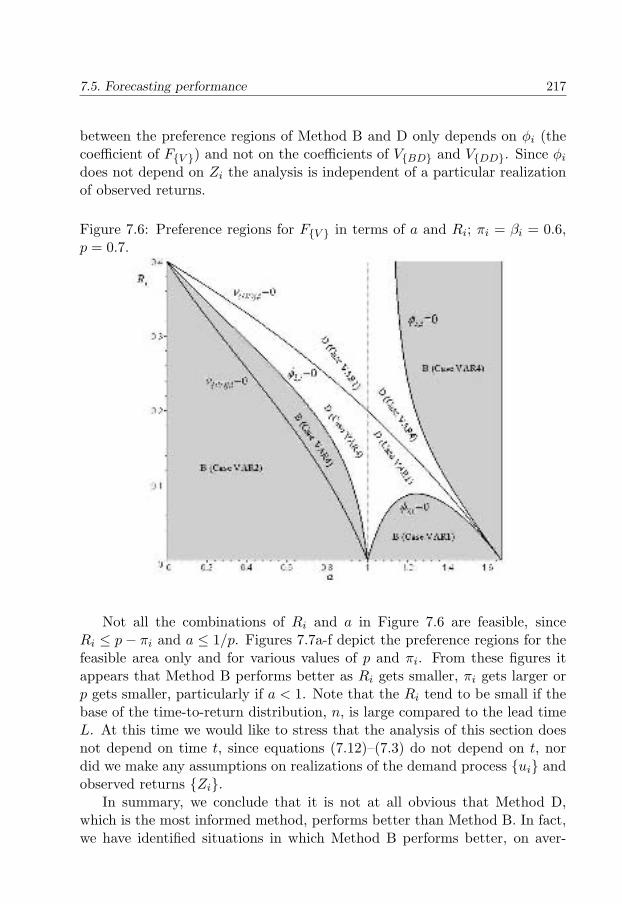
7.5. Forecasting performance 217
between the preference regions of Method B and D only depends on φi (thecoefficient of F{V }) and not on the coefficients of V{BD} and V{DD}. Since φi
does not depend on Zi the analysis is independent of a particular realizationof observed returns.
Figure 7.6: Preference regions for F{V } in terms of a and Ri; πi = βi = 0.6,p = 0.7.
Not all the combinations of Ri and a in Figure 7.6 are feasible, sinceRi ≤ p− πi and a ≤ 1/p. Figures 7.7a-f depict the preference regions for thefeasible area only and for various values of p and πi. From these figures itappears that Method B performs better as Ri gets smaller, πi gets larger orp gets smaller, particularly if a < 1. Note that the Ri tend to be small if thebase of the time-to-return distribution, n, is large compared to the lead timeL. At this time we would like to stress that the analysis of this section doesnot depend on time t, since equations (7.12)–(7.3) do not depend on t, nordid we make any assumptions on realizations of the demand process {ui} andobserved returns {Zi}.
In summary, we conclude that it is not at all obvious that Method D,which is the most informed method, performs better than Method B. In fact,we have identified situations in which Method B performs better, on aver-
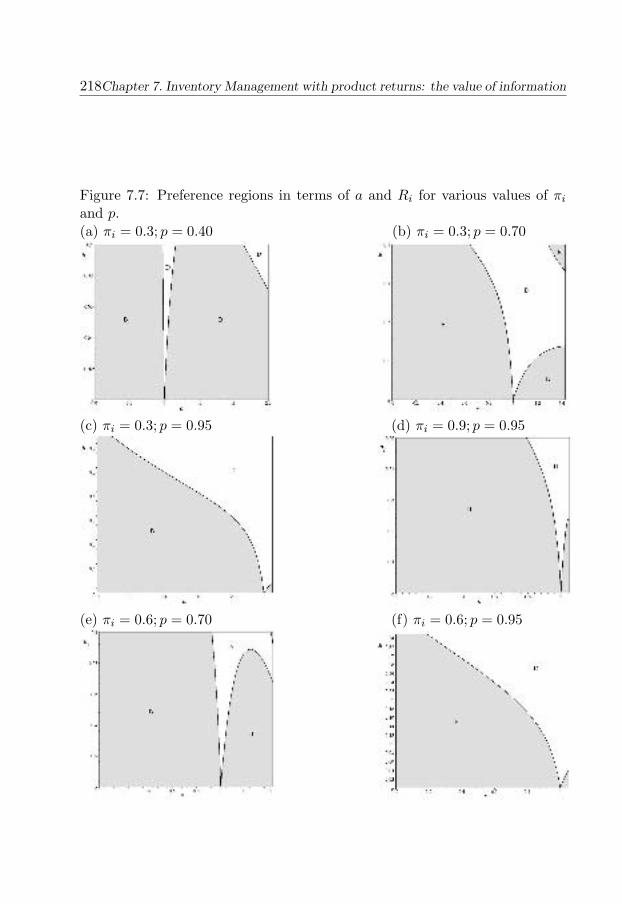
218Chapter 7. Inventory Management with product returns: the value of information
Figure 7.7: Preference regions in terms of a and Ri for various values of πi
and p.(a) πi = 0.3; p = 0.40 (b) πi = 0.3; p = 0.70
(c) πi = 0.3; p = 0.95 (d) πi = 0.9; p = 0.95
(e) πi = 0.6; p = 0.70 (f) πi = 0.6; p = 0.95
7.6. Cost performance 219
age, with respect to the expectation and variance of lead time net demand.In particular, when all return probabilities are underestimated or all returnprobabilities are overestimated Method B has opportunities to outperformMethod D. In the next section we will quantify the impact of misinformationwith respect to costs.
7.6 Cost performance
7.6.1 Experimental design
In order to quantify the impact of misinformation on inventory related costperformance we conducted a simulation study. We consider holding and back-order costs as described later. The experiments are based on the inventorysystem that was introduced in Section 7.4 and are conducted in the follow-ing manner. Each period t we draw the cumulative demand D(t) from anormal distribution with mean µD, variance σ2
D, and coefficient of variationcvD = σD
µD(values are rounded to integers; negative numbers are treated as
zero). For each individual item of this cumulative demand we determine thetime to return based on the pre-specified return probabilities, {pj}. Eachperiod, estimates of the expectation and variance of the net demand duringlead time are computed according to one of methods A–D. These estimatesare subsequently used to compute the base stock level, S. At the end of eachperiod, overstocks are charged with a holding cost $ h per item, per period,whereas stockouts are penalized with $ b per occurrence. At the end of eachsimulation experiment we calculate the total average cost per period as thetotal average holding plus backorder costs per period. Note that all methodsuse estimates, {pj}, of the real return probabilities, {pj}, since the latter arenot known. The same holds for the overall return probability, p, which isestimated as p.
Each simulation experiment consists of at least ten simulation runs of 5.000periods, preceded by a warm-up run of the same length. The simulation stopsas soon as the relative error in the total average costs is less than 1%. In orderto make a better comparison among simulation experiments we make use ofcommon random numbers. Please note that in this study all parameters areassumed to be constant over time.
Based on the estimates E[NDL(t)] and Var[NDL(t)] of the mean andvariance of net lead time demand the base stock level S is computed as in(7.1). Assuming that the net demand during lead time is normally distributed,the cost optimal value of the safety factor, k, satisfies G(k) = 1 − h
b , whereG(.) is the standard normal distribution (see Silver et al., 1998).
220Chapter 7. Inventory Management with product returns: the value of information
The time-to-return distribution {pj} consists of two components: Theoverall return probability p and the conditional time-to-return probabilities{pj} given that the item returns. The (unconditional) time-to-return prob-abilities then are defined as pj = p · pj , j ∈ [0, 1, . . . , n]. In the simulationexperiments we use two conditional time-to-return distributions. The first oneis a geometric distribution with conditional expected return time T = 1/q,i.e. pj = q(1 − q)j−1, j = 1, 2, . . . ,∞. The second is a discrete uniform dis-tribution with conditional expected return time T = (n + 1)/2, i.e. pj = 1/n,j = 1, 2, . . . , n. Please note that in this study all parameters are constant intime.
7.6.2 Numerical study
In the case of perfect information, i.e. p = p and pj = pj , method D willoutperform all other methods since it is using all of the available information ina correct way. In order to investigate the effect of misinformation, we considertwo types of errors in the parameter estimates. The first is a misspecificationof the overall return probability, p, while the expected return time is preserved.The second is a misspecification of the conditional expected time-to-return, T .This affects the shape of the time-to-return distribution, but the estimatedoverall return probability is preserved. For example, suppose that the realtime to return distribution is given by {p1, p2, p3} = {0.2, 0.1, 0.2}. Thenan estimate of {p1, p2, p3} = {0.1, 0.05, 0.1} would have the same conditionalexpected time-to-return (2.0), but a 50% lower estimated return probability.An estimate of {p1, p2, p3} = {0.3, 0.1, 0.1} would have the same overall returnprobability (0.5), but a lower conditional expected time-to-return.
For numerical comparisons we define the relative difference of some methodm with respect to method D as follows:
relative difference =costs method m− costs method D
costs method D× 100%
Perfect information
Comparing the four methods in the case of perfect information (Tables 7.2–7.3) we observe here that method D is indeed superior to the other methods,although the differences with respect to methods B and C are not significantfor p ≤ 0.8 (less than 1 percent). The performance of Method A is extremelypoor. It uses the assumption that all lead time returns are correlated with thelead time demands. This causes a systematic underestimation of the variancein the lead time net demand, especially for high return rates and large lead
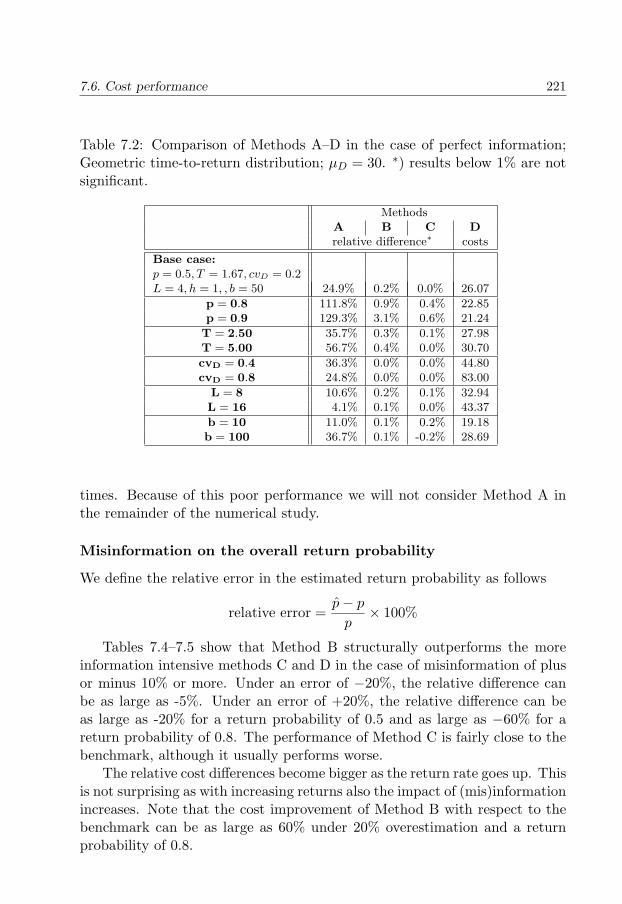
7.6. Cost performance 221
Table 7.2: Comparison of Methods A–D in the case of perfect information;Geometric time-to-return distribution; µD = 30. ∗) results below 1% are notsignificant.
MethodsA B C Drelative difference∗ costs
Base case:p = 0.5, T = 1.67, cvD = 0.2L = 4, h = 1, , b = 50 24.9% 0.2% 0.0% 26.07
p = 0.8 111.8% 0.9% 0.4% 22.85p = 0.9 129.3% 3.1% 0.6% 21.24
T = 2.50 35.7% 0.3% 0.1% 27.98T = 5.00 56.7% 0.4% 0.0% 30.70
cvD = 0.4 36.3% 0.0% 0.0% 44.80cvD = 0.8 24.8% 0.0% 0.0% 83.00
L = 8 10.6% 0.2% 0.1% 32.94L = 16 4.1% 0.1% 0.0% 43.37
b = 10 11.0% 0.1% 0.2% 19.18b = 100 36.7% 0.1% -0.2% 28.69
times. Because of this poor performance we will not consider Method A inthe remainder of the numerical study.
Misinformation on the overall return probability
We define the relative error in the estimated return probability as follows
relative error =p− p
p× 100%
Tables 7.4–7.5 show that Method B structurally outperforms the moreinformation intensive methods C and D in the case of misinformation of plusor minus 10% or more. Under an error of −20%, the relative difference canbe as large as -5%. Under an error of +20%, the relative difference can beas large as -20% for a return probability of 0.5 and as large as −60% for areturn probability of 0.8. The performance of Method C is fairly close to thebenchmark, although it usually performs worse.
The relative cost differences become bigger as the return rate goes up. Thisis not surprising as with increasing returns also the impact of (mis)informationincreases. Note that the cost improvement of Method B with respect to thebenchmark can be as large as 60% under 20% overestimation and a returnprobability of 0.8.

222Chapter 7. Inventory Management with product returns: the value of information
Table 7.3: Comparison of Methods A–D in the case of perfect information;Uniform time-to-return distribution; µD = 30. ∗) results below 1% are notsignificant.
MethodsA B C Drelative difference∗ costs
Base case:p = 0.5, T = 2.50, cvD = 0.2
L = 4, h = 1, b = 50 44.9% 0.3% 0.2% 28.59
p = 0.8 171.4% 2.4% 1.1% 26.23p = 0.9 181.4% 4.3% 1.8% 24.83
n = 4.50 59.6% 0.7% 0.3% 31.14n = 8.50 65.0% 0.3% 0.1% 32.68
cvD = 0.4 65.0% 0.2% 0.1% 50.22cvD = 0.8 48.3% 0.2% 0.1% 93.61
L = 8 18.2% 0.3% 0.2% 34.93L = 16 8.6% 0.2% 0.0% 44.80
b = 10 24.1% 0.6% 0.2% 21.07b = 100 68.2% 0.6% 0.2% 31.33
An increase of the lead time makes the relative differences smaller. Alonger lead time results in a larger portion of the lead time returns that comefrom expected issues during the lead time itself. Methods B, C, and D treatthis category of returns in exactly the same way, so the relative differencesbecome smaller.
Using a similar argument we expect that an increase in the expected time-to-return, T , results in larger relative differences. As the expected time-to-return increases the portion of lead time returns that come from expectedissues during the lead time decreases. The relative differences therefore in-crease, as Tables 7.4–7.5 also show.
An increase in demand variation also has a negative impact on the relativedifferences. This probably is because more demand uncertainty also leads tomore return uncertainty. More information on the return distribution thanhas less impact on cost performance. The difference between the methodsthus becomes smaller as the uncertainty in returns increases.
The analysis of Section 5.5 showed that in the case of misinformation ofthe return probability Method B performs better than Method D with respectto the expected lead time net demand, while the difference between the meth-ods increases as the return rate increases. With respect to the variance theanalysis was less straightforward. Sometimes Method B outperforms Method
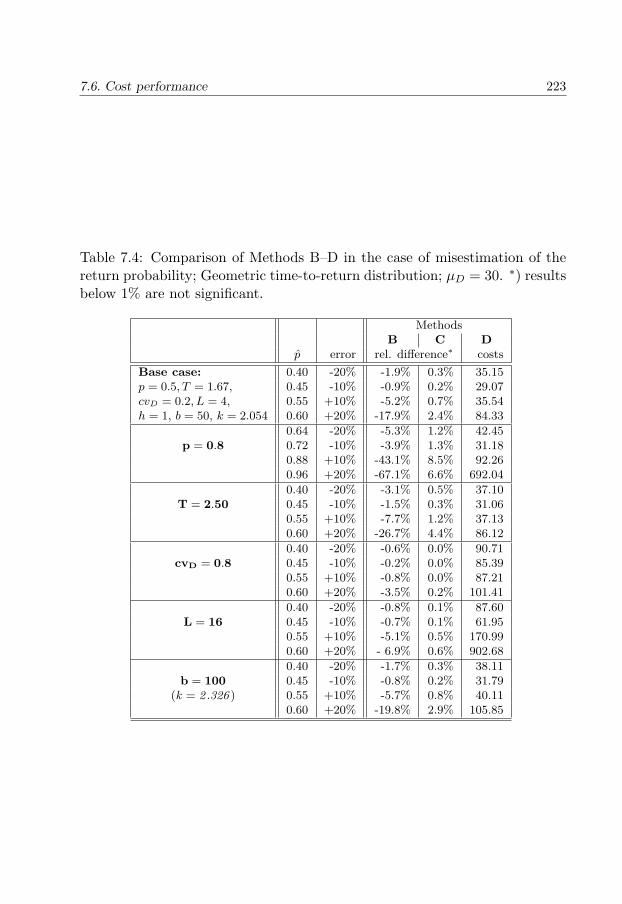
7.6. Cost performance 223
Table 7.4: Comparison of Methods B–D in the case of misestimation of thereturn probability; Geometric time-to-return distribution; µD = 30. ∗) resultsbelow 1% are not significant.
MethodsB C D
p error rel. difference∗ costs
Base case: 0.40 -20% -1.9% 0.3% 35.15p = 0.5, T = 1.67, 0.45 -10% -0.9% 0.2% 29.07cvD = 0.2, L = 4, 0.55 +10% -5.2% 0.7% 35.54h = 1, b = 50, k = 2.054 0.60 +20% -17.9% 2.4% 84.33
0.64 -20% -5.3% 1.2% 42.45p = 0.8 0.72 -10% -3.9% 1.3% 31.18
0.88 +10% -43.1% 8.5% 92.260.96 +20% -67.1% 6.6% 692.04
0.40 -20% -3.1% 0.5% 37.10T = 2.50 0.45 -10% -1.5% 0.3% 31.06
0.55 +10% -7.7% 1.2% 37.130.60 +20% -26.7% 4.4% 86.12
0.40 -20% -0.6% 0.0% 90.71cvD = 0.8 0.45 -10% -0.2% 0.0% 85.39
0.55 +10% -0.8% 0.0% 87.210.60 +20% -3.5% 0.2% 101.41
0.40 -20% -0.8% 0.1% 87.60L = 16 0.45 -10% -0.7% 0.1% 61.95
0.55 +10% -5.1% 0.5% 170.990.60 +20% - 6.9% 0.6% 902.68
0.40 -20% -1.7% 0.3% 38.11b = 100 0.45 -10% -0.8% 0.2% 31.79
(k = 2 .326 ) 0.55 +10% -5.7% 0.8% 40.110.60 +20% -19.8% 2.9% 105.85
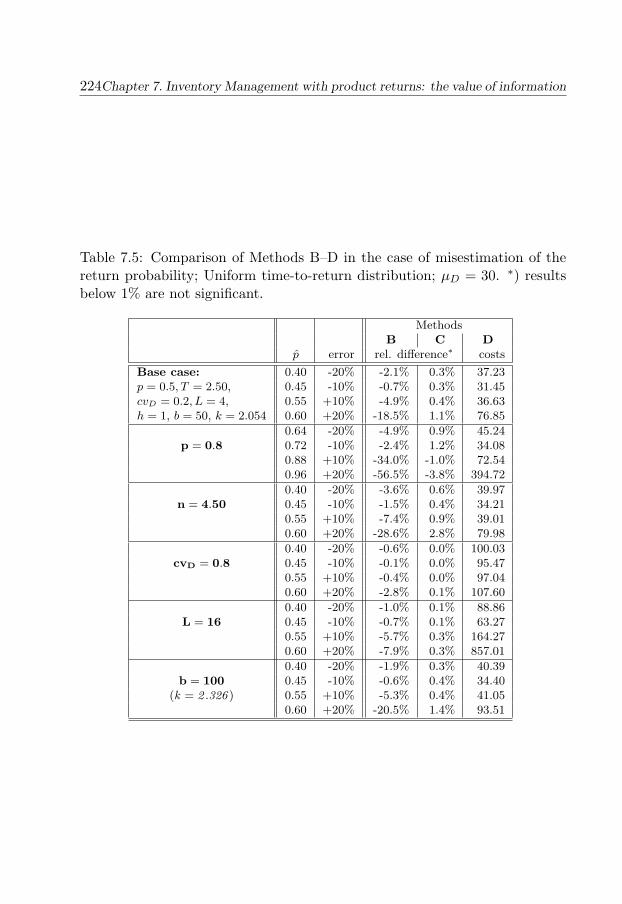
224Chapter 7. Inventory Management with product returns: the value of information
Table 7.5: Comparison of Methods B–D in the case of misestimation of thereturn probability; Uniform time-to-return distribution; µD = 30. ∗) resultsbelow 1% are not significant.
MethodsB C D
p error rel. difference∗ costs
Base case: 0.40 -20% -2.1% 0.3% 37.23p = 0.5, T = 2.50, 0.45 -10% -0.7% 0.3% 31.45cvD = 0.2, L = 4, 0.55 +10% -4.9% 0.4% 36.63h = 1, b = 50, k = 2.054 0.60 +20% -18.5% 1.1% 76.85
0.64 -20% -4.9% 0.9% 45.24p = 0.8 0.72 -10% -2.4% 1.2% 34.08
0.88 +10% -34.0% -1.0% 72.540.96 +20% -56.5% -3.8% 394.72
0.40 -20% -3.6% 0.6% 39.97n = 4.50 0.45 -10% -1.5% 0.4% 34.21
0.55 +10% -7.4% 0.9% 39.010.60 +20% -28.6% 2.8% 79.98
0.40 -20% -0.6% 0.0% 100.03cvD = 0.8 0.45 -10% -0.1% 0.0% 95.47
0.55 +10% -0.4% 0.0% 97.040.60 +20% -2.8% 0.1% 107.60
0.40 -20% -1.0% 0.1% 88.86L = 16 0.45 -10% -0.7% 0.1% 63.27
0.55 +10% -5.7% 0.3% 164.270.60 +20% -7.9% 0.3% 857.01
0.40 -20% -1.9% 0.3% 40.39b = 100 0.45 -10% -0.6% 0.4% 34.40
(k = 2 .326 ) 0.55 +10% -5.3% 0.4% 41.050.60 +20% -20.5% 1.4% 93.51
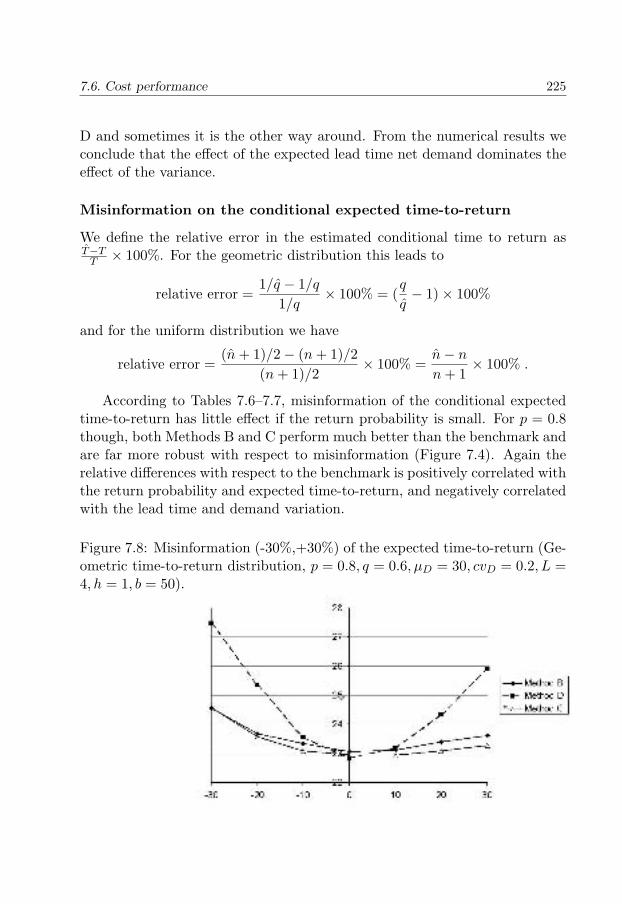
7.6. Cost performance 225
D and sometimes it is the other way around. From the numerical results weconclude that the effect of the expected lead time net demand dominates theeffect of the variance.
Misinformation on the conditional expected time-to-return
We define the relative error in the estimated conditional time to return asT−T
T × 100%. For the geometric distribution this leads to
relative error =1/q − 1/q
1/q× 100% = (
q
q− 1)× 100%
and for the uniform distribution we have
relative error =(n + 1)/2− (n + 1)/2
(n + 1)/2× 100% =
n− n
n + 1× 100% .
According to Tables 7.6–7.7, misinformation of the conditional expectedtime-to-return has little effect if the return probability is small. For p = 0.8though, both Methods B and C perform much better than the benchmark andare far more robust with respect to misinformation (Figure 7.4). Again therelative differences with respect to the benchmark is positively correlated withthe return probability and expected time-to-return, and negatively correlatedwith the lead time and demand variation.
Figure 7.8: Misinformation (-30%,+30%) of the expected time-to-return (Ge-ometric time-to-return distribution, p = 0.8, q = 0.6, µD = 30, cvD = 0.2, L =4, h = 1, b = 50).
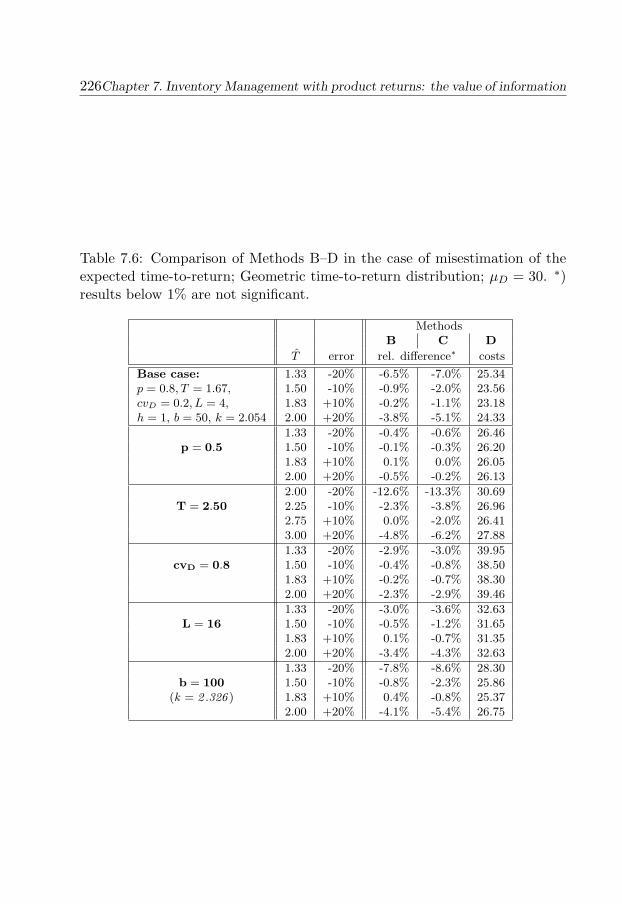
226Chapter 7. Inventory Management with product returns: the value of information
Table 7.6: Comparison of Methods B–D in the case of misestimation of theexpected time-to-return; Geometric time-to-return distribution; µD = 30. ∗)results below 1% are not significant.
MethodsB C D
T error rel. difference∗ costs
Base case: 1.33 -20% -6.5% -7.0% 25.34p = 0.8, T = 1.67, 1.50 -10% -0.9% -2.0% 23.56cvD = 0.2, L = 4, 1.83 +10% -0.2% -1.1% 23.18h = 1, b = 50, k = 2.054 2.00 +20% -3.8% -5.1% 24.33
1.33 -20% -0.4% -0.6% 26.46p = 0.5 1.50 -10% -0.1% -0.3% 26.20
1.83 +10% 0.1% 0.0% 26.052.00 +20% -0.5% -0.2% 26.13
2.00 -20% -12.6% -13.3% 30.69T = 2.50 2.25 -10% -2.3% -3.8% 26.96
2.75 +10% 0.0% -2.0% 26.413.00 +20% -4.8% -6.2% 27.88
1.33 -20% -2.9% -3.0% 39.95cvD = 0.8 1.50 -10% -0.4% -0.8% 38.50
1.83 +10% -0.2% -0.7% 38.302.00 +20% -2.3% -2.9% 39.46
1.33 -20% -3.0% -3.6% 32.63L = 16 1.50 -10% -0.5% -1.2% 31.65
1.83 +10% 0.1% -0.7% 31.352.00 +20% -3.4% -4.3% 32.63
1.33 -20% -7.8% -8.6% 28.30b = 100 1.50 -10% -0.8% -2.3% 25.86
(k = 2 .326 ) 1.83 +10% 0.4% -0.8% 25.372.00 +20% -4.1% -5.4% 26.75
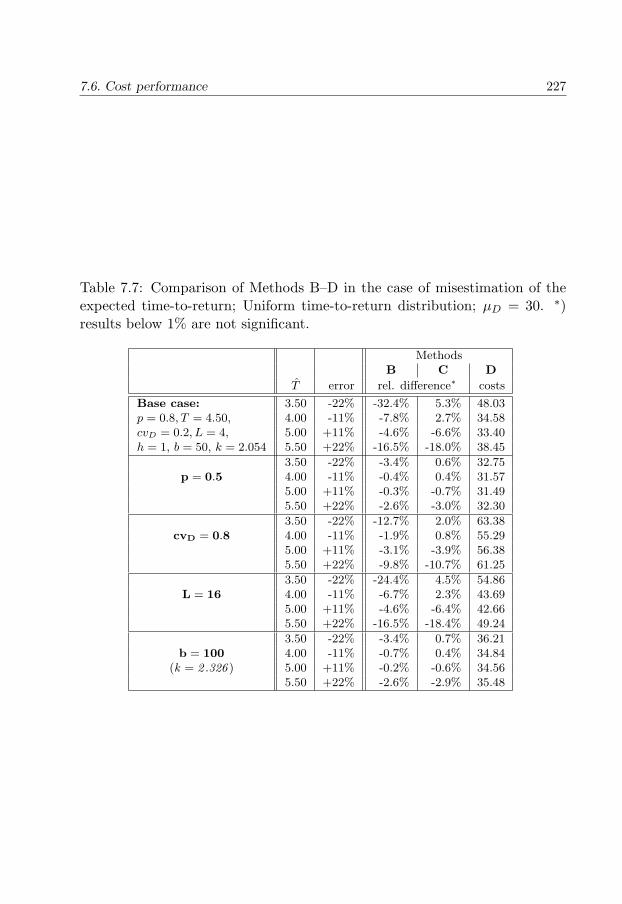
7.6. Cost performance 227
Table 7.7: Comparison of Methods B–D in the case of misestimation of theexpected time-to-return; Uniform time-to-return distribution; µD = 30. ∗)results below 1% are not significant.
MethodsB C D
T error rel. difference∗ costs
Base case: 3.50 -22% -32.4% 5.3% 48.03p = 0.8, T = 4.50, 4.00 -11% -7.8% 2.7% 34.58cvD = 0.2, L = 4, 5.00 +11% -4.6% -6.6% 33.40h = 1, b = 50, k = 2.054 5.50 +22% -16.5% -18.0% 38.45
3.50 -22% -3.4% 0.6% 32.75p = 0.5 4.00 -11% -0.4% 0.4% 31.57
5.00 +11% -0.3% -0.7% 31.495.50 +22% -2.6% -3.0% 32.30
3.50 -22% -12.7% 2.0% 63.38cvD = 0.8 4.00 -11% -1.9% 0.8% 55.29
5.00 +11% -3.1% -3.9% 56.385.50 +22% -9.8% -10.7% 61.25
3.50 -22% -24.4% 4.5% 54.86L = 16 4.00 -11% -6.7% 2.3% 43.69
5.00 +11% -4.6% -6.4% 42.665.50 +22% -16.5% -18.4% 49.24
3.50 -22% -3.4% 0.7% 36.21b = 100 4.00 -11% -0.7% 0.4% 34.84
(k = 2 .326 ) 5.00 +11% -0.2% -0.6% 34.565.50 +22% -2.6% -2.9% 35.48
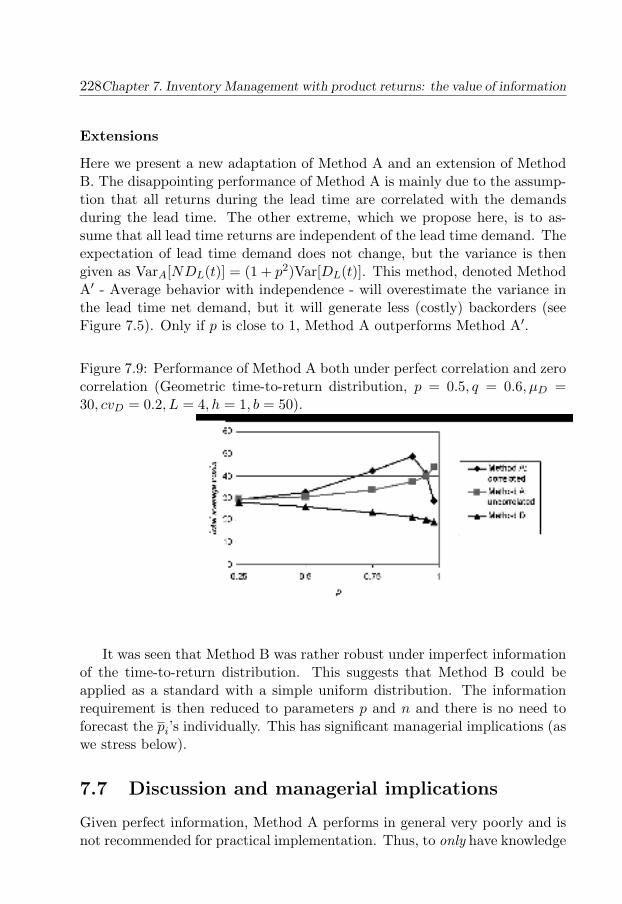
228Chapter 7. Inventory Management with product returns: the value of information
Extensions
Here we present a new adaptation of Method A and an extension of MethodB. The disappointing performance of Method A is mainly due to the assump-tion that all returns during the lead time are correlated with the demandsduring the lead time. The other extreme, which we propose here, is to as-sume that all lead time returns are independent of the lead time demand. Theexpectation of lead time demand does not change, but the variance is thengiven as VarA[NDL(t)] = (1 + p2)Var[DL(t)]. This method, denoted MethodA′ - Average behavior with independence - will overestimate the variance inthe lead time net demand, but it will generate less (costly) backorders (seeFigure 7.5). Only if p is close to 1, Method A outperforms Method A′.
Figure 7.9: Performance of Method A both under perfect correlation and zerocorrelation (Geometric time-to-return distribution, p = 0.5, q = 0.6, µD =30, cvD = 0.2, L = 4, h = 1, b = 50).
It was seen that Method B was rather robust under imperfect informationof the time-to-return distribution. This suggests that Method B could beapplied as a standard with a simple uniform distribution. The informationrequirement is then reduced to parameters p and n and there is no need toforecast the pi’s individually. This has significant managerial implications (aswe stress below).
7.7 Discussion and managerial implications
Given perfect information, Method A performs in general very poorly and isnot recommended for practical implementation. Thus, to only have knowledge
7.7. Discussion and managerial implications 229
on average behavior does not seem to be cost effective. Including informationon the return distribution, however, does seem to provide a sufficient levelof sophistication, as the performance of Method B shows. With respect toinventory related costs, the differences between Methods B, C and D are notsuch that they justify investments in recording detailed return data.
Both for misinformation on the return rate and on the return distribution,the differences between the methods become smaller with the decrease of thereturn probability and the increase of the lead time. Obviously, if there arefew returns forecasting of the lead time returns is not really an issue. Tounderstand the latter one should note that when L is large, most of the itemsthat return during the lead time were also purchased during the lead time.The forecast of this type of returns is not based on historical data, so allMethods B–D give exactly the same forecast.
With respect to misestimating the return rate, in general it is better tounderestimate the return rate than to overestimate, since stockouts are usuallymuch more costly than overstocks. Therefore, if an interval estimate of thereturn rate is available, one may opt to use a value that is closer to thelowerbound rather than the upperbound.
The most robust method given misestimation of the return rate is MethodB. Method B systematically outperforms Methods C and D if the return rateis misestimated by merely 10%,or more. The cost differences are particularlyhigh if return rates are overestimated. With respect to misestimating theconditional time to return distribution, Method C and again Method B aremuch more robust than Method D.
The above results strongly suggest that Method B has a sufficient levelof sophistication both in the case of perfect estimation and imperfect estima-tion. In the latter case Method B is far more robust than the most informedmethod, Method D. For the inventory management of the mail order com-pany of Section 7.2 this means that orders only have to be based on the returndistribution and realized demand per period, but there is no need to trackindividual returns.
Finally we observed that Method B was fairly robust given misespecifi-cation of the time-to-return distribution. Therefore the following practicaladaptation of the use of Method B was proposed. Companies may opt todisregard the shape of the return distribution and to simply use Method Bwith a flat shape, i.e. a uniform distribution. The advantages are huge interms of information spare. The company no longer has to estimate the re-turn probability per period, i.e. the individual pi’s. It suffices to estimate theoverall return probability and the max return period, i.e. p and n. These areactual the parameters for which companies more comfortably give estimates.
230Chapter 7. Inventory Management with product returns: the value of information
7.8 Summary of conclusions and further research
This chapter has reported on the impact of (mis)information on forecastingperformance and performance with respect to inventory costs by analyzingfour forecasting methods as proposed by Kelle and Silver (1989). All methodsmake use of the expectation and variance of the demand, but different levelsof information with respect to returns. The least demanding method, MethodA only uses the return rate. Method B also requires the return distribution.Method C additionally uses a periodic record of returns. Finally, Method Dneeds to track back the period in which each individual product return wassold.
Given perfect information, forecasting performance increases as the levelof information increases, Method D naturally being the best method. Yet,from the analysis we have concluded that Method B presents a reasonablelevel of sophistication given perfect information and is exceptionally robustgiven misinformation in comparison with the other methods. Furthermoresince the Method B is quite insensitive to the shape of the return distribution,the companies can simply employ the uniform return distribution, i.e. usingMethod B with a flat shape, that is by fitting an uniform distribution.
Method D does not appear to be very robust given misestimation. Thisleads to the conclusion that companies are not likely to recover investmentson advanced return data with inventory savings, especially in volatile en-vironments. Naturally, it is worth further investigating the value of returninformation, with respect to multiple criteria, like for instance productionscheduling and human resource management (see Toktay et al., 2004 for acomparison of the methods with respect to order variability, “the bullwhipeffect”).
The huge gap in performance between Methods A and B suggests thatrefinements of Method A are possible. In this chapter an enhanced MethodA, i.e. Method A
′was put forward, where the variance during the leadtime
is underestimated. In addition, there is an opportunity to look further forsimilar simple methods with low information requirements but a reasonableperformance.
In the analysis of misinformation, there was a static situation where asystematic error was introduced. This is natural for small errors, since it isdifficult in general to reason whether observations indicate trend changes ormere stochastic behavior. However, large variations could be dealt with byan adaptive method. This is a topic for further research.
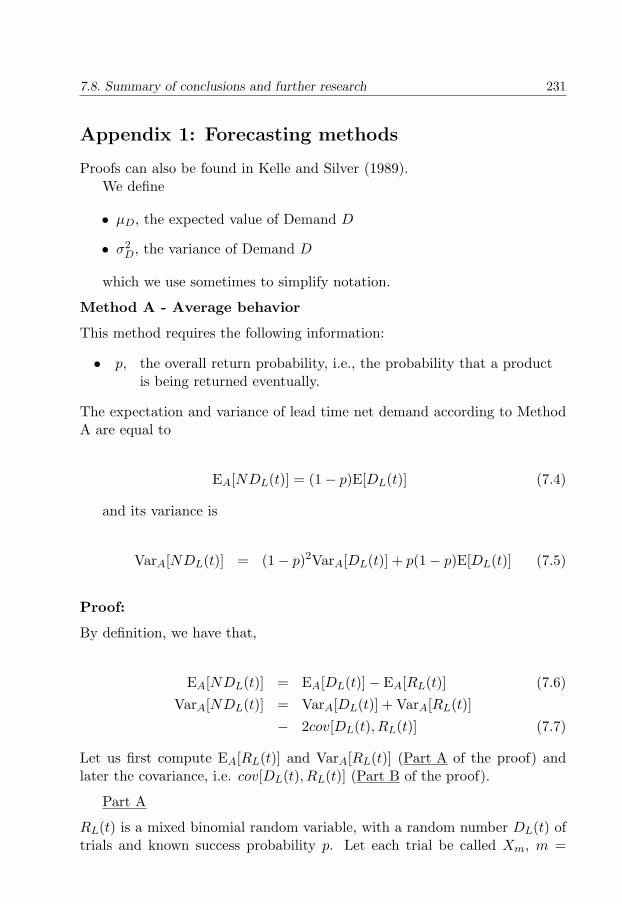
7.8. Summary of conclusions and further research 231
Appendix 1: Forecasting methods
Proofs can also be found in Kelle and Silver (1989).We define
• µD, the expected value of Demand D
• σ2D, the variance of Demand D
which we use sometimes to simplify notation.
Method A - Average behavior
This method requires the following information:
• p, the overall return probability, i.e., the probability that a productis being returned eventually.
The expectation and variance of lead time net demand according to MethodA are equal to
EA[NDL(t)] = (1− p)E[DL(t)] (7.4)
and its variance is
VarA[NDL(t)] = (1− p)2VarA[DL(t)] + p(1− p)E[DL(t)] (7.5)
Proof:
By definition, we have that,
EA[NDL(t)] = EA[DL(t)]− EA[RL(t)] (7.6)VarA[NDL(t)] = VarA[DL(t)] + VarA[RL(t)]
− 2cov[DL(t), RL(t)] (7.7)
Let us first compute EA[RL(t)] and VarA[RL(t)] (Part A of the proof) andlater the covariance, i.e. cov[DL(t), RL(t)] (Part B of the proof).
Part A
RL(t) is a mixed binomial random variable, with a random number DL(t) oftrials and known success probability p. Let each trial be called Xm, m =
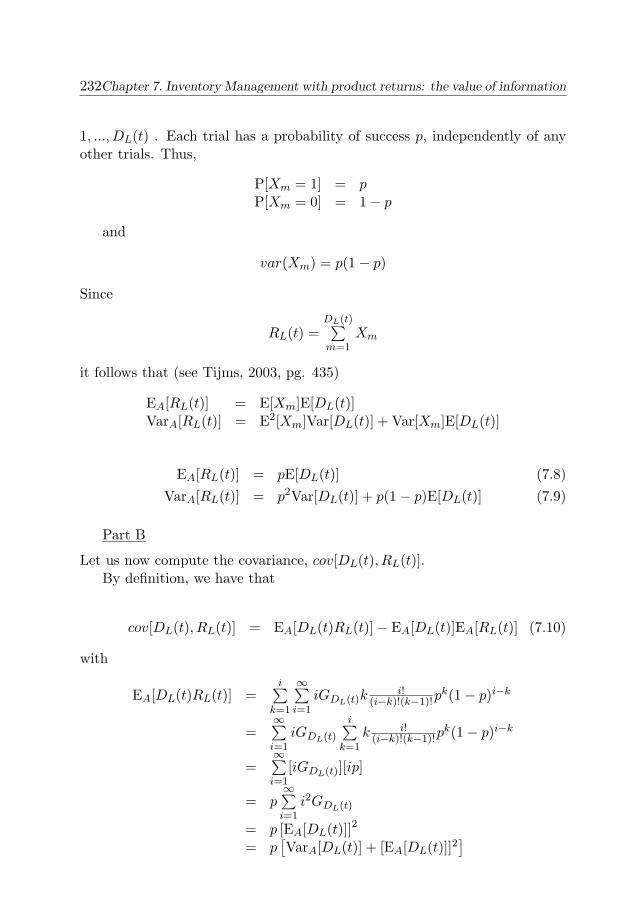
232Chapter 7. Inventory Management with product returns: the value of information
1, ..., DL(t) . Each trial has a probability of success p, independently of anyother trials. Thus,
P[Xm = 1] = pP[Xm = 0] = 1− p
and
var(Xm) = p(1− p)
Since
RL(t) =DL(t)∑m=1
Xm
it follows that (see Tijms, 2003, pg. 435)
EA[RL(t)] = E[Xm]E[DL(t)]VarA[RL(t)] = E2[Xm]Var[DL(t)] + Var[Xm]E[DL(t)]
EA[RL(t)] = pE[DL(t)] (7.8)VarA[RL(t)] = p2Var[DL(t)] + p(1− p)E[DL(t)] (7.9)
Part B
Let us now compute the covariance, cov[DL(t), RL(t)].By definition, we have that
cov[DL(t), RL(t)] = EA[DL(t)RL(t)]− EA[DL(t)]EA[RL(t)] (7.10)
with
EA[DL(t)RL(t)] =i∑
k=1
∞∑i=1
iGDL(t)ki!
(i−k)!(k−1)!pk(1− p)i−k
=∞∑i=1
iGDL(t)
i∑k=1
k i!(i−k)!(k−1)!p
k(1− p)i−k
=∞∑i=1
[iGDL(t)][ip]
= p∞∑i=1
i2GDL(t)
= p [EA[DL(t)]]2
= p[VarA[DL(t)] + [EA[DL(t)]]2
]
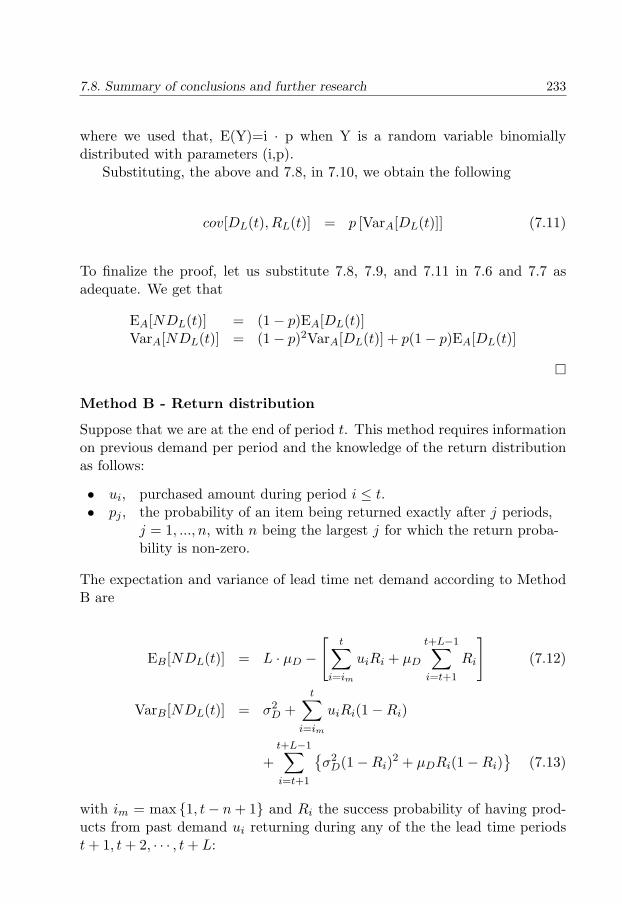
7.8. Summary of conclusions and further research 233
where we used that, E(Y)=i · p when Y is a random variable binomiallydistributed with parameters (i,p).
Substituting, the above and 7.8, in 7.10, we obtain the following
cov[DL(t), RL(t)] = p [VarA[DL(t)]] (7.11)
To finalize the proof, let us substitute 7.8, 7.9, and 7.11 in 7.6 and 7.7 asadequate. We get that
EA[NDL(t)] = (1− p)EA[DL(t)]VarA[NDL(t)] = (1− p)2VarA[DL(t)] + p(1− p)EA[DL(t)]
�
Method B - Return distribution
Suppose that we are at the end of period t. This method requires informationon previous demand per period and the knowledge of the return distributionas follows:
• ui, purchased amount during period i ≤ t.• pj , the probability of an item being returned exactly after j periods,
j = 1, ..., n, with n being the largest j for which the return proba-bility is non-zero.
The expectation and variance of lead time net demand according to MethodB are
EB[NDL(t)] = L · µD −
[t∑
i=im
uiRi + µD
t+L−1∑i=t+1
Ri
](7.12)
VarB[NDL(t)] = σ2D +
t∑i=im
uiRi(1−Ri)
+t+L−1∑i=t+1
{σ2
D(1−Ri)2 + µDRi(1−Ri)}
(7.13)
with im = max {1, t− n + 1} and Ri the success probability of having prod-ucts from past demand ui returning during any of the the lead time periodst + 1, t + 2, · · · , t + L:
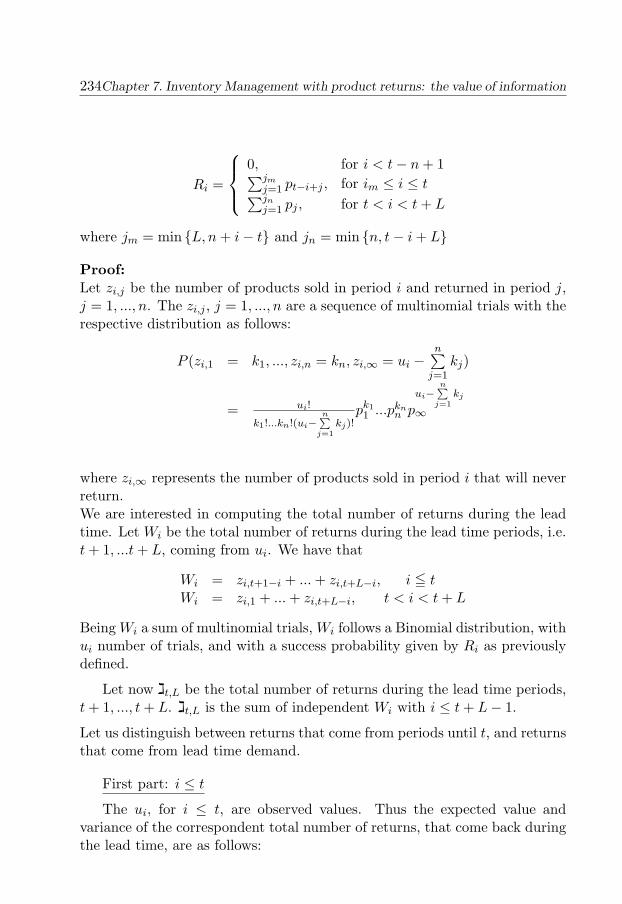
234Chapter 7. Inventory Management with product returns: the value of information
Ri =
0, for i < t− n + 1∑jm
j=1 pt−i+j , for im ≤ i ≤ t∑jn
j=1 pj , for t < i < t + L
where jm = min {L, n + i− t} and jn = min {n, t− i + L}
Proof:Let zi,j be the number of products sold in period i and returned in period j,j = 1, ..., n. The zi,j , j = 1, ..., n are a sequence of multinomial trials with therespective distribution as follows:
P (zi,1 = k1, ..., zi,n = kn, zi,∞ = ui −n∑
j=1kj)
= ui!
k1!...kn!(ui−n∑
j=1kj)!
pk11 ...pkn
n pui−
n∑j=1
kj
∞
where zi,∞ represents the number of products sold in period i that will neverreturn.We are interested in computing the total number of returns during the leadtime. Let Wi be the total number of returns during the lead time periods, i.e.t + 1, ...t + L, coming from ui. We have that
Wi = zi,t+1−i + ... + zi,t+L−i, i 5 tWi = zi,1 + ... + zi,t+L−i, t < i < t + L
Being Wi a sum of multinomial trials, Wi follows a Binomial distribution, withui number of trials, and with a success probability given by Ri as previouslydefined.
Let now t,Lג be the total number of returns during the lead time periods,t + 1, ..., t + L. t,Lג is the sum of independent Wi with i ≤ t + L− 1.
Let us distinguish between returns that come from periods until t, and returnsthat come from lead time demand.
First part: i ≤ t
The ui, for i ≤ t, are observed values. Thus the expected value andvariance of the correspondent total number of returns, that come back duringthe lead time, are as follows:
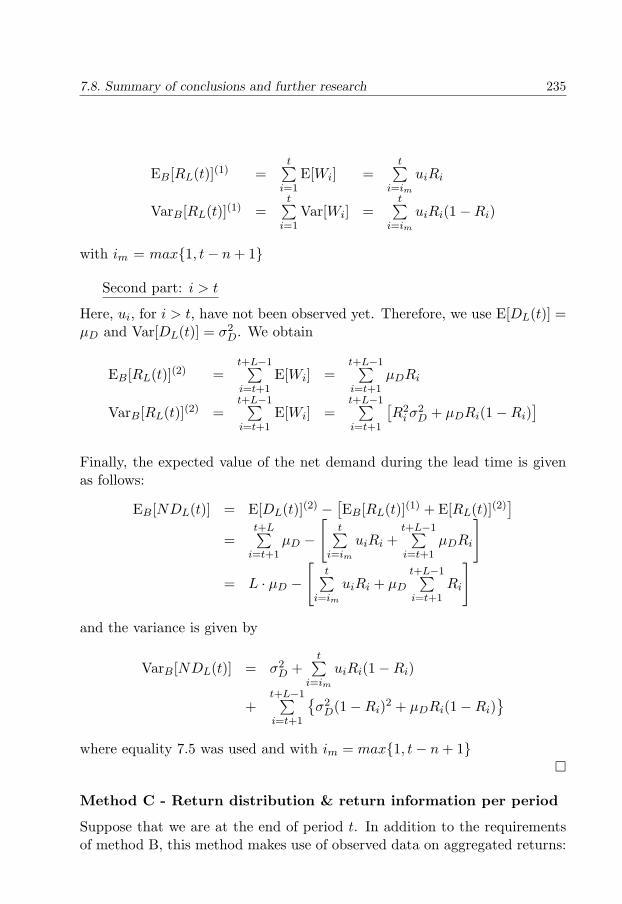
7.8. Summary of conclusions and further research 235
EB[RL(t)](1) =t∑
i=1E[Wi] =
t∑i=im
uiRi
VarB[RL(t)](1) =t∑
i=1Var[Wi] =
t∑i=im
uiRi(1−Ri)
with im = max{1, t− n + 1}
Second part: i > t
Here, ui, for i > t, have not been observed yet. Therefore, we use E[DL(t)] =µD and Var[DL(t)] = σ2
D. We obtain
EB[RL(t)](2) =t+L−1∑i=t+1
E[Wi] =t+L−1∑i=t+1
µDRi
VarB[RL(t)](2) =t+L−1∑i=t+1
E[Wi] =t+L−1∑i=t+1
[R2
i σ2D + µDRi(1−Ri)
]Finally, the expected value of the net demand during the lead time is givenas follows:
EB[NDL(t)] = E[DL(t)](2) −[EB[RL(t)](1) + E[RL(t)](2)
]=
t+L∑i=t+1
µD −
[t∑
i=im
uiRi +t+L−1∑i=t+1
µDRi
]
= L · µD −
[t∑
i=im
uiRi + µD
t+L−1∑i=t+1
Ri
]
and the variance is given by
VarB[NDL(t)] = σ2D +
t∑i=im
uiRi(1−Ri)
+t+L−1∑i=t+1
{σ2
D(1−Ri)2 + µDRi(1−Ri)}
where equality 7.5 was used and with im = max{1, t− n + 1}�
Method C - Return distribution & return information per period
Suppose that we are at the end of period t. In addition to the requirementsof method B, this method makes use of observed data on aggregated returns:
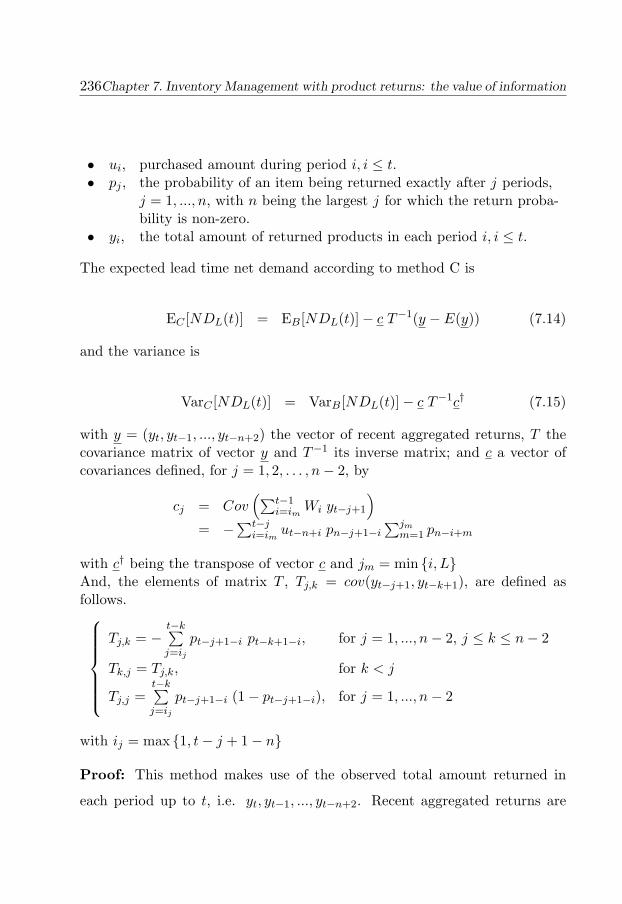
236Chapter 7. Inventory Management with product returns: the value of information
• ui, purchased amount during period i, i ≤ t.• pj , the probability of an item being returned exactly after j periods,
j = 1, ..., n, with n being the largest j for which the return proba-bility is non-zero.
• yi, the total amount of returned products in each period i, i ≤ t.
The expected lead time net demand according to method C is
EC [NDL(t)] = EB[NDL(t)]− c T−1(y − E(y)) (7.14)
and the variance is
VarC [NDL(t)] = VarB[NDL(t)]− c T−1c† (7.15)
with y = (yt, yt−1, ..., yt−n+2) the vector of recent aggregated returns, T thecovariance matrix of vector y and T−1 its inverse matrix; and c a vector ofcovariances defined, for j = 1, 2, . . . , n− 2, by
cj = Cov(∑t−1
i=imWi yt−j+1
)= −
∑t−ji=im
ut−n+i pn−j+1−i∑jm
m=1 pn−i+m
with c† being the transpose of vector c and jm = min {i, L}And, the elements of matrix T , Tj,k = cov(yt−j+1, yt−k+1), are defined asfollows.
Tj,k = −t−k∑j=ij
pt−j+1−i pt−k+1−i, for j = 1, ..., n− 2, j ≤ k ≤ n− 2
Tk,j = Tj,k, for k < j
Tj,j =t−k∑j=ij
pt−j+1−i (1− pt−j+1−i), for j = 1, ..., n− 2
with ij = max {1, t− j + 1− n}
Proof: This method makes use of the observed total amount returned in
each period up to t, i.e. yt, yt−1, ..., yt−n+2. Recent aggregated returns are
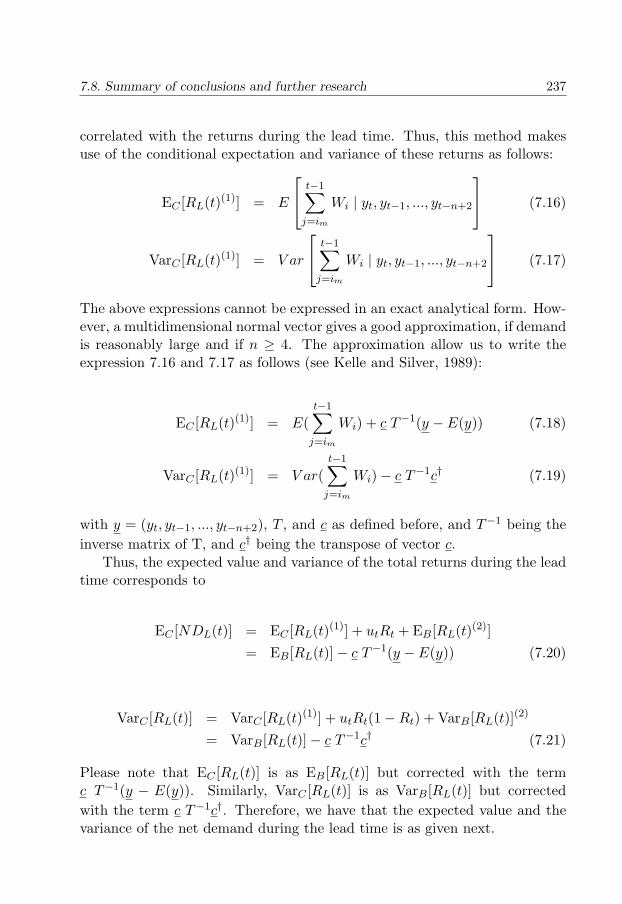
7.8. Summary of conclusions and further research 237
correlated with the returns during the lead time. Thus, this method makesuse of the conditional expectation and variance of these returns as follows:
EC [RL(t)(1)] = E
t−1∑j=im
Wi | yt, yt−1, ..., yt−n+2
(7.16)
VarC [RL(t)(1)] = V ar
t−1∑j=im
Wi | yt, yt−1, ..., yt−n+2
(7.17)
The above expressions cannot be expressed in an exact analytical form. How-ever, a multidimensional normal vector gives a good approximation, if demandis reasonably large and if n ≥ 4. The approximation allow us to write theexpression 7.16 and 7.17 as follows (see Kelle and Silver, 1989):
EC [RL(t)(1)] = E(t−1∑
j=im
Wi) + c T−1(y − E(y)) (7.18)
VarC [RL(t)(1)] = V ar(t−1∑
j=im
Wi)− c T−1c† (7.19)
with y = (yt, yt−1, ..., yt−n+2), T , and c as defined before, and T−1 being theinverse matrix of T, and c† being the transpose of vector c.
Thus, the expected value and variance of the total returns during the leadtime corresponds to
EC [NDL(t)] = EC [RL(t)(1)] + utRt + EB[RL(t)(2)]= EB[RL(t)]− c T−1(y − E(y)) (7.20)
VarC [RL(t)] = VarC [RL(t)(1)] + utRt(1−Rt) + VarB[RL(t)](2)
= VarB[RL(t)]− c T−1c† (7.21)
Please note that EC [RL(t)] is as EB[RL(t)] but corrected with the termc T−1(y − E(y)). Similarly, VarC [RL(t)] is as VarB[RL(t)] but correctedwith the term c T−1c†. Therefore, we have that the expected value and thevariance of the net demand during the lead time is as given next.
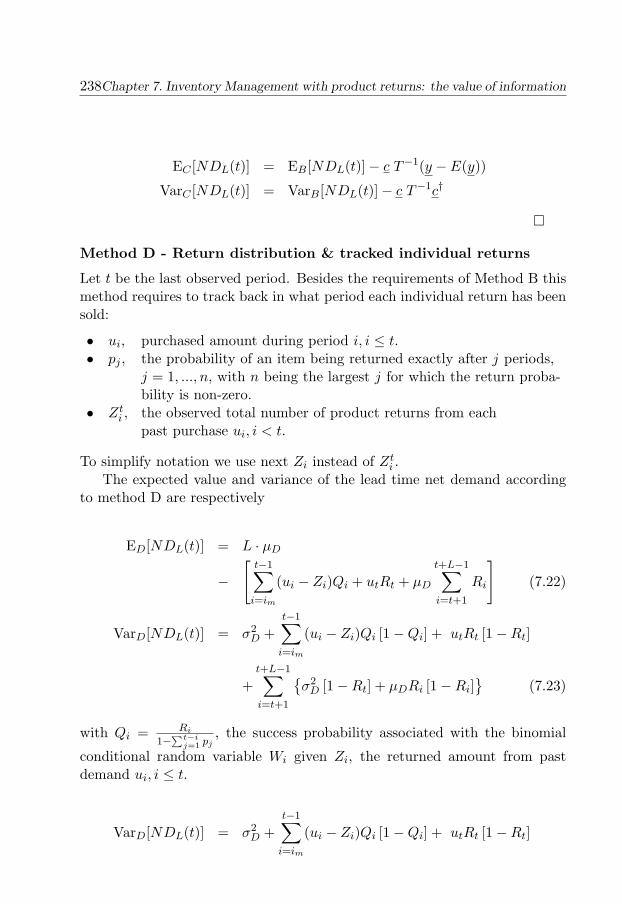
238Chapter 7. Inventory Management with product returns: the value of information
EC [NDL(t)] = EB[NDL(t)]− c T−1(y − E(y))
VarC [NDL(t)] = VarB[NDL(t)]− c T−1c†
�
Method D - Return distribution & tracked individual returns
Let t be the last observed period. Besides the requirements of Method B thismethod requires to track back in what period each individual return has beensold:
• ui, purchased amount during period i, i ≤ t.• pj , the probability of an item being returned exactly after j periods,
j = 1, ..., n, with n being the largest j for which the return proba-bility is non-zero.
• Zti , the observed total number of product returns from each
past purchase ui, i < t.
To simplify notation we use next Zi instead of Zti .
The expected value and variance of the lead time net demand accordingto method D are respectively
ED[NDL(t)] = L · µD
−
[t−1∑
i=im
(ui − Zi)Qi + utRt + µD
t+L−1∑i=t+1
Ri
](7.22)
VarD[NDL(t)] = σ2D +
t−1∑i=im
(ui − Zi)Qi [1−Qi] + utRt [1−Rt]
+t+L−1∑i=t+1
{σ2
D [1−Rt] + µDRi [1−Ri]}
(7.23)
with Qi = Ri
1−∑t−i
j=1 pj, the success probability associated with the binomial
conditional random variable Wi given Zi, the returned amount from pastdemand ui, i ≤ t.
VarD[NDL(t)] = σ2D +
t−1∑i=im
(ui − Zi)Qi [1−Qi] + utRt [1−Rt]
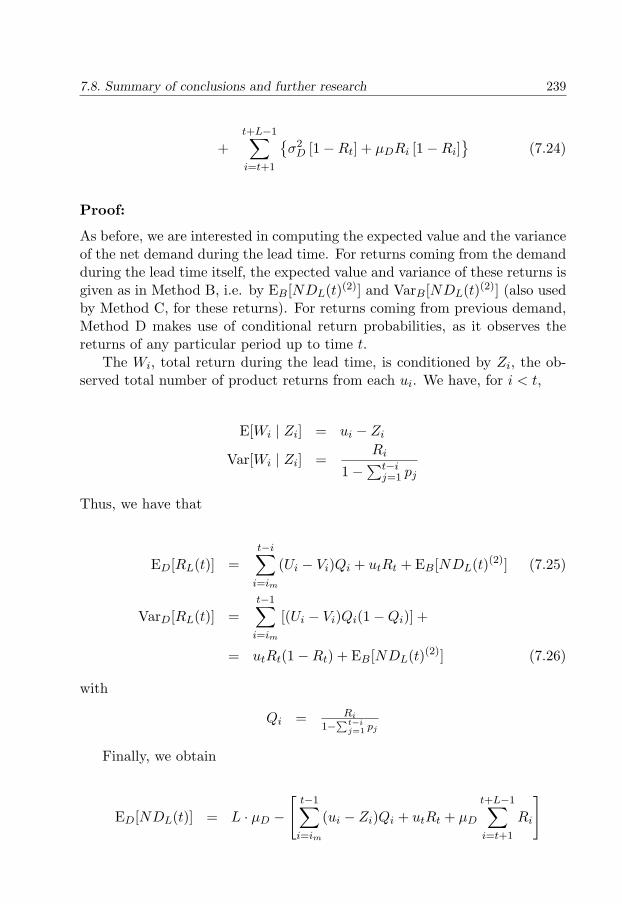
7.8. Summary of conclusions and further research 239
+t+L−1∑i=t+1
{σ2
D [1−Rt] + µDRi [1−Ri]}
(7.24)
Proof:
As before, we are interested in computing the expected value and the varianceof the net demand during the lead time. For returns coming from the demandduring the lead time itself, the expected value and variance of these returns isgiven as in Method B, i.e. by EB[NDL(t)(2)] and VarB[NDL(t)(2)] (also usedby Method C, for these returns). For returns coming from previous demand,Method D makes use of conditional return probabilities, as it observes thereturns of any particular period up to time t.
The Wi, total return during the lead time, is conditioned by Zi, the ob-served total number of product returns from each ui. We have, for i < t,
E[Wi | Zi] = ui − Zi
Var[Wi | Zi] =Ri
1−∑t−i
j=1 pj
Thus, we have that
ED[RL(t)] =t−i∑
i=im
(Ui − Vi)Qi + utRt + EB[NDL(t)(2)] (7.25)
VarD[RL(t)] =t−1∑
i=im
[(Ui − Vi)Qi(1−Qi)] +
= utRt(1−Rt) + EB[NDL(t)(2)] (7.26)
with
Qi = Ri
1−∑t−i
j=1 pj
Finally, we obtain
ED[NDL(t)] = L · µD −
[t−1∑
i=im
(ui − Zi)Qi + utRt + µD
t+L−1∑i=t+1
Ri
]
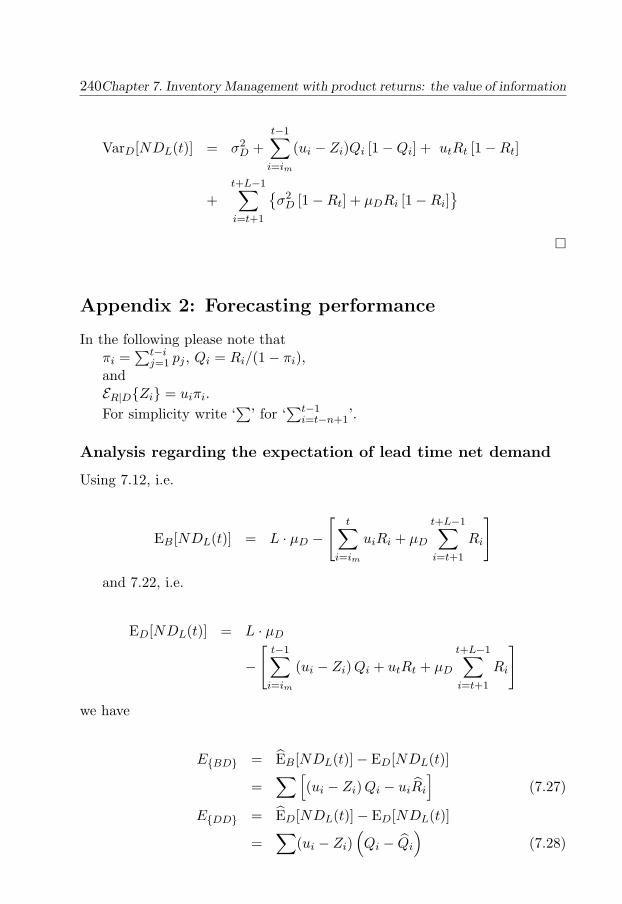
240Chapter 7. Inventory Management with product returns: the value of information
VarD[NDL(t)] = σ2D +
t−1∑i=im
(ui − Zi)Qi [1−Qi] + utRt [1−Rt]
+t+L−1∑i=t+1
{σ2
D [1−Rt] + µDRi [1−Ri]}
�
Appendix 2: Forecasting performance
In the following please note thatπi =
∑t−ij=1 pj , Qi = Ri/(1− πi),
andER|D{Zi} = uiπi.For simplicity write ‘
∑’ for ‘
∑t−1i=t−n+1’.
Analysis regarding the expectation of lead time net demand
Using 7.12, i.e.
EB[NDL(t)] = L · µD −
[t∑
i=im
uiRi + µD
t+L−1∑i=t+1
Ri
]
and 7.22, i.e.
ED[NDL(t)] = L · µD
−
[t−1∑
i=im
(ui − Zi) Qi + utRt + µD
t+L−1∑i=t+1
Ri
]
we have
E{BD} = EB[NDL(t)]− ED[NDL(t)]
=∑ [
(ui − Zi) Qi − uiRi
](7.27)
E{DD} = ED[NDL(t)]− ED[NDL(t)]
=∑
(ui − Zi)(Qi − Qi
)(7.28)
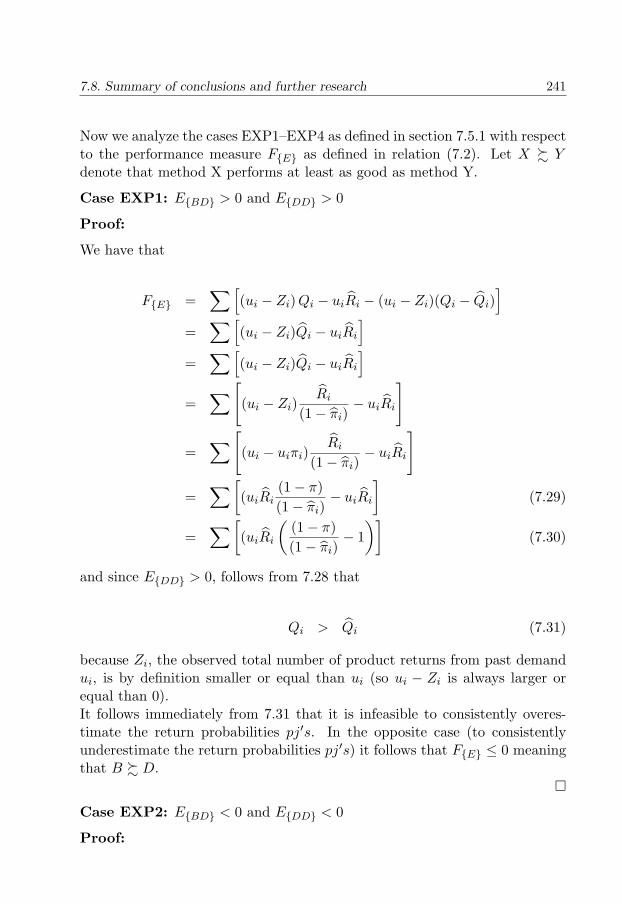
7.8. Summary of conclusions and further research 241
Now we analyze the cases EXP1–EXP4 as defined in section 7.5.1 with respectto the performance measure F{E} as defined in relation (7.2). Let X % Ydenote that method X performs at least as good as method Y.
Case EXP1: E{BD} > 0 and E{DD} > 0
Proof:
We have that
F{E} =∑ [
(ui − Zi) Qi − uiRi − (ui − Zi)(Qi − Qi)]
=∑ [
(ui − Zi)Qi − uiRi
]=
∑ [(ui − Zi)Qi − uiRi
]=
∑ [(ui − Zi)
Ri
(1− πi)− uiRi
]
=∑ [
(ui − uiπi)Ri
(1− πi)− uiRi
]
=∑ [
(uiRi(1− π)(1− πi)
− uiRi
](7.29)
=∑ [
(uiRi
((1− π)(1− πi)
− 1)]
(7.30)
and since E{DD} > 0, follows from 7.28 that
Qi > Qi (7.31)
because Zi, the observed total number of product returns from past demandui, is by definition smaller or equal than ui (so ui − Zi is always larger orequal than 0).It follows immediately from 7.31 that it is infeasible to consistently overes-timate the return probabilities pj′s. In the opposite case (to consistentlyunderestimate the return probabilities pj′s) it follows that F{E} ≤ 0 meaningthat B % D.
�
Case EXP2: E{BD} < 0 and E{DD} < 0
Proof:
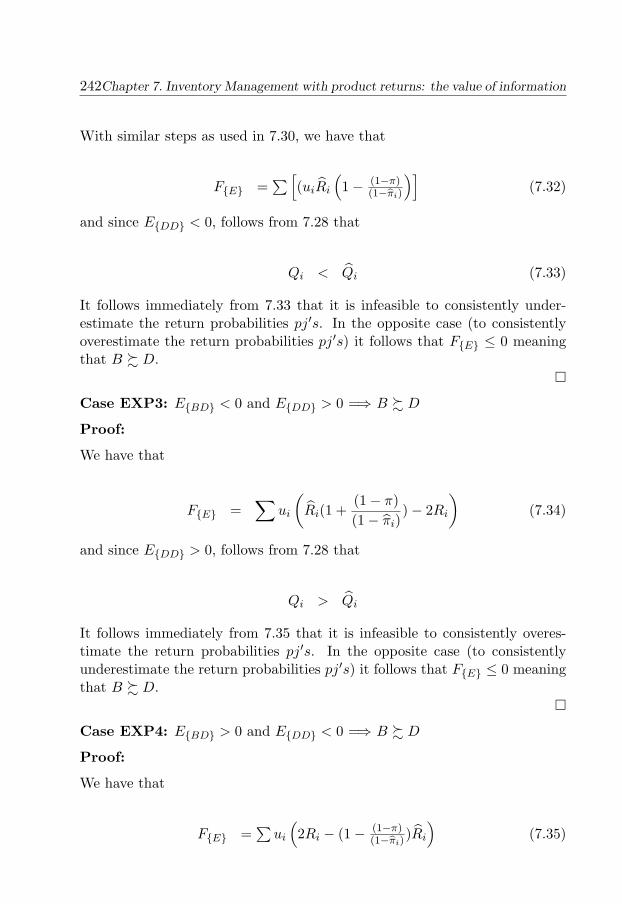
242Chapter 7. Inventory Management with product returns: the value of information
With similar steps as used in 7.30, we have that
F{E} =∑[
(uiRi
(1− (1−π)
(1−πi)
)](7.32)
and since E{DD} < 0, follows from 7.28 that
Qi < Qi (7.33)
It follows immediately from 7.33 that it is infeasible to consistently under-estimate the return probabilities pj′s. In the opposite case (to consistentlyoverestimate the return probabilities pj′s) it follows that F{E} ≤ 0 meaningthat B % D.
�
Case EXP3: E{BD} < 0 and E{DD} > 0 =⇒ B % D
Proof:
We have that
F{E} =∑
ui
(Ri(1 +
(1− π)(1− πi)
)− 2Ri
)(7.34)
and since E{DD} > 0, follows from 7.28 that
Qi > Qi
It follows immediately from 7.35 that it is infeasible to consistently overes-timate the return probabilities pj′s. In the opposite case (to consistentlyunderestimate the return probabilities pj′s) it follows that F{E} ≤ 0 meaningthat B % D.
�
Case EXP4: E{BD} > 0 and E{DD} < 0 =⇒ B % D
Proof:
We have that
F{E} =∑
ui
(2Ri − (1− (1−π)
(1−πi))Ri
)(7.35)
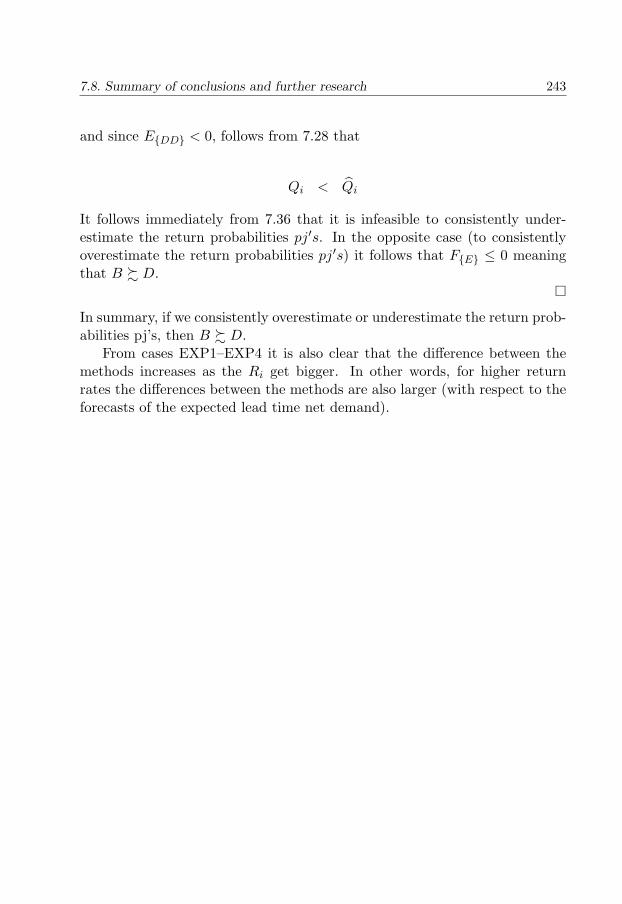
7.8. Summary of conclusions and further research 243
and since E{DD} < 0, follows from 7.28 that
Qi < Qi
It follows immediately from 7.36 that it is infeasible to consistently under-estimate the return probabilities pj′s. In the opposite case (to consistentlyoverestimate the return probabilities pj′s) it follows that F{E} ≤ 0 meaningthat B % D.
�
In summary, if we consistently overestimate or underestimate the return prob-abilities pj’s, then B % D.
From cases EXP1–EXP4 it is also clear that the difference between themethods increases as the Ri get bigger. In other words, for higher returnrates the differences between the methods are also larger (with respect to theforecasts of the expected lead time net demand).

Chapter 8
Reverse Logistics research:what does the future bring?
Change is the law of life.And those who look onlyto the past or presentare certain to miss the future.
John F. Kennedy
8.1 Introduction
The field of Reverse Logistics has been expanding fast with many technicalcontributions, case studies and some theoretic literature arising from research(see previous chapters). Yet, it remains an academic field in formation, whereconcepts and theories are not as vivid as in better established research fieldslike supply chain management (see Melissen and De Ron, 1999).
In this chapter, we propose a reflection on the future development ofreverse logistics, mainly as an academic field. In this way, we assist in givingpriorities to research in the field. At the end we evaluate reverse logisticsissues with respect to research impact and complexity.
We carried out a Delphi Study with an international panel of academicsworking on reverse logistics issues as a means to reflect on the future of reverselogistics as an academic field. The Delphi study consisted of two rounds ofanonymous questionnaires with an intermediary feedback phase. In short,
245
246 Chapter 8. Reverse Logistics research: what does the future bring?
every member received information on the answers to the first questionnaire,which they could rank and rate.
The overall analysis allows us to make recommendations concerning re-search and teaching about reverse logistics. Furthermore, we find evidenceof different contributions to the field, depending on whether the researcheris a senior, junior or a researchers working “accidentally” in the area. Inaddition, we explore the impact of the differences the between European andNorth American researchers.
This chapter is organized as follows. First, Section 8.2 describes the em-ployed methodology. Section 8.3 reports on an exploratory study that servedas input for the Delphi study. Section 8.4 presents the specific design of thisDelphi study. In Section 8.5 we display the profile of reverse logistics re-searchers and the profile of the participants of the study. Then in Section 8.6we discuss the insights that this study brings about reverse logistics. Section8.7 put into evidence the specific added-value to the field of senior, juniorand accidental researchers. In Section 8.8 we split the analysis according tothe European versus North American participants. Before the end, we glanceover the rest of the world. The last section puts together the conclusions. Anearlier report on this study has appeared in De Brito and van Wassenhove(2003).
8.2 Methodology
The employed methodology for the main investigation was a Delphi study,which is described in more detail below. Prior to the Delphi study, we carriedout an exploratory study, which brought awareness to the potential pitfalls ofthe main study. For the exploratory study, we employed the Nominal GroupTechnique (NGT).
Both NGT and Delphi are techniques to structure communication amonga group of individuals. The NGT is appropriate for the exploratory phaseas it allows us to follow the process in loco at the same time that helpscommunication to flow in a structured way. By following the process, insightsare gained on how to structure communication in follow-up studies. In ourcase, we obtained insights on how to build up the Delphi questionnaire. TheDelphi itself is a suitable method to reflect on the future of a field, as it callsupon the views of experts.
8.2. Methodology 247
8.2.1 An exploratory study
For the exploratory study, we employed the Nominal Group Technique (NGT)to structure the interactions of a group of reverse logistics researchers. Theirtask was to come up with ideas on “What are promising areas for futureresearch on reverse logistics?” The study took place during the annual work-shop of the European working group on Reverse Logistics, called RevLog (seeRevLog, online), in the end of the summer in 2002. The outcome of thisexploratory study is reported in the Section 8.3.
NGT is a technique to structure communication among a group of indi-viduals. To summarize, after having a question/task, the discussion processfollows the following steps(with some variations): Step 1- Silent generationof ideas; Step 2 - Round-robin record of ideas; Step 3 - Clarification of eachidea and discussion within each group; Step 4- Individual voting (ranking orrating) and wrap-up. The process has been designed 1) to assure creativity;and 2) to balance participation among members (see Delbecq et al., 1975).
The NGT is a technique to structure group meetings, and therefore, itwill achieve structured output. Nonetheless, this is still raw material andvery likely not rich in detail, since participants are stimulated to be brief instating their ideas. Any analysis of the results should take into account thegroup formation and how the discussion proceeded. Special caution should goin taking overall conclusions. For instance, to pool rankings/ratings is verydangerous. Note that groups vote from their own set of ideas.
8.2.2 The Delphi study
Delphi is another method to structure communication among a group of indi-viduals, also called panel. Delphi studies are well fit for purposes like problemsolving, policy-making and proposal review among others (Linstone and Tur-off, 1975). Experts or stakeholders on the subject in study constitute thepanel. Applying the Delphi method basically involves the following. Sev-eral rounds of questions and feedbacks are sent to the panel. Each feedbackincludes both the mild and the extreme panel standpoints relatively to theprevious round of questions. Individual comments/answers remain anony-mous to the group. Through the process, each member of the panel has thechance to refine his/her own answers or comments.
Since the first published Delphi study in the sixties (Dalkey and Helmer,1963), Delphi has been employed in many fields of research like technology,marketing, supply chain management and so on (see Boks and Tempelman,1997; Smit and Popma, 2002; Akkermans et al., 2003). For a review on Delphistudies, we refer to Linstone and Turoff (1975).
248 Chapter 8. Reverse Logistics research: what does the future bring?
In the literature, many have pointed out the advantages over face-to-facemeetings. For instance, in face-to-face meetings, winning an argument issometimes more important than to look for a better understanding of theproblem. With the Delphi, since anonymity is guaranteed, a participant canquietly change his/her mind without losing face (see Martino, 1972). Besidesthis, other advantages are (see Kenis, 1995): to balance participation (avoid-ing the follow-the-leader effect); to avoid a reactive chain of ideas (avoidingstagnation around the first welcomed idea); and to make participants freeof the burden of interpersonal relationships (being free from social-emotionalconcerns and accordingly behavior). Sceptics of the Delphi study have alsoexposed the disadvantages, especially directed to the original Delphi format.The critics accuse the method of being illusorily over simplistic and an easytemptation for being sloppy (see Slackman, 1975). Two pillars of the Del-phi study are 1) the concept of expert; 2) the questionnaires and respectivesummarized feedbacks. Thus the researcher(s) carrying out Delphi studieshas to be extremely careful with respect to the sampling process and theconstructing of the questionnaires and follow-up summaries.
For this study, experts on reverse logistics and related areas were chosen,based on their relevant scientific research and other experts’ judgement. Theexploratory study, carried out a priori, delivered us helpful input on potentialtraps, and guided the questionnaire as well (see Section 8.3). Furthermore,it helps to check the questionnaire by posing for instance the following ques-tions: are the questions too vague?; are the questions too precise?; or, perhapsbiased?; is the question by any chance too demanding, or is it within reachfor an expert? (see Dillman, 1978). It is imperative to fine-tune the question-naire with the expert panel. Besides this, the validity of Delphi cannot beguaranteed if the feedbacks do not represent the true answers of the panel.
8.3 An exploratory study
8.3.1 Implementation and discussion
The study took place during the annual workshop of the European workinggroup on Reverse Logistics, called RevLog (see RevLog, online), in the end ofthe summer in 2002. Fifteen participants were involved in this study, 13 be-longing to RevLog. The two guests, outside the RevLog group, were a seniorand a more junior researcher. All the participants of this study, either RevLogmembers or not, were familiar with the work of the RevLog group (see Dekkeret al., 2004). The participants were less-junior (e.g. Assistant Professors) andmore-junior researchers (PhD candidates), who use to publish in internation-
8.3. An exploratory study 249
ally renowned scientific journals. The senior researchers of the RevLog groupdid not participate. This was thought to be more adequate. RevLog seniorresearchers are experts in Reverse Logistics, who would dominate the results,even by only causing unintentional inhibition in the more junior researchers.Since this phase had an exploratory character, we favored to give freedom tothe more junior researchers. An earlier report on this study has appeared inDe Brito (2003).
Three groups of 5 people each, were put together. In each group, a mod-erator was nominated. In making the groups we aimed to have a diversity ofresearch backgrounds in each group. During the workshop, each group metat the same time, but in separate rooms. The moderators welcomed the par-ticipants stating that the meeting would serve to gain insights on the futureof reverse logistics research. The discussion followed the general four steps ofthe NGT. The moderators did also participate in all the steps; they count asparticipants as well.
The moderators met before the workshop to discuss the formulation ofthe question. The questions were brought down to the following two:
• What are promising areas for future research on reverse logistics?
• What are promising research areas to include in a follow-up RevLogproject?
The moderators auto-tested the question. The test showed that the secondquestion would lead to highly individually-centered research subjects whilethe first would give more room for other research subjects than the ones eachrespondent is individually involved with. Since this was important to theobjective of discussing promising areas for future research on reverse logistics,and some were invited participants (not members of RevLog) the first questionwas chosen.
Figure 8.1 represents the sheet of paper given to the participants. Partic-ipants were instructed to list any idea on promising ideas for future researchon reverse logistics, on a sheet of paper. They were instructed to synthesizetheir ideas in a few words (one short statement). The participants were given5 minutes to generate ideas individually and in silence, which was respected.After that, the ideas were recorded in a round-robin fashion. This meansgoing around the table asking for one idea from one member, recording iton a flip-chart, and then another idea from the next participant, and so on.Arguments for/against a given idea, or the motivation for it, should not begiven at this point in time. It is also up to the participant that gives the idea,the wording of his/her own idea.
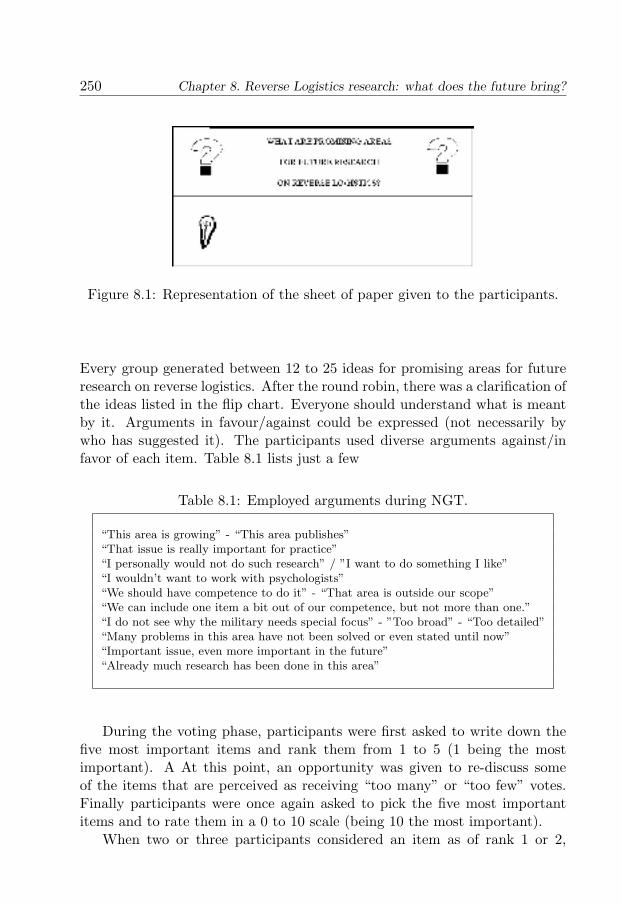
250 Chapter 8. Reverse Logistics research: what does the future bring?
Figure 8.1: Representation of the sheet of paper given to the participants.
Every group generated between 12 to 25 ideas for promising areas for futureresearch on reverse logistics. After the round robin, there was a clarification ofthe ideas listed in the flip chart. Everyone should understand what is meantby it. Arguments in favour/against could be expressed (not necessarily bywho has suggested it). The participants used diverse arguments against/infavor of each item. Table 8.1 lists just a few
Table 8.1: Employed arguments during NGT.
“This area is growing” - “This area publishes”“That issue is really important for practice”“I personally would not do such research” / ”I want to do something I like”“I wouldn’t want to work with psychologists”“We should have competence to do it” - “That area is outside our scope”“We can include one item a bit out of our competence, but not more than one.”“I do not see why the military needs special focus” - ”Too broad” - “Too detailed”“Many problems in this area have not been solved or even stated until now”“Important issue, even more important in the future”“Already much research has been done in this area”
During the voting phase, participants were first asked to write down thefive most important items and rank them from 1 to 5 (1 being the mostimportant). A At this point, an opportunity was given to re-discuss someof the items that are perceived as receiving “too many” or “too few” votes.Finally participants were once again asked to pick the five most importantitems and to rate them in a 0 to 10 scale (being 10 the most important).
When two or three participants considered an item as of rank 1 or 2,
8.3. An exploratory study 251
later more participants rated this item. To this may have contributed, onthe one hand, valid arguments during the second round of discussion, and, onthe other hand, an inherent search for group consensus. In contrast, we alsoobserved that some items were highly but single-rated. This seems to indicatethat some participants do not give up from the subjects that are most dearto them.
8.3.2 Observations and input for the Delphi Study
It is not our purpose here to report on the ideas listed as being the promisingareas for future research on reverse logistics. It is to be kept in mind thatthis was an exploratory study to thwart the way for the main study, i.e. theDelphi. The objective was to gain insights on possible pitfalls or on helpfulhints to conduct the Delphi study.
We observed that many of the items did not have to do with logisticsalone. Words like integration, coordination, acquisition, marketing, and ac-counting were among the ideas of the participants as promising areas forfuture research on Reverse Logistics. This announces that researchers in thefield are conscious of the multidisciplinary character of reverse logistics. Be-sides this, participants anticipate the development of the field in the directionof Integrated Reverse Logistics (in words like co-ordination, strategic) or evenExtended Reverse Logistics (in words like acquisition and marketing). Thiswould demand co-ordination with other research fields and therefore allianceswith researchers with other core expertise than reverse logistics. With this inmind, the invited panel for the Delphi included not only specialized reverselogistics researchers but also other researchers in related areas.
From some of the arguments used during the NGT discussion (see Table8.1), one notices that the ideas are biased by personal opinions and preferences(e.g. “I personally would not do such research”). Therefore, the Delphiquestionnaire was designed with a group of questions on the participant’sview of the state of the art of reverse logistics research. On the one hand,participants were asked about what they considered to be 1) important pastresearch contributions, and 2) major limitations in reverse logistics research(see Table 8.2). Furthermore, when asking on promising areas for futureresearch, participants were asked about areas of 1) their own expertise, butalso 2) outside their own expertise.
252 Chapter 8. Reverse Logistics research: what does the future bring?
8.4 Design and implementation of the Delphi
A team of four researchers put together this research project. The generalstructure of the Delphi study was as follows: a first questionnaire was sentto a panel of experts; after receiving the answers, those were processed anda second communication was sent to the panel. The second communicationserved to inform the panel on the obtained answers. At the same time, thepanel was asked to rank and rate the answers.
Before selecting the panel of experts, we discussed the range of the ques-tionnaire. A group of international academics active in reverse logistic issueswas chosen since the object of the study is primarily the development of re-verse logistics as a research field. All the 35 invited academics accepted toparticipate. The participants are associated either with European or NorthAmerican universities.
The first questionnaire included three groups of six questions about re-search, theory/modelling, and pedagogy. The aspects covered by the researchand modelling/theoretical questions were: major research contributions sofar, limitations of current research, topics for future research, research trendsand breakthroughs. The questions about pedagogy were about the main chal-lenges in teaching and on what could ease the task of teaching (see Table 8.2).Many of the questions were related. For instance, some of the questions aboutresearch (in general) and theory/modelling issues were very much the same,stimulating answers enriched by further details. The questionnaire was testedfor wording and understanding PhD students on the logistics and other areas.The improved questionnaire was given to all the participants.
Table 8.2: Topics covered by the Delphi questionnaire.Research Theory/Modelling Pedagogy
· major research contributions so far;· limitations of past research; · challenges;· topics for future research (own expertise);· topics for future research (others’ expertise); · utilities to ease· research trends; the teaching tasks;· research breakthroughs;
During the analysis of the answers, we proceeded to grouping in somedegree (e.g. when the same was said by means of different words), but severalanswers were unique. Both were reported to the panellists in the 2nd ques-tionnaire, which was in itself a feedback on the first. The answers for each
8.5. Reverse Logistics researchers and the panel 253
question were handed over, varying between 8 and 22 items depending on thedegree of concordance. At this stage, the participants were generally askedto rank and rate, the top answers, with respect to importance. Regardingtrends, the panel was asked to rank them first and then rating them withrespect to impact. A similar procedure was asked to breakthroughs, whichwere rated with respect to likelihood. Concerning pedagogy, the panel wasasked to rate the answers according to the priority that they should have.Out of the initial 35 panellists, 26 filled-out the 2nd questionnaire.
8.5 Reverse Logistics researchers and the panel
To be aware of the profile of reverse logistics researchers is very relevantbecause the researchers are in fact the resources that have to carry out thefuture research in the field. Concordantly, any suggestions coming out of theDelphi study have to be within their reach. In the reverse logistics field, weroughly recognize three standing kinds of researchers as follows:
• the junior
• the senior
• the accidental
Table 8.3 describes the main strengths and the foremost weakness of thesethree research-types. Please note that this is rather a caricature-approachthan a rigorous characterization.
The panel was constituted by 35 invited academics, 16 associated withEuropean universities and 19 with North American universities. From the twocontinents, both senior and more junior researchers participated in the Delphistudy. These researchers are experienced in teaching and they publish ininternationally renowned journals like Management Science, Harvard BusinessReview, California Management Review, Operations Research and so forth.Most of the researchers have a strong background in operations research andoperations management. Among the panel there were also other researchers ofwhich much of their work is focused on supply chain management, industrialecology, systems dynamics and environmental management, among others. Insum, the panel incorporated the three types researchers (Table 8.3).
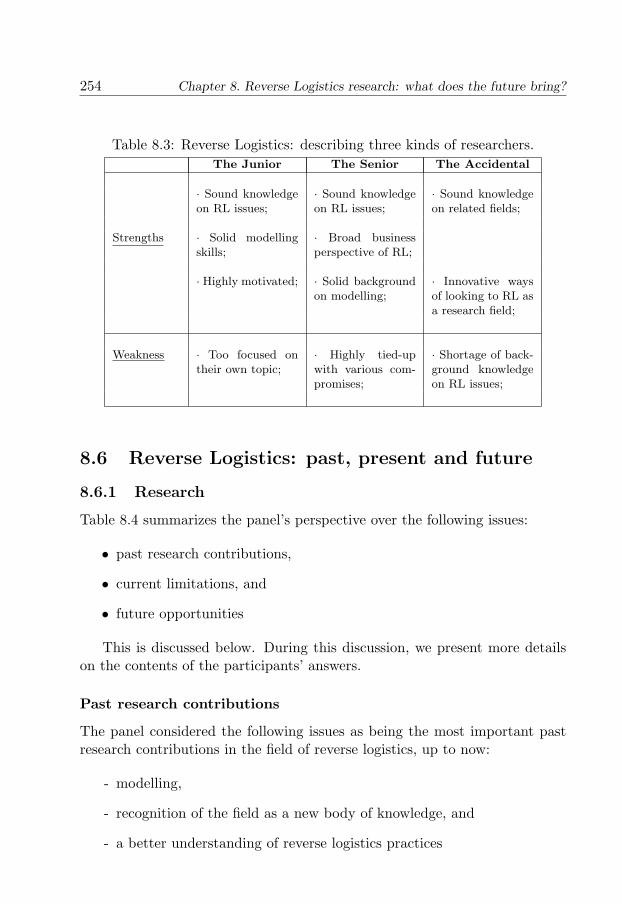
254 Chapter 8. Reverse Logistics research: what does the future bring?
Table 8.3: Reverse Logistics: describing three kinds of researchers.The Junior The Senior The Accidental
· Sound knowledgeon RL issues;
· Sound knowledgeon RL issues;
· Sound knowledgeon related fields;
Strengths · Solid modellingskills;
· Broad businessperspective of RL;
· Highly motivated; · Solid backgroundon modelling;
· Innovative waysof looking to RL asa research field;
Weakness · Too focused ontheir own topic;
· Highly tied-upwith various com-promises;
· Shortage of back-ground knowledgeon RL issues;
8.6 Reverse Logistics: past, present and future
8.6.1 Research
Table 8.4 summarizes the panel’s perspective over the following issues:
• past research contributions,
• current limitations, and
• future opportunities
This is discussed below. During this discussion, we present more detailson the contents of the participants’ answers.
Past research contributions
The panel considered the following issues as being the most important pastresearch contributions in the field of reverse logistics, up to now:
- modelling,
- recognition of the field as a new body of knowledge, and
- a better understanding of reverse logistics practices
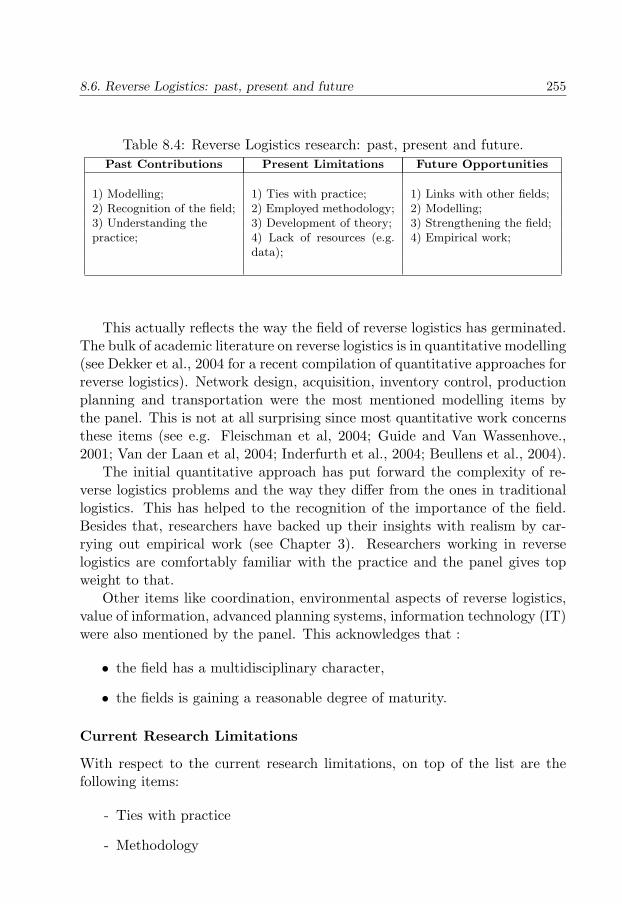
8.6. Reverse Logistics: past, present and future 255
Table 8.4: Reverse Logistics research: past, present and future.Past Contributions Present Limitations Future Opportunities
1) Modelling; 1) Ties with practice; 1) Links with other fields;2) Recognition of the field; 2) Employed methodology; 2) Modelling;3) Understanding the 3) Development of theory; 3) Strengthening the field;practice; 4) Lack of resources (e.g.
data);4) Empirical work;
This actually reflects the way the field of reverse logistics has germinated.The bulk of academic literature on reverse logistics is in quantitative modelling(see Dekker et al., 2004 for a recent compilation of quantitative approaches forreverse logistics). Network design, acquisition, inventory control, productionplanning and transportation were the most mentioned modelling items bythe panel. This is not at all surprising since most quantitative work concernsthese items (see e.g. Fleischman et al, 2004; Guide and Van Wassenhove.,2001; Van der Laan et al, 2004; Inderfurth et al., 2004; Beullens et al., 2004).
The initial quantitative approach has put forward the complexity of re-verse logistics problems and the way they differ from the ones in traditionallogistics. This has helped to the recognition of the importance of the field.Besides that, researchers have backed up their insights with realism by car-rying out empirical work (see Chapter 3). Researchers working in reverselogistics are comfortably familiar with the practice and the panel gives topweight to that.
Other items like coordination, environmental aspects of reverse logistics,value of information, advanced planning systems, information technology (IT)were also mentioned by the panel. This acknowledges that :
• the field has a multidisciplinary character,
• the fields is gaining a reasonable degree of maturity.
Current Research Limitations
With respect to the current research limitations, on top of the list are thefollowing items:
- Ties with practice
- Methodology
256 Chapter 8. Reverse Logistics research: what does the future bring?
- The development of theory
- The lack of resources (e.g. data).
Though researchers are aware of how reverse logistics functions in practice,modelling has not been sufficiently linked with that understanding. The panelrecognized this by mentioning that, on the one hand, the models have manytimes unrealistic assumptions, and, on the other hand, no major policy im-plications come out of the models. These two comments are indeed related,but the essence of it is that the panel faces any short of realism or relevanceas being a limitation to reverse logistics research. Similarly, the panel calledfor more research rigor by bringing to charge unsatisfactory methodology, likethe dominance of mono-disciplinary and case-by-case approaches with over-emphasis on details.
Besides this, reverse logistics as a new body of research suffers from theordinary entanglements of any new field of research. To start with, there islack of theoretical thickness in reverse logistics. The panel touched upon twoitems: insufficient differentiation with respect to forward logistics and the lackof an integrated theory. Besides that, there is a lack of resources, namely dataand problems in accessing the research of other research groups (low visibilityamong research groups).
Both the researchers’ criticism and the more inherent consequences of anovel research field raise many questions that have to be dealt with. Ratherthan a denial of the field, this is a sign that the reverse logistics academiccommunity is ready to strive after more.
Research Opportunities
According to the panel the top opportunities for future research on reverselogistics are:
- links with other fields,
- modelling,
- strengthening the field, and finally
- empirical work.
The message is a sort of
“let’s keep doing what we have been doing, but let’s improve it.”
8.6. Reverse Logistics: past, present and future 257
The way to do it, was also pointed out by the panel. On the one side,by stopping being so narrow and therefore making links with other disci-plines and with practice. The highlighted disciplines/theories were market-ing, design, and the extended product concept. This hints that the field isstretching itself, accompanying developments like the extended supply chainmanagement concept (already noticed in the exploratory study, see Section8.3).
Regarding modelling, the panel pointed at more holistic optimization tak-ing into account ecological, informational, technological, and public matters.The call for links with other disciplines, in particular through holistic mod-els is consistent with the previously identified limitation of mono-disciplinaryprocedures. On the other side, researchers have to work in the inner-self ofthe field to strengthen it. Some directions to do that as referred by the panelinclude clearly identifying the drivers for reverse logistics, the advantages overtraditional forms of logistics, and urging on theoretical build-up for reverselogistics.
8.6.2 Trends and breakthroughs
The panel was also asked about trends and what would be found as a researchbreakthrough. Table 8.5 synthesizes top trends with high impacts and, thetop breakthroughs with high likelihood.
By “top” and “high” we refer to items that fall in the 50% upper-tail ofthe total rankings/ratings. Thus, Table 8.5 resumes all the research trendsthat simultaneously respect this criterion for ranking and then for rating(according to impact). Analogously for breakthroughs, but in this case therating was with respect to likelihood. The reader should keep in mind thatsimilar approaches were used to construct coming tables in this and followingsection.
The panel identifies the following two items as the top research trendswith high impact.:
- the shift from operational to strategic issues, and
- the intensification of tactic-operational issues
At first, the two may appear contradictory but not if one bears in mindthat the shift into strategic issues is likely to be relative. After all, the majorityof researchers in the panel has a strong background on operations (see Section8.5). IT tools is also considered to be a top trend with high impact.
The field seems moving towards integration with forward logistics, as cou-pling reverse and forward logistics is considered to be a top trend with high
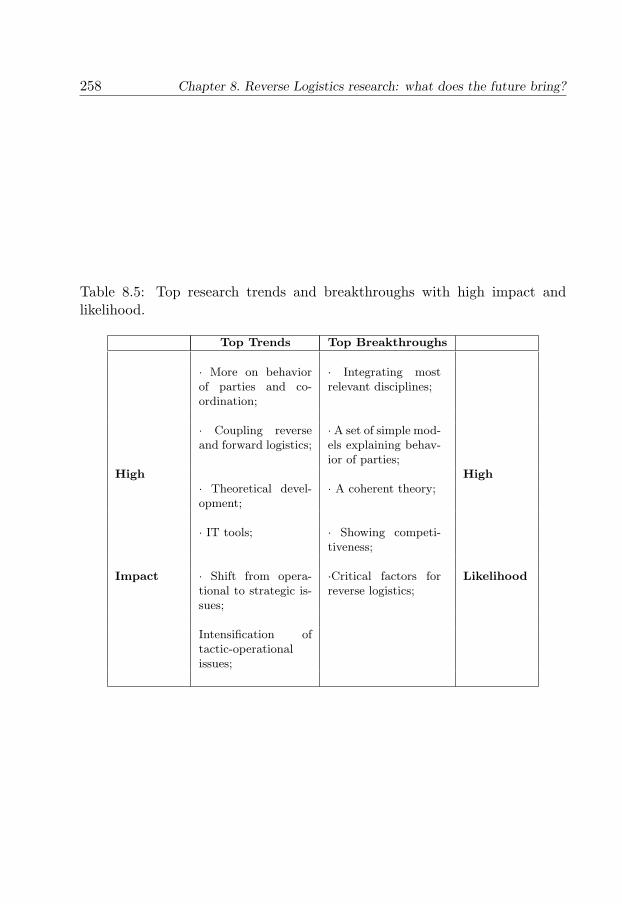
258 Chapter 8. Reverse Logistics research: what does the future bring?
Table 8.5: Top research trends and breakthroughs with high impact andlikelihood.
Top Trends Top Breakthroughs
· More on behaviorof parties and co-ordination;
· Integrating mostrelevant disciplines;
· Coupling reverseand forward logistics;
· A set of simple mod-els explaining behav-ior of parties;
High High· Theoretical devel-opment;
· A coherent theory;
· IT tools; · Showing competi-tiveness;
Impact · Shift from opera-tional to strategic is-sues;
·Critical factors forreverse logistics;
Likelihood
Intensification oftactic-operationalissues;
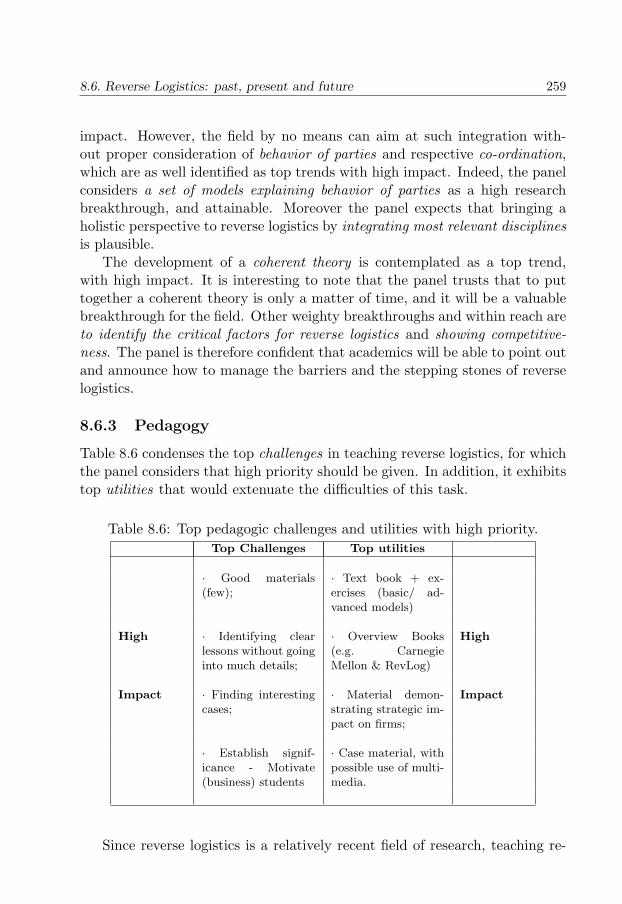
8.6. Reverse Logistics: past, present and future 259
impact. However, the field by no means can aim at such integration with-out proper consideration of behavior of parties and respective co-ordination,which are as well identified as top trends with high impact. Indeed, the panelconsiders a set of models explaining behavior of parties as a high researchbreakthrough, and attainable. Moreover the panel expects that bringing aholistic perspective to reverse logistics by integrating most relevant disciplinesis plausible.
The development of a coherent theory is contemplated as a top trend,with high impact. It is interesting to note that the panel trusts that to puttogether a coherent theory is only a matter of time, and it will be a valuablebreakthrough for the field. Other weighty breakthroughs and within reach areto identify the critical factors for reverse logistics and showing competitive-ness. The panel is therefore confident that academics will be able to point outand announce how to manage the barriers and the stepping stones of reverselogistics.
8.6.3 Pedagogy
Table 8.6 condenses the top challenges in teaching reverse logistics, for whichthe panel considers that high priority should be given. In addition, it exhibitstop utilities that would extenuate the difficulties of this task.
Table 8.6: Top pedagogic challenges and utilities with high priority.Top Challenges Top utilities
· Good materials(few);
· Text book + ex-ercises (basic/ ad-vanced models)
High · Identifying clearlessons without goinginto much details;
· Overview Books(e.g. CarnegieMellon & RevLog)
High
Impact · Finding interestingcases;
· Material demon-strating strategic im-pact on firms;
Impact
· Establish signif-icance - Motivate(business) students
· Case material, withpossible use of multi-media.
Since reverse logistics is a relatively recent field of research, teaching re-
260 Chapter 8. Reverse Logistics research: what does the future bring?
verse logistics has been very much at the ad hoc level with teachers having tostart from scratch while preparing their own material for classes. Textbookson logistics begin to present a few pages dedicated to reverse logistics, butexercises and in-depth cases are nearly non-existent. Finding interesting casesand few good materials are two challenges deserving high priority. Accord-ingly, the panel suggests that top priority is given to instruments like textbookswith exercises and case material. Two overview books to be published thisyear are specifically mentioned (see Guide and van Wassehove, 2003; Dekkeret al., 2004). Reverse logistics issues are many times taught as an appendixof another course like logistics, supply chain, operations, production, and en-vironmental management. Time is thus a pressure factor, contributing todifficulties, as identifying clear lessons without going into much details andto establish the significance/motivating the students. The panel believes thatmaterial demonstrating strategic impact on firms would relieve some of thepressure.
In the questionnaire, we also included a question on which case studiesor real examples researchers use when they teach about reverse logistics. Inanother part of the questionnaire we also asked the panel to name 2 or 3 suc-cessful examples of reverse logistic practices. For those that answered bothquestions, around 60% mentioned examples from car industry and the reman-ufacturing of single-use cameras (mostly associated with Kodak). Around40% also mentioned the remanufacturing of photocopiers (associated withXerox and Oce). However, when compared with the cases that they use inclass, there was some discrepancy with an average 20% decrease in teach-ing the 3 aforementioned successful reverse logistics practices. Partially thepanel explained this discrepancy by affirming that they use in class “theirown cases.” Possibly some of these cases are carried out by Master studentsfor their final thesis. That researchers want to use them in class is under-standable because they will be far more familiar with their own cases, thansomeone else’cases. And, since time is a pressure factor, as mentioned before,the “successful cases” are likely to be sacrificed. But, when this happens, itis not surprising that business students will be easily motivates. Ironically,“motivate (business) students” is considered by the panel as a top challengein teaching reverse logistics and “case material” as a top utility. These issuesare among those that should have top priority, according with the panel.
How can we then give top priority to these issues? An approach is toincrease the knowledge of teachers on “successful cases.” As one researcherstated “I would use Kodak camera and Xerox asset management cases ifthey were available in detail.” To facilitate the accessibility to “successfulcases,” we suggest the organization of educator’s days/sessions in workshops
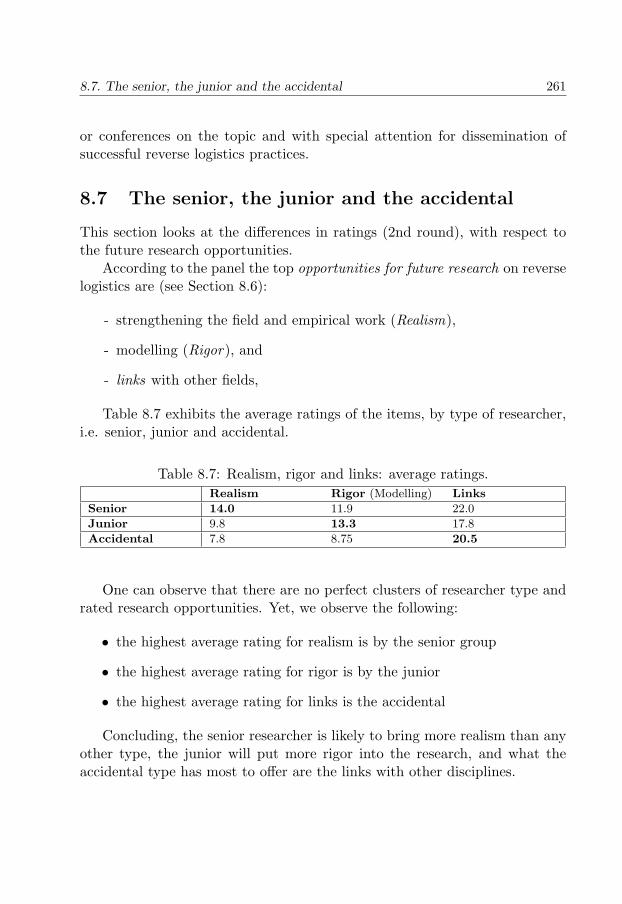
8.7. The senior, the junior and the accidental 261
or conferences on the topic and with special attention for dissemination ofsuccessful reverse logistics practices.
8.7 The senior, the junior and the accidental
This section looks at the differences in ratings (2nd round), with respect tothe future research opportunities.
According to the panel the top opportunities for future research on reverselogistics are (see Section 8.6):
- strengthening the field and empirical work (Realism),
- modelling (Rigor), and
- links with other fields,
Table 8.7 exhibits the average ratings of the items, by type of researcher,i.e. senior, junior and accidental.
Table 8.7: Realism, rigor and links: average ratings.Realism Rigor (Modelling) Links
Senior 14.0 11.9 22.0
Junior 9.8 13.3 17.8
Accidental 7.8 8.75 20.5
One can observe that there are no perfect clusters of researcher type andrated research opportunities. Yet, we observe the following:
• the highest average rating for realism is by the senior group
• the highest average rating for rigor is by the junior
• the highest average rating for links is the accidental
Concluding, the senior researcher is likely to bring more realism than anyother type, the junior will put more rigor into the research, and what theaccidental type has most to offer are the links with other disciplines.
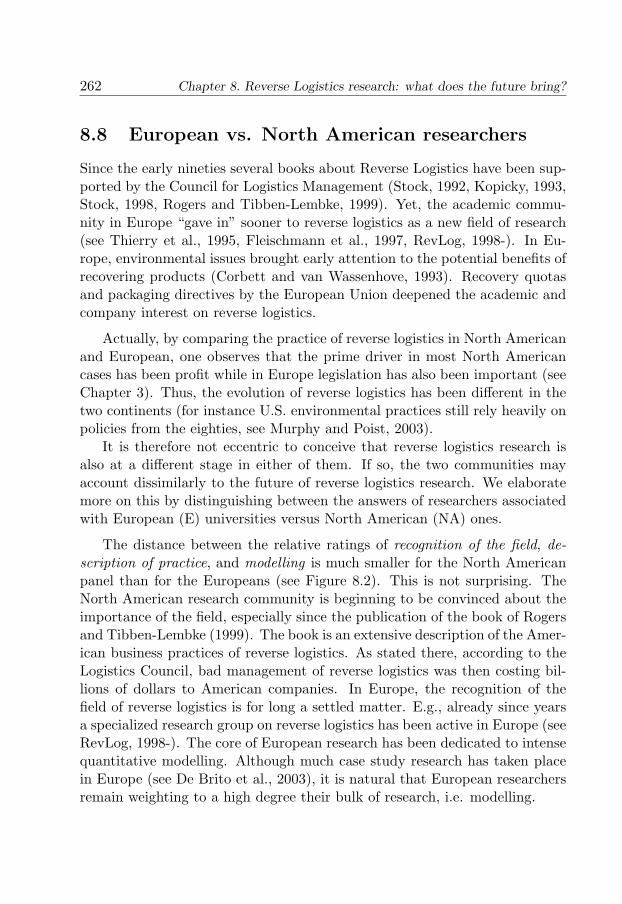
262 Chapter 8. Reverse Logistics research: what does the future bring?
8.8 European vs. North American researchers
Since the early nineties several books about Reverse Logistics have been sup-ported by the Council for Logistics Management (Stock, 1992, Kopicky, 1993,Stock, 1998, Rogers and Tibben-Lembke, 1999). Yet, the academic commu-nity in Europe “gave in” sooner to reverse logistics as a new field of research(see Thierry et al., 1995, Fleischmann et al., 1997, RevLog, 1998-). In Eu-rope, environmental issues brought early attention to the potential benefits ofrecovering products (Corbett and van Wassenhove, 1993). Recovery quotasand packaging directives by the European Union deepened the academic andcompany interest on reverse logistics.
Actually, by comparing the practice of reverse logistics in North Americanand European, one observes that the prime driver in most North Americancases has been profit while in Europe legislation has also been important (seeChapter 3). Thus, the evolution of reverse logistics has been different in thetwo continents (for instance U.S. environmental practices still rely heavily onpolicies from the eighties, see Murphy and Poist, 2003).
It is therefore not eccentric to conceive that reverse logistics research isalso at a different stage in either of them. If so, the two communities mayaccount dissimilarly to the future of reverse logistics research. We elaboratemore on this by distinguishing between the answers of researchers associatedwith European (E) universities versus North American (NA) ones.
The distance between the relative ratings of recognition of the field, de-scription of practice, and modelling is much smaller for the North Americanpanel than for the Europeans (see Figure 8.2). This is not surprising. TheNorth American research community is beginning to be convinced about theimportance of the field, especially since the publication of the book of Rogersand Tibben-Lembke (1999). The book is an extensive description of the Amer-ican business practices of reverse logistics. As stated there, according to theLogistics Council, bad management of reverse logistics was then costing bil-lions of dollars to American companies. In Europe, the recognition of thefield of reverse logistics is for long a settled matter. E.g., already since yearsa specialized research group on reverse logistics has been active in Europe (seeRevLog, 1998-). The core of European research has been dedicated to intensequantitative modelling. Although much case study research has taken placein Europe (see De Brito et al., 2003), it is natural that European researchersremain weighting to a high degree their bulk of research, i.e. modelling.
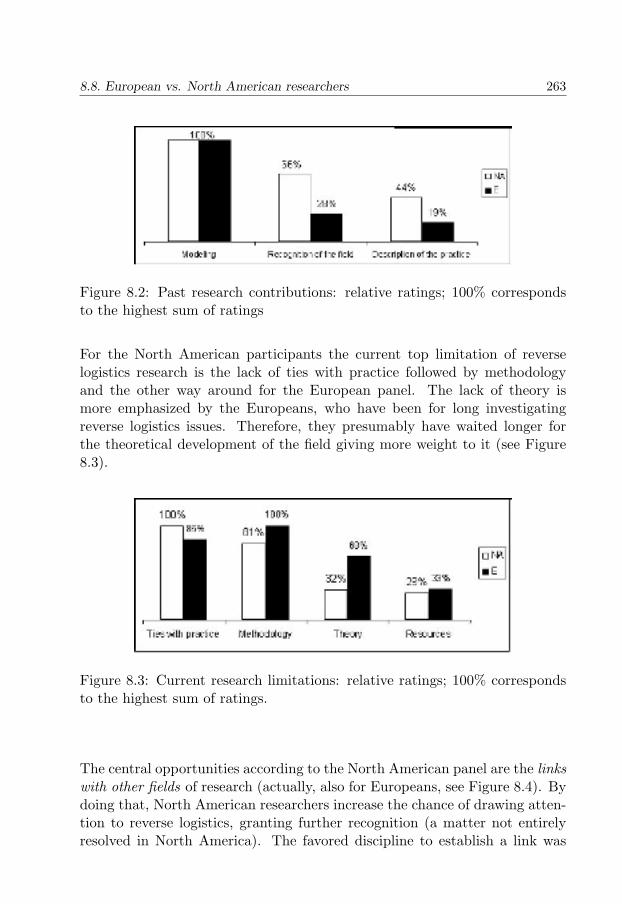
8.8. European vs. North American researchers 263
Figure 8.2: Past research contributions: relative ratings; 100% correspondsto the highest sum of ratings
For the North American participants the current top limitation of reverselogistics research is the lack of ties with practice followed by methodologyand the other way around for the European panel. The lack of theory ismore emphasized by the Europeans, who have been for long investigatingreverse logistics issues. Therefore, they presumably have waited longer forthe theoretical development of the field giving more weight to it (see Figure8.3).
Figure 8.3: Current research limitations: relative ratings; 100% correspondsto the highest sum of ratings.
The central opportunities according to the North American panel are the linkswith other fields of research (actually, also for Europeans, see Figure 8.4). Bydoing that, North American researchers increase the chance of drawing atten-tion to reverse logistics, granting further recognition (a matter not entirelyresolved in North America). The favored discipline to establish a link was
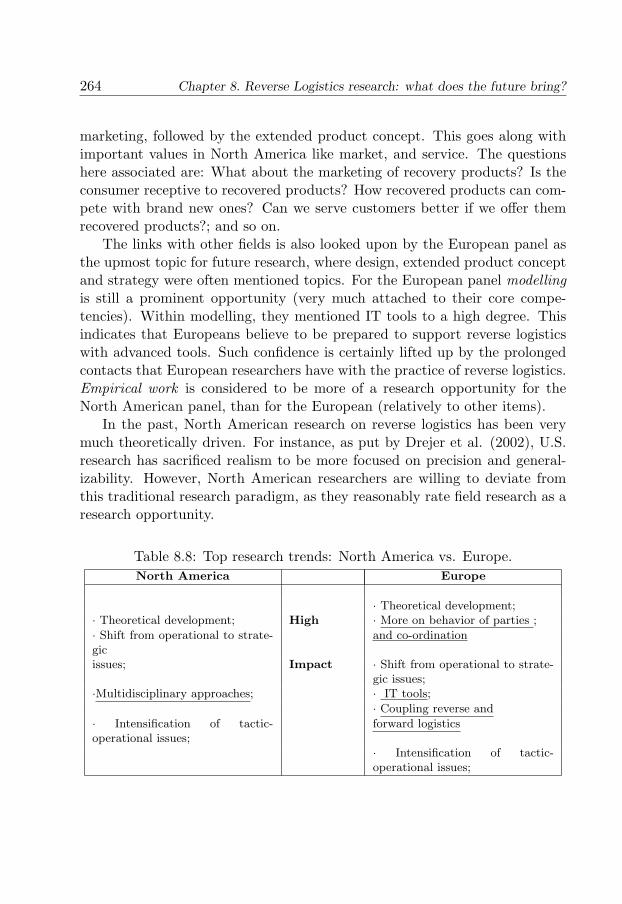
264 Chapter 8. Reverse Logistics research: what does the future bring?
marketing, followed by the extended product concept. This goes along withimportant values in North America like market, and service. The questionshere associated are: What about the marketing of recovery products? Is theconsumer receptive to recovered products? How recovered products can com-pete with brand new ones? Can we serve customers better if we offer themrecovered products?; and so on.
The links with other fields is also looked upon by the European panel asthe upmost topic for future research, where design, extended product conceptand strategy were often mentioned topics. For the European panel modellingis still a prominent opportunity (very much attached to their core compe-tencies). Within modelling, they mentioned IT tools to a high degree. Thisindicates that Europeans believe to be prepared to support reverse logisticswith advanced tools. Such confidence is certainly lifted up by the prolongedcontacts that European researchers have with the practice of reverse logistics.Empirical work is considered to be more of a research opportunity for theNorth American panel, than for the European (relatively to other items).
In the past, North American research on reverse logistics has been verymuch theoretically driven. For instance, as put by Drejer et al. (2002), U.S.research has sacrificed realism to be more focused on precision and general-izability. However, North American researchers are willing to deviate fromthis traditional research paradigm, as they reasonably rate field research as aresearch opportunity.
Table 8.8: Top research trends: North America vs. Europe.North America Europe
· Theoretical development;· Theoretical development; High · More on behavior of parties ;
· Shift from operational to strate-gic
and co-ordination
issues; Impact · Shift from operational to strate-gic issues;
·Multidisciplinary approaches; · IT tools;
· Coupling reverse and
· Intensification of tactic-operational issues;
forward logistics
· Intensification of tactic-operational issues;
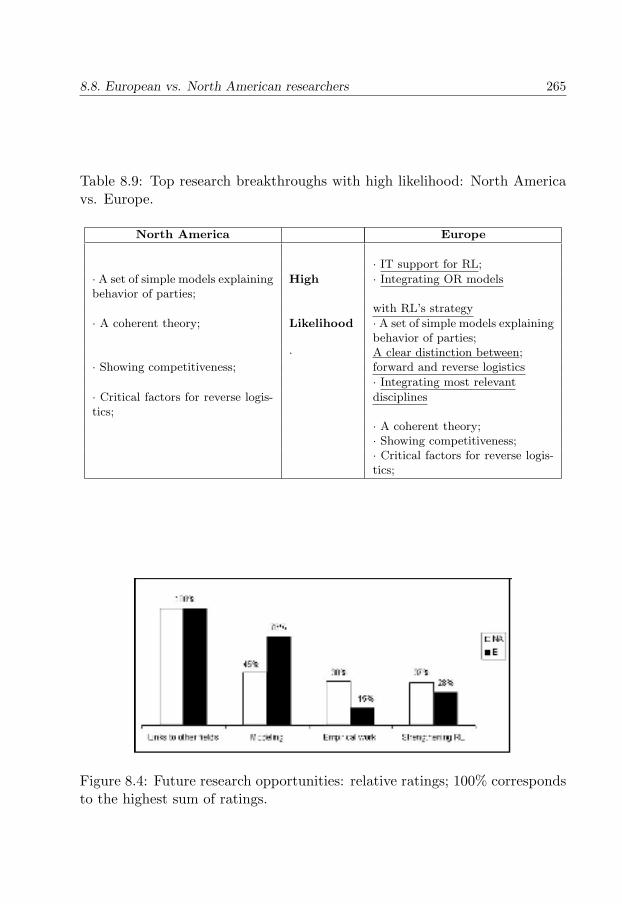
8.8. European vs. North American researchers 265
Table 8.9: Top research breakthroughs with high likelihood: North Americavs. Europe.
North America Europe
· IT support for RL;
· A set of simple models explainingbehavior of parties;
High · Integrating OR models
with RL’s strategy
· A coherent theory; Likelihood · A set of simple models explainingbehavior of parties;
· A clear distinction between;· Showing competitiveness; forward and reverse logistics
· Integrating most relevant
· Critical factors for reverse logis-tics;
disciplines
· A coherent theory;· Showing competitiveness;· Critical factors for reverse logis-tics;
Figure 8.4: Future research opportunities: relative ratings; 100% correspondsto the highest sum of ratings.
266 Chapter 8. Reverse Logistics research: what does the future bring?
Table 8.8 presents the top trends with high impacts and Table 8.9 presentstop breakthroughs with high likelihood. The items that are mentioned aloneby the European or by the North American researchers are underlined. Asmentioned before (Section 5), more on behavior of parties and co-ordinationis a natural consequence of coupling reverse with forward logistics. The NorthAmerica participants also agree that these two items are a top research trendbut they attribute it a lower relative impact. The North American panelaccredits to multidisciplinary approaches more impact than to e.g. theoreticaldevelopment of the field. IT Tools is thought to be a top trend with highimpact for Europeans but not for North American researchers.
The European panel is more condescending with respect to the plausibilityof top research breakthroughs. The long experience of the European researchcommunity is likely to contribute to this.
8.9 A glimpse on the rest of the world
In this chapter we proposed a reflection on the future of reverse logistics as anacademic field (see section 8.1). To do so, we carried out a Delphi study withexperts in research on the field of reverse logistics, and related fields. Theseexperts happen to be affiliated with either with North American or Europeanuniversities, as most of the work in the area has been done there. We wouldlike to remark that we do not imply that the future of reverse logistics dependsexclusively on the developments in these two continents. Throughout thesethesis, some research contributions coming from other geographic areas havebeen as well referred to (Yuan and Cheung, 1998, see Chapter 4); (Diaz andFu (1997); Chang and Wei, 2000; Gupta and Chakraborty, 1984, see Chapter3).
Some of the aforementioned references reported on real life examples. Diazand Fu (1997) applied an inventory model to a case of spare parts managementat the subway system Caracas, Venezuela. Chang and Wei (2000) discussedthe recycling network for household waste of the city of Kaohsiung in Taiwan.Gupta and Chakraborty (1984) reported on the rework taking place in a glassplant in India.
Though Europe is leading in pro-environmental legislation, the environ-mental awareness (and ergo behavior) by governmental institutions is becom-ing a wider phenomena. In Asia, Japan and Taiwan are leading regions onthis matter (see De Koster et al, 2003), though other regions in Asia have along history on recycling.
As remarked by Breukering (2001) India has been using waste paper as raw
8.10. Summary and conclusions 267
material in the glass industry as from the 1950’s and China (including HongKong) imports more than 90% of the total plastic waste traded internationally,which is recycled. The author discussed recycling from the perspective ofinternational trade and how governmental entities (re)act on it. For instance,during the nineties, India increased the import tax on paper waste puttingthe paper recycling industry in trouble. Similarly and around the same time,China prohibited the import of waste plastics. Both actions were later revisedas they were not sustainable for the recycling industry. The conclusion bythe author is that there is a lack of understanding on international tradeof secondary materials, leading to a overemphasis of negative aspects ratherthan looking to the positive ones. The same applies to other regions in theworld.
Wamiti (2001) defends the great potential that reverse logistics has inKenya. The author goes over several examples: 1) the collection of barleyspent grains in the beer industry for further use in farming ; 2) the importsof second-hand shoes and clothing; 3) replacement of engines in used cars; 4)rethreading of tyres. Only the first example is considered really successful.The other cases suffer from governmental policy to protect the (inefficient)local industry.
8.10 Summary and conclusions
We observed that the view of the panel on past research contributions reflectedthe way the field has been growing up. The panel pointed out current limi-tations of reverse logistics research. Some of those are inherited from reverselogistics being a young field of research. In addition, the panel exposed thatmore research rigor, more realism and more relevance need to be broughtto the field; otherwise it will remain very restricted. By the opportunitiespointed out, the field seems to be stretching itself and becoming rather linkedwith other fields of research like marketing. The panel showed confidence inthe plausibility of strengthening the field by e.g. identifying critical factorsfor reverse logistics and putting together a coherent theory (see Section 8.6.1.
With respect to teaching reverse logistics, the main challenges are, ac-cording to the panel: i) finding interesting cases, as well as ii) good materials.Accordingly, the panel suggests that top priority is given to instruments liketextbooks with exercises and case material. Time is a pressure factor as reverselogistics issues are many times taught as an appendix of another course. Thepanel believes that material demonstrating strategic impact on firms wouldrelieve some of the pressure of identifying clear lessons without going intomuch details. We also noticed that there was some discrepancy between the
268 Chapter 8. Reverse Logistics research: what does the future bring?
successful reverse logistics cases and the examples discussed in class. A plau-sible reason is that teachers lack of in-depth familiarity with those successfulpractices.
Aligned with this, we suggest the organization of educators’ days/sessionsin workshops or conferences on the topic with special attention for the dis-semination of successful reverse logistics practices. These sessions should aimto support reverse logistics teaching. Therefore, it is expected that the formatwill be somewhat different from the traditional workshop/conference presen-tations.
In addition we indicated how close the views of the European and NorthAmerican participants are. The North American research community is start-ing to accept the importance of the field, giving appreciable importance torecognition of the field, description of practice, and modelling as past contri-butions. The Europeans, who have been for long investigating reverse logisticsissues, have waited longer for the theoretical development of the field givingmore weight to it as a current limitation. As the top research opportunity,both North American and European agree that it is to link reverse logisticswith other fields. The favored discipline to establish a link for the NA re-searchers is marketing, followed by the extended product concept, reflectinghow important values like market, and service are in North America. Euro-peans give also substantial weight to future modelling as an opportunity, andwithin it they often mentioned IT. This indicates that Europeans believe tobe prepared to support reverse logistics with advanced tools. Such confidenceis certainly a result of their a long history of contacts with practice.
In the past, North American research on reverse logistics has been verymuch theoretically driven. However, North American researchers are willingto deviate from this traditional research paradigm, as they reasonably ratefield research as a research opportunity. Finally, the European panel was morecondescending with respect to the plausibility of top research breakthroughs.Again, the long experience of the European research community with reverselogistics is likely to contribute to this.
We have assessed which future academicians expect for reverse logisticsas a research field. In essence the panel claimed for
• more realism,
• more rigor, and
• more links with other disciplines.
These are undoubtedly ambitious aspirations. The question that remainsis: how can we work so this becomes reality? First of all, the fact that there is
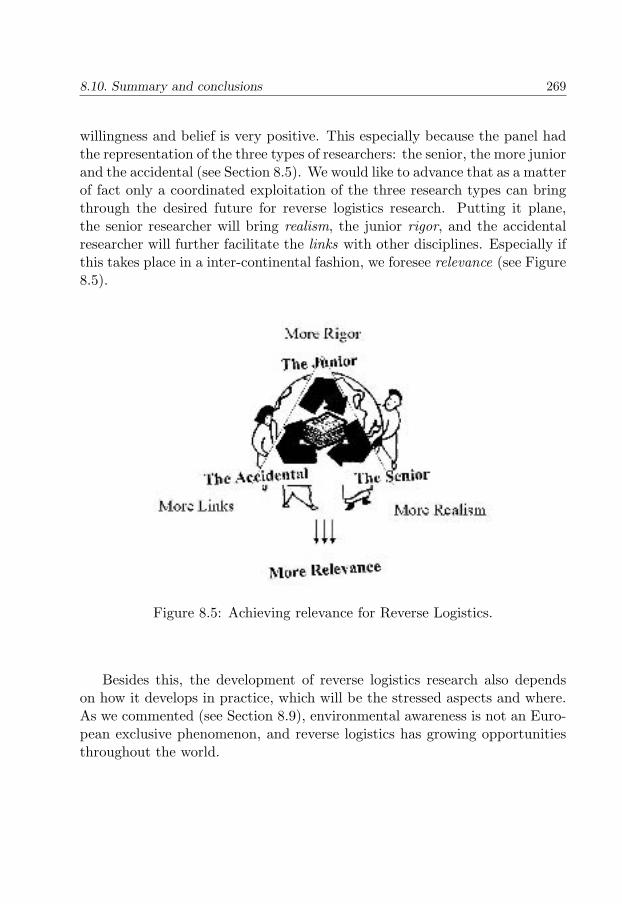
8.10. Summary and conclusions 269
willingness and belief is very positive. This especially because the panel hadthe representation of the three types of researchers: the senior, the more juniorand the accidental (see Section 8.5). We would like to advance that as a matterof fact only a coordinated exploitation of the three research types can bringthrough the desired future for reverse logistics research. Putting it plane,the senior researcher will bring realism, the junior rigor, and the accidentalresearcher will further facilitate the links with other disciplines. Especially ifthis takes place in a inter-continental fashion, we foresee relevance (see Figure8.5).
Figure 8.5: Achieving relevance for Reverse Logistics.
Besides this, the development of reverse logistics research also dependson how it develops in practice, which will be the stressed aspects and where.As we commented (see Section 8.9), environmental awareness is not an Euro-pean exclusive phenomenon, and reverse logistics has growing opportunitiesthroughout the world.

Chapter 9
Concluding remarks
Now this is not the end.It is not even the beginning of the end.But it is, perhaps, the end of the beginning.
Sir Winston Churchill
The research presented in this thesis was designed to provide a better under-standing of reverse logistics. We brought insights to reverse logistics decision-making and we laid down a theoretical ground for the development of reverselogistics as a research field.
This thesis aimed at
• structuring reverse logistics as a research field,
• a better understanding of reverse logistics practices,
• structuring and supporting reverse logistics decision-making, and
• conjecturing about the future development of reverse logistics as a re-search field.
In the remainder of this chapter, we summarize the main findings. Besidesthat, we go over the limitations and put forward opportunities for furtherresearch.
9.1 Summary and conclusions
Here we recapitulate the findings of this thesis. To do so, we consider thechapters one by one.
271
272 Chapter 9. Concluding remarks
Chapter 2: To structure the field and to provide an overall under-standing of reverse logistics.
This chapter provided an overall understanding of reverse logistics by struc-turing the field. In fact, we put together a framework for reverse logistics, i.e.a basic conceptional structure for reverse logistics, as follows: we identified theelementary ingredients (dimensions) of reverse logistics, we structured them,and we described their relations to each other.
To build the framework we employed three sources of input: selective liter-ature, a review of case studies (Chapter 3 of this thesis), and the knowledge onreverse logistics that was accumulated throughout the whole PhD trajectory.
To build up the framework for reverse logistics five key dimensions wereconsidered:
• Why products go back in the supply chain i.e. Why- returning ;
• Why companies become active with reverse logistics, i.e. Why-receiving ;
• What is being returned? The analysis comprised, on the one handcrucial product characteristics for reverse logistics, and on the other aclassification of products types;
• How are returns processed? In this respect we described the overallprocesses in a reverse logistics process, and we gave special attention torecovery options;
• Who is executing reverse logistic activities? Here, the enquiry was onthe actors and their roles in implementing reverse logistics;
More specifically, we have differentiated three driving forces for reverselogistics:
• economics,
• legislation, and
• corporate citizenship.
We have also stressed that the economic gains can either be direct orindirect. Furthermore, the three drivers are also interlinked and boundariesare sometimes blurred, as reverse logistics is often carried out for a mix ofmotives.
The return reasons were organized according to three supply chain stages:
9.1. Summary and conclusions 273
• manufacturing returns, which embrace raw material surplus, quality-control returns, and production leftovers or by-products.
• distribution returns, which include product recalls, returns coming backdue to commercial agreements (B2B commercial returns), internal stockadjustments and functional returns.
• customer returns, which comprise reimbursement guarantees, warrantyreturns, service returns, end-of-use and end-of-life returns.
The recovery options can be organized in great concordance with Thierryet al, 1995, that is product level (repair); module level (refurbishing); com-ponent level (remanufacturing); selective part level (retrieval); material level(recycling); energy level(incineration).
On product characteristics, we qualified three main product features af-fecting reverse logistics:
• the composition of the product,
• the deterioration process, and
• the use-pattern.
On product types, the typology presented was inspired by the work ofFleischmann et al. (1997) and the UN product’s classification, and the fol-lowing types were differentiated:
• civil objects,
• consumer goods,
• industrial goods,
• ores, oils and chemicals,
• packaging and distribution items,
• spare-parts, and
• other materials (like pulp, glass and scraps).
Regarding actors in reverse logistic systems, we divided them in threegroups:
• typical forward supply chain actors,
274 Chapter 9. Concluding remarks
• specialized reverse chain players,
• governmental institutions, and
• opportunistic players.
With respect to their roles, we detected 1) actors that are actually re-sponsible for operations in the reverse logistics chain; 2) others, that set upor combine operations, they have a role of an organizer ; 3) many parties arebusy carrying out the processes, like the collectors, so they play an executerrole; 4) there is the sender/giver that facilitates the product for recovery andthe future client that will acquire recovered products, without which recoverywould not make practical sense, so they have an accommodator role.
We stressed that the combination and characterization of the five dimen-sions determine to a large extent the kind of issues that arise in implementing,monitoring and managing such a system. This was illustrated with a collec-tion of typical cases.
Chapter 3: To provide a diversity of reverse logistics activities (andto help constructing the framework).
One cannot provide proper insights into reverse logistics without being famil-iar with how firms are dealing with it in practice, which are the trade-offsduring decision-making, how decisions are being supported, and so on.
We have provided a content analysis of more than 60 cases reported inthe literature dealing with reverse logistics aspects. The study was organizedaccording to the following topics 1) Network Structures, 2) Relationships, 3)Inventory Management, 4) Planning and Control, and 5) Information Tech-nology.
We remarked that Reverse Logistics Network Structures are well organizedaround the typologies on the how and the who. The cases found included thefollowing:
• Networks for re-distribution/re-sale,
• Networks for remanufacturing,
• Networks for Recycling - Public Networks, and
• Networks for Recycling - Private Networks.
9.1. Summary and conclusions 275
The cases showed that there are quite different incentive tools to enforcecertain desired behavior: 1) deposit fees; 2) buy back options; 3) trade-in’; 4)acquisition price; 5) timely and clear information; 6) power; 7) appealing forenvironmental responsibility; 8) appealing for social responsibility.
Some incentives are also part of sales contracts, while others require thecustomer to buy another product in exchange. There are also tools that arenot directly coupled to a selling activity like a gift to a non-profit organization.Actually, it seems that only deposit fees are specific for product recovery. Theother mentioned tools are also used to attract customers in general.
Concerning Inventory Management, the why-returning typology seemed anatural way of grouping and discriminating the reverse logistics issues raisingfrom the cases. We found cases for
• Commercial returns,
• Service returns,
• End-of-use, and
• End-of-life.
We found case studies on planning and control of product recovery inthe following categories: 1) the separate collection of (parts of) products forrecovery 2) the separate processing of (parts of) products for reuse or disposal3) the combined planning and control of collection of products for recoveryand distribution of new products 4) the combined planning and control ofprocessing products for recovery and production of new products
For each of the above decision-making areas, we concluded that some of thedimensions of the framework (see Chapter 2) are predominantly important,as follows
• Networks ⇔ Recovery option (How) and Actor (Who)
• Relationships ⇔ Actor (Who)
• Inventory Management ⇔ Return reason (Why-returning) and Producttype (What)
• Production Planning ⇔ Recovery option (How) and Actor (Who)
276 Chapter 9. Concluding remarks
Besides the analysis per decision-making area, we also presented the casesorganized by return reason (why-returning) vs. recovery option (how), andthe cases organized by driver vs. recovery option. This analysis revealed somerelations and issues. For instance, end-of-life returns appear to be highly cor-related with recycling. If products or their modules would be designed forremanufacturing, however, remanufacturing would likely be more attractive,even at the end of life. The main driver for recycling is legislation. Actually,current legislation does not seem to be able to stimulate other forms of recov-ery. However, if legislation would also pro-actively focus on product designissues, rather than dealing with recovery in a reactive way, other recoveryoptions than recycling would likely be more stimulated.
In addition, we reported on cases describing the use of IT to supportreverse logistics. We found cases reporting evidence for IT support in allthe stages of the life-path of a product: product development, the supplychain loop, and at the customer. For instance the data logger technology (seeEUREKA, 2003) is very promising regarding the need of a quick access ofthe state of the product. In this way uncertainty on quality can be reducedand savings can be made on activities, as e.g. disassembling. The casesalso show that though the technology to process and to transmit informationwith promising benefits for reverse logistics seems to be available, the lackof appropriate data is in still a bottleneck in the implementation of decisionsupport systems.
We observed a lack of cases on reimbursement returns. However, with thegrowth of the catalogue industry (also in the Internet), posing new challenges.Ergo, field research in this area is likely to growth as well.
The majority of the case studies dealt with one aspect of a real reverselogistics situation but they did not give the overall business environment,which made insights rather one-dimensional. Thus, we pointed out the needfor conducting more integral case study research, by mapping the businesscontext together with more broad information on critical factors, trade-offsand implications.
Besides that, the lack of theory for reverse logistics (see Dowlatshahi,2000) or even for supply chain management (Croom et al., 2000) adds tocompanies’ inability of knowing what matters in reverse logistics. Thereforethe development of theory should be on top of the research agenda to supportreverse logistics decisions.
9.1. Summary and conclusions 277
Chapter 4: To put forward the state-of-the-art of quantitative mod-els for return handling and to identify opportunities for future re-search
Though available quantitative models can be adapted to support warehousingreturn handling, this has been largely ignored up to now. For a number ofresearch areas, we highlighted how forward models can be extended or newmodels can be launched to include return handling in areas such as:
• facility layout & design,
• outsourcing,
• integrating operations (return policy and reusable packaging),
• inventory management,
• internal (return) transport,
• information systems,
• inventory, storage and order picking control, and
• vehicle planning and scheduling.
We brought to the attention several research opportunities, which canbe turned in a research agenda, as follows: What is the impact that returnflows have on 1) the warehouse layout; 2) material handling systems (e.g.,whether dedicated return handling systems do pay off); 3) vehicle planningand scheduling (mind sequencing restrictions); 4) storage and picking proce-dures (e. g. route combination of returns’ storage and pick ups). Further-more we suggested the use of the Mathematical Programming problem withEquilibrium Constraints (MPEC) formulation to e.g. help retailers decidingupon the return policy. A new direction to inventory modelling was also putforward by categorizing customers in two classes, i.e. less- and more- prof-itable depending on whether the customer (systematically) returns, or not,merchandize.
Chapter 5: To identify the main factors contributing whether, ornot, to combine forward and reverse flows during return handling.
The identified factors during transport to the warehouse, the receipt at thewarehouse, and, storage are respectively as follows: to have, or not, stores;the return volume; and, the future market for returns.
In more detail, we conjectured that:
278 Chapter 9. Concluding remarks
• For retailer organizations that supply (a sufficient number of) stores itis more efficient to collect the returned products, carriers and waste tothe distribution center with the same truck that delivers the products.
• For retailers that handle a high volume of returns, it is more efficient tounload and sort returns in a separate area of the distribution center.
• If the market for returns is different from the original market then prod-uct to store returns in a different area from those of purchased productsis preferable.
• If the market for returns is the same then storage of product returnsis likely to be combined with purchased products. Exceptions will befound in the case of high-desired control over returned products
Before we started this specific research project we suspected that the com-bination of volume and product diversity would have an impact on the storagedecision. From the analysis though it came out that the complicating factorwas the decision of controlling returns. Yet, both volume and product diver-sity can be a point of further research since they might not be a complicatingfactor alone but be so when combined with other factors. Furthermore, tohave a relevant degree of return monitoring and control, a separate modulefor returns in the warehouse management system is desirable as it is alreadythe case for mail order companies.
Chapter 6: To inquire the validity of common assumptions in theinventory management literature with product returns.
We established a framework for the statistical testing of common assumptionsin the inventory management literature with product returns, i.e.
• the demand process is a Homogeneous Compound Poisson Process (HCPP).
• the return process is a Homogeneous Compound Poisson Process (HCPP).
• the time elapsing between return and demand occurrences follows anegative exponential distribution;
With the developed methodology it was possible to carry out the desiredtesting including small (below 20) sample sizes. Only for extremely smallsample sizes, the methodology does not work. It is unambiguous that inthe last case, either the proposed or any other statistical framework cannot
9.1. Summary and conclusions 279
guarantee rigor. We employed the framework to three sets of real data, asfollows
Case 1: data from an in-company warehouse with internal returns inSwitzerland (CERN).
Case 2: data from a mail-order company with commercial returns in theNetherlands (referred to as MOC).
Case 3: data from an in-company warehouse in the Netherlands (referredto as RF).
We found products for which the common assumptions on the theoreticalmodels fit reasonably, but also products for which they do not. Regardingthe (non-)validity of the common assumptions, we empirically observed that:
• Demand may not behave as an HCPP due to seasonality or over longperiods of time;
• In non-stationary environments, the return process may behave as anHCPP;
• Time to return may not behave as an exponential distribution due to along tail or on account of the short-lag returns;
Concerning inventory management and control, we suggested that compa-nies would separate short-lag returns from long-lag returns. Then, to proceedto netting of the short-lag returns and to monitor the long-lag returns (returndistribution, the return rates and register return reasons). The most gains offeeding inventory policies with detailed information on product returns arelikely to be in medium well-behaved environments.
Chapter 7: To assess the impact of (mis)information on inventorymanagement
In the literature there are not many references related to research on the im-pact of information on inventory management with product returns. The onesthat exist generally assume known return probabilities or consider specificcases where the most-informed method leads to the best forecast. However,in environments where data is scarce or unreliable, or in environments thatare volatile, information may be misleading. This motivated us to assess theimpact that misinformation has on inventory management.
In order to bring the first insights on this matter, we focused on a staticenvironment where consistently the forecasted return rate or the return dis-tribution does not correspond to the true behavior. We considered a single
280 Chapter 9. Concluding remarks
product, single echelon, periodic review inventory system. We followed theapproach of Kelle and Silver (1989). Accordingly, we employ a base-stockpolicy and four different methods are used to forecast the net demand dur-ing the lead time. The four methods use different levels of information, withrespect to returns:
• Method A - Average behavior. This method estimates returns during thelead time through the overall return probability. Demand and returnsduring the lead time are simply netted. No historical information isused with respect to demands and returns, so in a static environmentthe resulting base stock level is constant in time.
• Method B - Return distribution. This method makes use of the returndistribution (return probabilities, per period) to determine the numberand moment of the returns during the order lead time.
• Method C - Return distribution & return information per period. Thismethod updates the number of items that have returned, which areobserved, and takes this into account to compute future returns.
• Method D - Return distribution & tracked individual returns. To employthis method, one has to be able to trace back the returns, i.e. to knowfrom which order period each specific return is coming from.
We identified situations in which the most informed method does not nec-essarily lead to the best performance. This is the case when one consistentlyoverestimates or underestimates the return rate per period.
Both for misinformation on the return rate and on the return distribution,the differences between the methods become smaller with decrease of thereturn probability and an increase of the lead time.
The most robust method given misestimation of the return rate is MethodB. Method B systematically outperforms Methods C and D if the return rateis misestimated by merely 10%,or more. The cost differences are particularlyhigh if return rates are overestimated. With respect to misestimating theconditional time to return distribution, Method C and again Method B aremuch more robust than Method D.
The findings strongly suggested that Method B has a sufficient level ofsophistication both in the case of perfect estimation and imperfect estimation.In the latter case Method B is far more robust than the most informed method,Method D.
9.1. Summary and conclusions 281
Chapter 8: To assess which future do academicians expect for re-verse logistics as a research field
The field of Reverse Logistics has been expanding fast and it remains a fieldin formation. To reflect on the future of reverse logistics as an academicfield, we carried out a Delphi Study with an international panel of academicsworking on reverse logistics issues. The study consisted of two rounds ofanonymous questionnaires with an intermediary feedback phase. In short,every member received information on the answers to the first questionnaire,which they could rank and rate. The overall analysis allows us to evaluatereverse logistics issues with respect to research and teaching.
We observed that the view of the panel on past research contributionsreflected the way the field has been growing up. The panel pointed out currentlimitations of reverse logistics research. Some of those are inherited fromreverse logistics being a young field of research. In addition, the panel exposedthat more research rigor, more realism and more relevance need to be broughtto the field; otherwise it will remain very restricted. By the opportunitiespointed out, the field seems to be stretching itself and becoming rather linkedwith other fields of research like marketing. The panel showed confidence inthe plausibility of strengthening the field by e.g. identifying critical factorsfor reverse logistics and putting together a coherent theory.
With respect to teaching reverse logistics, the main challenges are, accord-ing to the panel, finding interesting cases as well as good materials. Accord-ingly, the panel suggests that top priority is given to instruments like textbookswith exercises and case material. Time is a pressure factor as reverse logisticsissues are many times taught as an appendix of another course. The panelbelieves that material demonstrating strategic impact on firms would relievesome of the pressure of identifying clear lessons without going into much de-tails. Besides this, we also noticed that there was some incoherency betweenthe successful reverse logistics cases and the examples that teachers discussin class. Thus, to facilitate the accessibility to successful cases,” we suggestedthe organization of educators days/sessions in workshops or conferences.
In addition we compared the views of the European and North Americanparticipants are. The North American research community is starting to ac-cept the importance of the field, giving appreciable importance to recognitionof the field, description of practice, and modelling as past contributions. TheEuropeans, who have been for long investigating reverse logistics issues, havewaited longer for the theoretical development of the field giving more weightto it as a current limitation. As the top research opportunity, both NorthAmerican and European agree that it is to link reverse logistics with other
282 Chapter 9. Concluding remarks
fields. The favored discipline to establish a link for the NA researchers is mar-keting, followed by the extended product concept, reflecting how importantvalues like market, and service are in North America. Europeans give alsosubstantial weight to future modelling as an opportunity, and within it theyoften mentioned IT. This indicates that Europeans believe to be prepared tosupport reverse logistics with advanced tools. Such confidence is certainlya result of their long history of contacts with practice. On this, and in thepast, North American research on reverse logistics has been very much theo-retically driven. However, North American researchers are willing to deviatefrom this traditional research paradigm, as they reasonably rate field researchas a research opportunity. Finally, the European panel was more condescend-ing with respect to the plausibility of top research breakthroughs. Again, thelong experience of the European research community with reverse logistics islikely to contribute to this.
We assessed which future academicians expect for reverse logistics as aresearch field. In essence the panel claimed for more rigor, more realism andmore relevance of the field at the same time that links should be made withother disciplines. These are undoubtedly ambitious expert aspirations. Wealso stressed how we can work to make this happen. First of all, the fact thatthere is willingness and belief is very positive. This because the panel had therepresentation of the three types of researchers: the senior, the more juniorand the accidental. We advanced that as a matter of fact only a coordinatedexploitation of the three research types can bring through the desired futurefor reverse logistics research. Putting it plainly, the senior researcher willbring realism, the junior rigor, the accidental researcher will facilitate thelinks with other disciplines: all together produces relevance.
9.2 Raising questions and further research
This thesis was carried out throughout three phases: 1) design, 2) data col-lection and analysis, and 3) reflection. During the design phase a carefulplan was put together with input both from experts on reverse logistics andfrom the literature of the field. The next phase, data collection and analysiswas organized in several projects, tuned with the pre-set objectives. In eachof these projects, there was collaboration with one or more researchers fromthe European Working Group on Reverse Logistics, RevLog . This providedtriangulation with respect to the role of the researcher. Triangulation is inessence a plural approach to research, aiming at diminishing research biases.This thesis benefited not only from investigator triangulation, but also from
9.2. Raising questions and further research 283
data triangulation (different sources of data as both professional and academicrenowned journals) and combination of different methods (e.g. analytical andsimulation). During the reflection phase, we followed the standard informalprocedure of the Erasmus University Rotterdam: each chapter in turn wasdiscussed with the promoters and revised accordingly. Special attention waspaid to coherence, significance, and lacunas, improving the internal, the con-struct, and the internal validity of this thesis.
However, a scientific research project and its findings is also meant to raisequestions, otherwise it would not meaningfully contribute to the advance ofscientific knowledge. Every chapter of this thesis ends with research limita-tions and/or research opportunities. Next, we propose overall directions forfuture research on the field of reverse logistics, based on two main questionsthat arise after a reflection on this thesis.
How can scientific reverse logistics research support decision-making in practice?
In our view, the course to tackle this is twofold: 1) on the one hand,to learn more about reverse logistics practices, 2) on the other hand, toadapt/develop methods to aid specific critical decisions. Obviously, the firstwould be an input to the second. To learn more about practice, one canemploy qualitative research methodologies, such as comparative case studyresearch. We suggest the use of theoretical sampling, i.e. having in mind theforeseeable degree of understanding that the case study in question brings tothe field. Regarding decision-making methods, a great help can come fromquantitative models. Yet, as the Delphi study showed, more realism is needed(see Chapter 8). There is a need to break with the traditional assumptions,for instance in the literature on inventory modelling with returns. A necessarydirection is to develop models suitable for the non-stationary (real) situations,as it happens in the presence of seasonal products (see Chapter 4).
How can scientific reverse logistics research contribute to estab-lish a reverse logistics theory?
It seems inevitable that reverse logistics will grow as a research field andthat its scope will widen. In Chapter 1 we described how the definition ofreverse logistics changed over time. We are confident that a reverse logisticstheory can be established but to do that both inner and outer approachesare needed. By an inner-approach we mean a focus on the essence of reverselogistics, by paying special attention to consistency and meaningfulness withrespect to reverse logistics management. The framework for Reverse Logistics
284 Chapter 9. Concluding remarks
presented in Chapter 2 can be the departure platform to put forward propo-sitions, which upon testing can lead to the identification of critical factors forreverse logistics and therefore to a theory. By an outer-approach we imply thefollowing: to relate the field with other fields of research, like the Delphi studysuggested (see Chapter 8). Both similarities and contrasting points should bebrought forward, so reverse logistics can be a field with its own individuality.
We would like to recall that this research project benefited from co-operation with many European researchers in this topic (especially withinthe RevLog group). This in itself is an added-value, and we hope that otherresearchers can benefit from similar working groups in the future. On theother hand, this gives the research a remarkable European flavor, which canbe seen by some sort of limitation. A way to reduce geographic bias is toestablish bridges with researchers in other continents. Between Europe andNorth America, there is already a semi-formal and structured collaborationon the field, as the recent book of Guide and van Wassenhove (2003) attests.Besides that, in the conferences on the field, contributions from colleaguesfrom other continents are not unusual. Reverse logistics is a worldwide phe-nomenon (see Chapter 8) and we can be optimistic with respect to a widercollaboration especially embracing areas that systematically lag behind. Forinstance the European Association of OR Societies (EURO, 2003) is helpingAfrican researchers to revive scientific research in Africa. A living example isthe set up of AORN, 2003, the African Operational Research Network.
As final words, we come back to the initial question of this thesis:
Managing reverse logisticsor
reversing logistics management?
It goes without saying that reverse logistics is also logistics, so a priorione can also transfer lessons from traditional logistics management to themanagement of reverse logistics. On the other hand, traditional logisticsmanagement mainly thinks “forward.” Logistics managers are ultra-focusedon dispatching the goods, on moving them forward to the client. They arenot to blame, after all, this has been the formula to keep businesses going,and many companies have reward schemes based on it. But this is not goingto be enough in the future, where companies are eager to add value to theirproducts, by providing more service and by becoming “corporate citizens.”

9.2. Raising questions and further research 285
As reverse logistics stretches out worldwide, in all the layers of the supplychain, some actors in the chain are forced to take products back, while otherswill do so pro-actively (attracted by the value in used products). One way orthe other, reverse logistics is a key competence in modern supply chains.
Thus, in managing reverse logistics, one also has to be able of reversingtraditional logistics management:
Logistics cannot go forward without thinking reverse!

Bibliography
[1] ACRR (2003). ACRR, The Association of Cities and Regions for Recy-cling. http://www.acrr.org.
[2] Advanced Recovery (2003). http://www.advancedrecovery.com.
[3] Akkermans, H., Bogerd, P., Yucesan, E., and van Wassenhove,L. N. (2003). The impact of erp on supply chain management: ex-ploratory findings from a european delphi study. European Journal ofOperational Research, 146:284–301.
[4] Amazon.com (2003). www.amazon.com.
[5] Anderson, S., Browne, M., and Allen, J. (1999). Logistics impli-cations of the uk packaging waste regulations. International Journal ofLogistics: Research and Applications, 2(2):129–145.
[6] Andriesse, F. G. (1999). Successful implementation of reverse logisticsat Philip Morris. In Van Goor, A. R., Flapper, S. D. P., and Clement,C., editors, Handboek Reverse Logistics. Kluwer, B.V., Deventer, TheNetherlands. (In Dutch).
[7] Anupindi, R. and Bassok, Y. (1999). Supply contracts with quantitycommitments and stochastic demand. In Tayur, S., Ganeshan, R., andMagazine, M., editors, Reverse Logistics. Kluwer Academic Publishers,The Netherlands. pp. 197-232.
[8] AORN (2003). African operational research network (aorn).http://www.euro-online.org/africanOR/.
[9] Arge Altauto (2003). http://www.arge-altauto.de/.
[10] Austrian Federal Chamber of Labour (1998a). Employmentin the environmental sector. Report, Austrian Federal Chamber ofLabour, Austria.
287
288 Bibliography
[11] Austrian Federal Chamber of Labour (1998b). Working condi-tions in the waste management sector. Report, Austrian Federal Cham-ber of Labour, Austria.
[12] Auto Recycling Nederland (2003). http://www.autorecycling.nl/.
[13] Bain, L. J. and Engelhardt, M. (1987). Introduction to Probabilityand Statistics. Duxbury Press, Boston.
[14] Bakkers, F. T. P. G. and van Amstel Jr., J. J. A. P. (2000).Ortes Lecluyse return- and recycling system for PVC slats. In Van Goor,A., Flapper, S., and Clement, C., editors, Handboek Reverse Logistics.Kluwer, B.V., Deventer, The Netherlands. (In Dutch).
[15] Barros, A. I., Dekker, R., and Scholten, V. (1998). A two-level network for recycling sand: A case study,. European Journal ofOperational Research, 110(2):199–215.
[16] Bartel, T. (1995). Recycling program for toner cartridges and opticalphotoconductors. In Proceedings IEEE Symposium on Electronics andthe Environment, pages 225–228, Orlando, Florida.
[17] Bartels, J. J. C. (1998). Collection and processing of batteries in TheNetherlands - the Stibat execution scheme. In Van Goor, A., Flapper,S., and Clement, C., editors, Handboek Reverse Logistics. Kluwer B.V.,Deventer, The Netherlands. (In Dutch).
[18] Bartholdi, J. J., Bunimovich, L. A., and Eisenstein, D. D.(1999). Dynamics of two- and three-worker ‘bucket brigade’ productionlines. Operations Research, 47(3):488–491.
[19] Bartholdi, J. J. and Eisenstein, D. D. (1996). A production lionethat balances itself. Operations Research, 44(1):21–34.
[20] Bartholdi, J. J. and Gue, K. R. (2000). Reducing labor costs inan ltl crossdockiing terminal. Operations Research, 48(6):823–832.
[21] Bayindir, Z. P., Erkip, N., and Gullu, R. (2003). A model to eval-uate inventory costs in a remanufacturing environment. InternationalJournal of Production Economics, 81–82:597–607.
[22] Bentley, D., Rothstein, S. R., and Witt, R. (1986). Apply-ing MRP II to remanufacturing: a case study. In APICS ConferenceProceedings, pages 18–21.
Bibliography 289
[23] Beukering, P. J. H. (2001). Recycling, international trade and theenvironment: an empirical analysis. Kluwer Academic Publishers, Dor-drecht, the Netherlands. Vrije Universiteit Amsterdam, PhD thesis.
[24] Beullens, P. (2001). Location, process selection, and vehicle routingmodels for Reverse Logistics. PhD thesis, Catholic University of Leuven,Leuven, Belgium. PhD Thesis.
[25] Beullens, P., van Oudheusden, D., and Cattrysse, D. (1998).Bi-destination waste collection: impact of vehicle typre and operationson transportation costs. working paper 98-23, University of Leuven,Leuven, Belgium.
[26] Beullens, P., van Wassenhove, L. N., and van Oudheusden,D. (2004). Collection and vehicle routing issues in reverse logistics. InDekker, R., Inderfurth, K., van Wassenhove, L., and Fleischmann, M.,editors, Reverse Logistics. Reverse Logistics. Quantitative Models forClosed-Loop Supply Chains, chapter 5. Springer-Verlag.
[27] Bloemhof-Ruwaard, J., Krikke, H., and van Wassenhove,L. N. (2004). Or models for eco-eco closed-loop supply chains. InDekker, R., Inderfurth, K., van Wassenhove, L., and Fleischmann, M.,editors, Reverse Logistics. Quantitative Models for Closed-Loop SupplyChains, chapter 15. Springer-Verlag, Berlin, Germany.
[28] Boks and Tempelman (1997). Delphi forecasting of recycling tech-nology to support design for end-of-life of consumer electronic products.In Riitahuhta, A., editor, Proceedings of the 11th International Confer-ence on Engineering Design, Tampere, Finland. ICED ’97.
[29] Box, G. E. P., Jenkins, G. M., and Reinsel, G. C. (1994). TimeSeries Analysis - forecasting and control. Prentice-Hall Inc., New Jersey,3rd edition.
[30] Bozer, Y. A., Meller, R. D., and Erlebacher, S. J. (1994).An improvement-type layout algorithm for single and multiple floorfacilities. Management Science, 40(7):918–932.
[31] Bozer, Y. A. and White, J. (1984). Travel time models for auto-mated storage/retrieval systems. IIE Transactions, 16(4):329–338.
[32] Bozer, Y. A. and White, J. (1990). Design and performance modelsfor end-of-aisle order picking systems. Management Science, 36(7):852–866.
290 Bibliography
[33] Brodin, M. H. (2002). Logistics systems for recycling - on the influ-ence of products, structures, relationships and power. PhD thesis, In-stitute of Technology, Linkoping Universitet, Linkoping, Sweden. PhDThesis.
[34] Brundland, G. (1998). European union and the environment. Re-port, European Union. Luxemburg.
[35] Buchanan, D. J. and Abad, P. L. (1998). Optimal policy for a pe-riodic review returnable inventory system. IIE Transactions, 30:1049–1055.
[36] Caldwell, B. (1999). Reverse logistics. InformationWeek, 729:48–56.
[37] Camm, F. (2001). Environmental management in proactive commercialfirms.
[38] Canon (2003). http://www.canon.com.
[39] Carrol, A. B. (1979). a three-dimensional conceptual model of cor-porate performance. Academy of Management Review, 4(4):497–505.
[40] Carter, C. R. and Ellram, L. M. (1998). Reverse logistics: Areview of the literature and framework for future investigation. Inter-national Journal of Business Logistics, 19(1):85–102.
[41] Cattani, K. and Souza, G. (2003). Inventory rationing and ship-ment flexibility alternatives for direct market firms. Production andOperations Management. (forthcoming).
[42] CERN (1997). Stores management & logistics lims.http://asdbwww.cern.ch/lims.htm.
[43] CERN (1999). Cern stores. CERN Bulletin 47/99.
[44] CERN (2000). European organisation for nuclear research.http://cern.web.cern.ch/CERN/.
[45] Chain Store Age (2002). Returns are products too.
[46] Chang, N.-B. and Wei, Y. L. (2000). Siting recycling drop-off sta-tions in urban area by genetic algorithm-based fuzzy multi-objectivenonlinear integer programming modeling. Fuzzy Sets and Systems,114:133–149.
Bibliography 291
[47] Cho, D. I. and Parlar, M. (1991). A survey of maintenance mod-els for multi-unit systems. European Journal of Operational Research,51:1–23.
[48] CLM (2003). The council of logistics management.http://www.clm.org/.
[49] Coffman, E. G. J., Courcoubetis, C., Garey, M. R., Johnson,D. S., Shor, P. W., Weber, R. R., and Yannakakis, M. (2000).Bin packing with discrete item sizes, part 1: Perfect packing theoremsand the average case behavior of optimal packings. SIAM Journal onDiscrete Mathematics, 13(3):384–402.
[50] Corbett, C. J. and Tang, C. S. (1999). Designing supply contracts:Contract type and information asymmetry. In Tayur, S., Ganeshan,R., and Magazine, M., editors, Quantitative models for supply chainmanagement, pages 269–298. Kluwer Academic Publishers.
[51] Dalkey, N. and Helmer, O. (1963). An experimental applicationof the delphi method to the use of experts. Management Science,September:458–1467.
[52] Davis, S., Gerstner, E., and Hagerty, M. (1995). Money backguarantees in retailing: matching products to consumer tastes. Journalof Retailing, 71(1):7–22.
[53] Davis, S., Hagerty, M., and Gerstner, E. (1998). Return policiesand the optimal level of “hassle”. Journal of Economics and Business,50:445–460.
[54] De Bodt, M. and van Wassenhove L.N. (1990). Cost increase dueto demand uncertainty in mrp lot sizing. Decision Sciences, 14(3):345–353.
[55] De Brito, M. P. (2003). Promising areas for future research on re-verse: an exploratory study. In 8th International Symposium of Logis-tics, Sevilla, Spain. Logistics and Networked Organisations.
[56] De Brito, M. P. and de Koster, M. B. M. (2004). Productand material returns: handling and warehousing issues. In Dekker,R., Inderfurth, K., van Wassenhove, L., and Fleischmann, M., editors,Reverse Logistics. Quantitative Models for Closed-Loop Supply Chains,chapter 6. Springer-Verlag.
292 Bibliography
[57] De Brito, M. P. and Dekker, R. (2003). Modelling product returnsin inventory control - exploring the validity of general assumptions.International Journal of Production Economics, 81–82:225–241.
[58] De Brito, M. P. and Dekker, R. (2004). A framework for reverselogistics. In Dekker, R., Inderfurth, K., van Wassenhove, L., and Fleis-chmann, M., editors, Reverse Logistics. Quantitative Models for Closed-Loop Supply Chains, chapter 1. Springer-Verlag, Berlin, Germany.
[59] De Brito, M. P., Dekker, R., and Flapper, S. D. P. (2003).Reverse logistics: a review of case studies. Report Series Research inManagement ERS-2003-012-LIS, Erasmus University Rotterdam, theNetherlands.
[60] De Brito, M. P. and van der Laan, E. A. (2003). Inventorymanagement with returns: the impact of misinformation. Erasmus re-search institute series, Erasmus University Rotterdam, Rotterdam, theNetherlands.
[61] De Brito, M. P. and van Wassenhove, L. N. (2003). The futureof reverse logistics: a delphi study. working paper, Erasmus UniversityRotterdam, the Netherlands.
[62] De Kool, R. (2002). Erp and reverse logistics. Master’s thesis, Rot-terdam School of Management, Erasmus University Rotterdam, theNetherlands. unpublished Master’s Thesis (in Dutch).
[63] De Koster, M. B. M. (1994). Performance estimation of pick-to-belt orderpicking systems. European Journal of Operational Research,72:558–573.
[64] De Koster, M. B. M. (1996). Ontwerp van een eenvoudig magazijn.In Duijker, J. P., Koster, M. B. M. D., and van Amstel, M. J. P., editors,Praktijkboek Magazijnen/Distributiecentra, chapter 3.14, pages 3.14–01–3.14–25. Kluwer, Deventer, the Netherlands.
[65] De Koster, M. B. M., de Brito, M. P., and van Vendel, M. A.(2002). How to organise return handling: an exploratory study withnine retailer warehouses. International Journal of Retail and Distribu-tion Management, 30:407–421.
[66] De Koster, M. B. M., Flapper, S. D. P., Krikke, H., and Ver-meulen, W. S. (2003). Networks for the collection and processing of
Bibliography 293
end-of-life goods: a case example of implemmenting producer respon-sibility for large white goods. In Flapper, S. D. P., van Nunen, J. A.E. E., and van Wassenhove, L. N., editors, Managing closed loop supplychains. Springer-Verlag, Heilderberg, Germany.
[67] De Koster, M. B. M., Flapper, S. D. P., Krikke, H. R., andVermeulen, W. S. (1999a). Reverse logistics in the wholesale white-good sector. In Van Goor, A. R., Flapper, S. D. P., and Clement,C., editors, Handboek Reverse Logistics. Kluwer, B.V., Deventer, theNetherlands. (in Dutch).
[68] De Koster, M. B. M. and Neuteboom, J. (2001). The logistics ofsupermarket chains. Elsevier, Doetinchem, the Netherlands.
[69] De Koster, M. B. M., van der Poort, E. S., and Wolters, M.(1999b). Efficient order batching methods in warehouses. InternationalJournal of Production Research, 37(7):1479–1504.
[70] Debo, L. S. and van Wassenhove, L. N. (2004). Coordination inclosed-loop supply chains. In Dekker, R., Inderfurth, K., van Wassen-hove, L., and Fleischmann, M., editors, Reverse Logistics. QuantitativeModels for Closed-Loop Supply Chains, chapter 12. Springer-Verlag.
[71] Dekker, R., de Koster, M. B. M., van Kalleveen, H., andRoodbergen, K. J. (2002). Quick response practices at the ware-house of ankor. working paper, Erasmus University Rotterdam, theNetherlands.
[72] Dekker, R., Inderfurth, K., van Wassenhove, L., and Fleis-chmann, M. (2004). Reverse Logistics. Quantitative Models for Closed-Loop Supply Chains. Springer-Verlag, Berlin, Germany. forthcoming.
[73] Dekker, R. and van der Laan, E. (1999). Gestion des stocks pourune fabrication et une refabrication simultanes: synthese de resultatsrecents. Logistique & Management, 7(2). (in French).
[74] Dekker, R. and van der Laan, E. (2003). Inventory control inreverse logistics. In Guide Jr., D. and van Wassenhove, L. N., editors,Closed-Loop Supply Chains. Carnegie Mellon University Press, Pitts-burgh, Pennsylvania, U.S.A.
[75] Delbecq, A. L., van de Ven, A. H., and Gustafson, D. H. (1975).Group Techniques for Program Planning, a guide to nominal group andDelphi processes. Scott, Foresman and Company,, USA.
294 Bibliography
[76] DelCastillo, E. and Cochran, J. (1996). ptimal short horizondistribution operations in reusable container systems. Journal of theOperational Research Society, 47(1):48–60.
[77] Desproges, J. and David, G. (1998). Le contenu en emplois des fil-ires de collecte et de traitements des dchets mnagers. Report, ADEME.in French.
[78] Dethloff, J. (2001). Vehicle routing and reverse logistics: the vehiclerouting problem and simultaneos delivery and pick-up. OR Spektrum,23:79–96.
[79] Diaz, A. and Fu, M. C. (1997). Models for multi-echelon repairableitem inventory systems with limited repair capacity. European Journalof Operational Research, 97(3):480–492.
[80] Dijkhuizen, H. P. (1997). Reverse Logistics at IBM. In Van Goor,A., Flapper, S., and Clement, C., editors, Reverse Logistics, chapterE1310. Kluwer, B.V., The Netherlands. (In Dutch).
[81] Dillman, D. A. (1978). Mail and telephone surverys, the total designmethod. John Wiley & Sons, Inc., USA.
[82] Donker, S. and van der Ploeg, T. (2001). Multi-echelon inventorycontrol of repairable spare parts at Lucent Technologies Nederland. InVan Goor, A., Flapper, S., and Clement, C., editors, Handboek ReverseLogistics. Kluwer, B.V., Deventer, The Netherlands. (In Dutch).
[83] Doppelt, B. and Nelson, H. (2001). Extended producer respons-ability and product take-back: Applications for the pacific northwest.Report, The Center for Watershed and Community Health, Mark O.Hatfield School of Government, Portland State University, Portland,Oregon, USA.
[84] Drejer, A., Blackmon, K., and Voss, C. (2002). Worlds apart? - alook at the operations management are in the US, UK and Scandinavia.Scandinavia Journal of Management, 16:45–66.
[85] Driesch, H. M., Flapper, S. D. P., and van Oyen, J. E. (1998).Logistic control of engine re-use at Daimler-Benz MTR. In Van Goor,A., Flapper, S., and Clement, C., editors, Handboek Reverse Logistics.Kluwer, B.V., Deventer, The Netherlands. (In Dutch).
Bibliography 295
[86] Duhaime, R., Riopel, D., and Langevin, A. (2000). Value analysisand optimization of reusable containers at Canada Post. Interfaces,31(3):3–15.
[87] Duijker, J. P., de Koster, M. B. M., and van Amstel, M. P., editors(1994–2000). Praktijkboek Magazijnen/Distributiecentra. Ten HagenStam, The Hage, the Netherlands. in Dutch.
[88] ELA (1999). Insight to impact, results or the fourth quinquennial Euro-pean logistics study. European Logistics Association (ELA). Brussels.
[89] Emmons, H. and Gilbert, S. (1998). Note. the role of return poli-cies pricing and inventory decisions for catalogue goods. ManagementScience, 44(2):276–283.
[90] EUREKA (2003). A network for market oriented R&D,.www.eureka.be/.
[91] EURO (2003). http://www.euro-online.org/.
[92] EUROPA (2003). Europa, the European Union online.http://www.europa.eu.int/.
[93] European Environmental Agency (2002). Environmental signals2002 - benchmarking the millennium. Environmental Assessment Re-port 9, European Environmental Agency (EEA), Copenhagen, Den-mark.
[94] Faria de Almeida, A. and Robertson, A. (1995). Domestic batter-ies and the environment: A life-cycle approach to consumer electronicproducts. In Proceedings of the International Conference Clean Elec-tronics Products & Technology, pages 162–167, Edinburgh, Scotland.
[95] Farrow, P. H. and Jonhson, R. R. (2000). Entrepreneurship, inno-vation and sustainability strategies at walden paddlers, inc. Interfaces,30(3):215–225.
[96] Fernandez, I. (2003). The concept of Reverse Logistics. A reviewof litertaure. In Juga, J., editor, Proceedings of 15th Annual Confer-ence for Nordic Researchers in Logistics, NOFOMA 2003, “Stiving forLeading Edge Logistics”, pages 464–478, Oulu, Finland. NOFOMA.
[97] Fernie, J. and Hart, C. (2001). Uk packaging waste legislation.implications for food retailers. British Food Journal, 103(3):187–197.
296 Bibliography
[98] Ferrer, G. and Ketzenberg, M. (2003). Value of yield informationfor remanufacturing complex products. Working paper, Kenan-FlegerBusiness School.
[99] Flapper, S., van Nunen, J., and van Wassenhove, L. (2003).Managing closed loop supply chains. Springer-Verlag, Heilderberg, Ger-many. (forthcoming).
[100] Fleischman, E. A. and Mumford, M. D. (1991). Evaluating clas-sifications of job behaviour: a construct validation of the ability require-ment scales. Personnel Psychology, 44:523–575.
[101] Fleischmann, M. (2000). Quantitative Models for Reverse Logistics.PhD thesis, Erasmus University Rotterdam, Rotterdam, the Nether-lands. PhD Thesis.
[102] Fleischmann, M., Bloemhof-Ruwaard, J., Beullens, P., andDekker, R. (2004). Reverse logistics network design. In Dekker,R., Inderfurth, K., van Wassenhove, L., and Fleischmann, M., editors,Reverse Logistics. Quantitative Models for Closed-Loop Supply Chains,chapter 4. Springer-Verlag, Berlin, Germany.
[103] Fleischmann, M., Bloemhof-Ruwaard, J. M., Dekker, R.,van der Laan, E. A., van Nunen, J. A. E. E., and van Wassen-hove, L. N. (1997). Quantitative models for reverse logistics: A review.European Journal of Operational Research, 103:1–17.
[104] Fleischmann, M., Krikke, H. R., Dekker, R., and Flapper,S. D. P. (2000). A characterisation of reverse logistics networks forproduct recovery. Omega, 28(6):653–666.
[105] Fleischmann, M., Kuik, R., and Dekker, R. (2002). Controllinginventories with stochastic returns: a basic model. European Journalof Operational Research, 138(1):63–75.
[106] Fontrodona, J. (2002). Pragmatism and Management inquiry.Quorum Books, Westport, USA.
[107] Fuller, D. A. and Allen, J. (1997). A typology of reverse chan-nel systems for post-consumer recyclables. In Polonsky, J. and Mintu-Winsatt, A. T., editors, Environmental marketing: strategies, practice,theory and research. Haworth Press, Binghamton, NY.
Bibliography 297
[108] Gademann, A. J. R. M., van den Bergand, J., and van derHoff, H. H. (2001). An order batching algorithm for wave picking, ina parallel-aisle warehouse. IIE Transactions, 33(5):385–398.
[109] Gan, F. and Koehler, K. (1990). Goodness-of-fit tests based onp-p probability plots. Technometrics, 32(3):289–303.
[110] Ganeshan, R., Jack, E., Magazine, M. J., and Stephens, P.(1999). A taxonomic review of supply chain management research. InTayur, S., Ganesham, R., and Magazine, M. J., editors, QuantitativeModels for Supply Chain Management. Kluwer Academic Publishers,Massachussets, USA.
[111] Gardner, E. (1990). Evaluating forecast performance in an inventorycontrol system. Management Science, 36:490–499.
[112] Garner, A. and Keoleian, G. A. (1995). Industrial Ecology: anintroduction. National Pollution Prevention Center, Michigan, USA.
[113] Gentry, C. R. (1999). Reducing the cost of returns. Chain StoreAge, 75(10):124–126.
[114] Global Investment Recovery (2003).http://girpreciousmetals.com.
[115] Goetschalckx, M. (1992). An interactive layouot heuristic basedon hexagonal adjacency graphs. European Journal of Operational Re-search, 63:304–321.
[116] Goetz, W. G. and Egbelu, P. J. (1990). Guide path design andlocation of load pick-up/drop-off points for an automated guided vehiclesystem. International Journal of Production research, 28(5).
[117] Goggin, K. and Browne, J. (1978). Reverse distribution channelsfor recycling. California Management Review, 20(3):72–81.
[118] Goggin, K. and Browne, J. (2000). Towards a taxonomy ofresource recovery from end-of-life products. Computers in Industry,42:177–191.
[119] Goh, T. N. and Varaprasad, N. (1986). A statistical methodologyfor the analysis of the life-cycle of reusable containers. IEE Transac-tions, 18:42–47.
298 Bibliography
[120] Gooley, T. (1998). Reverse logistics: five steps to success. LogisticsManagement and Distribution Report, pages 49–54.
[121] Guba, E. G. and Lincoln, Y. S. (1994). Competing paradigmsin qualitative research. In Denzin, N. K. and Lincoln, Y. S., editors,Handbook of qualitative research. SAGE, Thousand Oaks, CA, USA.
[122] Guide Jr., V. D. R. (2000b). Technical note: Production planningand control for remanufacturing: industry practice and research needs.Journal of Operations Management, 18:467–483.
[123] Guide Jr., V. D. R., Jayamaran, V., Srivastava, R., and Ben-ton, W. C. (2000). Supply chain management for recovarable manu-facturing systems. Interfaces, 30(3):125–142.
[124] Guide Jr., V. D. R. and Spencer, M. (1997). Rough-cut capacityplanning for remanufacturing firms. Production Planning & Control,8(3):237–244.
[125] Guide Jr., V. D. R. and Srivastava, R. (1997a). Buffering frommaterial recovery uncertainty in a recoverable manufacturing environ-ment. Journal of the Operational Research Society, 8(48):519–529.
[126] Guide Jr., V. D. R. and Srivastava, R. (1997b). Repairable inven-tory theory: models and applications. European Journal of OperationalResearch, 102:1–20.
[127] Guide Jr., V. D. R. and Srivastava, R. (1998). Inventory buffersin recoverable manufacturing. Journal of Operations Management,106:551–568.
[128] Guide Jr., V. D. R., Srivastava, R., and Spencer, M. S. (1997).An evaluation of capacity planning techniques in a remanufacturingenvironment. International Journal of Production Research, 35:67–82.
[129] Guide Jr., V. D. R. and van Wassenhove, L. N. (2000). Closed-loop supply chains. working paper 2000/75/TM/CIMSO 15, INSEAD,Fontainebleau Cedex, France.
[130] Guide Jr., V. D. R. and van Wassenhove, L. N. (2001). Man-aging product returns for remanufacturing. Production and OperationsManagement, 10:142–155.

Bibliography 299
[131] Guide Jr., V. D. R. and van Wassenhove, L. N., editors (2003). Busi-ness Perspectives in Closed-Loop Supply Chains. Carnegie Mellon Uni-versity Press. Pittsburgh, Pennsylvania, USA.
[132] Guiltinan, J. and Nwokoye, N. (1974). Reverse channels for re-cycling: an analysis for alternatives and public policy implications. InCurhan, R. G., editor, New marketing for social and economic progress,Combined Proceedings. American Marketing Association.
[133] Gungor, A. and Gupta, S. M. (1999). Issues in environmentallyconscious manufacturing and product recovery: a survey. Computers &Industrial Engineering, 36:811–853.
[134] Gupta, T. and Chakraborty, S. (1984). Looping in a multi-stage production system. International Journal of Production Research,22:299–311.
[135] Hackman, S. T. and Platzman, L. K. (1990). Near-optimal so-lution of generalized resource allocation problems with large capacities.Operations Research, 38(5):902–910.
[136] Hausman W. H., L. B. Schwarz, S. C. G. (1976). Optimal storageassignment in automatic warehousing systems. Management Science,22(6):629–638.
[137] Healy, M. and Perry, C. (2000). Comprehensive criteria tojudge validity and reliability of qualitative research within the real-ism paradigm. Qualitative Market Research: An International Journal,3(3):118–126.
[138] Hendrickson, C., Matthews, H. S., Cagan, J., andMcMichael, F. (2003). Green engineering. In Guide Jr., V. D. R.and van Wassenhove, L. N., editors, Business Perspectives in Closed-Loop Supply Chains. Carnegie Mellon Press, U.S.A.
[139] Heskett, J. L. (1963). Cube-per-order index - a key to warehousestock location. Transportation and Distribution Management, 3:27–31.
[140] Hess, J., Chu, W., and Gerstner, E. (1996). Controlling productreturns in direct marketing. Transportation and Distribution Manage-ment, 7(4):307–317.
[141] Heyman, D. P. (1977). Optimal disposal policies for a single-iteminventory system with returns. Naval Research Logistics Quarterly,24:385–405.
300 Bibliography
[142] IGD.com (2002). Information, research and education, fact sheets.http://www.igd.com/.
[143] Indefurth, K. and van der Laan, E. A. (2001). Leadtime effectsand policy improvement for stochastic inventory control with remanu-facturing. International Journal of Production Economics, 71(1-3):381–390.
[144] Inderfurth, K. (1997). Simple optimal replenishment and disposalpolicies for a product recovery with leadtimes. OR Spektrum, 19:111–122.
[145] Inderfurth, K., Flapper, S. D. P., Lambert, A. J. D., Pappis,C., and Voutsinas), T. G. (2004). Production planning for productrecovery management. In Dekker, R., Inderfurth, K., van Wassenhove,L., and Fleischmann, M., editors, Reverse Logistics. Quantitative Mod-els for Closed-Loop Supply Chains, chapter 10. Springer-Verlag, Berlin,Germany. forthcoming.
[146] Inderfurth, K. and Jensen, T. (1999). Analysis of mrp policieswith recovery options? In et al., U. L.-W., editor, Modelling and De-cisions in Economics, pages 189–228. Physica-Verlag, Heidelberg-NewYork.
[147] Jahre, M. (1995). Logistics Systems for recycling - efficient collectionof household waste. PhD thesis, Chalmers University of technology,Gotenberg, Sweden.
[148] Jordan, K., Gonser, J., Radermaker, F., and Jorgensen,R. (2001). European commission dgxi.e.3, european packaging wastemangement systems. Report, ARGUS.
[149] Kanji, G. K. (1999). 100 Statistical tests. SAGE Publications.
[150] Kelle, P. and Silver, E. (1989). Forecasting the returns of reusablecontainers. Journal of Operations Management, 8(1):17–35.
[151] Kenis, D. (1995). Improving group decisions. Designing and testingtechniques for group decisions support systems, applying Delphi tech-niques. PhD thesis, University of Utrecht, Utrecht, the Netherlands.
[152] Kiesmuller, G. P. (2003). The use of information in a one depotN retailer system with returns. International Journal of ProductionEconomics. forthcoming.
Bibliography 301
[153] Kiesmuller, G. P. and van der Laan, E. (2001). An inventorymodel with dependent product demands and returns. InternationalJournal of Production Economics, 72(1):73–87.
[154] Klausner, M. and Hendrickson, C. (2000). Reverse-logisticsstrategy for product take-back. Interfaces, 30(3):156–165.
[155] Klausner M., W. M. G. and Hendrickson, C. (1998). Reuseof electric motors in con-sumer products, design and analysis of anelectronic data log. Journal of Ind. Ecology, 2(2):89–102.
[156] Kleijn, M. and Dekker, R. (1999). An overview of inventory sys-tems with several demand classes. In Grazia Speranza, M. and Stahly,P., editors, New Trends in Distribution Logistics, volume 480 of Lec-ture Notes in Economics and Mathematical Systems. Springer Verlag,Berlin.
[157] Kleineidam, U., Lambert, A. J. D., Blansjaar, J., Kok, J.,and Heijningen, R. (2000). Optimising product recycling chainsby control theory. International Journal of Production Economics,66(2):185–195.
[158] Kobeissi, A. (2001). Contribution a la mise en ouvre du systemed’evaluation des produits techniques en fin de vie. PhD thesis, InstitutNational Polytechnique de Grenoble, Grnoble, France. PhD Thesis (inFrench).
[159] Koehorst, H., de Vries., H., and Wubben, E. (1999). Standard-isation of crates: lessons learned from the versfust (freshcrate) project.Supply Chain Management, 49(2):95–101.
[160] Kokkinaki, A., Zuidwijk, R., van Nunen, J., and Dekker, R.(2004). Information and communication technology enabling reverselogistics. In Dekker, R., Inderfurth, K., van Wassenhove, L., and Fleis-chmann, M., editors, Reverse Logistics. Quantitative Models for Closed-Loop Supply Chains, chapter 16. Springer-Verlag.
[161] Kopicky, R. J., Berg, M. J., Legg, L., Dasappa, V., and Mag-gioni, C. (1993). Reuse and recycling: reverse logistics opportunities.Council of Logistics Management, Oak Brook, IL.
[162] Krikke, H. (1998). Recovery strategies and reverse logistic networkdesign. PhD thesis, Institute for Business Engineering and TechnologyApplication (BETA), University of Twente, Twente, the Netherlands.
302 Bibliography
[163] Krikke, H., le Blanc, I., and van de Velde, S. (2003). Creatingvalue from returns the impact of product life cycle management on cir-cular supply chains - and reverse. Report, Center of Applied Research,Tilburg University, Tilburg, the Netherlands.
[164] Krikke, H., van Harten, A., and Schuur, P. (1999a). Businesscase oce: Reverse logistic network re-design for copiers. OR Spektrum,34(3):381–409.
[165] Krikke, H., van Harten, A., and Schuur, P. (1999b). Businesscase roteb: recovery strategies for monitors. Computers & IndustrialEngineering, 34(4):739–757.
[166] Kroon, L. and Vrijens, G. (1995). Returnable containers: An ex-ample of reverse logistics. International Journal of Physical Distribution& Logistics Management, 25(2):56–68.
[167] Krumwiede, D. W. and Sheu, C. (2002). A model for reverselogistics entry by third-party providers. Omega, 30(5):325–333.
[168] Lambert, D. M. and Stock, J. R. (1981). Strategical PhysicalDistribution Mangement. Homewood,, IL.
[169] Landers, T. L., Cole, M. H., Walker, B., and Kirk, R. W.(2000). The virtual warehousing concept. Transportation ResearchPart-E- Logistics and Transportation Review, 36(2):115–125.
[170] Landrieu, A. (2001). Logistique inverse et collecte des produits tech-niques en fin de vie. Tourneees de vehicles avec contraintes. PhD thesis,Institut National Polytechnique de Grenoble, Grenoble, France. PhDThesis (in French).
[171] Lariviere, M. A. (1999). Supply chain contracting and coordinationwith stochastic demand. In Tayur, S., Ganeshan, R., and Magazine, M.,editors, Quantitative models for supply chain management, pages 233–268. Kluwer Academic Publishers.
[172] Laxe, F. G. (1999). Protection de l’environnement comme sourced’emplois. Report, Council of Europe.
[173] Lee, H., Padmanabhan, V., and Whang, S. (1997). Informationdistortion in a supply chain: the bullwhip effect. Management Science,43(4):546–558.
Bibliography 303
[174] Linstone, H. A. and Turoff, M. (1975). The Delphi method.Techniques and applications. Addison-Wesley, London, U.K.
[175] Linton, J. D. and Jonhson, D. A. (2000). A decision supportsystem for planning remanufacturing at nortel networks. Interfaces,30(6):17–31.
[176] Listes, O. and Dekker, R. (2001). Stochastic approaches for prod-uct recovery network design: a case study. Econometric Institute Re-port EI 2001-08, Erasmus University Rotterdam, the Netherlands.
[177] LOCOMOTIVE (1993). Logistics chain multidimen-sional design toolbox with environmental assessment.http://www.newcastle.research.ec.org/esp-syn/text/8615.html.
[178] Louwers, D., Kip, B. J., Peters, E., Souren, F., and Flapper,S. D. P. (1999). A facility location allocation model for reusing carpetmaterials. Computers & Industrial Engineering, 36:855–869.
[179] Luo, Z.-Q., Pong, J.-S., and Ralph, D. (1996). Mathematical Pro-gramming with Equilibrium Constraints. Cambridge University Press,Cambridge, UK.
[180] Lutzenbauer, M. (1993). Mehrwegsysteme fur transportverpackun-gen (systems for returnable transport packaging). Deutscher FachverlagGmbH.
[181] Mahadevan, B., Pyke, D. F., and Fleischmann, M. (2002). Peri-odic review, push inventory policies for remanufacturing. ERIM ReportSeries ERS-2002-35-LIS, Faculty of Business Administration, ErasmusUniversity Rotterdam, The Netherlands.
[182] Martino, J. (1972). Technological forecasting for decision making.Elsevier, New York, USA.
[183] Maslennikova, I. and Foley, D. (2000). Xerox’s approach to sus-tainability. Interfaces, 30(3):226–233.
[184] Matson, J. O. and White, J. A. (1982). European journal ofoperational research. Omega, 11:309–318.
[185] McGavis, D. (1994). The energy bucket and a not-so-drop-in-the-bucket portion of waste stream, consumables. pages 267–272, San Fran-cisco, California. IEEE International Symposium on Electronics & theEnvironment.
304 Bibliography
[186] Meijer, H. W. (1998). Green logistics. In Van Goor, A. R., Flap-per, S. D. P., and Clement, C., editors, Handboek of Reverse Logistics.Kluwer B. V., Deventer, The Netherlands. (in Dutch).
[187] Melissen, F. W. and de Ron, A. (1999). Defining recovery prac-tices - definitions and terminology. International Journal on Environ-mentally Conscious Manufacturing and Design, 8(2):1–18.
[188] Merriam-Webster (2003). Merriam-webster online - the languagecenter. http://www.m-w.com/home.htm.
[189] Meyer, H. (1999). Many happy returns. The Journal of BusinessStrategy, 20(4):27–31.
[190] MHIA (2002). Material handling industry of america. www.mhia.org.
[191] Minner, S. and Kleber, R. (2001). Optimal control of produc-tion and remanufacturing in a simple recovery model with linear costfunctions. OR Spektrum, 23:3–24.
[192] Moffat, J. (1992). Resources for the repair of non-modular aero-engines. Omega, 20(1):99–103.
[193] Moorthy, S. and (1995), K. S. (1995). Signaling quality with amoney-back guarantee:the role of transaction costs. Marketing Science,14:442–446.
[194] Morphy, E. (2001). Newgistics gears up to deliver many happy re-turns. CRMDaily.com. http://www.crmdaily.com.
[195] Mostard, J. and Teunter, R. (2002). The newsboy problem withresalable returns. ERIM Report Series ERS-2002-89-LIS, Faculty ofBusiness Administration, Erasmus University Rotterdam, The Nether-lands.
[196] Muckstadt, J. A. and Isaac, M. H. (1981). An analysis of singleitem inventory systems with returns. Naval Research Logistics Quar-terly, 28(1):237–254.
[197] Murphy, P. R. (1986). A preliminary study of transportation andwarehousing aspects of reverse distribution. Transportation Journal,35(4):12–21.
Bibliography 305
[198] Murphy, P. R. and Poist, R. F. (2003). Green perspectives andpractices: a “comparative logistics” study. Supply Chain Management:An International Journal, 8:122–131.
[199] Murphy, P. R. and Poist, R. P. (1989). Managing of logisticsretromovements: an empirical analysis of literature suggestions. Trans-portation Research Forum, 29(1):177–84.
[200] Muther, R. (1973). Systematic layout planning. Cahners Books,Boston, USA, 2nd edition edition.
[201] Nagel, C. and Meyer, P. (1999). Caught between ecology andeconomy: end-of-life aspects of environmentally conscious manufactur-ing. Computers & Industrial Engineering, 36(4):781–792.
[202] Office for Fair Trading (2003). http://www.oft.gov.uk/.
[203] Olsen, R. (2000). A checklist for e-commerce. Discount Store News,39(4):15–16.
[204] O’Neill, S. and Chu, J. (2001). Online returns management strate-gies. Executive strategy report, IBM Corporation.
[205] Pappis, C., Stavros, E., and Tsoulfas, G. (2004). Reverse logis-tics and environmental management. In Dekker, R., Inderfurth, K., vanWassenhove, L., and Fleischmann, M., editors, Reverse Logistics. Quan-titative Models for Closed-Loop Supply Chains, chapter 14. Springer-Verlag, Berlin, Germany.
[206] Piron, F. and Young, M. (2000). Retail borrowing: insights andimplications on returning used merchandise. International Journal ofRetail & Distribution Management, 28(1):27–36.
[207] Pohlen, T. L. and Farris, T. (1992). Reverse logistics in plasticsrecycling. International Journal of Physical Distribution & LogisticsManagement, 22(7):35–47.
[208] Rabinovich, E., Windle, R., Dresner, M., and Corsi, T.(1999). Outsourcing of integrated logistics functions. InternationalJournal of Physical Distribution and Logistics Management, 29:353–273.
[209] Realff, M. J., J. C. A. and Newton, D. (2000). Strategic designof reverse production systems. Computers and Chemical Engineering,24:991–996.
306 Bibliography
[210] ReCellular (2003). http://recellular.com.
[211] Reloop (1998-). Reloop, Reverse Logistics Chain Optimization.http://www.kuleuven.ac.be/cib/projkt03.htm.
[212] RevLog (1998-). Revlog, the european working group on reverselogistics. http://www.fbk.eur.nl/OZ/REVLOG/.
[213] Richter, K. (1996). The extended EOQ repair and waste model.International Journal of Production Economics, 1–3:443–448.
[214] RLEC (2003). RLEC, The Reverse Logistics Executive Council.http://www.rlec.org/index.html.
[215] Robison, S. J. (1992). The world of a class ”A” remanufacturingcompany. In APICS Remanufacturing Seminar Proceedings, pages 1–3.APICS.
[216] Rodrigue, J.-P., Slack, B., and Comtois, C. (2001). Greenlogistics. In Brewer, A., Button, K., and Henshe, D., editors, TheHandbook of Logistics and Supply-Chain Management, Handbooks inTransport N. 2. Pergamon/Elsevier, London, “UK”.
[217] Rogers, D. S. and Tibben-Lembke, R. S. (1999). Going Back-wards: reverse logistics trends and practices. Reverse Logistics Execu-tive Council, Pittsburgh, PA.
[218] Rogers, D. S. and Tibben-Lembke, R. S. (2001). An examinationof reverse logistics practices. Journal of Business Logistics, 22(2):129–248.
[219] Roodbergen, K. (2001). Layout and routing methods for warehouses.PhD thesis, Erasmus University Rotterdam, Rotterdam, the Nether-lands.
[220] Ross, S. (1996). Stochastic Processes. John Wiley & Sons, Inc., 2ndedition.
[221] Rouwenhorst, B., Reuter, B., Stockrahm, V., van Houtum,G. J., Mantel, R. J., and Zijm, W. H. M. (2000). Warehousedesign and control: framework and literature review. European Journalof Operational Research, 122:515–533.
Bibliography 307
[222] Rudi, N., Pyke, D. F., and Sporsheim, P. O. (2000). Productrecovery at the norwegian national insurance administration. Interfaces,30(3):166–179.
[223] Sanders, H., van Harten, A., and van der Heijden, M. C.(2000). Logistics and reverse logistics at Wehkamp. In Van Goor, A.,Flapper, S. D. P., and Clement, C., editors, Handboek of Reverse Logis-tics. Kluwer B. V., Deventer, The Netherlands. (in Dutch).
[224] Schiffeleers, S. (2001). Reduction of distribution costs for emimusic in europe. Master’s thesis, Eindhoven University of Technology,the Netherlands. unpublished MSc Thesis.
[225] Schinkel, H. (2000). Plaster remnants should not be thrown away!In Van Goor, A., Flapper, S. D. P., and Clement, C., editors, Handboekof Reverse Logistics. Kluwer B. V., Deventer, The Netherlands. (inDutch).
[226] Schmidt, R. A., Sturrock, F., Ward, P., and Lea-Greenwood, G. (1999). Deshopping - the art of illicit consumption.International Journal of Retail & Distribution Management, 27(8):290–301.
[227] Schrady, D. A. (1967). A deterministic inventory model for re-pairable items. Naval Research Logistics Quarterly, 14:391–398.
[228] Silver, E. A., Peterson, R., and Pyke, D. F. (1998). Inventorymanagement and production planning and scheduling. John Wiley &Sons, New York, USA, 3rd edition edition.
[229] Simons, P. H. W. (1998). Reverse logistics at Trespa InternationalB.V. In Van Goor, A., Flapper, S. D. P., and Clement, C., editors,Handboek of Reverse Logistics. Kluwer B. V., Deventer, The Nether-lands. (in Dutch).
[230] Simpson, V. (1978). Optimum solution structure for a repairableinventory problem. Operations Research, 26:270–281.
[231] Slackman, H. (1975). Delphi critique. Lexington,, Massachusetts,USA.
[232] Smit, W. and Popma, W. (2002). Complacency, indecisiveness anddiy-centres threaten dutch garden centres’ flourishing market position.European Retail Digest, European Regional Review, 34:36–40.
308 Bibliography
[233] Smith, N. C., Thomas, R. J., and Quelch, J. A. (2001). A strate-gic approach to managing returns. Harvard Business Review, pages102–112.
[234] Spengler, T., Puchert, H., Penkuhn, T., and Rentz, O.(1997). Capacitated remanufacturing with service level constraints. Eu-ropean Journal of Operational Research, 97(2):308/326.
[235] STIBAT (2003). STIBAT, the Dutch battery foundation.http://www.stibat.nl/.
[236] Stock, J. R. (1992). Reverse Logistics. Council of Logistics Man-agement, Oak Brook, IL.
[237] Stock, J. R. (1998). Development and implemmentation of ReverseLogistics programs. Council of Logistics Management, Oak Brook, IL.
[238] Stock, J. R. (2001). The 7 deadly sins of reverse logistics. MaterialHandling Management, 56(3):5–11.
[239] Stock, J. R. and Lambert, D. M. (2001). Strategic Logistics man-agement. McGraw-Hill International edition, Singapore.
[240] Strauss, A. and Corbin, J. (2000). Grounded theory methodology.In Denzin, N. K. and Lincoln, Y. S., editors, Handbook of qualitativeresearch. Sage, Thousand Oaks, CA, USA. 2nd edition.
[241] Stroeker, N. E. (1995). Second-hand markets for consumerdurables. PhD thesis, Erasmus University Rotterdam, Rotterdam, theNetherlands. PhD Thesis, Tinbergen Institute research Series.
[242] Swinkels, J. and van Esch, C. F. A. (1998). Return packagingand turnover rates. In Van Goor, A., Flapper, S. D. P., and Clement,C., editors, Handboek of Reverse Logistics. Kluwer B. V., Deventer, TheNetherlands. (in Dutch).
[243] ’t Slot, W. M. E. and van Amstel, J. J. A. P. (1999). Expe-riences from the national trial project apparetour. In Van Goor, A.,Flapper, S. D. P., and Clement, C., editors, Handboek of Reverse Logis-tics. Kluwer B. V., Deventer, The Netherlands. (in Dutch).
[244] Tashakkori, A. and C.Teddlie (1998). Mixed methodology. com-bining qualitative and quantitative approaches. In Applied Social Re-search Methods Series, volume 46. SAGE, Thousand Oaks, California,USA.
Bibliography 309
[245] Teunter, R. (2001). Economic ordering quantities for remanufac-turable item inventory systems. Naval Research Logistics, 48(6):484–495.
[246] Teunter, R., Inderfurth, K., Minner, S., and Kleber, R.(2000). Reverse logistics in a pharmaceutical company: a case. workingpaper, Otto von Guericke-University, Magdeburg, Germany.
[247] Teunter, R. and Vlachos, D. (2002). On the necessity of a dis-posal option for returned items that can be remanufactured. Interna-tional Journal of Production Economics, 75(3):257–266.
[248] Thierry, M., Salomon, M., van Nunen, J. A. E. E., and vanWassenhove, L. N. (1995). Strategic issues in product recovery man-agement. California Management Review, 37(2):114–135.
[249] Thomas Jr., M. (1997). Emerging technology: production schedul-ing matures. IIE Solutions, pages 25–29.
[250] Tibben-Lembke, R. S. and Rogers, D. S. (2002). Differencesbetween forward and reverse logistics in a retail environment. SupplyChain Management: An International Journal, 7(5):271–282.
[251] Tichy, N., McGill, A. R., and Clair, L. S. (1997). Corporateglobal citizenship. The new Lexington Press, San Francisco, USA.
[252] Tijms, H. C. (1994). Stochastic models, an algorithmic approach.John Wiley & Sons.
[253] Tijms, H. C. (2003). A first course in stochastic models. Wiley, WestSussex, England.
[254] Toktay, L. B. (2003). Forecasting product returns. In Guide Jr.,V. D. R. and van Wassenhove, L. N., editors, Business Perspectives inFull Cycle Supply Chains. Carnegie Mellon UniversityPress, Pittsburgh,Pennsylvania, USA.
[255] Toktay, L. B., van der Laan, E. A., and de Brito, M. P.(2004). Managing product returns: The role of forecasting. In Dekker,R., Inderfurth, K., van Wassenhove, L., and Fleischmann, M., editors,Reverse Logistics. Quantitative Models for Closed-Loop Supply Chains,chapter 3. Springer-Verlag, Berlin, Germany.
310 Bibliography
[256] Toktay, L. B., Wein, L. M., and Zenios, S. A. (2000). Inven-tory management of remanufacturable products. Management Science,46(11):1412–1426.
[257] Tompkins, J., White, J., Bozer, Y., Frazelle, E., Tanchoco,J., and Trevino, J. (1996). Facilities planning. Wiley, New York.
[258] Trebilcock, B. (2002). Return to sender. Warehousing Manage-ment, 9(4):24–27.
[259] Tsay, A. A., Nahmias, S., and Agrawal, N. (1999). Modelingsupply chain contracts: A review. In Tayur, S., Ganeshan, R., andMagazine, M., editors, Quantitative models for supply chain manage-ment, pages 299–336. Kluwer Academic Publishers.
[260] Ubbens, U. M. P. (2000). The closed loop of metal packaging. InVan Goor, A., Flapper, S. D. P., and Clement, C., editors, Handboekof Reverse Logistics. Kluwer B. V., Deventer, The Netherlands. (inDutch).
[261] UGSG (2001). Obsolete computers, “gold mine”or high-teck trash?resource recovery recycling. USGS Fact Sheet FS-060-01, U.S. Depart-ment of the Interior, Denver, U.S.A. U.S. Geological Survey.
[262] United Nations (2003). http://esa.un.org.
[263] Van Burik, A. M. C. (1998). Return flow problems of car wreck ma-terials. In Van Goor, A., Flapper, S. D. P., and Clement, C., editors,Handboek of Reverse Logistics. Kluwer B. V., Deventer, The Nether-lands. (in Dutch).
[264] Van den Berg, J. P. (1999). A literature survey on planning ancontrol of warehousing systems. IIE Transactions, 31:751–762.
[265] Van den Berg, J. P. and Zijm, W. H. M. (1999). Models for ware-house management: classification and examples. International Journalof Production Economics, 59:519–528.
[266] Van der Laan, E. A. (1997). The effects of remanufacturing oninventory control. PhD thesis, Erasmus University Rotterdam, Rotter-dam, the Netherlands.
[267] Van der Laan, E. A., Kiesmuller, G., Kuik, R., Vlachos, D.,and R.Dekker (2004). Stochastic inventory control for product re-covery management. In Dekker, R., Inderfurth, K., van Wassenhove,
Bibliography 311
L., and Fleischmann, M., editors, Reverse Logistics. Quantitative Mod-els for Closed-Loop Supply Chains, chapter 8. Springer-Verlag, Berlin,Germany.
[268] Van der Laan, E. A., Salomon, M., Dekker, R., and vanWassenhove, L. N. (1999). Inventory control in hybrid systems withremanufacturing. Management Science, 45(5):733–747.
[269] Van der Meer, J. (2000). Operational control of internal transport.PhD thesis, Erasmus University Rotterdam, Rotterdam, the Nether-lands.
[270] Van Donk, F. (1999). Environmental logistics in housebuilding andpublic construction. In Van Goor, A., Flapper, S. D. P., and Clement,C., editors, Handboek of Reverse Logistics. Kluwer B. V., Deventer, TheNetherlands. (in Dutch).
[271] Van Goor, A., Flapper, S. D. P., and Clement, C., editors (1994-).Kluwer B. V., Deventer, The Netherlands. (in Dutch).
[272] Van Laarhoven, P., Berglund, M., and Peters, M. (2000).Third-party logistics in europe - five years later. International Journalof Physical Distribution and Logistics Management, 30(5):425–442.
[273] Van Nes, N. (2003). Replacement of Durables: Influencing productlifetime through product design. PhD thesis, Erasmus University Rot-terdam, Rotterdam, the Netherlands.
[274] Van Notten, R. A. P. (2000). Collection and processing for the re-use of packaging glass. In Van Goor, A., Flapper, S. D. P., and Clement,C., editors, Handboek of Reverse Logistics. Kluwer B. V., Deventer, TheNetherlands. (in Dutch).
[275] Vis, I. F. A. (2002). Planning and control concepts for material han-dling systems. PhD thesis, Erasmus University Rotterdam, Rotterdam,the Netherlands.
[276] Vlachos, D. and Dekker, R. (2000). Return handling optionsand order quantities for single period products. Report EconometricInstitute EI2000-29/A, Faculty of Economics, Erasmus University Rot-terdam, The Netherlands.
312 Bibliography
[277] Vroom, J. A., van der Linden, A., and Kraal, A. (2001). Pack-aging and reverse logistics at campina melkunie. In Van Goor, A., Flap-per, S. D. P., and Clement, C., editors, Handboek of Reverse Logistics.Kluwer B. V., Deventer, The Netherlands. (in Dutch).
[278] VVAV (2003). Dutch waste processing association (vvav).www.vvav.nl.
[279] Waimiti, H. (2001). Logistics in kenya. status, trends and develop-ments. Master’s thesis, Erasmus University Rotterdam, Rotterdam, theNetherlands. unpublished Master thesis.
[280] Walpole, E. E., Myers, R. H., and Myers, S. (1998). Probabil-ity and statistics for engineers and scientists. Prentice Hall Inc., 6thedition.
[281] Wascher, G. (2002). Order picking: a survey of planning prob-lems and methods. working paper 13/2002, Faculty of Economics andManagement, Otto von Guericke University Magdeburg, Magdeburg,Germany.
[282] Wijshof, C. P. H. (1997). Reverse logistics, a case. In Van Goor,A., Flapper, S. D. P., and Clement, C., editors, Handboek of ReverseLogistics. Kluwer B. V., Deventer, The Netherlands. (in Dutch).
[283] Wood, S. (2001). Remote purchase environments: the influence ofreturn policy leniency on two-stage decision processes. Journal of Mar-keting Research, 38(2):157–169.
[284] Yender, G. L. (1998). Battery recycling technology & collectionprocesses. In Proceedings IEEE International Symposium on Electronicsand the Environment, page 30 35, Oak Brook, IL, U.S.A.
[285] Yuan, X.-M. and Cheung, K. (1998). Modeling returns of mer-chandise in an inventory system. OR Spektrum, 20(5):147–154.
[286] Zuidema, J. and de Koster, R. (2002a). Wehkamp - teaching note-. Teaching case (exercise note), Rotterdam School of Management,University Erasmus Rotterdam, Rotterdam, the Netherlands.
[287] Zuidema, J. and de Koster, R. (2002b). Wehkamp: rethinking re-turn handling at DC Dedemsvaart. Teaching case, Rotterdam School ofManagement, University Erasmus Rotterdam, Rotterdam, the Nether-lands.

Samenvatting
In het verleden zorgden supply chains voor de logistieke fine-tuning van devoorwaartse goederenstromen van grondstof tot de uiteindelijke klant. Van-daag de dag echter vloeit een groeiende stroom producten terug in de keten.Bedrijven moeten dus ook de retourlogistiek beheren. Toch denken managersvoornamelijk in ‘voorwaartse’ termen, waarbij de nadruk ligt op het leverenvan goederen aan de klant. De vraag is of bedrijven door kunnen gaan metdeze benadering of dat de focus meer moet worden gericht op retourlogistiek.In andere woorden: Is het een zaak van ‘managing reverse logistics’ of van‘reversing logistics management’?
Dit proefschrift draagt bij aan een beter begrip van retourlogistiek en welmet betrekking tot de volgende hoofdlijnen:
1. retourlogistiek als (wetenschappelijk) onderzoeksgebied,
2. beslissingsondersteuning en praktijk van retourlogistiek.
De belangrijkste doelen van het verrichtte onderzoek zijn
• het structureren van retourlogistiek als onderzoeksgebied,
• een beter begrip kweken van de praktijk van retourlogistiek,
• het structureren en ondersteunen van beslissingen in retourlogistiek,
• speculeren over de toekomstige ontwikkeling van retourlogistiek als on-derzoeksgebied.
In het bijzonder werden verscheidene onderzoeksprojecten opgezet om speci-fieke doelstellingen te bereiken. Elk hoofdstuk geeft een verslag van een vandeze doelstellingen en wel als volgt.
Hoofdstuk 2: Het structuren van het onderzoeksgebied en hetkweken van globaal begrip van retourlogistiek.
Dit hoofdstuk kweekt een globaal begrip van retourlogistiek door middel vaneen structurering van het onderzoeksgebied. In feite construeren we eenraamwerk, dat wil zeggen een conceptionele structuur, voor retourlogistiek:we identificeren de elementaire ingredienten (dimensies) van retourlogistiek,we structureren deze en beschrijven hun onderlinge relatie.
314 Bibliography
Voor het raamwerk gebruiken we drie bronnen van input: selectieve liter-atuur die het onderzoeksgebied structureert, een bespreking van case stud-ies (Hoofdstuk 3), en de kennis van retourlogistiek die is geaccumuleerdgedurende het gehele onderzoekstraject.
De dimensies en typologieen van het raamwerk voor retourlogistiek gevenniet alleen context voor retourlogistieke situaties. Ook hun combinatie bepaaltvoor een groot gedeelte het soort issues dat een rol speelt bij het imple-menteren, beheersen, en controleren van zulke situaties. Dit wordt geillustreerdaan de hand van een verzameling typische situaties in de retourlogistiek.
Hoofdstuk 3: Het aangeven van een diversiteit van retourlogistiekeactiviteiten en het helpen structureren van het framework.
Dit hoofdstuk analyseert meer dan 60 casussen uit de literatuur die handelenover retourlogistieke aspecten. De studie is georganiseerd met betrekking totde volgende onderwerpen: 1) Netwerk structuren, 2) Relaties, 3) Voorraad-beheer, 4) Planning & Control, en 5) Informatie technologie.
De analyse heeft een aantal relaties en issues aan het licht gebracht. Zolijken end-of-life retouren bijvoorbeeld sterk gecorreleerd te zijn met recy-cling. Als producten of modules zouden zijn ontworpen voor remanufacturingechter, dan zou remanufacturing waarschijnlijk attractiever zijn, zelfs aan heteinde van de levenscyclus. De belangrijkste driver voor recycling is wetgev-ing. In feite lijkt de huidige wetgeving niet in staat te zijn om andere vor-men van hergebruik te stimuleren. Echter, als wetgeving zich meer pro-actiefzou richten op product-ontwerp vraagstukken in plaats van zich reactief terichten op hergebruik, dan zouden andere vormen van hergebruik dan recy-cling waarschijnlijk meer worden gestimuleerd.
Voor elk van de bovengenoemde beslisgebieden zijn die dimensies geidentificeerddie overwegend belangrijk zijn en zijn richtlijnen gegeven voor verder onder-zoek.
Hoofdstuk 4: Het aangeven van de state-of-the-art van kwanti-tatieve modellen voor de afhandeling van retouren en het identi-ficeren van mogelijkheden voor toekomstig onderzoek.
Dit hoofdstuk
• bouwt een beslissingsraamwerk voor de afhandeling van retouren, en
• identificeert modellen voor beslissingsondersteuning.
Bibliography 315
De analyse laat zien dat tot nog toe expliciete modellen voor beslissing-sondersteuning ten behoeve van de afhandeling van retouren in het magaz-ijn zijn veronachtzaamd. Voor een aantal onderzoeksgebieden geven we aanhoe voorwaartse modellen kunnen worden uitgebreid, of hoe nieuwe modellenzouden kunnen worden opgezet, om retouren mee te nemen. Verscheideneonderzoekshiaten worden geidentificeerd en gevat in een onderzoeksagenda.
Hoofdstuk 5: Het identificeren van de belangrijkste factoren voorhet al of niet combineren van voorwaartse en retour stromen bij deafhandeling van retouren.
Deze exploratieve studie helpt mee aan de ontwikkeling van theorie voor deafhandeling van retouren en geeft aanbevelingen voor de praktijk als ookwetenschappelijk onderzoek. Met betrekking tot de factoren voor het al of nietcombineren van voorwaartse en retour stromen introduceren we drie veronder-stellingen. Deze veronderstellingen geven relaties tussen de volgende zaken:
1. het beleveren van winkels & de transport fase beslissing,
2. het retour-volume & de ontvangst in het magazijn,
3. de markt voor retouren & de opslag beslissing.
Hoofdstuk 6: Het onderzoeken van de validiteit van gangbare aan-names in de literatuur van voorraadbeheer voor retouren.
In dit hoofdstuk wordt een raamwerk opgezet voor het statistisch toetsen vangangbare aannames in de literatuur van voorraadbeheer voor retouren. Metde ontwikkelde methodologie is het mogelijk om zelfs voor kleine steekproevende gewenste toetsen uit te voeren. We gebruiken data sets van productenvan drie verschillende Europese bedrijven. We vinden producten waarvoor degangbare aannames lijken te gelden, maar ook enkele waarvoor ze niet gelden.Op basis van de analyse geven we theoretische inzichten en implicaties voorde praktijk. Bovendien geven we aan welk onderzoek nog nodig is.
Hoofdstuk 7: Het evalueren van de waarde van (mis-)informatiem.b.t voorraadbeheer.
Dit hoofdstuk onderzoekt de waarde van (mis)informatie met betrekking totvoorraadbeheer. We beschouwen een voorraadmodel met een product en eenechelon, waarbij elke periode een bestelling kan worden geplaatst om de voor-raadpositie aan te vullen tot een van tevoren bepaald niveau. Hierbij wordt
316 Bibliography
rekening gehouden met de retouren die zullen binnenkomen gedurende delevertijd. Om deze te schatten worden vier methodes gebruikt, elk met eenbepaalde informatiebehoefte.
Met behulp van analytische resultaten en simulatie identificeren we situ-aties waarin de meest geavanceerde methode niet noodzakelijkerwijs de besteprestaties levert. Dit is bijvoorbeeld het geval als systematisch de retourintentie wordt onderschat of overschat.
De analyse geeft vervolgens aanleiding tot een aantal implicaties voor man-agement, in het bijzonder informatie management.
Hoofdstuk 8: Het evalueren van de toekomst van retourlogistiek alsonderzoeksgebied.
Dit hoofdstuk presenteert een Delphi studie, ondernomen door een panel vanacademici die werken op het gebied van retourlogistiek, met het doel om tereflecteren op de toekomst van het vakgebied. De analyse maakt het mo-gelijk om aanbevelingen te doen over onderzoek en onderwijs binnen de re-tourlogistiek. Het blijkt dat het type onderzoek afhankelijk is van het typeonderzoeker (junior, senior, accidental). Ook geven we aan wat mogelijkeconsequenties zijn van de verschillen tussen Europees onderzoek en dat in deVerenigde Staten.
Het spreekt voor zich dat retourlogistiek ook een vorm van logistiek is, zodata priori lessen uit de traditionele logistiek ook kunnen worden doorgetrokkennaar retourlogistiek. Aan de andere kant denken traditionele managers voor-namelijk in termen van voorwaartse stromen. In de toekomst zal dit nietvoldoende blijken. Aangezien retourlogistiek zich wereldwijd uitspreidt inalle lagen van de supply chain, worden sommige actoren in de keten gedwon-gen om producten terug te nemen, terwijl anderen dit pro-actief doen Delaatsten worden ofwel aangetrokken tot de waarde die gebruikte productennog vertegenwoordigen, ofwel aangetrokken door hun institutionele verant-woordelijkheid. Hoe dan ook, retourlogistiek is een cruciale competentie inmoderne supply chains.
Logistiek kan niet vooruit zonder ‘terug’ te gaan!


Curriculum Vitae
Marisa P. de Brito studied Statistics and Operations Research at the Uni-versity of Lisbon in Portugal. On her last year, she visited the EconometricInstitute at the Erasmus University Rotterdam (EUR) where she wrote herthesis on the topic of Inventory Control. On graduating in 1997, she en-rolled for a 1-year post-graduation on Operations Research at the Universityof Lisbon in Portugal. During the same academic year, she was a full-time As-sistant Professor of the department of Quantitative Methods at the Instituteof Business Administration, ISCTE in Lisbon, Portugal. In October 1998 shegot engaged with an International Master on Urban Management at EUR,having received the diploma one year later.
In October 1999 she became an assistant researcher at the Economet-ric Institute (EUR), being a PhD candidate associated with the ErasmusResearch Institute of Management (ERIM). Her research was nested in theEuropean Working Group for Reverse Logistics (RevLog), financially sup-ported by the European Commission. Within the RevLog network, she vis-ited the Business School INSEAD of Fontainebleau in France for a 2-monthperiod, at which she worked with Prof. Luk van Wassenhove. Furthermore,during her PhD, she followed international courses associated with the Eu-ropean Doctoral School on Knowledge and Management (EUDOKMA), theEuropean Institute for Advanced Studies in Management (EIASM) and theEuropean Logistics Association (ELA). Her PhD was financially supported bythe Portuguese Foundation for the Development of Science and Technology,“Fundacao Para a Ciencia e a Tecnologia,” as from January 2000.

Erasmus Research Institute of Management
ERIM Ph.D. Series Resesearch in Management
1. J. Robert van der Meer, Operational Control of Internal TransportPromotor(es): Prof.dr. M.B.M. de Koster, Prof.dr.ir. R. DekkerDefended: September 28, 2000, ISBN: 90-5892-004-6
2. Moritz Fleischmann, Quantitative Models for Reverse LogisticsPromotor(es): Prof.dr.ir. J.A.E.E. van Nunen, Prof.dr.ir. R. DekkerDefended: October 5, 2000, Lecture Notes in Economics and MathematicalSystems, Volume 501, 2001, Springer Verlag, Berlin, ISBN: 3540-417-117
3. Dolores Romero Morales, Optimization Problems in Supply ChainManagementPromotor(es): Prof.dr.ir. J.A.E.E. van Nunen, dr. H.E. RomeijnDefended: October 12, 2000, ISBN: 90-9014-078-6
4. Kees Jan Roodbergen, Layout and Routing Methods for WarehousesPromotor(es): Prof.dr. M.B.M. de Koster, Prof.dr.ir. J.A.E.E. van NunenDefended: May 10, 2001, ISBN: 90-5892-005-4
5. Rachel Campbell, Rethinking Risk in International Financial MarketsPromotor(es): Prof.dr. C.G. KoedijkDefended: September 7, 2001, ISBN: 90-5892-008-9
6. Yongping Chen, Labour flexibility in China’s companies: an empiricalstudyPromotor(es): Prof.dr. A. Buitendam, Prof.dr. B. KrugDefended: October 4, 2001, ISBN: 90-5892-012-7
7. Pursey P.M.A.R. Heugens, Strategic Issues Management: Implicationsfor Corporate PerformancePromotor(es): Prof.dr.ing. F.A.J. van den Bosch, Prof.dr. C.B.M. van RielDefended: October 19, 2001, ISBN: 90-5892-009-7
8. Roland F. Spekl, Beyond Generics; A closer look at Hybrid andHierarchical GovernancePromotor(es): Prof.dr. M.A. van Hoepen RADefended: October 25, 2001, ISBN: 90-5892-011-9
322 Bibliography
9. Pauline Puvanasvari Ratnasingam, Interorganizational Trust in Businessto Business E-CommercePromotor(es): Prof.dr. K. Kumar, Prof.dr. H.G. van DisselDefended: November 22, 2001, ISBN: 90-5892-017-8
10. Michael M. Mol, Outsourcing, Supplier-relations andInternationalisation: Global Source Strategy as a Chinese puzzlePromotor(es): Prof.dr. R.J.M. van TulderDefended: December 13, 2001, ISBN: 90-5892-014-3
11. Matthijs J.J. Wolters, The Business of Modularity and the Modularityof BusinessPromotor(es): Prof.mr.dr. P.H.M. Vervest, Prof.dr.ir. H.W.G.M. van HeckDefended: February 8, 2002, ISBN: 90-5892-020-8
12. J. van Oosterhout, The Quest for Legitimacy; On Authority andResponsibility in GovernancePromotor(es): Prof.dr. T. van Willigenburg, Prof.mr. H.R. van GunsterenDefended: May 2, 2002, ISBN: 90-5892-022-4
13. Otto R. Koppius, Information Architecture and Electronic MarketPerformancePromotor(es): Prof.dr. P.H.M. Vervest, Prof.dr.ir. H.W.G.M. van HeckDefended: May 16, 2002, ISBN: 90-5892-023-2
14. Iris F.A. Vis, Planning and Control Concepts for Material HandlingSystemsPromotor(es): Prof.dr. M.B.M. de Koster, Prof.dr.ir. R. DekkerDefended: May 17, 2002, ISBN: 90-5892-021-6
15. Jos Bijman, Essays on Agricultural Co-operatives; GovernanceStructure in Fruit and Vegetable ChainsPromotor(es): Prof.dr. G.W.J. HendrikseDefended: June 13, 2002, ISBN: 90-5892-024-0
16. Linda H. Teunter, Analysis of Sales Promotion Effects on HouseholdPurchase BehaviorPromotor(es): Prof.dr.ir. B. Wierenga, Prof.dr. T. KloekDefended: September 19, 2002, ISBN: 90-5892-029-1
17. Joost Loef, Incongruity between Ads and Consumer Expectations ofAdvertisingPromotor(es): Prof.dr. W.F. van Raaij, Prof.dr. G. AntonidesDefended: September 26, 2002, ISBN: 90-5892-028-3
18. Andrea Ganzaroli, Creating Trust between Local and Global SystemsPromotor(es): Prof.dr. K. Kumar, Prof.dr. R.M. LeeDefended: October 10, 2002, ISBN: 90-5892-031-3
Bibliography 323
19. Paul C. van Fenema, Coordination and Control of Globally DistributedSoftware ProjectsPromotor(es): Prof.dr. K. KumarDefended: October 10, 2002, ISBN: 90-5892-030-5
20. Dominique J.E. Delporte–Vermeiren, Improving the flexibility andprofitability of ICT-enabled business networks: an assessmentmethod and tool.Promotor(es): Prof.mr.dr. P.H.M. Vervest, Prof.dr.ir. H.W.G.M. van HeckDefended: May 9, 2003, ISBN: 90-5892-040-2
21. Raymond van Wijk, Organizing Knowledge in Internal Networks. AMultilevel StudyPromotor(es): Prof.dr.ing. F.A.J. van den BoschDefended: May 22, 2003, ISBN: 90-5892-039-9
22. Leon W.P. Peeters, Cyclic Railway Timetable OptimizationPromotor(es): Prof.dr. L.G. Kroon, Prof.dr.ir. J.A.E.E. van NunenDefended: June 6, 2003, ISBN: 90-5892-042-9
23. Cyriel de Jong, Dealing with Derivatives: Studies on the role,informational content and pricing of financial derivativesPromotor(es): Prof.dr. C.G. KoedijkDefended: June 19, 2003, ISBN: 90-5892-043-7
24. Ton de Waal, Processing of Erroneous and Unsafe DataPromotor(es): Prof.dr.ir. R. DekkerDefended: June 19, 2003, ISBN: 90-5892-045-3
25. Reggy Hooghiemstra, The Construction of RealityPromotor(es): Prof.dr. L.G. van der Tas RA, Prof.dr. A.Th.H. PruynDefended: September 25, 2003, ISBN: 90-5892-047-X
26. Marjolijn Dijksterhuis, Organizational dynamics of cognition and actionin the changing Dutch and U.S. banking industriesPromotor(es): Prof.dr. F.A.J. van den Bosch, Prof.dr. H.W. VolberdaDefended: September 18, 2003, ISBN: 90-5892-048-8
27. Dennis Fok, Advanced Econometric Marketing ModelsPromotor(es): Prof.dr. P.H.B.F. FransesDefended: November 6, 2003, ISBN: 90-5892-049-6
28. Martin Wielemaker, Managing Initiatives. A Synthesis of theConditioning and Knowledge-Creating ViewPromotor(es): Prof.dr. H.W. Volberda, Prof. dr. C.W.F. Baden-FullerDefended: November 16, 2003, ISBN: 90-5892-050-X
324 Bibliography
29. Douglas A.F. Berghe, Working Across Borders: MultinationalEnterprises and the Internationalization of EmploymentPromotor(es): Prof.dr. R.J.M. van Tulder, Prof. dr. E.J.J. SchenkDefended: November 28, 2003, ISBN: 90-5892-05-34
30. Peter R. Miltenburg, Effects of modular sourcing on manufacturingflexibility in the automotive industry. A study among German OEMsPromotor(es): Prof.dr. J. Paauwe, Prof. dr. H.R. CommandeurDefended: November 28, 2003, ISBN: 90-5892-052-6
31. Gjalt Graag, Tractable Morality. Customer discourses of bankers,veterinarians and charity workersPromotor(es): Prof.dr. F. Leijnse, Prof. dr. T. van WilligenburgDefended: December 12, 2003, ISBN: 90-5892-051-8
32. Victor A. Gilsing, Exploration, Exploitation and Co-evolution inInnovation NetworksPromotor(es): Prof.dr. B. Nooteboom, Prof.dr. J.P.M. GroenewegenDefended: December 3, 2003, ISBN: 90-5892-05-42
33. Bert Filer, Strategic Renewal of European Financial IncumbentsPromotor(es): Prof.dr. F. van den Bosch, Prof.dr. H. VolberdaDefended: December 11, 2003, ISBN: 90-5892-055-0
34. Peter de Langen, The Performance of Seaport ClustersPromotor(es): Prof.dr. B. Nooteboom, Prof.dr. H.W.H. WeltersDefended: January 20, 2004, ISBN: 90-5892-056-9

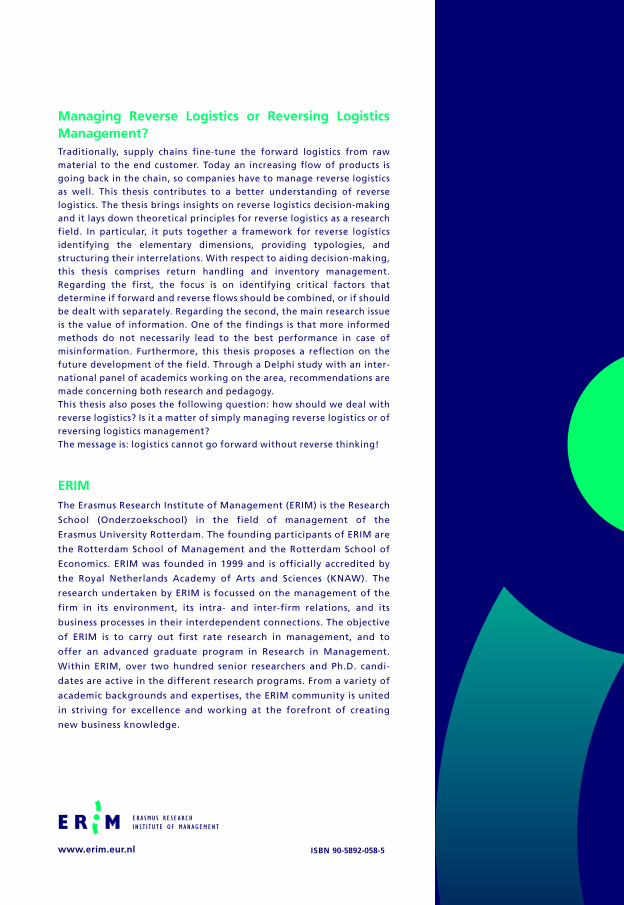
Managing Reverse Logistics or Reversing LogisticsManagement?Traditionally, supply chains fine-tune the forward logistics from rawmaterial to the end customer. Today an increasing flow of products isgoing back in the chain, so companies have to manage reverse logisticsas well. This thesis contributes to a better understanding of reverselogistics. The thesis brings insights on reverse logistics decision-makingand it lays down theoretical principles for reverse logistics as a researchfield. In particular, it puts together a framework for reverse logisticsidentifying the elementary dimensions, providing typologies, andstructuring their interrelations. With respect to aiding decision-making,this thesis comprises return handling and inventory management.Regarding the first, the focus is on identifying critical factors thatdetermine if forward and reverse flows should be combined, or if shouldbe dealt with separately. Regarding the second, the main research issueis the value of information. One of the findings is that more informedmethods do not necessarily lead to the best performance in case ofmisinformation. Furthermore, this thesis proposes a reflection on thefuture development of the field. Through a Delphi study with an inter-national panel of academics working on the area, recommendations aremade concerning both research and pedagogy.This thesis also poses the following question: how should we deal withreverse logistics? Is it a matter of simply managing reverse logistics or ofreversing logistics management?The message is: logistics cannot go forward without reverse thinking!
ERIMThe Erasmus Research Institute of Management (ERIM) is the Research
School (Onderzoekschool) in the field of management of the
Erasmus University Rotterdam. The founding participants of ERIM are
the Rotterdam School of Management and the Rotterdam School of
Economics. ERIM was founded in 1999 and is officially accredited by
the Royal Netherlands Academy of Arts and Sciences (KNAW). The
research undertaken by ERIM is focussed on the management of the
firm in its environment, its intra- and inter-firm relations, and its
business processes in their interdependent connections. The objective
of ERIM is to carry out first rate research in management, and to
offer an advanced graduate program in Research in Management.
Within ERIM, over two hundred senior researchers and Ph.D. candi-
dates are active in the different research programs. From a variety of
academic backgrounds and expertises, the ERIM community is united
in striving for excellence and working at the forefront of creating
new business knowledge.
www.erim.eur.nl ISBN 90-5892-058-5