managing heavy clay soils of the bland - nsw … rr gault, and ga sandral (2005), managing heavy...
TRANSCRIPT
Background
This booklet is based on the research findings from GRDC project CSP291: Optimising crop performance through innovative phase farming systems - new approaches to improve the nitrogen supply and management of hydrological balance for crops in wet environments, but also includes additional information from GRDC projects CSP216, CSP271 and CSP343.
Objectives of research program
� Explore through on-farm research, the potential for a range of different agronomic strategies to improve crop performance and capture the environmental benefits of perennial pasture species
� To develop and deliver management packages to growers that optimise water and N supply to crops following perennials in environments where too much water periodically constrains crop growth and yield potential
� In association with growers develop best practice management packages for farming difficult soils.
The Research Team Dr Mark Peoples, Mr Tony Swan, Mr Bob Gault,
CSIRO Division of Plant Industry Dr Brian Dear, Dr Yin Chan, Mr Richard Hayes,
Mr Albert Oates, Mr Graeme Sandral, NSW Department of Primary Industries.
Grogan and Morangarell Landcare
Citation: BS Dear, MB Peoples, KY Chan, AD Swan, RC Hayes, AOates, RR Gault, and GA Sandral (2005), Managing heavy clay soils of
the Bland-outcomes and management guidelines. Report on GRDC Project CSP 291, NSW Department of Primary Industries,
Wagga Wagga NSW.
ISBN 0 7347 1638 9
1
Managing heavy clay soils of the Bland Outcomes and management guidelines from GRDC project CSP 291
Understanding management of heavy clay soils
Key findings – what we learnt .................................................. 3Sodic Soils - background reading ............................................ 5How does gypsum work?......................................................... 6Will gypsum work on my soil?.................................................. 6Gypsum quality ........................................................................ 7Gypsum choice ........................................................................ 8Mixtures of gypsum and lime ................................................... 9How long will gypsum last?.................................................... 10Will crop yields benefit from applying gypsum?..................... 11Effect of gypsum at Morangarell - a less sodic site................ 12What do EC and ESP measures mean?................................ 13Salinity and sodicity soil profiles ............................................ 14What is plant-available soil water?......................................... 16How deep did the roots of the crops and pastures go and how much water can they extract?................................................ 18Potential impacts of gypsum on salt profiles and plant-available soil water................................................................................ 21Best bet pasture mixes for heavy clay soils ........................... 23Effect of gypsum on pasture yields........................................ 24The rotational implications of “dewatering” the soil profile withlucerne ................................................................................... 28Effect of soil compaction and wheel tracks on crop growth ... 33Some extra notes on wheel track compaction ....................... 34What is the impact of pasture species on soil mineral N during the pasture phase? ................................................................ 38Comparison of soil nitrate profiles under annual and perennial pasture treatments ................................................................. 40Management guidelines......................................................... 44
2
Key findings – what we learnt
- All 13 soil profiles examined in the Bland were sodic (ESP>6%) somewhere in the soil profile. Sodicity increased with depth. Most soils exhibited a bulge of high EC (ECe >4 dSm-1) below 50-70 cm.
- Not all soils on the Bland respond to gypsum, significant benefits only occurred where soil tests indicated exchangeable sodium levels exceeded 6% in the topsoil.
-The Grogan soil was sodic (ESP>6%) from the surface and saline (ECe >4 dSm-1) below 60 cm.
- Gypsum increased canola growth and grain yield in a moderately wet year such as 2000 by improving water infiltration into the topsoil and reducing the severity of waterlogging.
- Wheat was less sensitive to waterlogging than canola
- Gypsum increased the establishment and plant density of lucerne but did not increase lucerne persistence.
- Lucerne populations declined at a steady rate irrespective of initial plant density or gypsum treatment
- A mixture of Clare subterranean clover, Riverina subterranean clover, burr medic and balansa clover was highly productive on the heavy soils
- Adding gypsum increased seed yield by the annual legumes by 30-60%
- Both sites had a highly compacted layer at a depth of about 15 cms which was sufficient to restrict root growth.
- Soil compaction as a result of machinery traffic was a major impediment to plant growth reducing canola yields by 66%.
- The impact of livestock trampling on soil compaction was reduced with gypsum due to the improved infiltration and a drier topsoil
- Soil compaction by livestock can be worse in lucerne-based pastures than under annual clover.
- Canola root growth was more sensitive to soil compaction than wheat.
- Deep ripping can remove the compacted layer, but it reforms with wheel traffic and stocking
- Deep ripping increased wheat and canola yields by 15-20% in 2000.
-Lucerne extracted water to around 2.5 m on these heavy soils. This compares to a rooting depth of 3-5 m on a typical red earth.
- Net mineralization was greater during the 2nd and 3rd crop after lucerne removal than for the 1st crop.
- Chicory will grow well for up to 3 years on these soils providing it is not excessively wet.
- Chicory did not seem to be as competitive with sub clover as lucerne or phalaris.
- A single year of good growth by high density forage legumes can greatly increase concentrations of soil mineral N for cropping.
3 4
Sodic Soils - background reading Some clay soils are well structured and relatively easy to manage. Sodic clay soils, by contrast, are more likely to be poorly structured and difficult to manage.
What are sodic soils? Sodic soils are said to be ‘dispersive’ which means they tend to lose their structure when wet by rain water. (The cloudiness of water in puddles is typically due to clay dispersion). More precisely, sodic soils are dominated by sodium or magnesium on their cation exchange sites. When wet, these cations occupy much of the space around cation exchange sites preventing clay particles from getting close enough to bond together.
By contrast, calcium is a much more compact cation when wet. If calcium dominates the cation exchange sites of clay particles the soil will be much more stable in the presence of rain water, wet clay particles are able to stay close together enabling ‘flocculation’ and protecting the soil’s ‘aggregation’.
• In Australia, a soil is considered ‘sodic’ if the exchangeable sodium percentage (ESP) is greater than 6%.
• A simple test for sodicity or dispersion is to gently place a few (say 3) 3-5mm crumbs of soil in a saucer of rain water. If a cloudy halo develops around the soil crumb in 2 hours the soil is dispersive or sodic.
• When a soil disperses in the field, disaggregated clay particles tend to clog surface pores making the soil impermeable. This contributes to surface sealing resulting in reduced infiltration, increased runoff and surface water-logging. As the surface dries, a crust forms which may hinder seedling emergence.
Applying gypsum (or lime if the soil is acidic) to a sodic soil can prevent the above problems and hence make the soil better to manage.
How does gypsum work? The scientific name for gypsum is calcium sulphate.
There are two ways in which gypsum works:
1: Salt (or electrolyte) effect As mentioned previously, sodic soils disperse in the presence of rain water. If the water is salty this may prevent the soil from dispersing. Gypsum is a salt and is moderately soluble in water. An improvement in soil structure seen in the year that gypsum is applied is mainly due to this salting effect. This effect is quickly lost as water leaches through the soil profile reducing the ‘salt’ concentration.
2: Calcium effect As the gypsum dissolves and leaches through the soil, calcium ions replace some of the sodium (or magnesium) ions on the clay particles’ cation exchange sites. (These ‘exchangeable cations’ are the cations reported on in commercial soil tests.) Once calcium dominates the cation exchange sites the clay particles no longer disperse when wet.
Lime (calcium carbonate) is an alternative source of calcium which may be effectively applied if the soil is acidic.
Will gypsum work on my soil? In general, gypsum is recommended for sodic soils. It is also a source of sulphur, so the use of gypsum may reduce the sulphur fertiliser required from other sources.
However, crop responses will be dependent on a range of factors such as seasonal rainfall, soil and crop types.
Do a soil test to confirm that the surface soil is sodic. Before applying gypsum over the whole field, first try it in a test strip.
5 6
Gypsum quality Factors to consider 1: Purity Recommended application rates of gypsum are generally based on a pure product. In practice, commercially available gypsum will contain impurities which may need to be accounted for when calculating the application rate. Typical impurities include water, soil, lime (may be useful), sodium chloride, cadmium and fluoride. The source of the gypsum will dictate which impurities are most significant: mined gypsum may contain soil and limestone whilst ‘by-product’ gypsum may contain cadmium and/or fluoride. The moisture content of either source may also be significant.
2: Particle size Gypsum is relatively insoluble in water so the fineness of the gypsum product largely determines how fast it dissolves. A finer product will also give much better soil coverage.
3: Fertilisers Act (1985) By law gypseous materials sold in NSW need to be registered and labelled. The vendor must provide details of the purity (percent sulphur on a wet weight basis), particle size (percent passing a 2mm sieve), water content (%) and chloride percent (wet weight basis). To comply the gypsum must have
• at least 12% sulphur (equivalent to 65% pure gypsum on a wet weight basis)
• at least 80% passing a 5.6mm sieve • no more than 15% moisture • a warning if the chloride content exceeds 1.2% on a wet
weight basis
Reference: ‘Improving soil structure with gypsum and lime’, Abbott, T.S. and McKenzie, D.C. (1996) Agfact AC.10
Gypsum choice
In choosing a gypsum product it is important to get a product of adequate purity and which is sufficiently spreadable and soluble for the task at hand. For example if surface crusting is a problem then the gypsum will need to be fine (not ‘cloddy’) to give the solubility and soil ‘coverage’ required. Assuming a number of suppliers can satisfy those criteria (and provide reliable supply) then valid price comparisons need to be made. Given that gypsum may be supplied by the tonne or by the cubic metre the following formulae may be useful in deciding which supplier to purchase from.
Cost = $ (A+B) x 18.6 / C if buying by weight, or
Cost = $ (A+B) x 18.6 / (C x D) if buying by volume, where
Cost is $ per tonne of pure gypsum (CaSO4.2H2O)
A is the farm gate cost of gypsum per tonne or cubic metre
B is the spreading cost per tonne or cubic metre
C is the purity as sulphur percentage on a wet weight basis
D is the tonnes/cubic metre if buying gypsum by the cubic metre
Reference: ‘Improving soil structure with gypsum and lime’,
Abbott, T.S. and McKenzie, D.C. (1996) Agfact AC.10 (This Agfact also provides helpful advice on whether cadmium and other contaminants are likely to cause problems in your particular situation.)
7 8
Mixtures of gypsum and lime
Both gypsum and lime contain calcium and they both also contribute electrolyte (salt) to the soil solution. Consequently, both products may have a role in improving sodic soils.
Pure gypsum (CaSO4.2H2O) contains approx. 23% calcium and is moderately soluble.
Pure lime (CaCO3) contains about 40% calcium but is much less soluble than gypsum and is essentially insoluble if the soil pH is above about 6.0 when measured in calcium chloride.
Providing the pH is suitable a mixture of gypsum and lime may be a good strategy: the gypsum providing a quick response whilst the lime, with its lower solubility but higher calcium content, providing a longer-term benefit.
A suggested strategy:
• For pH greater than 6 use gypsum
• For pH less than 6 but greater than about 5.4 use a mixture of about 75:25 gypsum to lime
• For pH greater than 4.8 but less than about 5.4 use a mixture of about 50:50 gypsum to lime
• For pH less than 4.8 use lime
Reference: ’Improving soil structure with gypsum and lime’,
Abbott, T.S. and McKenzie, D.C. (1996) Agfact AC.10
9
How long will gypsum last? To answer this question, it is useful to distinguish the crop response from the soil response. Gypsum application improves soil structure and changes the soil /water conditions (as described before) which can potentially benefit crops. However this doesn’t automatically lead to a yield increase, particularly in dry-land situations. Positive responses depend on seasonal conditions, particularly rainfall.
In the present experiment, higher crop yields were found only in one season, namely 2000, a wet year.
On the other hand, soil improvement as a result of gypsum application was observed for
• Reduced exchangeable sodium % (ESP) • Reduced dispersion • Improved aeration • Increased soil water storage • Reduced soil strength
Lower ESP was detected to a soil depth of 30 cm, 5 years after gypsum application. Reduced dispersion, increased soil water storage and reduced soil strength were detected in the gypsum-treated soil after 5 years.
Usually effects of gypsum last longer in clay soils than in sandy soils. The effects tend to decrease with time due to leaching losses of gypsum.
Is the “gypsum effect” cumulative? The short term effect of gypsum i.e. “the salt effect”, is likely to be transient and will be lost due to leaching of the added gypsum in a couple of seasons. However, the calcium effect, i.e. the exchange of sodium by calcium ions of the added gypsum, with resulting lower ESP of the soil, should last for a longer period of time. Therefore repeated application of gypsum should have a cumulative effect on reducing sodicity. This is especially true for the clay soils which have high cation exchange capacity (therefore can hold the calcium ions tightly) and low rate of leaching.
10
Will crop yields benefit from applying gypsum?
Data collected from the more sodic of the 2 main experimental sites, Grogan (where ESP was 12% in the top 10cm and increased to 30% at depth), indicated that gypsum:
• Influenced structural stability resulting in improved trafficability, a wider sowing window, and improved timeliness of sowing,
• Improved water infiltration and prevented surface waterlogging in 2000 (70mm above average rainfall following a wet summer),
• Improved seedling emergence for crops such faba bean, • Resulted in substantial increases in canola grain yield
(from 0.5-2.0 t/ha) under the wet conditions in 2000. At a nearby on-farm study on a similar soil type, wheat yields were enhanced from 3.0 to 4.5 t/ha also in 2000 with the application of 2.5 t gypsum/ha.
• Faba bean crop biomass (5.7-8.0 t dry matter/ha) and N-fixation (57-132 kg N/ha) was increased in response to gypsum treatment in the drier 2001 growing season (50mm below average, 80mm less than average total annual), but there was no significant difference in grain yield (3.4-3.8 t/ha). This was probably due to lower soil moisture availability in the plus gypsum plots (because of the greater biomass production) combined with high temperatures (greater than 25OC) at the end of October/ early November which resulted in the crop senescing early. No differences in wheat yields were observed in the on-farm study in 2001.
• There was no significant effect of gypsum on either canola or wheat under the dry conditions that prevailed at Grogan between 2002 and 2004.
Effect of gypsum at Morangarell - a less sodic site
While improvements in soil ‘workability’ were observed at the less sodic site at Morangarell (no surface sodicity, but sodic below 10 cm), there was no measurable impact on crop growth or yield in any year between 1999 and 2003. On this basis we would not recommend applying gypsum if the ESP of the top 10cm is less than 6%. However, this conclusion should be qualified by noting that growing season rainfall at Morangarell was between 50 and 185mm less than average for the duration of the experiment, and crop response to gypsum was never evaluated under waterlogged conditions.
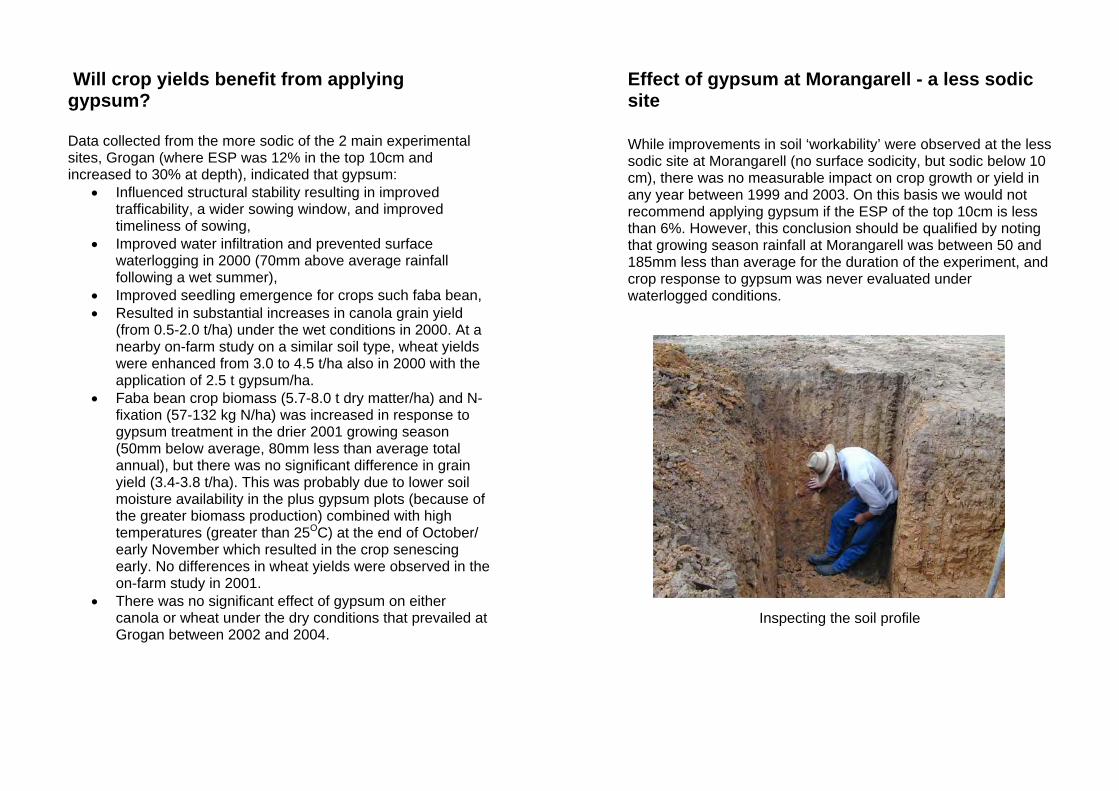
Inspecting the soil profile
11 12
30
What do EC and ESP measures mean? Electrical conductivity (EC) EC provides a measure of soil salinity. There are 3 different measures of EC.
1: Saturated paste extract (ECs or ECse or ECe) This comes closest to simulating the salinity experienced by a plant in the field but is the least convenient to measure. As the name suggests it involves preparing a soil paste, removing the water from this paste and then measuring the electrical conductivity of the soil water. A value of 4 decisiemens per m (dSm-1) or greater is generally accepted as being ‘saline’.
2: Electrical conductivity (EC 1:5) In this procedure 5 grams of soil are added to 25ml of distilled water and shaken to dissolve any salts present. The electrical 120 conductivity of the soil solution is then measured. This value may then be converted to the equivalent of a saturated paste extract 140
(ECe) using a conversion factor which corresponds to the texture of the soil. 160
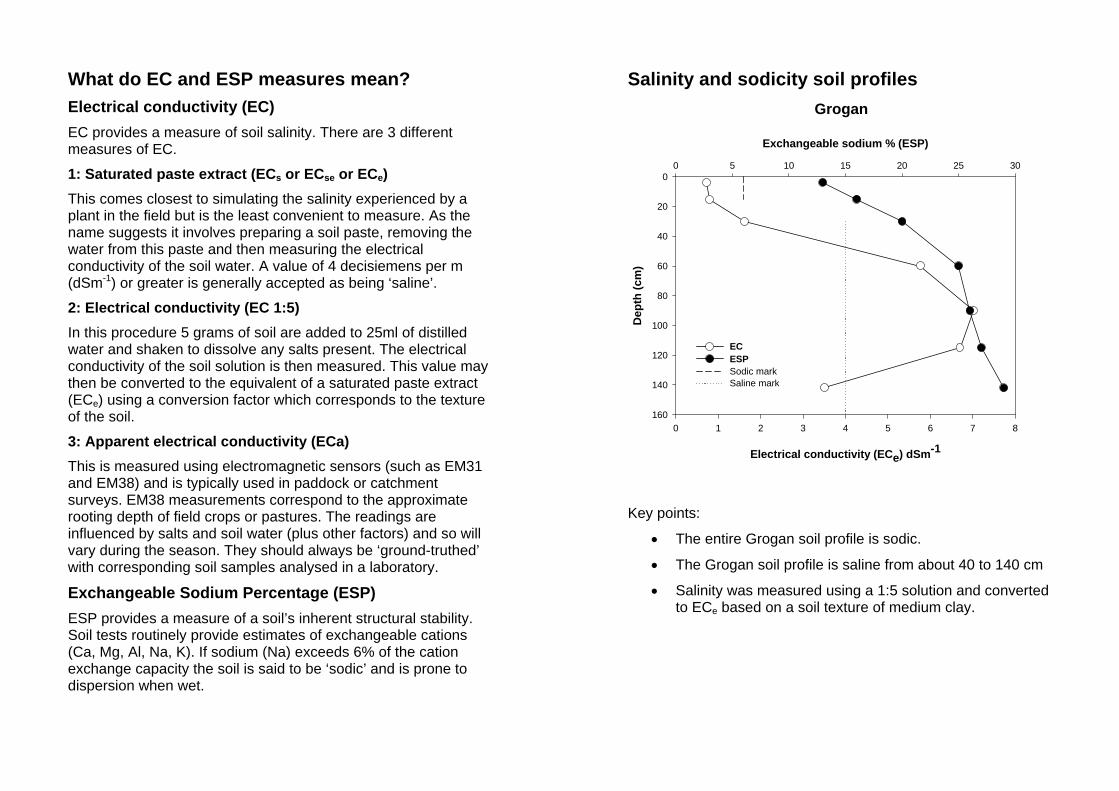
Salinity and sodicity soil profiles Grogan
Exchangeable sodium % (ESP)
0 5 15 2510 20 0
20
40
EC ESP Sodic mark Saline mark
Dep
th (c
m) 60
80
100
3: Apparent electrical conductivity (ECa) This is measured using electromagnetic sensors (such as EM31 and EM38) and is typically used in paddock or catchment surveys. EM38 measurements correspond to the approximate rooting depth of field crops or pastures. The readings are influenced by salts and soil water (plus other factors) and so will vary during the season. They should always be ‘ground-truthed’ with corresponding soil samples analysed in a laboratory.
Exchangeable Sodium Percentage (ESP) ESP provides a measure of a soil’s inherent structural stability. Soil tests routinely provide estimates of exchangeable cations (Ca, Mg, Al, Na, K). If sodium (Na) exceeds 6% of the cation exchange capacity the soil is said to be ‘sodic’ and is prone to dispersion when wet.
0 1 2 3 4 5 6 7 8
Electrical conductivity (ECe) dSm-1
Key points:
• The entire Grogan soil profile is sodic.
• The Grogan soil profile is saline from about 40 to 140 cm
• Salinity was measured using a 1:5 solution and converted to ECe based on a soil texture of medium clay.
13 14
Dep
th (c
m)
Morangarell
Exchangeable sodium % (ESP)
0 5 10 15 20 25 30 0
20
40
60
80
100
120
140
160 0 2 4 6 8
ECe
ESP Sodic mark Saline mark
Electrical conductivity (ECe) dSm-1
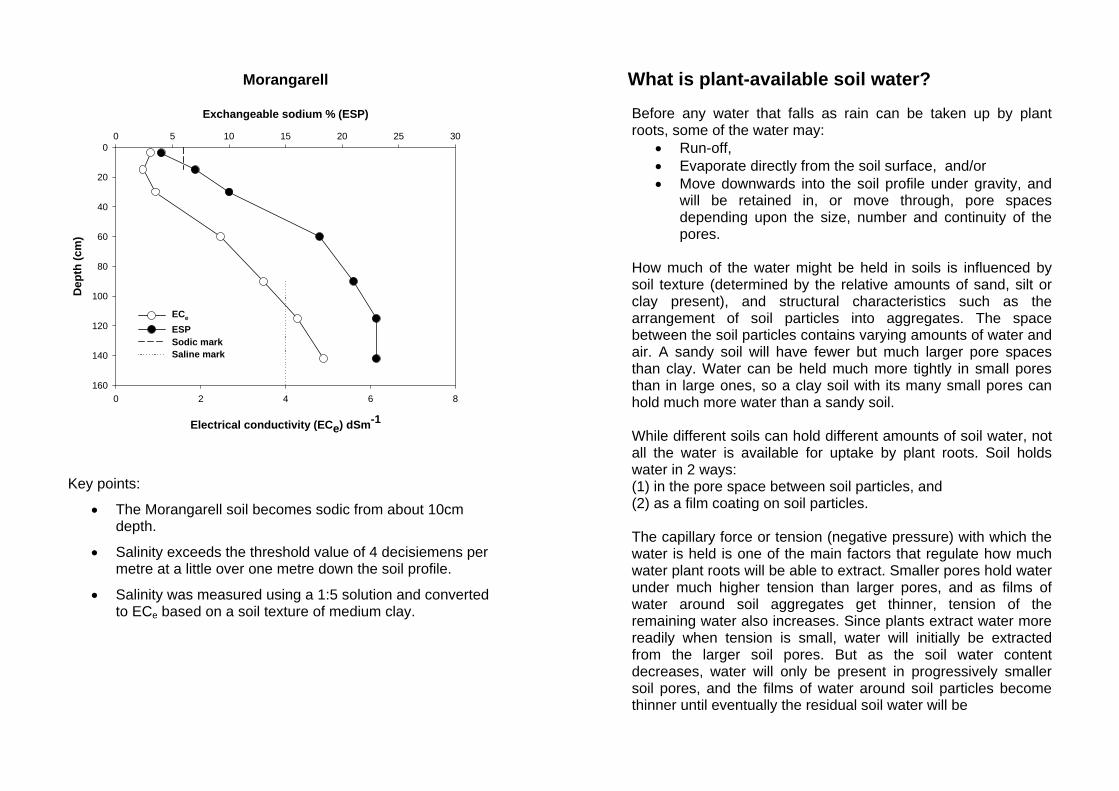
Key points:
• The Morangarell soil becomes sodic from about 10cm depth.
• Salinity exceeds the threshold value of 4 decisiemens per metre at a little over one metre down the soil profile.
• Salinity was measured using a 1:5 solution and converted to ECe based on a soil texture of medium clay.
What is plant-available soil water?
Before any water that falls as rain can be taken up by plant roots, some of the water may:
• Run-off, • Evaporate directly from the soil surface, and/or • Move downwards into the soil profile under gravity, and
will be retained in, or move through, pore spaces depending upon the size, number and continuity of the pores.
How much of the water might be held in soils is influenced by soil texture (determined by the relative amounts of sand, silt or clay present), and structural characteristics such as the arrangement of soil particles into aggregates. The space between the soil particles contains varying amounts of water and air. A sandy soil will have fewer but much larger pore spaces than clay. Water can be held much more tightly in small pores than in large ones, so a clay soil with its many small pores can hold much more water than a sandy soil.
While different soils can hold different amounts of soil water, not all the water is available for uptake by plant roots. Soil holds water in 2 ways: (1) in the pore space between soil particles, and (2) as a film coating on soil particles.
The capillary force or tension (negative pressure) with which the water is held is one of the main factors that regulate how much water plant roots will be able to extract. Smaller pores hold water under much higher tension than larger pores, and as films of water around soil aggregates get thinner, tension of the remaining water also increases. Since plants extract water more readily when tension is small, water will initially be extracted from the larger soil pores. But as the soil water content decreases, water will only be present in progressively smaller soil pores, and the films of water around soil particles become thinner until eventually the residual soil water will be
15 16
What is plant-available soil water? (contined)
held so firmly by adsorptive capillary forces that it cannot effectively be extracted by plants.
The total amount of soil water that can be extracted by plants is often a useful measure to know. When the soil profile is full of water it is said to be at ‘field capacity’. Field capacity is the water content of a soil at the upper limit of the available water range. It is generally measured from the amount of water remaining in a soil after it has been saturated and allowed to drain for 24 hours. When plants have removed all of the available water from a given soil they wilt and do not recover. This is the ‘lower limit’ of the available water range. In practice this is often determined from the lowest water contents that have actually been measured at a field site – for example the water content measured in summer after a few years of lucerne. The difference between measures of field capacity and lower limit provides an estimate of plant-available soil water for any particular soil.
While the amount of plant-available water will be influenced largely by soil type, factors other than soil texture and structure can also be important. Differences in rooting depth or root architecture between plant species can result in different volumes of soil being explored by their roots, and this will impact on the amount of available water that can be extracted by the different species. However, if subsoil conditions restrict root growth, then the amount of water available for crop growth will also be reduced even if the soil profile is full. If the soil is slightly saline, the concentration of salt in the soil solution will rise as the soil becomes drier, and less water is likely to be extracted by roots (and available water reduced) for osmotic reasons (see later section).
How deep did the roots of the crops and pastures go and how much water can they extract?
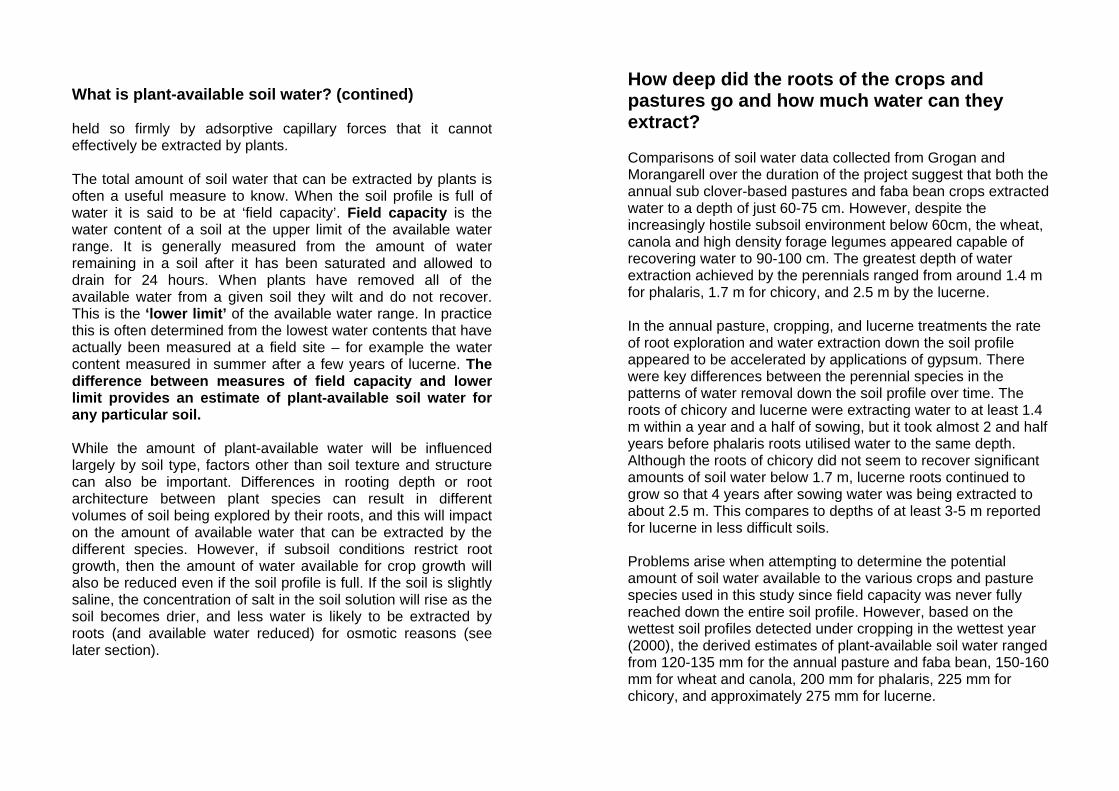
Comparisons of soil water data collected from Grogan and Morangarell over the duration of the project suggest that both the annual sub clover-based pastures and faba bean crops extracted water to a depth of just 60-75 cm. However, despite the increasingly hostile subsoil environment below 60cm, the wheat, canola and high density forage legumes appeared capable of recovering water to 90-100 cm. The greatest depth of water extraction achieved by the perennials ranged from around 1.4 m for phalaris, 1.7 m for chicory, and 2.5 m by the lucerne.
In the annual pasture, cropping, and lucerne treatments the rate of root exploration and water extraction down the soil profile appeared to be accelerated by applications of gypsum. There were key differences between the perennial species in the patterns of water removal down the soil profile over time. The roots of chicory and lucerne were extracting water to at least 1.4 m within a year and a half of sowing, but it took almost 2 and half years before phalaris roots utilised water to the same depth. Although the roots of chicory did not seem to recover significant amounts of soil water below 1.7 m, lucerne roots continued to grow so that 4 years after sowing water was being extracted to about 2.5 m. This compares to depths of at least 3-5 m reported for lucerne in less difficult soils.
Problems arise when attempting to determine the potential amount of soil water available to the various crops and pasture species used in this study since field capacity was never fully reached down the entire soil profile. However, based on the wettest soil profiles detected under cropping in the wettest year (2000), the derived estimates of plant-available soil water ranged from 120-135 mm for the annual pasture and faba bean, 150-160 mm for wheat and canola, 200 mm for phalaris, 225 mm for chicory, and approximately 275 mm for lucerne.
17 18
105-120
120-135
135-150
150-165
Key points
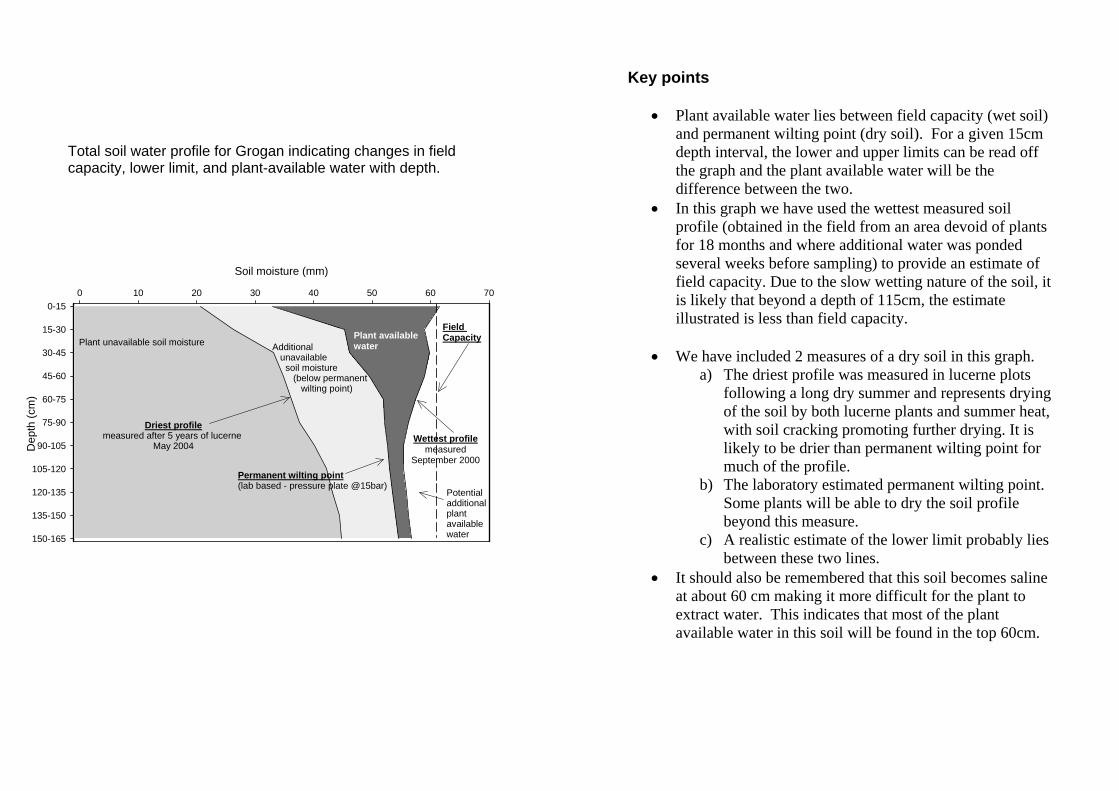
• Plant available water lies between field capacity (wet soil) and permanent wilting point (dry soil). For a given 15cm depth interval, the lower and upper limits can be read off the graph and the plant available water will be the difference between the two.
• In this graph we have used the wettest measured soil profile (obtained in the field from an area devoid of plants for 18 months and where additional water was ponded several weeks before sampling) to provide an estimate of field capacity. Due to the slow wetting nature of the soil, it is likely that beyond a depth of 115cm, the estimate
Total soil water profile for Grogan indicating changes in field capacity, lower limit, and plant-available water with depth.
Soil moisture (mm)
0 10 20 30 40 50 60 70 0-15
Wettest profile measured
September 2000 Permanent wilting point(lab based - pressure plate @15bar)
Driest profilemeasured after 5 years of lucerne
May 2004
Additional unavailable soil moisture
(below permanent wilting point)
Plant available water Plant unavailable soil moisture
Field Capacity
Potential additional plant available water
illustrated is less than field capacity.
• We have included 2 measures of a dry soil in this graph. a) The driest profile was measured in lucerne plots
following a long dry summer and represents drying of the soil by both lucerne plants and summer heat, with soil cracking promoting further drying. It is likely to be drier than permanent wilting point for much of the profile.
b) The laboratory estimated permanent wilting point. Some plants will be able to dry the soil profile beyond this measure.
c) A realistic estimate of the lower limit probably lies
15-30
30-45
45-60
60-75
Dep
th (c
m)
90-105
75-90
between these two lines. • It should also be remembered that this soil becomes saline
at about 60 cm making it more difficult for the plant to extract water. This indicates that most of the plant available water in this soil will be found in the top 60cm.
19 20
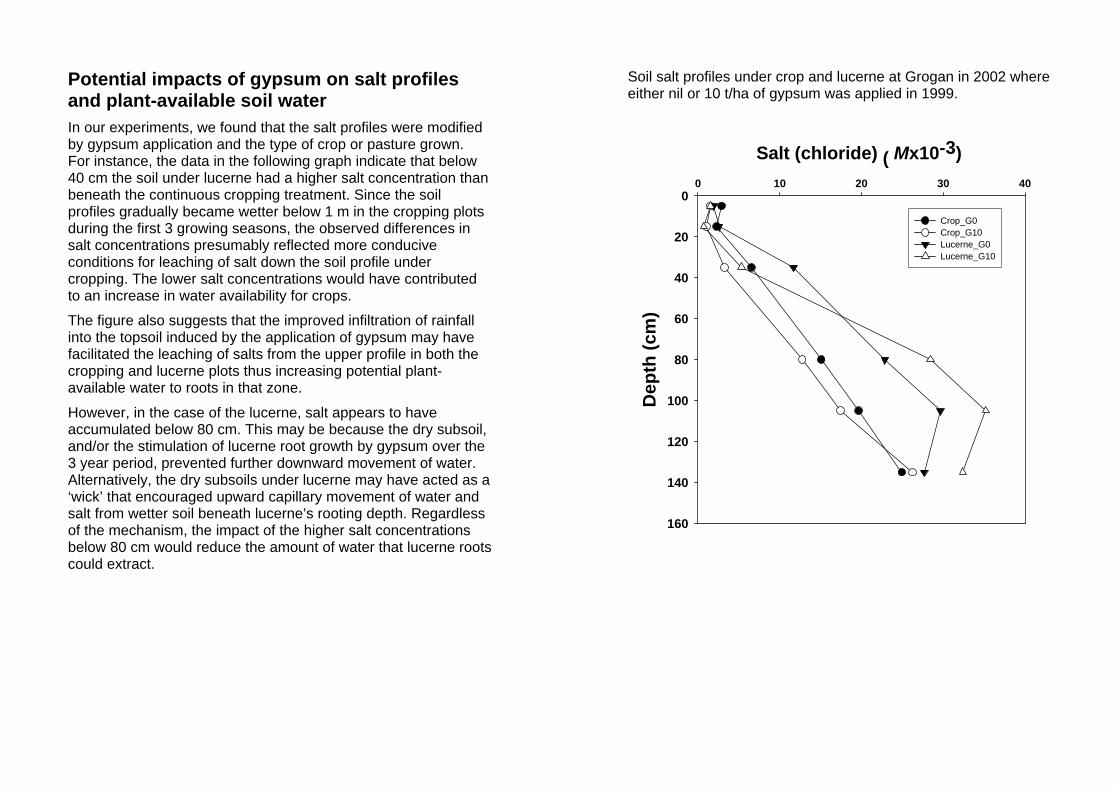
Potential impacts of gypsum on salt profiles and plant-available soil water In our experiments, we found that the salt profiles were modified by gypsum application and the type of crop or pasture grown. For instance, the data in the following graph indicate that below 40 cm the soil under lucerne had a higher salt concentration than beneath the continuous cropping treatment. Since the soil profiles gradually became wetter below 1 m in the cropping plots during the first 3 growing seasons, the observed differences in salt concentrations presumably reflected more conducive conditions for leaching of salt down the soil profile under cropping. The lower salt concentrations would have contributed to an increase in water availability for crops.
The figure also suggests that the improved infiltration of rainfall into the topsoil induced by the application of gypsum may have facilitated the leaching of salts from the upper profile in both the cropping and lucerne plots thus increasing potential plant-available water to roots in that zone.
However, in the case of the lucerne, salt appears to have accumulated below 80 cm. This may be because the dry subsoil, and/or the stimulation of lucerne root growth by gypsum over the 3 year period, prevented further downward movement of water. Alternatively, the dry subsoils under lucerne may have acted as a ‘wick’ that encouraged upward capillary movement of water and salt from wetter soil beneath lucerne’s rooting depth. Regardless of the mechanism, the impact of the higher salt concentrations below 80 cm would reduce the amount of water that lucerne roots could extract.
Soil salt profiles under crop and lucerne at Grogan in 2002 where either nil or 10 t/ha of gypsum was applied in 1999.
Salt (chloride) ( Mx10-3) 0 10 20 30 40
0
20
40
60
80
100
120
140
160
Crop_G0 Crop_G10 Lucerne_G0 Lucerne_G10
Dep
th (c
m)
21 22
Best bet pasture mixes for heavy clay soils
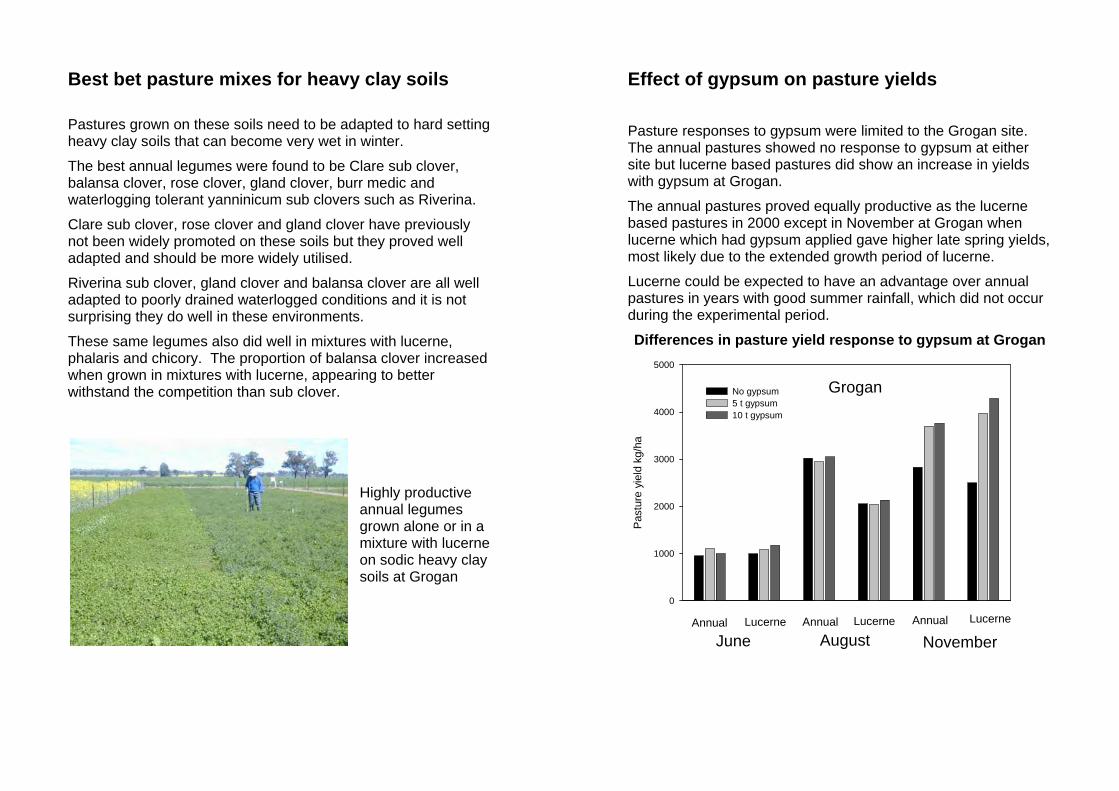
Pastures grown on these soils need to be adapted to hard setting heavy clay soils that can become very wet in winter.
The best annual legumes were found to be Clare sub clover, balansa clover, rose clover, gland clover, burr medic and waterlogging tolerant yanninicum sub clovers such as Riverina.
Clare sub clover, rose clover and gland clover have previously not been widely promoted on these soils but they proved well adapted and should be more widely utilised.
Riverina sub clover, gland clover and balansa clover are all well adapted to poorly drained waterlogged conditions and it is not surprising they do well in these environments.
These same legumes also did well in mixtures with lucerne, phalaris and chicory. The proportion of balansa clover increased when grown in mixtures with lucerne, appearing to better withstand the competition than sub clover.
Highly productive annual legumes grown alone or in a mixture with lucerne on sodic heavy clay soils at Grogan
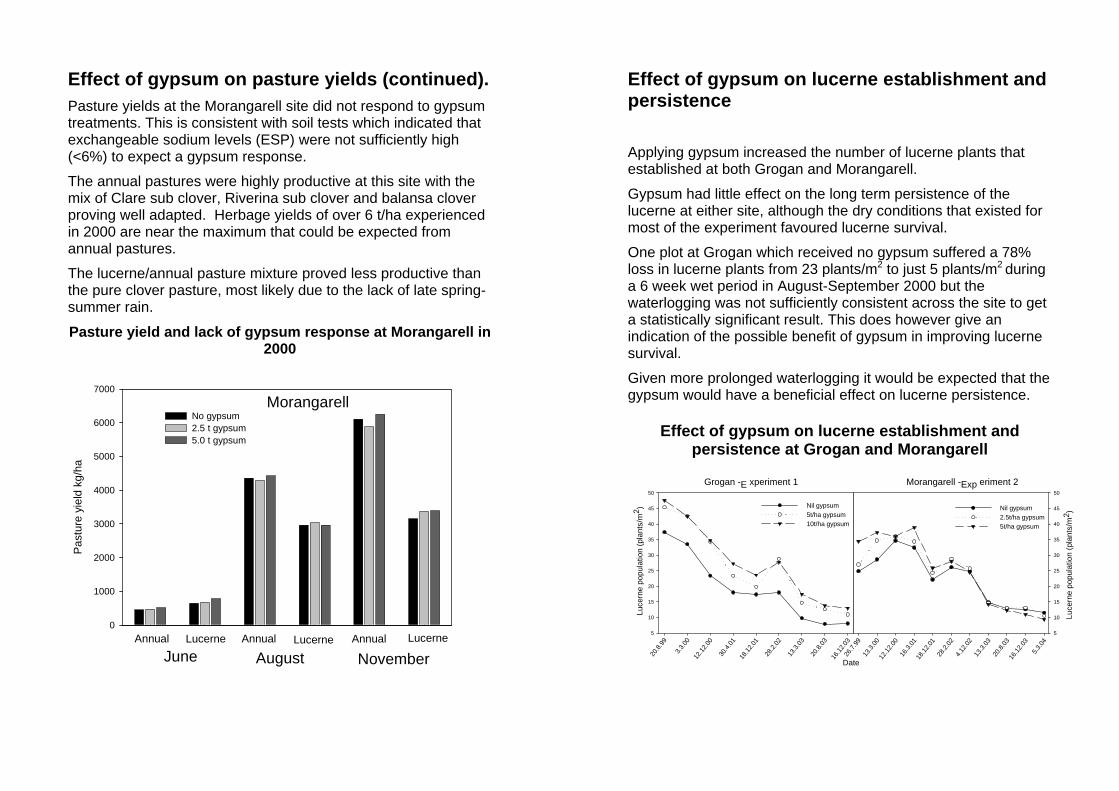
Effect of gypsum on pasture yields
Pasture responses to gypsum were limited to the Grogan site. The annual pastures showed no response to gypsum at either site but lucerne based pastures did show an increase in yields with gypsum at Grogan.
The annual pastures proved equally productive as the lucerne based pastures in 2000 except in November at Grogan when lucerne which had gypsum applied gave higher late spring yields, most likely due to the extended growth period of lucerne.
Lucerne could be expected to have an advantage over annual pastures in years with good summer rainfall, which did not occur during the experimental period.
Differences in pasture yield response to gypsum at Grogan
Pas
ture
yie
ld k
g/ha
4000
5000
No gypsum 5 t gypsum 10 t gypsum
Grogan
3000
2000
1000
0
June Annual Lucerne
August Annual Lucerne
November Annual Lucerne
23 24
2000
3000
5000
7000 Morangarell
No gypsum6000 2.5 t gypsum
5.0 t gypsum
Past
ure
yiel
d kg
/ha
4000
0 Annual Lucerne Annual Lucerne Annual Lucerne
June August November
1000
20.8.
99
3.3.00
12
.12.0 0
30.4.
01
18.12
.01
28.2.
02
13.3.
03
20.8.
03
16.12
.03
26.7.
9 913
.3.0 0
12.12
.00
16.3.
01
18.12
.01
28.2.
02
4.12.0
2 13
.3.03
20
.8.03
16
.12.03
5.3
.04
Effect of gypsum on pasture yields (continued). Effect of gypsum on lucerne establishment and Pasture yields at the Morangarell site did not respond to gypsum persistence treatments. This is consistent with soil tests which indicated that exchangeable sodium levels (ESP) were not sufficiently high (<6%) to expect a gypsum response. Applying gypsum increased the number of lucerne plants that
established at both Grogan and Morangarell.The annual pastures were highly productive at this site with the mix of Clare sub clover, Riverina sub clover and balansa clover Gypsum had little effect on the long term persistence of the proving well adapted. Herbage yields of over 6 t/ha experienced lucerne at either site, although the dry conditions that existed for in 2000 are near the maximum that could be expected from most of the experiment favoured lucerne survival. annual pastures. One plot at Grogan which received no gypsum suffered a 78% The lucerne/annual pasture mixture proved less productive than loss in lucerne plants from 23 plants/m2 to just 5 plants/m2 during the pure clover pasture, most likely due to the lack of late spring- a 6 week wet period in August-September 2000 but the summer rain. waterlogging was not sufficiently consistent across the site to get
a statistically significant result. This does however give anPasture yield and lack of gypsum response at Morangarell in indication of the possible benefit of gypsum in improving lucerne
2000 survival.
Given more prolonged waterlogging it would be expected that thegypsum would have a beneficial effect on lucerne persistence.
Effect of gypsum on lucerne establishment andpersistence at Grogan and Morangarell
Grogan -E xperiment 1 Morangarell -Exp eriment 2 50 50
10
15
20
25
30
35
Nil gypsum 5t/ha gypsum 10t/ha gypsum
10
15
20
25
30
35
Nil gypsum 2.5t/ha gypsum 5t/ha gypsum
45 45
Luce
rne
popu
latio
n (p
lant
s/m
2 )
40 40
5 5
Date
25 26
Luce
rne
popu
latio
n (p
lant
s/m
2 )
Using chicory on heavy soils
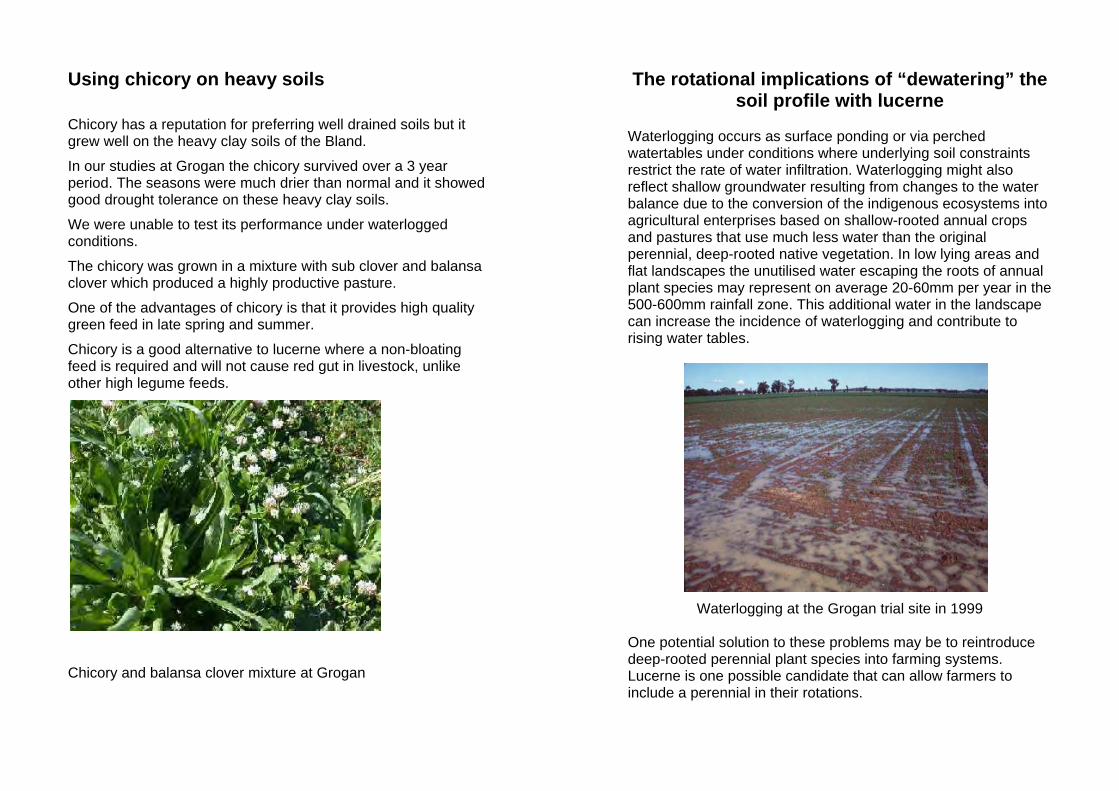
Chicory has a reputation for preferring well drained soils but it grew well on the heavy clay soils of the Bland.
In our studies at Grogan the chicory survived over a 3 year period. The seasons were much drier than normal and it showed good drought tolerance on these heavy clay soils.
We were unable to test its performance under waterlogged conditions.
The chicory was grown in a mixture with sub clover and balansa clover which produced a highly productive pasture.
One of the advantages of chicory is that it provides high quality green feed in late spring and summer.
Chicory is a good alternative to lucerne where a non-bloating feed is required and will not cause red gut in livestock, unlike other high legume feeds.
The rotational implications of “dewatering” the soil profile with lucerne
Waterlogging occurs as surface ponding or via perched watertables under conditions where underlying soil constraints restrict the rate of water infiltration. Waterlogging might also reflect shallow groundwater resulting from changes to the water balance due to the conversion of the indigenous ecosystems into agricultural enterprises based on shallow-rooted annual crops and pastures that use much less water than the original perennial, deep-rooted native vegetation. In low lying areas and flat landscapes the unutilised water escaping the roots of annual plant species may represent on average 20-60mm per year in the 500-600mm rainfall zone. This additional water in the landscape can increase the incidence of waterlogging and contribute to rising water tables.
Waterlogging at the Grogan trial site in 1999
One potential solution to these problems may be to reintroduce deep-rooted perennial plant species into farming systems. Lucerne is one possible candidate that can allow farmers to include a perennial in their rotations.
Chicory and balansa clover mixture at Grogan
27 28
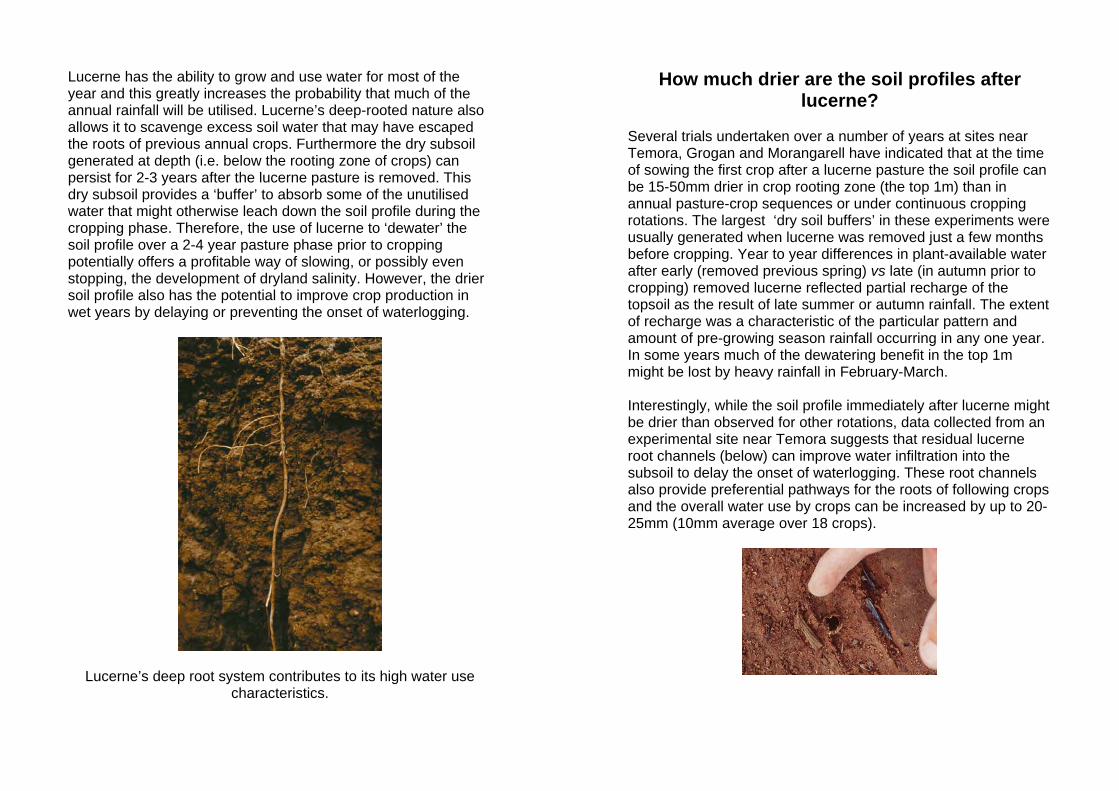
Lucerne has the ability to grow and use water for most of the year and this greatly increases the probability that much of the annual rainfall will be utilised. Lucerne’s deep-rooted nature also allows it to scavenge excess soil water that may have escaped the roots of previous annual crops. Furthermore the dry subsoil generated at depth (i.e. below the rooting zone of crops) can persist for 2-3 years after the lucerne pasture is removed. This dry subsoil provides a ‘buffer’ to absorb some of the unutilised water that might otherwise leach down the soil profile during the cropping phase. Therefore, the use of lucerne to ‘dewater’ the soil profile over a 2-4 year pasture phase prior to cropping potentially offers a profitable way of slowing, or possibly even stopping, the development of dryland salinity. However, the drier soil profile also has the potential to improve crop production in wet years by delaying or preventing the onset of waterlogging.
Lucerne’s deep root system contributes to its high water use characteristics.
How much drier are the soil profiles after lucerne?
Several trials undertaken over a number of years at sites near Temora, Grogan and Morangarell have indicated that at the time of sowing the first crop after a lucerne pasture the soil profile can be 15-50mm drier in crop rooting zone (the top 1m) than in annual pasture-crop sequences or under continuous cropping rotations. The largest ‘dry soil buffers’ in these experiments were usually generated when lucerne was removed just a few months before cropping. Year to year differences in plant-available water after early (removed previous spring) vs late (in autumn prior to cropping) removed lucerne reflected partial recharge of the topsoil as the result of late summer or autumn rainfall. The extent of recharge was a characteristic of the particular pattern and amount of pre-growing season rainfall occurring in any one year. In some years much of the dewatering benefit in the top 1m might be lost by heavy rainfall in February-March.
Interestingly, while the soil profile immediately after lucerne might be drier than observed for other rotations, data collected from an experimental site near Temora suggests that residual lucerne root channels (below) can improve water infiltration into the subsoil to delay the onset of waterlogging. These root channels also provide preferential pathways for the roots of following crops and the overall water use by crops can be increased by up to 20-25mm (10mm average over 18 crops).
29 30
What impact does a dry soil profile have on cropping in a wet year?
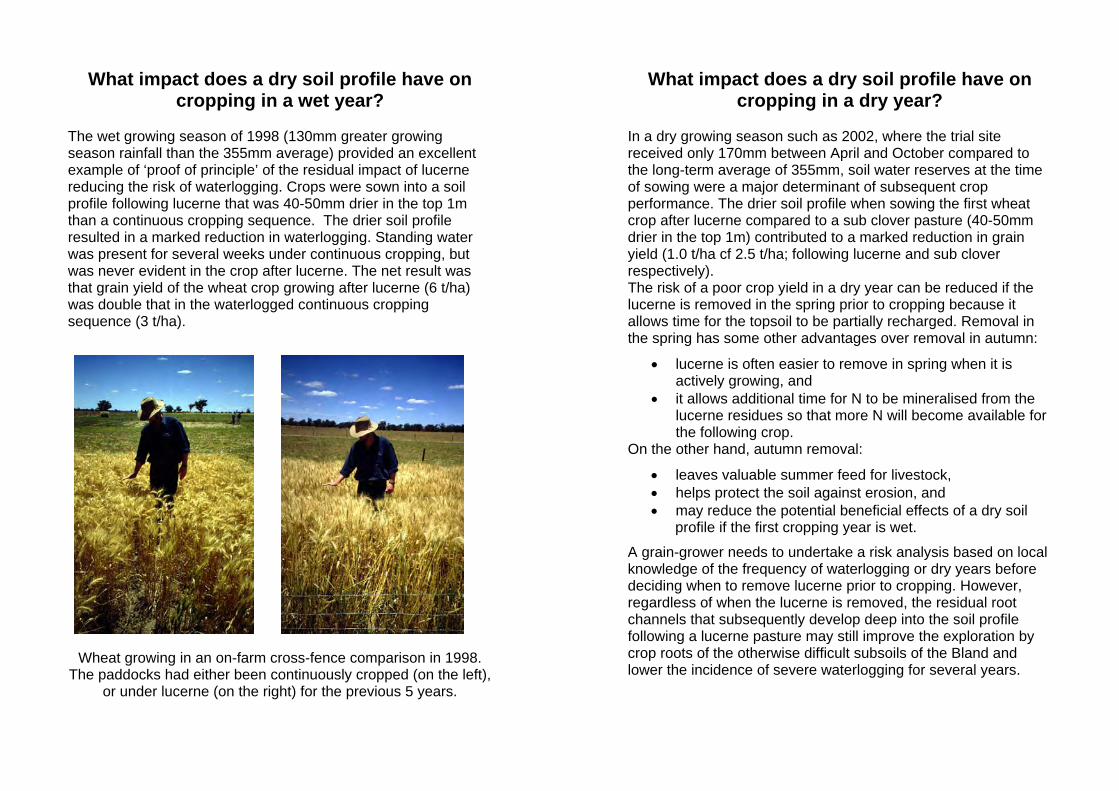
The wet growing season of 1998 (130mm greater growing season rainfall than the 355mm average) provided an excellent example of ‘proof of principle’ of the residual impact of lucerne reducing the risk of waterlogging. Crops were sown into a soil profile following lucerne that was 40-50mm drier in the top 1m than a continuous cropping sequence. The drier soil profile resulted in a marked reduction in waterlogging. Standing water was present for several weeks under continuous cropping, but was never evident in the crop after lucerne. The net result was that grain yield of the wheat crop growing after lucerne (6 t/ha) was double that in the waterlogged continuous cropping sequence (3 t/ha).
Wheat growing in an on-farm cross-fence comparison in 1998. The paddocks had either been continuously cropped (on the left),
or under lucerne (on the right) for the previous 5 years.
What impact does a dry soil profile have on cropping in a dry year?
In a dry growing season such as 2002, where the trial site received only 170mm between April and October compared to the long-term average of 355mm, soil water reserves at the time of sowing were a major determinant of subsequent crop performance. The drier soil profile when sowing the first wheat crop after lucerne compared to a sub clover pasture (40-50mm drier in the top 1m) contributed to a marked reduction in grain yield (1.0 t/ha cf 2.5 t/ha; following lucerne and sub clover respectively). The risk of a poor crop yield in a dry year can be reduced if the lucerne is removed in the spring prior to cropping because it allows time for the topsoil to be partially recharged. Removal in the spring has some other advantages over removal in autumn:
• lucerne is often easier to remove in spring when it is actively growing, and
• it allows additional time for N to be mineralised from the lucerne residues so that more N will become available for the following crop.
On the other hand, autumn removal:
• leaves valuable summer feed for livestock, • helps protect the soil against erosion, and • may reduce the potential beneficial effects of a dry soil
profile if the first cropping year is wet.
A grain-grower needs to undertake a risk analysis based on local knowledge of the frequency of waterlogging or dry years before deciding when to remove lucerne prior to cropping. However, regardless of when the lucerne is removed, the residual root channels that subsequently develop deep into the soil profile following a lucerne pasture may still improve the exploration by crop roots of the otherwise difficult subsoils of the Bland and lower the incidence of severe waterlogging for several years.
31 32
Effect of soil compaction and wheel tracks on crop growth Wheel tracks on a paddock cover up to 80% of a paddock in one year when cultivation, sowing, spraying and harvesting are taken into account. After several years of cropping most of a paddock is subject to compaction by wheel traffic.
An experimental area at Grogan was deep ripped to remove the hard pan and wheat and canola were then grown in a system that simulated controlled traffic.
The ripped soil was re-compacted by subsequent wheel traffic. This restricted canola and wheat root mass in the 0-5 cm layer 85 days after sowing to only 33% and 63%, respectively, of that measured in non-wheel track areas. In the case of wheat, this reduction in root growth was not reflected in poorer shoot growth or grain yield (Table 1).
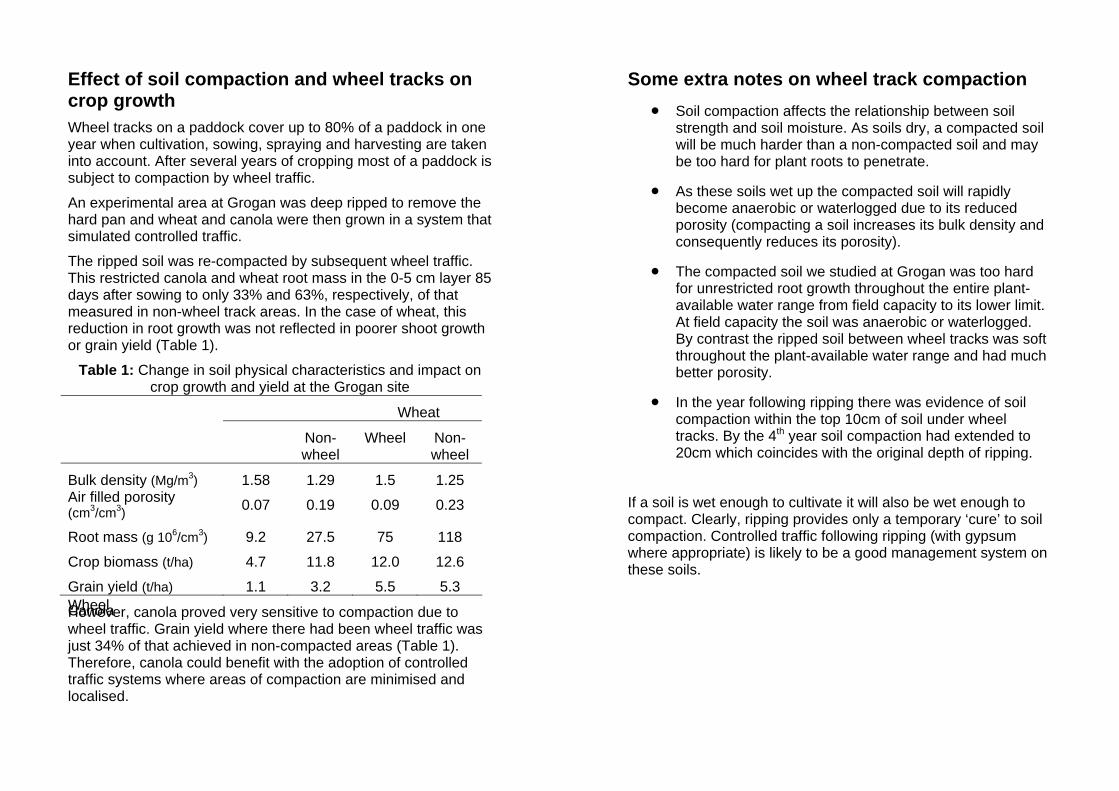
Table 1: Change in soil physical characteristics and impact on crop growth and yield at the Grogan site
Canola
Wheat
Wheel
Non- Wheel Non-wheel wheel
Bulk density (Mg/m3) 1.58 1.29 1.5 1.25 Air filled porosity 0.07 0.19 0.09 0.23(cm3/cm3)
Root mass (g 106/cm3) 9.2 27.5 75 118
Crop biomass (t/ha) 4.7 11.8 12.0 12.6
Grain yield (t/ha) 1.1 3.2 5.5 5.3
However, canola proved very sensitive to compaction due to wheel traffic. Grain yield where there had been wheel traffic was just 34% of that achieved in non-compacted areas (Table 1). Therefore, canola could benefit with the adoption of controlled traffic systems where areas of compaction are minimised and localised.
Some extra notes on wheel track compaction • Soil compaction affects the relationship between soil
strength and soil moisture. As soils dry, a compacted soil will be much harder than a non-compacted soil and may be too hard for plant roots to penetrate.
• As these soils wet up the compacted soil will rapidly become anaerobic or waterlogged due to its reduced porosity (compacting a soil increases its bulk density and consequently reduces its porosity).
• The compacted soil we studied at Grogan was too hard for unrestricted root growth throughout the entire plant-available water range from field capacity to its lower limit. At field capacity the soil was anaerobic or waterlogged. By contrast the ripped soil between wheel tracks was soft throughout the plant-available water range and had much better porosity.
• In the year following ripping there was evidence of soil compaction within the top 10cm of soil under wheel tracks. By the 4th year soil compaction had extended to 20cm which coincides with the original depth of ripping.
If a soil is wet enough to cultivate it will also be wet enough to compact. Clearly, ripping provides only a temporary ‘cure’ to soil compaction. Controlled traffic following ripping (with gypsum where appropriate) is likely to be a good management system on these soils.
33 34
Management options for reducing compaction The options often mentioned are :
• Controlled traffic
• Deep tillage
• Deep soil ameliorants Current experience suggests that deep tillage done properly can remove a subsoil compaction pan, but for subsoil constraints like sodicity and acidity, deep soil ameliorants have to be applied in conjunction with the deep tillage operation. Furthermore, re-compaction by machinery is likely after deep tillage so the effects tend to be short lived. Adoption of controlled traffic after deep tillage is a better long term solution.
On the other hand, limited yield benefits are likely if controlled traffic is adopted in situations where a subsoil compaction pan exists and has not been removed.
The options to overcome compaction are not mutually exclusive but should be used as a package after proper soil diagnosis.
A note on ripping If a cultivation pan is to be removed by ripping it is important to ensure that the soil is first dry enough to shatter and not smear. If a 3mm diameter rod can be rolled from the soil in the palm of your hand the soil is too wet. If the soil rod repeatedly fractures at diameters greater than 3mm the soil is drier than the lower plastic limit and is dry enough to rip.
Some field observations • After back-filling our soil pits a significant mound of soil
was left on top. This provides some insight into how compact these soils can be at depth.
• In 2000 the soils were quite moist at sowing. In moving from a plot with gypsum to one without gypsum deep wheel tracks were immediately formed. The tractor almost bogged. Gypsum significantly improved the trafficability of a sodic soil.
• In 2000 a period of wet weather during spring led to the surface ponding of water in plots without gypsum. This impacted severely on canola and lucerne plants. Applying gypsum minimised surface water-logging.
• In the year of establishment (1999) cultivated treatments without gypsum slumped and formed surface crusts. Gypsum treatments were visibly different and retained their friability.
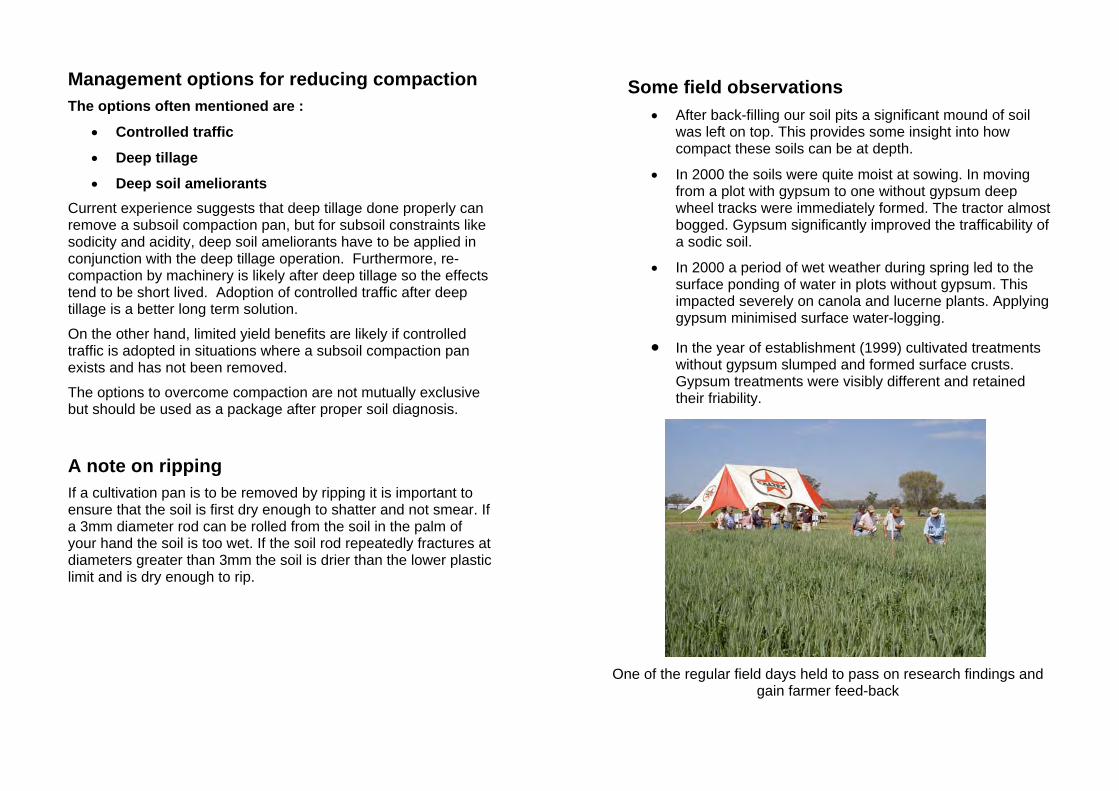
One of the regular field days held to pass on research findings and gain farmer feed-back
35 36
Changes in total and labile soil carbon with pastures and crops
The levels of organic matter in soils are usually decreased by cultivation and cropping and increased under pastures. Organic matter increases the aggregate stability of soils.
The change in carbon levels in the soil was measured at the Grogan and Morangarell site in 2001 after just 2 years of crop or pasture.
Labile carbon is the carbon fraction that is more active and more easily mineralised. Both total and labile carbon were higher under both annual legume pastures and lucerne compared to the cropped soil.
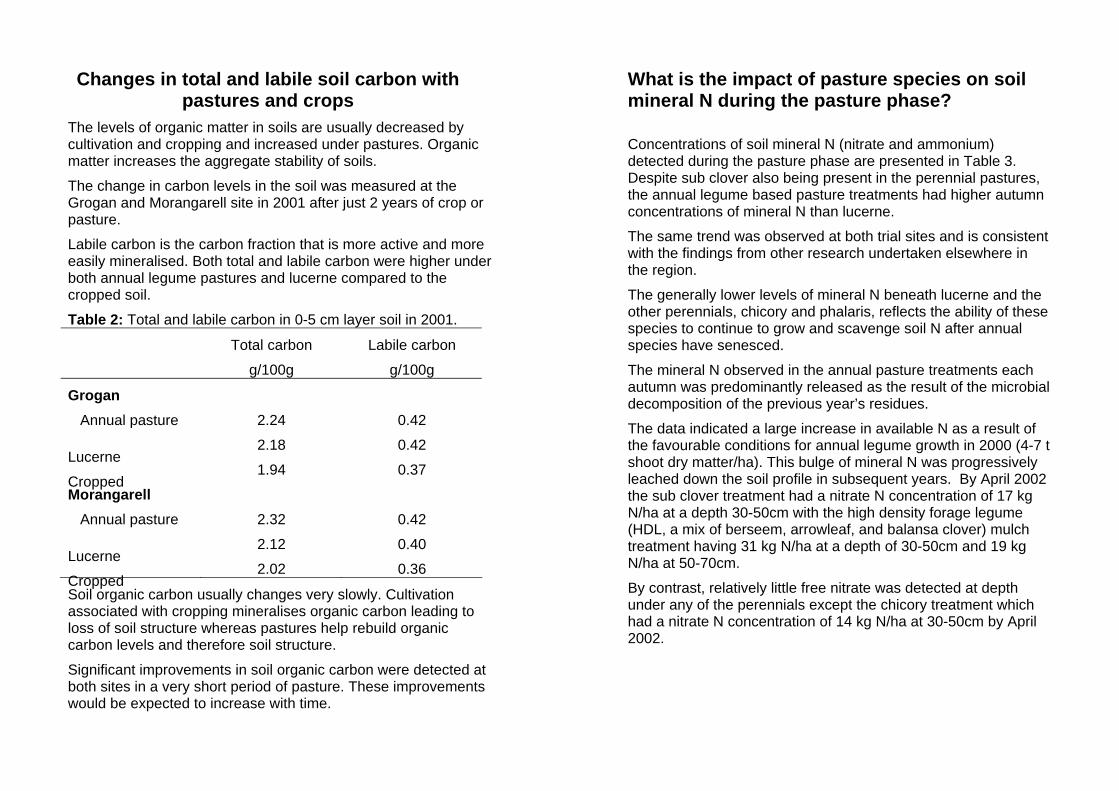
Table 2: Total and labile carbon in 0-5 cm layer soil in 2001.
Total carbon Labile carbon
Grogan Annual pasture
Lucerne
g/100g
2.24
2.18
g/100g
0.42
0.42
Cropped Morangarell Annual pasture
Lucerne
1.94
2.32
2.12
0.37
0.42
0.40
Cropped 2.02 0.36
Soil organic carbon usually changes very slowly. Cultivation associated with cropping mineralises organic carbon leading to loss of soil structure whereas pastures help rebuild organic carbon levels and therefore soil structure.
Significant improvements in soil organic carbon were detected at both sites in a very short period of pasture. These improvements would be expected to increase with time.
37
What is the impact of pasture species on soil mineral N during the pasture phase?
Concentrations of soil mineral N (nitrate and ammonium) detected during the pasture phase are presented in Table 3. Despite sub clover also being present in the perennial pastures, the annual legume based pasture treatments had higher autumn concentrations of mineral N than lucerne.
The same trend was observed at both trial sites and is consistent with the findings from other research undertaken elsewhere in the region.
The generally lower levels of mineral N beneath lucerne and the other perennials, chicory and phalaris, reflects the ability of these species to continue to grow and scavenge soil N after annual species have senesced.
The mineral N observed in the annual pasture treatments each autumn was predominantly released as the result of the microbial decomposition of the previous year’s residues.
The data indicated a large increase in available N as a result of the favourable conditions for annual legume growth in 2000 (4-7 t shoot dry matter/ha). This bulge of mineral N was progressively leached down the soil profile in subsequent years. By April 2002 the sub clover treatment had a nitrate N concentration of 17 kg N/ha at a depth 30-50cm with the high density forage legume (HDL, a mix of berseem, arrowleaf, and balansa clover) mulch treatment having 31 kg N/ha at a depth of 30-50cm and 19 kg N/ha at 50-70cm.
By contrast, relatively little free nitrate was detected at depth under any of the perennials except the chicory treatment which had a nitrate N concentration of 14 kg N/ha at 30-50cm by April 2002.
38
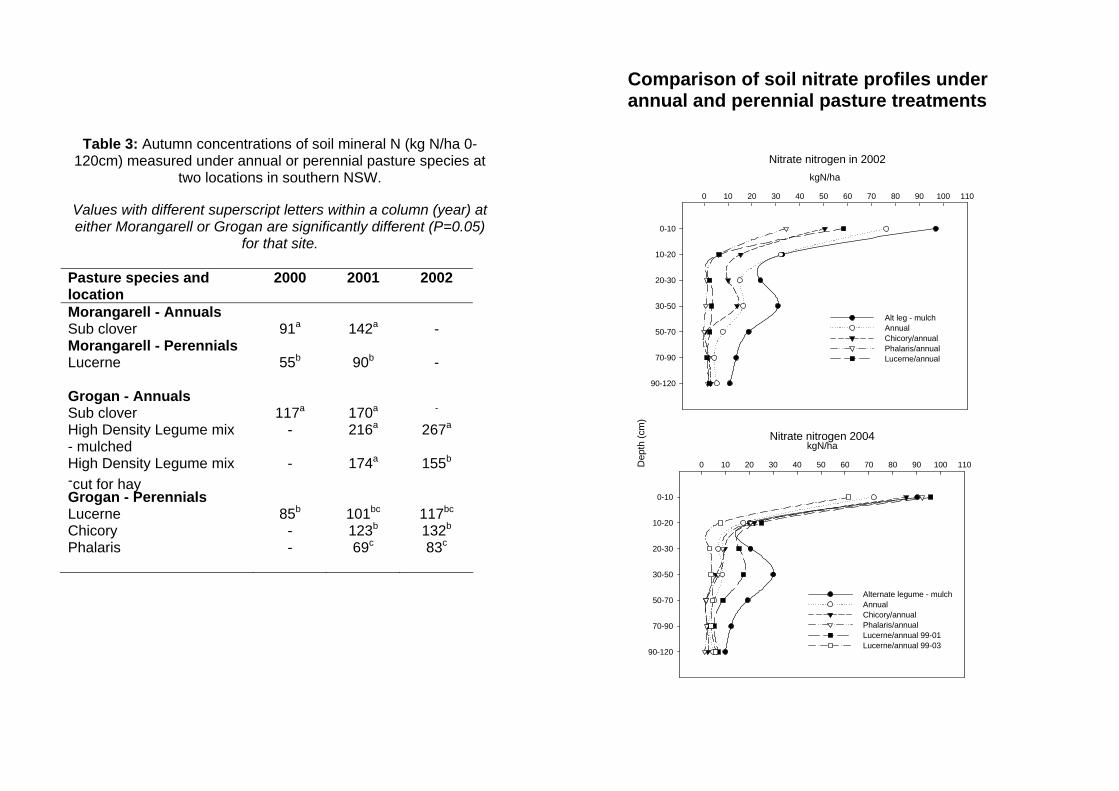
Table 3: Autumn concentrations of soil mineral N (kg N/ha 0-120cm) measured under annual or perennial pasture species at
two locations in southern NSW.
Values with different superscript letters within a column (year) at either Morangarell or Grogan are significantly different (P=0.05)
for that site.
Pasture species and 2000 2001 2002 location Morangarell - Annuals
91a Sub clover 142a -Morangarell - Perennials
55b 90b Lucerne -
Grogan - Annuals -Sub clover 117a 170a
High Density Legume mix - 216a 267a
- mulched High Density Legume mix - 174a 155b
-cut for hay Grogan - Perennials
85b 101bc Lucerne 117bc
Chicory - 123b 132b
69c 83c Phalaris -
Comparison of soil nitrate profiles under annual and perennial pasture treatments
Nitrate nitrogen in 2002
kgN/ha
0 10 20 30 40 50 60 70 80 90 100 110
0-10
10-20
20-30
30-50
50-70
70-90
90-120
Nitrate nitrogen 2004kgN/ha
Alt leg - mulch Annual Chicory/annual Phalaris/annual Lucerne/annual
Dep
th (c
m)
20-30
10-20
0 10 20 30 40 50 60 70 80 90 100 110
0-10
30-50
50-70
70-90
90-120
Alternate legume - mulch Annual Chicory/annual Phalaris/annual Lucerne/annual 99-01 Lucerne/annual 99-03
39 40
What is the impact of pasture species on soil mineral N during the cropping phase?
Areas of lucerne sown in 1999 were removed with herbicide to be cropped in 2002 at both Grogan (Experiment 1) and Morangarell (Experiment 2), and a further area of 1999 sown lucerne was removed for cropping at Grogan in 2004. The remaining lucerne, chicory, phalaris and HDL treatments sown at Grogan in 2000 (Experiment 3) were removed for cropping in 2003. Concentrations of mineral N measured in the soil profile (to 120cm) just prior to sowing wheat or canola between 2002 and 2004 are shown in Table 4.
Lower than average rainfall conditions that prevailed between 2002 and 2004 undoubtedly influenced the observations since:
(a) the release of available soil N from organic residues is a microbial process and the activity of soil microbes will be extremely low in dry soil,
(b) the dry conditions impacted on both the timing of herbicide application and the efficacy of herbicide action when attempting to remove the perennial species at the end of the pastures phase, and
(c) it was likely that much of the mineral N present in 2002 was poorly utilised by the drought affected crops and would have carried over into 2003.
However, despite these qualifications, a number of general conclusions can be drawn from the data: • Less than 60% of the total mineral N in the soil profile
following a pasture was present in the top 20cm of soil. Therefore, soil testing for nitrate in only the top 10cm is likely to under-estimate the amount of N available to crops.
• Levels of mineral N tended to be lowest where lucerne or phalaris had just been removed for cropping. Therefore, growers should ideally soil test and be prepared to fertilise the first crop after a perennial pasture to optimise crop nutrition.
• Interestingly, mineral N after chicory was higher than immediately following lucerne or phalaris and was similar to
the HDL hay cutting treatment in 2003. This presumably was because chicory was less competitive with subterranean clover than the other species and the chicory pasture generally contained a more vigorous clover component.
• Mineral N concentrations at Grogan were highest in both 2003 and 2004 following the HDL mulch treatment.
• Mineral N was relatively high in 2004 where lucerne had been removed for cropping either 1 year (lucerne 00-02 in Table 4, lucerne had grown between 2000 and 2002) or 2 years previously (lucerne 99-01). This suggested that while the release of N from lucerne might initially be slower than after annual legume-based pastures in the 1st year of cropping, mineralisation of N from lucerne residues is likely to continue further into the cropping phase.
• An increase in nitrate N was found after the lucerne 99-01 treatment in May 2003 and 2004 at a depth of 30-50cm (30 kg N/ha and 18 kg N/ha, respectively). This N could have been leached following lucerne removal or mineralised at depth from the lucerne roots.
• Nitrate concentrations under the HDL treatment were still high in 2004 (30 kg N/ha at 30-50cm, 19 kg N/ha at 50-70cm and 12 kg N/ha at 70-90cm), even though the treatment had been cropped in 2003.
Other research in the region indicates that the amount of mineral N released from lucerne at the end of a pasture phase will be influenced by the timing of its removal prior to cropping. The longer the period between killing a perennial pasture and cropping, the longer the time for N mineralisation of the organic residues to occur (and higher the concentration of mineral N expected at sowing). However, the amount of N mineralised will depend upon the total amount of rain that falls following pasture removal.
Table 4: Concentrations of soil mineral N (0-120cm) prior to sowing wheat and canola at Morangarell and Grogan.
42
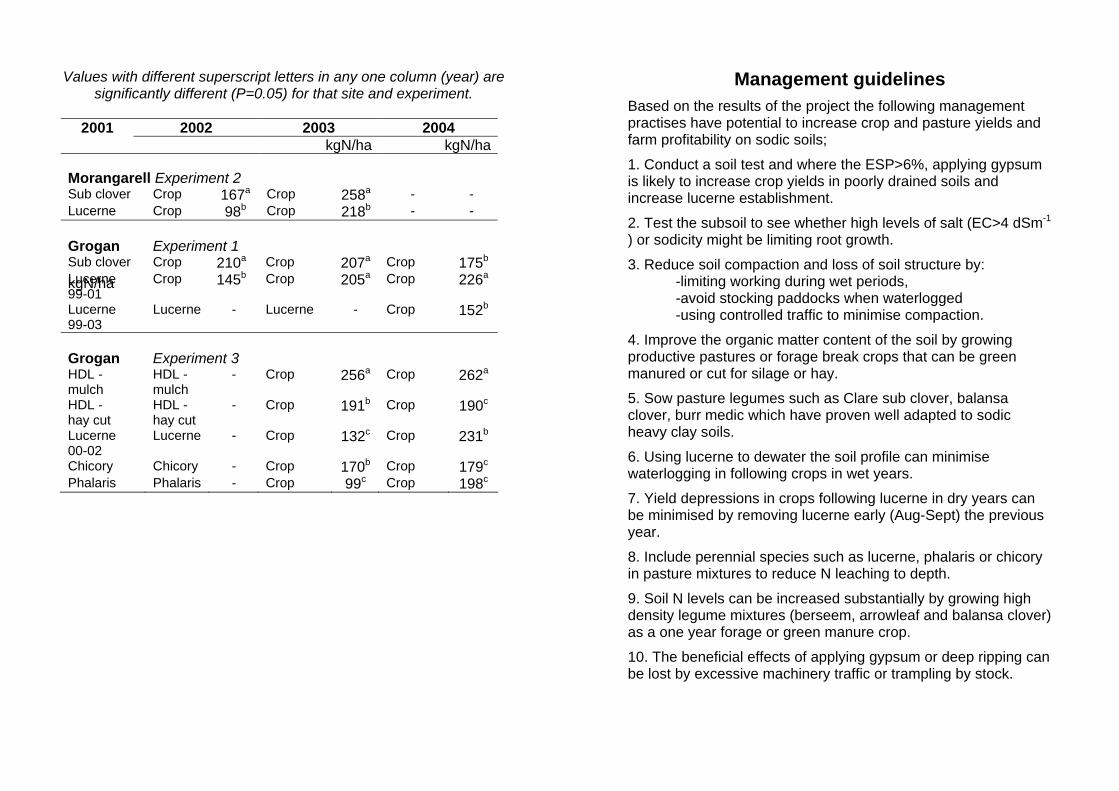
Values with different superscript letters in any one column (year) are significantly different (P=0.05) for that site and experiment.
2001 2002 2003 2004 kgN/ha kgN/ha
Morangarell Experiment 2 Sub clover Crop 167a Crop 258a - -Lucerne Crop 98b Crop 218b - -
Grogan Experiment 1 Sub clover Crop 210a Crop 207a Crop 175b
Lucerne Crop 145b Crop 205a Crop 226a kgN/ha 99-01 Lucerne Lucerne - Lucerne - Crop 152b
99-03
Grogan Experiment 3 HDL - HDL - - Crop 256a Crop 262a
mulch mulch HDL - HDL - - Crop 191b Crop 190c
hay cut hay cut Lucerne Lucerne - Crop 132c Crop 231b
00-02 Chicory Chicory - Crop 170b Crop 179c
Phalaris Phalaris - Crop 99c Crop 198c
Management guidelines Based on the results of the project the following management practises have potential to increase crop and pasture yields and farm profitability on sodic soils;
1. Conduct a soil test and where the ESP>6%, applying gypsum is likely to increase crop yields in poorly drained soils and increase lucerne establishment.
2. Test the subsoil to see whether high levels of salt (EC>4 dSm-1
) or sodicity might be limiting root growth.
3. Reduce soil compaction and loss of soil structure by: -limiting working during wet periods, -avoid stocking paddocks when waterlogged -using controlled traffic to minimise compaction.
4. Improve the organic matter content of the soil by growing productive pastures or forage break crops that can be green manured or cut for silage or hay.
5. Sow pasture legumes such as Clare sub clover, balansa clover, burr medic which have proven well adapted to sodic heavy clay soils.
6. Using lucerne to dewater the soil profile can minimise waterlogging in following crops in wet years.
7. Yield depressions in crops following lucerne in dry years can be minimised by removing lucerne early (Aug-Sept) the previous year.
8. Include perennial species such as lucerne, phalaris or chicory in pasture mixtures to reduce N leaching to depth.
9. Soil N levels can be increased substantially by growing high density legume mixtures (berseem, arrowleaf and balansa clover) as a one year forage or green manure crop.
10. The beneficial effects of applying gypsum or deep ripping can be lost by excessive machinery traffic or trampling by stock.
43 44
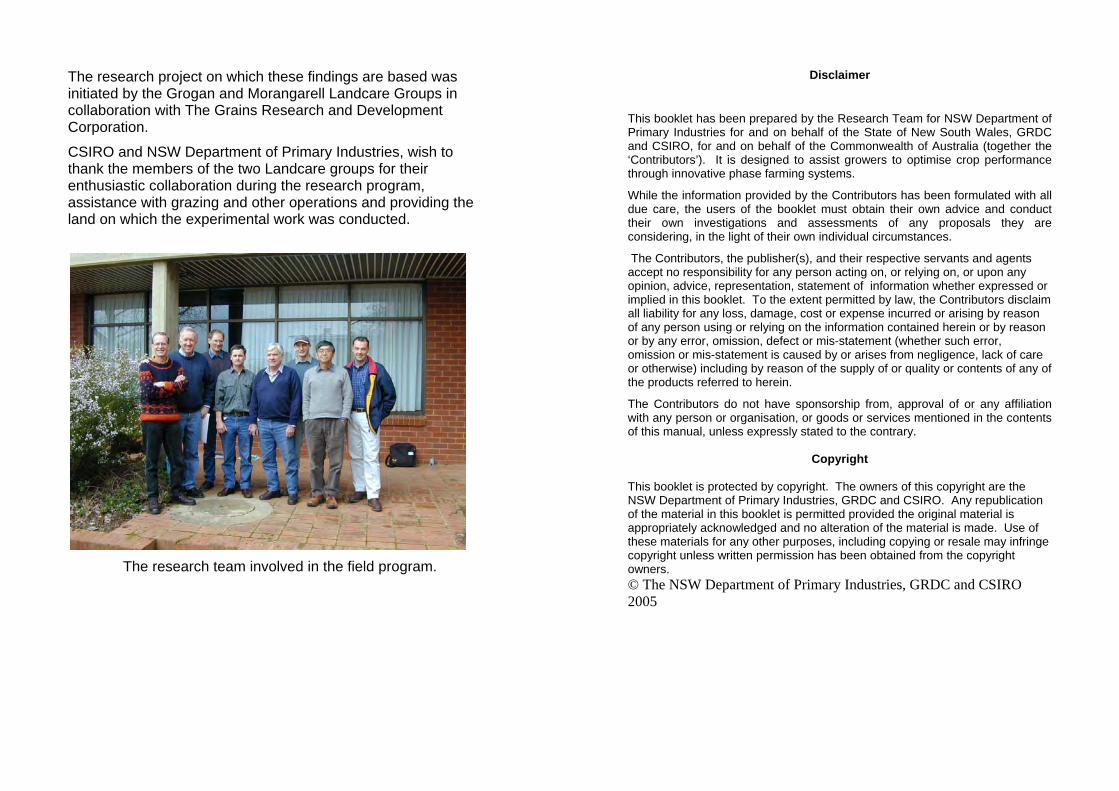
The research project on which these findings are based was initiated by the Grogan and Morangarell Landcare Groups in collaboration with The Grains Research and Development Corporation.
CSIRO and NSW Department of Primary Industries, wish to thank the members of the two Landcare groups for their enthusiastic collaboration during the research program, assistance with grazing and other operations and providing the land on which the experimental work was conducted.
The research team involved in the field program.
Disclaimer
This booklet has been prepared by the Research Team for NSW Department of Primary Industries for and on behalf of the State of New South Wales, GRDC and CSIRO, for and on behalf of the Commonwealth of Australia (together the ‘Contributors’). It is designed to assist growers to optimise crop performance through innovative phase farming systems.
While the information provided by the Contributors has been formulated with all due care, the users of the booklet must obtain their own advice and conduct their own investigations and assessments of any proposals they are considering, in the light of their own individual circumstances.
The Contributors, the publisher(s), and their respective servants and agents accept no responsibility for any person acting on, or relying on, or upon any opinion, advice, representation, statement of information whether expressed or implied in this booklet. To the extent permitted by law, the Contributors disclaim all liability for any loss, damage, cost or expense incurred or arising by reason of any person using or relying on the information contained herein or by reason or by any error, omission, defect or mis-statement (whether such error, omission or mis-statement is caused by or arises from negligence, lack of care or otherwise) including by reason of the supply of or quality or contents of any of the products referred to herein.
The Contributors do not have sponsorship from, approval of or any affiliation with any person or organisation, or goods or services mentioned in the contents of this manual, unless expressly stated to the contrary.
Copyright
This booklet is protected by copyright. The owners of this copyright are the NSW Department of Primary Industries, GRDC and CSIRO. Any republication of the material in this booklet is permitted provided the original material is appropriately acknowledged and no alteration of the material is made. Use of these materials for any other purposes, including copying or resale may infringe copyright unless written permission has been obtained from the copyright owners. © The NSW Department of Primary Industries, GRDC and CSIRO 2005
45 46