managing environmentalsustainability · food manufacturing waste water solid wastes greenhouse...
TRANSCRIPT
Managing Environmental Sustainabilityin the European Food & Drink Industries
ISSUES, INDUSTRY ACTION AND FUTURE STRATEGIES
Contents
Message from the CIAA President . . . . . . . . . . . . . . . . . . . . . . . . . . . . . . . . p.3
The life-cycle of food and drink products . . . . . . . . . . . . . . . . . . . . p.4
Introduction: Overall perspective . . . . . . . . . . . . . . . . . . . . . . . . . . . . . . . . . . p.6
■ Shared responsibility across and beyond the food chain
■ Key areas for current and future action
■ Reaching out to stakeholders
Setting the scene: Environmental sustainability across the food chain . . . . . . . . . . . . . . . . . . . . . . . . . . . . . . . . . . . . . . . . . . . . . . . . . . . . . . . p.8
1 Our raw materials . . . . . . . . . . . . . . . . . . . . . . . . . . . . . . . . . . . . . . . . . . . . . . . . . . . . . . . . . p.10
■ Sustainability at the start of the food chain
2 Resource efficiency & waste management . . . . . . . . . . . . p.16
■ Making the most of our raw materials
■ Re-use, recycling and recovery
3 Energy and climate change . . . . . . . . . . . . . . . . . . . . . . . . . . . . . . . . . . . . . . . p.24
■ Improving energy efficiency - cutting emissions
4 Water . . . . . . . . . . . . . . . . . . . . . . . . . . . . . . . . . . . . . . . . . . . . . . . . . . . . . . . . . . . . . . . . . . . . . . . . . . . . . . p.34
■ Conserving the source of life
5 Packaging . . . . . . . . . . . . . . . . . . . . . . . . . . . . . . . . . . . . . . . . . . . . . . . . . . . . . . . . . . . . . . . . . . . . . . p.40
■ Protecting what's inside
6 Transport & distribution . . . . . . . . . . . . . . . . . . . . . . . . . . . . . . . . . . . . . . . . . . . . . . p.48
■ Moving to sustainable connections
7 Consumers . . . . . . . . . . . . . . . . . . . . . . . . . . . . . . . . . . . . . . . . . . . . . . . . . . . . . . . . . . . . . . . . . . . . p.54
■ Their role in environmental sustainability
Conclusion . . . . . . . . . . . . . . . . . . . . . . . . . . . . . . . . . . . . . . . . . . . . . . . . . . . . . . . . . . . . . . . . . . . . . . . . p.58
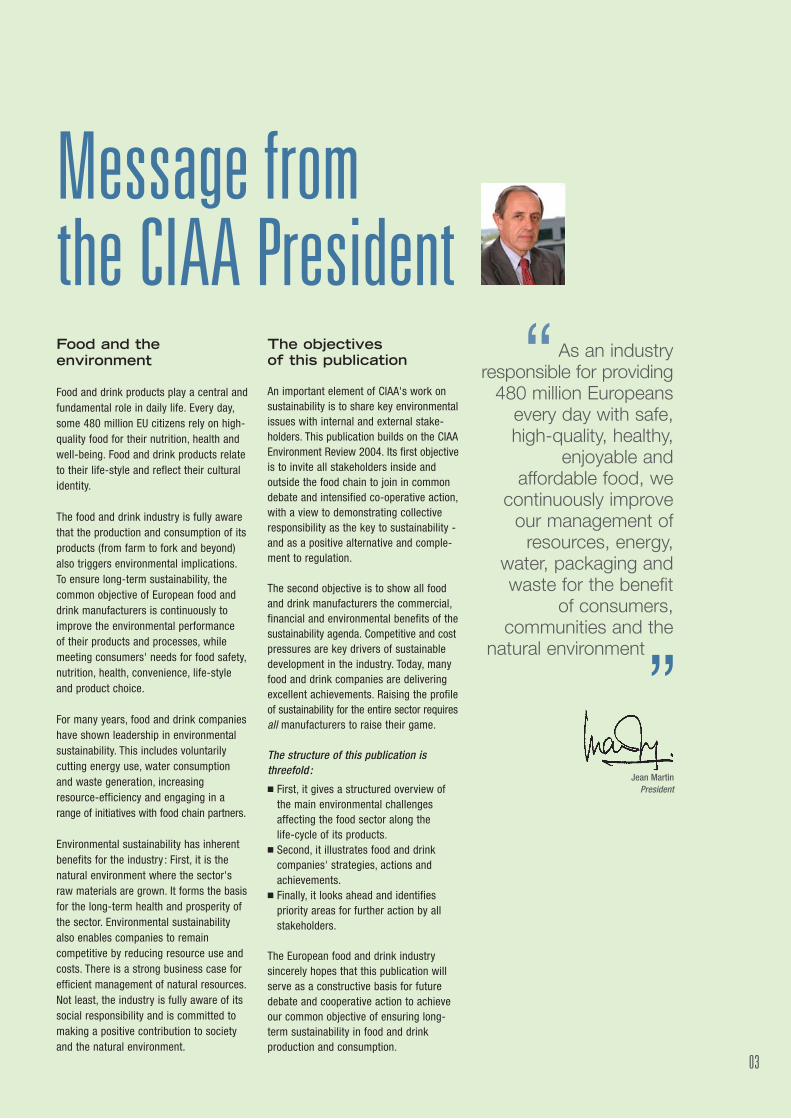
Message from the CIAA President
As an industry responsible for providing
480 million Europeansevery day with safe,high-quality, healthy,
enjoyable and affordable food, we
continuously improveour management of
resources, energy,water, packaging andwaste for the benefit
of consumers, communities and the
natural environment
“Food and the environment
Food and drink products play a central andfundamental role in daily life. Every day,some 480 million EU citizens rely on high-quality food for their nutrition, health andwell-being. Food and drink products relateto their life-style and reflect their culturalidentity.
The food and drink industry is fully awarethat the production and consumption of itsproducts (from farm to fork and beyond)also triggers environmental implications.To ensure long-term sustainability, thecommon objective of European food anddrink manufacturers is continuously toimprove the environmental performance of their products and processes, while meeting consumers' needs for food safety,nutrition, health, convenience, life-styleand product choice.
For many years, food and drink companieshave shown leadership in environmentalsustainability. This includes voluntarily cutting energy use, water consumptionand waste generation, increasingresource-efficiency and engaging in arange of initiatives with food chain partners.
Environmental sustainability has inherentbenefits for the industry : First, it is the natural environment where the sector'sraw materials are grown. It forms the basisfor the long-term health and prosperity ofthe sector. Environmental sustainabilityalso enables companies to remain competitive by reducing resource use andcosts. There is a strong business case forefficient management of natural resources.Not least, the industry is fully aware of itssocial responsibility and is committed tomaking a positive contribution to societyand the natural environment.
The objectives of this publication
An important element of CIAA's work onsustainability is to share key environmentalissues with internal and external stake-holders. This publication builds on the CIAAEnvironment Review 2004. Its first objectiveis to invite all stakeholders inside and outside the food chain to join in commondebate and intensified co-operative action,with a view to demonstrating collectiveresponsibility as the key to sustainability -and as a positive alternative and comple-ment to regulation.
The second objective is to show all foodand drink manufacturers the commercial,financial and environmental benefits of thesustainability agenda. Competitive and costpressures are key drivers of sustainabledevelopment in the industry. Today, manyfood and drink companies are deliveringexcellent achievements. Raising the profileof sustainability for the entire sector requiresall manufacturers to raise their game.
The structure of this publication is threefold :
■ First, it gives a structured overview ofthe main environmental challengesaffecting the food sector along the life-cycle of its products.
■ Second, it illustrates food and drinkcompanies' strategies, actions andachievements.
■ Finally, it looks ahead and identifies priority areas for further action by allstakeholders.
The European food and drink industry sincerely hopes that this publication willserve as a constructive basis for futuredebate and cooperative action to achieveour common objective of ensuring long-term sustainability in food and drink production and consumption.
03
Jean MartinPresident
”

WaterEnergy
PreservativesAdditives
RefrigerantsPackaging materials
Food manufacturing
Waste waterSolid wastes
Greenhouse gasesAir emissions
Resources &Waste
Energy & Climate
Water Packaging
SoilWater
Animal feedAgro-chemicals
PesticidesHerbicides
Energy
Agriculture
Soil lossPolluted runoff
Greenhouse gasesWastewater
Organic wastesHabitat loss
Eutrophication
The life-cycle of food and drink products
04
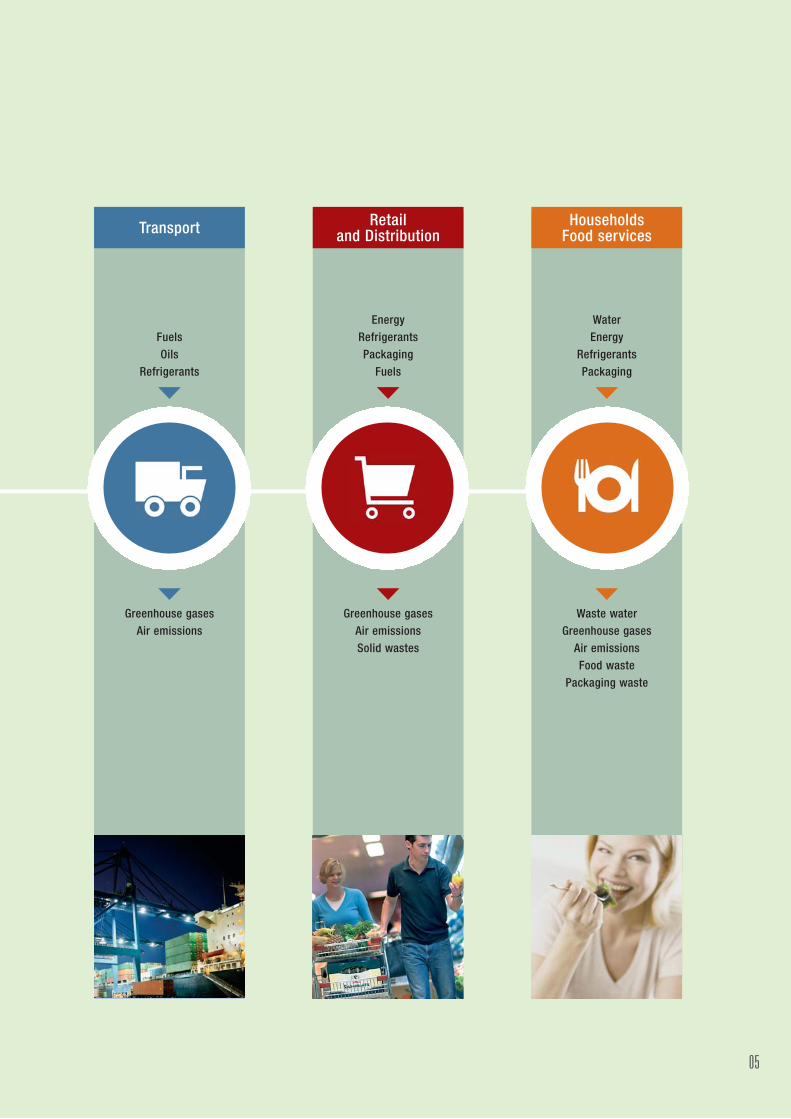
FuelsOils
Refrigerants
Transport
Greenhouse gasesAir emissions
EnergyRefrigerantsPackaging
Fuels
Retail and Distribution
Greenhouse gasesAir emissionsSolid wastes
WaterEnergy
RefrigerantsPackaging
Households Food services
Waste waterGreenhouse gases
Air emissionsFood waste
Packaging waste
05

Introductionoverall perspective
1. Shared responsibilityacross and beyond thefood chain
The food chain comprises many differentstages and players, including farmers,industry, suppliers, transport, retailers,consumers and waste managers, all ofwhom generate different environmentalimpacts. A meaningful strategy towardssustainable production and consumption inthe food chain requires integrated involve-ment of all life-cycle stages and players.Every player in the chain has a crucial roleto play, individually but also as a teamplayer.
The food industry's direct sphere of influence is in purchasing agricultural rawmaterials and processing them into highquality food and drink products. Therefore,the main focus of this communication ison the manufacturing stage, coveringenergy use and greenhouse gas emis-sions, resource and waste management,water and waste water management, aswell as packaging.
However, important environmental impactsoccur upstream and downstream of theprocessing stage, where a range of otherplayers have their own distinct spheres ofinfluence and responsibility. The relation-ships between these players are complex.For instance, the food and drink industry isnot directly involved in farming. However,it purchases about 70% of EU agriculturalproduce. Cooperation between farmers,industry and others is vital to ensure sus-tainable development in the production ofraw materials for the entire food chain.The same applies to others in the chain,including transport, retailers and con-sumers. They all take their own decisionswhich influence the food chain's overallperformance, but they operate outside thedirect control of food companies.
multi-faceted measures that affect all con-tributors. Some are taken by individualplayers, others involve cooperationbetween several players or indeed theentire food chain. Some are production-related, others consumer-related.Some foster short and mid-term objectives,others require long-term strategies.
Sustainable Production :Innovating processes andproducts
Spreading best practice
In numerous cases, short and mid-term objectives can be successfully fostered viathe proliferation of existing best practiceand technology at all stages of the foodchain. In food manufacturing, particularattention has to be paid to reaching SMEs(small and medium enterprises), whichaccount for 99% of all food and drinkcompanies in the EU (totalling 279,000).Trade associations are playing an activerole in supporting, sharing and encouragingthe spread of best practice, but it is oftenmore difficult for them to reach SMEs.It is crucial that national and local authoritiesand agencies target their support programmes and incentives to help SMEsto overcome barriers in terms of financialand human resources.
R&D and innovation
Innovation plays a crucial role in ensuringlong-term sustainability. Technologicaldevelopment can be expected to deliversignificant further improvements in areassuch as energy use, greenhouse gasesand resource efficiency. Meeting long-termsustainability targets will require furtherfocus on R&D and investment andincreased cooperation among all stake-holders. R&D efforts should be coordinatedand prioritised, and the results made available across all sectors. The industry is
Environmental sustainability in the food
chain requires integrated involvementof all life-cycle stages
and players. Every player in thechain has a crucial
role to play, individuallybut also as a
team player
”
“
Sustainability in the food chain thereforerequires shared responsibility among allthose involved along the life-cycle. To startwith, each player has continuously toimprove the environmental performance inhis direct sphere of influence. In addition,individual players can help and stimulateother food chain partners to improve theirperformance affecting the entire foodchain. Consequently, this publication alsoshows the food and drink industry's on-going activities in areas upstream anddownstream of the manufacturing stage.
2. Key areas for current and futureaction
Continuous improvementthrough cooperative action
There is no such thing as a single, exclusivetool to ensure sustainability in the foodchain. The high heterogeneity of food anddrink products and processes, the widerange of environmental implications, andthe diversity of players in the food chain,requires a broad range of continuous and
06
committed to work closely with authoritiesand researchers to align R&D with busi-ness needs and to implement the resultsof beneficial R&D. Particular attentionmust be paid to improving the commercial competitiveness of emergingtechnologies.
Sustainable Consumption :Reducing impacts throughenvironmental education
Consumers' own impacts
Consumers generate significant directenvironmental impacts through the waythey transport, store and prepare food, aswell as the amount of waste they generate,and how they dispose of it. Intensifiedenvironmental education will be vital to raise consumer awareness of the sustainability impacts of their behaviourand decisions.
Consumer information
Consumers also indirectly influenceimpacts upstream in the supply chainthrough their purchasing decisions.Reliable environmental information is animportant tool to enable consumers tomake informed choices and to follow their individual preferences. With this in mind,the food and drink industry is engaged in a number of concrete initiatives to evaluate the feasibility of a uniform andmeaningful environmental assessmentmethodology for food and drink products,to evaluate related costs and benefits andto explore suitable communication tools.
Improving the knowledge-base
Countless food and drink companies are monitoring their own environmental performance as part of their internalimprovement process, and communicate
their performance to the outside world aspart of their corporate social responsibilitycommitment.
The most complete environmental data isavailable from large food and drink companies, which account for about 50%of the sector's turnover in the EU.Due to the extremely high number of SMEsin the sector and their exceptionally widevariety of products and processes, themeasurement and monitoring of theirresource consumption and environmentalimpacts has proved to be particularly difficult, especially at an aggregate, EU-27level. On the basis of available sector,national and company data sources, thefood and drink industry is making significantefforts to consolidate environmental dataand monitor trends, identify priorities,and develop and implement relevant sustainability strategies.
Combined efforts by industry, publicauthorities, environmental agencies andthe European research community haveconsiderable potential to further improve theknowledge-base in areas where relevantdata is still incomplete or insufficientlyrobust. Establishing a reliable knowledge-base not only supports industry in furtherrefining its own sustainability strategies, itis also vital for ensuring science-basedpolicy-making and better regulation.
3. Reaching out tostakeholders
This publication illustrates that the foodand drink industry has made a significantcontribution to environmental sustainability.The industry is justifiably proud of itsefforts. That said, there is absolutely noroom for complacency. There is still muchto do. Long-term sustainability along thefood chain requires continuous improvement
and innovation across the entire sectorbased on the responsibility and coopera-tion of all food chain players.
The food and drink industry is firmly committed to continue and further intensifyits cooperation with all business partners,public authorities and other stakeholders.For this purpose, this publication not onlyaddresses existing challenges and industryaction, but also highlights areas for closerfuture cooperation by all players.However, the identified issues are notexclusive and should serve as the basis for extensive future debate. They shouldencourage all stakeholders inside and outside the food chain to contribute theirviews, strategies and expectations.
The CIAA welcomes comment and debateand is ready and willing to have meaning-ful dialogue with all those who respond tothe issues outlined in this publication.The industry looks forward to even greatercooperation to help build momentum andmake an even bigger contribution to envi-ronmental sustainability.
The dissemination ofexisting best practiceand technology at all
stages of the foodchain as well as tech-
nological developmentcan be expected to
deliver significant further environmental
improvements in areassuch as energy use,greenhouse gases,water and resource
efficiency
“
07
”

Our raw materials ■ Farming systems are the start-
point of the food chain. The EUfood and drink industry purchas-es about 70% of EU agriculturalproduce. It is therefore crucialfor the long-term health andprosperity of the industry thatfarming systems are sustainable.
■ While agriculture accounts for anotable part of the environmentalimpacts of the food chain,including impacts on water, air,climate and bio-diversity, farmingsystems - if managed sustain-ably - can also benefit the envi-ronment in many ways.
■ The food and drink industry,although not directly involved infarming activities, is engaged ina series of concrete initiatives tosupport sustainable agriculture inthe EU and globally. The industrypromotes a holistic approach tosustainable agriculture aimed atsecuring safe food supplies, bothin quality and quantity, protectingthe natural environment andimproving the socio-economicconditions of local communities.
Resource efficiency and waste management■ Raw materials used in the food and drink industry are of agricultural origin.
Food and drink manufacturers are increasingly acting as bio-refineries, in which agricul-tural raw materials are separated into a long series of products, comprising not onlyfood but also feed, fertilisers, cosmetics, bio-fuels and others.
■ Full raw material utilisation in the food sector increases resource-efficiency and productivity, reduces bio-degradable waste and supports the transition to a bio-basedeconomy (use of renewable resources).
■ For remaining waste, manufacturers implement recycling and recovery to reclaim theresources embedded in waste and to minimise waste going to final disposal.
Setting the scene Environmental sustainability across the food chain
Energy and climate change ■ The food and drink industry accounts for about 1.5% of total greenhouse gas (GHG)
emissions in the EU-15. Direct GHG emissions fell by 3% from 2004 to 2005 and CO2-intensity relative to economic growth has fallen by 25% since 1990.
■ Within the food chain, agriculture accounts for 49% of GHG emissions, followed byconsumers with 18% and manufacturing with 11%.
■ Countless food and drink companies are showing genuine leadership in energy andcarbon management. This includes voluntarily cutting energy use, fuel switching,investing in energy efficient and low carbon technologies, participating in national orsector energy efficiency schemes, detailed energy audits and feasibility studies.
Water ■ Access to fresh water is critical for the food and drink industry, both in terms of
quantity and quality. Clean water is not only a pre-requisite for agricultural sustainability,it is also an important product, a main ingredient and key processing element.
■ The challenge for the industry is two-fold: First, continuously reduce water consumption in its own processes by improving water efficiency without compromising strict EU food hygiene requirements.
■ Second, promote the responsible use of water and maintain sustainable water supplies throughout the food chain, including agriculture.
Packaging■ As a major user of packaging, the food and drink industry fully recognises its
responsibility to reduce the environmental impact of packaging along the life-cycle.
■ At the same time, packaging is essential to ensure food safety and product quality.By avoiding food waste, packaging also protects the environment.
■ Packaging recycling and recovery is highly successful in the EU. The amount of packaging waste sent for disposal fell by more than 20% between 1997 and 2004.
■ Sociological trends and changes in life-styles are driving significant changes in thedemand for packaged goods. The key challenge lies in the reduction of packagingmaterial, without compromising food integrity, quality and safety, and in ensuringsound recycling and recovery of packaging waste.
08
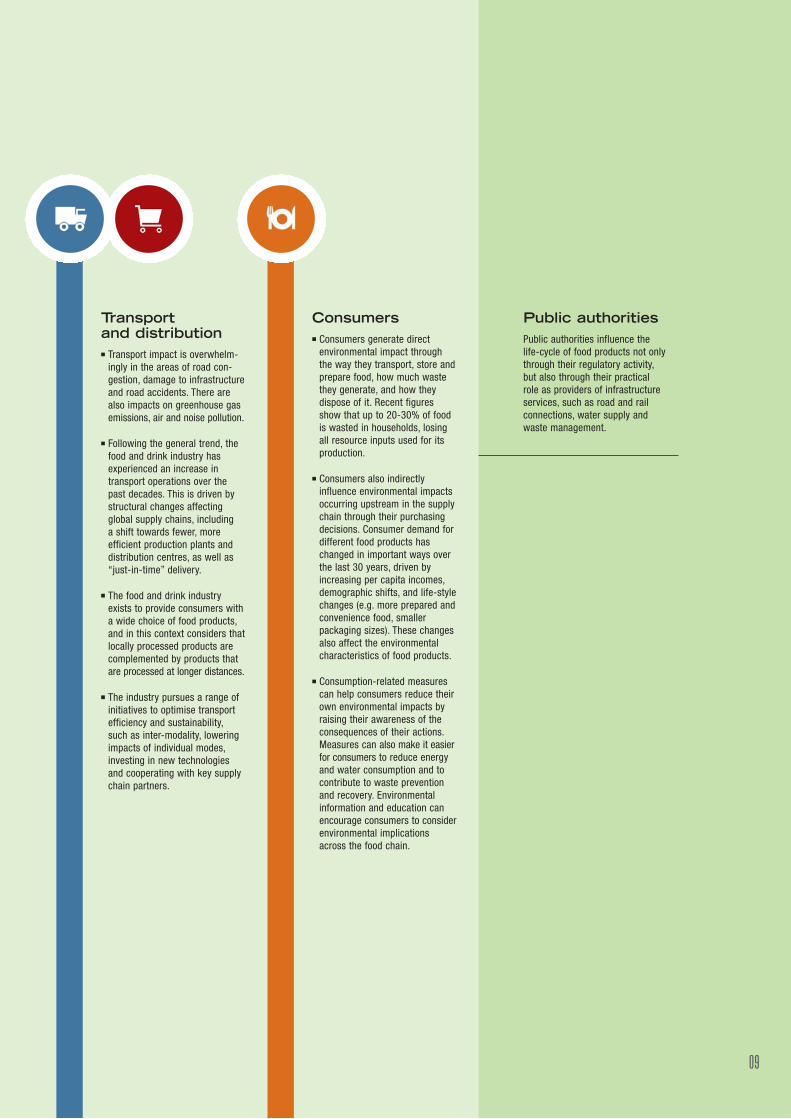
Transport and distribution ■ Transport impact is overwhelm-
ingly in the areas of road con-gestion, damage to infrastructureand road accidents. There arealso impacts on greenhouse gasemissions, air and noise pollution.
■ Following the general trend, thefood and drink industry hasexperienced an increase intransport operations over thepast decades. This is driven bystructural changes affectingglobal supply chains, including a shift towards fewer, more efficient production plants anddistribution centres, as well as“just-in-time” delivery.
■ The food and drink industryexists to provide consumers witha wide choice of food products,and in this context considers thatlocally processed products arecomplemented by products thatare processed at longer distances.
■ The industry pursues a range ofinitiatives to optimise transportefficiency and sustainability,such as inter-modality, loweringimpacts of individual modes,investing in new technologiesand cooperating with key supplychain partners.
Consumers ■ Consumers generate direct
environmental impact throughthe way they transport, store andprepare food, how much wastethey generate, and how they dispose of it. Recent figuresshow that up to 20-30% of foodis wasted in households, losingall resource inputs used for itsproduction.
■ Consumers also indirectly influence environmental impactsoccurring upstream in the supplychain through their purchasingdecisions. Consumer demand fordifferent food products haschanged in important ways overthe last 30 years, driven byincreasing per capita incomes,demographic shifts, and life-stylechanges (e.g. more prepared andconvenience food, smaller packaging sizes). These changesalso affect the environmentalcharacteristics of food products.
■ Consumption-related measurescan help consumers reduce theirown environmental impacts byraising their awareness of theconsequences of their actions.Measures can also make it easierfor consumers to reduce energyand water consumption and tocontribute to waste preventionand recovery. Environmentalinformation and education canencourage consumers to considerenvironmental implicationsacross the food chain.
Public authoritiesPublic authorities influence thelife-cycle of food products not onlythrough their regulatory activity,but also through their practicalrole as providers of infrastructureservices, such as road and railconnections, water supply andwaste management.
09
> > > >
Our raw materialsSustainability at the start of the food chain
1
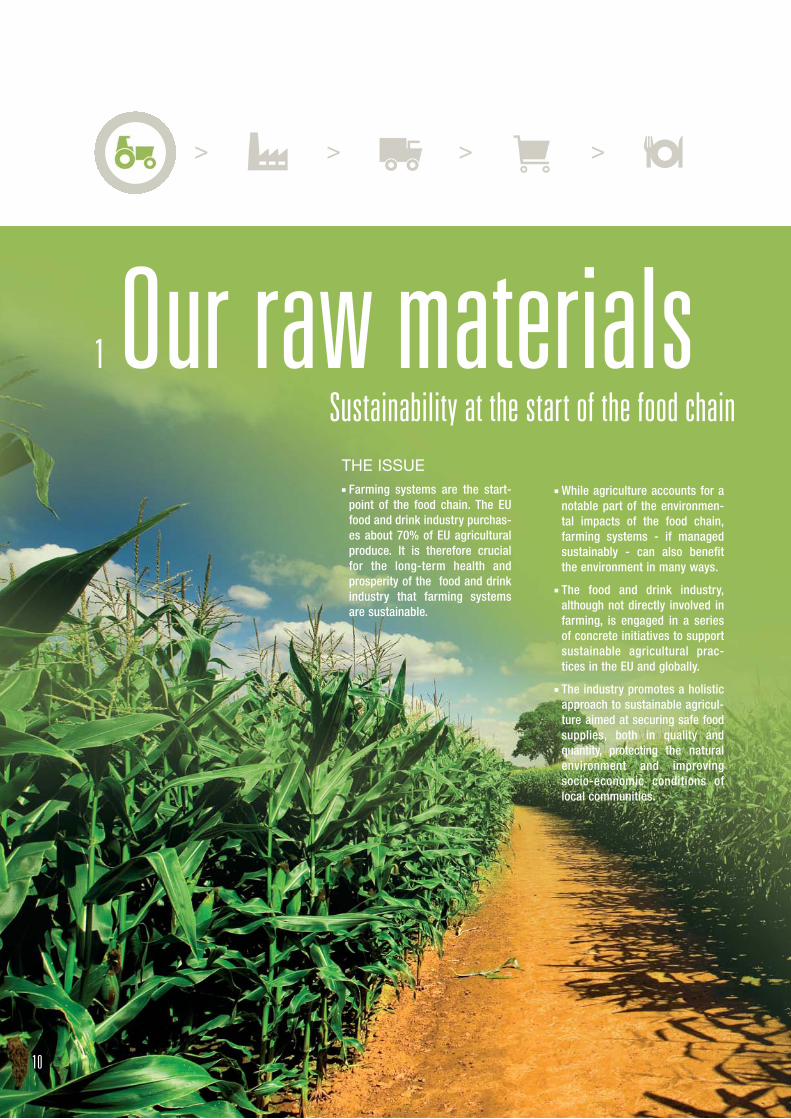
THE ISSUE■ Farming systems are the start-
point of the food chain. The EUfood and drink industry purchas-es about 70% of EU agriculturalproduce. It is therefore crucialfor the long-term health andprosperity of the food and drinkindustry that farming systemsare sustainable.
10
■ While agriculture accounts for anotable part of the environmen-tal impacts of the food chain,farming systems - if managedsustainably - can also benefitthe environment in many ways.
■ The food and drink industry,although not directly involved infarming, is engaged in a seriesof concrete initiatives to supportsustainable agricultural prac-tices in the EU and globally.
■ The industry promotes a holisticapproach to sustainable agricul-ture aimed at securing safe foodsupplies, both in quality andquantity, protecting the naturalenvironment and improvingsocio-economic conditions oflocal communities.

Farming systems arethe start point of thefood chain. Whereas
the food and drinkindustry is not directly
involved in farmingactivities, it purchases
about 70% of EU agricultural produce.
For the long-termhealth and prosperity
of the industry, it istherefore crucial that agricultural
production systems are sustainable
“
”
The challengeThe natural environment is where rawmaterials for the food and drink manufac-turing sector are grown. About 70% of EUagricultural produce is purchased by the EUfood and drink industry. For the long-termhealth and prosperity of the industry, it iscrucial that agricultural production systemsare sustainable.
Agriculture accounts for a notable part ofthe environmental impact along the foodchain, including impacts on water, air quality,climate, soil and bio-diversity. Agriculture isthe dominant user of fresh water worldwide,accounting for 70% of global and 37% ofEU water consumption. It contributes 9% oftotal EU-15 GHG emissions and about 50% of GHG emissions in the food chain.World population is expected to grow from6.7 billion in 2007 to 9.2 billion in 2050 (a rise of 37%) which will put additionalpressure on land use and the amount ofarable land per person.
On the other hand, farming systems, ifmanaged sustainably, can benefit the environment in many ways, e.g. throughcontribution to water accumulation andflood control, nutrient recycling and fixation,soil formation, carbon sequestration bytrees and soil, wildlife and bio-diversityprotection; and even the provision of recreational services and adding otherforms of aesthetic value.
The CAP reform andbeyond
In this context, different farming systems(e.g. conventional, integrated, organic, mixedand crop-specific systems, and others)complement one another as long as theycontribute to sustainability. The reform ofthe EU Common Agricultural Policy has putincreased emphasis on sustainability inconventional agricultural production. Focuson less intensive production methods and
the introduction of cross-compliance areamong the corner-stones of this newapproach, which makes it mandatory torespect statutory management requirementsand good agricultural and environmentalconditions. A wide range of other systemsbuild on this framework, and incorporateelements going beyond regulation.Integrated farming, for instance, aims toensure sustainability by combining beneficialnatural processes with modern technologyin order to balance food production,profitability, safety, animal welfare, environ-mental protection and social responsibility.Organic farming is centred on a number ofenvironmental criteria, which are specifiedin EU legislation, and accounts for 4% ofthe total utilised agricultural area in the EU.Many other systems address agriculturalsustainability on a crop-specific basis.In some cases, agricultural systems thatexceed the requirements of regulation, usequality assurance schemes to communicatetheir compliance with defined criteria.
11
The three elements of sustainable farming
Environmental dimension
Preserving natural resources, protecting and,wherever possible, improving eco-systemsare corner-stones of all sustainable farmingsystems.
■ Responsible cultivation practices contributeto preserving soil fertility and to preventingsoil erosion, pollution, salinisation and lossof arable land and bio-diversity.
■ Responsible and limited use of water helpsto conserve water quantity and quality.
■ Energy-efficiency and the reduction ofgreenhouse gases and other emissions are crucial for reducing air pollution andmitigating global warming.
■ Animal welfare must be ensured along thefood chain.
■ Waste must be prevented wherever possible and - where this is not feasible -be re-used, recycled or recovered accordingto local conditions.
Social dimension
Sustainable agriculture requires essentialsocial aspects to be taken into account.National, EU and international regulations mustbe respected. Working and living conditionsfor farmers, farm-dependent employees andtheir families, as well as opportunities fordeveloping their skills and capabilities, shouldbe improved over time. Freedom of associa-tion has to be respected.
Economic dimension
To enable viable livelihoods to be made fromfarming activity, sustainable agricultural production should be market-driven andrespond to consumer demand.
In summary, the on-going challenge for aneffective system of sustainable agriculturerequires the application of a broad set ofgood farming practices to mainstreamagriculture. It is also dependent on integrating all three elements of sustainablefarming: environmental, social and economic.
European food anddrink manufacturers are
involved in a range ofconcrete initiatives
worldwide to supportand stimulate
sustainable agriculturalpractices beyond legal
requirements
”
“Food and drink industryinitiativesFood and drink manufacturers, althoughnot directly involved in farming activities,are strongly committed to supporting andstimulating sustainable agricultural practicesbeyond legal requirements. Numerous largefood and drink companies are supportingthe development and implementation ofsustainable agricultural practices in the EUand globally, while a rising number of small and medium enterprises (SMEs) areparticipating in national sustainabilityschemes. Industry's approach to sustainableagriculture encompasses all three pillars ofsustainability - environmental, social andeconomic - and is based on the followingkey principles :
■ Ensure safe food supplies in terms ofquantity and quality
■ Protect and, wherever possible, improvethe natural environment
■ Strengthen competitiveness of farmingsystems and improve socio-economicconditions of local communities
The food and drink industry maintains acontinuous and close dialogue with suppliersof agricultural produce. In many cases,industry is playing a positive role in coordinating the supply chain by cooperatingwith all relevant players. Depending on thecrop and structure of the supply chain, foodmanufacturers either have direct contactwith farmers or work with traders on worldmarkets. A variety of different tools isapplied to develop sustainable sourcingpractices. For some crops, e.g. coffee andpalm oil, farming best practice codes havebeen developed, and food manufacturersare playing a positive role in encouragingsuppliers to adopt them.
12
Our raw materials
Examples of industryinvolvement in sustainable agriculture
The food and drink industry is involved in aseries of agricultural initiatives worldwide,which are characterised by a high diversityof partners, concepts and tools.None of these initiatives claims to providea single, exclusive approach to sustainableagriculture. Stakeholders are engaged inpermanent dialogue about the merits andfuture development of the various initiatives,and continuous progress is being madethrough constant “reality-checks” andmutual bench-marking with other schemes.The initiatives shown below - together withmany others - share the common objectiveof contributing to improved sustainability.
SustainableAgricultureInitiative (SAI)Platform
SAI Platform was created in 2002 byUnilever, Danone and Nestlé to support thedevelopment of sustainable agricultureworldwide, involving different stakeholdersin the food chain. The Platform, which todayincludes 21 major food companies, has aholistic vision of sustainable agriculture,embodying economic, social and environ-mental elements. SAI working areas includecereals, coffee, vegetables, fruit and dairy.
SAI Working Group on Dairy
The world's cattle population provides awide array of services to people, includingmilk, dairy products and meat. It also cre-ates labour. To ensure the positive develop-ment of the dairy sector, a number of chal-lenges lie ahead. The SAI Working Group
on Dairy aims to help meet these by main-taining food safety and quality of dairyproducts; improving farms' economic via-bility and social progress; and increasingenvironmental protection and animal wel-fare. The Group has developed SustainableDairy Principles and Practices on the basisof the International Dairy Federation (IDF)and FAO "Guide to good dairy farmingpractice". These are now being tested in anumber of pilot projects worldwide, andbench-marked against other majorschemes and initiatives.
www.saiplatform.org
Roundtable on SustainablePalm Oil (RSPO)
RSPO is a global stakeholder initiative created in 2004 to promote the growthand use of sustainable palm oil.Participants include growers, processors,traders, retailers, banks, NGOs and manu-facturers, such as Nestlé, Unilever, CadburySchweppes, Ferrero and Heinz. Its work iscentred on the Principles and Criteria forSustainable Palm Oil Production.A separate Roundtable on Sustainable Soywas created in 2005.
www.rspo.org

13
World Cocoa Foundation (WCF)
WCF was formed in 2000 to promote economic and social development as wellas environmental conservation in cocoagrowing communities. Today, it plays aleading role in developing and managingeffective, on-the-ground programmes,raising funds, and acting as a forum fordiscussion of the cocoa farming sector'sneeds. The WCF comprises nearly 60member companies, including Ferrero,Kraft, Nestlé and Cargill.
www.worldcocoafoundation.org
Common Code for the CoffeeCommunity (4C) Association
The 4C Association is a multi-stakeholderassociation, comprising coffee producers,trade, industry and NGOs. 4C aims toimprove producers' income and living conditions via cost reductions, qualityimprovements, improved marketing condi-tions and environmental sustainability (e.g. reducing the use of agro-chemicalsand protecting tropical rainforests).Trade and industry members commit themselves to buying rising amounts of 4Ccoffee over time, and to financing verificationcosts. Industry members include, amongothers, the European, German, UK andNorwegian Coffee Federations, Tchibo,Sara Lee, Nestlé and Kraft Foods.
www.sustainable-coffee.net
UTZ Certified
UTZ is another worldwide coffee programmebased on the UTZ Certified Code of Conduct.It sets out social and environmental criteriafor responsible coffee growing practicesand efficient farm management.Independent certifiers conduct annualinspections to ensure producers complywith the Code.
www.utzcertified.org
Vegaplan Belgium
Vegaplan is an example of a national agricultural scheme. This Belgian certifica-tion scheme supports sustainable farmingand chain management in arable crops.The scheme is based on the ICQM Standard(Integrated Chain Quality Management),which covers food safety, traceability,environment and technological quality, andcomprises all links in the chain “from farmto fork” - including food manufacturers.
www.vegaplan.be
Sustainable Beet Growing Board
The Board was founded about 30 years agoon the initiative of the Südzucker companyand beet growers' associations with theaim of improving agricultural practices inbeet growing. Major achievements includea 50% reduction in mineral-N-fertiliserusage and a 90% reduction in pesticideusage for seed protection. The developmentand broad application of new approachesin weed control and leaf disease treatment,
as well as in practices to minimise erosion,are major steps towards sustainable beetgrowing.
The Rainforest Alliance
The Rainforest Alliance is an internationalenvironment organisation with more than 20 years' experience in the developmentand promotion of sustainable standards inforestry, agriculture and tourism. RainforestAlliance's standards cover safe and fairworking conditions, environmental protec-tion and economic sustainability.The organisation supports farmers in makingimprovements in sustainability and isworking with food companies such as KraftFoods, Unilever and Nestlé.
www.rainforest-alliance.org
The industrypromotes a holistic
approach to sustainableagriculture aimed atsecuring safe food
supplies, both in qualityand quantity,
protecting the naturalenvironment and
improvingsocio-economic
conditions of localcommunities
“
”

Building onachievementsLooking ahead, a major objective is continuously to broaden participation offood and drink companies in sustainable agriculture initiatives. This will not onlyresult in increased environmental benefits,but will also strengthen the administrativestructures required for defining, imple-menting and verifying sustainable farmingpractices worldwide. In addition to wideningparticipation, agricultural initiatives areimproving over time due to continuousreality checks and mutual benchmarkingand stimulation. This ongoing process also brings with it an increasing number of sustainable sourcing commitments by individual food industry players.
To be sustainable, agricultural productionhas to respond to consumers' needs.Food and drink manufacturers are continu-ing to extend the integration of sustainabilityaspects in their sourcing practices in linewith rising consumer demand for productscomplying with specified criteria.Agricultural and rural policies should support this process by encouraging sustainable farming practices and offeringa framework in which public and privateinitiatives that go beyond regulation, canflourish.
14
Unilever commits to sourceall its tea sustainably by 2015In May 2007, Unilever - the world'slargest tea company - announced its commitment to purchase all its tea fromsustainable sources. It has asked theRainforest Alliance to start certifying teaestates in Africa. Since then, Unilever haslaunched the first Rainforest AllianceCertified Lipton Kericho Estate Tea in theUK. The plan is to have all Lipton YellowLabel tea bags sold in Western Europecertified by 2010; and all Lipton tea bagssold globally certified by 2015.
Kraft Foods : A new approach to marketingsustainably produced coffeeIn a move to advance the availability ofcertified sustainable coffees in the mainstream market, Kraft launched a partnership in October 2003 with theRainforest Alliance. Kraft is the largestbuyer of Rainforest Alliance coffee beansworldwide. In 2006, Kraft purchased about12,000 tons of coffee from RainforestAlliance Certified Farms. This is threetimes the amount Kraft purchased in 2003when it began working with the RainforestAlliance. Kraft is blending this certifiedcoffee into several of its mainstream coffee brands in western Europe. In 2005,Kraft launched its first 100% RainforestAlliance Certified retail brands in France,Sweden, Italy and the United Kingdom.
Nespresso AAA SustainableQuality ProgrammeIn 2006, Nespresso signed aMemorandum of Understanding with all itsmain coffee suppliers, committing all parties to sourcing green coffee accordingto defined sustainability and quality criteria. The criteria are based on the Toolfor the Assessment of Sustainable Quality(TASQ), which Nespresso is implementingin cooperation with the Rainforest Alliance.The TASQ covers a range of aspects such as strain of coffee plant, soil type,harvesting practices, environmentalaspects including use of fertilisers, bio-diversity and water conservation, but alsosocial practices and economic issues.
Our raw materials

15
Widening participation in sustainable agriculture
initiatives will not onlyresult in increased
environmental benefits,but will also strengthen
the administrative structures required fordefining, implementing
and verifying sustainable farming
practices worldwide
“
”

Resource efficiency &waste management
Making the most of our raw materials
2
THE ISSUE■ Resources used in the food and
drink sector are of agriculturalorigin. Due to their biologicalnature, virtually every part of anagricultural crop has a usefulapplication. There is both an imperative and an immensepotential to use these resourcesin a highly efficient manner.
■ The declared objective of thefood industry is to use 100% ofagricultural resources whereverpossible and, in so doing, toreduce waste to the absoluteminimum by transforming theminto a wide range of products,including co-products and by-products. Food and drink manu-facturers are increasingly acting
16
as bio-refineries, in which agri-cultural resources are separatedinto different components, eachof which finds useful applica-tions including animal feed, fer-tilisers, cosmetics, pharmaceuti-cals, bio-plastics and bio-fuels.
■ While food companies are fully committed to source reduction,some waste is unavoidable andfood companies progressivelyimplement sustainable recyclingand recovery methods to reclaimresources embedded in waste,and minimise waste going tolandfill, in particular as far asbio-degradable waste fractionsare concerned.
> > > >

The challengeThe way in which renewable and non-renewable resources are used in manyparts of the world risks eroding the planet's capacity to regenerate theseresources. Globally, this trend is furtherexacerbated by increasing demand for rawmaterials from emerging economies suchas China, India and Brazil.
To ensure more sustainable resource use,it is essential to improve resource efficiencyand reduce environmental impact whileensuring continued economic growth(decoupling). Resource efficiency is also a crucial driver for waste prevention, oneof the key objectives of the 6th EUEnvironmental Action Programme. Wherewaste generation cannot be prevented, it is imperative to ensure its sustainable management and to recover its embeddedresources in the most efficient manner.
Food and drink industryinitiatives
I. Aiming for full rawmaterial utilisation -The key to wasteprevention
Besides its core products, the EU food anddrink industry produces many additionalproducts that are used in a wide range ofdifferent economic applications, rangingfrom animal feed to fertilisers, cosmetics,pharmaceuticals, lubricants, bio-plastics,bio-fuels and others.
These products are subject to intensiveproduct-related legislation and offer signifi-cant environmental and economic benefits.They improve resource efficiency in industry,helping to reduce agricultural pressures onthe environment. They also generate higher
added value from a given unit of agriculturalinput (stimulating economic growth).In addition, they contribute significantly towaste prevention by avoiding unnecessarywastage of natural resources. Finally,products and by-products from the foodand drink sector support the importanttransition towards a bio-based, low carboneconomy (use of renewable resources).
Example 1 : Animal feed
Animal feed is the most important use ofby-products from the food sector in termsof volume. Each year, about 85 milliontonnes of by-products are used for animalfeeding (e.g. sugar beet pulp, maizegluten, brewers' grains, whey). 60 milliontonnes are used by the EU compound feedindustry, while the rest is supplied directlyto farmers. The use of these products inanimal feed is extensively regulated in EUlegislation, including Regulation 178/2002on food law and Directive 96/25/EC on thecirculation and use of feed material.
a) Sugar beet The European sugar industry processessome 110 million tonnes of beet everyyear, producing 17 million tonnes of sugar.However, sugar represents only about 16%of fresh sugar beet weight, and a consider-able number of other products are pro-duced, all of which meet legislation, speci-fications and quality controls.
17
The leading non-sugar product is beet pulp,an excellent and long-recognised cattlefeed product which is highly appreciatedby farmers for its pure plant origin andhigh energy value. Beet pulp originatesfrom cleaned, sliced sugar beet (known as“cossettes”) when the sugar is dissolvedwith warm water. The annual production of beet pulp in the EU amounts to around 8 million tonnes of pressed pulp and 5.5 million tonnes of dried pulp.
Towards 100% efficiency in the sugar sector :Products and by-products from 1 unit of sugar beet
Due to their biological nature,
virtually every part of an agricultural
crop has a useful application.
There is both an imperative and an
immense potential touse these natural
resources in a highlyefficient manner
“
Sugar 16.0%
Water 75.0% (re-used for beet washing & transport)
Molasses 3.5%(e.g. animal feed)
Beet pulp 5.0%(e.g. animal feed)
Other 0.5% (incorporated into sugar factory lime)
”
Source: CEFS

b) Oilseed crushingThe extraction of oil from soybeans, rape-seeds, sunflower seeds and other oilseedsgenerates yearly around 18.6 milliontonnes of oilseed meal, a product that isextremely concentrated in high nutritionalvalue proteins. Oilseed meals are anessential source of protein for the EU livestock population, regardless of species.
Example 2 : Bio-energy production
Due to the agricultural origin of the rawmaterials used in the food and drink sector, many by-products are suitable foruse as a CO2-neutral, renewable energysource.
a) By-products from oilseed processingOilseed processing generates oils, mealand fatty acids. Both meals and fatty acidshave a high energy content. Fatty acids arean ideal, CO2-neutral bio-fuel. Its energycontent is almost comparable with that ofmineral fuels, while its fluidity brings aboutthe same logistic advantages. The Europeanoilseed processing industry producesapproximately 550,000 tonnes of fattyacids each year that can be used for heatand power generation.
b) Bio-gas production Many by-products from food and drinkmanufacturing can be transformed intobio-gas via anaerobic digestion in bio-
18
Food manufacturing > Resource efficiency & waste management
reactors. This technique is increasinglycombined with combined heat and powergeneration (CHP), with the produced heatused 100% in the internal productionprocess, and remaining electricity sold tothe national grid as renewable energy.
c) Coffee by-products Coffee chaff from coffee roasting andspent coffee grounds from soluble coffeemanufacturing can also be used as CO2-neutral fuels. For instance, spent cof-fee grounds from soluble coffee productioncan be burned as renewable fuel to providesteam for other production stages, replacingfossil fuels and reducing CO2 emissions.
Example 3 : Fertilisers
Several by-products from food manufacturingcan be used as bio-fertilisers adding nutritional value to soil. Sugar factory lime,for instance, is recognised as a fertiliserunder the EU's regulation on organic agricultural production. In addition to lime(calcium carbonate), it also contains othervaluable nutrients such as magnesium,phosphate and potassium, and is used toimprove soil structure and reduce acidity.In this way, the sugar industry makes avaluable contribution to environmental efficiency by providing farmers with a sustainable product that avoids extractionof limited limestone reserves.
Example 4 : Other applications
Growing awareness of the environmentalimpact of petro-based products, and therecent insecurity of oil supply, has focusedattention on the advantages of bio-basedproducts and raw materials from the foodand drink sector, which are increasingly usedto produce plastics, lubricants, detergents,ink, cosmetics and pharmaceuticals.
Regulatory barriers to full raw material utilisation
By-products and waste
The current lack of legal clarity under EU legislation regarding the distinctionbetween waste and non-waste can hinder the efficient use of by-products,especially when national authorities, oftenover-burdened with legal ambiguities,wrongly classify by-products as “waste”.This situation poses a threat to the objectiveof improved resource efficiency, industrialproductivity, waste prevention andincreased use of renewable resources.
Integrated Resource and WasteManagement (IRWM)
In 2004, CIAA launched the IRWM platformtogether with many other EU stakeholdersfrom the food and feed chains. The forumdeveloped clear criteria to distinguishbetween products and waste in the foodand drink sector. These criteria also reflectrecent jurisprudence of the European Courtof Justice on by-products. To allow the fullbenefits of by-products to be realised,these principles need to be translated intoclear EU legislation, confirming their statusas non-waste.

19
Overview of the criteria to distinguishbetween by-products and waste
What is a by-product ?What is waste?
Directive 2006/12/EC defines waste as“any substance or object which the holderdiscards or intends or is required to dis-card”. While this definition serves its pur-pose in most cases, it evoked ambiguitywith regard to the status of so-called co-products or by-products that are produced in a manufacturing process inaddition to the primary product (e.g. whey,which is a valuable by-product from cheeseproduction). For industry, it has alwaysbeen evident that these products are notwaste, but authorities have sometimesfound it difficult to apply the definitionaccurately.
As a result, several cases referred to theECJ have addressed the issue of non-waste by-products. The outcome is thatmany substances which may previouslyhave been wrongly classified as waste arenow rightly considered as non-waste by-products, because they are used inother sectors as useful economic input.In May 2007, the UK Defra, in its FoodIndustry Sustainability Strategy, states withregard to food industry by-products: “Thechange in interpretation is likely to haveled to a substantial reduction in the overallfood waste arising”.
In February 2007, the European Commissionpublished guidance on the definition ofwaste and by-products based on this caselaw. It explicitly mentions “by-products fromthe food and drink industry used as animalfeed” as an example for non-waste materials.This type of by-product alone amounts to85 million tonnes annually in the EU, anddoes not include all the other useful appli-cations of food manufacturing by-products(e.g. fertilisers, cosmetics, pharmaceuticals,bio-fuels).
These legal corrections are beginning toreflect the business reality where by-productuse and waste prevention have been practiced in the food sector for many years.
Legal classification By-product (non-waste) Waste
Usability Suitable for direct further use Not suitable for direct further usein a production process or as final product May be used as secondary raw material
after recycling or recovery
Intention of the holder Intention to exploit or market the material Intention to discard the material
Certainty of use Further use is certain Discarding takes place
Legislation Further use in compliance with all relevant Waste management (e.g. recyclingproduct, environmental and health recovery, disposal) in compliance with protection requirements for the specific waste legislationfurther use
Example Bio-based by-products from food The following items if no longer used:manufacturing used in :
■ Animal feed ■ Pallets■ Fertilisers ■ Crates■ Cosmetics ■ Plastic■ Pharmaceuticals ■ Paper■ Bio-plastics ■ Metals■ Lubricants ■ Wood■ Bio-energy production
Food and drink manufacturers are
increasingly acting asbio-refineries, in which
agricultural crops areseparated into different
components, each of which finds useful
applications includinganimal feed, fertilisers,
cosmetics, pharmaceu-ticals, bio-plastics
and bio-fuels
“
”

II. Re-use, recycling and recoveryMinimising and making the most of waste
Waste prevention is the over-riding priorityof the food and drink industry, and full by-product utilisation is an outstandingcontributor to waste prevention. However, aminimum of waste is inevitable, and wastemanagement along the lines of re-use,recycling and recovery of resources embed-ded in waste, is a prime focus for the sec-tor. A particular priority is to minimise dispos-al and divert any remaining bio-degradablewaste away from landfill into recovery andrecycling. To cite just one example, the UKfood and drink industry uses or recycles orrecovers more than 70% of its productionresidues, which is above average comparedwith other sectors in the UK.
20
A. Solid waste
There is no precise data on the totalamount of waste generated by the foodindustry in the EU-25. Existing figures fromMember States are incomplete and wastecategorisations at national level are ofteninconsistent, making it difficult to comparedata. The European Environment Agencydata base contains figures from 15Member States concerning the amount offood processing waste in total nationalmanufacturing waste (from different years).These national figures differ markedly,ranging from 1.2% in France to 52% inThe Netherlands. According to this data,food and drink processing - on an aggre-gated level - would account for about
12.5% of manufacturing industry's wastein these countries. In the EU as a whole,total manufacturing accounts for 26% oftotal waste generation. If the food industry'sshare of 12.5% was applied to this totalEU data, food industry waste wouldaccount for about 3.25% of overall wastegeneration in the EU.
However, these figures from 1999-2003must be treated with a great deal of caution as since then the concept of wastehas altered under EU case law. Several ofthe reported figures include by-products,which in today's legal understanding areno longer considered as waste. Given thehigh utilisation of by-products from thefood and drink industry, final waste arising
1. Waste preventionWherever possible through :
■ Use of by-products (e.g. in animal feed,fertilisers, bio-energy, pharmaceuticals, etc.)
■ Reducing water consumption in food processing to prevent waste water
■ Avoiding food waste in transport andhouseholds through optimised packagingsolutions
■ Packaging waste prevention throughpackaging weight reduction
■ Matching of products to user needs (e.g. product and packaging design,portion size)
2. Re-use, recycling and recoveryWhere waste generation cannot beprevented, it is imperative to recoverits embedded resources in the mostsuitable manner :
■ Re-use (e.g. consumer packaging,transport crates, pallets)
■ Recycling (e.g. packaging waste, non bio-degradable industrial waste, e.g. usedpallets, crates, plastic, paper and metals;composting of bio-waste)
■ Recovery of discarded residues:
- Bio-energy production (anaerobic treatment)
- Land treatment (following pre-treatment)
- Combustion with energy recovery
3. Disposal (landfill, incineration)To be avoided wherever possible
This hierarchy has to be seen as a guiding principle. It does not provide a“one-size-fits-all” solution suitable for allcases. In the waste management reality, noproduct or waste stream is identical, andflexibility is required to identify the optionthat offers the best overall environmental,economic and social results.
The waste hierarchy in the food industry
Food manufacturing > Resource efficiency & waste management

21
Due to their renewable nature, by-products and
waste from the foodand drink industry can
make a valuable contribution to the
objective of reducingdependence on fossil
fuels and achievinglower levels of green-
house gas emissions
“
Example : NestléComposting of spentcoffee grounds
The production of soluble coffee generatesa by-product, spent coffee grounds, whichcan be used - amongst others - as bio-based fertiliser and soil improver.To optimise the quality of this by-productprior to agricultural application, the spentcoffee ground from the Nestlé factory inGirona is sent to an external, specialisedcomposting plant, which uses this materiallike an ingredient to obtain high qualitycompost. This composting technique isrecognised as good practice for valorisingby-products.
Example : Remo-fritGreen electricity productionfrom potato processing by-products
Remo-frit is a Belgian SME transformingpotatoes into French fries and fresh peeledpotatoes. During the production process,the residues of potatoes and their peelingsare sent together with the used water, whichis now enriched with starch, to an anaerobicreactor. In this reactor, the organic matteris transformed into bio-gas by naturaldegradation. The bio-gas is then used asfuel in a special engine with an electricalpower of 630 kWh. Thus, Remo-frit is atthe same time producer of potato productsand of electricity !
in the sector must reasonably be estimatedto be considerably lower. The precise shareneeds to be reassessed on the basis of fullimplementation of recent case law in allMember States.
Food and drink industryinitiatives
1. Bio-degradable waste
It is a priority for food and drink companiesto divert remaining bio-degradable wasteaway from landfill into sustainable recoveryand recycling processes. Bio-degradablewaste can be processed either in the presence of oxygen by composting, or inthe absence of oxygen, by using anaerobicdigestion. Both methods produce a soilconditioner, which when prepared correctly,can be used as a valuable source of nutri-ents in agriculture. Anaerobic digestionalso produces methane gas, an importantsource of bio-energy. The energy embeddedin bio-degradable residues can also berecovered in a combustion process. In allthese cases, the material in question qualifies either as a by-product or aswaste, depending on whether it meets allcumulative by-product criteria.
Examples
a) CompostingCompost plays an important role in top soilmanufacture, land remediation andrestoration, in horticulture, agriculture andlandscaping, e.g. on sports grounds andgolf courses. In the food and drink sector,composting is frequently applied as a pre-treatment method for bio-degradableresidues that are then applied on land toimprove soil quality. For this purpose, thebio-degradables are usually supplied to thecomposting industry. On-site compostingby food and drink manufacturers is rare.
b) Anaerobic digestionBio-energy from bio-mass contributes toreduced dependence on fossil fuels andlower levels of greenhouse gases. The EUhas set a target of 20% for the share ofrenewable energies in total energy con-sumption by 2020. Due to their biologicalorigin, by-products and waste from foodand drink processing can make a valuablecontribution to this objective. Their use alsohelps to reduce existing pressures on agricultural markets, stemming from anincreasing diversion of arable land fromfood production towards the growing offirst-generation bio-fuels.
Food processing residues in 15 MemberStates as share of overall EU waste generation (based on EEA data 1)
Mining and quarrying 29%
Food processing residues 3.25% (may include by-products) precise share uncertain
Other manufacturing 22.75%
Constructionand demolition 22%
Municipal waste 14%
Others 5%
Energy production
4%
”
c) Land application of organic residuesLoss of organic matter is one of the sevenmain threats to soil quality in the EU.Pre-treated food processing residues canbe applied on land (landspread) under controlled conditions to improve soil qualityand raise organic matter content.For instance, the land application of aerobicsludge from starch plants is practisedunder clear rules in several EU countries,e.g. France. Organic matter is degraded bysoil bacteria and its nutrients are taken upby the crops or recycled into the soil.Food processing residues are often a goodsource of nitrogen (N), phosphorous (P)and potassium (K). To determine preciselyhow much N, P or K will be available tocrops, the residues need to be analysed.Also the soil receiving these materials hasto be tested regularly in order to determineits nutritional interest.
d) Energy recoveryFinally, the energy embedded in bio-degradable residues can be recovered in a combustion process. For instance, thecombustion of brewers' grain holds a bigpotential for energy and cost savings inbreweries. This technology strengthens theindependence of breweries from externalenergy sources and leads to a substantialcompetitive advantage. Rising energy priceswill affect the overall production costs lessseverely due to an almost autonomousenergy source.
22
2. Non-biodegradable waste
Non-organic waste in the food sectorincludes used products such as pallets,crates, plastic, paper and metals. Theseare typically collected separately on site forrecycling or energy recovery. Today hardlyanything is disposed of.
B. Industrial wastewater
Waste water is the most common waste inthe food and drink industry. This is becausefood processing involves a number of unitoperations in which water is an essentialrequirement, such as washing, boiling,evaporation, extraction, filtration and cleaning. European food and drink manu-facturers undertake significant efforts andcontinuous investment to ensure soundwaste water treatment, which consists ofthree main elements: First, to reduce the
amount of waste water through efficientprocessing methods. Second, to improvethe quality of waste water through state-ofthe-art water treatment. Third, to optimisethe re-use, recycling and recovery of wastewater whenever this is possible withoutcompromising stringent EU hygienerequirements.
Waste water reduction
In member states, for which reliable data is available, water discharge from foodprocessing fell notably over the lastdecade, e.g. by 30% from 1994 to 2001 in the Belgian region of Wallonia while production output increased by 28% over the same period. Process water isgenerally micro-biologically purified in private and/or public treatment installationsbefore being discharged into the environment.
Water quality improvement and recovery
Quality control of discharged water is asecond key element in waste water management in the food and drink industry.In several cases, a “win-win” solution isfeasible: The organic components containedin the process water can be valorised toproduce energy (anaerobic digestion),
Example : Energy recoveryfrom brewers' grain atBrewery Göss, Austria
In 2002, the world’s first plant for energyrecovery from brewers' grain was put intooperation by Brewery Göss in Austria. Theplant is designed for a capacity of 2 to 3t/h of wet brewer's grain, which corre-sponds to a full steam capacity of 2 to 3MW and an operating pressure of 8 bar.The experience gained through this pilotplant serves as a valuable basis for furtherprojects. Patents for this method are pending in 28 countries.
Example : FDF - Research on wastesources and treatmentoptions in the UK
The UK Food and Drink Federation (FDF)has worked with Envirowise on a number ofoccasions in the past on waste and otherenvironmental issues. Specifically theScottish FDF, a devolved Division of FDF,has formed a Scottish Food Chain Group(comprising the National Farmers Union ofScotland, Sea Fish Industry Authority,Scottish Retail Consortium, ScottishGrocers Federation, British HospitalityAssociation as well as the SFDF), which isdeveloping, in conjunction with Envirowise,a framework for action on waste andresource efficiency. This includes workingon the development of a programme ofworkshops and an outline specification for research into waste streams that aregenerated by the food chain, and theoptions for handling or disposing of suchwaste. FDF is also a member of theChampions' Group on Waste under the UKDefra's Food Industry Sustainability Strategy.
300
250
350
200
150
100
50
0
110
100
120
90
80
70
60
50
Evolution of the total water dischargefrom the food and drink industries in theBelgian Region of Wallonia
1994
1995
1996
1997
1998
1999
2000
2001
Annual discharge (in pollution discharge units)
Production index
■ Production index ■ Total discharge
Source: MRW/DGRNE
Food manufacturing > Resource efficiency & waste management

23
Food and drink manufacturers undertake significant investment in
state-of-the-art wastewater treatment to further improve the
quality of dischargedwater and to optimiseenergy and resource
efficiency
“compost (aerobic digestion) and soilimprovers, while at the same time signifi-cantly improving the quality of dischargedwater. Several companies operate a fullthree-step treatment: Anaerobic pre-treat-ment (biogas-production), followed by com-posting and tertiary treatment i.e. removalof nitrogen and phosphor. This results notonly in improved energy efficiency, but alsoin a decrease in the discharge of oxygen-depleting substances. In Wallonia, forexample, discharged oxygen depleting sub-stances from the food sector fell by 30%from 1996 to 2001. Many companies con-tinue investing in cutting-edge technologyto reduce COD still further and to optimiseenergy recovery.
Building onachievements
■ Waste prevention remains industry's priority in the field of resource manage-ment. The utilisation of all componentscontained in agricultural raw materialsstill offers a huge potential for furtherresource-efficiency gains.
■ Food and drink companies continuouslyinvest in new technologies to adapt theirby-products to emerging new markets.Further environmental and economicgains can be realised through intensifiedcooperation between business partners andthe research community with a view toexploring new technologies. Current R&Dcovers areas such as the utilisation ofproteins, oils, sugars, vitamins, colourantsor antioxidants contained in the crop.
■ Besides R&D, on-site investment is oftenrequired to implement the required tech-nologies for full resource utilisation. Inthis respect, the financial restraints ofsmall and medium enterprises (SMEs) inthe food and drink sector must be takeninto full account if existing technologiesare to be rolled out widely.
■ In certain cases, there may be opportuni-ties to centralise by-product utilisation,especially where they are produced attoo low a scale to economically justifyinternal utilisation (e.g. centralised bio-gas production from by-products from foodand drink facilities in a given local area).
■ Recycling of pre-treated waste water, inline with stringent EU hygiene require-ments, is another area where further efficiency gains can be achieved throughcontinuous innovation and investment.
Example:Green power from the neweffluent treatment at theRoyal Brewery in Manchester
Reducing chemical oxygendemand by 97.5% while producing renewable energy
Scottish & Newcastle UK Ltd took a pro-active approach to water treatment anddischarge by investing £3 million in theinstallation of the latest effluent treatmentplant technology at their Royal Brewery inManchester. The Effluent Treatment Plantsignificantly reduces the site's discharge of suspended solids and chemi-cal oxygen demand by 96% and 97.5%respectively, as well as smoothing out thepH to a neutral level, all of which helpsreduce the site's environmental impact.
In addition to the treatment performanceof the plant, the BIOPACË reactor designconverts most of the organic componentsof the effluent into methane. This bio-gasis then collected and used as a replace-ment for natural gas in the site's boilers -thus saving on finite environmentalresources, cutting the site's carbon foot-print and helping the site meet itsEmission Trading Scheme obligation.
Actions requiredfrom otherstakeholders
■ To allow the full environmental and eco-nomic benefits of complete raw materialutilisation to be realised, long-term legalcertainty is required regarding the impor-tant distinction between non-waste,including by-products, and waste underEU waste law. This legal certainty isessential in order to justify the significantinvestment needed for adjusting by-products to the needs of existing andemerging new markets. EU legislationmust facilitate, not hinder, resource-efficiency in this field and must providethe industry with a clear legal basis for its ongoing efforts to optimise raw material use.
■ Flexibility of waste management optionsis required under EU legislation.The waste hierarchy has to be seen as aguiding principle, which does not providea “one-size-fits-all” solution. In wastemanagement reality, no product or wastestream is identical, and flexibility betweenre-use, recycling and recovery is requiredto identify the option that offers the bestoverall environmental, economic andsocial results.
”

> > > >
Energy & climate change
Improving energy efficiency - cutting emissions
3
THE ISSUE■ The food and drink industry fully
supports the promotion of ener-gy efficiency as an importantdriver for industrial competitive-ness and to reduce emissions ofgreenhouse gases (GHG).
■ While the food and drink sectoris characterised by relatively lowenergy intensity compared withmany other industrial sectors,sharply rising energy prices havebecome a notable cost factor inseveral sub-sectors.
24
■ The food and drink manufactur-ing industry accounts for about1.5% of total GHG emissions inthe EU-15. GHG emissions fell by3% from 2004 to 2005 and CO2-intensity has fallen by 25% since1990 compared with economicgrowth.
■ Within the food chain, agricul-ture accounts for 49% of GHGemissions, followed by con-sumers with 18% and manufac-turing with 11%.
■ Food and drink manufacturersare demonstrating genuineleadership in energy and carbonmanagement. This includes vol-untarily cutting energy use, fuelswitching, investing in energyefficient and low carbon tech-nologies, participating in nationalor sector energy efficiencyschemes, and carrying outdetailed energy audits and feasi-bility studies.
The challengeThere is mounting evidence that theworld's climate is changing, and that theburning of fossil fuels, along with land usechanges and agriculture, are among theprinciple causes.
The EU is determined to tackle globalwarming and in 2007 adopted ambitioustargets in its new energy and climatechange policy. These include reducinggreenhouse gas (GHG) emissions by 20%,improving energy efficiency by 20%,raising the share of renewable energysources by 20% and the share of bio-fuelsin road transport by 10%. All targets applyto the year 2020.
There is increasing pressure on energyusers to improve their energy efficiency.This is not only a result of regulatory drivers.It is also caused by rising and highlyvolatile energy prices, and concerns oversupply security.
The envisaged transition towards a lowcarbon economy will have far-reachingimpacts on all economic sectors, includingthe food and drink industry. Impacts on thefood sector may also stem from globalwarming itself. Climate change may affectagriculture, availability of clean water andsea temperatures, and this in turn couldhave direct effects on the sustainability ofthe food and drink business.
The industry's manufacturers are thereforecommitted to contributing fully to the EU'spolicy objectives in the field of energy andclimate change and are undertaking a widerange of activities and investments to cutenergy use and GHG emissions.
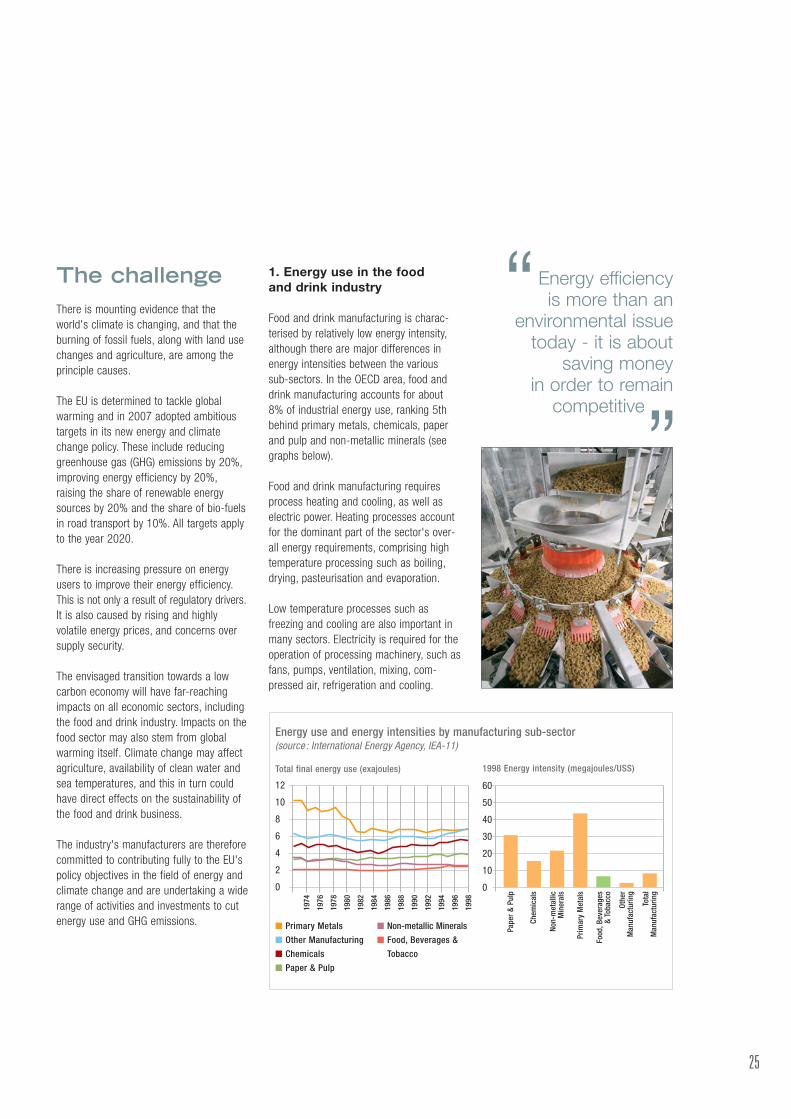
1. Energy use in the food and drink industry
Food and drink manufacturing is charac-terised by relatively low energy intensity,although there are major differences inenergy intensities between the varioussub-sectors. In the OECD area, food anddrink manufacturing accounts for about8% of industrial energy use, ranking 5thbehind primary metals, chemicals, paperand pulp and non-metallic minerals (seegraphs below).
Food and drink manufacturing requiresprocess heating and cooling, as well aselectric power. Heating processes accountfor the dominant part of the sector's over-all energy requirements, comprising hightemperature processing such as boiling,drying, pasteurisation and evaporation.
Low temperature processes such as freezing and cooling are also important inmany sectors. Electricity is required for theoperation of processing machinery, such asfans, pumps, ventilation, mixing, com-pressed air, refrigeration and cooling.
25
Energy efficiencyis more than an
environmental issuetoday - it is about
saving moneyin order to remain
competitive
“
Energy use and energy intensities by manufacturing sub-sector (source : International Energy Agency, IEA-11)
12
10
8
6
4
2
0
1974
1976
1978
1980
1982
1984
1986
1988
1990
1992
1994
1996
1998
■ Primary Metals
■ Other Manufacturing
■ Chemicals
■ Paper & Pulp
■ Non-metallic Minerals
■ Food, Beverages &
Tobacco
Total final energy use (exajoules) 1998 Energy intensity (megajoules/USS)
60
50
40
30
20
10
0
Pape
r &
Pul
p
Chem
ical
s
Non-
met
allic
Min
eral
s
Prim
ary
Met
als
Food
,Bev
erag
es&
Tob
acco
Othe
rM
anuf
actu
ring
Tota
lM
anuf
actu
ring
”

26
Food manufacturing > Energy and Climate Change
3. Emissions trends in thefood and drink industry
Between 1990 and 2005, the economicvalue of the food and drink industry's pro-duction output has grown by more than51% in the EU-15 and today amounts tomore than €730 billion per year. Despitethis notable economic expansion, growth inCO2 emissions in the sector has been lim-ited to 13% over the same period, reflect-ing a relative decoupling of economicgrowth from CO2 emissions. This has beenachieved despite significant life-stylechanges that increasingly shift consumerdemand towards food and drink products
that often require additional processing bymanufacturers, e.g. chilled foods, readymeals, 'life-style' foods, and smaller andmore convenient package sizes. It is par-ticularly encouraging that since 2002absolute CO2 emissions in the sector havestagnated despite continued economicgrowth, and that in 2005 emissions fell by3%. For the EU food and drink industry,which today comprises 27 nationaleconomies, this is a very positive and reas-suring signal, which reflects the increasingcommitment of food and drink companiescontinuously to improve their energy andcarbon management.
2. GHG emissions in thefood and drink manufacturingsector
GHG emissions from food and drink manufacturing are almost exclusively energy-use related (> 99%). Process emissions inthe industry are very low and predominantlyCO2-neutral from processes such as fermentation.
Energy-use related emissions in the foodindustry can be divided into :
1. direct (on site) emissions (burning of liquid, gaseous and solid fuels on site)
2. indirect (off-site) emissions from electricity purchased from power plants
The food and drink manufacturing industry'sdirect emissions accounted for 0.9% ofoverall GHG emissions in the EU-15 in2005 (source: EEA).2
The food and drink manufacturing indus-try's indirect emissions typically representabout 35-40% of the sector's total CO2emissions. Therefore total CO2 emissionsfrom the sector can be reasonably estimated to represent a share of 1.5% in overall EU-15 GHG emissions.3
EU-15 GHG emissions by sectors - 2005 (Source: EEA 2)
Non-ferrous metals 0.3%
Chemicals 1.6%
Paper and pulp 0.7%
Food, drink and tobacco(CO2 from energy use) 0.9%(plus 0.6% from indirect emissions)
Total: 1.5%
Iron and steel2.4%
Other 7.1%
The food and drink manufacturing industryaccounts for about 1.5% of total green-
house gas emissions in the EU“
Transport 21%Agriculture 9%
Industrial processes(non-energy) 8%
Waste 2.6%
Energy use (excl. transport) 59% (including power sector, manufacturing industry,construction, households, tertiary)
Energy use inmanufacturingand construction13%
Energy intensity reduced by 25% between 1990 and 2005EU-15 food and drink manufacturing industries
45,00040,00035,00030,00025,00020,00015,00010,0005,0000
1990
1992
1994
1996
1998
2000
2002
2004
2005
■ Economic growth: +51% since 1990 ■ Direct CO2 emissions: +13% since 1990
Gg CO2 equivalents
➜
”
Source: EEA

27
Food and drink industryinitiativesThe food and drink industry considersenergy efficiency and carbon managementimportant drivers for increased industrialcompetitiveness and improved environ-mental sustainability. Food and drink companies are making significant effortsand investments to improve their energyperformance and to reduce GHG emissions,e.g. via the adoption of best practices,investing in energy efficient and low carbontechnologies, fuel switching, participatingin national or sector energy efficiencyschemes, detailed energy audits and feasibility studies.
While energy savings opportunities differmarkedly among sub-sectors, and bestpractice is often defined on a sector basis(e.g. for dairy, sugar, brewing, etc), a numberof general principles can be identified inthe industry's move towards sustainableenergy and carbon management .
4. Food manufacturing as part of the wider food chain
GHG emissions in the UK food chain : an overview (Source: Defra, ESI Division, 2007)
Total UK GHG emissions 2004
GHG emissions across the food chain havebeen investigated as part of the UKGovernment's Food Industry SustainabilityStrategy (FISS). Whereas variations exist inthe GHG composition in different EU Member States (size of the sector, nationalenergy mix, supply chain structure, trade),this data provides a representative andrealistic overview of GHG emissions of thefood chain's players.
GHG shares of the food chain players The entire food chain accounts for 17% oftotal UK GHGs. The largest source of GHGsis agriculture with 49% of food chain emissions, which is due to the importanceof non-CO2 GHGs methane and N2O.This is followed by consumers with 18% ofemissions, including food shopping by car,home cooking, cooling and freezing anddishwashing. Food manufacturing ranksthird, accounting for 11% of the foodchain's GHG emissions.
Within the food chain,agriculture accounts for about half of the
greenhouse gas emissions, followed
by consumers with 18% and manu-
facturing with 11%
“
UK food chain GHG emissions 2004
Agriculture 8.2%Fertiliser manufacture 0.6%Food manufacturing 1.8%Road freight 1%Home food related 2.6%Retail 1.4%Catering 0.8%Consumer food shopping 0.4%Non food 83%
Retail 8%
Catering 5%Consumer food shopping 3%
Home food related 15%
Food manufacturing 11%
Fertiliser manufacture 4%Agriculture 49%
Road Freight 6%
”

28
EU Emissions Trading Scheme(ETS)
The EU ETS aims to ensure that GHG emissions are cut at lowest possible coststo industry. The scheme is mandatory forfood and drink companies operating combustion installations above 20 MegaWatt. In France, for instance, 13.6% of allETS installations are at food and drinksites. Under the EU ETS, food and drinkcompanies are making continuousprogress towards reduced CO2 emissions.In 2005, the first year of the EU ETS imple-mentation, CO2 emissions from combustioninstallations in the food and drink sector(inside and outside the ETS) fell by 3%.
Long-term energy efficiencyagreements
In several EU Member States, the food anddrink sector is participating in Long TermAgreements (LTAs) on energy efficiencybetween government and industry.
Here are some examples :
LTAs in The Netherlands
The first LTA was signed in 1992.The agreements involved detailed energyaudits of industrial facilities. Over 29 sectors participated in LTA covenants up to theyear 2000 representing > 90% of totalindustrial energy consumption of TheNetherlands. From 1992 to 2000 cumulativeenergy efficiency improvement was equalto 22%. Under LTA 2, companies mustintroduce all suitable process efficiencymeasures with a pay-back time of fiveyears or less and introduce an energymanagement system in line with ISO 14001within two years.
LTAs in the UK
To qualify for an 80% reduction in the UKclimate change levy, 10,800 facilities from44 sectors signed 10 year CO2 reductiontargets. In 2005/06, Carbon Trust completed5,400 energy audits. Between 1.1 and 1.6 Mt CO2 savings were realised through
The food and drinkindustry's sustainableenergy roadmap
1. Demand side (energy end-use)
a) Implementation of energy efficiency measures
■ Define and apply sector best practice onenergy management
■ Identify major energy saving opportunitieswithin the plant, e.g. via an energy audit
■ Develop an energy action plan and integrate it into daily business practice
■ Monitor energy efficiency savings overtime, use bench-marking where sensible
■ Participate in national and sector energyefficiency schemes
b) Investment in low carbon technology
■ Consider energy efficiency in long-terminvestment decisions
■ Explore potential for co-generation(CHP), tri- and poly-generation, andother technologies
■ Gradual move towards HCFC and HFC-free refrigeration technology
2. Supply side (heat and powergeneration)
Move towards renewable and low-carbonenergy sources (internal and external)
a) External sources
■ Electricity is mainly sourced from thegrid. Its CO2-intensity depends on thenational energy mix
■ Purchasing of low carbon power fromcertified suppliers may become an option
b) Internal sources
■ For heat generation, switch from oil andsolid fuels to natural gas, renewablesand biomass
■ Explore the potential for increased on-sitegeneration of low carbon energy, e.g.:• Bio-gas production from by-products,
waste, process water, etc.• Use of by-products as renewable,
CO2-neutral fuels in combustion plant • Explore potential for other renewable
energy sources, e.g. solar heat, wind
Food manufacturing > Energy and Climate Change

29
the measures implemented. In 2006, theeight agreements covering food and drinkmanufacturers reported savings in absoluteCO2 emissions of 300,000 Te comparedwith a 1999 baseline.
LTAs in Belgium
In 2004, 132 Belgian food and drink com-panies, representing more than 80% ofenergy use in the sector, signed an EnergyEfficiency Agreement with the authorities.Based on a detailed energy audit or abench-mark, each company signed a formal commitment to achieve clearlydefined energy use reduction targets by2012. Three kinds of LTA exist in Belgium:
■ For the Walloon Region, the improvementtarget is 10.9%.
■ In the Flemish Region, the biggest foodand drink companies will reduce theirenergy consumption by 3.3 PJ.
■ For another group of smaller food anddrink companies in the Flemish Region,the target is not yet adopted but isexpected to be higher than 5%.
Industrial audits in France
Decision making processes for companiesare assisted through national financial support schemes for pre-diagnostic audits,as well as other detailed audits and feasibility studies.
British brewing sector
Energy consumption in the UK brewingindustry as represented by BBPA,accounting for 98% of UK beer produc-tion, fell by 54% in the years between1976 and 2006 (by 30% since 1990).
UK food and drink manufacturingsector
CO2 emissions from the UK food anddrink manufacturing industry fell by15.2% from 1990 to 2004. This was aresult of fuel switching from coal and oilto gas in the 1990's, as well as on-going industry actions to improve energyefficiency and the impact of the UK's climate change agreements. The UK foodand drink industry represented 13% ofthe European food and drink sector'stotal production value in the EU-15 in2005.
Case studies and examplesfrom companies and federations
Many food and drink companies aredemonstrating genuine leadership in energyefficiency and carbon management.There are innumerable examples of corpo-
rate and sector strategies and initiatives tocut both energy consumption and CO2emissions. Some of these actions andachievements are outlined below.
UK food and drink manufacturing totalCO2 emissions
16,000
14,000
12,000
10,000
8,000
6,000
4,000
2,000
0
1990
1992
1994
1996
1998
2000
2002
2004
2006
2008
2010
kTCO2
-15.2%
-17.7%
-11.3%
Specific energy consumption(delivered energy per hectolitre of beer produced)
350
300
250
200
150
100
50
0
1976
2006
1978
1980
1982
1984
1986
1988
1990
1992
1994
1996
1998
2000
2002
2004
Specific consumption MJ/hl
-54%
Switching from oil to natural gas and renewableenergy sources, the adoption of best management
practices and continuous investment in energy efficient processing technologies, are cornerstones
of the industry's sustainable energy strategy
“
■ Total CO2 emissions ■ Fossil Fuels ■ Net electricity
”

Friesland Foods: Reducing fuel consumption and CO2 emissions
The company monitors energy-relatedCO2 emissions on the basis of naturalgas and oil consumption. The continu-ous reduction in emissions (-35%CO2/tonne of product between 2000and 2004) is a direct result of thereduced use of fuels.
Kraft Foods: Focused energy reduc-tion measures in manufacturing
Improved usage reduction programmesand processes, together with the appli-cation of technological innovations thatpromote energy efficiency, resulted in a14% decrease in energy use and a 21%decrease in CO2 emissions in 2006 compared with 2001. CO2 emissions in2006 were 9% less versus 2005, due primarily to energy reduction in manu-facturing involving natural gas and elec-tricity use. Total energy usage in 2006was reduced by 11% versus 2005.
INBEV: Bio-gas production from waste water
InBev has been working hard to explorealternative waste water treatment methods, including anaerobic treatment,which uses less energy, produces lessprocess water sludge and also generatesbio-gas as a by-product, which is usedas fuel. In 2004, 10 InBev breweries pro-duced sufficient biogas, to generate over102,637 GJ of energy, which otherwisewould have been sourced externally(equalling the annual energy consump-tion of 9,500 households).
Year ktonnes CO2 tonnes per tonne of product
2000 614 0.20
2001 527 0.17
2002 533 0.14
2003 559 0.15
2004 512 0.13
30
Danone: Internal target setting and key performance indicators
Group Danone set itself the goal of reducing its energy consumption by 20% between2000 and 2010. Mid-term results in 2005 confirm that the group's target will beachieved earlier, since in 2004 the energy savings already amounted to 17.8%,reflecting an annual decrease of 4%.The group's approach comprises, inter alia, precise organisation of the work place, thedefinition of key performance indicators and the integration of energy management intodaily business practice. This is accompanied by energy audits and investment in energyefficient equipment.
From 1995 to 2006, Unilever reduced CO2 emissions per tonne of production by33.5%. In the next five years the company's target is to reduce CO2 emissionsby another 12.5% compared with 2006 levels. Of the total energy used byUnilever sites, 14.8% comes from renewable sources.
Unilever : Continuous reductions in CO2 emissions
Specific energy consumptionCO2 emissions
50
2000
2001
2002
2003
2004
2005
2006
2007
2008
2009
2010
100
150
200
250
300
Ratio (kWh/t)
100
1995
150
200
250
300
1996
1997
1998
1999
2000
2001
2002
2003
2004
2005
2006
2006
2007
2011
Kg/tonne of production
Total specific energy use (2000)
Target for 2010 (2000-20%)
Target thermal energy
2010 (2000-30%)
242.91247.35
226,17
217.23208.14
197.91
198.59
195.17191.46 185.67
171.75164.59 166.60
155.43
145.68
TARGETS
■ Total specific energy use ■ Specific thermal energy use ■ Specific electricity use
Food manufacturing > Energy and Climate Change

Specific electricity consumptionbreweries and soft-drink plants
2003
2004
2005
2006
2007
2008
10.1
9.91
9.509.59
9.07
8.85
8.55
■ Actual ■ Target MJ/hl beer + soft-drink
31
Heineken: Bench-marking in the brewing sector
In 2003, Heineken, together with otherDutch breweries, developed a bench-marking scheme to determine the ener-gy efficiency of breweries in TheNetherlands and internationally.Heineken's electricity consumptiondecreased from 9.91 kWh per hectolitrein 2004 to 9.59 kWh per hectolitre in2005 (minus 3%). This total is justabove Heineken's 2005 target within its overall goal to reduce electrici-ty consumption by 15% within 5 years.
Nestlé: Using spent coffee groundsas CO2-neutral fuel:
Nestlé's worldwide operations includemore than 20 soluble coffee factories, inwhich spent coffee grounds are used asa renewable, CO2-neutral fuel. This inte-grated approach to managing by-prod-ucts and energy requirements has pro-duced a series of positive environmentalresults: decreased reliance on fossilfuels, saving more than 45,000TOE/year, reduced SOx emissions andprevention of about 800,000 tonnes oforganic material from going to landfill,where it would produce methane gas.
Specific thermal energy consumptionbreweries and soft-drink plants
2003
2004
2005
2006
2007
2008 92
96
100
107108
116
114
■ Actual ■ Target MJ/hl beer + soft-drink
BESS project on energy efficiencyin SMEs in the food sector
In April 2007, the EU co-funded projectBESS (Benchmarking and EnergyManagement Schemes in SMEs)finalised an innovative e-learningscheme to implement energy efficiencymeasures in small and medium sizedenterprises (SMEs) in the food anddrink sector. The BESS tools weredeveloped by a consortium of nationalenergy agencies and consultanciesand tested in over 50 food and drinkcompanies in 11 EU member states.CIAA actively supported the projectthrough its continued participation inthe BESS Project Advisory Group,which consists of members of the project consortium, the EuropeanCommission, the International EnergyAgency and CIAA. The tools consist ofan energy management specification,an implementation model, a handbook,a web based e-learning system, abench-marking scheme and templatesfor energy audits, measure lists andchecklists.www.bess-project.info
Greenhouse gases per tonne of pro-duction have been reduced by 56%in 500 Nestlé factories worldwide(1997-2006).
Index
0
1997
50
100
1998
1999
2000
2001
2002
2003
2004
2005
2006
Countless food and drink companies
have integrated energy and carbon
management into theirdaily business
practices and areachieving impressive
results. The challengelies in helping under-
performing companiesto catch up, while
encouraging front-runners to
further improve theirachievements
“
■ Production volume ■ Greenhouse gases
”

Green energy from dairy production: How the Austrian dairy company Landfrisch powers 1,250 households by innovating its use of wheyIn times of rising climate awareness and soaring energy prices, food and drink manufacturersincreasingly are becoming suppliers of green energy. In July 2006, the Austrian dairy company“Landfrisch” launched Europe's first bio-reactor for the production of bio-gas from sour whey.
The production of cheese generates two products: cheese as the main product and whey as aby-product. In the past, Landfrisch Wels sold the whey fractions to neighbouring pig farmers asvaluable animal feed. With increasing volumes of cheese production, the company started inves-tigating alternative options to valorise their whey.
The plant management opted for the construction of an on-site bio-gas plant and achievedimpressive results: The bio-reactor has a performance of 500 kW in electrical output and 580kW in thermal output. This corresponds to 33% of the total energy needs of the plant.Landfrisch feeds the produced electricity (12,000 kWh/day) directly into the Austrian power grid,thereby supplying 1,250 households with energy, while 100% of the reactor's heat output is re-used internally. The remaining fermentation sludge is composted and used as bio-fertiliser onsurrounding farms. The company anticipates pay-back within four years. In recognition of theexcellent results, in 2006 Landfrisch was named the overall winner of the Austrian Energy Globeaward.
32
The UK Food and Drink IndustryRefrigeration Efficiency Initiative
To help food companies cut energy costs,the UK Food and Drink Federation (FDF)launched the Food and Drink IndustryRefrigeration Efficiency Initiative, a projectsponsored by the Carbon Trust and supported by other food chain players andthe Institute of Refrigeration. The projectdeveloped an energy efficiency guide forindustrial refrigeration systems used in thefood and drink industry. It is based oninvestigations carried out at 30 sites andcovers four specific topics: Reducing heatloads; improving the condenser system;optimising the part load performance; andreducing power used by auxiliary pumpsand fans. The project has identified energyefficiency opportunities leading to CO2reductions of over 25,000 Te CO2.
Refrigeration
Reducing GHG emissions in refrigeration
Hydro Fluoro Carbons (HFCs) are used asrefrigerants in some types of refrigerationsystems, for which currently no viablealternatives exist. If accidentally releasedinto the atmosphere, HFCs contribute toglobal warming. Although HFCs are a verysmall source of GHG emissions in the foodindustry (accounting for around 0.2% of
the sector's emissions), the food industryis gradually moving towards alternativerefrigerants as they become technicallyand economically viable, safe and energyefficient. Where viable alternatives are notyet available, the food industry fully supportsthe objective of the new EU F-gas Regulationto prevent HFC emissions through anadvanced containment regime. This newregulation entered into force in 2007 andis expected to realise significant reductionsof HFC releases.
Shifting to HFC-free solutions in point-of-sale refrigeration
Refrigerants, Naturally! is a multi-stakeholderinitiative launched by The Coca-ColaCompany, Unilever and McDonald's.Today it also includes Carlsberg, PepsiCo andIKEA. Its goal is to promote a shift in point-of-sale cooling technology to alternative HFC-free solutions that protect both the climateand the ozone layer. For this purpose, allmembers develop time-lines and share infor-mation among themselves, as well as withstakeholders. The initiative is supported byGreenpeace and UNEP and officially recognised by the UN as a Partnership forSustainable Development.
Food manufacturing > Energy and Climate Change

33
Appropriate measures divide into short-and long-term strategies :
Short and mid-term strategies for managing a carbon restrained future
Spreading existing best practice across industry
Short and mid-term energy use and carbonreductions will be achievable if existingbest practice on energy management isspread still more widely within the sector.Associations are playing an active role insupporting, sharing and encouraging thespread of best practice, though it is oftenmore difficult for them to reach small andmedium enterprises (SMEs) in the industry.
Long-term strategies for managing a carbonrestrained future
Long-term targets require additionalfocus, R&D, investment and increasedcooperation among all stakeholders,including businesses and public authorities.
R&D and Innovation
Technological developments are expectedto deliver significant GHG savings. Industrywill work closely with authorities to align
research and development (R&D) withindustry's needs and to implement theresults of beneficial R&D. Particular attention must be paid to improving thecommercial competitiveness of emergingtechnologies.
Transformation of energy supply
Long-term GHG reductions in the food and drink sector may require a majortransformation in energy supply, e.g.through the development of renewable andlow-carbon energy sources.
a) Self-generation
An important option to consider isincreased self-generation of low carbonenergy on-site. Due to the agriculturalnature of raw materials used in the foodsector, there is technical potential in several sub-sectors to generate bio-based,carbon-neutral energy from by-productsand waste (e.g. anaerobic digestion).At the same time, these by-products serveimportant alternative purposes along thefood chain, e.g. animal feed. Renewableenergies also include, amongst others,wind turbines and solar heat.
b) Purchasing low carbon energy
The second option is to purchase low carbon electricity from licensed suppliers.
What we do as an industry
■ Awareness raising for energy and carbonmanagement, in particular in SMEs
■ Definition and dissemination of best practices in energy efficiency
■ Facilitate investment in low carbon tech-nology by providing information on existingtechnologies, investment parameters andsaving potentials
■ Constructive cooperation with all relevantEU and national stakeholders, includingparticipation in R&D projects, fundingschemes and private-public partnerships
What support is required from external players?
■ Public authorities and energy agencies tohelp promote energy efficiency at the levelof SMEs (e.g. provision of free energyaudits and other relevant expertise)
■ Financial support schemes to overcomeexisting investment barriers (e.g. CHP)
■ Continued R&D to push innovation
■ Improve the competitiveness (commercialviability) of low-carbon technologies
■ Member states to align national energy mixwith GHG reduction targets
Building onachievementsCountless food and drink companies haveintegrated energy and carbon managementinto their daily business practices and areachieving impressive results. The challengelies in helping under-performing companiesto catch up, while encouraging front-runnersto further improve their achievements.In moving towards sustainable energy andcarbon management, manufacturers oftenface a number of barriers which can besummarised as follows:
Investment barriers
■ Long pay-back periods in a sector usedto short investment cycles
■ Availability of investment funds
■ Lack of commercial competitiveness ofemerging technologies
■ Investment uncertainty
■ Gas and electricity price volatility (e.g. CHP)
Management barriers
■ Integration of energy and carbon issuesat top level. In many sub-sectors, energyaccounts for a low share of overall costs
■ Lack of skilled and informed staff,especially in SMEs, intension/ability gap
Barriers to sharing best practices
■ Best practice sometimes seen as a competitive advantage
Technological barriers
■ Remaining technical insufficiencies ofemerging technologies
Depending on the type and size of a company, its financial and humanresources, and its experience with energyand carbon management, different instru-ments and support schemes are required.
Long-term carbon reduction targets requireintensified efforts among business, authorities
and the research community to align R&D withindustry's needs and to foster the economic
competitiveness of emerging technologies
“”

WaterConserving the source of life
4
THE ISSUEAccess to water is critical for the foodand drink industry, both in terms ofquantity and quality. Clean water isnot only a prerequisite for agriculturalsustainability; it is also an importantproduct in its own right, a main ingre-dient and key processing element. Thechallenge for the food and drinkindustry in terms of water use istwofold :
34
■ Continuously reduce levels of waterconsumption in its processes byimproving water efficiency withoutcompromising strict food hygienerequirements.
■ Promote the responsible use of waterand maintain sustainable water sup-plies throughout the food chain,including agriculture.
> > > >

The challengeIn the food and drink sector, water servesthree key functions :
1. The highest volume of water in the foodchain is used in agriculture, representingaround 70% of global fresh water consumption and around 37% of wateruse in Europe (EU-27).
2. In food and drink manufacturing, wateris both a product and a main ingredient(for bottled water, non-alcoholic andalcoholic drinks, etc.).
3. Water is also an indispensable elementin many food-processing steps, such as washing, boiling, steaming, cooling andcleaning. In all food sub-sectors, waterplays a crucial role in guaranteeingstrictest hygiene standards.
Available data on the food and drink industry's water use is incomplete and notalways consistent. The breakdown of waterconsumption between the various sub-sectors varies considerably from oneregion to another, depending on naturalconditions and economic and demographicstructures. Data from the EEA (EuropeanEnvironment Agency)4 shows that in 2001,industry as a whole accounted for slightlyless than 12% of overall water use inEurope. Estimates from various nationalfood and drink industry federations suggestthat, at present, the food and drink manufacturing industry is responsible for a
share of between 8% and 15% of totalindustrial water use. If this share wasapplied uniformly to the EU level, totalwater use in the food manufacturing sectorwould represent between 1% to 1.8% ofoverall water use in Europe.
Food and drink industryinitiativesReducing water consumptionin our own operations
Concrete action to improve water efficiencyat factory level falls into two categories :behavioural changes (best managementpractice) and investment in water-efficienttechnology.
a) Behavioural changes - best practiceBehavioural change is “the low hangingfruit” for water-efficiency. It incurs limitedcosts yet can save substantial amounts of
35
water. Behavioural improvements cover avariety of initiatives, which require specificstaff training and communication tools.They include: developing water consump-tion monitoring tools, modifying cleaningand housekeeping routines; increasingstaff awareness; identifying and repairingleaks promptly; using sensor-controlledtaps and auto-flush toilets or using hand-controlled triggers on hoses.
To give one example, FEVIA, the Belgianfood and drink industry federation,developed a “Vademecum for use of waterin the food and drink sector” to broadenand encourage good water managementpractices, in particular in small and mediumenterprises (SMEs).
Behavioural change is ‘the low hanging
fruit’ for water-efficiency. It incurs
limited costs yet can savesubstantial amounts of
water. Investment in cut-ting-edge technology is a
more capital-intensive, but important long-term
element in water use reduction
“Total water consumption in Europe by sectors(Above pie EU-27+ Switzerland, Norway, Turkey;source EEA; bottom pie: F&D industry sharebased on data from the UK, BE, NL) 4
Energy 32.5%
Urban 18.2%
Industry 11.8%
Food & drink industry
(1.8% of overall water use in the EU)
Industry - Others
Agriculture 37.5%
”

36
FEVIA : Water use efficiencyin the cleaning process
Improving water efficiency in cleaning isone of the management practices includedin the FEVIA handbook. Cleaning processesallow frequent eco-efficiency improvementswith only limited costs. Notable examplesare prior dry cleaning and the adjustmentof water hoses.
■ Prior dry cleaning is a measure that hasan impact both on discharge and onwater consumption. The elimination ofdirt particles improves the efficiency ofsubsequent cleaning, for example withfoam. In fact, foam does not work effi-ciently when, for example, fat particlesremain on the floor surface.
■ The adjustment of water hoses is ameasure that yields significant watersavings. Cleaning is sometimes carriedout using strengthened fire hoses thatcan easily consume 40 litres of waterper minute whereas a rate of around 10litres per minute is sufficient in manycases.
Sugar industry: Re-using thewater content of sugar beet
One of the objectives of the Europeansugar industry is to keep fresh water consumption at an absolute minimum.To achieve this goal, a number of differentmeasures are applied. The most importantsource of water in the factories is thesugar beet itself. It contains about 75%water, most of which is turned into steamduring the production process, and thencondensed. This condensate is used forbeet transport and washing water, as wellas for extraction and crystallisation. Waterfrom pressing the exhausted pulp is alsorecycled. This means that sugar factoriesnot only keep fresh water consumption toa minimum but also avoid producingwastewater from the pulp pressing.
Water efficiency in small andmedium enterprises (SMEs)
Continuous technological improvementsare also made in SMEs, as is the case inthe brewing sector :
■ Brewery Liefmans : In the past, waterused for cooling flasks (after pasteurisa-tion) was drained to the purificationinstallation. Now, a cooling tower hasbeen installed, which cools the waterand allows recuperation. Water usage inthe pasteurisation unit has decreasedfrom 5.5 m3/hour to 3.5 m3/hour,corresponding to a water saving of 20%of total usage.
■ Brewery Timmermans : By closing thewater tap on the bottle washer a littlemore, the water usage of this device wasreduced from 44m3/day to 35 m3/day,without loss of efficiency. Water savings of5% of total usage were achieved.
b) Investment in water-efficient technologyInvestment in new technology is a morecapital-intensive element in reducing wateruse. For instance, figures from the Frenchfood and drink industry federation ANIAshow that investment in water-efficienttechnologies constitutes by far the largestshare of the sector's environment-relatedinvestment in France. Wherever hygienerequirements allow it, technologies forwater re-use and recycling are implemented.For example, innovative processes havebeen developed to replace freshwaterintake with water recovered during the production process, and to recycle suitablewater streams for irrigation purposes aroundfactories. Maximisation of condensaterecovery from the steam distribution systems has also been investigated andimplemented.
Shares of food and drink industry investmentsin environmental protection measures inFrance in 2003
Protecting water supplies outside food and drink factories
In addition to water eco-efficiency withintheir own operations, many food and drinkcompanies are engaged in initiatives toprotect water source areas. This helps tomaintain sustainable water supplies, bothin terms of quality and quantity.
Food manufacturing > Water
Water 67%
Solid waste 12%
Landscape and biodiversity 1%
Noise 1%Soil and ground water 7%
Air and climate
12%

37
While food and drink manufacturers are
realising continuouswater savings, there are
technical limits, and a certain level of fresh
water will always remain necessary to
ensure compliance withstrict EU food hygiene
standards
“Danone's water source area protection
As the operator of 72 natural springs around the world, Danone applies rigorous standards thatare set down in its charter for the protection of underground water resources. The charter's firstprinciple states that Danone must never use more water than each spring naturally produces. Thesecond principle requires Danone to cooperate with farmers, communities and other local stake-holders to draw up guidelines for sustainable management. A local manager is appointed to over-see operations at each spring in partnership with local communities and participants in the localeconomy. In 2005, Danone contributed to the renovation of the entire waste water system forthe communities around Évian and helped hire forest rangers to prevent fires in catchmentareas in Spain. Internationally, Danone is an active partner in the Ramsar Convention for the protection of wetlands, which play a key role in the eco-system by filtering rainwater and replen-ishing water tables.
Source: EEA
■ Public water ■ Ground water
■ Surface water ■ Others
Overall achievementsOfficial data show that total water consumption in Europe by industry in general has decreased consistently since1990 5. Although the extreme diversity ofthe food and drink sector makes it difficultto gather complete data on its EU-widecross-sector water consumption, reliable datafrom individual food and drink companies,national federations and sub-sector federa-tions indicate a comparable trend in wateruse reduction over the past decade.
Example 1 :Belgian food and drink industry
Between 1999-2001, the Belgian food anddrink industry reduced its specific waterconsumption (per tonne of products) by 14%and its absolute water consumption by 12%.
60000
50000
40000
30000
20000
10000
01990 1995 1996 1997 1998 1999 2000 2001
Water use of total Industry in EU-27 (Hm3)
8
6
4
2
0
Specific water consumption in Belgianfood and drink industry (per tonne ofproduction)
1999 2000 2001
m3/t
7,556,63 6,48
Example 2 :UK brewing sector
Between 1976 and 2004, members of the British Beer and Pub Association,representing more than 98% of beerbrewed in the UK, reduced their specificwater consumption (per hectolitre brewed)by 43%.
Specific water consumption(hectolitre per hectolitre brewed)
Specific consumption hl/hl
40000
30000
20000
10000
0
80000
70000
60000
50000
Water consumption in Belgian food &drink industry (quantity and origin)
1999 2000 2001
1000 m3
8
7
6
10
9
5
4
3
2
0
1976
1978
1980
1982
1984
1986
1988
1990
1992
1994
1996
1998
2000
2002
2004
➜
➜
➜
➜
-43%
”
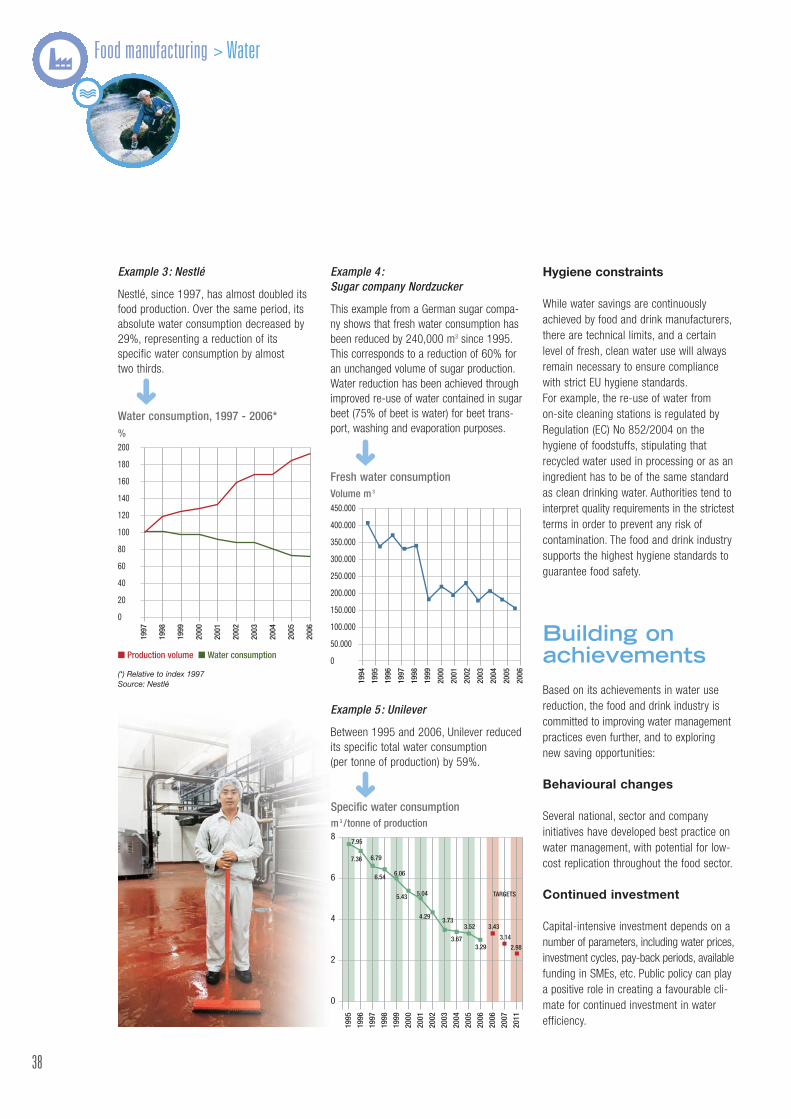
38
Water consumption, 1997 - 2006*
160
140
120
200
180
100
80
60
40
20
0
1997
■ Production volume ■ Water consumption
%
1998
1999
2000
2001
2002
2003
2004
2005
2006
Example 3 : Nestlé
Nestlé, since 1997, has almost doubled itsfood production. Over the same period, itsabsolute water consumption decreased by29%, representing a reduction of its specific water consumption by almost two thirds.
(*) Relative to index 1997Source: Nestlé
Fresh water consumption
400.000
350.000
300.000
450.000
250.000
200.000
150.000
100.000
50.000
0
1994
Volume m 3
1995
1996
1997
1998
1999
2000
2001
2002
2003
2004
2005
2006
Example 4 :Sugar company Nordzucker
This example from a German sugar compa-ny shows that fresh water consumption hasbeen reduced by 240,000 m3 since 1995.This corresponds to a reduction of 60% foran unchanged volume of sugar production.Water reduction has been achieved throughimproved re-use of water contained in sugarbeet (75% of beet is water) for beet trans-port, washing and evaporation purposes.
Example 5 : Unilever
Between 1995 and 2006, Unilever reducedits specific total water consumption (per tonne of production) by 59%.
0
1995
2
4
6
8
1996
1997
1998
1999
2000
2001
2002
2003
2004
2005
2006
2006
2007
2011
m 3 /tonne of production
Specific water consumption
TARGETS
7.95
7.36 6.79
6.54 6.06
5.43 5.04
4.29 3.73
3.67
3.52
3.29
3.43
3.14
2.98
Hygiene constraints
While water savings are continuouslyachieved by food and drink manufacturers,there are technical limits, and a certainlevel of fresh, clean water use will alwaysremain necessary to ensure compliancewith strict EU hygiene standards.For example, the re-use of water from on-site cleaning stations is regulated byRegulation (EC) No 852/2004 on thehygiene of foodstuffs, stipulating that recycled water used in processing or as aningredient has to be of the same standardas clean drinking water. Authorities tend tointerpret quality requirements in the strictestterms in order to prevent any risk of contamination. The food and drink industrysupports the highest hygiene standards toguarantee food safety.
Building onachievementsBased on its achievements in water usereduction, the food and drink industry iscommitted to improving water managementpractices even further, and to exploringnew saving opportunities:
Behavioural changes
Several national, sector and company initiatives have developed best practice onwater management, with potential for low-cost replication throughout the food sector.
Continued investment
Capital-intensive investment depends on anumber of parameters, including water prices,investment cycles, pay-back periods, availablefunding in SMEs, etc. Public policy can playa positive role in creating a favourable cli-mate for continued investment in waterefficiency.
➜
➜➜
Food manufacturing > Water

39
Working with the food chain
In particular, large food and drink companieshave proved their ability to reach out toother partners in the food chain in order toreduce water consumption throughout thefood production system.
Working internationally
Large multi-national companies are increasingly playing a positive role in promoting sustainable water use and watergovernance worldwide.
Unilever's work with farmers
Water is one of 11 sustainable agricultureindicators at Unilever. The company isworking with growers to reduce theirwater impacts through methods such asdrip-irrigation. For example, in 2006, thecompany ran training programmes forfarmers in Italy on best practice in spinachirrigation. Initial results are promising on bothwater use and the energy required to pumpthe water. In Greece, almost all Unilever'stomato growers now use drip-irrigation.
Unilever's engagement withexternal stakeholders
Unilever continues its involvement inWater and Sanitation for the Urban Poor(WSUP), a partnership between the private, public and civil society sectors.WSUP seeks to demonstrate newapproaches to meeting the water, sanita-tion and hygiene needs of low-incomeconsumers in urban areas, particularly indeveloping and emerging markets.
The “CEO Water Mandate”: A business leader initiative inpartnership with the globalcommunity
This initiative grew out of a partnershipbetween the United Nations GlobalCompact, the Government of Sweden anda group of committed companies, includ-ing The Coca Cola Company and Nestlé,and specialist organisations dealing withproblems of water scarcity. The CEO WaterMandate seeks to engage a critical massof companies from around the world, will-ing to undertake serious efforts, in part-nership with other stakeholders, toaddress the emerging global water crisis.Whenever possible, this initiative coordi-nates efforts and works with existingwater programmes - both global and local- in order to maximise impact.www.regeringen.se/content/1/c6/08/54/73/1d280de2.pdf
The World Business Councilfor Sustainable Development(WBCSD) water scenariosproject
The World Business Council forSustainable Development brings togethercompanies from a wide range of industryand service sectors, including food anddrink companies like PepsiCo, Procter &Gamble and Unilever. It has developed the“Water Scenarios to 2025” project toidentify strategies for businesses to contribute to sustainable water manage-ment. In August 2007, the Water WorkingGroup launched its 'Global Water Tool', afree and easy-to-use tool for organisationsto map their water use and assess risksrelative to their global operations and supply chain.
Nestlé project “WET”
Water Education for Teachers (WET) is anon-profit organisation, providing educa-tion resources which facilitate and promoteawareness, appreciation, knowledge, andstewardship of water resources. Launchedin the United States in 1984 and conti-nuously sponsored by Nestlé Waters since1992, Project WET workshops and programmes have trained over 400,000teachers, reaching several million childrenin over 20 countries (including France,Hungary, Italy and Ukraine).
Water education for future generations
The food and drink industry believes thateducation is an essential element in chang-ing habits and increasing water conscien-tiousness. Food and drink companies areinvolved in many education programmes.
Action fromother stake-holders■ Sustainable water management along the
food chain requires shared responsibilityfrom agriculture, industry, consumers andpublic authorities.
■ Specifically, to encourage water savingsin all economic sectors, water pricesshould reflect real costs in line with theEU Water Framework Directive.
■ At the national level, attention should bepaid to the proper implementation ofwater legislation in all sectors in order toensure high water quality and quantity.
■ Best agricultural practices need to inte-grate water preservation as a key com-ponent.
■ EU and national policies should supportefficient water management and technology in all economic sectors.

> > > >
PackagingProtecting what’s inside
5
THE ISSUE■ As major user of packaging, the
food and drink industry recog-nises its responsibility to reducethe environmental impacts ofpackaging along the life-cycle.
■ At the same time, packaging isessential to ensure productquality and food safety. Byavoiding food waste, packagingalso protects the environment(e.g. transport, extended shelf life).
40
■ Sociological trends (e.g. moresingle households) are drivingsignificant changes in thedemand for packaging, whichoften counter-balance techno-logical improvements in packag-ing waste prevention.
■ The main challenge lies in thereduction of packaging materialswithout compromising foodquality, safety and consumerneeds, while ensuring soundrecovery and recycling of pack-aging waste.
■ Despite growing packaging con-sumption, packaging waste sentfor final disposal fell by morethan 20% between 1997 and2004.
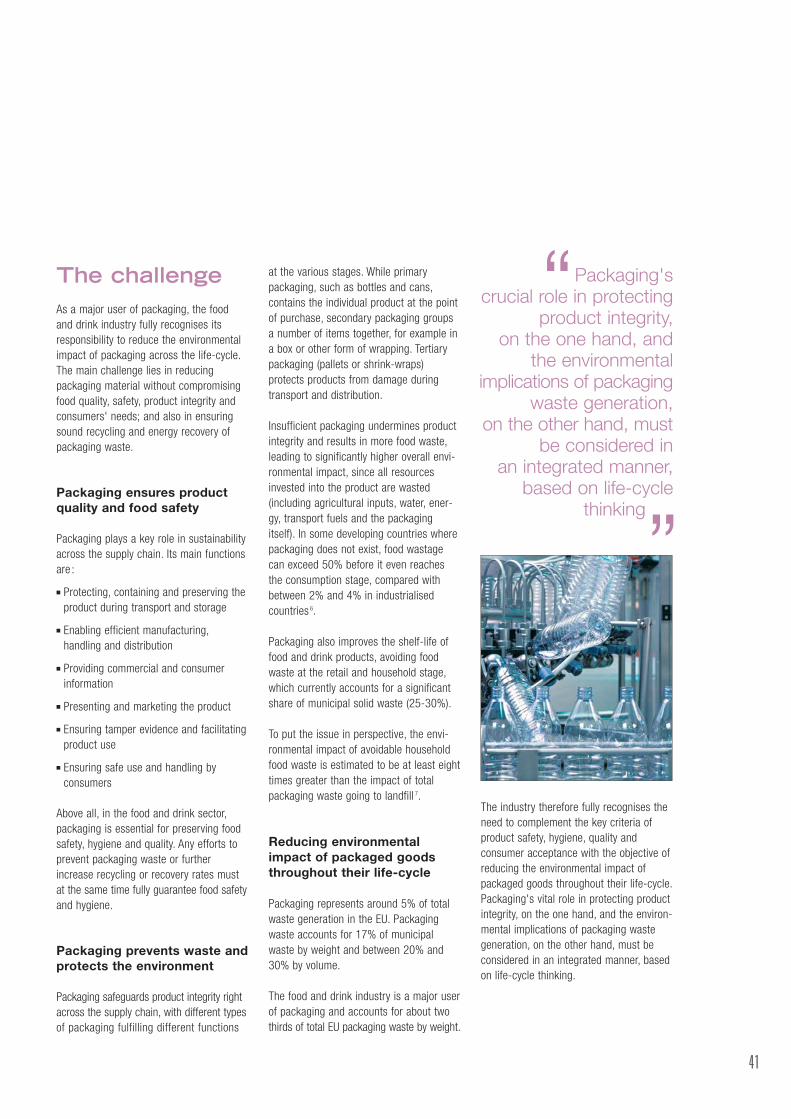
The challengeAs a major user of packaging, the food and drink industry fully recognises itsresponsibility to reduce the environmentalimpact of packaging across the life-cycle.The main challenge lies in reducing packaging material without compromisingfood quality, safety, product integrity andconsumers' needs; and also in ensuringsound recycling and energy recovery ofpackaging waste.
Packaging ensures productquality and food safety
Packaging plays a key role in sustainabilityacross the supply chain. Its main functionsare :
■ Protecting, containing and preserving theproduct during transport and storage
■ Enabling efficient manufacturing,handling and distribution
■ Providing commercial and consumerinformation
■ Presenting and marketing the product
■ Ensuring tamper evidence and facilitatingproduct use
■ Ensuring safe use and handling by consumers
Above all, in the food and drink sector,packaging is essential for preserving foodsafety, hygiene and quality. Any efforts toprevent packaging waste or furtherincrease recycling or recovery rates mustat the same time fully guarantee food safetyand hygiene.
Packaging prevents waste andprotects the environment
Packaging safeguards product integrity rightacross the supply chain, with different typesof packaging fulfilling different functions
at the various stages. While primary packaging, such as bottles and cans,contains the individual product at the pointof purchase, secondary packaging groupsa number of items together, for example ina box or other form of wrapping. Tertiarypackaging (pallets or shrink-wraps) protects products from damage duringtransport and distribution.
Insufficient packaging undermines productintegrity and results in more food waste,leading to significantly higher overall envi-ronmental impact, since all resourcesinvested into the product are wasted(including agricultural inputs, water, ener-gy, transport fuels and the packagingitself). In some developing countries wherepackaging does not exist, food wastagecan exceed 50% before it even reachesthe consumption stage, compared withbetween 2% and 4% in industrialisedcountries 6.
Packaging also improves the shelf-life offood and drink products, avoiding foodwaste at the retail and household stage,which currently accounts for a significantshare of municipal solid waste (25-30%).
To put the issue in perspective, the envi-ronmental impact of avoidable householdfood waste is estimated to be at least eighttimes greater than the impact of totalpackaging waste going to landfill 7.
Reducing environmentalimpact of packaged goodsthroughout their life-cycle
Packaging represents around 5% of totalwaste generation in the EU. Packagingwaste accounts for 17% of municipalwaste by weight and between 20% and30% by volume.
The food and drink industry is a major userof packaging and accounts for about twothirds of total EU packaging waste by weight.
41
The industry therefore fully recognises theneed to complement the key criteria ofproduct safety, hygiene, quality and consumer acceptance with the objective ofreducing the environmental impact ofpackaged goods throughout their life-cycle.Packaging's vital role in protecting productintegrity, on the one hand, and the environ-mental implications of packaging wastegeneration, on the other hand, must beconsidered in an integrated manner, basedon life-cycle thinking.
Packaging's crucial role in protecting
product integrity, on the one hand, and
the environmental implications of packaging
waste generation, on the other hand, must
be considered in an integrated manner,
based on life-cyclethinking
“
”

➜
New life-styles and demographic structures
are driving importantchanges in the demand
for different products andpackaging types. The
food and drink industry isresponding to changing
consumers' needs and isadjusting its products andpackaging accordingly
”
“Sociological and demographictrends strongly influencepackaging
In addition to quality and safety requirements,new European life-styles and demographicstructures, which lie outside the influence ofthe food industry, are driving importantchanges in the demand for different productsand packaging types. The food and drinkindustry has an important responsibility toserve consumers' needs, and must thereforetake these changes into account and adjustproducts and packaging accordingly.
For example, most EU countries have a growing number of single person households.In Germany, for instance, 35.4% of peoplelive alone (32.6% of households compriseonly two people). This trend results inincreased waste volumes per household,including packaging waste (see graph below).
At the same time, portion sizes tailored tothe needs of single person households canplay a crucial role in reducing food waste.The impact of increased packaging isthereby usually far out-weighed by theenvironmental benefits of preventing theloss of all resources invested in the foodproduct over its life-cycle.
Other sociological trends with relevance topackaging include better understanding andawareness of dietary and health issuesamong EU consumers. In this context, smallerportion sizes are one of several measuresin the broader strategy to fight obesity.
Major industry achievements ata glanceAll recovery and recycling targetshave been met
In 2002, all EU recovery and recycling targets applicable to EU-15 have beenachieved. Specifically, out of a total of 66 million tonnes of packaging waste,around 36 million tonnes (54%) wererecycled. Compared with 1997, this is anincrease of 9 million tonnes and anincrease in the recycling rate of 8%(Source: European Commission).
Packaging waste recycling andrecovery have led to positiveenvironmental effects
Significant greenhouse gas savings havebeen achieved amounting to around 25 million tonnes of CO2 equivalent.Resource savings total around 10 milliontonnes of oil equivalent. This correspondsto around 0.6% of total EU-15 greenhousegas emissions in 2002, or between a thirdand a half of total greenhouse gas emis-sions of countries like Denmark, Ireland orSweden (Source: European Commission).
20% reduction in packagingwaste sent for final disposal
Although packaging consumption in theEU is growing, packaging waste sent forfinal disposal fell by nearly 10% between1997 and 2001 and by nearly 12%between 2001 and 2004 - an overallreduction of more than 20% (Source:http://ec.europa.eu/environment/waste/packaging/data.htm). Both achievementswere due to the significant contribution ofindustry to the efficient functioning ofnational recovery and recycling schemes.Whereas the volume of packaging placedon the market is typically rising with grow-ing GDP (although less markedly), efficientrecycling and recovery ensure thatembedded materials and energy find use-ful new applications within the economiccycle, thereby replacing virgin raw materi-als and resulting in lower environmentalimpacts.
42
The volume of waste per person
Food manufacturing > Packaging
Food and drink industryinitiativesIt is a priority for the food and drink indus-try continuously to improve the environ-mental performance of packaging acrossthe life-cycle. The industry has implement-ed a wide range of measures and initia-tives to promote responsible packagingmanagement including source reduction,re-use, recycling and recovery.
11 kg
kg/week
kg/week
Packaging food/non-food
■ Other waste■ Kitchen waste
■ Paper■ Plastic
■ Glass■ Metal
In a single-person household
In a family-of-four household
4 kg
Packagingfood/non-food
A single person living alone produces more wastethan a person living in a family-of-four household.
Source: INCPEN, Great Britain

Packaging waste recycling and recovery
in the EU have led topositive environmental
effects. Significantgreenhouse gas
savings have beenachieved amounting to
around 25 milliontonnes of CO2
equivalent. Resourcesavings total around
10 million tonnes of oilequivalent
(European Commission, 2006)
43
“
Kraft - Eco ToolboxIn its effort to minimise product-packaging impacts, Kraft developed environmental designguidelines - Kraft Eco-Toolbox - to incorporate sustainability into every packaging design.Eco-Toolbox promotes weight minimisation and the use of materials that can be recovered afteruse through recycling, composting or conversion to energy. In addition, the guidelines encouragethe maximum use of recycled material in product packaging, subject to applicable regulatoryrequirements and the need to ensure product safety. As an example Kraft analysed existing packaging and came up with single layer packaging for Milka chocolate bars. The change inwrapping cut packaging volume by 58%.
Coca-ColaPackaging material reduction: Aluminium cans (12oz/355 ml), glass contour bottles (8oz) andPET bottles (2L) used today have been reduced by 33%, 57%, and 32% respectively, since theiroriginal introduction. In 2005, the use of cutting-edge Ultra Glass technology eliminated theneed for approximately 52,000 tons of glass globally - a CO2 reduction equivalent to planting8,000 acres of trees. Coca-Cola also reduced global PET use by more than 10,000 tons viamanufacturing and package redesign efforts.
Decoupling between growth in GDP and packaging waste sent for final disposal between 1997 and 2004 (EU-15)
130
120
110
100
90
80
70
60
50
401997
+16,2%
-20%
2004
Index = 1997
■ GDP ■ Packaging waste sent for final disposal
In the following paragraphs, the efforts andachievements of the industry are explainedin detail.
Packaging source reduction
The food and drink industry is workingintensively to limit packaging volume andweight to the level necessary to maintainthe required levels of safety, hygiene andacceptance of the packed product by theconsumer. Industry efforts cover a range ofdifferent initiatives that span production,marketing, distribution, utilisation and dis-posal stages. They include :
■ Redesigning packaging to minimise useof materials
■ Reducing secondary and tertiary packaging
■ Using different packaging materials tominimise the number of types used andto optimise combinations
■ Using lighter material
■ Distributing products in bulk, where practicable and without prejudice to foodsafety
■ Using packaging eco-design
■ Rationalising product ranges to reducepackaging
■ Using recycled and recyclable packagingmaterials
”

NestléNestlé is committed to reducing the environmental impact of packaging, withoutjeopardising the safety and quality of itsproducts. The company aims to developsafe and high-quality packaged foodsusing the most efficient and appropriatepackaging available, while at the sametime satisfying consumer requirementsand expectations. As an example, Nestléreduced the weight of packaging materialused per litre of bottled water by 26%between 2002 and 2006.
UnileverBy eliminating an outer carton fromUnilever`s Knorr vegetable mix and creatinga new shipping and display box, the company halved the packaging, resultingin 280 fewer pallets and six fewer trucksa year to transport the same quantity.Unilever is also working on other designchanges and light-weighting. For instance,in The Netherlands, Calvé peanut butterjar packaging has been reduced by 23%through a combination of light-weightingand design change.
44
To improve the environmental performanceof packaging, the full life-cycle of packaged products has to be taken intoaccount. This life-cycle approach helps toidentify the most favourable environmentalpackaging solution. A minimum of packagingis crucial to protect the product from damage and contamination during transport,distribution, storage and consumption.Insufficient packaging leads to more foodwaste, resulting in significantly higher environmental impact. In addition, less primary packaging often requires moretransport packaging to avoid product damage, which can lead to higher ratherthan lower environmental impact.
* Nestlé Waters - 2006 figure estimated. Source: Nestlé** In 2008, when compared to the relative amount used
in 2002
-26% 354thousand tonnes
saved**
60%
50%
40%
30%
20%
10%
0%2002 2003 2004 2005 2006
62,7
52,6 51,148,8
46,3
Grammes of packaging material usedper litre of bottled water, 2002 - 2006*
Biscuit packaging
5 MJ/kg
4
3
2
1
95,1g
■ Sales Packaging - Cardbox*
■ Transport Packaging - Shrink film
Solution 195,1 g/kg biscuits
4,4 MJ/kg
Old version2,0g
93,1g
* Cardboard carton 83,8g + plastic mg 9,3g
5 MJ/kg
4
3
2
1
103,4g
■ Sales Packaging - Plastic bag*
■ Transport Packaging - Corrugated board box
Solution 1103,4 g/kg
biscuits
5,4 MJ/kg
New version87,1g
16,3g
Source: Packforsk, Sweden
➜
A food company tried to reduce the weightof its biscuit packaging. The biscuits wereoriginally packed in a thin plastic bag and a cardboard box. The total weight ofthe primary package per kg/biscuits was93.1g. The energy expenditure of packagingwas 4.2MJ per kg/biscuits.A shrink film with 2.0g weight/kg and0.2MJ energy expenditure/kg was adequatefor transport packaging. To achieve reduction at source and produce a lighterpackage, the film and carton system wasreplaced with a stronger plastic bag.The total weight of the primary packagewas now only 16.3g/kg biscuits.
Limits to packaging weight reduction for biscuits
At 1.3MJ/kg the energy expenditure wasalso much lower. However, this packagingrequired stronger transport packaging - a corrugated board box instead of shrinkfilm. As a result, the total weight of thecombination of consumer and transportpackaging rose to 103.4g/kg biscuitsinstead of the original 95.1g. The totalenergy expenditure rose to a total of5.4MJ/kg. In addition, there was a higherenergy loss due to increased productwastage.
Source: Pro Europe, Effective Packaging Effective Prevention, 2004 Brochure (For more information see http://www.pro-e.org/)
Food manufacturing > Packaging

In 2002, all packaging and recycling targets underEU waste legislation applicable to EU-15 have
been achieved. Since then, recycling and recov-ery has further intensified. Several EU MemberStates had already reached the new targets for
2008 by 2005. Industry's contribution to the effi-cient functioning of packaging recovery schemes
has been vital in achieving this success
45
“
Recycling and recovery
In order to meet national and EU legislation,industry (with the support of authorities)has developed and financed packagingrecovery schemes, which take over thetake-back and recovery obligations underEU legislation. Considerable amounts oftime, effort and money have been investedby industry to ensure the efficient function-ing of these national schemes and toencourage consumer awareness. The foodand drink industry is the main contributor topackaging and recovery schemes acrossEurope. Recovery and recycling schemes,many of which are using the Green Dotsymbol, have been set up in 23 EU MemberStates and have proven highly successful inachieving impressive recycling and recoveryrates. In 2005 more than 14.7 milliontonnes of used packaging were recoveredand recycled by these schemes in Europe.
In 2002, all the targets of the Packaging & Packaging Waste Directive (PPWD) applicable to EU-15 have been achieved.Out of the 66 million tonnes of packagingwaste, around 36 million tonnes (or 54%)were recycled in 2002. Compared with1997, this is an increase of 9 milliontonnes and an uplift in the recycling rate of8%. Moreover, recycling and recovery hasbeen further intensified since 2002.By 2005, recovery in the EU-25 reached67%, and recycling reached 55%. In addi-tion, several EU Member States had alreadyreached their recycling and recovery targets for 2008 by 2005, pushing theaverage recovery rate within the EU-12 upto 75%. These results are clearly an indi-cator of excellent progress in terms ofresource efficiency.
■ Target 2001 (for EU-12*)
■ Target 2008 (for EU-12*)
■ Achieved rates 2002 (EU-12*)
■ Achieved rates 2005 (EU-12)
■ Achieved rates 2005 (EU-23**)
(*) EU-12 stands for EU-15 minus Greece Ireland and Portugal. Average of individual Member States' results(**) EU-23 stands for EU-25 minus Malta and Slovakia for which data is not available. Average of individual Member
States' resultsSource: European Commission
60%
50%
40%
80%
70%
30%
20%
10%
0%
Achieved recycling and recovery rates (2002, 2005) against targets for 2001 and 2008under EU packaging law
Recovery Recycling
FOST Plus Belgium Packaging recovery organisations, such as Green Dot schemes, have proven highly successful inachieving impressive recycling and recovery rates. In 2006, the Belgian scheme FOST Plus, forexample, achieved a recycling rate of more than 90%.
Treatment of household packaging (in relation to the overall market)
90%
80%
100%
70%
60%
50%
40%
30%
20%
10%
0%
1995
1996
1997
1998
1999
2000
2001
2002
2003
2004
2005
2006
■ Recycling ■ Incineration with energy recovery■ Disposal without recovery
Tonnage %
Food 31.7%
Others 17.7%
Drinks 44.5 %
Cleaning & maintenance 3.1 %
Hygiene & beauty 3.0 %
Tonnage per group of products
➜ ➜
50%
67%60%
75%
67%
25%
56% 55% 55%58%
Achi
eved
rate
s 20
02 (E
U-12
)
Targ
et 2
001
Targ
et 2
001
Targ
et 2
008
Targ
et 2
008
Achi
eved
rate
s 20
05 (E
U-12
)
Achi
eved
rate
s 20
05 (E
U-23
)
Achi
eved
rate
s 20
05 (E
U-23
)
Achi
eved
rate
s 20
05 (E
U-12
)
Achi
eved
rate
s 20
02 (E
U-12
)
”
Kellogg: Recycled material in cereal cartons Before Kellogg's even had an official environmental policy, the company usedsafe, efficient and environmentally soundmanufacturing methods. In fact, the firstbox that rolled off Kellogg's productionline was made of completely recycledmaterial. Today, over 90% of Kellogg'spackaging is made from recycled material.Kellogg's is continually looking at ways to minimise the packaging needed for itsproducts. Because of the company's historic use of recycled fibre, Kellogg'spackaging includes the recycling symbol to communicate its environmental commitment.
Energy recovery from plastics (Source : Plastics Europe)
■ In 2005, 29% (i.e. 6.4 million tonnes) of the post-consumer plastics wastewas recovered as energy in the EU-25 + Norway and Switzerland, up 3%points on 2004.
■ An important part of plastics recovery is from packaging applications and municipal incinerators which remain themost common form of energy recovery.
46
factors, such as transport distances andreturn rates which affect the number ofuses. For long distance trips, recyclablepackaging is generally a better environ-mental option due to reduced fuel use andCO2 emissions. A 2003 study assessingthe environmental, economic and socialcosts of different beverage containersfound that the internal costs of re-usablepackaging (in particular for deposit management) were considerably higherthan those of recyclable packaging 8.The difference more than off-set any lowerenvironmental impact of re-usable packagingfor short trips. There is therefore no generally preferable system between thesetwo types of packaging systems.
Building onachievementsSustainable packaging solutions require acontinuous improvement process, withinnovative research and development(R&D) in areas such as source reduction,light-weighting and design, packagingmaterial, optimising recyclability andrecoverability, and many others. Promotinga sense of responsibility plays a crucialrole in ensuring sustainable packagingmanagement. This applies to everyoneinvolved throughout the supply chain,including consumers.
integrity, food safety and quality, but alsoconsumer acceptance and reduced environmental impacts, it is essential thatindustry can draw on the full scope ofavailable packaging types and materials toidentify the option offering the best overallperformance under given circumstances.Continued R&D and eco-innovation istherefore required for all different packagingtypes and materials. There is no singlesolution.
One interesting option, among many others, is to explore the technical potentialof packaging made from renewable rawmaterials and to assess its overall environ-mental, social and economic performance.The use of these materials for packagingof food and drink products is particularlychallenging due to a number of specialdemands, such as permeability, as well asmechanical properties and safety issues.
R&D, eco-innovation andpackaging choice
The food and drink industry is workingcontinuously with packaging material suppliers and converters, as well as otherfood chain partners, to develop innovativepackaging solutions with reduced environ-mental impact. Further technical researchand innovation are vital to overcome existingtechnical barriers. In order to ensure thatnew packaging innovations meet all relevantcriteria, including the protection of product
Energy recovery
Energy recovery from packaging waste constitutes another important treatmentoption, depending on the packaging materialand local circumstances. In particular,plastics contain a high energy content,which can be efficiently recovered in specialised installations.
Re-use
The food and drink industry makes use ofre-usable packaging wherever it is themost sensible solution. 20% of food anddrink packaging is re-useable. The overallenvironmental performance of re-useablepackaging is dependent on a number of
Food manufacturing > Packaging

47
Action from other stakeholders
Consumers
Industry, retailers, consumer organisationsand authorities share the responsibility towork together to raise consumer aware-ness and understanding of packagingreduction and recovery. Everyone mustplay their part in developing practical solu-tions to make it easier for consumers tocontribute to re-use, recycling and recov-ery on a daily basis.
Internal market
The objective of ensuring environmentallyresponsible packaging management needsto be promoted in parallel with the objec-tive of safe-guarding the proper functioningof the internal market. Therefore, MemberStates should not be allowed to introducediscriminatory national packaging meas-ures, such as mandatory deposit systemsand eco-taxes, which are not justified onenvironmental grounds and which hamperthe proper functioning of the internal mar-ket and distort competition.
The food and drinkindustry is working con-tinuously with packaging
material suppliers andconverters to developinnovative packaging
solutions that contributeto improved sustainability.
To this end, industrymust be able to draw onthe full scope of available
packaging types andmaterials in order to
identify the option offering the best overall
performance under given circumstances
“Nestlé: Packaging madefrom renewable resourcesWith the launch of new packaging forNestlé Dairy Box and Black Magic in theUK in 2005, Nestlé has pioneered a newtechnology in Europe. The trays of bothproducts have been made from renewableresources (maize starch) and provide thesame level of safety and quality as the oldtrays, which were made from crude oil.Furthermore, the new trays require about50% less energy along their entire life-cycle, from raw material production andtransformation into packaging materialthrough to disposal. They are bio-degrad-able and also dissolve in water. NestléDairy Box won the Environmental categoryat the UK Packaging Awards 2006. Due totechnical difficulties with the packaging,however, the new packaging had to bereplaced temporarily with PET trays.Nestlé is nevertheless determined to reintroduce the trays again, as soon aspossible. Nestlé's worldwide R&D networkis following developments in this techno-logical area and is duly considering furtherrelevant uses for this new type of packaging.
Recovery and RecyclingSchemes
National recovery and recycling schemesfor packaging waste have proven highlysuccessful in achieving impressive recy-cling and recovery rates, and will play akey role in future packaging waste ma-nagement. A key challenge lies in thetranslation of successful concepts fromexperienced Member States to all otherMember States. Through mutual learningprocesses and stimulation, the aim is toensure resource-efficient packaging wastemanagement across all 27 EU MemberStates.
”

Transport & distributionMoving to sustainable connections
6
THE ISSUE■ Transport impact is overwhelm-
ingly in the areas of road conges-tion, damage to infrastructureand road accidents. There arealso impacts on greenhouse gasemissions, air and noise pollu-tion.
■ Following the general trend, thefood and drink industry has expe-rienced an increase in transportoperations over the past decades.This is driven by structuralchanges affecting global supplychains, including a shift towardsfewer, more efficient productionplants and distribution centres,as well as “just-in-time” delivery.
48
■ Food transport sustainabilitydepends on an integratedapproach, based on environmen-tal life-cycle thinking and anunderstanding of the wider socialand economic implications. Sim-plified concepts that measuresustainability solely in terms ofdistance travelled are misleadingand should be avoided.
■ The industry pursues a range ofinitiatives to optimise transportefficiency and sustainability,such as inter-modality, loweringimpacts of individual modes,investing in new technologiesand cooperating with key supplychain partners.
■ To achieve further improvements,all stakeholders including farm-ers, industry, the transport sector,retailers, consumers, publicauthorities and others must joinin intensified action to addressthe challenges we face. The envi-ronmental impacts of food trans-port should be reduced through acombination of fewer and friend-lier miles. As there is no singlesolution, all possibilities shouldbe explored.
> > > >
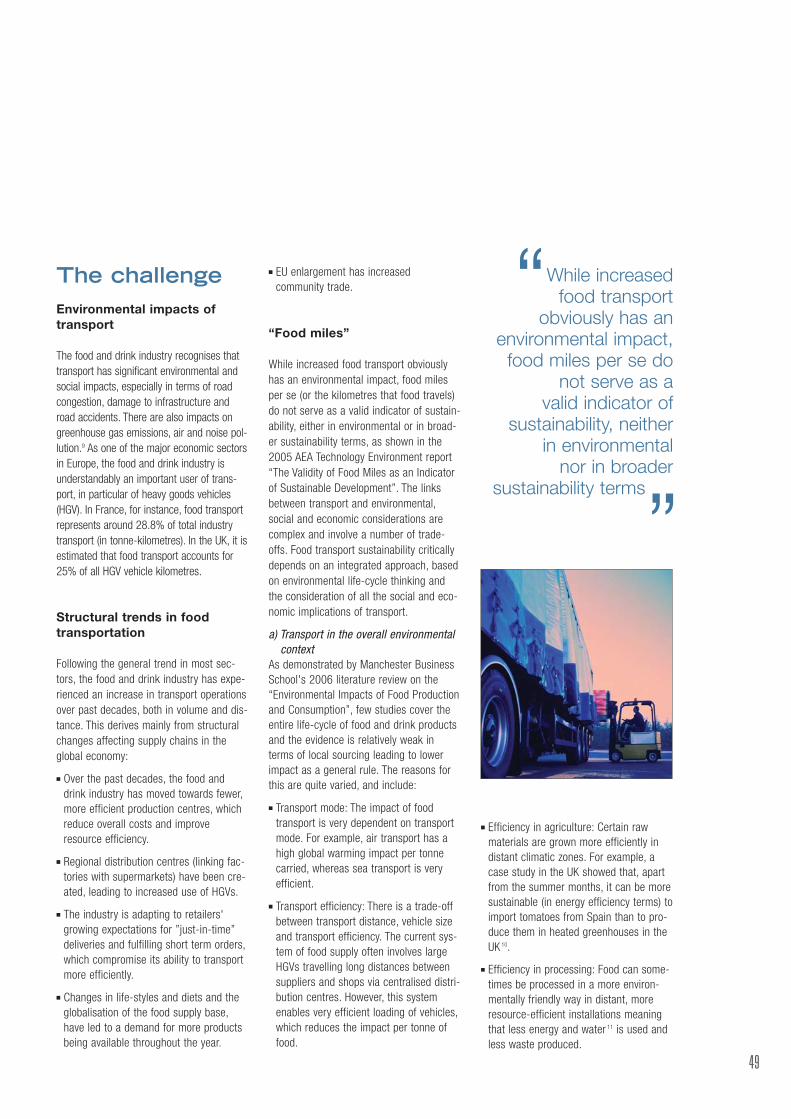
The challengeEnvironmental impacts oftransport
The food and drink industry recognises thattransport has significant environmental andsocial impacts, especially in terms of roadcongestion, damage to infrastructure androad accidents. There are also impacts ongreenhouse gas emissions, air and noise pol-lution.9 As one of the major economic sectorsin Europe, the food and drink industry isunderstandably an important user of trans-port, in particular of heavy goods vehicles(HGV). In France, for instance, food transportrepresents around 28.8% of total industrytransport (in tonne-kilometres). In the UK, it isestimated that food transport accounts for25% of all HGV vehicle kilometres.
Structural trends in foodtransportation
Following the general trend in most sec-tors, the food and drink industry has expe-rienced an increase in transport operationsover past decades, both in volume and dis-tance. This derives mainly from structuralchanges affecting supply chains in theglobal economy:
■ Over the past decades, the food anddrink industry has moved towards fewer,more efficient production centres, whichreduce overall costs and improveresource efficiency.
■ Regional distribution centres (linking fac-tories with supermarkets) have been cre-ated, leading to increased use of HGVs.
■ The industry is adapting to retailers'growing expectations for ”just-in-time”deliveries and fulfilling short term orders,which compromise its ability to transportmore efficiently.
■ Changes in life-styles and diets and theglobalisation of the food supply base,have led to a demand for more productsbeing available throughout the year.
■ EU enlargement has increased community trade.
“Food miles”
While increased food transport obviouslyhas an environmental impact, food milesper se (or the kilometres that food travels)do not serve as a valid indicator of sustain-ability, either in environmental or in broad-er sustainability terms, as shown in the2005 AEA Technology Environment report“The Validity of Food Miles as an Indicatorof Sustainable Development”. The linksbetween transport and environmental,social and economic considerations arecomplex and involve a number of trade-offs. Food transport sustainability criticallydepends on an integrated approach, basedon environmental life-cycle thinking andthe consideration of all the social and eco-nomic implications of transport.
a) Transport in the overall environmentalcontext
As demonstrated by Manchester BusinessSchool's 2006 literature review on the“Environmental Impacts of Food Productionand Consumption”, few studies cover theentire life-cycle of food and drink productsand the evidence is relatively weak interms of local sourcing leading to lowerimpact as a general rule. The reasons forthis are quite varied, and include:
■ Transport mode: The impact of foodtransport is very dependent on transportmode. For example, air transport has ahigh global warming impact per tonnecarried, whereas sea transport is veryefficient.
■ Transport efficiency: There is a trade-offbetween transport distance, vehicle sizeand transport efficiency. The current sys-tem of food supply often involves largeHGVs travelling long distances betweensuppliers and shops via centralised distri-bution centres. However, this systemenables very efficient loading of vehicles,which reduces the impact per tonne offood.
49
■ Efficiency in agriculture: Certain rawmaterials are grown more efficiently indistant climatic zones. For example, acase study in the UK showed that, apartfrom the summer months, it can be moresustainable (in energy efficiency terms) toimport tomatoes from Spain than to pro-duce them in heated greenhouses in theUK 10.
■ Efficiency in processing: Food can some-times be processed in a more environ-mentally friendly way in distant, moreresource-efficient installations meaningthat less energy and water 11 is used andless waste produced.
While increased food transport
obviously has an environmental impact,
food miles per se donot serve as a
valid indicator of sustainability, neither
in environmental nor in broader
sustainability terms
“
”

The fish processing industry Some European Member State govern-ments are encouraging consumers to eatmore fish. (The UK government's advice istwo portions per week.) Yet many localfisheries are over-exploited, so fishprocessors increasingly are turning toalternative sources further afield in orderto broaden the species base and tospread catches in line with re-generationcapacities of fishstocks. In this regard,fish sourcing is looked at in a global con-text, with the benefits of sustainablesourcing far out-weighing the downside oftransport. Furthermore, processing ofEuropean sourced fish in China is oftencited as an example of inefficiency in thesupply chain. However, hand-processingmethods, which are economically viable inChina, mean yields are significantly higherthan mechanical processing in Europe.One company has estimated that theyneed 2.4 million fewer cod fish per yearas a result of this strategy.
50
Food and drink industryinitiativesFood and drink companies pursue a rangeof initiatives to optimise transport efficien-cy and reduce environmental impact andcosts. These actions apply to upstreamflows (from raw material source to factory)and downstream flows (from factory gateto customers).
Optimising the mix of transport modes
In the food and drink supply chain, rawmaterials and products get to market via acomplex transport network of road, rail,sea, and a very small proportion of airlinks. It's obvious that efficient and sus-tainable transport requires efficient transferbetween these different modes. The foodand drink industry has significant experi-ence with inter-modality and is continuous-ly exploring innovative solutions.
b) Transport in the wider sustainabilitycontext
In addition to environmental considera-tions, transport has to be seen in a widercontext, taking account of the social andeconomic dimensions of sustainability, bothin the EU and globally.Trade and thus transport is an inherentcomponent of EU policy. It is essential toprovide appropriate and sufficient foodsupplies throughout the EU market andoffer increased consumer choice. Exports,as much as imports are key to enhancingindustry competitiveness. To develop andsecure growth and jobs, not only in largecompanies but also in small and mediumenterprises (SMEs), it is essential forindustry to reach out to new markets.Moreover, sourcing raw materials and finalproducts from non-EU countries, in particu-lar developing countries, contributes to thedevelopment and long-term prosperity oflocal economies.A transport concept focusing on transportdistances alone would therefore seriouslyundermine some key EU policy objectives interms of social and economic sustainability.
Transport & Distribution
Food transport sustainability critically
depends on an integrated approach,
based on environmentallife-cycle thinking
and the considerationof all social and
economic implicationsof transport
“
Cadbury: Cocoa beans take short cut by sea to factory gate Cadbury Schweppes' “Purple Goes Green” initiative aims to reduce the company's greenhousegas emissions by 50% by 2020. One way they have reduced environmental impact in recentyears is by changing the way in which cocoa beans are transported from Ghana to the UK. Priorto 2000 the beans were shipped to south-east England and then transported by road to thecocoa-processing factory at Chirk in North Wales. This involved 2,150 loads travelling over500,000 miles. The beans are now shipped directly into Liverpool in north-west England (40 miles/60km from the processing plant). This has resulted in 1,600 loads travelling only135,000 miles, thereby reducing environmental impact by 75%.
Danone: The first user of the Saône-Rhône river for containertransport River freight has been a significant part of the Danone supply chain for many years. In 2006alone, it carried over 100 million bottles of mineral water. This figure has been growing at a rateof 10% a year. Containers are loaded in Macon and Lyon for the deep-sea port of FOS-Marseille. From there Danone supplies its customers around the world and especially in Japan.Two barges leave Macon every week and a third is added during the peak season for mineralwater. By using the river, Danone keeps 5,000 trucks off the road each year.
”

51
Minimising the environmentalimpact of individual transportmodes
Road transportation is the main source ofCO2 emissions compared to other transportmodes. In this context, consumers play animportant role in terms of the vehicle-kilo-metres that their food travels. The AEATechnology Environment report showedthat, in 2002 in the UK, domestic car jour-neys from shop to home accounted for48% of UK food vehicle-kilometres and40% of total social costs of UK transport.Concerning the industry’s share in overallfood vehicle-kilometres, one of its keyobjectives in terms of ‘fewer’ miles is tominimise tonne-kilometres carried for agiven volume of product. For instance, foodand drink companies are mindful of theneed to make use of spare capacity on thereturn leg of a delivery journey to reduceempty running, a practice known as back-loading. This is being addressed by compa-nies either through their relations with thirdpart hauliers – for those that contract outtheir transportation (as is the case for themajority of companies 12) – or through theirown road transport optimisation pro-grammes.
Food and drink manufacturers pursue
a range of initiatives to optimise transport
efficiency and sustainability, such
as inter-modality, lowering impacts
of individual modes,investing in new
technologies and cooperating with key supply chain
partners
“Transport rationalisation in thesugar industry
Efficient beet processing requires accuratecontrol of enormous commodity flows, andcontinuous beet delivery to the factories. Tominimise the traffic burden, the sugar indus-try has pursued a policy of transport ratio-nalisation in order to reduce the environ-mental effects of beet transport. Beet farm-ers are encouraged, through targeted infor-mation and various handling improvementsmade in the factories, to deliver in largevehicles. This reduces the number of tripsand thus results in fewer kilometres trav-elled, lower fuel consumption as well as lessnoise.
UK food vehicle-kilometres bytransport mode (2002)
CO2 emissions associated with UKfood transport (2002)
HGV overseas 7%
HGV UK 19%
HGV UK33%
Sea, Rail, Air short haul,Air long haul 0%
HGV UK tooverseas 5%
HGV UK tooverseas 12%
Sea 12%
Air long haul 10%
Rail0%
HGV overseas12%
Car13%
LGV UK6%
LGV overseas
2%
LGV UK 16%Car 48%
LGV overseas 5%
Transport modes in the UK food sector
Source: AEA Technology Environment
Number of vehicle movements in aGerman sugar company
440
430
420
410
400
390
380
370
0
1995
1996
1997
1999
1998
2000
2001 ”

52
Building onachievementsGreater cooperation across the supplychain, bringing together food manufactur-ers, logistics providers, retailers and con-sumers, has the potential to achieveimportant further improvements in trans-port sustainability. In the specific context ofthe UK, the report of the Food IndustrySustainability Strategy (FISS) Champions'Group on Food Transport published in May2007 assessed that a 20% reduction inenvironmental and social costs associated
with domestic transportation of food by thefood industry was possible - withoutundermining the efficiency of the distribu-tion network. However, it demands concen-trated effort in six “big hitting” actionareas, summarised in the table.
For the food and drink industry, wheredirect deliveries between manufacturersand shops are concerned, discussion withretailers to widen delivery windows is ofparticular importance. In fact, deliveries toretailers are mainly concentrated between5 am and 10 am, when many people arecommuting.
New technologies
The need to use state-of-the-art technolo-gy plays a key role in food and drink com-panies' own transport fleets and in thechoice of external transport logisticsproviders. The industry supports the intro-duction of new engine norms (EURO IV, V)and chooses its logistics providers accord-ing to their compliance with EU norms.
The ECR Project for collabo-rative management of trans-port across the supply chain A number of large food and drink compa-nies, together with major retailers, serviceproviders and other consumer goods manufacturers, have joined forces to setup the ECR initiative ("Efficient ConsumerResponse"). The European TransportOptimisation project, one of ECR's projects, was launched in late 1997 todevelop guidelines to optimise transportefficiency in economic, social and envi-ronmental terms. The team estimates that comprehensive implementation of theprinciples outlined in the report wouldenable the European economy to reducevehicle movements by up to 30%, or toabsorb up to 30% growth in businessfreight tonne-kilometres, without anyincrease in current levels of goods vehiclemovements.
NestléNestlé NWDi Poland has two producers oftrucks: IVECO and Renault. Old vehicles arereplaced every 5-6 years. This guaranteesnew technology (e.g. updated engines, Euro3, 4, 5) and reduction of emissions. Trucksare regularly maintained, which preventsunexpected pollution. There have been 6IVECO Daily 65C12G in operation in Poland(Warsaw depot) since 2004, functioningwith 3-way catalytic converters to reducegas emissions (CO, HC, CH4 and NOxemissions). In addition the “CNG powerunit” greatly improves urban transport sus-tainability by lowering emissions of micro-dust particles (PM 10).
6
5
4
3
2
1
0Euro 3(2000)
Euro 4(2005)
Euro 5(2009)
DailyCNG
0.25
0.2
0.15
0.1
0.05
0Euro 3(2000)
Euro 4(2005)
Euro 5(2009)
DailyCNG
Reduction in air emissions under EUtransport engine norms compared withCNG emissions
Six “big hitting” action areas for food transport sustainability under the UK FISS
➜
■ CO (g/kWh) ■ NMHC (g/kWh)■ CH4 (g/kWh) ■ NOx (g/kWh)
■ Micro particules PM 10 (g/kWh)
Action Main Potential CO2impact saving (%) reduction (%)
Greater capacity vehicles Fewer 5.3 6.5
Out of hours deliveries Friendlier 2.0 [0]
Engine specifications Friendlier 3.5 0.4
Vehicles telematics/CVRS Fewer 3.0 2.3
Transport collaboration Fewer 3.2 3.8
Logistics systems redesign Fewer 2.3 2.8
TOTAL BOTH 17.3 14.2
Greater cooperation across
the supply chain,bringing together
food manufacturers,logistics providers,
retailers and consumers, has the potential to
achieve importantfurther improve-
ments in transportsustainability
“Source: Faber Maunsell (2007, p.43 Tables 26 & 27)
Transport & Distribution
”

53
Alternative fuels/bio-fuels
Renewable energy sources, including bio-fuels, can contribute to addressing a three-fold objective: improving security of energysupply through the diversification of energyand feed-stock sources; helping to tackleclimate change; and enhancing the com-petitiveness of EU-based companies.
However it is essential to ensure that theglobal costs related to EU bio-fuels policiesdo not outweigh their benefits and triggerserious environmental problems (e.g.deforestation, water depletion) and socialand economic problems, including foodshortages and global price rises.
In future, agricultural markets will faceincreasing demand from rapidly expandingeconomies in Asia and Latin America. Thebio-fuel development envisaged in manycountries over the next 10 to 20 years willadd to existing pressure on agriculturalmarkets and is likely to contribute to risingglobal food commodity prices. Also poten-tial environmental impacts triggered by anincreasing demand for bio-fuel crops needto be considered carefully. This assess-ment is echoed by the 2007 OECD reporton bio-fuels (Roundtable on SustainableDevelopment) concluding that the rush to
energy crops could cause food shortagesand damage to bio-diversity, and bring limited benefits.
The EU bio-fuels policy must therefore takean integrated sustainability approach, con-sidering life-cycle environmental impactsas well as food security and other socialand economic impacts. Particular urgencymust be given to the earliest possibledevelopment of second-generation bio-fuels, which put less pressure on globaleco-systems and food security.
Action from other stakeholders
Road to rail/ship
CIAA considers that the road to rail or shipmodal shift also has great potential todeliver 'friendlier' miles for the industry.However it requires efficient infrastructure,in particular more high-quality and efficientrail services (in terms of reliability, punctu-ality as well as cross-border speed andinter-operability between national railwaysystems). Uptake by the food industry isalso currently hampered by a lack of com-munication about possible synergies, net-works, back-loading opportunities and ageneral lack of flexibility amongst the railfreight industry. Further harmonisation ofinter-modal unit loads and development ofinter-modal terminals is also essential.Whilst the food and drink industry wel-comes recent initiatives to improve infra-structures for alternative modes of transport at national level, it calls for more pan-European work to look at theexisting barriers to achieving greater modal shift from road to rail or ship,and how these might be overcome.
Industry welcomes recent
initiatives to improveinfrastructures for
alternative modes oftransport at national
level and calls for morepan-European work
to look at the existingbarriers to achieving
greater modal shift andhow these might be
overcome
“
”
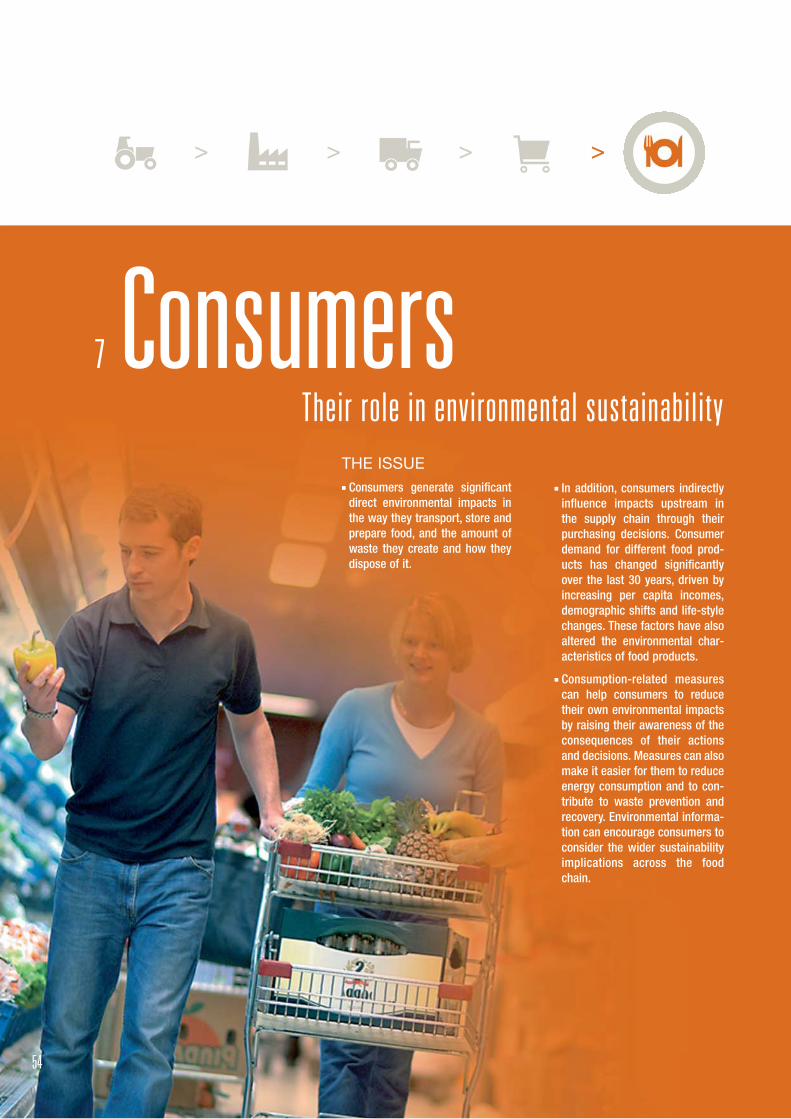
ConsumersTheir role in environmental sustainability
7
THE ISSUE■ Consumers generate significant
direct environmental impacts inthe way they transport, store andprepare food, and the amount ofwaste they create and how theydispose of it.
54
■ In addition, consumers indirectlyinfluence impacts upstream inthe supply chain through theirpurchasing decisions. Consumerdemand for different food prod-ucts has changed significantlyover the last 30 years, driven byincreasing per capita incomes,demographic shifts and life-stylechanges. These factors have alsoaltered the environmental char-acteristics of food products.
■ Consumption-related measurescan help consumers to reducetheir own environmental impactsby raising their awareness of theconsequences of their actionsand decisions. Measures can alsomake it easier for them to reduceenergy consumption and to con-tribute to waste prevention andrecovery. Environmental informa-tion can encourage consumers toconsider the wider sustainabilityimplications across the foodchain.
> > > >

The challengeHouseholds' direct environ-mental impact
CO2 from shopping by car
The rapid increase in the number of hyper-markets and food shops, often located out-side towns, has increased the amount oftransport miles for household food shopping.To reduce CO2 emissions from shopping bycar, the challenge for the consumer is to usemore efficient engines and cleaner fuels,and, wherever possible, to change to alter-native transport and/or delivery modes (e.g.use of supermarkets' delivery services).
Energy use for food storage and preparation
The use of energy for food-related activi-ties is a notable contributor to overall GHGemissions in the food chain (about 15%).Recent research indicates, for example,that food storage, preparation and dish-washing account for about 38.5% of theelectricity used in the life-cycle of meatand dairy products. This compares with ashare of 18% for manufacturing.Household electricity consumption hascontinued to grow, largely due to expand-ing household ownership of appliances,including food-related appliances (refriger-ators, freezers, dishwashers, microwaves).There is still significant potential forimproved energy efficiency of appliances,and for consumers to apply more energy-efficient food-preparation techniques.
Generation of food waste
Food waste generation in households isparticularly worrying from an environmentalperspective as it results in the loss of allresources invested in the product over itsentire life-cycle (agricultural inputs, water,energy, packaging, transport, cooling, etc).Recent research indicates that up to 30%of food is wasted in households (half isedible food). In addition to the unnecessaryloss of natural resources, inappropriatedisposal of household food waste gener-ates additional environmental impacts.Composting household food waste is oftenstill under-developed and a significant partends in landfill, where it generates thegreenhouse gas methane. Prevention ofhousehold food waste is therefore funda-mental in ensuring sustainability in thefood chain.
Packaging waste
Consumers play an essential role in ensur-ing the successful functioning of nationalre-use, recycling and recovery schemes forpackaging and packaging waste.Consumers' efforts have been crucial inachieving continuously rising recycling andrecovery rates in the EU. Besides environ-mental education, it is important to make iteasy for consumers to separate, collectand dispose of their waste correctly in theireveryday life (see the chapter on packaging).
55
Food and drink industryinitiativesFood waste: Tailoring productand packaging design to consumers' needs
The food and drink industry's efforts indeveloping tailor-made packaging solu-tions, including adjusted portion sizes, pro-tection from physical damage and shelf-lifeimprovements, have helped greatly toreduce food waste from spoilage duringtransportation and storage. When smallerportion sizes (particularly for the risingnumber of single households) lead to a risein packaging, this increase is usually farout-weighed by the environmental benefitsof preventing food waste. This is simplybecause the manufacture of the food ordrink product itself is far more resourceintensive than that of the packaging, whichis also subject to highly effective recyclingand recovery. Adjusting packaging designto changing consumers' needs will there-fore remain a priority for food and drinkcompanies.
Food waste in households (based on UK estimates, WRAP) 14
Consumed food 70%
Household food waste 30%
Non-edible 15%
Purchased food (100%):It contains all resourcesinvested in the productover the entire life-cycle:agricultural inputs, water,energy, packaging,transport fuel,refrigerants, etc.
Edible 15%
Electricity consumption along the meatand dairy life-cycle
Food industry 18%
As % of total consumption for meat and dairy products(Household electricity use covers covers food storage, cookingand dishwashing)
Households 38.5%
Retail 6%Farming 7%
Others 24%
Catering 6.5%
Source: IMPRO study, Draft final report, 2007 13
Consumers generatetheir own environmentalimpacts in the way they
transport, store andprepare food, and theamount of waste they
produce and how theydispose of it. They also
influence impactsupstream in the supply
chain through their purchasing decisions
“
”

56
Building onachievements1. Households' direct impact
Household food waste
As highlighted in recent studies (e.g. theIMPRO draft final report on meat and dairyproducts 12 ), the most immediate household-related challenge is to reduce food waste.
■ The greatest potential to reduce foodwaste lies in improved shopping andhousehold planning. Consumers are oftenunaware of the environmental impact offood waste generation, and do not consid-er this aspect in their shopping decisions.
■ Cooperative action is required by privateand public stakeholders to support con-sumers in developing easily applicablestrategies to match their daily food pur-chases with their actual needs. Improvingthe knowledge-base on consumer shop-ping patterns (e.g. frequencies and vol-umes of purchases) will help to identifythe main motives for insufficient planning.
■ The food industry will continue to exploreopportunities to adapt product and pack-aging design to changing demographicrequirements and purchasing trends (e.g. single households, rising dietaryawareness) in order to avoid unnecessaryfood waste.
■ Where household food waste cannot beprevented, increased attention has to bepaid to environmentally sound manage-ment of this waste stream (e.g. bio-gasand composting).
Food storage and preparation
Cooperation among stakeholders is neededto support consumers in saving energy andwater in daily food storage and prepara-tion, for example by providing detailedinformation on the most efficient foodpreparation techniques. Changing to moreenergy-efficient household appliances(fridges, freezers, cookers and stoves) willbe another important contributor.
2. Environmental information
Product information enables consumers tomake informed choices and to follow indi-vidual preferences. Food and drink compa-nies have comprehensive experience incommunicating with consumers and under-take concrete actions to inform them of allrelevant product characteristics, includingquality, safety, health, nutritional composi-tion, but also environmental performance.Many different tools can be used to communicate product information (e.g. website, on-pack, on-shelf).
Packaging: National recoveryschemes and environmentaleducation
The food and drink industry has investedextensive amounts of time, effort and moneyto develop efficient recovery schemes forpackaging waste that have proven highlysuccessful in achieving impressive recyclingand recovering rates in the EU. Effectiveprevention, recovery and recycling alsodepend strongly on consumer behaviour.Promoting a sense of responsibility plays akey role in this respect. Food and drinkcompanies have cooperated with other partners to develop environmental educationmeasures and comprehensive communica-tion programmes that address consumers atevery level. Many of these educational activities are aimed at children to help themdevelop an early sense of responsibility forthe environment.
Consumers
Packaging recovery organi-sations support active citizenship for sustainabledevelopmentSince 2000, Ecoembalajes (the Green Dotsystem in Spain) has been cooperatingwith Ecovidrio, Ministry for theEnvironment, APAS (Association for thePromotion of Socio-Cultural Activities) andthe Foundation for Biodiversity to developdidactic education materials for teachersand schoolchildren between the ages ofeight and twelve. The environmentalguides focus on sorting, recycling and re-use of packaging and packaging waste.1,600 schools and around 170,000 children are currently using the materials.Ecoembalajes also supports the “Valuesfrom Aldeas Infantiles S.O.S.” school pro-gramme that is run by the foundation ofthe same name. A teaching unit on thesubject of waste separation and recyclingwas developed and distributed to 3,750schools. At the end of 2004, a total ofaround 257,000 children aged betweensix and twelve were taught this subject forone month.
Household food waste is particularly
worrying from an environmental
perspective as it results in the loss
of all resources invested in the
product over its entire life-cycle
”
“
Reliable and meaningful environmental
information enablesconsumers to considerthe wider sustainability
implications of their purchasing decisions
“
57
industry also supports the provision of environmental information to consumers,on the following conditions:
■ Information must be credible and science-based.
■ To be meaningful, the information mustcover all major environmental impactsalong the life-cycle.
■ Information must be understandable and must not confuse or mislead theconsumer.
■ To avoid any consumer misinformation,verification is crucial.
■ To avoid distortion of information, appliedassessment methodologies should beuniform.
■ Information must be effective and effi-cient, i.e. it has to contribute to environ-mental improvement in a cost-efficientmanner.
■ Besides labelling, there is a range ofother tools to inform consumers of theenvironmental performance of products.The suitability of all available tools should be explored.
Example 1: In the UK, the pack of the brand“Innocent” (fruit smoothies) refers to awebsite providing information on the carbon footprint of the product.
Example 2: The pack of the brand “Nescafé -Partner's Blend” refers to a website pro-viding information on how Nescafé's sup-ply chain management supports farmers,their communities and the environment.
Example 3: In the UK, the brand “Walkers - Cheese & Onion Crisps” carries a carbon label onpack.
Developing reliable and meaningfulassessment methods
In the last few years, businesses and public authorities have engaged in intensified efforts to develop meaningfulenvironmental assessment methods,covering the entire lifecycle of products,and to communicate this information alongthe supply chain and to the consumer. Inthe food and drink industry, environmentalsupply chain analysis is an important man-agement tool to cut resource consumption,emissions and costs. The food and drink
The European food and drink industry isactively engaged in a number of concreteinitiatives aimed at evaluating the feasibili-ty of developing a uniform, integrated and reliable environmental assessmentmethodology for food and drink products,to evaluate corresponding costs and bene-fits and to explore suitable communication.
”
ConclusionThis publication demonstrates that the European food and drink industry is making significant and continuous improvement towards environmental sustainability. It also shows that there is considerable scope to build on theseachievements.
As we have said, given the complexity of the food chain, there is no single solution. Every player in the chain has a crucial role, individually but also as ateam player. It is by working together that we can achieve even more strikinglong-term results.
This publication has highlighted key issues and identified areas for future work by all stakeholders. And we send the same invitation as we did at the beginningof this communication: the CIAA welcomes your contributions.
Together, right across the food chain, we can achieve much more. The whole isgreater than the sum of the parts.
We look forward to hearing from you.
58

Endnotes(1) European Environment Agency, Indicator Fact Sheet Signals 2001- Total
waste generation by sector EEA Countries 1992-1997
(2) European Environmental Agency, Annual European Community green-house gas inventory 1990-2005 and inventory report 2007
(3) Two other considerations indicate the validity of this estimate. The EUmanufacturing sector accounts for 28% of final energy use and forabout 16.5% of all GHG emissions in the EU-15 (energy-use relatedemissions, not including process emissions). Food manufacturingaccounts for about 7% of final industrial energy use, thus for about1.15% of total GHG emissions. As process emissions in the food indus-try are very low, the sector's overall share in EU-15 GHG emissionscould be estimated at about 1.2% on the basis of this calculation. Thiscompares with estimates by the UK Defra, suggesting that national foodmanufacturing accounts for about 1.8% of total UK GHG emissions (thesector's share differs according to size and structure of the nationalfood industry). The above share of 1.5% can thus be considered as asensible average estimate for the food and drink industry at Europeanlevel.
(4) European Environment Agency (WQ2) and New Cronos (Eurostat-OECDJQ2002), Water use by sectors, scope: EU-27 + Turkey, Norway andSwitzerland (May 2004)
(5) Idem
(6) G Pre, Packaging of food products - its role and requirements,Packaging India, 30/1, 9-11 (1997)
(7) J M Kooijman, Environmental Impact of Packaging Performance in theFood Supply System (1995), Environmental Impact of Packaging:Performance in the Household (2000), The Use of Packaging in DutchHouseholds: Survey of Products, Quantities and Energy (2000)
(8) RDC and PIRA, Evaluation of costs and benefits for the achievements ofreuse and recycling targets for the different packaging materials in theframe of the packaging and packaging waste directive 94/62/EC(2003)
(9) Faber Maunsell, Reducing the External Costs of the DomesticTransportation of Food by the Food Industry (2007) http://statistics.defra.gov.uk/esg/reports/costfoodtransport/default.asp
(10) See also: Lincoln University, Comparative Energy/EmissionsPerformance of New Zealand's Agriculture (2006)
(11) Schlich and Fleissner (2003) found that large-scale orange juice pro-cessing and shipment from Brazil is more energy-efficient thanprocuring apple juice from small local producers in Germany, inEnvironmental Impacts of Food Production and Consumption,Manchester Business School, p. 47 (December 2006)
(12) For instance, 95% of food and drink companies' transport operationsare contracted out to third party hauliers in the UK
(13) Bo P. Weidema, Marianne Wasnæs, Environmental ImprovementPotentials of Meat and Dairy Products (IMPRO), Draft Final Report,commissioned by European Commission, Joint Research Centre, IPTS(2007)
(14) Waste and Resource Action Programme (WRAP), Understanding FoodWaste, 2007
Be inspired...The case studies and examples selected for this report illus-trate how different companies in the food and drink industryare addressing various sustainability challenges. They give anidea of the breadth and depth of the industry's efforts.
The examples emanate from a highly diversified industry witha multitude of different raw materials, products, processes andactivities. They represent a very diverse range of interests andactivities from companies, organisations and federations in amultitude of sub-sectors. They also depend on different localenvironmental and economic conditions.
In this context, it would be inappropriate to use these practicesas benchmarks either for the entire industry or for sub-sectors.Nevertheless, we hope that they will be a source of inspirationfor other food and drink companies.
Take a closer lookFor more case studies and examples, please visit:
http://envi.ciaa.eu
59

At a glance:The EU-25 food and drink industry
54
Europe’s number one manufacturing industry
13% of total EU manufacturing production value
11% of jobs in manufacturing
Dominated by small and medium sizedenterprises: 99% of food companieshave fewer than 250 employees
More than 280,000 companies
d836 billion in annual sales
Around 3.8 million employees
Purchases and transforms 70% ofEuropean agricultural raw materials
d48 billion a year in exports
The leading industrial sector in the EU
■ With a turnover reaching €836 billion, the foodand drink industry is the largest manufacturingindustry in the EU, ahead of the automobile andchemical industries.
■ The food and drink industry is the leadingemployer in the manufacturing sector with 3.8 million employees in 282,600 companies.
■ France, Germany, Italy, the UK and Spain are theleading producers of food and drinks in the EU,accounting for about 70% of total EU turnover.
SMEs in the food and drink industry
■ The food and drink industry is composed of adiverse range of companies from SMEs (smalland medium-sized enterprises defined as havingless than 249 employees) to large companies.
■ SMEs make up 99.1% of the food and drinkbusiness population. These 282,600 companiesgenerate 47.8% of food and drink turnover andemploy 61.3% of the sector workforce.
■ Large companies account for just 0.9% of allfood and drink enterprises but they provide52.2% of turnover, 53.8% of added value andcontribute to 38.7% of employment.
A highly diverse and fragmented sector
■ The food and drink industry is characterised by avery high diversity of different products and pro-duction processes
■ The “various food products” category is thelargest sector of the food and drink industry: itaccounts for 26% of total turnover and 42% ofwork-force. This so-called “various food products” category is a heterogeneous groupwhich includes bakery, pastry, chocolate andconfectionery products but also pasta and babyfood.
■ Meat, beverages and dairy products are also keysectors and, together with “various food products”, they represent 77% of total turnoverand 84% of the total number of employees.
Distribution of turnover and employment in sub-sectors
Source: Eurostat, SBS, 2003 data
26.0
41.3
23.2
9.2
20.0
15.3
6.5
6.24.2
3.9
2.5 1.3
15.5
10.2
6.3
33
2.5
Turnover (%) Employment (%)
■ Meat products
■ Fish products
■ Processed fruit and vegetables
■ Oils and fats
■ Dairy products
■ Grain mill products and starch products
■ Animal feeds
■ Beverages
■ Various food products
Structure of the food and drink industry
60

AustriaFIAA – Fachverband Lebensmittelindustrie
BelgiumFEVIA – Fédération de l’Industrie Alimentaire /Federatie Voedingsindustrie
Czech Republic PKCR - Potravinárská Komora Ceské Republiky
DenmarkFI – Foedevareindustrien
EstoniaETL – Eesti Toiduainetööstuse Liit
FinlandETL – Elintarviketeollisuusliitto
FranceANIA – Association Nationale des Industries Alimentaires
GermanyBLL – Bund für Lebensmittelrecht undLebensmittelkunde BVE – Bundesvereinigung der DeutschenErnährungsindustrie
GreeceSEVT – Συνδεσµος Ελληνικων Βιοµηχανιων Τροφιµων /Federation of Hellenic Food Industries
HungaryEFOSZ – Élelmiszerfeldolgozók Országos Szövetsége
IrelandFDII – Food & Drink Industry Ireland
ItalyFEDERALIMENTARE – Federazione Italiana dell’industriaAlimentare
LatviaLPUF – Latvijas Pãrtikas Uz,nemumu Federãcija
LuxembourgFIAL – Fédération des Industries Agro-alimentairesLuxembourgeoises
PolandPFPZ – Polska Federacja Producentów Zywnosci
PortugalFIPA – Federação das Indústrias Portuguesas Agro-ali-mentares
SlovakiaUPZPPS – Unia podnikatel'ov a zamestnávatel'ov v potravinárskom priemysle na Slovensku
PKS – Potravinárska Komora Slovenska
SloveniaGZS – Zbornica kmetijskih in zivilskih podjetij
SpainFIAB – Federación Española de Industria de laAlimentación y Bebidas
SwedenLI – Livsmedelsföretagen
The NetherlandsFNLI – Federatie Nederlandse Levensmiddelen Industrie
United KingdomFDF – Food & Drink Federation
Observers:
NorwayNBL – Næringsmiddelbedriftenes Landsforening
RomaniaRomalimenta – Federatia Patronala din IndustriaAlimentara
TurkeyGDF - Türkiye Gıda ve Içecek Sanayii DernekleriFederasyonu
BakeryAIBI
BeerTHE BREWERS OF EUROPE
Bottled waters EFBW
Breakfast cerealCEEREAL
Broth & soupFAIBP
Chocolate, biscuits & confectionery CAOBISCO
Dairy productsEDA
Dietetic productsIDACE
Fruit & vegetable juicesAIJN
Fruit & vegetable preserves OEITFL
Ice creamEUROGLACES
Intermediate products for bakery & confec-tioneryFEDIMA
IsoglucoseAPI
MargarineIMACE
Non-alcoholic beveragesUNESDA
OilsFEDIOL
PastaUNAFPA
Pet foodFEDIAF
Processed meatCLITRAVI
Processed potatoesUEITP
SaltEUSALT
Sauce & condimentFIC
SnacksESA
Soluble & roasted coffeeECF
SpicesESA
StarchAAF
SugarCEFS
Tea & herbal infusionsEHIA/ETC
Vegetable proteinsEUVEPRO
YeastCOFALEC
ADM
BUNGE
CADBURY SCHWEPPES
CAMPBELL FRANCE HOLDING
CARGILL
COCA-COLA
DANONE
FERRERO
HEINEKEN
HEINZ
KELLOGG'S
KRAFT FOODS
MASTERFOODS
NESTLE EUROPE
PEPSICO
PERNOD RICARD
PROCTER & GAMBLE
SÜDZUCKER
TATE & LYLE
UNILEVERMajo
r fo
od a
nd d
rink c
om
panie
s
Secto
rs
National F
edera
tions
CIAA Members
61
This report is printed on Condat Silk, a paper producedfrom well-managed forests and certified by the ForestStewardship Council (FSC)
Acknowledgement:
CIAA would like to thank all the members whose input, comments, experience and case studies have contributed to this publication.
Published in October 2007
Editing
Peter Bear, PB Marketing and Communication.Contact [email protected]
Photographs used with the permission of:
Danone, Heineken, Pernod Ricard, Nestlé, Raisio Plc,Glanbia, Südzucker AG, Brewers of Europe, FNLI,FEVIA, SEVT, TetraPak, APEAL, FEFCO
Printing
Les Editions Européennes SA, Brussels, Belgium
Paper
Oh! D
esig
n SP
RL
62


CIAA AISBLAvenue des Arts 43B-1040 BrusselsBelgium
Phone: +32.2.514 11 11Fax: +32.2.511 29 05E-mail: [email protected]