managers’ voting rights and corporate control mikkelsonlcb-file.uoregon.edu/wmikkels/jfe published...
TRANSCRIPT
Journal of Financial Economics 25 (1989) 263-290. North-Holland
MANAGERS’ VOTING RIGHTS AND CORPORATE CONTROL
Wayne H. MIKKELSON and M. Megan PARTCH*
UnicersiQ of Oregon, Eugene, OR 97403, USA
Received October 1988, final version received May 1990
We document managers’ vote holdings in a large random sample of industrial firms, and test whether the degree of managerial control of shares affects how often a firm is the target of control events. The likelihood of successful acquisitions of firms is unrelated to managers’ holdings. But this insignificant relation reflects two opposing effects. Lower managerial control is associated with a higher probability that a firm will receive a takeover offer, but a lower probability that a takeover attempt will lead to a change in control.
1. Introduction
Despite great interest in how managers’ control of shares affects events in the market for corporate control, evidence on the issue is sparse. Walkling and Long (1984), Merck, Shleifer, and Vishny (1988b), and Broadman (1989) report that managers’ share ownership affects their response to takeover attempts for their firm. But there is little evidence that managers’ control of shares affects the likelihood a firm will be a takeover target.’
We document the extent of managers’ voting control in a broad sample of U.S. industrial firms, and examine whether this control is related to the occurrence of events such as toehold investments, takeover offers, and the outcomes of takeover offers. Our tests control for the use of staggered voting for directors, the presence of substantial blockholdings, the amount of financial leverage, and total firm value.
*We would like to thank Brad Barber, Larry Dann. Jenny Gaver. Kenneth Gaver, Clifford Holderness, Christopher James, Cole Kendall, Chuck O’Kelley, Artur Raviv, Richard Ruback (the editor), Dennis Sheehan, Rene Stulz, Ralph Walkling, Paul Asquith (the referee), as well as seminar participants at Arizona State University, Pennsylvania State University, Purdue Univer- sity, the University of British Columbia, and the University of Oregon for helpful suggestions. We thank John Byrd, Ronald Budde, James Fries, Hailu Regassa, and Michele Woo for assistance in collecting data and Cedric Antosiewicz for assistance in computer programming. We are also grateful for research support we received from the Graduate School of Business of the University of Chicago while we were visiting professors.
‘See Jensen and Warner (1988) and the articles they reference. In addition, Song and Walkling (1989) investigate the relation between the percentage of shares owned by managers and the probability that a firm will be a takeover target.
0304-405X/89/%3.30 D 1989, Elsevier Science Publishers B.V. (North-Holland)
264 W.H. Mikkelson and .KVf. Parxh, Managers’ rating rights and corporate control
We find no association between the proportion of shares controlled by a firm’s officers and directors and the likelihood that a firm will be taken over. Our estimates of the probability that a firm will undergo a change in control vary only between 0.16 and 0.17 across a range of managers’ voting control from less than 10% to more than 50% of outstanding votes.
The lack of association between managers’ voting rights and changes in control, however, obscures the influence of managers’ holdings on both the initiation and the success of attempts to acquire control of a firm. Managers’ control of shares is negatively related to the incidence of takeover attempts by outsiders, as well as to the incidence of managerial resistance to takeover attempts. In contrast, the probability that a takeover attempt will lead to a change in control is positively related to target managers’ voting control. This positive association is found for both resisted and unresisted offers.
More than any other variable we study, firm size explains the occurrence of control events. Smaller firms are more often the target of toehold invest- ments and takeover attempts, and the takeover offers they receive more often lead to a change in control. We suspect that smaller firms are less costly to acquire, which affects a bidder’s choice of target firm as well as the outcome of takeover negotiations.
We find that the financial leverage of the target firms has no effect on the incidence of takeover offers or the outcome of takeover attempts, but that toehold investments are more likely for more highly leveraged firms.
Staggered voting for directors has no reliable association with the occur- rence of control events. Staggered voting does not appear to deter outsiders’ interest in takeover activity, nor does it identify managers who are likely to resist takeover offers.
Firms with a blockholder who sits on the board of directors are more likely to undergo a change in control than firms without such a blockholder. We find no evidence, however, that blockholders who do not sit on the board facilitate or deter takeover attempts or control changes.
We conclude that managers’ holdings of votes have observable effects on the actions of managers and outsiders in the market for control. Greater managerial control reduces the likelihood of takeover offers, yet increases the likelihood that a takeover offer will uhimately lead to a change in control. Consistent with these offsetting effects, the probability that firms will experi- ence a takeover offer that results in a control change is unrelated to managers’ voting control.
2. Possible effects of managers’ voting control
Common stock typically bundles residual claims on the firm’s earnings and assets with the right to vote in elections of directors and on other matters. As discussed by Fama and Jensen (1983) and by Easterbrook and Fischel(19831,
W. W Mikkelson and MM. Pmch, Managers c,oting rights and corporate control 265
this bundling is important because it ties managers’ voting control to their economic stake in their firm.
The bundling of votes and financial claims does not imply a clear predic- tion about the association between managers’ voting power and the incidence of control events. Managers’ ability to thwart takeovers is directly related to the proportion of votes they control, but so are their payoffs from a takeover offer. When managers’ voting power is great, their personal financial rewards from a takeover are similarly great.
Stulz (1988) argues that when managers have little voting power, they cannot block unwanted takeover attempts. Jensen and Meckling’s (1976) argument that conflicts of interest between managers and stockholders are greatest when management owns few shares also implies an inverse relation between managerial voting control and the incidence of control changes. Potential gains from takeovers that discipline managers should be greatest when target managers own few shares.
These arguments ignore the effect of economic incentives created by share ownership. Walkling and Long (1984) and Merck, Shleifer, and Vishny (1988a) find that managers with relatively high ownership are less likely to resist tender offers. Broadman (1989) finds that the likelihood an initial takeover offer will succeed is directly related to the payoffs to target man- agers. Both pieces of evidence are consistent with the view that when target managers control many votes, more takeover offers succeed. Relatively high management ownership can also lead to more successful takeover attempts if the costs to bidders of negotiating with a small number of large shareholders are less than the costs of negotiating with managers who have few sharehold- ings and represent a diverse group of stockholders.
Additional support for a positive relation between the incidence of control events and managers’ voting control comes from the arguments of Demsetz (1983) and the findings of Merck, Shleifer, and Vishny (1988b). They suggest that managers are less likely to maximize firm value when they have majority voting control and therefore are insulated from unwanted takeover attempts. The reduced market value of firms with majority ownership by managers can attract takeover offers.
3. Description of the sample
Our initial sample of 240 industrial firms was selected at random from a population defined as follows:
(1) Firms are represented in the Center for Research in Security Prices (CRSP) daily returns file throughout 1972. The CRSP database includes companies listed on the American or New York Stock Exchange. There were 2,556 firms listed throughout 1972.
266 W. H. Mkkzlson and M.M. Panch, Managers’ coring rights und corporate connol
(2) Firms are included in Moody’s Industrial Manual in 1972. This excludes banking, insurance, and other financial companies as well as utilities and transportation companies.
We follow the firms in our sample through 1987. Forty-three percent, or 104 of the original 240 firms, were still publicly traded at the end of that year.
As firms depart from the sample, by being acquired, going private, or going into bankruptcy or liquidation, they are replaced by the industrial firm that entered the CRSP file on the date closest to the departing firm’s date of departure. Our sample, therefore, maintains an age distribution, as measured by the number of years that firms have been nationally listed, that is representative of the population of industrial firms included in the CRSP file.
The number of firms departing the sample each year ranges from five (or 2% of the sample) in 1975 to 19 (or 8%) in 1984. An increase in the frequency of departures occurred in 1978 and persisted thereafter.
4. Managers’ control of voting shares
For each of the years 1973, 1978, and 1983, we examined the annual meeting proxy statement for each firm in our sample. If proxy statements for these years were unavailable we substituted proxy statements from nearby years. We were unable to obtain proxy statements for five firms. From the proxy statements, we collected data on the number of shares of common stock and voting preferred stock owned directly or indirectly by a firm’s top three officers (chief executive, president, and chairman of the board) and by the board of directors. We include voting shares held by members of an officer’s or director’s family, by trusts for any family member’s benefit, and by corporations or foundations controlled by the family. In effect we measure the number of votes assigned to all of the voting securities associated in the proxy statement with a particular officer or director.
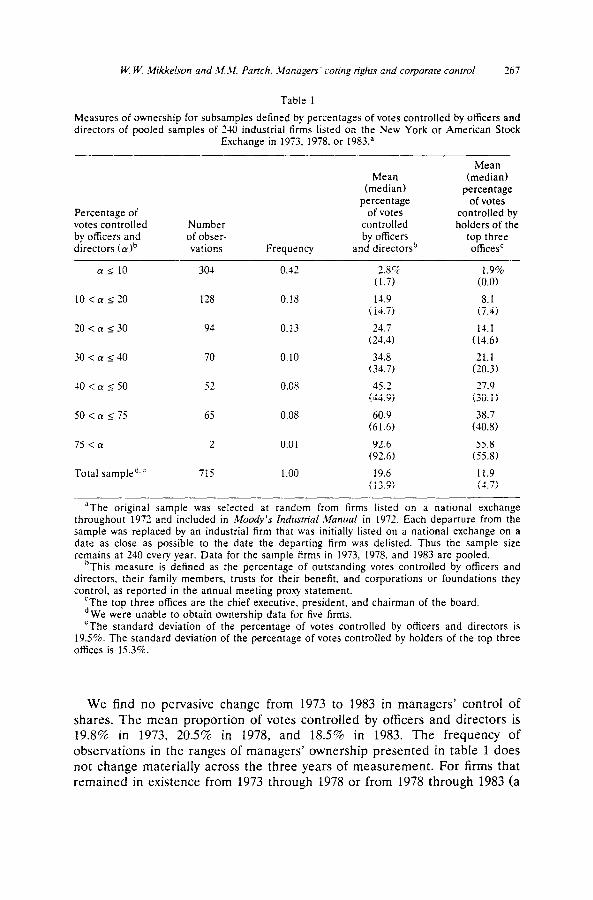
We focus on the percentage of outstanding votes controlled by officers and directors as a group (a>. Table 1 presents summary statistics for groups of observations defined by ranges of LY in the pooled 1973, 1978, and 1983 samples. The mean and median percentages of votes controlled by officers and directors are 19.6% and 13.9%. Overall, the percentage of votes con- trolled by officers and directors is less than or equal to 10% for 42% of the observations.
The mean and median percentages of votes controlled by the chief execu- tive, president, and chairman of the board are presented in column 5. The correlation between votes controlled by the holders of the top three offices and votes controlled by officers and directors is 0.80. In the remainder of the paper we focus on the proportion of votes controlled by officers and direc- tors. Our results are not materially affected by whether we examine officers’ and directors’ combined ownership or the ownership of the top three officers.
W W Mikkelson and .V..W Panch. .Clanagers’ coring rights and corporate control 267
Table 1
Measures of ownership for subsamples defined by percentages of votes controlled by otlicers and directors of pooled samples of 140 industrial firms listed on the New York or American Stock
Exchange in 1973, 1978. or 1983.”
Mean Mean (median)
(median) percentage percentage of votes
Percentage of of votes controlled by votes controlled Number controlled holders of the by officers and of obser- directors (ajb
by officers and directorsb
top three vations Frequency officesC
al IO 304 0.42 2.8% 1.9% (1.7) (0.0)
10 <a I20 128 0.18 11.9 8.1 (14.7) (7.4)
20 < a I 30 94 0.13 24.7 14.1 (24.4) (14.6)
30 < a I 40 70 0.10 34.8 21.1 (34.7) (20.3)
JO < (2 I 50 52 0.08 45.2 27.9 (44.9) (30.1)
50 < a I 75 65 0.08 60.9 38.7 (61.6) (40.8)
75 <ff 2 0.01 92.6 55.8 (92.6) (55.8)
Total sampled.e 715 1 .oo 19.6 11.9 (13.9) (4.7)
“The original sample was selected at random from firms listed on a national exchange throughout 1972 and included in Moody’s Indmtrial Manual in 1972. Each departure from the sample was replaced by an industrial firm that was initially listed on a national exchange on a date as close as possible to the date the departin g firm was delisted. Thus the sample size remains at 240 every year. Data for the sample firms in 1973, 1978, and 1983 are pooled.
bThis measure is defined as the percentage of outstanding votes controlled by officers and directors, their family members. trusts for their benefit, and corporations or foundations they control, as reported in the annual meeting proxy statement.
‘The top three offices are the chief executive. president, and chairman of the board. d We were unable to obtain ownership data for five firms. eThe standard deviation of the percentage of votes controlled by officers and directors is
19.5%. The standard deviation of the percentage of votes controlled by holders of the top three offices is 15.3%.
We find no pervasive change from 1973 to 1983 in managers’ control of shares. The mean proportion of votes controlled by officers and directors is 19.8% in 1973, 20.5% in 1978, and 18.5% in 1983. The frequency of observations in the ranges of managers’ ownership presented in table 1 does not change materially across the three years of measurement. For firms that remained in existence from 1973 through 1978 or from 1978 through 1983 (a
268 W. H. Mikkelson and M. M. Partch. Managers ’ toting rights and corporate control
total of 388 observations), we measured the change in managers’ holdings of votes over the five-year periods. Measures of managers’ ownership generally do not change appreciably in these intervals. For example, two-thirds of the firms experienced a change in managers’ holdings of votes, measured as a change in decima1 value, of less than 0.05 in absolute value.
The mean and median proportions of votes controlled by officers and directors that we report are generally higher than the proportions reported by Jensen and Warner (19881, who summarize measures of managers’ owner- ship reported in a number of recent studies. Those studies, however, examine samples limited to large firms or firms undertaking a particular action, such as the adoption of a charter amendment. Our sample, in contrast, is a cross-section of randomly selected firms. Because our sample is free of selection bias we believe our measures are useful benchmarks for assessing managers’ voting control. In the appendix we present summary measures of managers’ proportionate control of shares for firms grouped by the market value of equity.
5. Determinants of managers’ control
Managers’ voting power may be affected by factors other than their direct control of votes.* For example, total firm value can affect managers’ voting power because it corresponds to the amount of resources available to managers to resist a takeover and therefore to the costs of acquiring control of the firm. Increases in leverage that leave total firm value unchanged, such as a stock repurchase or a debt-for-equity exchange offer, also increase managers’ voting power. Staggered voting for directors strengthens managers’ control by raising the costs to outsiders of obtaining majority representation on the board. The size of significant blockholdings can lessen or increase managers’ control over the firm’s policies, depending on whether blockhold- ers oppose or support management’s policies.
We document these factors for our samples of firms and relate them to our measures of managerial control of votes. The value of the firm includes the market value of common stock, the book value of preferred stock, and the book value of long-term debt and current liabilities. The market value of shares is calculated using share price at the end of 1973, 1978, and 1983. All figures are in millions and have been converted to 1983 dollars. The leverage ratio is total book value of debt divided by the sum of total book value of debt, the book value of preferred stock, and the market value of equity. Balance-sheet data were collected from Moody’s lndusrriuf Manuals.
‘Brickley and James (1987) and Dann and DeAngelo (1988) provide evidence on actions managers take to compensate for less than complete voting control of their firms.
W W. Mikkelson and M.M. Panch, Managers roting rights and corporate control 269
From the proxy statements we collected information about voting rules, as well as substantial ownership of voting shares by individuals who are not officers or directors. Proxy statements report the use of staggered voting, but do not indicate whether a firm’s corporate charter includes a supermajority voting provision or a fair-price amendment. Beginning in 1973 firms were required to disclose in proxy statements the security ownership of holders of 10% or more of a class of voting securities. In 1978 the reporting require- ment was lowered to 5%.
We define three types of blockholders. The first type, unaffiliated block- holders, consists of individuals or corporations who have no representation on the board of directors. This category is most likely to include investors who monitor managers closely and who may oppose certain of their policies. The second type, affiliated blockholders, is defined as individuals or corpora- tions who are represented on the board. The third type is financial institu- tions, foundations, estates, or employee stock-ownership plans. We believe the second and third types include a larger fraction of investors whose interests are aligned with management, because they have board representa- tion or possibly financial dealings with the firtn3
5.1. Lecels of managers’ Coting control
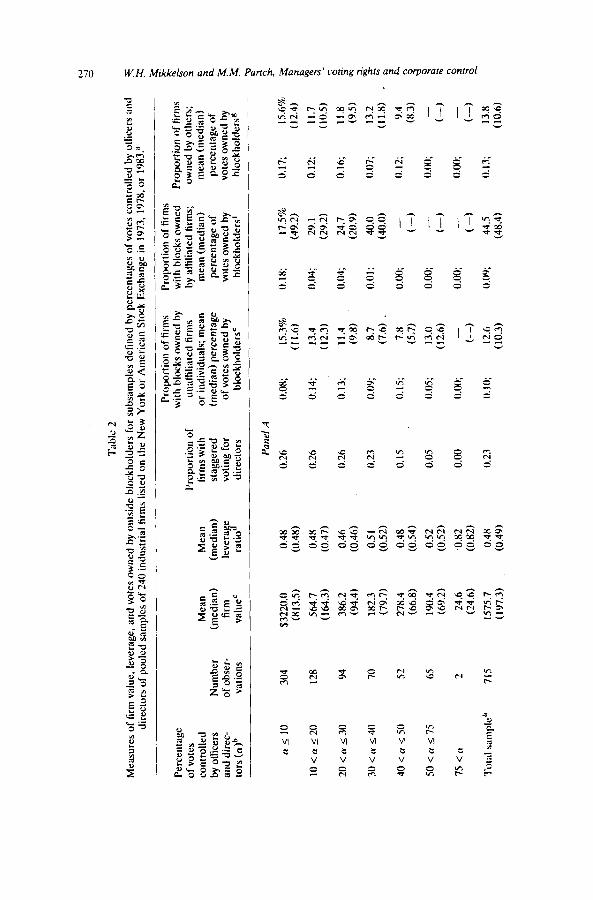
Panel A of table 2 presents descriptive statistics on firm value, leverage ratio, frequency of staggered voting, and frequency and size of reported blockholdings for groups of firms defined by ranges of managers’ voting rights. Panel B reports simple as well as partial correlations between man- agers’ voting rights and the measures described in panel A. We find a significant negative association between managers’ voting rights and firm value. The simple correlation between firm value and cx is -0.48, consistent with the results of Demsetz and Lehn (1985). Firm value is more highly correlated with managers’ proportionate control of votes than with any other firm characteristic we examine.
Leverage is unrelated to the proportion of votes controlled by officers and directors, in contrast to the findings of Friend and Lang (19881, who report a negative association between management stockholdings and leverage.
Staggered voting is negatively correlated with managers’ voting rights. Sut only when the proportion of votes controlled by managers exceeds 0.40 does the frequency of staggered voting decline appreciably. For lower levels of ownership there is virtually no association between managers’ proportionate control of votes and staggered voting.
3Brickley, Lease, and Smith (1988) distinguish behveen blocks owned by individuals or corporations and blocks owned by institutional investors. Their evidence suggests these groups of blockholders vote differently on corporate charter amendments.
Tab
le
2
Mea
sure
s o
f fi
rm v
alu
e,
leve
rag
e,
and
vo
tes
ow
ned
b
y o
uts
ide
blo
ckh
old
ers
for
sub
sam
ple
s d
efin
ed
by
per
cen
tag
es
of
vote
s co
ntr
olle
d
by
olt
icer
s an
d
dir
ecto
rs
of
po
ole
d
sam
ple
s o
f 24
0 in
du
stri
al
tirm
s lis
ted
o
n t
he
New
Y
ork
o
r A
mer
ican
S
tock
E
xch
ang
e in
197
3,
1978
, o
r 19
X3.
” $ %
=r
Per
cen
tag
e o
f vo
tes
con
tro
lled
b
y o
ffic
ers
and
dir
ec-
tors
(o
jb
Nu
mb
er
of
ob
ser-
va
tio
ns
Mea
n
(med
ian
) fi
rm
valu
e’
Mea
n
(med
ian
) le
vera
fj
rati
o
Pro
po
rtio
n
of
tirm
s w
ith
st
agg
ered
vo
tin
g
for
dir
ecto
rs
Pro
po
rtio
n
of
firm
s w
ith
b
lock
s o
wn
ed
by
un
affi
liate
d
firm
s o
r in
div
idu
als;
m
ean
(m
edia
n)
per
cen
tag
e o
f vo
tes
ow
ned
b
y b
lock
ho
lder
C
Pro
po
rtio
n
of
tirm
s w
ith
b
lock
s o
wn
ed
by
ath
liate
d
tirm
s;
mea
n
(med
ian
) p
erce
nta
ge
of
vote
s o
wn
ed
by
blo
ckh
old
ers’
Pro
po
rtio
n
of
firm
s o
wn
ed
by
oth
ers;
$ a
mea
n
(med
ian
) S
-a
per
cen
tag
e o
f S
.
vote
s o
wn
ed
by
%
blo
ckh
old
erss
%
11 s
IO
304
lO<l
xS20
12
8
20<a
_<30
94
30<a
<40
70
40<d
I50
52
50<n
<75
65
75<a
2
To
tal
sam
ple
” 71
5
$322
0.0
0.48
(8
13.5
) (0
.4X
)
564.
7 0.
48
(164
.3)
(0.4
7)
386.
2 0.
46
(94.
4)
(0.4
6)
182.
3 0.
51
(79.
7)
(0.5
2)
27X
.4
0.48
(6
6.8)
(0
.54)
190.
4 0.
52
(69.
2)
(0.5
2)
24.6
0.
x2
(24.
6)
(0.X
2)
1575
.7
0.48
(1
97.3
) (0
.49)
Pad
A
0.26
0.26
0.26
0.23
0.15
0.05
0.00
0.23
0.0x
; 15
.3%
(1
1.6)
0.14
; 13
.4
(12.
3)
0.13
; 11
.4
(9.8
)
0.09
; $;
I, .
0.15
; 7.
8
(527
)
0.05
; 13
.0
(12.
6)
0.00
;
C,
0. I
O;
12.6
(1
0.3)
-
0.18
; 17
.5%
(4
9.2)
0.04
; 29
. I
(29.
2)
0.04
; 24
.7
(20.
9)
0.01
; 40
.0
(40.
0)
0.00
;
(1,
0.00
;
(1,
0.00
; - t-_)
0.09
; 44
.5
(48.
4)
0.17
;
0.12
;
0.16
;
0.07
;
0.12
;
osw
);
0.00
;
0.13
;
11.7
8 3
(10.
5)
?-
11.x
0 3
(9.5
) ;,
13.2
2
(11.
X)
I a
9.4
S_
(X.3
) $ 0
G
4 ii
“0
- z
t-_)
5
13.x
(1
0.6)
3
Pu
nel
R:
Par
tial
co
rrel
atio
n
coef
fici
ents
w
ith
p
erce
nta
ge
of
vote
s co
ntr
olle
d
by
olf
icer
s an
d
dir
ecto
rs
(sim
ple
co
rrel
atio
n
coel
tici
ents
in
par
enth
eses
)’
z
-0S
li 0.
00
- 0.
2 I i
-o
.~si
-
0.32
i
-0.1
6’
1 (-
0.4(
li)
(0.0
7)
(-0.
13’)
(
- 1)
.03)
(
- 0.
23’)
(-0.
14’)
__
_-.._
_ z
..-
__~
- __
_..-
“Th
e o
rig
inal
sa
mp
le
was
sel
ecte
d
at r
and
om
fr
om
fi
rms
liste
d o
n a
nat
ion
al
exch
ang
e th
rou
gh
ou
t 19
72
and
in
clu
ded
in
M
oo
cly’
s ln
du
sfri
ul
Mu
nu
ul
~~~
__-
%
in
lY72
. E
ach
d
epar
ture
fr
om
th
e sa
mp
le
was
re
pla
ced
b
y an
in
du
stri
al
firm
th
at
was
in
itia
lly
liste
d
on
a
nat
ion
al
exch
ang
e o
n
a d
ate
as c
lose
as
$
po
ssib
le
to t
he
dat
e th
e d
epar
tin
g
firm
w
as d
elis
ted
. T
hu
s sa
mp
le
size
re
mai
ns
at
240
ever
y ye
ar.
Dan
a fo
r th
e sa
mp
le
firm
s in
19
73,
1978
, an
d
19x3
z
are
po
ole
d.
hT
his
m
easu
re
is d
efin
ed
as t
he
per
cen
tag
e o
f o
uts
tan
din
g
vote
s co
ntr
olle
d
by
oH
icer
s an
d
dir
ecto
rs,
thei
r fa
mily
m
emb
ers,
tr
ust
s fo
r th
eir
ben
efit
, ;P
and
co
rpo
rati
on
s o
r fo
un
dat
ion
s th
ey
con
tro
l, as
rep
ort
ed
in t
he
ann
ual
m
eeti
ng
p
roxy
st
atem
ent.
a
“Fir
m
valu
e is
th
e su
m o
f th
e b
oo
k va
lues
o
f cu
rren
t ti
ahili
ties
, lo
ng
-ter
m
deb
t,
and
p
refe
rred
st
ock
p
lus
the
mar
ket
valu
e o
f co
mm
on
st
ock
. lk
wtk
_*
valu
es
wer
e o
bta
ined
fr
om
M
oo
dy’
s In
du
srri
ul
Mu
mu
ls
in
1973
, 19
78,
and
19
83.
Th
e m
arke
t va
lue
of
ou
tsta
nd
ing
sh
ares
is
cal
cula
ted
u
sin
g s
har
e 2 4
pri
ce
at
the
end
o
f 19
73,
1978
, o
r 19
83.
All
fi
gu
res
are
in m
illio
ns
and
h
ave
bee
n
con
vert
ed
to
1983
d
olla
rs.
“Th
e le
vera
ge
rati
o
is t
ota
l d
ebt
(th
e b
oo
k va
lue
of
lon
g-t
erm
d
ebt
plu
s cu
rren
t lia
bili
ties
) d
ivid
ed
by
the
sum
o
f to
tal
deb
t,
the
bo
ok
valu
e o
f 5 8
pre
ferr
ed
sto
ck,
and
th
e m
arke
t va
lue
of
equ
ity.
B
alan
ce
shee
t d
ata
wer
e co
llect
ed
fro
m
M&
y’s
//rd
~rri
u/
Mu
wd
s.
‘Un
alti
liate
d
firm
s o
r in
div
idu
als
are
tho
se
wit
ho
ut
rep
rese
nta
tio
n
on
th
e b
oar
d
of
dir
ecto
rs.
Blo
ckh
old
ing
s ar
e re
po
rted
in
th
e an
nu
al
mee
tin
g
8.
c
pro
xy
stat
emen
ts.
8
‘Afi
liate
d
firm
s ar
e th
ose
re
pre
sen
ted
b
y a
dir
ecto
r o
r to
p o
ffic
er
on
th
e sa
mp
le
firm
’s
bo
ard
o
f d
irec
tors
. B
lock
ho
ldin
gs
are
rep
ort
ed
in t
he
ann
ual
2.
mee
tin
g
pro
xy
stat
emen
ts.
6 sO
ther
b
lock
ho
lder
s in
clu
de
linan
cial
in
stit
uti
on
s,
fou
nd
atio
ns,
es
tate
s,
and
em
plo
yee
sto
ck
ow
ner
ship
p
lan
s.
Blo
ckh
old
ing
s ar
e re
po
rted
in
th
e 2
an;u
al
mee
tin
g
pro
xy
stat
emen
ts.
LX
We
wer
e u
nab
le
to o
bta
in
ow
ner
ship
d
ata
for
five
tir
ms.
‘P
ears
on
co
rrel
atio
ns
are
rep
ort
ed.
Sp
earm
an
ran
k co
rrel
atio
ns
wer
e al
so c
alcu
late
d;
they
ar
e ve
ry
sim
ilar
IO t
he
Pea
rso
n
corr
elat
ion
s.
Th
e lo
g o
f 2 8
firm
va
lue
was
use
d
in c
alcu
lati
ng
co
rrel
atio
ns.
‘S
ign
ific
ant
at 0
.01
leve
l. R
8 9 e
272 W. H. Mkkelson and M.M. Partch, Managers’ coring rights and corporate control
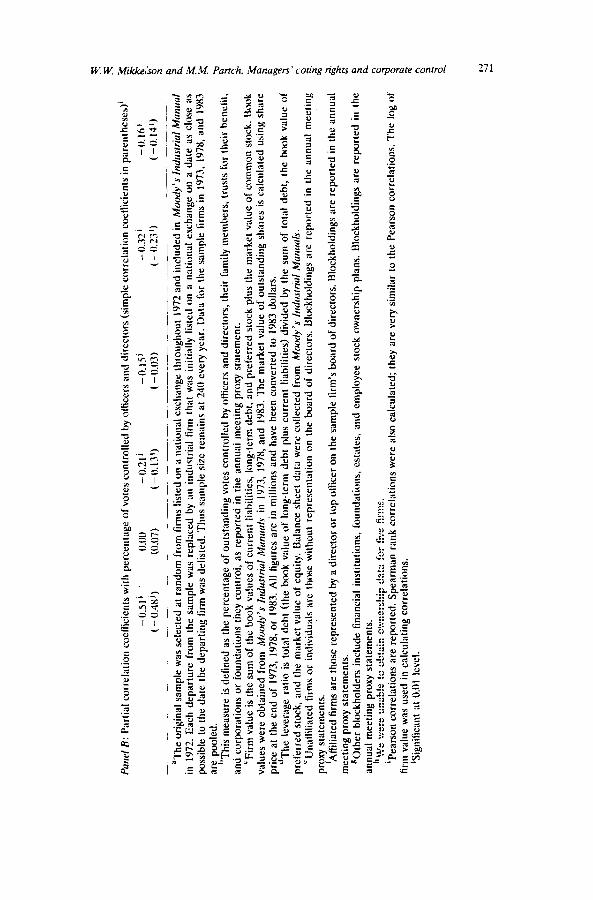
The frequency of each of the three types of blockholdings is about 0.10 in the entire sample. The average stake is approximately 13% of outstanding shares for unaffiliated and financial blockholders. For blockholders with board representation the average stake is almost 45%. Managers’ ownership of votes is negatively correlated with the proportion of votes controlled by each of the three types of blockholders. This negative association, however, may simply reflect that the sum of proportional shareholdings is bounded by one.
5.2. Changes in managers’ control
If managers take advantage of their opportunities to modify capital struc- ture or to change voting rules to maintain effective voting power when their proportionate vote ownership changes, we should find a relation between changes in managers’ control of votes and changes in other factors during the same periods.
We find no significant or systematic relations between changes in the proportion of shares controlled by officers and directors over five-year inter- vals and changes in other potential determinants of managers’ voting power. If other determinants of managers’ voting control affect managers’ vote ownership, our evidence suggests that the relation is between levels of these variables, rather than between changes in the levels. Therefore, in the tests that follow of a relation between managers’ voting rights and the incidence of control events, we control for the levels of other determinants of managers’ voting power.
6. Managers’ voting rights and control events
In section 6.1, we investigate the relation between managers’ control of voting rights and completed changes in control of firms. In section 6.2 we examine takeover attempts. The outcomes of takeover attempts are analyzed in section 6.3.
6.1. Changes in control
We classify firms by outcomes that occur within four years of our measure- ment of management ownership of voting rights in 1973, 1978, and 1983. The outcomes we consider are the completion of an acquisition by another party, completion of a going-private transaction, bankruptcy or liquidation, and still publicly traded. For example, a firm that was acquired in 1980 is classified as still traded in the 1973-1977 period, and as acquired in the 1978-1982 period. Firms with an outstanding offer to be acquired are classified as still
W W. MiXkeLson and MM. Parrch, Managers coring rights and corporate control 273
traded if the control transfer is not completed by the end of the four years following measurement of managers’ voting rights.
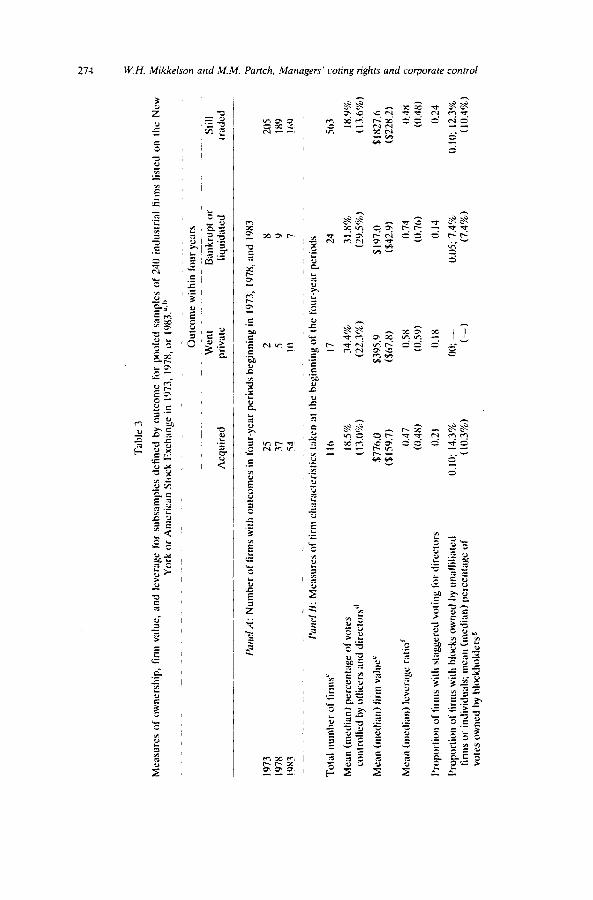
Panel A of table 3 presents the distributions of firms in 1973, 1978, and 1983 by one of the outcomes at the end of four years. Over time the proportion of firms acquired increases, from 10% in 1973-1977, to 15% in 1978-1982, to 23% in 1983-1987. The proportion of firms still publicly traded four years after our measurements of managers’ ownership falls from 85% in 1973 to 72% in 1983.
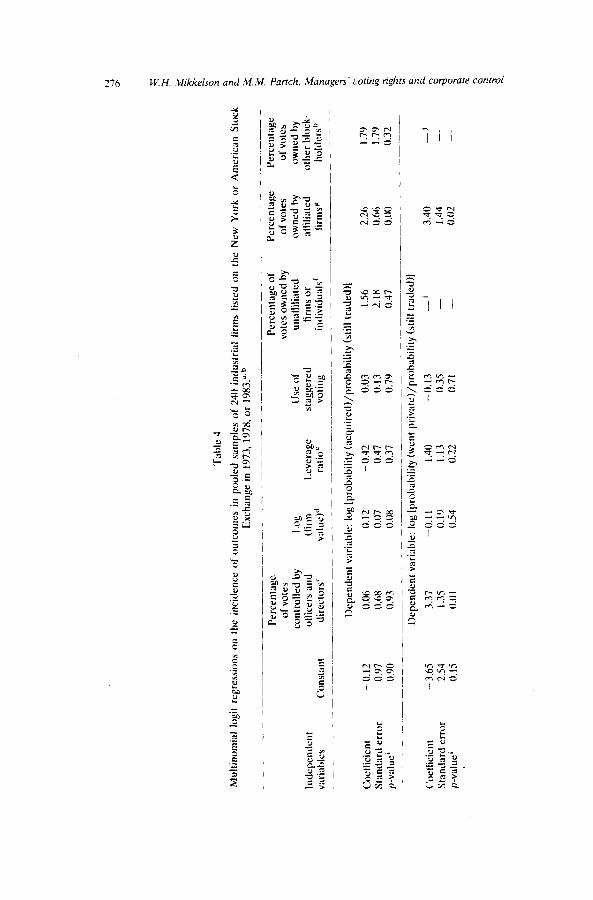
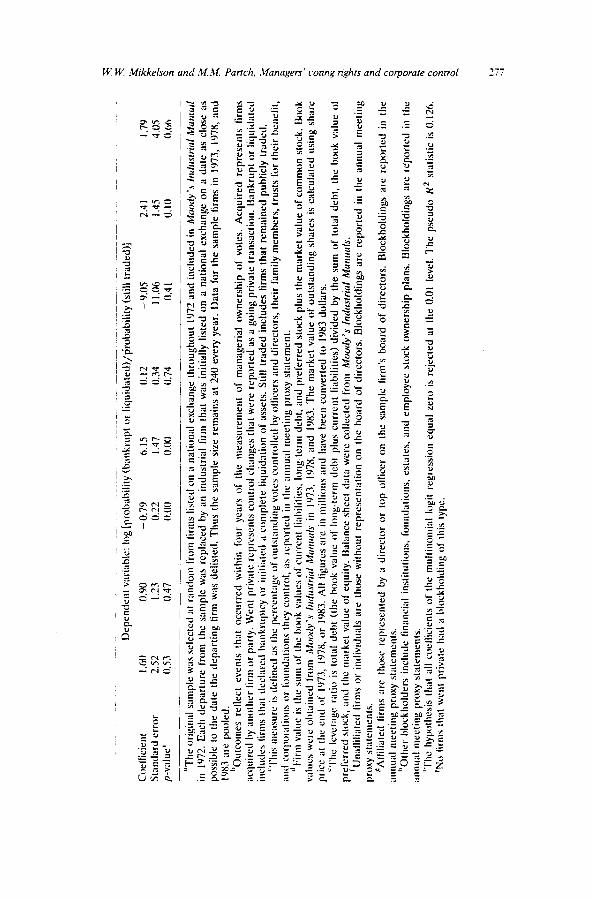
In panel B of table 3 we pool the data and report measures of vote ownership, firm value, leverage, staggered voting, and the presence of outside blockholdings for groups of sample firms defined by the four outcomes. The measures reported are taken at the beginning of the four-year periods in which outcomes are defined. A multinomial logit regression analysis of these data, based on the model presented by Theil (1969), is reported in table 4. The default outcome in our specification of the multinomial regression is still publicly traded. This means the coefficients we estimate must be interpreted as the effect of an independent variable on the log of the ratio of the probability of a control change, for example, to the probability of being still traded. The results of our analysis are not affected by whether we analyze subperiods separately or pool the data.
Our most striking finding is the absence of an association between manage- rial control of voting rights and the incidence of completed control changes in the following four years. The results in table 3 indicate that the mean and median proportions of voting rights controlled by officers and directors are very similar for the firms that remain traded and those that are acquired. Table 4 indicates that the likelihood of a completed acquisition is not related to managers’ holdings of votes, but is related negatively to total firm value at the 0.08 significance level. The holdings of an outside blockholder with board representation are positively related to the likelihood of a control change. Financial leverage, staggered voting, and blockholdings of investors without board representation are not related to the probability of a change in contr01.4
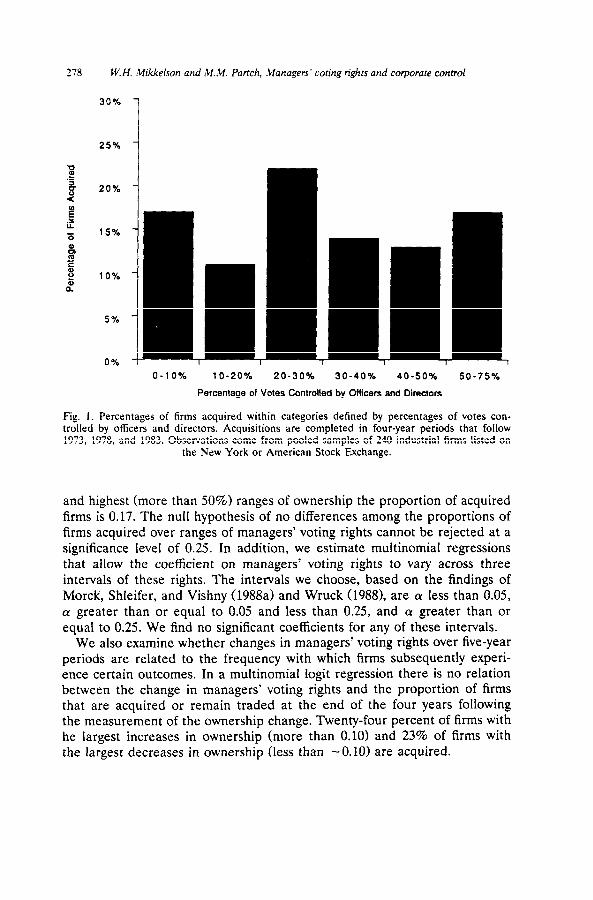
Because we test only for linear relations in table 4, we investigate whether the relation between managers’ voting rights and outcomes is nonlinear. In fig. 1 we present outcomes for groups defined by ranges of managers’ holdings. The proportion of firms acquired ranges from a low of 0.11 when managers own between 10% and 20% of votes to a high of 0.22 when managers own between 20% and 30% of votes. In the lowest (less than 10%)
4Holderness and Sheehan (1988) report no substantial difference between the incidence of control changes for firms with and without a majority shareholder. Palepu (1986) examines determinants other than managers’ shareholdings on the frequency of takeovers. He finds, as we do, that larger firms are less likely to be taken over. But Palepu also reports some evidence of an inverse relation between the probability of a takeover and financial leverage.
Tab
le
3
Mea
sure
s o
f o
wn
ersh
ip,
firm
va
lue,
an
d
leve
rag
e fo
r su
bsa
mp
les
det
ined
b
y o
utc
om
e fo
r p
oo
led
sa
mp
les
of
240
ind
ust
rilr
l fi
rms
liste
d
on
th
e N
ew
Yo
rk
or
Am
eric
an
Sto
ck
Exc
hu
ng
e in
lY
73,
lY78
, o
r IY
83.“
,h
_ ~_
.~
~~~_
~__
~~
._
_~_~
~
~ ~
~~
_ _
Ou
tco
me
wit
hin
fo
ur
year
s
Wen
t B
ankr
up
t o
r S
till
Acq
uir
ed
pri
vate
liq
uid
nte
d
t rad
rd
Pu
trd
A:
Nu
mb
er
of
tirm
s w
ith
o
utc
om
es
in f
ou
r-ye
ar
per
iod
s b
egin
nin
g
in
1973
, 19
78,
and
19
83
I973
25
2
8 19
7x
37
5 Y
19
83
54
10
7
I’md
B: M
easu
res
of
firm
ch
arac
teri
stic
s t;
lken
;I
I th
e h
egin
nin
g
of
the
fou
r-ye
ar
per
iod
s
To
tal
nu
mb
er
of
lirm
s’
I I6
17
24
Mea
n
(med
ian
) p
erce
nta
ge
of
VO
ICS
1X
.5%
34
.4%
31
.X%
co
ntr
olle
d
by
olli
cers
an
d d
irec
tors
” (1
3.(1
%%
,)
(22.
3%))
(2
Y.5
%)
Mea
n
(med
ian
) li
rm
vdu
re
$776
.0
53Y
5.Y
$l
Y7.
0 ($
150.
7)
($h
7.X
) ($
42.‘)
)
Mea
n
(med
ian
) le
vera
ge
rati
o’
0.47
0.
5x
0.74
(0
.4X
) (0
.5’~
) (0
.70)
Pro
po
rtio
n
of
lirn
is w
ilb
st
ng
ger
ed
voti
ng
fo
r d
irec
tors
0.
2 I
0.1x
0.
14
Pro
po
rtio
n
of
lirm
s w
ith
b
lock
s o
wn
ed
hy
un
allil
i;tt
ed
0.10
; 14
.3%
(l
o;
- 0
05.
7.4%
.
>
lirm
s o
r in
div
idu
als;
m
ean
(m
rdi;
m)
per
cen
tag
e o
f (1
0.3%
) (-
-_)
(7.4
%)
vote
s o
wn
ed
hy
hlo
ckb
old
ersg
205
IX’)
I 0
9
503 IX
.‘)%
C
IB.c
~%)
$182
7.6
($22
X.2
)
0.4x
(0
.4H
)
0.24
0. I
O;
12.3
%
(10.
4%)
Pro
po
rlio
n
of
firm
s w
ith
b
lock
s o
wn
ed
by
afti
tiat
ed
0.19
; 47
.2%
0.
24;
37.3
90
0.18
; 43
.9%
0.
06;
43.7
%
firm
s; m
ean
(m
edia
n)
per
cen
tag
e o
f vo
tes
ow
ned
b
y b
lock
ho
lder
s”
(4X
.6%
) (3
6.6%
) (4
4.2%
) (4
4.7%
)
Pro
po
rtio
n
of
firm
s w
ith
b
lock
s o
wn
ed
by
oth
ers;
m
ean
0.
16;
12.3
%
0.0;
-
0.14
; I 1.
9%
0.1
I;
15.0
%
(med
ian
) p
erce
nta
ge
of
vote
s o
wn
ed
by
bto
ckh
otd
ers’
(9
.3%
) (-
-_)
(I
1.8%
) (1
2.0%
) __
-.
___
_ ~.
__.
.~~.
“Th
e o
rig
inal
sa
mp
le
was
sel
ecte
d
at r
and
om
fr
om
fi
rms
liste
d
on
a n
atio
nal
ex
chan
ge
thro
ug
ho
ut
1972
an
d
incl
ud
ed
in
Mo
vdy’
s /r
~clu
s~ri
u/ Munuul
in
1972
. E
ach
d
epar
ture
fr
om
th
e sa
mp
le
wils
rep
lace
d
by
an
ind
ust
rial
fi
rm
that
w
as
init
ially
lis
ted
o
n
a n
atio
nal
ex
chan
ge
on
a
dal
e as
clo
se
as
po
pib
le
to t
he
dat
e th
e d
epar
tin
g
firm
w
as d
elis
ted
. T
hu
s th
e sa
mp
le
size
re
mai
ns
at 2
40
ever
y ye
ar.
Ou
tco
mes
re
Hec
1 ev
en&
th
at
occ
urr
ed
wit
hin
fo
ur
year
s o
f th
e m
easu
rem
ent
of
man
ager
ial
ow
ner
ship
o
f vo
tes.
A
cqu
ired
re
pre
sen
ts
tirm
s ac
qu
ired
b
y an
oth
er
firm
o
r p
arty
. W
ent
pri
vate
re
pre
sen
ts
con
tro
l ch
ang
es
that
w
ere
rep
ort
ed
as a
go
ing
-pri
vare
tr
ansa
ctio
n.
Ban
kru
pt
or
liqu
idat
ed
incl
ud
es
firm
s th
at
dec
lare
d
ban
kru
ptc
y o
r in
itia
ted
a
com
ple
te
liqu
idat
ion
o
f as
sels
. S
rill
trad
ed
incl
ud
es
firm
s th
at
rem
ain
ed
pu
blic
ly
trad
ed.
‘We
wer
e ab
le
to d
eter
min
e th
e st
atu
s o
f al
l o
f o
ur
sam
ple
ti
rms
at
the
end
o
f ea
ch
of
the
fou
r-ye
ar
per
iod
s.
I Ien
ce
lhe
tota
l n
um
ber
o
f lir
ms.
ac
;oss
all
ou
lco
mes
, is
720
. I l
ow
ever
, w
e w
ere
able
IO
ob
(ain
o
wn
ersh
ip
Dad
a fo
r o
nly
71
5 lir
ms.
T
his
m
eaS
ure
is
def
ined
as
th
e p
erce
nta
ge
of
ou
tsta
nd
ing
vo
les
con
tro
ttcd
b
y cr
ltic
crb
an
d
dir
ecto
rs,
thei
r fa
mily
m
emb
ers,
tr
ust
s fo
r Ih
cir
ben
dii,
an
d
corp
ora
lion
s o
r ti
mn
ttal
ion
s Ih
ey
con
lro
t,
as r
rpo
rlet
t in
lh
e ai
inu
al
nie
elin
g
t”-o
xy s
tale
mcn
l. ‘F
irm
va
lue
is t
he
sum
of
Ihe
bo
ok
valu
es
of
curr
ent
liab
itili
es,
ton
g-t
erm
d
ebI,
and
p
refe
rred
st
ock
p
lus
the
mar
ket
valu
e o
f co
mm
on
sl
ack.
B
oo
k va
lues
w
ere
ob
tain
ed
fro
m Moody's /rr
r/u
srri
d
Mur
rds
in
1973
, 19
78,
and
19
83.
Th
e m
arke
t va
lue
of
ou
tsta
nd
ing
sh
ares
is
cat
cuta
(ed
u
sin
g
shar
e p
r$e
at
the
end
o
f 19
73,
1978
, o
r I9
K3.
A
ll
tig
urc
s ar
e in
mill
ion
s an
d
hav
e b
een
co
nve
rted
IO
I98
3 d
olla
rs.
Th
e le
vera
ge
rati
o
is t
ota
l d
ebt
(th
e b
oo
k va
lue
of
lon
g-t
erm
d
ebt
plu
s cu
rren
t lia
bili
ties
) d
ivid
ed
by
the
sum
o
f to
tal
deb
t,
rhe
bo
ok
valu
e o
f p
refe
rred
st
ock
, an
d
the
mar
ket
valu
e o
f eq
uit
y.
Bal
ance
sh
erc
dat
a w
ere
colle
cted
fr
om
M
oo
dy’
s hc
krr~
id
Mu
rmu
ts.
“Un
aHit
iale
d
firm
s o
r in
div
idu
als
are
Iho
se
wit
ho
ut
rep
rese
nta
tio
n
on
th
e b
oar
d
of
dir
ecto
rs.
Blo
ckh
old
ing
s ar
e re
po
rted
in
th
e an
nu
al
mee
tin
g
prt
xy
stat
emen
ts.
Aft
itia
ted
fi
rms
are
tho
se
rep
rese
nte
d
by
a d
irec
tor
or
lop
o
ltic
er
on
th
e sa
mp
le
firm
’s
bo
ard
o
f d
irec
tors
. B
lock
ho
ldin
gs
are
rep
orl
ed
in
Ihe
ann
ual
m
eeti
ng
p
roxy
st
atem
ents
. ‘O
ther
b
lock
ho
lder
s in
clu
de
fin
anci
al
inst
itu
tio
ns,
fo
un
dat
ion
s,
esla
tes,
an
d
emp
loye
e st
ock
o
wn
ersh
ip
pla
ns.
B
lock
ho
ldin
gs
are
rep
orl
ed
in
lhe
ann
ual
m
relin
g
pro
xy
sta(
emen
ts.
Mu
llin
om
ial
log
il
reg
ress
ion
s o
n
the
inci
den
ce
of
ou
tco
mes
in
p
oo
led
sa
mp
les
of
240
intl
ust
ri;r
l H
rms
liste
d
on
th
e N
ew
Yo
rk
or
Am
cria
n
Sla
ck
Exc
han
ge
in 1
973,
19
78,
or
19X
3.“.
”
Ind
epen
den
t va
riab
les
Co
nsl
an
t
Per
cen
tag
e o
f vo
tes
con
tro
lled
b
y o
Hic
ers
and
d
irec
tors
’
Lo
g
(tir
m
valu
e)J
Lev
erag
e ra
lio”
.___
____
P
erce
nta
ge
of
vote
s o
wn
ed
by
Use
o
f u
naf
filia
ted
st
agg
ered
fi
rms
or
voti
ng
in
div
idu
als’
Per
cen
tag
e P
erce
nta
ge
of
voIe
s o
f vo
tes
ow
ned
b
y o
wn
ed
by
aHili
nte
d
oth
er
blo
ck-
firm
s’
ho
lder
s”
____
__
__
Dep
end
ent
vari
able
: lo
g [
pro
bab
ility
(a
cqu
ired
)/p
rob
abili
ty
(sti
ll tr
aded
)]
Co
eHic
ien
t -0
.12
0.06
-0
.12
- 0.
42
0.03
I.5
6 2.
26
I .I9
S
tan
dar
d
erro
r 0.
07
0.08
0.
07
0.47
0.
I3
2.1X
0.
66
1.7Y
p
-v;1
lue’
0.
00
KY
3 0.
08
0.37
0.
7Y
0.47
0.
00
(I.3
2
Dep
end
ent
vari
able
: lo
g (
pro
bab
ility
(w
ent
pri
vate
)/p
rob
abili
ty
(sti
ll tr
aded
)]
Co
ellic
ien
l -
3.65
3.
31
-0.1
I
I .40
-0
.13
-1
3.40
I
Sta
nd
ard
er
ror
2.54
t .
35
0.1
Y
1.13
0.
3s
- I .
44
- p
-val
ue’
0.
15
0.01
0.
54
0.22
0.
71
- 0.
02
-
~I
-..-
_
_
I,_
. . .
. . . . .
. . . _
. “_
. ..L
. . . . .
. . . . .
.._.
.._.._
__-.
. .
. ,
De
pe
nd
ttu
t va
riab
le:
log
[p
rob
ab
ility
(b
an
kru
pl
or
liqu
ida
ted
)/~
rob
ah
ility
(s
till
trad
ed)]
Co
elti
cien
t I h
o 0.
90
- 0.
79
6.15
0.
12
- 9.
05
2.4
1 I .7
1 S
tan
dar
d
erro
r 2.
52
I.23
0.22
1.
47
0.34
1 I
.06
1.45
4.
05
/I-v
;lll
le'
0.53
0.
47
0.00
0.
00
0.74
0.
4 I
0.10
0.
66
“Th
e o
rig
inal
sa
mp
le
was
sel
ecte
d
at r
and
om
fr
om
fi
rms
liste
d
on
a
nat
ion
al
exch
ang
e th
rou
gh
ou
t 10
72
and
in
clu
ded
in
M
ou
tly’
s /n
&rs
rric
rl
Mu
nn
ctf
in
1972
. E
ach
d
epar
ture
fr
om
th
e sa
mp
le
was
re
pla
ced
b
y an
in
du
stri
al
firm
th
at
was
in
itia
lly
liste
d
on
a
nat
ion
al
exch
ang
e o
n
a d
ate
as c
lose
as
p
oss
ible
to
th
e d
ate
the
dep
arti
ng
Ii
rm
was
del
iste
d.
Th
us
the
sam
ple
si
ze
rem
ain
s at
24
0 ev
ery
year
. D
ata
for
the
sam
ple
fi
rms
in
1973
, 19
78,
and
IV
83
are
po
ole
d.
“Ou
tco
mes
re
llect
ev
ents
th
at
occ
urr
ed
wit
hin
fo
ur
year
s o
f th
e m
easu
rem
ent
of
man
ager
ial
ow
ner
ship
o
f vo
tes.
A
cqu
ired
re
pre
sen
ts
firm
s ac
qu
ired
b
y an
oth
er
lirm
o
r p
arty
. W
en
l p
riva
te
rep
rese
nts
c
ou
th-0
1 ch
an
ge
s th
at
we
re
rep
ort
ed
ii
s il
go
ing
pri
vate
tr
ansa
ctio
n.
Ban
kru
pl
or
liqu
idat
ed
incl
ud
es
firm
s th
at
dec
lare
d
ban
kru
plc
y o
r in
itia
ted
;I
co
mp
lele
liq
uid
atio
n
of
asse
ts.
Still
tr
aded
in
clu
des
lir
ms
that
re
mai
ned
p
ub
licly
tr
aded
. “T
his
II
IC;I
SIII
'C is
de
linc
tl as
(h
e p
erce
nta
ge
of
ou
tsta
nd
ing
vo
les
con
tro
lled
b
y o
tlic
crs
and
d
irec
tors
, th
eir
fam
ily
mem
ber
s,
tru
sts
for
thei
r b
enel
il,
anA
l co
rpo
ralio
ns
or
fou
nd
alio
ns
they
co
nlr
ol,
as r
epo
rted
in
th
e ;~
nn
ual
mee
ling
p
roxy
sl
atem
enl.
Fir
m
valu
e is
th
e SI
IIII
ol'
th
e h
oo
k v
;du
es
of
cu
rre
nt
liab
ilitie
s,
lon
g-t
ern
1 d
eb
t.
an
d p
refe
rre
d
sto
ck
p
lus
the
mar
ket
valu
e o
f co
mm
on
sm
ck.
Bo
ok
valu
es
wer
e o
bta
ined
fr
om
M
oody
’s
Imhr
s~ic
rl
MW
IUN
/~ in
19
73,
197X
, a
nd
19
X3.
Th
e m
arke
t va
lue
of
ou
tsla
nd
ing
sh
ares
is
cal
cula
ted
u
sin
g
shar
e p
rice
at
th
e en
d
of
1973
, 11
78,
or
1183
. A
ll
ligu
res
are
in m
illio
ns
and
h
ave
bee
n
con
vert
ed
io
1983
d
olla
rs.
‘Th
e le
vera
ge
rati
o
is t
ota
l d
ebt
(th
e b
oo
k va
lue
of
lon
g-l
erm
d
ebt
plu
s cu
rrcn
l lia
hili
lies)
d
ivid
ed
by
the
sum
o
f to
tal
d&
l, th
e b
oo
k va
lue
01
pr:
ferr
ed
sto
ck,
and
th
e m
arke
t va
lue’
of
equ
ity.
B
alan
ce
shee
t d
ata
wer
e co
llect
ed
fro
m
Moo
dy’s
In
hsrr
iul
Mun
ds.
Un
allil
iate
d
lirm
s o
r in
div
idu
als
are
tho
se
wit
ho
ut
rep
rese
nta
tio
n
on
th
e h
oar
d
of
dir
ecto
rs.
Blo
ckh
old
ing
s ar
e re
po
rted
in
th
e an
nu
al
mee
tin
g
pro
xy
stat
emen
ts.
“Mili
aled
lir
ms
are
tho
se
rep
rese
nte
d
by
a d
irec
tor
or
top
o
ltic
er
on
th
e sa
mp
le
firm
’s
ho
ard
o
f d
irec
tors
. B
lock
ho
ldin
gs
are
rep
ort
ed
in
the
iln
;;u
al
mee
tin
g
pro
xy
stal
emrn
ts.
Oth
er
blo
ckh
old
ers
incl
ud
e lin
anci
al
insM
uti
on
s,
fou
nd
atio
ns,
es
tate
s,
and
em
plo
yee
sto
ck
ow
ner
ship
p
lan
s.
Blo
ckh
old
ing
s ar
e re
po
rted
in
th
e an
nu
al
nie
elin
y p
roxy
si
atem
ents
. ‘T
he
hyp
olh
esis
th
at
all
coet
tici
ents
o
f th
e m
uit
ino
mia
l lo
git
reg
ress
ion
e
qu
al
zero
is
re
jec
ted
at
th
e O
.OI
leve
l. Th
e
pse
ud
o
R2
stat
isti
c is
0.1
26.
‘No
fi
rms
that
W~
III
pri
vale
h
ad
a b
lock
ho
ldin
g
of
this
ty
pe.
W. H. Mikkelson and ,LI.M. Partch, Managers’ coring rights and corporate control
25%
20%
15%
10%
5 %
0 % I I 7- -1
0-10x 1 O-20% 20-30% 30-40% 40-50% so-75%
Percentage of Votes Controlled by Officers and Directors
ges of tirms acquired within categories defined by percentages of votes con- rs and directors. Acquisitions are completed in four-year periods that follow 1983. Observations come from pooled samples of 240 industrial firms listed on
the New York or American Stock Exchange.
Fig. 1. Perter ita trolled by offi se1 1973, 1978, ar Id
and highest (more than 50%) ranges of ownership the proportion of acquired firms is 0.17. The null hypothesis of no differences among the proportions of firms acquired over ranges of managers’ voting rights cannot be rejected at a significance level of 0.25. In addition, we estimate multinomial regressions that allow the coefficient on managers’ voting rights to vary across three intervals of these rights. The intervals we choose, based on the findings of Merck, Shleifer, and Vishny (1988a) and Wruck (19881, are (Y less than 0.05, CY greater than or equal to 0.05 and less than 0.25, and CY greater than or equal to 0.25. We find no significant coefficients for any of these intervals.
We also examine whether changes in managers’ voting rights over five-year periods are related to the frequency with which firms subsequently experi- ence certain outcomes. In a multinomial logit regression there is no relation between the change in managers’ voting rights and the proportion of firms that are acquired or remain traded at the end of the four years following the measurement of the ownership change. Twenty-four percent of firms with he largest increases in ownership (more than 0.10) and 23% of firms with the largest decreases in ownership (less than -0.10) are acquired.
W. W Mkkelson and MM Partch. Managers’ coring rights and corporate control 279
6.2. Initiation of control ecents
To this point the evidence shows no relation between completed control changes and managers’ control of votes. But this result conceals the effects of target managers’ voting control on the initiation as well as the success of takeover attempts. In this section we investigate the influence of managers’ holdings of votes on the incidence of takeover attempts and toehold invest- ments.
We first document how often firms in our sample are the target of a block purchase, a merger proposal or tender offer, or an attempt to go private. These events are identified by searching the Wall Street Journal Index for each firm in our sample. 5 Then we relate the incidence of these events to managers’ voting rights, firm value, leverage, staggered voting, and the presence of outside blockholders. To be included in our analysis, a control event must have occurred within the four years following the date of the proxy statement from which one of our measurements of managers’ control of voting rights was taken.
The frequency of control events increased over the successive four-year periods that follow our measurements of managers’ shareholdings in 1973, 1978, and 1983. There were seven reported purchases of large blocks in 1973-1977, 54 in 1978-1982, and 52 m 1983-1987, for a total of 113. We identified 29 merger proposals or tender offers in 1973-1977,47 in 1978-1982, and 51 in 1983-1987, for a total of 127. Thus, the percentage of firms that were the target of a merger proposal or tender offer increased from 12.1% in the four years following 1973 to 21.3% in the four years following 1983. Finally, we found two attempts to take firms private in 1973-1977, seven in 1978-1982, and 15 in 1983-1988, for a total of 24.
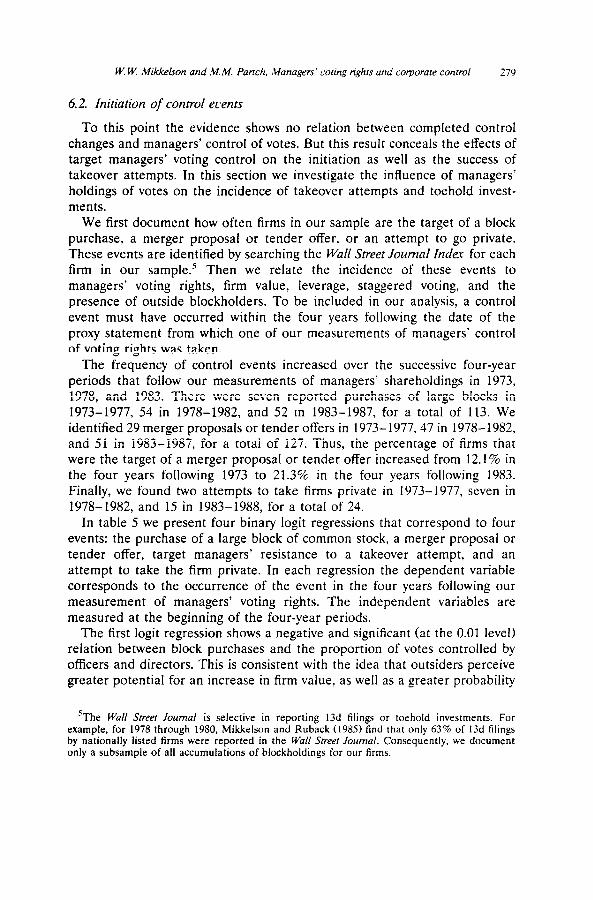
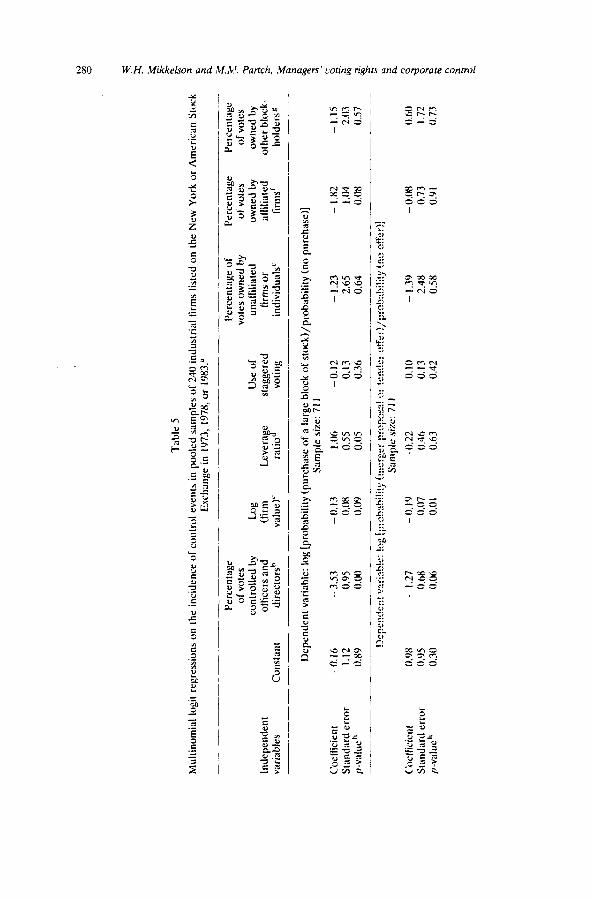
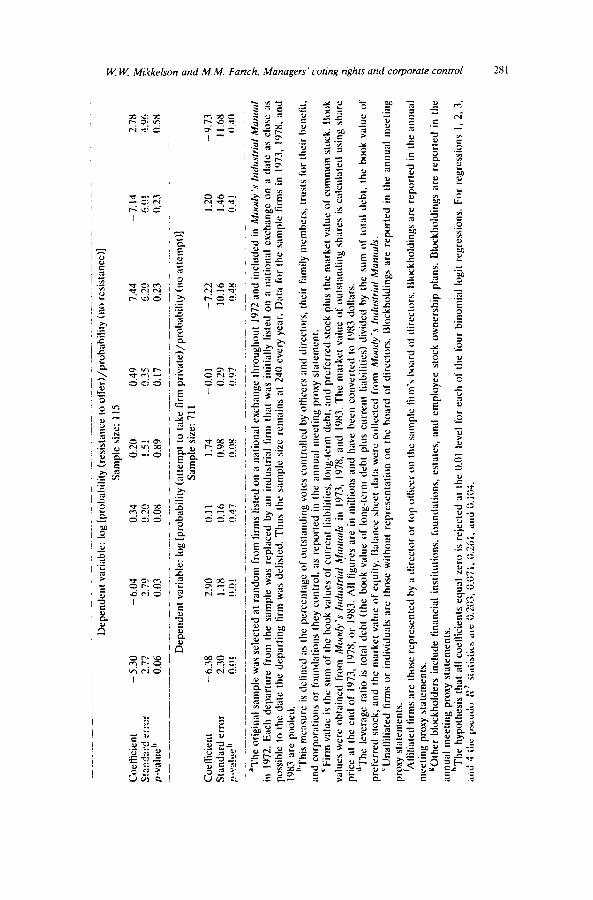
In table 5 we present four binary logit regressions that correspond to four events: the purchase of a large block of common stock, a merger proposal or tender offer, target managers’ resistance to a takeover attempt, and an attempt to take the firm private. In each regression the dependent variable corresponds to the occurrence of the event in the four years following our measurement of managers’ voting rights. The independent variables are measured at the beginning of the four-year periods.
The first logit regression shows a negative and significant (at the 0.01 level) relation between block purchases and the proportion of votes controlled by officers and directors. This is consistent with the idea that outsiders perceive greater potential for an increase in firm value, as well as a greater probability
‘The Wail &reef Journal is selective in reporting 13d filings or toehold investments. For example, for 1978 through 1980, Mikkelson and Ruback (1985) find that only 63% of 13d filings by nationally listed firms were reported in the WaN Street Journal. Consequently, we document only a subsample of all accumulations of blockholdings for our firms.
Tab
le
5
Mu
hin
om
ial
loai
l re
eres
sio
ns
on
th
e in
cid
ence
o
f co
ntr
ol
even
ts
in n
oo
led
sa
mn
les
of
240
ind
ust
rial
lir
ms
liste
d
on
th
e N
ew
Yo
rk
or
Am
eric
an
Sto
ck
Exc
han
ge’
in
lY73
, 19
?8,
or
1983
.”
- Ind
epen
den
t va
riab
les
Co
nst
ant
Per
cen
tag
e o
f vo
tes
con
tro
lled
b
y o
ftic
ers
and
d
irec
tors
h
Lo
g
(fir
m
valu
e)’
-
Per
cen
tag
e o
f P
erce
nta
ge
vole
s o
wn
ed
by
of
vole
s U
se
of
un
affi
liate
d
ow
ned
b
y L
ever
a e
stag
ger
ed
firm
s o
r af
filia
led
ra
tio
J vo
tin
g
ind
ivid
ual
s’
firm
s’
Per
cen
lag
e o
f vo
les
ow
ned
b
y o
ther
b
lock
- h
old
ers”
Dep
end
ent
vari
able
: lo
g [
pro
bab
ility
(p
urc
has
e o
f a
larg
e b
lock
o
f st
ock
)/p
rob
abili
ty
(no
p
urc
has
e)]
Sam
ple
si
ze:
711
Co
effi
cien
t -0
.16
- 3.
53
-0.1
3 1.
06
-0.1
2 -
1.23
-
1.x2
S
tan
dar
d
erro
r 1.
12
0.95
0.
08
0.55
0.
13
2.65
I.0
4 p
-val
ue
h
0.89
0.
00
0.09
0.
05
0.36
0.
64
0.08
__
~~_.
____
_
Dep
end
ent
vari
able
:%g
[p
rob
abili
ty
(mer
ger
p
rop
osa
l o
r te
nd
er
otf
er)/
pro
bab
ility
(n
o
off
er)]
S
amp
le
size
: 71
I
Co
effi
cien
t 0.
Y8
- I .
27
-0.1
9 -
0.22
0.
10
- I .
39
- 0.
08
Sta
nd
ard
er
ror
0.05
0.
6X
0.07
0.
46
0.13
2.
48
0.73
p
-val
ue”
0.
30
0.06
0.
01
0.63
0.
42
0.58
0.
‘) I
-
- 1.
15
2.03
0.
57
0.00
I .
72
0.73
Dep
end
ent
vari
able
: lo
g [
pro
bab
ility
(r
esis
tan
ce
to o
ffer
)/p
roh
ahili
ty
(no
re
sist
ance
)]
Sam
ple
si
ze:
115
Co
eRic
ien
I -
5.30
-
6.04
0.
34
0.20
0.
49
7.44
-7
.14
2.78
Sta
nd
ard
er
ror
2.77
2.
79
0.20
1.
51
0.35
6.
20
6.01
4.
96
p-v
alu
e h
0.
06
0.03
0.
08
0.89
0.
17
0.23
0.
23
0.5x
Dep
end
ent
vari
able
: lo
g (
pro
bab
ility
(a
ttem
pt
to t
ake
firm
p
riva
te)/
pro
bab
ility
(n
o
atte
mp
t)]
Sam
ple
si
ze:
711
Co
effi
cien
t -6
.38
2.90
0.
11
1.74
-0
.01
- 7.
22
1.20
-
9.73
Sta
nd
ard
er
ror
2.30
1.
18
0.16
0.
98
0.29
10
.16
1.46
II.
68
p-v
alu
e”
0.01
0.
01
0.47
0.
08
0.97
0.
48
0.4
I 0.
40
“Th
e o
rig
inal
sa
mp
le
was
sel
ecte
d
at r
and
om
fr
om
fi
rms
liste
d o
n a
nat
ion
al
exch
ang
e th
rou
gh
ou
t 19
72 a
nd
in
clu
ded
in
M
M/~
‘S
I~rc
lus~
icrl
M~c
tcrl
in
19
72.
Eac
h
dep
artu
re
fro
m
the
sam
ple
w
as
rep
lace
d
by
an
ind
ust
rial
li
rm
that
w
as
init
ially
lis
ted
o
n
a n
atio
nal
ex
chan
ge
on
:I
dat
e as
clo
se
as
po
ssib
le
to t
he
dat
e th
e d
epar
tin
g
lirm
w
as d
elis
ted
. T
hu
s th
e sa
mp
le
size
re
mai
ns
at
240
ever
y ye
ar.
Dat
a fo
r th
e sa
mp
le
firm
s in
19
73,
1978
, an
d
1983
ar
e p
oo
led
. “T
his
m
easu
re
is d
elin
ed
as
the
per
cen
tag
e o
f o
uts
tan
din
g
vote
s co
ntr
olle
d
by
olii
cers
an
d
dir
ecto
rs,
thei
r fa
mily
m
emb
ers,
tr
ust
s fo
r th
eir
ben
elil,
an
d
corp
ora
tio
ns
or
fou
nd
atio
ns
they
co
ntr
ol,
us
rep
ort
ed
in t
he
ann
ual
m
eeti
ng
p
roxy
st
atem
ent.
‘F
irm
va
lur
is t
he
sum
of
the
bo
ok
valu
es
of
curr
ent
li;lb
iliti
es,
lon
g-t
erm
d
ebt,
an
d
pre
ferr
ed
sto
ck
plu
s th
e m
arke
t va
lue
of
com
mo
n
sto
ck.
Bo
ok
valu
es
wer
e o
bta
ined
fr
om
M~
xly
‘s /
tr~/
~ts/
rirr
/ M
tr~r
~rrr
ls in
19
73,
1978
, an
d
19X
3.
Th
e m
arke
t va
lue
of
ou
tsta
nd
ing
sh
ares
is
ca
lcu
lutr
d
usi
ng
A
are
pri
ce
at
the
end
o
f 10
73,
1978
, o
r 19
83.
All
fi
g&
s ar
e in
mill
ion
s an
d
hav
e b
een
co
nve
rted
to
I9
83
do
llars
. “T
he
leve
rag
e ra
tio
is
to
tal
deh
t (t
he
bo
ok
valu
e o
f lo
ng
-ter
m
deh
t p
lus
curr
ent
liab
iliti
es)
div
ided
b
y th
e su
m
of
tota
l d
ebt,
th
e b
oo
k va
lue
of
pre
ferr
ed
sto
ck,
and
th
e m
arke
t va
lue
of
equ
ity.
B
alan
ce
shce
~ d
ata
wer
e co
llect
ed
fro
m
Mo
url
y’s
Incl
usr
ritr
l M
utn
rctl
s.
‘Un
ntf
iliaf
ed
firm
s o
r in
div
idu
als
are
tho
se
wit
ho
ut
rep
rese
nta
tio
n
on
th
e b
oar
d
of
dir
ecto
rs.
Blo
ckh
old
ing
s ar
e re
po
rted
in
th
e an
nu
al
mee
tin
g
pro
xy
stilt
etlle
ills.
‘Alli
liute
d
lirm
s ar
e th
ose
re
pre
sen
ted
b
y ;I
dir
ecto
r o
r to
p o
llice
r on
th
e s;
rmp
le l
irm
’s
bo
ard
o
f d
irec
tors
. I~
lock
ho
ldin
gs
are
rep
ort
ed
in t
he
an
nu
al
mee
tin
g
pro
xy
stat
emen
ts.
‘Oth
er
hlo
ckh
old
ers
incl
ud
e fi
nan
cial
in
stit
uti
on
s,
fou
nd
atio
ns,
es
tate
s,
and
em
plo
yee
sto
ck
ow
ner
ship
p
lan
s.
Blo
ckh
old
ing
s ar
e re
po
rted
in
th
e ill
l,fU
Ul
mee
tin
g
pro
xy
stat
emen
ts.
Th
e h
ypo
thes
is
that
al
l co
effi
cien
ts
ecpa
l ze
ro
is r
ejec
ted
a~
th
e 0.
01
leve
l fo
r ea
ch
of
the
fou
r b
ino
mia
l lo
git
re
gre
ssio
ns.
F
or
reg
ress
ion
s I,
2, 3
, an
d
4 th
e p
seu
do
I<
* s!
atis
tics
ar
e 0.
203,
0.
071,
0.
261,
an
d
0.10
4.
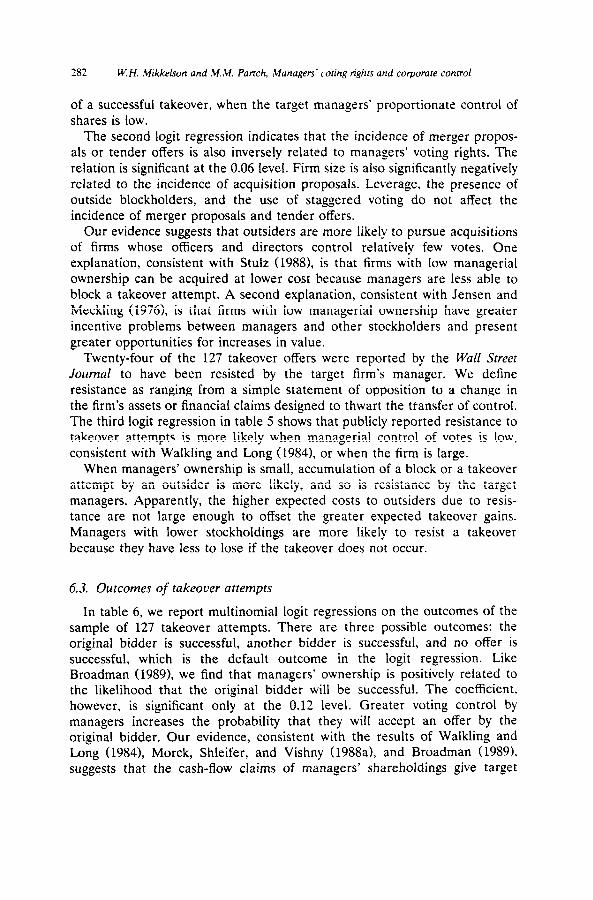
282 W.H. Mkkelson and M.M. Panch, Managers’ toting rights and corporare control
of a successful takeover, when the target managers’ proportionate control of shares is low.
The second logit regression indicates that the incidence of merger propos- als or tender offers is also inversely related to managers’ voting rights. The relation is significant at the 0.06 level. Firm size is also significantly negatively related to the incidence of acquisition proposals. Leverage, the presence of outside blockholders, and the use of staggered voting do not affect the incidence of merger proposals and tender offers.
Our evidence suggests that outsiders are more likely to pursue acquisitions of firms whose officers and directors control relatively few votes. One explanation, consistent with Stulz (19881, is that firms with low managerial ownership can be acquired at lower cost because managers are less able to block a takeover attempt. A second explanation, consistent with Jensen and Meckling (1976), is that firms with low managerial ownership have greater incentive problems between managers and other stockholders and present greater opportunities for increases in value.
Twenty-four of the 127 takeover offers were reported by the Wall Street Journal to have been resisted by the target firm’s manager. We define resistance as ranging from a simple statement of opposition to a change in the firm’s assets or financial claims designed to thwart the transfer of control. The third logit regression in table 5 shows that publicly reported resistance to takeover attempts is more likely when managerial control of votes is low. consistent with Walkling and Long (1984), or when the firm is large.
When managers’ ownership is small, accumulation of a block or a takeover attempt by an outsider is more likely, and so is resistance by the target managers. Apparently, the higher expected costs to outsiders due to resis- tance are not large enough to offset the greater expected takeover gains. Managers with lower stockholdings are more likely to resist a takeover because they have less to lose if the takeover does not occur.
6.3. Outcomes of takeocer attempts
In table 6, we report multinomial logit regressions on the outcomes of the sample of 127 takeover attempts. There are three possible outcomes: the original bidder is successful, another bidder is successful, and no offer is successful, which is the default outcome in the logit regression. Like Broadman (19891, we find that managers’ ownership is positively related to the likelihood that the original bidder will be successful. The coefficient, however, is significant only at the 0.12 level. Greater voting control by managers increases the probability that they will accept an offer by the original bidder. Our evidence, consistent with the results of Walkhng and Long (19841, Merck, Shleifer, and Vishny (1988a), and Broadman (1989), suggests that the cash-flow claims of managers’ shareholdings give target
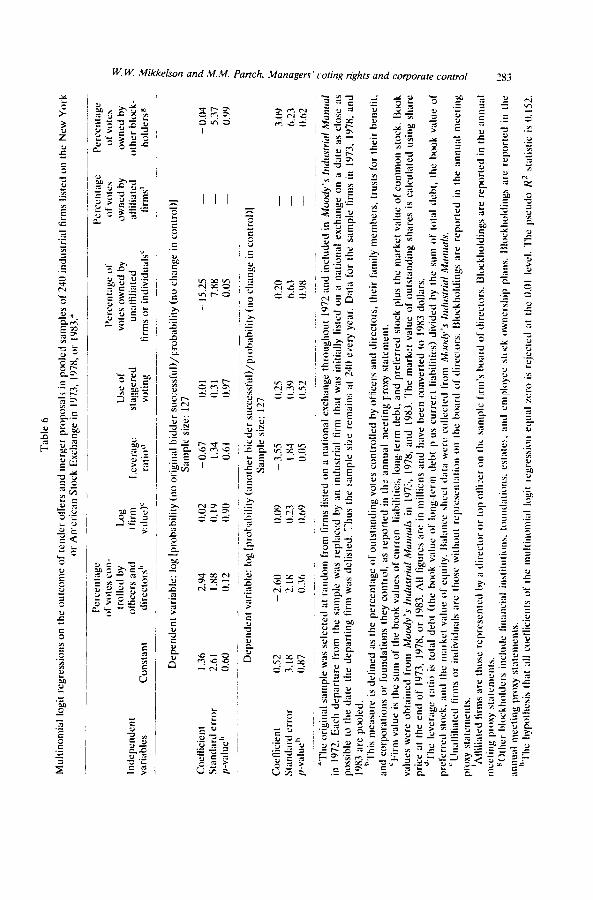
W W Mikkelson and M.&t, Partch. Managers’ rating rights and corporare control
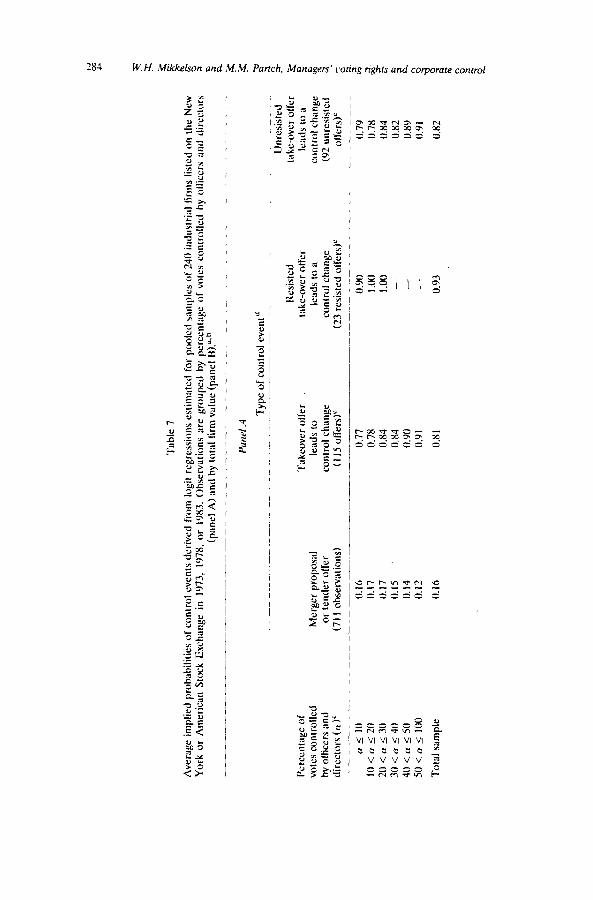
Tab
le
1
Ave
rag
e im
plie
d
pro
bab
iliti
es
of
con
tro
l ev
ents
d
eriv
ed
fro
m
log
it
reg
ress
ion
s es
tim
ated
fo
r p
oo
led
sa
mp
les
of
240
ind
ust
rial
fi
rms
liste
d
on
th
e N
ew
Yo
rk
or
Am
eric
an
Sto
ck
Exc
han
ge
in
1Y73
, lY
78,
or
l’JX
3.
Ob
serv
atio
ns
are
gro
up
ed
by
per
cen
tag
e o
f vo
tes
con
tro
lled
b
y o
llice
rs
and
d
irec
tors
(p
anel
A
) an
d
by
tota
l fi
rm v
alu
e (p
anel
13
).“.
h
Per
cen
tag
e o
f vo
tes
con
tro
lled
b
y o
tlic
ers
and
d
irec
tors
((
I)’
Mer
ger
p
rop
osa
l o
r te
nd
er
off
er
(711
o
bse
rvat
ion
s)
Typ
e o
f co
ntr
ol
even
t”
Res
iste
d
Tak
eove
r o
lfer
ta
ke-o
ver
otf
er
lead
s to
le
ads
to a
co
ntr
ol
chan
ge
con
tro
l ch
ang
e (1
15
off
ers)
’ (2
3 re
sist
ed
off
ers)
’
Un
resi
sled
ta
ke-o
ver
off
er
lead
s to
a
con
tro
l ch
ang
e (Y
2 u
nre
sist
ed
off
ers)
’
0 s
IO
0.16
0.
77
o.Y
o
0.79
IO <
u _
i 20
0.
17
0.78
I .
oo
0.
78
20
< a
5 30
0.
I 7
0.
84
1.00
0.
84
30
< n
5
40
0.15
0.
84
- 0.
82
40
< n
5
50
0.14
0.
W
- 0.
89
5O<r
yS
100
0.12
0.
91
- 0.
‘) I
To
tal
sam
ple
0.
16
0.81
0.
93
0.82
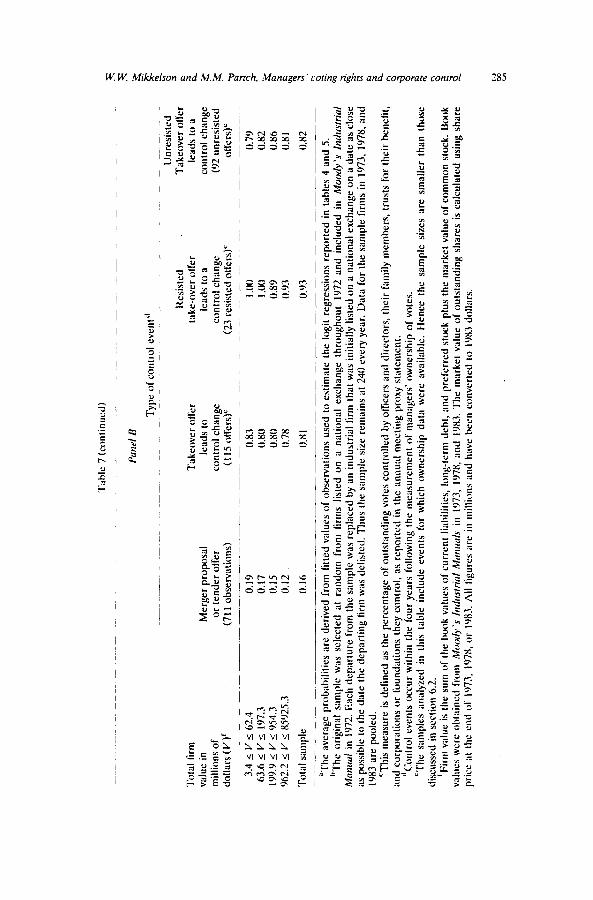
‘Tab
le 7
(co
nti
nu
ed)
.$
!?
f’u
nrl
B
Typ
e o
f co
ntr
ol
even
t“
@
Un
resi
sted
$
Res
iste
d
Tak
eove
r o
lfer
g
T
ota
l fi
rm
Tak
eove
r o
tFer
ta
ke-o
ver
olf
er
lead
s IO
1
valu
e in
M
erg
er
pro
po
sal
lead
s to
le
ads
to a
co
ntr
ol
chan
ge
: m
illio
ns
of
or
ten
der
o
tfer
co
ntr
ol
chan
ge
do
llars
(V
)’
co
ntr
ol
chan
ge
(92
un
resi
sted
z
(711
o
bse
rvat
ion
s)
(1 I
5 o
tfer
s)’
CL
3 re
sist
ed
otf
ers)
’ o
tfer
s)’
--__
2
3.4
5 V
I 62
.4
0.19
0.
83
1.00
0.
79
2
63.6
2
V 5
19
7.3
0.17
_S
- 0.
80
I .oo
0.
82
199.
9 5
VI
054.
3 0.
15
WJ
0.89
O
S6
%
Y62
.2
zz V
< X
5925
.3
0.12
0.
7x
O.Y
3 0.
X1
f S
To
lal
snm
ple
0.
16
0.X
1 N
Y3
0.82
2
_ ._
_I
“Th
e av
erag
e p
rob
abili
ties
ar
e d
eriv
ed
fro
m
litte
d
valu
es
of
ob
serv
atio
ns
use
d
to e
stim
ate
the
log
it
reg
ress
ion
s re
po
rted
in
tab
les
4 an
d
5.
x
“Th
e o
rig
inal
sa
mp
le
was
se
lect
ed
at
ran
do
m
fro
m
lirm
s lis
ted
o
n
a n
atio
nal
ex
chan
ge
thro
ug
ho
ut
1972
an
d
incl
ud
ed
in
Moo
dy’s
/r
~du
striu
/ 2 g
Mm
uul
in
lY72
. E
ach
d
epar
ture
fr
om
th
e sa
mp
le
was
rep
lace
d
by
an i
nd
ust
rial
fi
rm
that
w
as i
nit
ially
lis
ted
o
n a
nat
ion
al
exch
ang
e o
n a
dat
e u
s cl
ose
3
us
po
ssib
le
to t
he
dat
e th
e d
epar
tin
g
tirm
w
as d
elis
ted
. T
hu
s th
e sa
mp
le
size
rem
ain
s at
240
ev
ery
year
. D
ata
for
the
sam
ple
fi
rms
in
1Y73
, lY
78,
and
2
1Y83
are
p
oo
led
. 2
‘Th
is
mea
sure
is
del
ined
u
s th
e p
erce
nta
ge
of
ou
tsta
nd
ing
vo
tes
con
tro
lled
b
y o
ffic
ers
and
d
irec
tors
, th
eir
fam
ily
mem
ber
s,
tru
sts
for
thei
r b
enel
it,
:
and
co
rpo
rati
on
s o
r fo
un
dat
ion
s th
ey
con
tro
l, as
rep
ort
ed
in t
he
ann
ual
m
eeti
ng
p
roxy
st
atem
ent.
“C
on
lro
l ev
ents
o
ccu
r w
ith
in
the
fou
r ye
urs
fo
llow
ing
th
e m
easu
rem
ent
of
man
ager
s o
wn
ersh
ip
of
vote
s.
3
‘Th
e sa
mp
les
anal
yzed
in
th
is
tab
le
incl
ud
e ev
ents
fo
r w
hic
h
ow
ner
ship
d
ata
wer
e av
aila
ble
. H
ence
th
e sa
mp
le
size
s u
re
smal
ler
than
th
ose
,q
;:
dis
cuss
ed
in S
CCI~
OI~
6.2.
‘F
irm
vi
llue
is l
he
sum
of
the
bo
ok
valu
es
of
curr
ent
li;d
Glit
ies,
lo
ng
-ter
m
deb
t,
and
p
refe
rred
st
ock
p
lus
the
mar
ket
valu
e o
f co
mm
on
st
ock
. B
oo
k 3 a
villu
es
wer
e o
bta
ined
fr
om
M
oo
cly
‘s /
trc/
~rs/
rirr
/ Mm
~ud
~
in
lY73
, lY
7X,
ilnd
IY
X3.
T
he
mar
ket
valu
e o
f o
uts
tan
din
g
shar
es
is c
alcu
late
d
usi
ng
sh
are
_
pri
ce
;II
the
end
o
f lY
73.
lY7X
. o
r IY
X3.
A
ll
ligu
res
ure
in
mill
ion
s en
d h
ave
bee
n
con
vert
ed
IO l
Y83
d
olli
trs.
286 W.H. Mikkelson and M.M. Partch. Managers’ toting rights and corporate control
managers important incentives that affect the outcomes of takeovers. We do not find support for the argument that greater managerial voting power reduces the probability that takeover attempts will succeed.
For the subsample of resisted takeover attempts and the subsample of unresisted attempts (not reported) the coefficients on managers’ ownership are also positive, but statistically insignificant. We find an insignificant negative association between managers’ voting rights and the likelihood that another bidder’s offer will succeed for the entire sample of takeover attempts as well as for the subsample of resisted offers and the subsample of unre- sisted offers.
Panel A of table 7 presents the average implied probabilities of the occurrence of different types of control events in four-year periods. The events are (1) a takeover attempt, (2) a takeover attempt that leads to a control change, (3) a resisted takeover attempt that leads to a control change, and (4) an unresisted takeover attempt that leads to a control change. Using the estimated logit regressions, we solve for the implied probability of each observation of an event, such as a merger or tender offer. The average probabilities indicate the likelihood of a particular event for a firm with characteristics similar to firms in subsamples grouped by intervals of man- agers’ voting rights.
From the lowest to the highest ranges of manager’ ownership, the average implied probabilities of a merger proposal or tender offer decrease from 0.16 to 0.12. Thus, even though the logit regression uncovers a statistically significant association, the implied effect of managers’ ownership on the probability of a takeover offer is not large.
Column 2 of table 7 shows the average implied probabilities that a takeover offer will lead to a successful takeover by either the original bidder or another bidder. The average probability of a successful offer increases monotonically from 0.77 when managers control fewer than 10% of votes to 0.91 when managers control more than 50% of votes.
The absence of a relation between managers’ holdings of votes and control changes apparently is explained by the combination of the probabilities of takeover attempts in column 1 and the probabilities of successful attempts in column 2. As managers’ ownership increases, a decreased probability of takeover attempts is offset by an increased success rate of control changes. The products of the probabilities in columns 1 and 2 are estimates of the joint probability of receiving a takeover offer that leads to a control change. The products of the probabilities are virtually constant across ranges of managers’ control. The joint probability ranges from 0.12 when managers control fewer than 10% of votes to 0.14 when managers control between 20% and 30% of votes, and is 0.11 when managers control more than 50% of the votes. Thus, the bundling of residual claims and votes in common stock that is emphasized by Fama and Jensen (1983) and by Easterbrook and Fischel
W. W ,Mikkelson and MM. Partch, Managers’ roting rights and corporate control 287
(1983) leads to no reliable relation between managers’ ownership stakes and the incidence of control changes.
The average implied probabilities in columns 3 and 4 indicate that as managers’ ownership increases, so does the probability that both resisted and unresisted takeover attempts will lead to a control change. Because the probability that unresisted attempts will lead to a control change increases with managers’ control of votes, managers’ resistance does not explain the positive relation between their ownership and the likelihood that takeover attempts will result in a control change.
Panel B of table 7 groups merger proposals and tender offers by quartiles of the total value of the target firm. In column 1 the average implied probability of merger proposals and tender offers decreases from 0.19 for the smallest firms to 0.12 for the largest. In addition, in column 2 the frequency of takeover offers that result in a control change decreases as firms increase in size. These effects reinforce each other, so that there is a negative relation between firm size and the occurrence of completed acquisitions, as shown earlier.
7. Conclusions
We document voting stakes of officers and directors of nationally listed U.S. industrial firms in 1973, 1978, and 1983. On average managers as a group control a substantial voting stake. The median and mean percentages of votes controlled by managers are 13.9% and 19.6%. Officers and directors own less than 10% of the votes in 42% of our observations; this group owns at least 50% of votes in 9% of the observations.
There is considerable variation in managers’ voting stakes across firms, but little variation over time for most firms. The absolute value of the change over five-year intervals in the proportion of votes controlled by officers and directors is less than 10% of outstanding votes for approximately 85% of our observations.
We investigate the incidence of events in the market for corporate control. Larger firms are less likely to receive takeover offers as well as to undergo a change in control. But staggered voting for directors, financial leverage, and the holdings of blockholders without board representation are not signifi- cantly related to either the frequency of takeover attempts or the frequency of control changes. Firms that have a blockholder with board representation are more likely to be acquired.
Completed acquisitions of firms are unrelated to managers’ voting control. But this lack of association masks the effects of managers’ voting control on outsiders’ attempts to acquire control and on the outcome of takeover attempts. We find that accumulations of blockholdings and attempts to acquire control are more likely when the target firm’s managers control few
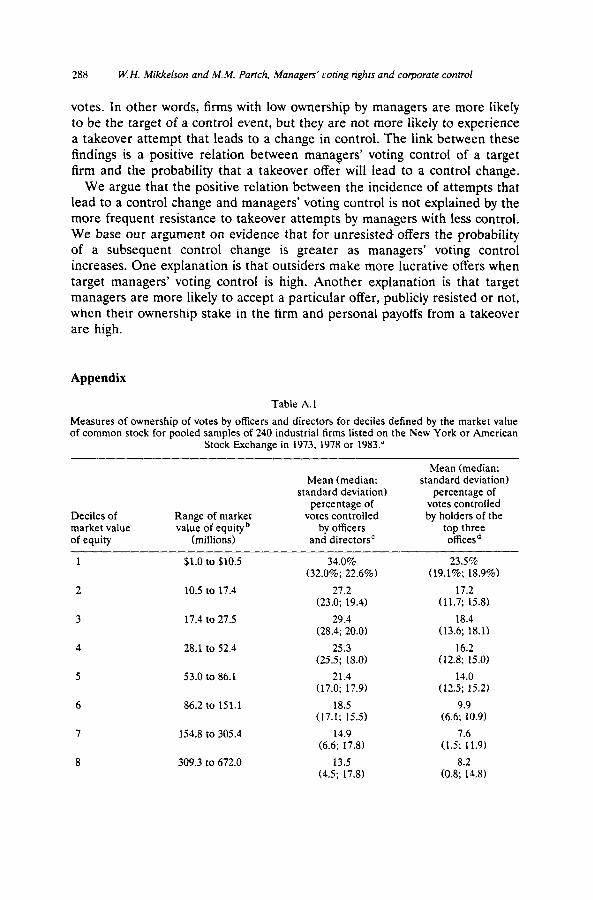
288 W. H. MiWtelson and M.M. Partch. Managers’ toting rights and corporate control
votes. In other words, firms with low ownership by managers are more likely to be the target of a control event, but they are not more likely to experience a takeover attempt that leads to a change in control. The link between these findings is a positive relation between managers’ voting control of a target firm and the probability that a takeover offer will lead to a control change.
We argue that the positive relation between the incidence of attempts that lead to a control change and managers’ voting control is not explained by the more frequent resistance to takeover attempts by managers with less control. We base our argument on evidence that for unresisted offers the probability of a subsequent control change is greater as managers’ voting control increases. One explanation is that outsiders make more lucrative offers when target managers’ voting control is high. Another explanation is that target managers are more likely to accept a particular offer, publicly resisted or not, when their ownership stake in the firm and personal payoffs from a takeover are high.
Appendix
Table A. 1
Measures of ownership of votes by officers and directors for deciles defined by the market value of common stock for pooled samples of 240 industrial firms listed on the New York or American
Stock Exchange in 1973, 1978 or 1983.a
Deciles of Range of market market value value of equity b of equity (millions)
2
3
4
5
6
8
$1.0 to $10.5
10.5 to 17.4
17.4 to 27.5
28.1 to 52.4
53.0 to 86.1
86.2 to 151.1
154.8 to 305.4
309.3 to 672.0
Mean (median; standard deviation)
percentage of votes controlled
by officers and directorsC
34.0% (32.0%; 22.6%)
27.2 (23.0; 19.4)
29.4 (28.4; 20.0)
25.3 (25.5; 18.0)
21.4 (17.0; 17.9)
18.5 (17.1; 15.5)
14.9 (6.6; 17.8)
13.5 (4.5; 17.8)
Mean (median; standard deviation)
percentage of votes controlled by holders of the
top three officesd
23.5% (19.1%; 18.9%)
17.2 (11.7; 15.8)
18.4 (13.6; 18.1)
16.2 (12.8; 15.0)
14.0 (12.5; 15.2)
9.9 (6.6; 10.9)
7.6 (1.5; 11.9)
8.2 (0.8; 14.8)
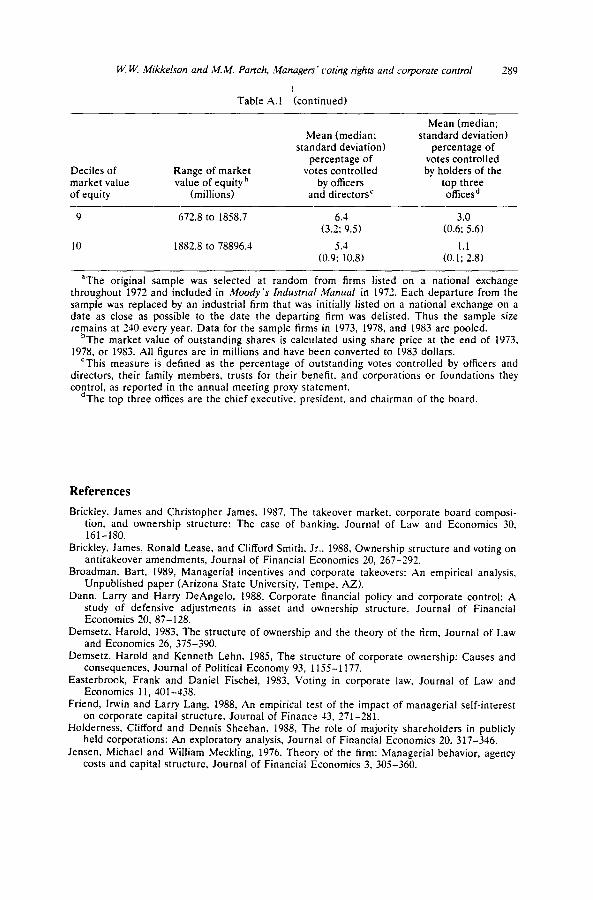
W W. Mikkelson and M.M. Partch, ‘Managers’ coring rights and corporate control 289
Table A.1 (continued)
Mean (median; Mean (median; standard deviation)
standard deviation) percentage of percentage of votes controlled
Deciles of Range of market votes controlled market value value of equity’
by holders of the by officers top three
of equity (millions) and directorsC officesd
9 672.8 to 1858.7 6.4 (3.2; 9.5) (0.:;9.6)
10 1882.8 to 78896.4 5.4 (0.9: 10.8) cO.:;:.8J
aThe original sample was selected at random from firms listed on a national exchange throughout 1972 and included in Moody’s Industrial Manual in 1972. Each departure from the sample was replaced by an industrial firm that was initially listed on a national exchange on a date as close as possible to the date the departing firm was delisted. Thus the sample size remains at 240 every year. Data for the sample firms in 1973, 1978. and 1983 are pooled.
bThe market value of outstanding shares is calculated using share price at the end of 1973, 1978, or 1983. All figures are in millions and have been converted to 1983 dollars.
‘This measure is defined as the percentage of outstanding votes controlled by officers and directors, their family members, trusts for their benefit, and corporations or foundations they control, as reported in the annual meeting proxy statement.
dThe top three offices are the chief executive, president, and chairman of the board.
References
Brickley, James and Christopher James, 1987. The takeover market. corporate board composi- tion, and ownership structure: The case of banking, Journal of Law and Economics 30, 161-180.
Brickley, James, Ronald Lease, and Clifford Smith. Jr., 1988, Ownership structure and voting on antitakeover amendments, Journal of Financial Economics 20, 267-292.
Broadman, Bart, 1989, Managerial incentives and corporate takeovers: An empirical analysis. Unpublished paper (Arizona State University, Tempe, AZ).
Dann, Larry and Harry DeAngelo, 1988, Corporate financial policy and corporate control: A study of defensive adjustments in asset and ownership structure, Journal of Financial Economics 20, 87- 128.
Demsetz, Harold, 1983, The structure of ownership and the theory of the firm, Journal of Law and Economics 26, 375-390.
Demsetz, Harold and Kenneth Lehn, 1985, The structure of corporate ownership: Causes and consequences, Journal of Political Economy 93, 1155-l 177.
Easterbrook, Frank and Daniel Fischel, 1983, Voting in corporate law. Journal of Law and Economics 11, 401-438.
Friend, Irwin and Larry Lang, 1988, An empirical test of the impact of managerial self-interest on corporate capital structure, Journal of Finance 13, 271-281.
Holderness, Clifford and Dennis Sheehan, 1988, The role of majority shareholders in publicly held corporations: An exploratory analysis, Journal of Financial Economics 20, 317-346.
Jensen, Michael and William Meckling, 1976, Theory of the firm: Managerial behavior, agency costs and capital structure, Journal of Financial Economics 3, 305-360.
290 W. H. Mikkelson and M. M. Partch. Managers’ toting rights and corporate control
Jensen, Michael and Jerold Warner, 1988, The distribution of power among corporate managers. shareholders and directors, Journal of Financial Economics 20, 3-24.
Loderer, Claudio and Dennis Sheehan, 1989. Corporate bankruptcy and management self-sew- ing behavior, Journal of Finance 44, 1059-1075.
Mikkelson, Wayne and Richard Ruback, 1985, An empirical analysis of the intertirm equity investment process, Journal of Financial Economics 14. 523-553.
Merck, Randall, Andrei Shleifer, and Robert Vishny, 1988a. Characteristics of targets of hostile and friendly takeovers, in: Alan Auerbach, ed., Takeovers: Causes and consequences (Uni- versity of Chicago Press, Chicago, IL).
Merck, Randall, Andrei Shleifer, and Robert Vishny, 1988b. Management ownership and market valuation: An empirical analysis, Journal of Financial Economics 20, 293-316.
Palepu, Krishna, 1986, Predicting takeover targets: A methodological and empirical analysis, Journal of Accounting and Economics 8, 3-37.
Song, Moon and Ralph Walkling, 1989, The impact of target managerial ownership on the selection, characteristics and outcome of acquisition attempts, Unpublished paper (Ohio State University, Columbus, OH).
Theil, Henry, 1969, A multinominal extension of the linear logit model, International Economic Review 10, 2.51-2.59.
Walkling, Ralph and Michael Long, 1984, Agency theory, managerial welfare, and takeover bid resistance, Rand Journal of Economics 15, 54-68.
Wruck, Karen, 1989, Equity ownership concentration and firm value: Evidence from private equity financings, Journal of Financial Economics 23, 3-28.