making problem management work for your organization
TRANSCRIPT

JOHN CUSTY • ITSM CONSULTANT • JPG GROUP • @ITSMNINJA
Problem Management: Making It Work For Your Organization

John CustyService Management Practitioner, Consultant and Educator
•Ron Muns Lifetime Achievement Award •IT Industry Legend – Cherwell Software •Distinguished Professional in IT Service Management •ITIL Expert and ITIL Accredited Trainer •ISFS, ISMAS based on ISO/IEC 27002 •ISO/IEC 20000 Consultant •DevOps Certified Instructor •KCS Verified Consultant •HDI Faculty & Certified Instructor
Twitter: @ITSMNinja Facebook: John Custy LinkedIn: johncusty
Copyright 2015 JPCGroup ‘Making Problem Management Work in Your Organization’

Get insightsRecover fasterMeet availability
Why problem management?
Increase valueDecrease time-to-resolution (MTRS, MTTR).
Ensure services meet the availability of the business
Reports are more than just outages. How much time is lost for reoccurring issues?
Improve the availability of your IT services, reduce downtime and cut down costs.
Copyright 2015 JPCGroup ‘Making Problem Management Work in Your Organization’

The value of problem management
Decreased costs
Customers can be more productive due to improved service availability.
Reduced downtimeCustomers experience less downtime due to increased IT service availability.
Improved productivity
Lower costs due to reduction of recurring incidents.
Copyright 2015 JPCGroup ‘Making Problem Management Work in Your Organization’

• Big cool statistic
• 2,569
• Add-Ons in Marketplace
Problem Management:Current state and challenges

Today, everyone does it their own way
Source: KT/ITpreneurs

The result: significant rework for escalations and transfers.
Source: KT/ITpreneurs
?

Outcome: Extended Resolution
0
75
150
225
300
0 1 2 3 4 5 6 7 8 9 10 11 12 13 14 15 16 17 18 20
Owners
Mea
n Ti
me
to S
olve
(Day
s)
Source: KT/ITpreneurs
P R O B L E M M A N A G E M E N T T E C H N I Q U E S
W H Y D O P R O B L E M M A N A G E M E N T
N E X T S T E P S
Agenda
Copyright 2015 JPCGroup ‘Making Problem Management Work in Your Organization’

1. Prevent problems and related incidents from happening
Problem Management:
2. Eliminate recurring incidents
3. Minimize the impact of incidents that can’t be prevented
Copyright 2015 JPCGroup ‘Making Problem Management Work in Your Organization’

Key concepts:
Copyright 2015 JPCGroup ‘Making Problem Management Work in Your Organization’
Incidents
Incident
Problem
Problem
Known error
Request for change
Your service management tooling must support these relationships

Problem Management Process Metrics
Total # of problems recorded in the period Backlog of outstanding problems
Percentage of problems resolved within their targets Avg cost of handling a problem
# of problems that exceed their target resolution times # of known errors added to the KEDB
% of problems that exceed their target resolution times % of major problem reviews completed successfully & on time
# of major problems % of accuracy of the KEDB
Copyright 2015 JPCGroup ‘Making Problem Management Work in Your Organization’

Problem Management Value Metrics
Downtime eliminated (Productivity improvements for the
business and IT)Confidence/Image/Perception
Cost of problem management Reduce stories about downtime
Copyright 2015 JPCGroup ‘Making Problem Management Work in Your Organization’

Problem Management Benefits
Increased service quality.Quality
Copyright 2015 JPCGroup ‘Making Problem Management Work in Your Organization’

Problem Management Benefits
Reduced # of incidents and problems.Fewer issues
Copyright 2015 JPCGroup ‘Making Problem Management Work in Your Organization’

Problem Management Benefits
Permanent solutions.Fixes
Copyright 2015 JPCGroup ‘Making Problem Management Work in Your Organization’

Problem Management Benefits
Improved workarounds.Better ideas
Copyright 2015 JPCGroup ‘Making Problem Management Work in Your Organization’

Problem Management Benefits
Historical data informs future decisions.
Learning
Copyright 2015 JPCGroup ‘Making Problem Management Work in Your Organization’

Problem Management Benefits
Higher first-level resolution rate.Fewer escalations
Copyright 2015 JPCGroup ‘Making Problem Management Work in Your Organization’

Problem Management Benefits
Higher technical awareness within the IT organization.
Shared knowledge
Copyright 2015 JPCGroup ‘Making Problem Management Work in Your Organization’

Problem Management Benefits
More informed decision making.Better decisions
Copyright 2015 JPCGroup ‘Making Problem Management Work in Your Organization’

1. Clear goals and objectives2. Clear policies3. Resources allocated to problem management4. Roles clearly defined5. Process relationships (incident, knowledge, change, release,
deployment, financial and service levels)6. Value communicated and understood
Problem Management Challenges:
Copyright 2015 JPCGroup ‘Making Problem Management Work in Your Organization’

• Big cool statistic
• 2,569
• Add-Ons in Marketplace
Problem Management Techniques

5 W H Y ’ S
B R A I N S TO R M I N G
PA I N VA L U E A N A LY S I S
C H R O N O L O G I C A L A N A LY S I S
Proven problem analysis techniques that have shown to deliver positive results:
I S H I K AWA D I A G R A M S
PA R E TO A N A LY S I S
K E P L E R T R E G O E

•The most common type of problem analysis•Relevant experts meet together (physically or virtually)•Identify their ideas on the potential cause of the problem•Sessions can be very constructive, but can also be time-consuming
•Sessions should be structured with a moderator• Documents the session• Identifies actions
•Follow-up items listed and assignments
Brainstorming:
Copyright 2015 JPCGroup ‘Making Problem Management Work in Your Organization’

•This analysis is used when attempting to understand the impact of incidents/problems on the business.
•It is possible to design a formula to measure the level of pain using variables:
•The investigation may also bring up info to help diagnose, assess and ultimately correct the problem.
Pain Value Analysis:
Copyright 2015 JPCGroup ‘Making Problem Management Work in Your Organization’
# of users affected
Length of downtime
Timing of the downtime
Cost to the business (user time, lost sales, penalties, etc).

1.Develop a timeline2.Document all events in a chronological order3.Determine which events triggered other events4.Discount claims that are not supported by evidence5.Correlate and identify root cause6.Attempt recreation, if practical, to confirm root cause
Chronological analysis:
Copyright 2015 JPCGroup ‘Making Problem Management Work in Your Organization’
Builds a timeline of what happened when (from event and/or incident data). The timeline can be used to identify cause and effect events and validate assumptions not supported by the events.

Chronological analysis:
Copyright 2015 JPCGroup ‘Making Problem Management Work in Your Organization’
Builds a timeline of what happened when (from event and/or incident data). The timeline can be used to identify cause and effect events and validate assumptions not supported by the events.
Incident Detection Repair Restore Solved incident
Diagnosis Recovery
Time

Ishikawa
Copyright 2015 JPCGroup ‘Making Problem Management Work in Your Organization’
Developed by Kaoru Ishikawa, this is a graphical technique that helps identify all possible causes of an effect, such as a problem. It’s
sometimes called a “fishbone” diagram.
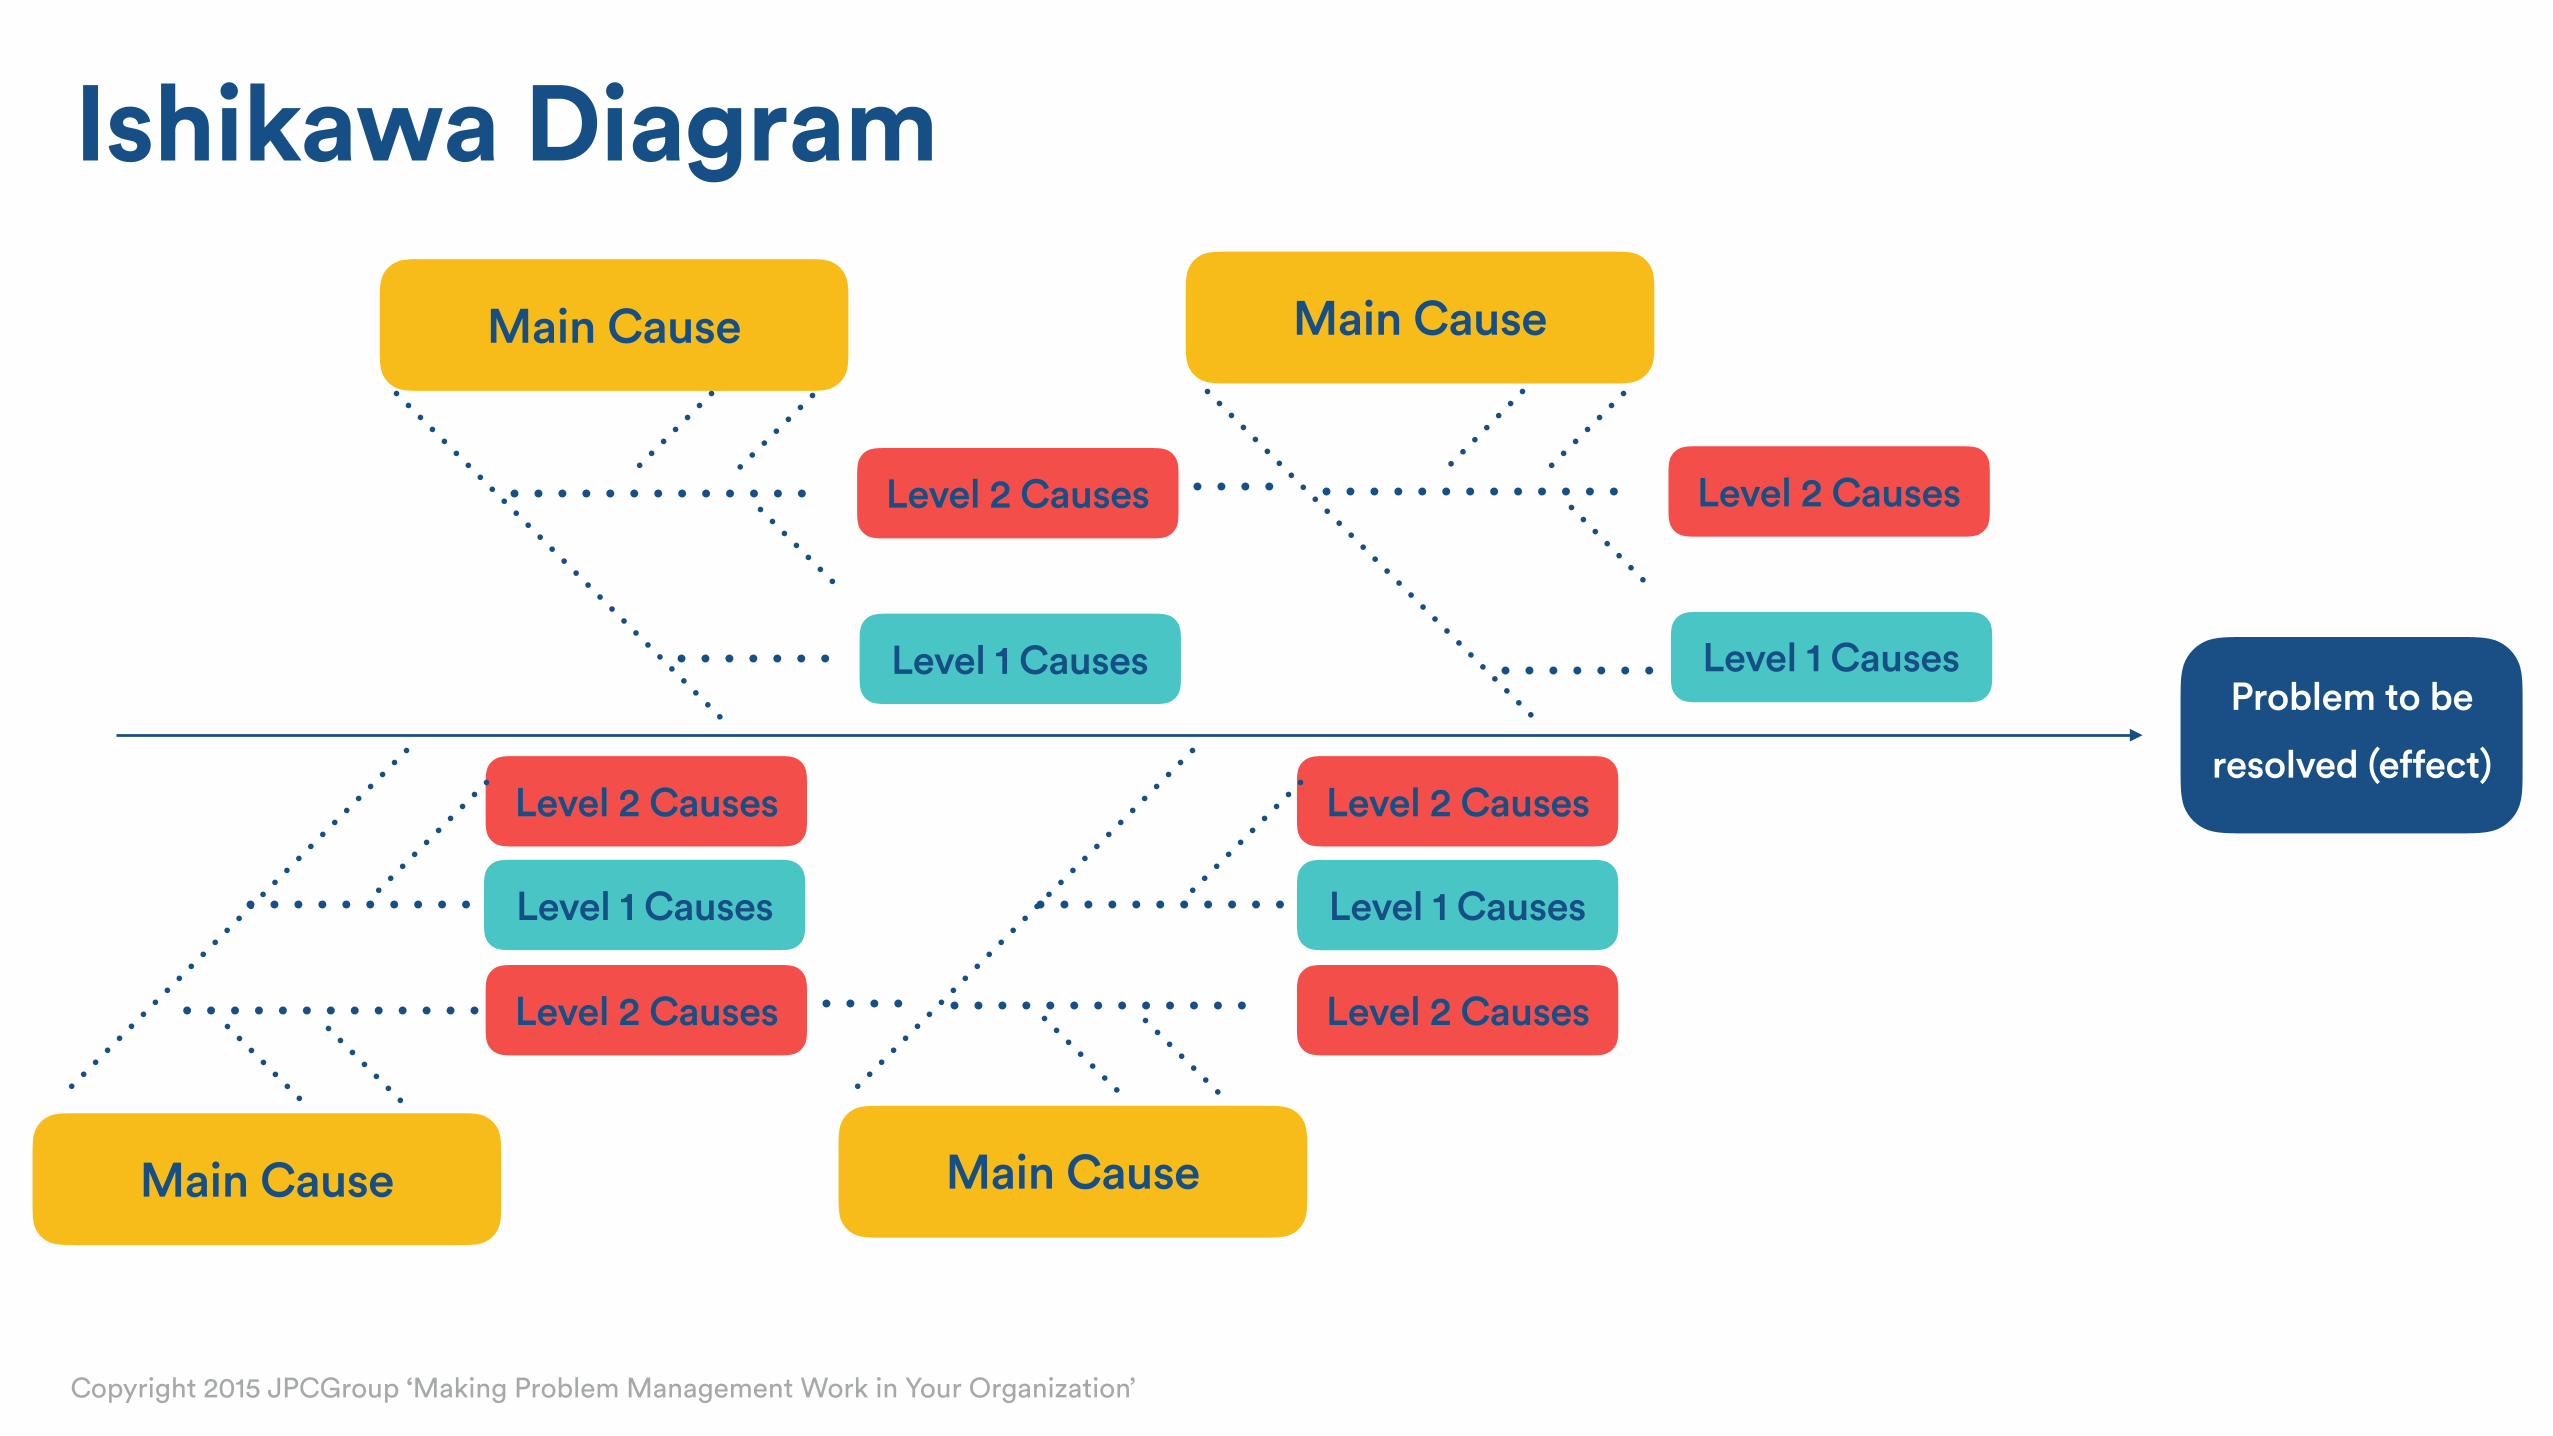
Ishikawa Diagram
Copyright 2015 JPCGroup ‘Making Problem Management Work in Your Organization’
Main Cause Main Cause
Level 1 Causes
Level 2 Causes
Level 1 Causes
Level 2 Causes
Main Cause Main Cause
Level 2 Causes Level 2 Causes
Level 1 Causes Level 1 Causes
Level 2 Causes Level 2 Causes
Problem to be
resolved (effect)

Root Cause Analysis Flow Chart:
Copyright 2015 JPCGroup ‘Making Problem Management Work in Your Organization’
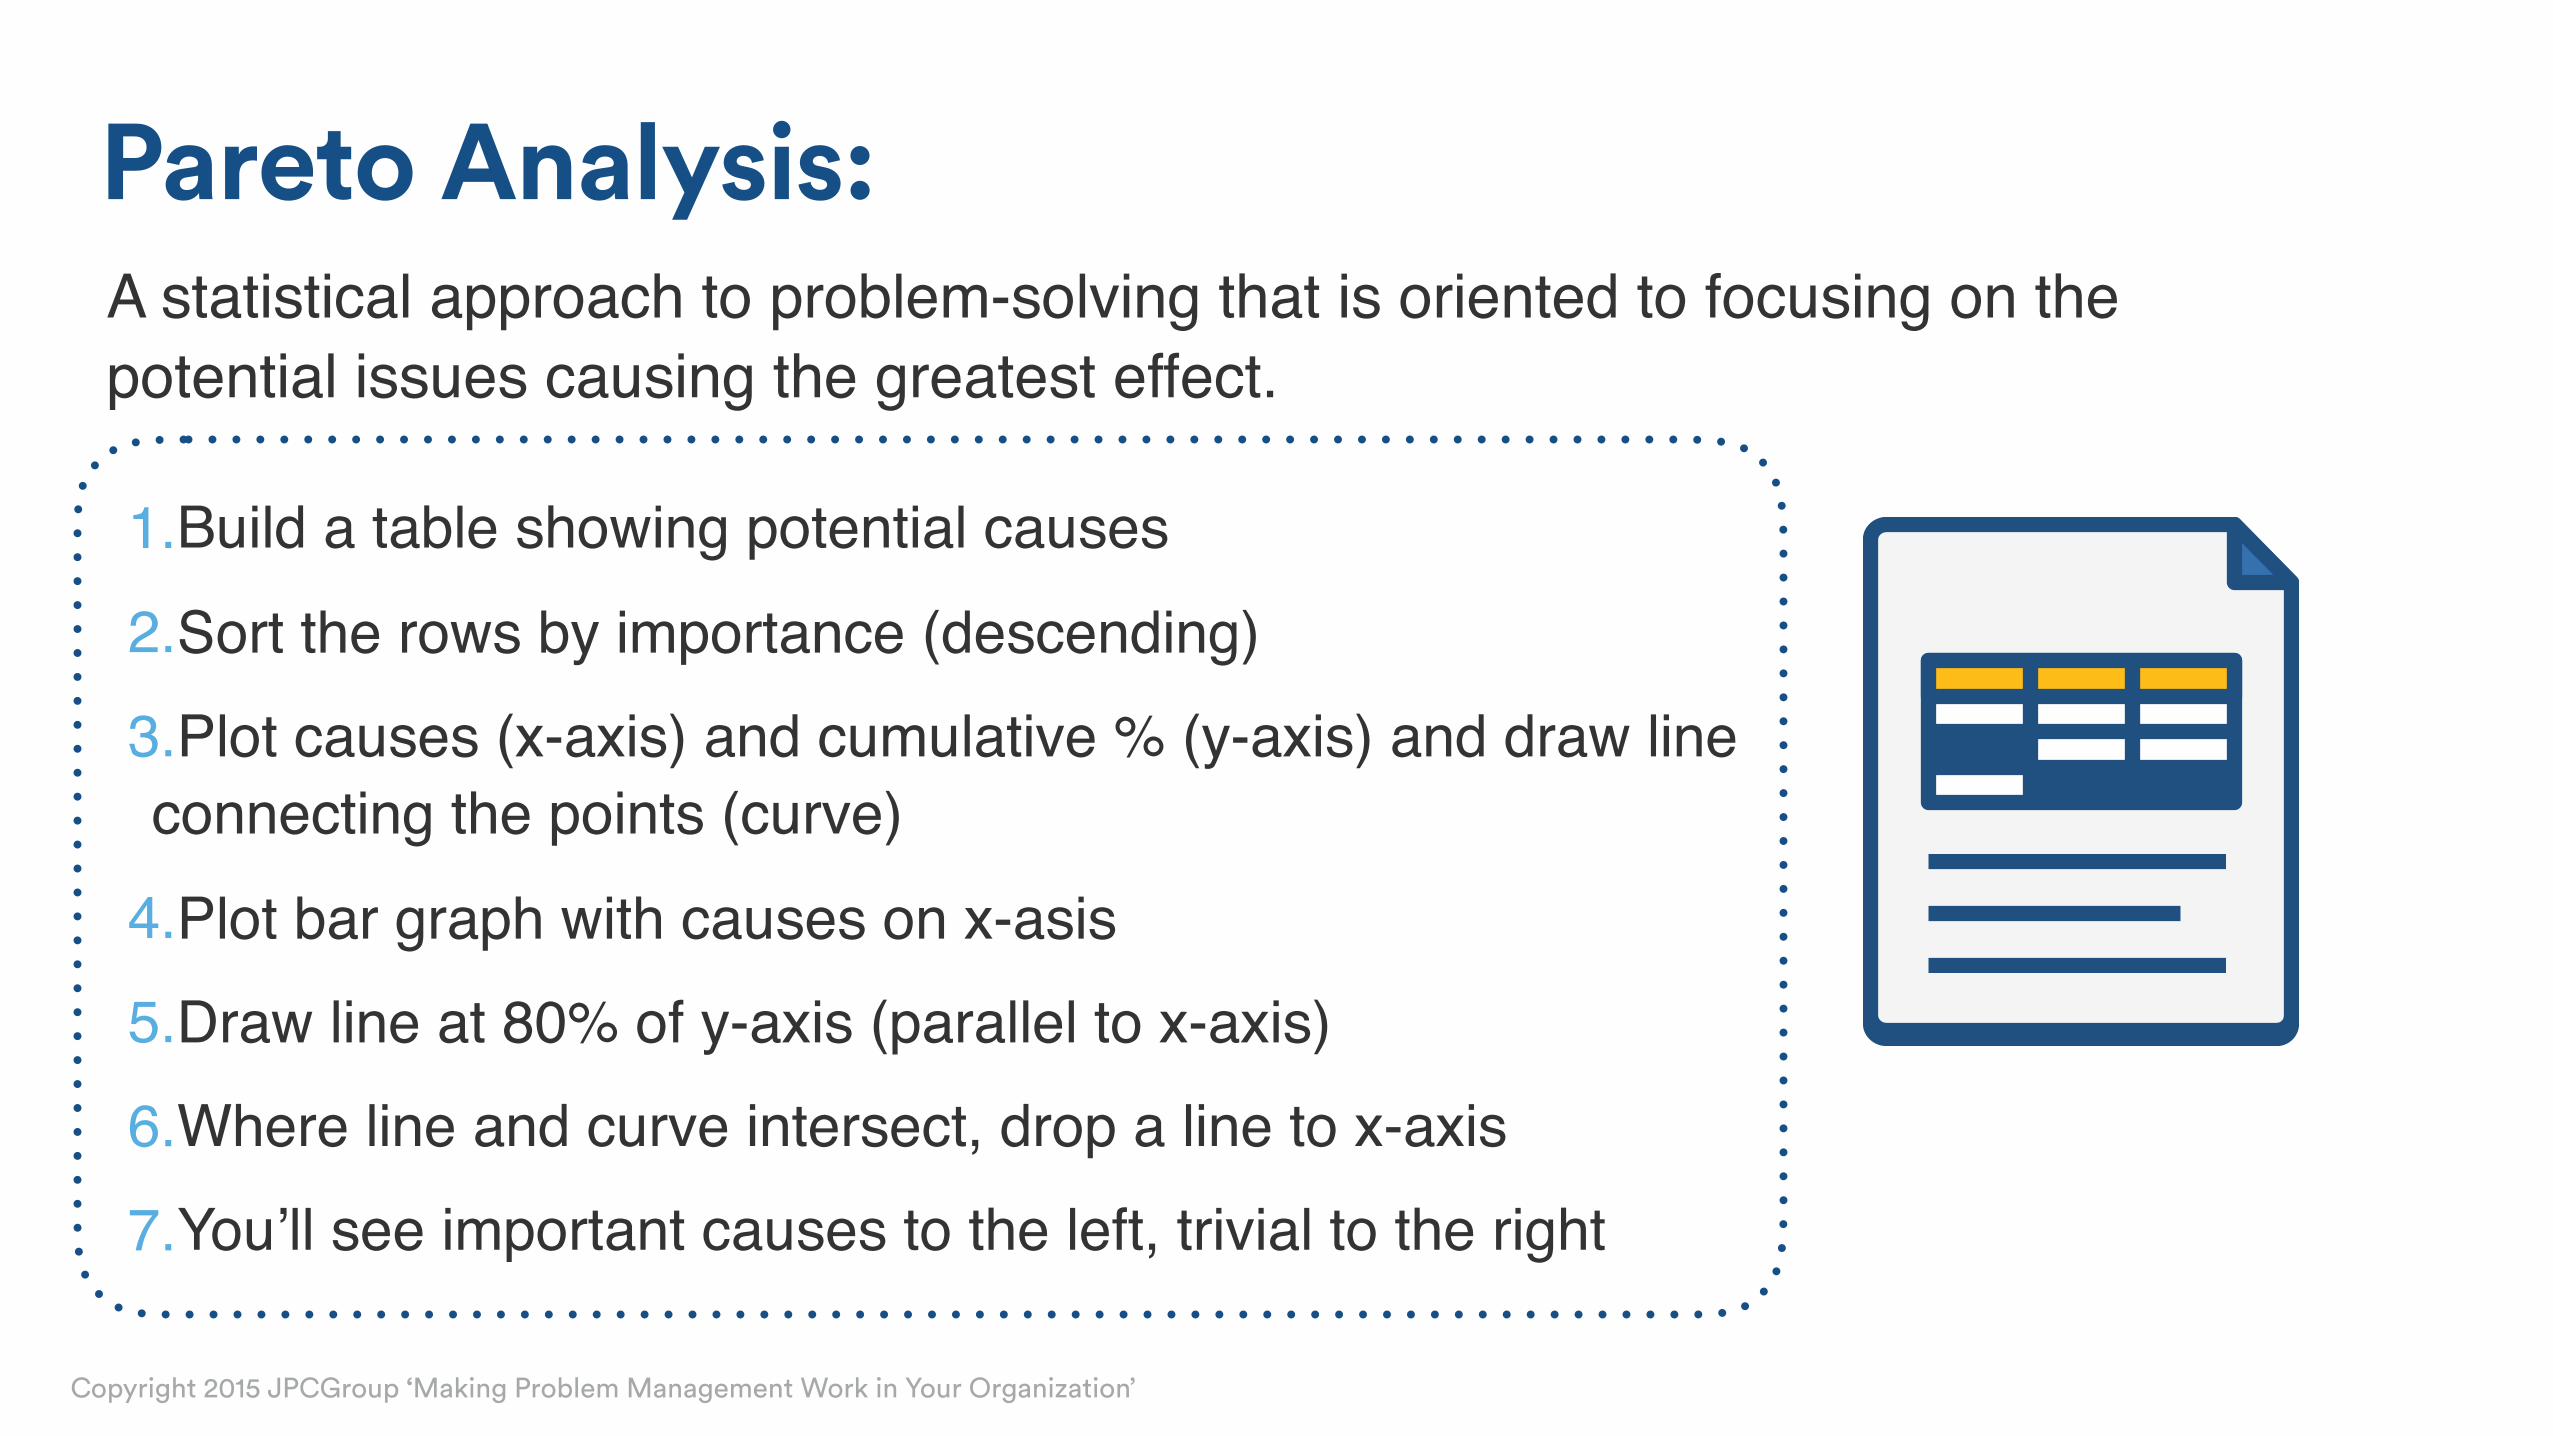
1.Build a table showing potential causes2.Sort the rows by importance (descending)3.Plot causes (x-axis) and cumulative % (y-axis) and draw line connecting the points (curve)
4.Plot bar graph with causes on x-asis5.Draw line at 80% of y-axis (parallel to x-axis)6.Where line and curve intersect, drop a line to x-axis7.You’ll see important causes to the left, trivial to the right
Pareto Analysis:
Copyright 2015 JPCGroup ‘Making Problem Management Work in Your Organization’
A statistical approach to problem-solving that is oriented to focusing on the potential issues causing the greatest effect.

Pareto Analysis:
Copyright 2015 JPCGroup ‘Making Problem Management Work in Your Organization’
A statistical approach to problem-solving that is oriented to focusing on the potential issues causing the greatest effect.
Cause % of errors Cumulative % of errors
Network controller 35 % 35 %
File corruption 26 % 61 %
Addressing conflicts 19 % 80 %
Server OS 6 % 86 %
Scripting error 5 % 91 %
Untested change 3 % 94 %
Operator error 2 % 96 %
Backup failure 2 % 98 %
Intrusion attempts 1 % 99 %
Disk failure 1 % 100 %

Pareto Analysis:
Copyright 2015 JPCGroup ‘Making Problem Management Work in Your Organization’
0%
20%
40%
60%
80%
100%
120%
0%
5%
10%
15%
20%
25%
30%
35%
40%
Network
File co
rruptio
n
Server O
S
Scriptin
g error
Untested ch
ange
Operator e
rror
Backu
p failu
re
Intrusio
n
Disk fa
ilure
Cumulative %
% of Errors
Important Trivial

•A rational model that is well respected in business management circles. An important aspect of KT decision-making is the assessment and prioritization of risk.
•KT is not about finding a perfect solution, but rather the best possible choice, based on actually achieving the outcome with minimal negative consequences.
Kepner-Tregoe (KT) Analysis:
Copyright 2015 JPCGroup ‘Making Problem Management Work in Your Organization’

Four steps in Kepner-Tregoe Decision Making
Potential problem analysis
Clarify the situation, outline concerns and choose a direction.
Problem analysisDefine the problem and determine root cause.
Situational appraisal
Further scrutinize alternatives against potential problems and negative consequences to find the best.
Copyright 2015 JPCGroup ‘Making Problem Management Work in Your Organization’
Decision analysisIdentify alternatives and analyze risk for each.

Technique Purpose Pros Cons
Chronological AnalysisUseful for complex problems with conflicting reports about what happened
• Can provide a timeline to help discover causes• Does a good job of documenting what/when and
where the event occurred
• Often times, little or no analysis occurs - events just recorded• Creative thinking is limited to a pre-defined set of questions• Can produce data that requires investigation and doesn’t lead
to clarity
Brainstorming Useful for generating ideas• Easy• Reduces domination• Prioritizes ideas
• Process may appear too mechanical or rigid
Kepler & Tregoe Useful when there are many potential causes
• Mature technique• Detailed• Well-documented
• Can be time-consuming as you consider many possible causes
Ishikawa Diagrams Useful for identifying all probable causes
• Act as a checklist of possible causes• Works well with cross-functional teams
• Difficult to create a list of causes that can account for all possible causes
• Identifying true root cause can be challenging
Pareto Analysis Useful for identifying the most important potential causes
• Statistical approach to problem-solving, leaves a positive perception with stakeholders
• Intended to direct resources to most common causes
• Limited by accuracy of the data used to create the histogram• Best used as a tool to identify where to start your analysis
Five Why’s Useful for identifying the root cause on minor problems
• Most simplistic technique to use• Identifies causal relationships
• Limited to the knowledge and experience of the problem owner in determining root cause
• Not as useful for problems that require investigation by cross-functional teams
Fault Tree Analysis Useful for identifying links between possible causes
• Works well to identify possible system or design failures
• Works well to identify causal relationships• Helps to determine if certain causal relationships are
probable
• Limited to known failure rates of components• Best used to support root cause analysis
Problem Management Techniques:
Copyright 2015 JPCGroup ‘Making Problem Management Work in Your Organization’

• Big cool statistic
• 2,569
• Add-Ons in Marketplace
Next Steps: What do you need to do to improve
your problem management process?

Assess current stateClarify goalsSponsorship
Next steps:
Clarify rolesIs it more available services? Improved productivity of staff and customers?
Who is the champion for this initiative?
What’s your maturity state? Assess culture, people and tools in addition to process. What is your strategy?
What are the process relationships and roles involved?
Copyright 2015 JPCGroup ‘Making Problem Management Work in Your Organization’

Successful problem-solving approach:
Copyright 2015 JPCGroup ‘Making Problem Management Work in Your Organization’
Quality Adoption Results
Problem-Solving
Skill Transfer
Coaching
+Alignment of:
Processes and triggers
Expectations > Consequences > Feedback Measurement
Documentation and Knowledge Creation (software)
Role modeling (leadership)
Resolution time
Cost per incident/problem
CSAT

Thank you!
JOHN CUSTY • ITSM CONSULTANT • JPG GROUP • @ITSMNINJA