major investments - invest in spain
TRANSCRIPT

2014
SovereignWealth Funds

Editor:
Javier Santiso, PhD
Professor of Economics, ESADE Business School
Vice President, ESADEgeo - Center for Global Economy and Geopolitics

Index
Foreword 5
Introduction 7
SWF Investment 2013: The Continuing Quest for Quality Deal Flow 11
I Geographic Analysis 19
Sovereign wealth funds in Spain and Latin America
Equity investments of the G : A European sovereign wealth fund for Europe
49
North American Dream: U.S. and Canadian Public Funds
II Sector Analysis
Sovereign Wealth Fund Investment in Infrastructure
Sovereign wealth funds and real estate: Spain's awakening
Looking Back and Launching Forward: SWF Investment in Financial Services
Appendix. ESADEgeo Sovereign Wealth Funds Ranking 2014
Sovereign Wealth Funds 2014Index
3
21
95
63
89
Norway´s PFG
81
101
79


Foreword
Sovereign Wealth Funds 2014Foreword
5

Sovereign Wealth Funds 2014Foreword6
1. Foreword
The recovery of the world economy continued to make progress
during 2014, although more moderately than initially predicted
and showing significant heterogeneity, principally due to differing
growth rates recorded in different countries. Activity in advanced
economies picked up, but not all at an equal rate. Growth rates
in developing economies were slightly lower than those recorded
in previous years. However, they continued rising in the ranks
of the world economy, advancing at rates significantly higher
than developed economies and serving as a driver for the global
economy.
Economies such as China, Russia or the United Arab Emirates are
even more important exporters of capital, due to their comfortable
fiscal positions, internal savings rates and an abundance of raw
materials. In this regard these countries play an increasingly
important role as sources of foreign direct investment in the
world: in 2013 developing economies generated more than 33%
of world outflows of foreign direct investment, when in 2000 they
represented only 12%.
As reflected in previous editions of this Report, some of these
countries are channelling their increasing investing power through
sovereign wealth funds, whose strategic decisions have more and
more of an impact on the world economy. Due to the substantial
and growing role of these investment vehicles, ESADE Business
School, KPMG and ICEX-INVEST IN SPAIN present the third edition of
the Sovereign Wealth Fund Report, with the aim of continuing to go
more in depth on the study of the strategy and worldwide trends of
sovereign wealth funds.
Jaime García-Legaz
Secretary of State for Trade
Javier Solana
President, ESADEgeo
John Scott
President, KPMG España
In this edition, the report analyses the main activities carried out
by sovereign wealth funds in 2013 and the beginning of 2014,
as well as their strategies, investment decisions and alliances or
collaboration with other funds and institutional investors. Also,
three new areas are analysed in depth. Firstly, the investment
strategy and asset portfolio of the world’s biggest sovereign wealth
fund, the Norwegian Government Pension Fund Global, is examined
in detail. Secondly, a detailed study is made of North American
public funds and the main Canadian pension funds. Thirdly, the
presence of sovereign wealth funds in three sectors is analysed in
detail: infrastructure, property, and financial services.
As in previous editions, the report focusses on Spain and Spanish
companies, which in recent years have come to play an important
role in Europe as recipients of investment from sovereign wealth
funds and state-owned enterprises, especially those with a presence
in Latin America. The strategic positioning of Spanish companies,
both geographically as well as in terms of their sector, together
with the knowledge and experience of their management teams,
will contribute to keeping Spain an important destination for these
international investors in the coming years.
We hope that you are looking forward to this new edition of the
study, on the role that sovereign wealth funds are playing in the
world economy.

Sovereign Wealth Funds 2014Introduction
7
Introduction
Javier Santiso
Professor of Economics, ESADE Business School
Vice President, ESADEgeo - Center for Global Economy and Geopolitics

This Sovereign Wealth Funds 2014 report is the third such report
produced by ESADEgeo, with the support of KPMG and ICEX-Invest in
Spain. We should like to start by thanking both institutions for the
support they have given us, enabling us to complete this third report
on sovereign wealth funds. We should also like to express our
particular thanks to Javier Capapé and Tomás Guerrero for their
excellent analysis and coordination of the report; and lastly to
Samuel Granados, for designing the internationally top-level
infographics, as demonstrated by his recent appointment as senior
editor with the Washington Post.
This work has not been an isolated effort. It is part of a range of
activities undertaken by ESADEgeo over the past three years. In
2011, Javier Santiso advised the Colombian government together
with the then Minister of Finance, Juan Carlos Echeverry and his
team on the creation of their sovereign wealth fund (now dedicated
to innovation). We have also launched a series of conferences on
emerging markets – ESADEgeo Globalization Lab – since many of
these countries have institutions of this kind. On 30 May 2011, we
held a Lab on sovereign wealth funds with Victoria Barbary, then
with the Monitor Group, in London. On 7 February 2012, Christopher
Balding of the Peking University HSBC Business School (Shenzhen,
China) was in attendance to present his latest book. In addition, we
have also contributed a chapter on political bias in sovereign wealth
fund investments to Sovereign Investment, a book edited by Karl
Sauvant for Oxford University Press. Debe quedar: Karl Sauvant for
Oxford University Press. During this past academic year 2013-2014
we took part in preparing a chapter on sovereign wealth funds and
Latin America in Global Public Investors 2014, published by OMFIF,
in London. We also strengthened our collaboration with the Fletcher
School at Tufts University, incorporating the analysis of trends in
funds carried out by Patrick Schena; also in 2014 we presented an
overview of the sovereign wealth funds industry at Sciences Po, in
Paris. The Report has already established itself as an international
reference: it is the only source specialising in sovereign wealth funds
quoted by the World Investment Report 2013, published by UNCTAD
(Geneva).
This Report is divided into three themed sections. In the first of
these, we address the main trends shown by sovereign wealth
funds in 2013 (Patrick Schena and Neeraj Prasad). In the second,
dedicated to geographical analysis, we focus on Spain and Latin
America (Javier Santiso and Germán Ríos), Norway (Javier
Capapé and Tomás Guerrero) and North America (Paul Rose). In
the third, we study the sovereign wealth funds’ activity by sector:
the real estate sector (with a special spotlight on Spain by Xavier
Reig), infrastructure (Victoria Barbary) and financial services
(Patrick Schena).
Several conclusions can be drawn from the analysis obtained in the
Sovereign Wealth Funds Report 2014:
• The phenomenon of sovereign wealth funds is continuing to
spread throughout all emerging regions: not just Asia and the
Middle East, but Africa and Latin America too. There are currently
84 sovereign wealth funds in operation, with assets amounting to
5.9 trillion dollars. The number of existing and potential funds
exceeds one hundred. Investments continue to be concentrated,
with the major funds accounting for the majority of transactions.
The classical receiving sectors - real estate and financial services -
attracted fresh capital. Specifically, the investment in real estate
well illustrates the paradox faced by many institutional investors
in the sector: the funds increase in average size, making them
more competitive. However, this increased size also poses a
difficulty when seeking to invest ever larger volumes of capital
efficiently.
• The analysis of the funds’ global trends shows two significant
tendencies. Firstly, “consortium” investments are recovering: in
2013 the number of direct transactions carried out jointly by the
funds (several funds co-investing in the same asset) exceeded the
number of individual transactions. This had not been the case
since 2009, and points to a learning process: the strengthening
of mutual know-how among these funds. Secondly, the attraction
of South-South investments stands out, as they again occupied a
priority position for the sovereign wealth funds. In this regard, we
would highlight the fact that the two biggest transactions of 2013
were carried out against the backcloth of an MoU between a
government and a sovereign wealth fund; in both cases, these
agreements were established with governments of emerging or
frontier countries. Qatar Investment Authority committed $5
billion in Malaysia to develop a new petrochemical industrial
complex in the South of the Peninsula; for its part, Mubadala
(United Arab Emirates) signed an agreement valued at $5 billion
to increase exports of bauxite from Guinea, as well as
constructing a port and an aluminium refinery.
• In our report for 2012, we highlighted the fact that Europe had
been the main recipient of investment in 2011 and that, within
Europe, Spain and its companies had been the main destinations
for sovereign wealth funds, receiving $8.34 billion of investment,
ahead of France, the UK and Germany. In 2013, we show that
Spain continued to be a priority target for the sovereign wealth
funds, with the increase in the Qatar Investment Authority’s
equity in Iberdrola, that of Temasek’s in Repsol, and the advent of
the first major real estate transaction with the acquisition of
Barcelona’s Hotel W by Qatari Diar. In total, between 2007 and
2014, SWFs have made more than €13 billion of direct
investments in Spain, 10% of total foreign investment in tangible
assets, showing the capacity for counter-cyclical investment that
Sovereign Wealth Funds 2014Introduction8
2. Introduction

these long-term investors have. Prominent among the most
active investors are sovereign wealth funds such as Qatar
Investment Authority (through its direct investment arm Qatar
Holding), Mubadala and IPIC (UAE) and Temasek and GIC
(Singapore). In the period covered by this 2014 Report, from
January 2013 to mid-2014, we have identified a flow of
investment into Spanish companies (equity) valued at more than
€2.7 billion. Most notable is the recovery of confidence in Spain
on the part of the giant Norwegian Government Pension Fund
Global (GPFG) which has increased its holdings in Spanish equities
by 15%. Moreover, it has also started trusting Spanish debt again,
increasing its positions almost fivefold to reach €3.32 billion at
the end of 2013, placing Spain in the twelfth position by incoming
investment in sovereign debt, ahead of Canada, Russia and
Australia.
• In this report we sketch out a systematic strategy for promoting
bilateral funds of funds in Spain (especially private equity,
expansion capital and venture capital). To this end, we focus on
the examples of countries such as Italy, France and Ireland, which
have established agreements (or created new investment
companies) between governments and sovereign wealth funds to
finance specific sectors or cover more complex phases of
investment (expansion capital in Spain being a good example).
Why not take advantage of the pull of investment in Spain and its
companies to establish an agreement of this type?
• The Canadian pension funds and the US sovereign wealth funds
are also studied in this Report. We trace the origins, many dating
back to the nineteenth century, of the US sovereign wealth funds,
most of which are unknown to the public at large. We also look at
the creation and strengthening of new, modern sovereign wealth
funds linked to the extraction of shale gas. And we study the
major Canadian public pension funds. While not being sovereign
wealth funds, since they have pension commitments, these
players pursue highly innovative, sophisticated and direct
investment strategies, and are gaining in importance in the
European market.
• The Norwegian sovereign wealth fund continues to lead in the
ranking by volume of assets under management. Now very close
to $900 billion, it is firmly on track to reach the trillion dollar
mark. We again note the nature of the fund which, despite having
the word “pension” in its name, is not a pension fund. We
uncover a marked European bias in its investments in equities,
which penalises investment in North American equities and
makes the UK the leading destination, followed (historically) by
France, Germany, Switzerland and Spain.
• Sovereign wealth funds are almost ideal players for investing in
infrastructure. Given their long-term investor profile, sovereign
wealth funds see in infrastructure a type of investment that
diversifies their portfolios, since there is usually very little
correlation with equities or bonds. Furthermore, it ensures a rate
of return that matches their long-term commitments and their
objectives of inter-generational wealth transfer: returns are stable
and hedged against the risk of inflation. Geographically, Europe
continues to dominate, and specifically the UK remains attractive
in airports and utilities such as water. However, in 2013, there
was a significant increase in investment in infrastructure in
emerging markets (23% of the total), led by Latin America. In
total, SWFs allocated $700 million to investment in infrastructure
in these markets; while still far from covering investment
requirements, these first steps may serve as an entry into markets
such as Brazil or Mexico, as well as Africa and South-east Asia,
where needs in the coming decades are patent.
• In 2013, the financial sector strengthened as a destination for
investment by sovereign wealth funds. This shows that the
financial sector continues to be a key investment sector for the
funds; additionally, we see a new trend, in that the funds are
directing their investments in the sector into new geographical
regions. Some funds’ strategic objective has centred on ensuring
domestic financial stability and strengthening the bases of their
own banking systems. As commented, for some funds, a new
geographical focus can be discerned, driven by positive prospects
and new demographic and socio-economic data. The sovereign
wealth funds have become an important source of capital for
global financial companies: almost 270 transactions in the sector
since 2006, 70% of them after the global financial crisis. All this
leads us to wonder about the actions of the sovereign wealth
funds as investors in this sector: What strategy do the sovereign
wealth funds pursue in investing in the financial sector? And what
inferences can be drawn? We will respond to both questions in
this chapter.
• In short, in this 2014 Report we corroborate the solid weight of
the emerging sovereign wealth funds in the industry as a whole.
This trend is in line with the increased weight of the emerging
markets in the global economy, which is now more apparent than
ever, and which is clearly demonstrated by these sovereign
wealth funds. The sovereign wealth funds are developing ever
greater and more sophisticated investment capabilities,
establishing new agreements with governments of European,
African and Asian countries, strengthening their co-investment
alliances and their positioning in global sectors such as real estate
and infrastructure.
Sovereign Wealth Funds 2014Introduction
9

SWF Investment 2013: The Continuing Quest for Quality Deal Flow
Patrick J. Schena
PhD, Adjunct Assistant Professor & Senior Fellow and Co-Head SovereigNET: The Fletcher Network for Sovereign Wealth and Global Capital
The Fletcher School, Tufts University
Neeraj Prasad
PhD, The Fletcher School, Tufts University
Sovereign Wealth Funds 2014SWF Investment 2013: The Continuing Quest for Quality Deal Flow
11

Sovereign Wealth Funds 2014SWF Investment 2013: The Continuing Quest for Quality Deal Flow12
3. SWF Investment 2013: The Continuing Quest for Quality Deal Flow
2013 marked yet another year of steady advancement in both the
number and aggregate size of sovereign wealth funds globally.
Including the watershed year of 2006 when 10 new funds were
established, some 25 entities have been created primarily in
emerging economies 1. Among those 25, ten funds were
established in Africa, which today is home to 15 SWFs. Asset
growth has likewise expanded in the intervening years, by some
accounts more than doubling to current estimates of
approximately $6 trillion. This brief reflection on the rapid
expansion of SWFs as a class of global institutional investor is
important. While it may mask the substantial differences in the
size and scale of SWFs, it helps to inform the challenges of
managing large and expanding pools of institutional capital and
the continuing quest for quality deal flow. These challenges will
become more pronounced as the average size of SWFs continues
to expand and along with it competition to efficiently deploy
capital in scale.
Definition and methodology
We begin our discussion with a brief, but cautionary note on
definition and methodology, which, we believe, has broader
applicability to research into the investment activities of SWFs. First,
definitions matter 2. In this context, our definition of “sovereign
wealth fund” is broad in scope and includes what are commonly
referred to as stabilization, wealth, development, and pension
reserve funds. Next, our research on investment activity, described
and analyzed in this chapter, is focused on those direct investments
by SWFs conducted in private versus public markets, i.e. what might
be described as “private equity”. We do not, however, exclude
transactions in which SWFs provide debt capital. Also, our research
attempts to isolate the direct contribution of a SWF to a transaction.
This includes estimates of capital directly contributed or earmarked
for the deal. Because deal amounts or direct SWF contributions are
frequently unreported or refer to capital commitments versus
invested amounts, in-year estimates of SWF DFI can vary widely
among researchers.
Large fund structures and concentration themes tend to dominate
our analysis. This is a naturally occurring bias in the data. Thus, for
2013 we identified over 160 confirmed transactions involving SWFs
expectedly concentrated among the largest funds. Earlier patterns
of concentration in such industries as financial services and real
estate likewise continued from prior years. With respect to
investment behavior, a pattern has emerged suggesting that the
average size of SWF contributions to individual transactions may be
rising after several years in decline.
1 As both the definition and count of SWFs global remains a topic of considerable debate, it is difficult to definitely scale the impact of entity growth. Nonetheless defensible estimates suggest that.2 Javier Capapé and Tomás Guerrero. 2013. “More layers than an onion: Looking for a definition of Sovereign Wealth Funds” SovereigNET Research Paper, The Fletcher School, Tufts University, Boston, MA.
Global deals analysis
As has been well-documented 3, the years in the immediate
aftermath of the financial crisis saw large SWFs investments
directed to the financial sector. These infusions were driven by the
need for liquidity and prompt recapitalization in several large
global banks – both domestic and foreign – to the investing funds.
During the intervening period – 2010-2012 – relatively smaller
deals transactions were completed with listed non-financial firms
including AMD, Nova Chemicals, Daimler, Porsche, CEPSA, Frac
Tech, and Siemens. SWF investment in these companies was often
directed to facilitate further corporate expansion in the SWF’s
home country whether through the build-out of increased
manufacturing capacity or to secure access to a steady supply of
raw materials.
More recently, we observe sizeable SWF investments directed to
large developmental projects, including townships, industrial zones,
and key infrastructure, or to the development of strategic assets,
such as natural resource, including extraction and refining. Many of
these investments represent capital commitments that will be
deployed over the coming five years, i.e. through project
construction. They are typically driven by MoU signed by the state
and a private company, or between two states, wherein the SWF
plays key roles not only as a source of funding, but also to facilitate
deal origination and structuring. Two examples will serve to
illustrate.
In 2013, the largest foreign acquisitions by SWFs were two deals of
$5 billion each. Both the deals involved a MoU signed between the
SWF and the host national government. In the first, Mubadala
signed an agreement with the Guinean government to build
bauxite and an aluminum refinery in Guinea. In this deal $1 billion
was earmarked to build infrastructure to extract and export
bauxite, while additional $4 billion will be utilized to build an
aluminum refinery and port. Similarly, QIA agreed to invest $5
billion in the Pengerang Integrated Petroleum Complex in the
southern state of Johor, in Malaysia. Both transactions involve
capital commitments to be made over a period of three to four
years.
Focusing specifically on the largest SWF deals of 2013, of the top
five, three deals where in sectors related to real estate and
construction while 2 were in natural resources.
3 See also chapter 7 on Financial Services by Patrick Schena in this Report 2014.

Sovereign Wealth Funds 2014SWF Investment 2013: The Continuing Quest for Quality Deal Flow
13
Swf target company Sub-Sector uS$ (millions)
Qatar Investment Authority Barwa’s Real Estate Assets (Qatar) Real estate - Mix 7,100
Qatar Investment Authority Pengerang Integrated Complex Development (Malaysia)Natural resources – Petrochemical 5,000
Mubadala Development Company Bauxite & Aluminium infraestruture & Port (Guinea)Natural resources & Construction 5,000
Khazanah Nasional Bhd Temasek Holdings DUO Township (Singapore)Real estate – Construction 3,194
GIC Broadgate Office Complex (UK)Real estate – Construction 2,720
Table 1
Deal Concentration by Size (2013)
Source: Fletcher SWF Transaction Database (2014).
The average deal size of the top five deals in the last 5 years was
approximately $3.7 billion; however, in 2013 this increased to about
$4.6 billion. As many as 17 of the 25 top five annual deals since
2009 have been solo transactions. In line with this trend, three out
of the top five deals of 2013 were also solo, including the largest
announced, QIA’s acquisition of Barwa’s assets for $7.1 billion,
completed through its real estate arm, Qatari Diar. Extending their
tradition of active co-investment in large transactions, Temasek and
Khazanah partnered to invest more than $3 billion in a township
being developed in Singapore.
By fund based on number of deals completed, Temasek led the deal
rankings in 2013, having completed the largest number of
investments – approximately 40. It was followed by GIC with 27,
Qatar Investment Authority with 20, Khazanah Nasional Bhd with
15, and China Investment Corporation with 12. Of the 67 deals
completed by the two Singapore SWFs, investments in China
accounted for as many as 20 deals, followed by 13 in India. By
contrast, Qatar directed its attention to the Gulf-region, North
America and South Asia, completing five investments in UAE and
four in USA and India each. In line with their mandate, Khazanah
made as many as six investments within Malaysia itself, and three
investments each in Turkey and China.
Geographically, China was the target of the most deals (26) by SWFs
in 2013, as followed closely by the USA and India (Chart 1). As noted,
Temasek and GIC combined for 20 out of the 26 investments made
in China – 14 by and 6 by GIC. Likewise, Singapore funds accounted
for 12 of the 21 investments made in India. UAE made the other 9
investments in India. The US, somewhat expectedly, continued to
attract the most diverse group of sovereign investors, with
Singaporeans making 9 investments, followed by UAE (4), Norway
(3), and one investment each from New Zealand, South Africa,
Kuwait, Malaysia, and China.
Source: Fletcher SWF Transaction Database (2014).
Chart 1
Operations of SWFs by country in 2013
China
2624 22
1311
USA India UK UAE
In Europe, Spain has been a destination for SWF investment over the
last five years. While the number of investments has been limited, the
deal size of each SWF investment has been relatively large on average.
For example, Abu Dhabi’s International Petroleum Investment
Company invested twice in Spain-headquartered Compañía Española
de Petróleos S. A. (CEPSA). The first investment, in 2009, involved
purchase of a $4.37 billion stake in CEPSA, resulting in a 47% ownership
position. In 2011, IPIC increased its holding in CEPSA by purchasing
Total’s stake for $5 billion. Also in 2011, now well documented, the QIA
purchased a 6.1% stake in Iberdrola for about $2.8 billion. In return,
Iberdrola agreed to establish a regional headquarter and a research &
development unit in Qatar. In 2013, Temasek acquired a 5% stake in
Spanish oil and gas giant Repsol for approximately $1.3 billion.

Sovereign Wealth Funds 2014SWF Investment 2013: The Continuing Quest for Quality Deal Flow14
3. SWF Investment 2013: The Continuing Quest for Quality Deal Flow
Source: ESADEgeo SWF Tracker (2014).
Angola
Bolivia
Namibia
United States
113.1
France
33.6Italy
6.0
Slovenia
Syria
n.d.
Papua New Guinea
Trinidad and Tobago
Ghana
India
Japan
Tunisia
UgandaSierra Leone
Senegal
1.0
Liberia
Mozambique
Tanzania
South Africa
Zambia
Zimbabwe
IsraelLebanon
Mongolia
n.d.
ASSETS UNDER MANAGEMENT (US$ billions)
UAE
973.3
19
Oman
6.8
Bahrain
36.6
AzerbaijanGeorgia
58.6
Iran
175.0
Qatar
530
Singapore
173.0
Kazakhstan
97.62
Russia
66.0
Libya
77.0
Algeria
56.6
South Korea
39.0
Brunei
Philippines
40.9
Malaysia
Ireland
20.2
Norway
897.6
25.51
New Zealand
Canada
22.5
Mexico
1.9
Brazil
7.0
5.1
15.7
East Timor
5.1
5.0
Botswana
1.7
Congo
Chile
22.7
n.d.
n.d.
Mauritius
1.0
Nigeria
Gabon
1.4
Panama
Guatemala
Venezuela
0.7Colombia
n.d.
0.7
Vietnam
0.52
Kiribati
PRE-2010 SWFs
65
Indonesia
n.d.
Mauritania
0.4
n.d.
São Tomé and Príncipe
Peru
8.5
S. Arabia
741.8
355
Kuwait
0.7Palestine
China
1,119.8
Australia
KenyaRwanda
0.03
Eq. GuineaSout. Sudan
n.d.
NEW SWFs(2010-2014)
19
COUNTRIES CONSIDERING SWFs
22
Oficinas internacionales de CICWorld map of sovereign wealth funds (2014)
Infographic 1
98.57
n.d.
n.d.n.d.
Currently, there are 84 active sovereign wealth funds, two more than our 2013 ESADEgeo SWF Report. 55 countries have established at least one SWF. Middle East, China, Southeast Asia and Norway are the four most active centers of SWFs. Assets under management sum up to 5.86 trillion dollars. SWFs have widely spread in recent years: in the last three years 7 new funds were established and 22 countries are considering establishing one. Debates over new SWFs are growing in East and South Africa and in Latin America. Thus, in 2014, there are 105 operating or projected-SWFs.
SWFs have likewise targeted Latin America for investment on a limited
scale since 2009. There have been 17 identified deals in the region
primarily across Brazil, Chile, Colombia, and Mexico. No clear trend
emerges as a case for increased interest by SWFs in Latin America as the
number of deals has varied from a few as one to as many as 7 (in
2010). In 2013, two interesting transactions of note are the team-up of
Mubadala and Trafigura to invest US$ 966 million to acquire an iron-
ore port – MMX Porto Sudeste - from Brazilian businessman Eike Batista
and GIC’s subscription to a capital increase in Aegea Saneamento e
Participacoes SA, a unit of Grupo Equipav. Under the terms of the MMX
Porto Sudeste deal, Trafigura will hold a 65% stake in MMX Porto
Sudeste Ltda, which is currently under construction, while Mubadala will
hold the remaining 35%. The GIC deal resulted in $135 million
investment in the Brazilian water and sewage treatment company,
which will be used to help the firm maintain its growth plans.
In 2013, of the 161 recorded deals, as many as 71 were co-investments,
as SWFs partnered with other investors to form deal consortia. Over the
last five years, almost 50% of the investments by count have been
co-investments. As much as 65% of all partnerships are with other fund
managers including private equity funds, insurance companies, and
pension funds. On average, about 25% of all co-invested deals include a
‘technical’ partner. This trend continued in 2013, with 28% of the
consortium deals having the involvement of a technical partner. SWFs
will also partner directly with governments as local governments seek to
attract SWF investment to their country. The previously noted Guinean
government agreement with Mubadala to develop bauxite extraction
and aluminum extraction capabilities is one such example. Likewise the
Russian government, through Russia Direct Investment Fund, has been
courting the China Investment Corporation and the Qatar Investment
Authority to invest in Russian projects 4.
From a sector perspective, financial services, broadly defined, and real
estate maintained their perennial lead as destination sectors for SWF
investment. Out of the 49 investments in the finance sector, 11
investments were made in banks, 3 in market exchanges, 7 in
insurance companies, and 22 investments were made in other
investment structures, including funds and private partners such as
private equity funds, REITS, etc. Such trends are much in line with
SWFs investments observed over the last five years, when typically
banks account for 25%, and investment funds account 40% of all
investments received by finance sector. In real estate and construction
we count approximately over 30 new deals; 10 out the 13 investments
made in the natural resources sector were in oil, gas or coal. Lastly,
investments made in the infrastructure were diversified utilities (6),
power generation (2), ports (3), and transport (2).
4 Check the chapter on Spain and Latin America within this 2014 SWF Report to see more examples of these agreements between governments and SWFs.

Sovereign Wealth Funds 2014SWF Investment 2013: The Continuing Quest for Quality Deal Flow
15
Source: ESADEgeo SWF Tracker (2014).
Angola
Bolivia
Namibia
United States
113.1
France
33.6Italy
6.0
Slovenia
Syria
n.d.
Papua New Guinea
Trinidad and Tobago
Ghana
India
Japan
Tunisia
UgandaSierra Leone
Senegal
1.0
Liberia
Mozambique
Tanzania
South Africa
Zambia
Zimbabwe
IsraelLebanon
Mongolia
n.d.
ASSETS UNDER MANAGEMENT (US$ billions)
UAE
973.3
19
Oman
6.8
Bahrain
36.6
AzerbaijanGeorgia
58.6
Iran
175.0
Qatar
530
Singapore
173.0
Kazakhstan
97.62
Russia
66.0
Libya
77.0
Algeria
56.6
South Korea
39.0
Brunei
Philippines
40.9
Malaysia
Ireland
20.2
Norway
897.6
25.51
New Zealand
Canada
22.5
Mexico
1.9
Brazil
7.0
5.1
15.7
East Timor
5.1
5.0
Botswana
1.7
Congo
Chile
22.7
n.d.
n.d.
Mauritius
1.0
Nigeria
Gabon
1.4
Panama
Guatemala
Venezuela
0.7Colombia
n.d.
0.7
Vietnam
0.52
Kiribati
PRE-2010 SWFs
65
Indonesia
n.d.
Mauritania
0.4
n.d.
São Tomé and Príncipe
Peru
8.5
S. Arabia
741.8
355
Kuwait
0.7Palestine
China
1,119.8
Australia
KenyaRwanda
0.03
Eq. GuineaSout. Sudan
n.d.
NEW SWFs(2010-2014)
19
COUNTRIES CONSIDERING SWFs
22
Oficinas internacionales de CICWorld map of sovereign wealth funds (2014)
Infographic 1
98.57
n.d.
n.d.n.d.
Currently, there are 84 active sovereign wealth funds, two more than our 2013 ESADEgeo SWF Report. 55 countries have established at least one SWF. Middle East, China, Southeast Asia and Norway are the four most active centers of SWFs. Assets under management sum up to 5.86 trillion dollars. SWFs have widely spread in recent years: in the last three years 7 new funds were established and 22 countries are considering establishing one. Debates over new SWFs are growing in East and South Africa and in Latin America. Thus, in 2014, there are 105 operating or projected-SWFs.

Sovereign Wealth Funds 2014SWF Investment 2013: The Continuing Quest for Quality Deal Flow16
3. SWF Investment 2013: The Continuing Quest for Quality Deal Flow
Global real estate focus
Elsewhere in this Report we return for a more focused look at SWF
investment activity in financial services (Chapter 7). Here we will
divert for a closer examination of SWF investment in real estate,
which has emerged an important anchor asset class for many SWF
portfolios. A closer focus on real estate in Spain involving SWFs is
developed in Chapter 6.
Currently over 60% of SWFs allocate at least 5% of their portfolios to
property either directly or indirectly 5. Such patterns in asset
allocation notwithstanding, it is primarily the largest SWFs who
dominate led by investors in the GCC and Asia. New to this field is
Norway’s Government Pension Fund Global, whose mandate to
deploy up to 5% of its $900 billion portfolio in global real estate,
represents a sizeable overhang in global real estate markets. Such
commitments reflect not only the scale of liquidity available among
these investors, but also their capacity to invest over long horizons in
less liquid, higher yielding assets, whose returns are less correlated
with the balance of their portfolios. Market access occurs both
through private real estate fund structures, as well as direct
investments that include partnerships with both local and global
real estate development companies. Geographically, North America
and Europe, and in particular the UK, have attracted the most SWF
real estate investment on the strength of asset quality. However, the
pace of SWF flows into the real estate sectors of emerging
economies has quickened in recent years.
Since 2006 SWF investment in global real estate markets has been
dominated by 7 funds 6 that have participated in over 75% of the
nearly 200 SWF transactions in the intervening period. Among these
funds GIC, QIA, and Temasek have been the most active together
participating in nearly 47% of the total transactions completed.
NBIM, the manager of Norway’s GPFG, initiated the build out of its
mandate in 2011 and has dramatically expanded its scope since.
In 2013, 34 global real estate deals were completed by SWFs. The
dominance of the core group - GIC, QIA, and Temasek - persisted
with total deals constituting over 44% of the total. Also in 2013
GPFG established itself as an important investor in global real estate
as it continued its aggressive investment program completing 5
deals or nearly 15% of the total.
As noted, SWFs have traditionally directed investment to developed
markets in North America and Europe. In the US and UK alone since
2011, the portion of total SWF investment in real estate has
expanded from 25% to over 40%. Interestingly, over the same
period, SWFs have increased their commitment to properties in both
5 “Sovereign Wealth Funds Investing in Real Estate”, Real Estate Spotlight, November, 2013 (Preqin); https://www.preqin.com/docs/newsletters/RE/Preqin_Real_Estate_Spotlight_November_2013.pdf6 The SWFs include CIC, GIC, GPFG, Istithmar World, Mubadala, QIA, and Temasek.
South and Southeast Asia, where such deals have increased to over
40% of global totals. SWF geographic concentration by 2013 has
therefore resulted in over 82% of all SWF investments in real estate
undertaken across these four countries/regions.
Finally, with respect to market access, SWFs have exhibited
flexibility by investing through both listed and unlisted structures,
while the dominant SWF real estate investors also actively engage in
direct transactions often in partnership with other SWFs or large
institutions or with experienced property development firms. In
2013, fund or listed structures and direct commercial or office
projects dominated equally, together constituting about 75% of
transactions. Importantly, the volume of fund or limited partner
participations appears also to have increased substantially over
recent years. This is an interesting development, particularly in light
of growing fee pressures on private structures and perhaps reflects a
practical resolution in the trade-off between fees and capacity
development among institutional investors.
As investors in this sector, SWFs certainly share the challenges of
their institutional peers. Principle among these challenges today is a
sizeable build up of global demand of between $350 billion and
$500 billion by some estimates 7. Similarly, the strategies they
deploy are often designed to leverage potential competitive
advantages to size and global reach. These include in-house capacity
development to support more direct transactions, and particularly
executed along side experienced local partners 8. Several recent
examples from the investment activities of SWFs in real estate will
serve to illustrate.
We begin with GPFG, who has been among the most active real
estate investors in the last 3 years and made its first investments in
the US in 2013. For the year, GPFG returned a reported 11.8% on its
real estate holdings as it continued its build out to a 5% allocation.
This build-out of their continually growing portfolio will contribute
directly to the above noted overhang in global real estate markets
for the next several years. Karsten Kallevig, chief investment officer
for real estate at NBIM has acknowledged that Norway’s real estate
investment program will evolve as a long-term initiative and will be
challenged by the increasing growth of the overall assets of the
GPFG 9.
As it builds its global portfolio, GPFG has focused on direct deals
through which it could invest in scale. Its approach has to leverage
the capacity and experience of local partners. In February 2013,
NBIM announced a partnership with TIAA-CREF to create a joint
7 See The Real Estate Equation: Bridging the Divide; Global to Local, Macro to Micro, PwC, October, 2013; see http://www.pwc.com/en_GX/gx/deals/swf/publications/assets/the-real-estate-equation-bridging-the-divide-global-to-local.pdf8 Ibid.9 David M. Levitt, Christopher Spillane and Jonas Bergman, “TIAA-CREF Plans More Property Deals With Norwegian Fund”, Bloomberg, Feb 12, 2013; see http://www.bloomberg.com/news/2013-02-11/norway-s-wealth-fund-makes-first-u-s-real-estate-purchase.html

Sovereign Wealth Funds 2014SWF Investment 2013: The Continuing Quest for Quality Deal Flow
17
venture through which it will co-invest in office properties in Boston,
New York and Washington. TIAA-CREF owns 50.1% and will manage
the joint venture, while NBIM holds the remaining 49.9%. The
partnership is rooted in a mutual focus on a long-term investment
horizon and an emphasis on large, high-quality assets in gateway
cities 10.
Geographically, India, among the emerging economies of South
and Southeast Asia, emerged as a destination for SWF real estate
investment in 2013. A key representative SWF deal is the
participation of GIC, Temasek, and Oman in a real estate private
equity fund launched by HDFC Property Fund, a unit of India’s
largest mortgage lender. This co-investment team-up will provide
the three sovereign investors access to Indian real estate through
the market experience of HDFC. It builds on an earlier 2010
partnership between GIC, Temasek, ADIC, and HDFC Ventures, the
venture arm of HDFC that involved the acquisition of a 10% stake in
a 117 floor residential tower in Mumbai, the city’s tallest
development 11.
10 See TIAA-CREF press release https://www.tiaa-cref.org/public/about/press/about_us/releases/articles/pressrelease443.html11 Maya Ando, “GIC, Temasek, Abu Dhabi and HDFC invest Mumbai’s highest development”, Asian Venture Capital Journal, 18 Aug 2010; http://www.avcj.com/avcj/news-analysis/1728403/gic-temasek-abu-dhabi-hdfc-invest-mumbais-development
Finally, we cite the Qatar Investment Authority, who has long been
an active investor in global real estate markets 12. Its experience
includes both direct and indirect market access and includes active
partnership with experienced local investors/developers. In 2013,
Qatar Holding exercised its interest in European real estate,
particularly Italy, through a strategic partnership with Hines Italia to
invest in Milan’s Port Nuova 13. The project has been billed as one of
the most ambitious city center mixed-use developments in Europe
with a reported market value in excess of €2 billion. The central
building of Porta Nuova Garibaldi, which is leased to Unicredito, is
Italy’s tallest structure. In the transaction, Qatar Holding will further
diversify its global real estate portfolio through increased
participation in the Italian real estate market, acquiring a 40% with
the remaining 60% owned by the current sponsors. This transaction
builds on a QIA-Hines relationship, that includes Hines partnership
with Qatari Diar, the QIA’s real estate development entity, to design
and construct a 370-room luxury hotel -the Conrad Washington, DC-
and 70,000 square feet of large-format retail space at CityCenterDC
in the US capital 14.
12 See Xavier Reig’s “Sovereign wealth funds and real estate” in 2013 ESADEgeo SWF Report.13 See Hines press release at http://www.hines.com/press/releases/5-16-13.aspx14 See Hines press release at http://www.hines.com/press/releases/692014.aspx

IGeographic Analysis

IGeographic Analysis

Javier Santiso
Professor of Economics, ESADE Business School
Germán Ríos
Director of Strategic Affairs, CAF - Development Bank of Latin America
Vice President, ESADEgeo - Center for Global Economy and Geopolitics
Sovereign wealth funds in Spain and Latin America

Javier Santiso
Professor of Economics, ESADE Business School
Germán Ríos
Director of Strategic Affairs, CAF - Development Bank of Latin America
Vice President, ESADEgeo - Center for Global Economy and Geopolitics
Sovereign wealth funds in Spain and Latin America
Sovereign Wealth Funds 2014Sovereign wealth funds in Spain and Latin America
21

Sovereign Wealth Funds 2014Sovereign wealth funds in Spain and Latin America22
4. Sovereign wealth funds in Spain and Latin America
4. SovErEiGn wEalth funDS in SPain anD latin amErica
Spain has not disappeared from the international investor’s map. On
the contrary, the crisis that battered the country between 2007 and
2014 was seen as an opportunity for many companies and investors,
particularly from Latin America, to enter Europe through Spain.
First-rate investors from Mexico, Colombia and Venezuela showed
interest, and took stakes in banks and businesses (such as
Campofrío and Bimbo, both now Mexican-owned.) Some made
their Spanish base the centre for their process of European
internationalisation (such is the case of Bimbo, with headquarters in
Barcelona) or internationalisation into Latin America and Asia (as in
the case of IPIC, based in Madrid via CEPSA.) This confirms the
attraction of Spain as a global base, a strategy we have defended
previously 1.
Above all, over the past few years sovereign wealth funds’ interest in
investing has been confirmed. In total, between 2011 and 2014,
SWFs made more than €13 billion of direct investments in Spain,
10% of total foreign investment in realassets. Prominent among the
most active investors are sovereign wealth funds such as Qatar
Investment Authority (through its direct investment arm Qatar
Holding), IPIC and Mubadala (United Arab Emirates) and Temasek
and GIC (Singapore). In the period covered by this 2013 Report,
from January 2013 to mid-2014, we have identified a flow of
investment into Spain and Spanish companies (equity) valued at
more than €2.7 billion.
The biggest investor, however, is Norway’s Government Pension
Fund Global (GPFG), which holds investments on the Spanish stock
exchange worth more than €7.2 billion in 2014, 15% more than the
year before, spread over 73 listed companies. In the latest period
analysed the data is very positive for Spain in terms of government
bonds, with growth of 366% and inward investment of €3.3 billion.
In this chapter we also address the development of Latin American
sovereign wealth funds and investment in Latin America and the
Caribbean by sovereign wealth funds from all over the world. Given
the history of trading and investment exchanges with the region,
Spain can focus its attention on capturing investment from Latin
American sovereign wealth funds that grew in this long
commodities cycle. For example, calling attention to the equity
investments of the Chilean funds, which recently revised their
investment strategy, or of Trinidad and Tobago; and seeking
interaction so as to receive investment in debt from the Peruvian
fund and the same Chilean funds.
1 See Javier Santiso, The rise of the multilatinas, Cambridge, Cambridge University Press, 2013.
More investors also appeared in sectors that were new to them
(such as the Spanish real estate sector, which Asian investors
ventured into during 2013-2014). We devote a section to the
property sector in our chapter on global investments and a fully-
devoted chapter to real estate and SWFs in Spain.
Another phenomenon that we highlight in this chapter is the strong
entry of Canadian pension funds, particularly into Spanish assets.
This entry is not specific to Spain, but part of a strategy of
strengthening investments in Europe, as confirmed by several
Canadian funds having established regional headquarters in London
over the past year.
New investment sectors for some, new players for others, the map of
sovereign wealth funds and (public) pension funds is being filled in and
coloured in Spain. From countries as diverse as Canada, Singapore,
South Korea, Qatar and the UAE, investors are entering a wide variety of
sectors. Could this represent a new opportunity for Spain?
In this chapter we sketch out a systematic strategy for promoting
bilateral funds of funds in Spain (especially private equity, expansion
capital and venture capital). Italy, for example, has put together
bilateral funds with Kuwait and Qatar to invest in medium-size
companies and provide expansion capital to help them grow in
international markets, including the Middle East where their
strategic partners come from. France has done the same thing with
sovereign wealth funds from Qatar and the UAE.
Ireland has gone even further, setting up a bilateral technology fund,
in this case co-investing with China Investment Corporation. This
example, as we shall see, is particularly attractive for Spain in view of
the sector (technology) and the logic: CIC provides investment to Irish
start-ups seeking to expand into Asia and set up a base in China, and
while also encouraging the arrival of Chinese start-ups seeking to
expand into Europe and set up an operational base in Ireland.
Spain could take inspiration from its French and Italian neighbours
and, above all, from the Irish, and establish similar bilateral funds of
funds. It has institutions that could be counterparties: ICO (Instituto
de Crédito Oficial, the state-owned credit institution), CDTI (Centro
para el Desarrollo Tecnológico Industrial) and ENISA (Empresa
Nacional de Innovación S.A., a state-owned enterprise for the
promotion of innovation). A fund of funds could be set up (for
investments in private equity, expansion capital and/or venture
capital) Spain-UAE, Spain-Qatar and Spain-Kuwait, with
contributions of €500 million from each counterparty (one billion
for each fund, i.e. €3 billion in total). Fund of funds Spain-Singapore
and Spain-Malaysia, also with contributions of €500 million from
each party, i.e. two more funds of funds, each of one billion. Fund of
funds Spain-South Korea and Spain-China with the same amounts of
participation. €7 billion in total.

Sovereign Wealth Funds 2014Sovereign wealth funds in Spain and Latin America
23
Table 1
Main investments in Spanish companies (2013-2014)
Source: Author’s estimations and data from Expansión, 2014.
Investor Country Company Stake / Assets Amount* Seller Sector Year
Vodafone United Kingdom Ono 100% 7,200 Risk Capital Telecommunications 2014
Crown Holding USA Mivisa 100% 1,200 N+1, Mercapital and Blackstone
Industry 2013
Triton Partners United Kingdom Befesa 100% 1,075 Abengoa Environment 2013
Temasek Singapore Repsol 5% 1,036 Treasury stock Energy 2013
Banesco Venezuela Novagalicia Banco 88.33% 1,000 Frob Banking 2013
ADO Mexico Avanza 100% 800 Doughty Hanson Transport 2013
Kennedy Wilson\Värde USA Aliseda 51% 800 Banco Popular Real Estate 2013
Apollo USA Altamira 85% 700 Banco Santander Real Estate 2014
Scor Global Life France Portfolio of pure life policies
90% 630 BBVA Seguros Insurance 2013
NTT Data Japan Everis 100% 559 3i, Landon and Hutton Collins
Consulting 2013
Revlon USA Colomer 100% 486 CVC and Familia Colomer Cosmetics 2013
Del Valle Family Mexico Banco Popular 6% 450 Banco Popular Banking 2013
IPIC Abu Dhabi Torre Foster - 450 Bankia Real Estate 2013
Carrefour France 63 commercial centres - 380 Klépierre Real Estate 2013
Several funds - Enagás 10% 360 Liberbank and other savings banks
Energy 2013
KKR USA - Debt of Uralita 320 Banks Construction 2013
Sigma Food Mexico Campofrío 45% 315 Oaktree, Ballvé Family and CaixaBank
Consumption 2013
Jaime Gilinski Colombia Banco Sabadell 5.03% 313 Capital increase Banking 2013
Fintech USA\Mexico Banco Sabadell 4.94% 306 Capital increase Banking 2013
Fibra Uno Mexico - 278 branches of Banco Sabadell 300 Moor Park Real Estate 2013
Fortress USA Realia debt - 284 SAREB (Spain's "bad bank") Real Estate 2013
Emin Capital Andorra Torre Agbar - 250 Agbar Real Estate 2013
Burlington Loan Management Limited USA Bermuda Colonial Loans 245 SAREB (Spain's "bad bank") Real Estate 2013
HNA China NH Hoteles 20% 234.5 Capital increase Tourism 2013
Doughty Hanson United Kingdom Teknon 100% 230 Magnum Capital Healthcare 2013
Goldman Sachs and Azora USA\Spain - 2,935 council flats 201.2 Ivima-CAM Real Estate 2013
Qatari Diar Qatar - Hotel W 200 FCC, OHL, Comsa Ente and Godia
Real Estate 2013
TPG USA Servihabitat Gestión Inmobiliaria
51% 189 La Caixa Real Estate 2013
Baupost USA 8 shopping centres - 180 Vastned Retail Real Estate 2014
AndBank Andorra Inversis Private Banking - 179.8 Banca March Banking 2013
Axa Real Estate France - 13 buildings belonging to the Government of Catalonia
172 Government of Catalonia Real Estate 2013
Intu\CPPIB UK\Canada - Parque Principado 162 SONAE\CBRE Real Estate 2013
Veolia France Proactiva 50% 150 FCC Environment 2013
Fortress USA - 2,000 residential actions 150 SAREB (Spain's "bad bank") Real Estate 2013
Orion Capital United Kingdom Port of Venice 50% 144.5 British Land Real Estate 2013
Inmosan\Davinci Capital\Masaveu Mexico\Spain Liberbank 14% 174 Cajasur, Caja Extremadura and Caja Cantabria
Banking 2014
total 21,826
* Millions of euros.
Sovereign Wealth Funds 2014Sovereign wealth funds in Spain and Latin America24
4. Sovereign wealth funds in Spain and Latin America
These funds would be allocated to private sector private equity
and venture capital companies, which would compete for the
mandates. Having anchor investors from emerging countries and
regions would also give them all an expansion capital dimension,
towards the Middle East and South or North Asia, all high-growth
regions. There could be multi-sector funds of funds and others
more sector-specific or themed, for example a fund of innovation
funds, or a fund of funds with a water or infrastructure theme. We
would also do well to draw inspiration from what some Latin
American countries have done, particularly Chile, which has
created Start-Up Chile 2 with a (public) fund to attract start-ups
from all over the world, encouraging the import of entrepreneurs
while at the same time bringing about a real silent revolution, a
change of mentality whereby nowadays young Chileans no longer
aspire only to be lawyers or economists, but also entrepreneurs.
The programme has put Chile on the world map of start-ups in just
four years.
This economic policy should be driven at the highest level to make it
really operational: obtaining and coordinating mandates, and
delegated execution in the agencies already operating in the field of
investment in businesses (ICO, ENISA and CDTI). Clear objectives
should be pursued: supporting the internationalisation of medium-
size and/or high-growth companies; focusing on added value in
products and processes and, as a priority, betting on innovation and
technology. The final operations would fall to private equity teams
and firms from the private sector, with nationwide, not regional,
mandates.
In any case, many countries have already created or are creating
venture capital funds of funds or funds for investing directly in
start-ups, seeking to promote innovation and technology,
enterprises and entrepreneurs. In the past, Israel rolled out a
successful strategy in this respect: the Yozma Programme. Today,
countries such as Canada, Singapore, Lebanon, Saudi Arabia,
Chile, Colombia, Brazil, Ireland and Taiwan have executed or are
currently executing strategies similar to Israel’s. Spain too has
instruments and agencies with which to take advantage of this
momentum: bilateral funds of funds would add more capacity at a
critical time like the present.
Spain has to reinvent itself. The crisis has shown that the low-cost,
construction- and services-based growth model is not enough to
generate solid, quality employment. Betting on industrial and
digital niches are two possible levers, though by no means the
only ones. To this end the strengths of the economy can and must
also be the starting point: if Spain is a tourism powerhouse, why
not opt for creating industrial groups and digital firms specifically
2 A total of more than 10,000 projects were presented, from 110 countries. More than 700 start-ups from 65 countries were supported. See the report on the first four years of the programme: http://www.alejandrobarros.com/media/users/1/50369/files/4363/Reporte_Startup_Chile_2013.pdf
in this sector? The same can be said of the food and nutrition
sectors, seeking to link them with added-value industrial and
digital processes instead of focusing solely on the base, partly or
semi-transformed product.
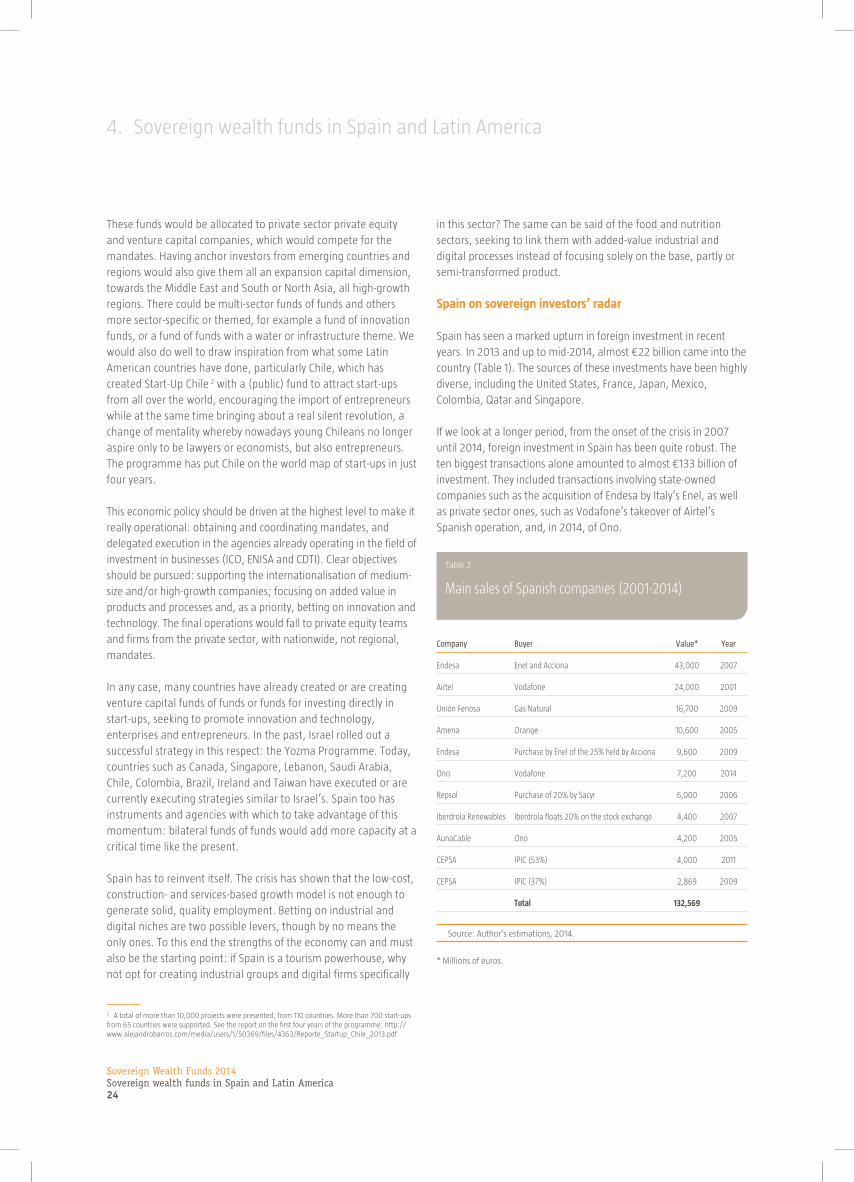
Spain on sovereign investors’ radar
Spain has seen a marked upturn in foreign investment in recent
years. In 2013 and up to mid-2014, almost €22 billion came into the
country (Table 1). The sources of these investments have been highly
diverse, including the United States, France, Japan, Mexico,
Colombia, Qatar and Singapore.
If we look at a longer period, from the onset of the crisis in 2007
until 2014, foreign investment in Spain has been quite robust. The
ten biggest transactions alone amounted to almost €133 billion of
investment. They included transactions involving state-owned
companies such as the acquisition of Endesa by Italy’s Enel, as well
as private sector ones, such as Vodafone’s takeover of Airtel’s
Spanish operation, and, in 2014, of Ono.
Company Buyer Value* Year
Endesa Enel and Acciona 43,000 2007
Airtel Vodafone 24,000 2001
Unión Fenosa Gas Natural 16,700 2009
Amena Orange 10,600 2005
Endesa Purchase by Enel of the 25% held by Acciona 9,600 2009
Ono Vodafone 7,200 2014
Repsol Purchase of 20% by Sacyr 6,000 2006
Iberdrola Renewables Iberdrola floats 20% on the stock exchange 4,400 2007
AunaCable Ono 4,200 2005
CEPSA IPIC (53%) 4,000 2011
CEPSA IPIC (37%) 2,869 2009
total 132,569
Table 2
Main sales of Spanish companies (2001-2014)
Source: Author’s estimations, 2014.
* Millions of euros.

Sovereign Wealth Funds 2014Sovereign wealth funds in Spain and Latin America
25
Table 3
Main investments of sovereign wealth funds in Spanish companies (2011-2014)
Fund Country Company acquired/owner Equity stake/Assets Amount* Year
IPIC UAE CEPSA 53% 4,000 2011
Qatar Holding (QIA) Qatar Iberdrola 6.1% 2,000 2011
Qatar Holding (QIA) Qatar Santander Brazil 5.1% 1,953 2010**
Temasek Singapore Repsol 5% 1,036 2013
Mubadala UAE Sener Joint Venture (60%) 940 2011
Qatar Holding (QIA) Qatar Iberdrola 2.2% 620 2012
Qatar Holding (QIA) Qatar Ferrovial (Heathrow Airport Holdings) 10.6% 587 2012
IPIC UAE Bankia Torre Foster 450*** 2013
Qatar Holding (QIA) Qatar Société Foncière Lyonnaise (Colonial) 22.1% 391 2014
CIC China Abertis 7% stake in Eutelsat 385,2 2012
CIC China Ferrovial (Heathrow Airport Holdings) 5.7% 319 2012
QIA Qatar Colonial 13.1% 239 2014
Qatari Diar (QIA) Qatar FCC, OHL, Comsa Ente and Godia Hotel W 200 2013
GIC Singapore Applus+ 6.1% 127 2014
Qatari Diar (QIA) Qatar Sociedad Internacional Marina Tarraco Marina Port Tarraco 64 2011
Katara Hospitality (QIA) Qatar GSSG Hotel Intercontinental 60 2014
total 13,371
Source: Author´s calculations, 2014.
* Millions of euros.
** The fund changed the convertible bonds into shares in 2013.
*** Value of the purchase option.
Sovereign wealth funds have remained very active in Spain and
in Spanish companies. Examples are the investments by
Singapore’s funds Temasek and GIC in Repsol and Applus+,
respectively. Moreover, Qatar’s real estate transactions in Spain
are on the increase: for example Qatari Diar bought Hotel W in
Barcelona and Qatar Holding’s new hotel arm, Katara
Hospitality, acquired the Hotel Intercontinental in Madrid. For its
part, IPIC, which already occupies Torre Foster in Madrid through
CEPSA, holds a purchase option on the high-rise, which is one of
Madrid’s new iconic landmarks. Additionally, Norway’s sovereign
wealth fund has increased its exposure to Spain by more than
$1.6 billion, to $9.99 billion. In total, in 2013 and up to mid-
2014, SWFs foreign investment inward flow in Spanish
companies (both portfolio or direct investments) is valued at
nearly $3.65 billion.
As we have seen in previous reports, this is not a new trend. Since
the onset of the financial crisis of 2007, sovereign wealth funds
have shown significant interest in Spain. Between 2007 and 2014
they invested more than €13 billion in the country. Qatar has been
the most active investor in terms of the number of transactions, with
investments in companies such as Santander and Iberdrola, and
later with acquisitions of and equity stakes in hotels, property
companies and marinas. The biggest investment by a sovereign
wealth fund is that of the UAE’s IPIC with the acquisition of CEPSA
for nearly €7 billion, in two tranches, one in 2009 and the other in
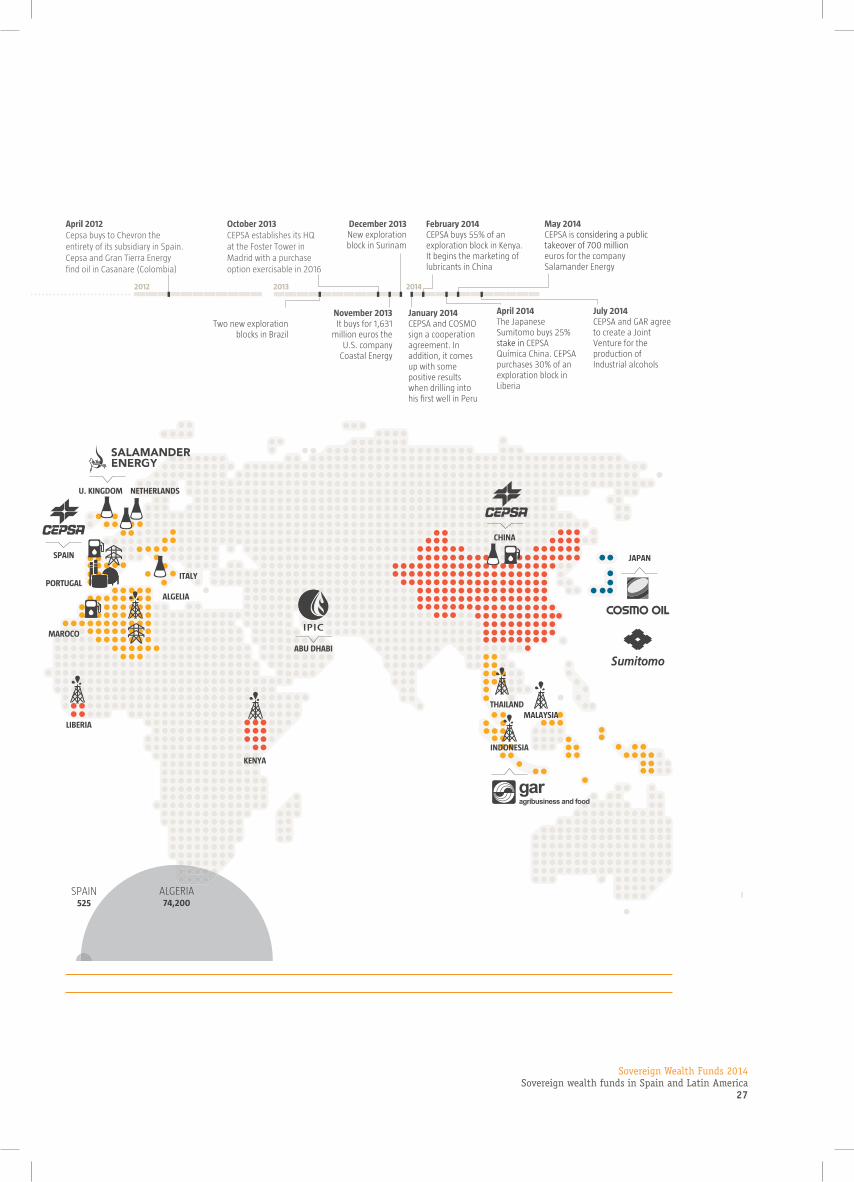
2011. Driven by IPIC, the company has thus become the group’s
internationalisation hub, transforming its international and sectoral
presence, as we explain in Infographic 2.* Millions of euros.

Sovereign Wealth Funds 2014Sovereign wealth funds in Spain and Latin America26
4. Sovereign wealth funds in Spain and Latin America
Source: based on annual reports of the companies (2014).
IPIC is turning the company to convert CEPSA in a global energy player.
Main strategic axes
After IPIC completed acquistion of 100% of CEPSA in 2011, CEPSA has struck out in a new direction with the intention of achieving a strong global growth, focused on Exploration and Production, and Petrochemistry business units.
Activities
Reconversion
Technological and commercial synergies
New markets
Production from fields attributed to CEPSA in thousands of barrels per day.
Average production
Marketing
Refining
Gas and electricity
Exploration and production
Petrochemistry
The metamorphosis of CEPSA
Infographic 2
CANADA
UNITED STATES
PANAMA
BRAZIL
SURINAME
U. KINGDOM
PERU
COLOMBIA
SPAIN
ITALYPORTUGAL
MAROCO
ALGELIA
LIBERIA
NETHERLANDS
ABU DHABI
MALAYSIATHAILAND
INDONESIA
JAPAN
CHINA
KENYA
COLOMBIA18 237
SPAIN525
ALGERIA74 200
August 2011IPIC buys 52.94% stake
in CEPSA for $3.7bn
March 2011New exploration
block in Algeria
March 2010CEPSA and Petrobras announced
the discovery of oil at Balay-1 exploratory well, in Cuenca de los
Llanos (Colombia)
May 2013 Two new exploration
blocks in Brazil
December 2013 New exploration block in Surinam
November 2013 It buys for 1,631
million euros the U.S. company
Coastal Energy
October 2013CEPSA establishes its HQ at the Foster Tower in Madrid with a purchase option exercisable in 2016
January 2014CEPSA and COSMO sign a cooperation agreement. In addition, it comes up with some positive results when drilling into his first well in Peru
February 2014 CEPSA buys 55% of an exploration block in Kenya. It begins the marketing of lubricants in China
May 2014CEPSA is considering a public takeover of 700 million euros for the company Salamander Energy
July 2014CEPSA and GAR agree to create a Joint Venture for the production of Industrial alcohols
April 2014The Japanese Sumitomo buys 25% stake in CEPSA Química China. CEPSA purchases 30% of an exploration block in Liberia
2013 20142012201120102009
December 2011It creates a strategic plan
(2012-2016): 1) Significant growth in Exploration and
Production; 2) International projection in Petrochemistry
April 2012Cepsa buys to Chevron the entirety of its subsidiary in Spain.Cepsa and Gran Tierra Energy find oil in Casanare (Colombia)
March 2009IPIC acquires 32.53% and 5% stake in CEPSA in the hands of Banco Santander and Unión Fenosa respectively. The deal amounts to just over 3,300 million euros and it places IPIC as the second largest shareholder with 47.06%
, ,
Sovereign Wealth Funds 2014Sovereign wealth funds in Spain and Latin America
27
Source: based on annual reports of the companies (2014).
IPIC is turning the company to convert CEPSA in a global energy player.
Main strategic axes
After IPIC completed acquistion of 100% of CEPSA in 2011, CEPSA has struck out in a new direction with the intention of achieving a strong global growth, focused on Exploration and Production, and Petrochemistry business units.
Activities
Reconversion
Technological and commercial synergies
New markets
Production from fields attributed to CEPSA in thousands of barrels per day.
Average production
Marketing
Refining
Gas and electricity
Exploration and production
Petrochemistry
The metamorphosis of CEPSA
Infographic 2
CANADA
UNITED STATES
PANAMA
BRAZIL
SURINAME
U. KINGDOM
PERU
COLOMBIA
SPAIN
ITALYPORTUGAL
MAROCO
ALGELIA
LIBERIA
NETHERLANDS
ABU DHABI
MALAYSIATHAILAND
INDONESIA
JAPAN
CHINA
KENYA
COLOMBIA18 237
SPAIN525
ALGERIA74 200
August 2011IPIC buys 52.94% stake
in CEPSA for $3.7bn
March 2011New exploration
block in Algeria
March 2010CEPSA and Petrobras announced
the discovery of oil at Balay-1 exploratory well, in Cuenca de los
Llanos (Colombia)
May 2013 Two new exploration
blocks in Brazil
December 2013 New exploration block in Surinam
November 2013 It buys for 1,631
million euros the U.S. company
Coastal Energy
October 2013CEPSA establishes its HQ at the Foster Tower in Madrid with a purchase option exercisable in 2016
January 2014CEPSA and COSMO sign a cooperation agreement. In addition, it comes up with some positive results when drilling into his first well in Peru
February 2014 CEPSA buys 55% of an exploration block in Kenya. It begins the marketing of lubricants in China
May 2014CEPSA is considering a public takeover of 700 million euros for the company Salamander Energy
July 2014CEPSA and GAR agree to create a Joint Venture for the production of Industrial alcohols
April 2014The Japanese Sumitomo buys 25% stake in CEPSA Química China. CEPSA purchases 30% of an exploration block in Liberia
2013 20142012201120102009
December 2011It creates a strategic plan
(2012-2016): 1) Significant growth in Exploration and
Production; 2) International projection in Petrochemistry
April 2012Cepsa buys to Chevron the entirety of its subsidiary in Spain.Cepsa and Gran Tierra Energy find oil in Casanare (Colombia)
March 2009IPIC acquires 32.53% and 5% stake in CEPSA in the hands of Banco Santander and Unión Fenosa respectively. The deal amounts to just over 3,300 million euros and it places IPIC as the second largest shareholder with 47.06%
, ,

Sovereign Wealth Funds 2014Sovereign wealth funds in Spain and Latin America28
4. Sovereign wealth funds in Spain and Latin America
The funds’ investments have followed several different strategies.
Some, such as GIC’s 2014 investment in Applus+, are purely
financial equity stakes. Others, however, seek strategic synergies
beyond financial returns, as we shall see in the case of IPIC with the
acquisition of CEPSA, or with Temasek’s stake in Repsol. The
investments made by these funds in Spanish companies with a view
to entering Latin American markets also deserve special attention.
For example, Qatar’s investments in Iberdrola and Santander.
Another piece of good news from 2013 is the recovery of
Norway’s investment in Spanish debt. Last year we announced
that the Norwegian fund (GPFG) had reduced its exposure to
Spanish debt by nearly 70%, to €712 million. By the end of 2013,
the trend had completely changed. GPFG had more than €3.3
billion of Spanish sovereign debt in its portfolio. The increase, in
euros, relative to 2012, was a substantial 366%. Whereas in
2012 Spain fell to 40th position in fixed income, in 2013 it was
back among the Norwegian giant’s leading recipients of the
investments in fixed income, in 12th place, ahead of Canada,
Russia and Switzerland.
* Millions of euros.
Investment 2013 2012 2013/2012
Fixed Income 9,814 7,862 24.80%
Central Government Debt 3,323 712 366.70%
Equities 7,257 6,297 15.20%
total* 20,394 14,871 37.10%
Table 4
The Norwegian sovereign wealth fund is renewing its commitment to Spain and Spanish companies
Source: Author’s elaboration, based on NBIM data, 2014.
Sovereign wealth funds pounce on bricks and mortar
Sovereign wealth funds’ interest in the real estate sector was confirmed
in 2013 and 2014 (see chapter devoted to this sector in the report).
Between 2013 and 2014, the biggest property sales totalled more than
€3 billion. One of the biggest transactions was the purchase of the
Hotel W in Barcelona by Qatari Diar, for €200 million, another being
the lease with purchase option of the Torre Foster in Madrid by IPIC, for
€450 million, although the option has not yet been exercised. As shown
in Table 5, investments in the sector increased notably in the past two
years, and the sovereign wealth funds formed part of the trend. For the
first time in recent years, Spain’s real estate sector is perceived as a
premium investment, something that in Europe was hitherto mainly the
preserve of the UK and France, with London and Paris as magnets for
these investors in search of top-grade assets.
Europe is a priority real estate sector destination for Asian investors.
Prominent among the most active investors are Malaysia’s
Permodalan Nasional Berhad, China’s Gingko Capital and Australia’s
AMP Capital. Sovereign wealth funds such as the Hong Kong
Monetary Authority, Korea Investment Corporation, China Investment
Corporation and Singapore’s GIC have also made inroads.
These transactions are part of the general return of foreign investors
to the Spanish property market. Asian investors stand out in this
segment, having invested in both offices and residential properties
and hotels (see Chart 1).
Asian investment in the sector is not an entirely new phenomenon.
IBM’s Madrid headquarters, purchased by Morgan Stanley in 2006 for
€240 million and now in the sights of Mexican magnate Carlos Slim,
had been owned by Singapore’s GIC since 2000. In that year it
apparently paid €180 million under a sale and lease-back arrangement.
Millions of dollars
Chart 10
Changes in Latin American and Caribbean foreignexchange reserves (1994-2013)
Source: IAD and CAF, 2014.
0
300,000
600,000
900,000
1995 2000 2005 2010
814,903
Source: IMF, 2014.
Chart 9
Flow of foreign capital by type (1980-2013)
-50,000
0
50,000
100,000
150,000
200,000
Direct Investment, net Portfolio Investment, net Millions of dollars
1980 1985 1990 1995 2000 2005 2010
5.0%
51.0%
51.0%
51.0%
2.5%
4.2%
7.4%
11.9%
20.0%
20.0%
20.1%
60.0%
77.8%
79.2%
80.0%
92.0%
95.8%
100%
100%
100%
100%
100%
100%
100%
100%
100%
Source: Prepared by authors, 2014.
Chart 8
SEPI's industrial holdings
Ensa
Grupo Hunosa
Grupo Sepides
IZAR
Grupo Navantia
MAYASA
Agencia EFE
Grupo Cofivacasa
Grupo Correos
Hipódromo de la Zarzuela
Alimentos y Aceites
SAECA
Cetarsa
Corporación RTVE
Grupo Enusa
Defex
Grupo Mercasa
Tragsa
Indra
Enresa
REE
España Expansión Exterior
Hispasat
Enagás
EADS
IAG
Chart 7
Shareholding of Deoleo following the entry of CVC
Before the entry After the entry
Source: Prepared by authors, 2014.
Free float 37%
Others 7.4%
Ebro Foods 2.9%
Kutxa 4.8%
CaixaBank 5.28%
Unicaja 11.4%
Bankia16.5%
CVC29.9%
BMN 4.8%
Dcoop 9.9% Dcoop 1.32%
Chart 1
Asian sovereign wealth funds swoop on theSpanish real estate sector
Offices70.0%
Residential17.0%
Hotels 8.0%
Commercial 2.0%
Industrial 2.0%
Source: Prepared by authors, 2014.
Source: Prepared by authors, 2014.
Chart 5
Main shareholders of ONO followingbefore the entry of Vodafone
CCMP15.2%
Thomas H. Lee15.0%
Quadrangle9.0%
Providence15.2%
General Electric9.0%
Multitel6.0%
5.4%Val Tel.
Caisse dedépôt etplacementdu Québec6.8%
OntarioTeachersPensionPlan4.8%
Sodinteleco3.9%
Otros1.6%
Northwestern2.3%
Bregal1.4%
BancoSantander4.4%
Source: Prepared by authors, 2014.
Chart 6
Major shareholders of Applus+
Carlyle35.5%
Morgan Stanley6.9%
GIC6.1%
AmeripriseFinancial3.8%
Source: Prepared by authors, 2014.
Chart 4
Shareholding of Heathrow Airport Holdings
Ferrovial25.0%
Caisse dedépôt etplacementdu Québec
13.3%
Qatar Holding20.0%
10.0%
China InvestmentCorporartión
11.2%
Alinda Airports
11.9%
Government of Singapore
8.7%
UniversitiesSuperannuationScheme
Source: Prepared by authors, 2014.
Chart 3
Shareholding of Société Foncière Lyonnaisefollowing the entry of QIA
Colonial53.1%
Qatar Holding22.1%
CréditAgricole(Predica)12.3%
ORION IIIEuropean 36.4%
Reig CapitalGroup4.4%
Free Float1.7%
Source: Prepared by authors, 2014.
Chart 2
Shareholding of Colonial following the entry of QIA
Free-Float31.0%
Grupo Villar Mir29.0%
Coral Partners9.4%
13.1%Grupo Santo Domingo7.5%
MoraBanc7.0%
Fidelity 2.7%
Qatar Investment Authority
Added to these transactions are those carried out in 2014 by the
Qatar Investment Authority in Colonial and in its French subsidiary
Société Foncière Lyonnaise (SFL). In the case of Colonial, QIA took
part in the Spanish property company’s capital increase in April, and
initially took a 3.7% equity stake, increasing it a few weeks later to
13.1% (worth around €239 million), becoming the company’s
second biggest shareholder after the Villar Mir Group. Colombia’s
Santo Domingo group and Andorra’s Morabank accompanied QIA,
and also took advantage of the capital increase to take 7.5% and 7%
shareholdings respectively in Colonial.

Sovereign Wealth Funds 2014Sovereign wealth funds in Spain and Latin America
29
Table 5
Biggest property sales (2012-2014)
Assets Buyer Seller Value* Year
Torre Foster** IPIC Bankia 450 2013
278 branch offices of Sabadell Fibra Uno Fund Moor Park 300 2013
Colonial Loans Burlington Loan Management Limited SAREB (Spain's "bad bank") 245 2013
2,935 council homes Goldman Sachs and Azora Ivima 201 2013
NPLs Lone Star, Fortress and Cerberus Banco Santander 200 2012
Hotel W Qatari Diar FCC, OHL, Comsa Ente and Godia 200 2013
Servihabitat (51%) TPG CaixaBank 185 2013
13 public buildings Axa Real Estate Government of Catalonia 172 2013
Parque Principado Intu\CPPIB Sonoae/CBRE 162 2013
Port of Venice Orion Capital British Land 145 2013
Castellana 200 PSP Investments Reyal Urbis/Financial institutions 140 2014
1,860 social housing units Blackstone Madrid City Hall 129 2013
115 Avenida de América London & Regional Banco Sabadell 117 2014
1,000 flats Baupost Group BBVA 100 2013
Centro Comercial Plaza Cataluña 23 IVA Capital Partners El Corte Inglés 100 2013
Cartera Toro HIG Capital SAREB (Spain's "bad bank") 100 2013
Bankia Habitat Cerberus Bankia 90 2013
Edificio Banesco Pontegadea SAREB (Spain's "bad bank") 66 2014
Hotel Intercontinental Qatar Investment Authority GSSG 60 2014
Dorian Portfolio Blackstone SAREB (Spain's "bad bank") 42 2014
total 3,204
Source: Author’s estimations and data from El País, 2014.
* Millions of euros.
** Purchase option.
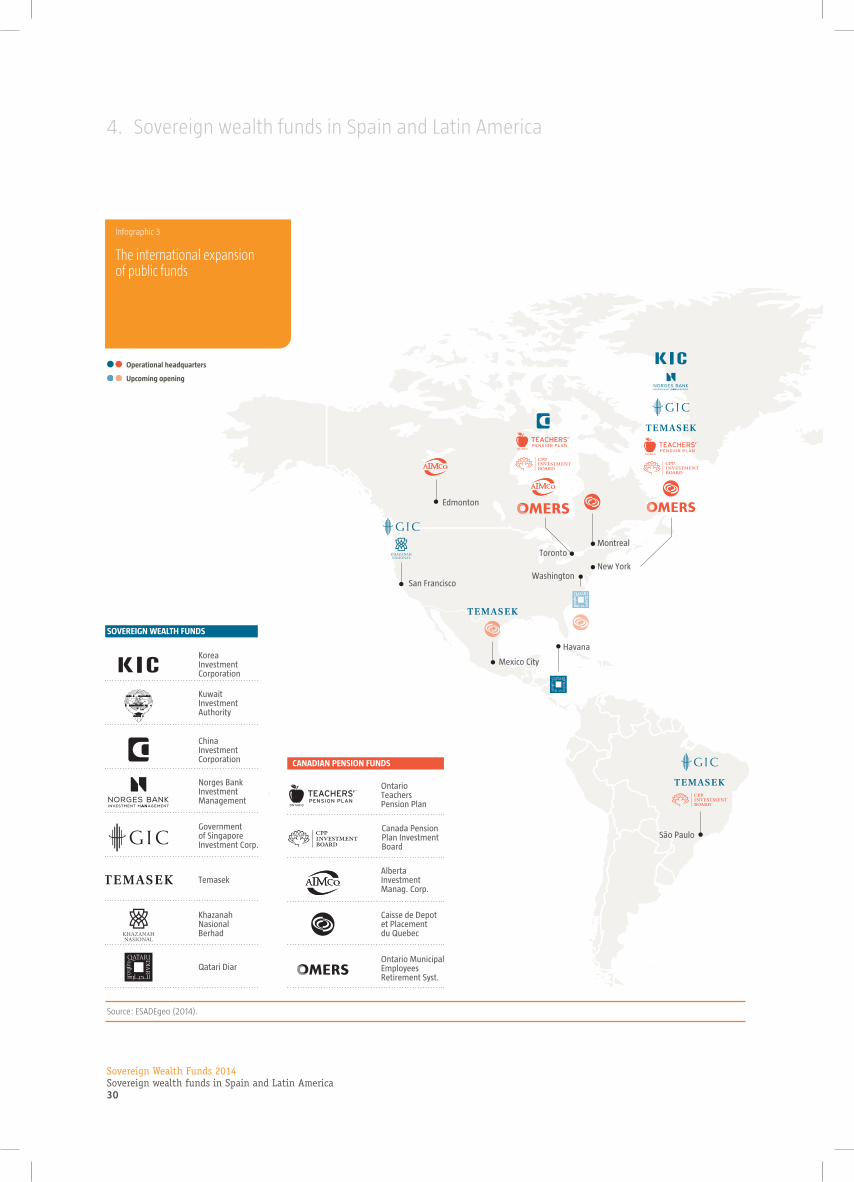
Sovereign Wealth Funds 2014Sovereign wealth funds in Spain and Latin America30
4. Sovereign wealth funds in Spain and Latin America
Source: ESADEgeo (2014).
Operational headquarters
Upcoming opening
TorontoMontreal
Mexico City
San Francisco
Edmonton
São Paulo
New YorkWashington
Havana Hong KongHanoi
Singapore Kuala Lumpur
Saigon
Beijing
Shanghai
Seoul
Tokyo
London
Oslo
Kuwait
Lusail
Istanbul
Dushanbe
Tangier
Nouakchott
Cairo
Khartoum Sana'a
Damascus
Mumbai
Chennai
Korea Investment Corporation
Kuwait Investment Authority
China Investment Corporation
Norges Bank Investment Management
Government of Singapore Investment Corp.
Temasek
Ontario Teachers Pension Plan
Canada Pension Plan Investment Board
Alberta Investment Manag. Corp.
Caisse de Depot et Placement du Quebec
Ontario Municipal Employees Retirement Syst.
Khazanah NasionalBerhad
Qatari Diar
SOVEREIGN WEALTH FUNDS
CANADIAN PENSION FUNDS
The international expansion of public funds
Infographic 3

Sovereign Wealth Funds 2014Sovereign wealth funds in Spain and Latin America
31
Source: ESADEgeo (2014).
Operational headquarters
Upcoming opening
TorontoMontreal
Mexico City
San Francisco
Edmonton
São Paulo
New YorkWashington
Havana Hong KongHanoi
Singapore Kuala Lumpur
Saigon
Beijing
Shanghai
Seoul
Tokyo
London
Oslo
Kuwait
Lusail
Istanbul
Dushanbe
Tangier
Nouakchott
Cairo
Khartoum Sana'a
Damascus
Mumbai
Chennai
Korea Investment Corporation
Kuwait Investment Authority
China Investment Corporation
Norges Bank Investment Management
Government of Singapore Investment Corp.
Temasek
Ontario Teachers Pension Plan
Canada Pension Plan Investment Board
Alberta Investment Manag. Corp.
Caisse de Depot et Placement du Quebec
Ontario Municipal Employees Retirement Syst.
Khazanah NasionalBerhad
Qatari Diar
SOVEREIGN WEALTH FUNDS
CANADIAN PENSION FUNDS
The international expansion of public funds
Infographic 3

Sovereign Wealth Funds 2014Sovereign wealth funds in Spain and Latin America32
4. Sovereign wealth funds in Spain and Latin America
The Qatari fund’s entry into SFL, in which Colonial holds a 53.1%
stake, was carried out at the same time as its entry into the
parent company. Qatar Holding, a subsidiary of QIA, took
advantage of Royal Bank of Scotland’s exit from the
shareholding of SFL to take an 8.5% stake valued at some €152
million. Months later, as in the case of Colonial, Qatar Holding
boosted its stake in SFL, acquiring an additional 13.6% for €239
million. As a result, Qatar Holding became SFL’s second biggest
shareholder, with 22.1%, ahead of French bank Crédit Agricole,
which also raised its stake in the company from 5% to 12.3%. SFL
has a portfolio of prime office buildings located in the centre of
Paris, valued at some €4 billion.
In 2012, Qatari Diar, the real estate arm of QIA, had already
disbursed €64 million for Tarragona’s luxury yacht marina Port
Tarraco. Qatar also invested €78.5 million in acquiring
Barcelona’s Hotel Renaissance, through another fund linked to
the Qatari armed forces. Qatar has a very substantial presence in
Spain, a high-profile example being Qatar Airways’ agreement
with FC Barcelona, whereby it will inject €96 million between
now and 2016.
Millions of dollars
Chart 10
Changes in Latin American and Caribbean foreignexchange reserves (1994-2013)
Source: IAD and CAF, 2014.
0
300,000
600,000
900,000
1995 2000 2005 2010
814,903
Source: IMF, 2014.
Chart 9
Flow of foreign capital by type (1980-2013)
-50,000
0
50,000
100,000
150,000
200,000
Direct Investment, net Portfolio Investment, net Millions of dollars
1980 1985 1990 1995 2000 2005 2010
5.0%
51.0%
51.0%
51.0%
2.5%
4.2%
7.4%
11.9%
20.0%
20.0%
20.1%
60.0%
77.8%
79.2%
80.0%
92.0%
95.8%
100%
100%
100%
100%
100%
100%
100%
100%
100%
Source: Prepared by authors, 2014.
Chart 8
SEPI's industrial holdings
Ensa
Grupo Hunosa
Grupo Sepides
IZAR
Grupo Navantia
MAYASA
Agencia EFE
Grupo Cofivacasa
Grupo Correos
Hipódromo de la Zarzuela
Alimentos y Aceites
SAECA
Cetarsa
Corporación RTVE
Grupo Enusa
Defex
Grupo Mercasa
Tragsa
Indra
Enresa
REE
España Expansión Exterior
Hispasat
Enagás
EADS
IAG
Chart 7
Shareholding of Deoleo following the entry of CVC
Before the entry After the entry
Source: Prepared by authors, 2014.
Free float 37%
Others 7.4%
Ebro Foods 2.9%
Kutxa 4.8%
CaixaBank 5.28%
Unicaja 11.4%
Bankia16.5%
CVC29.9%
BMN 4.8%
Dcoop 9.9% Dcoop 1.32%
Chart 1
Asian sovereign wealth funds swoop on theSpanish real estate sector
Offices70.0%
Residential17.0%
Hotels 8.0%
Commercial 2.0%
Industrial 2.0%
Source: Prepared by authors, 2014.
Source: Prepared by authors, 2014.
Chart 5
Main shareholders of ONO followingbefore the entry of Vodafone
CCMP15.2%
Thomas H. Lee15.0%
Quadrangle9.0%
Providence15.2%
General Electric9.0%
Multitel6.0%
5.4%Val Tel.
Caisse dedépôt etplacementdu Québec6.8%
OntarioTeachersPensionPlan4.8%
Sodinteleco3.9%
Otros1.6%
Northwestern2.3%
Bregal1.4%
BancoSantander4.4%
Source: Prepared by authors, 2014.
Chart 6
Major shareholders of Applus+
Carlyle35.5%
Morgan Stanley6.9%
GIC6.1%
AmeripriseFinancial3.8%
Source: Prepared by authors, 2014.
Chart 4
Shareholding of Heathrow Airport Holdings
Ferrovial25.0%
Caisse dedépôt etplacementdu Québec
13.3%
Qatar Holding20.0%
10.0%
China InvestmentCorporartión
11.2%
Alinda Airports
11.9%
Government of Singapore
8.7%
UniversitiesSuperannuationScheme
Source: Prepared by authors, 2014.
Chart 3
Shareholding of Société Foncière Lyonnaisefollowing the entry of QIA
Colonial53.1%
Qatar Holding22.1%
CréditAgricole(Predica)12.3%
ORION IIIEuropean 36.4%
Reig CapitalGroup4.4%
Free Float1.7%
Source: Prepared by authors, 2014.
Chart 2
Shareholding of Colonial following the entry of QIA
Free-Float31.0%
Grupo Villar Mir29.0%
Coral Partners9.4%
13.1%Grupo Santo Domingo7.5%
MoraBanc7.0%
Fidelity 2.7%
Qatar Investment Authority

Sovereign Wealth Funds 2014Sovereign wealth funds in Spain and Latin America
33
Millions of dollars
Chart 10
Changes in Latin American and Caribbean foreignexchange reserves (1994-2013)
Source: IAD and CAF, 2014.
0
300,000
600,000
900,000
1995 2000 2005 2010
814,903
Source: IMF, 2014.
Chart 9
Flow of foreign capital by type (1980-2013)
-50,000
0
50,000
100,000
150,000
200,000
Direct Investment, net Portfolio Investment, net Millions of dollars
1980 1985 1990 1995 2000 2005 2010
5.0%
51.0%
51.0%
51.0%
2.5%
4.2%
7.4%
11.9%
20.0%
20.0%
20.1%
60.0%
77.8%
79.2%
80.0%
92.0%
95.8%
100%
100%
100%
100%
100%
100%
100%
100%
100%
Source: Prepared by authors, 2014.
Chart 8
SEPI's industrial holdings
Ensa
Grupo Hunosa
Grupo Sepides
IZAR
Grupo Navantia
MAYASA
Agencia EFE
Grupo Cofivacasa
Grupo Correos
Hipódromo de la Zarzuela
Alimentos y Aceites
SAECA
Cetarsa
Corporación RTVE
Grupo Enusa
Defex
Grupo Mercasa
Tragsa
Indra
Enresa
REE
España Expansión Exterior
Hispasat
Enagás
EADS
IAG
Chart 7
Shareholding of Deoleo following the entry of CVC
Before the entry After the entry
Source: Prepared by authors, 2014.
Free float 37%
Others 7.4%
Ebro Foods 2.9%
Kutxa 4.8%
CaixaBank 5.28%
Unicaja 11.4%
Bankia16.5%
CVC29.9%
BMN 4.8%
Dcoop 9.9% Dcoop 1.32%
Chart 1
Asian sovereign wealth funds swoop on theSpanish real estate sector
Offices70.0%
Residential17.0%
Hotels 8.0%
Commercial 2.0%
Industrial 2.0%
Source: Prepared by authors, 2014.
Source: Prepared by authors, 2014.
Chart 5
Main shareholders of ONO followingbefore the entry of Vodafone
CCMP15.2%
Thomas H. Lee15.0%
Quadrangle9.0%
Providence15.2%
General Electric9.0%
Multitel6.0%
5.4%Val Tel.
Caisse dedépôt etplacementdu Québec6.8%
OntarioTeachersPensionPlan4.8%
Sodinteleco3.9%
Otros1.6%
Northwestern2.3%
Bregal1.4%
BancoSantander4.4%
Source: Prepared by authors, 2014.
Chart 6
Major shareholders of Applus+
Carlyle35.5%
Morgan Stanley6.9%
GIC6.1%
AmeripriseFinancial3.8%
Source: Prepared by authors, 2014.
Chart 4
Shareholding of Heathrow Airport Holdings
Ferrovial25.0%
Caisse dedépôt etplacementdu Québec
13.3%
Qatar Holding20.0%
10.0%
China InvestmentCorporartión
11.2%
Alinda Airports
11.9%
Government of Singapore
8.7%
UniversitiesSuperannuationScheme
Source: Prepared by authors, 2014.
Chart 3
Shareholding of Société Foncière Lyonnaisefollowing the entry of QIA
Colonial53.1%
Qatar Holding22.1%
CréditAgricole(Predica)12.3%
ORION IIIEuropean 36.4%
Reig CapitalGroup4.4%
Free Float1.7%
Source: Prepared by authors, 2014.
Chart 2
Shareholding of Colonial following the entry of QIA
Free-Float31.0%
Grupo Villar Mir29.0%
Coral Partners9.4%
13.1%Grupo Santo Domingo7.5%
MoraBanc7.0%
Fidelity 2.7%
Qatar Investment Authority
new players: canada’s pension funds
In the past few years some new players have appeared on the
Spanish investor scene: pension funds, many of them public, from
Canada. (For a fuller analysis of this type of investment, see
Chapter 6 devoted to North American public funds in this report).
Canada’s pension funds are among the World’s biggest: the top
four total nearly $700 billion in assets under management. In total,
Canadian pension funds hold almost a trillion dollars in AUM,
slightly less than Spain’s GDP in 2013. Although the bulk of
investments are made in fixed income and equities, the alternative
investment component has grown steadily in the past few years,
from 13% in 2002 to more than 23% in 2012. Ontario’s fund has
even established a subsidiary (OMERS Ventures) entirely dedicated
to investments in expansion capital and venture capital.
Table 6
Main Canadian Pension Funds
Fund Assets* Region Established
Canada Pension Plan Investment Board (CPPIB) 201.5 Federal 1997
Caisse de Dépôt et Placement du Québec 200.1 Quebec 1965
Ontario Teachers' Pension Plan (OTPP) 140.8 Ontario 1917
British Columbia Investment Management Corporation (bcIMC) 102.8
British Columbia 1999
Public Sector Pension Investment Board (PSP Investments) 76.1 Federal 1999
Alberta Investment Management Corporation (AIMCo) 68.6 Alberta 2008
Ontario Municipal Employees' Retirement System (OMERS) 65.1 Ontario 1962
Healthcare of Ontario Pension Plan (HOOPP) 51.6 Ontario 1960
Ontario Pension Board (PSPP) 18.7 Ontario 1920
OPSEU Pension Trust (OPTrust) 16 Ontario 1995
New Brunswick Investment Management Corporation (NBIMC) 10.1 New Brunswick 1996
Alberta Pensions Services Corporation 4.7 Alberta 1995
Healthcare Employees' Pension Plan (HEPP) 4.5 Manitoba 1997
Nova Scotia Pension Services Corporation 4.5 Nova Scotia 2013
total 965.1
Source: Author’s elaboration, based on funds’ annual reports, 2014.
*$ billions.

Sovereign Wealth Funds 2014Sovereign wealth funds in Spain and Latin America34
4. Sovereign wealth funds in Spain and Latin America
In 2013, several of them opened offices in London to promote their
European investments. This is a general trend of pension funds, also
shared by sovereign wealth funds: opening international offices in
order to be closer to the markets in which they operate and to have
access to more and better deal flows 3.
Europe has become one of the main destinations for Canadian pension
fund investments. At the end of 2013, the national fund CPPIB had 16%
of its total assets invested in Europe, OTPP more than 28% and AIMCo
more than 11.5%. They all now have European offices based in London.
Infographic 3 shows a complete map about where SWFs’ and pension
funds’ are leading their expansion and set up offices around the World.
Spain and Spanish companies’ assets also stimulated these funds’
appetites for investment. For example, Heathrow Airport Holdings,
majority held by Ferrovial, has two pension funds among its
shareholders, one of them Canadian, the Caisse de Dépôt et
Placement du Québec, and the UK’s Universities Superannuation
Scheme. Moreover, as we showed in the last report, Heathrow Airport
Holdings also has three sovereign wealth funds as shareholders.
Table 7
Main investments of Canadian pension funds in Spanish companies (2010-2014)
Fund Company acquired/owner Equity stake/Assets Amount* Year
PSP Investments Hochtief AirPort (ACS) 100% 1,100 2013
CPPIB Cintra Ferrovial 10% of 407 ETR 640 2010
OTPP Leighton Holdings (ACS)70% of NextGen, Metronode and Infoplex 500 2013
PSP Investments Isolux Infrastructure Capital increase 500 2012
CPPIB Dorna 39% 400 2012
CPPIB - Parque Principado 162 2013
PSP Investments CLH 5% 111 2013
OPTrust Globalvía Recapitalisation 100 2013
total 3,513
Source Author’s elaboration, 2014.
* Millions of euros.
3 In Europe, London is the location par excellence, see Ashby Monk et al. «Getting closer to the action: Why pension and sovereign funds are expanding geographically», Stanford University, Global Projects Center, 2014. Available at http://papers.ssrn.com/sol3/papers.cfm?abstract_id=2380277.
Millions of dollars
Chart 10
Changes in Latin American and Caribbean foreignexchange reserves (1994-2013)
Source: IAD and CAF, 2014.
0
300,000
600,000
900,000
1995 2000 2005 2010
814,903
Source: IMF, 2014.
Chart 9
Flow of foreign capital by type (1980-2013)
-50,000
0
50,000
100,000
150,000
200,000
Direct Investment, net Portfolio Investment, net Millions of dollars
1980 1985 1990 1995 2000 2005 2010
5.0%
51.0%
51.0%
51.0%
2.5%
4.2%
7.4%
11.9%
20.0%
20.0%
20.1%
60.0%
77.8%
79.2%
80.0%
92.0%
95.8%
100%
100%
100%
100%
100%
100%
100%
100%
100%
Source: Prepared by authors, 2014.
Chart 8
SEPI's industrial holdings
Ensa
Grupo Hunosa
Grupo Sepides
IZAR
Grupo Navantia
MAYASA
Agencia EFE
Grupo Cofivacasa
Grupo Correos
Hipódromo de la Zarzuela
Alimentos y Aceites
SAECA
Cetarsa
Corporación RTVE
Grupo Enusa
Defex
Grupo Mercasa
Tragsa
Indra
Enresa
REE
España Expansión Exterior
Hispasat
Enagás
EADS
IAG
Chart 7
Shareholding of Deoleo following the entry of CVC
Before the entry After the entry
Source: Prepared by authors, 2014.
Free float 37%
Others 7.4%
Ebro Foods 2.9%
Kutxa 4.8%
CaixaBank 5.28%
Unicaja 11.4%
Bankia16.5%
CVC29.9%
BMN 4.8%
Dcoop 9.9% Dcoop 1.32%
Chart 1
Asian sovereign wealth funds swoop on theSpanish real estate sector
Offices70.0%
Residential17.0%
Hotels 8.0%
Commercial 2.0%
Industrial 2.0%
Source: Prepared by authors, 2014.
Source: Prepared by authors, 2014.
Chart 5
Main shareholders of ONO followingbefore the entry of Vodafone
CCMP15.2%
Thomas H. Lee15.0%
Quadrangle9.0%
Providence15.2%
General Electric9.0%
Multitel6.0%
5.4%Val Tel.
Caisse dedépôt etplacementdu Québec6.8%
OntarioTeachersPensionPlan4.8%
Sodinteleco3.9%
Otros1.6%
Northwestern2.3%
Bregal1.4%
BancoSantander4.4%
Source: Prepared by authors, 2014.
Chart 6
Major shareholders of Applus+
Carlyle35.5%
Morgan Stanley6.9%
GIC6.1%
AmeripriseFinancial3.8%
Source: Prepared by authors, 2014.
Chart 4
Shareholding of Heathrow Airport Holdings
Ferrovial25.0%
Caisse dedépôt etplacementdu Québec
13.3%
Qatar Holding20.0%
10.0%
China InvestmentCorporartión
11.2%
Alinda Airports
11.9%
Government of Singapore
8.7%
UniversitiesSuperannuationScheme
Source: Prepared by authors, 2014.
Chart 3
Shareholding of Société Foncière Lyonnaisefollowing the entry of QIA
Colonial53.1%
Qatar Holding22.1%
CréditAgricole(Predica)12.3%
ORION IIIEuropean 36.4%
Reig CapitalGroup4.4%
Free Float1.7%
Source: Prepared by authors, 2014.
Chart 2
Shareholding of Colonial following the entry of QIA
Free-Float31.0%
Grupo Villar Mir29.0%
Coral Partners9.4%
13.1%Grupo Santo Domingo7.5%
MoraBanc7.0%
Fidelity 2.7%
Qatar Investment Authority
Between 2010 and 2014 Canadian pension funds’ investments
increased substantially. In 2013 PSP Investments bought the airports
unit of Hochtief, a subsidiary of ACS, for more than €1.1 billion.
CPPIB invested more than €600 million in Cintra Ferrovial, acquiring
a 10% stake in the Toronto ring road. As the following table shows,
although transactions were few and far between in 2010 and 2012,
they increased substantially in 2013.
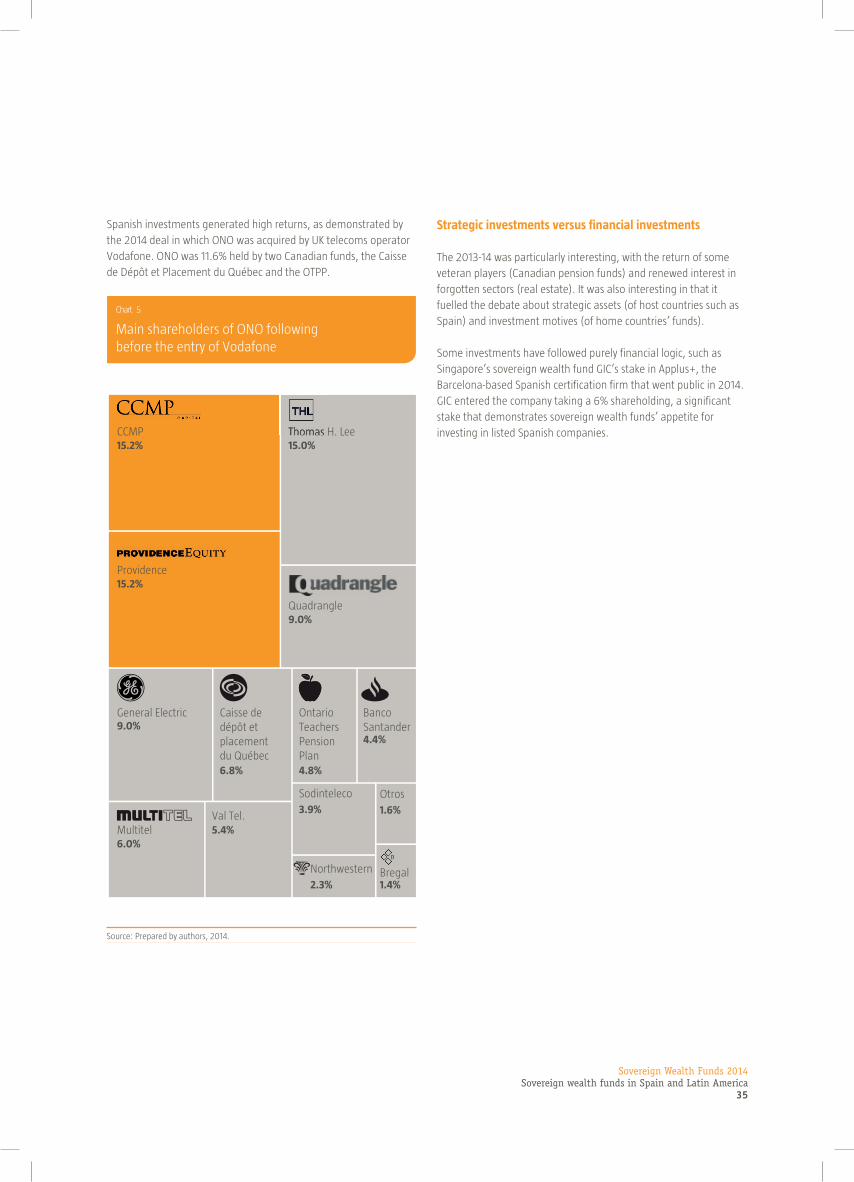
Sovereign Wealth Funds 2014Sovereign wealth funds in Spain and Latin America
35
Spanish investments generated high returns, as demonstrated by
the 2014 deal in which ONO was acquired by UK telecoms operator
Vodafone. ONO was 11.6% held by two Canadian funds, the Caisse
de Dépôt et Placement du Québec and the OTPP.
Millions of dollars
Chart 10
Changes in Latin American and Caribbean foreignexchange reserves (1994-2013)
Source: IAD and CAF, 2014.
0
300,000
600,000
900,000
1995 2000 2005 2010
814,903
Source: IMF, 2014.
Chart 9
Flow of foreign capital by type (1980-2013)
-50,000
0
50,000
100,000
150,000
200,000
Direct Investment, net Portfolio Investment, net Millions of dollars
1980 1985 1990 1995 2000 2005 2010
5.0%
51.0%
51.0%
51.0%
2.5%
4.2%
7.4%
11.9%
20.0%
20.0%
20.1%
60.0%
77.8%
79.2%
80.0%
92.0%
95.8%
100%
100%
100%
100%
100%
100%
100%
100%
100%
Source: Prepared by authors, 2014.
Chart 8
SEPI's industrial holdings
Ensa
Grupo Hunosa
Grupo Sepides
IZAR
Grupo Navantia
MAYASA
Agencia EFE
Grupo Cofivacasa
Grupo Correos
Hipódromo de la Zarzuela
Alimentos y Aceites
SAECA
Cetarsa
Corporación RTVE
Grupo Enusa
Defex
Grupo Mercasa
Tragsa
Indra
Enresa
REE
España Expansión Exterior
Hispasat
Enagás
EADS
IAG
Chart 7
Shareholding of Deoleo following the entry of CVC
Before the entry After the entry
Source: Prepared by authors, 2014.
Free float 37%
Others 7.4%
Ebro Foods 2.9%
Kutxa 4.8%
CaixaBank 5.28%
Unicaja 11.4%
Bankia16.5%
CVC29.9%
BMN 4.8%
Dcoop 9.9% Dcoop 1.32%
Chart 1
Asian sovereign wealth funds swoop on theSpanish real estate sector
Offices70.0%
Residential17.0%
Hotels 8.0%
Commercial 2.0%
Industrial 2.0%
Source: Prepared by authors, 2014.
Source: Prepared by authors, 2014.
Chart 5
Main shareholders of ONO followingbefore the entry of Vodafone
CCMP15.2%
Thomas H. Lee15.0%
Quadrangle9.0%
Providence15.2%
General Electric9.0%
Multitel6.0%
5.4%Val Tel.
Caisse dedépôt etplacementdu Québec6.8%
OntarioTeachersPensionPlan4.8%
Sodinteleco3.9%
Otros1.6%
Northwestern2.3%
Bregal1.4%
BancoSantander4.4%
Thomas H. Lee
Source: Prepared by authors, 2014.
Chart 6
Major shareholders of Applus+
Carlyle35.5%
Morgan Stanley6.9%
GIC6.1%
AmeripriseFinancial3.8%
Source: Prepared by authors, 2014.
Chart 4
Shareholding of Heathrow Airport Holdings
Ferrovial25.0%
Caisse dedépôt etplacementdu Québec
13.3%
Qatar Holding20.0%
10.0%
China InvestmentCorporartión
11.2%
Alinda Airports
11.9%
Government of Singapore
8.7%
UniversitiesSuperannuationScheme
Source: Prepared by authors, 2014.
Chart 3
Shareholding of Société Foncière Lyonnaisefollowing the entry of QIA
Colonial53.1%
Qatar Holding22.1%
CréditAgricole(Predica)12.3%
ORION IIIEuropean 36.4%
Reig CapitalGroup4.4%
Free Float1.7%
Source: Prepared by authors, 2014.
Chart 2
Shareholding of Colonial following the entry of QIA
Free-Float31.0%
Grupo Villar Mir29.0%
Coral Partners9.4%
13.1%Grupo Santo Domingo7.5%
MoraBanc7.0%
Fidelity 2.7%
Qatar Investment Authority
Strategic investments versus financial investments
The 2013-14 was particularly interesting, with the return of some
veteran players (Canadian pension funds) and renewed interest in
forgotten sectors (real estate). It was also interesting in that it
fuelled the debate about strategic assets (of host countries such as
Spain) and investment motives (of home countries’ funds).
Some investments have followed purely financial logic, such as
Singapore’s sovereign wealth fund GIC’s stake in Applus+, the
Barcelona-based Spanish certification firm that went public in 2014.
GIC entered the company taking a 6% shareholding, a significant
stake that demonstrates sovereign wealth funds’ appetite for
investing in listed Spanish companies.

Sovereign Wealth Funds 2014Sovereign wealth funds in Spain and Latin America36
4. Sovereign wealth funds in Spain and Latin America
The deal involving Deoleo generated far more controversy. It was
held by a large number of savings banks and banks related to
savings banks. (The main shareholder was the rescued Bankia, with
16.5% of the capital). Deoleo became a very important focus of
attention in 2014. Its former owners disposed of stakes equivalent
to more than 31%, favouring the entry of UK private equity fund CVC.
The Spanish government reiterated on several occasions its wish to
keep the company in Spain, amid fears that it would pass to Italian
control. Deoleo, world leader in the olive oil market, attracted the
interest of several private equity funds, but above all the Italian
sovereign wealth fund Fondo Strategico Italiano (FSI), which
expressed interest in bidding together with Qatar Holding.
Italy is the world’s leading exporter of olive oil (and Spain’s direct
competitor). For its part, Deoleo is the owner of renowned Italian
olive oil brands such as Bertolli, Carapelli and Sasso. The episode
rang alarm bells about the possible loss of a «strategic asset» to a
direct competitor. And yet no such concern was seen regarding the
acquisition of Campofrío by Mexican and Chinese investors, another
transaction in the food sector. In the end the company was sold to
UK private equity fund CVC, which took control of it in April 2014.
Millions of dollars
Chart 10
Changes in Latin American and Caribbean foreignexchange reserves (1994-2013)
Source: IAD and CAF, 2014.
0
300,000
600,000
900,000
1995 2000 2005 2010
814,903
Source: IMF, 2014.
Chart 9
Flow of foreign capital by type (1980-2013)
-50,000
0
50,000
100,000
150,000
200,000
Direct Investment, net Portfolio Investment, net Millions of dollars
1980 1985 1990 1995 2000 2005 2010
5.0%
51.0%
51.0%
51.0%
2.5%
4.2%
7.4%
11.9%
20.0%
20.0%
20.1%
60.0%
77.8%
79.2%
80.0%
92.0%
95.8%
100%
100%
100%
100%
100%
100%
100%
100%
100%
Source: Prepared by authors, 2014.
Chart 8
SEPI's industrial holdings
Ensa
Grupo Hunosa
Grupo Sepides
IZAR
Grupo Navantia
MAYASA
Agencia EFE
Grupo Cofivacasa
Grupo Correos
Hipódromo de la Zarzuela
Alimentos y Aceites
SAECA
Cetarsa
Corporación RTVE
Grupo Enusa
Defex
Grupo Mercasa
Tragsa
Indra
Enresa
REE
España Expansión Exterior
Hispasat
Enagás
EADS
IAG
Chart 7
Shareholding of Deoleo following the entry of CVC
Before the entry After the entry
Source: Prepared by authors, 2014.
Free float 37%
Others 7.4%
Ebro Foods 2.9%
Kutxa 4.8%
CaixaBank 5.28%
Unicaja 11.4%
Bankia16.5%
CVC29.9%
BMN 4.8%
Dcoop 9.9% Dcoop 1.32%
Chart 1
Asian sovereign wealth funds swoop on theSpanish real estate sector
Offices70.0%
Residential17.0%
Hotels 8.0%
Commercial 2.0%
Industrial 2.0%
Source: Prepared by authors, 2014.
Source: Prepared by authors, 2014.
Chart 5
Main shareholders of ONO followingbefore the entry of Vodafone
CCMP15.2%
Thomas H. Lee15.0%
Quadrangle9.0%
Providence15.2%
General Electric9.0%
Multitel6.0%
5.4%Val Tel.
Caisse dedépôt etplacementdu Québec6.8%
OntarioTeachersPensionPlan4.8%
Sodinteleco3.9%
Otros1.6%
Northwestern2.3%
Bregal1.4%
BancoSantander4.4%
Source: Prepared by authors, 2014.
Chart 6
Major shareholders of Applus+
Carlyle35.5%
Morgan Stanley6.9%
GIC6.1%
AmeripriseFinancial3.8%
Source: Prepared by authors, 2014.
Chart 4
Shareholding of Heathrow Airport Holdings
Ferrovial25.0%
Caisse dedépôt etplacementdu Québec
13.3%
Qatar Holding20.0%
10.0%
China InvestmentCorporartión
11.2%
Alinda Airports
11.9%
Government of Singapore
8.7%
UniversitiesSuperannuationScheme
Source: Prepared by authors, 2014.
Chart 3
Shareholding of Société Foncière Lyonnaisefollowing the entry of QIA
Colonial53.1%
Qatar Holding22.1%
CréditAgricole(Predica)12.3%
ORION IIIEuropean 36.4%
Reig CapitalGroup4.4%
Free Float1.7%
Source: Prepared by authors, 2014.
Chart 2
Shareholding of Colonial following the entry of QIA
Free-Float31.0%
Grupo Villar Mir29.0%
Coral Partners9.4%
13.1%Grupo Santo Domingo7.5%
MoraBanc7.0%
Fidelity 2.7%
Qatar Investment Authority

Sovereign Wealth Funds 2014Sovereign wealth funds in Spain and Latin America
37
Millions of dollars
Chart 10
Changes in Latin American and Caribbean foreignexchange reserves (1994-2013)
Source: IAD and CAF, 2014.
0
300,000
600,000
900,000
1995 2000 2005 2010
814,903
Source: IMF, 2014.
Chart 9
Flow of foreign capital by type (1980-2013)
-50,000
0
50,000
100,000
150,000
200,000
Direct Investment, net Portfolio Investment, net Millions of dollars
1980 1985 1990 1995 2000 2005 2010
5.0%
51.0%
51.0%
51.0%
2.5%
4.2%
7.4%
11.9%
20.0%
20.0%
20.1%
60.0%
77.8%
79.2%
80.0%
92.0%
95.8%
100%
100%
100%
100%
100%
100%
100%
100%
100%
Source: Prepared by authors, 2014.
Chart 8
SEPI's industrial holdings
Ensa
Grupo Hunosa
Grupo Sepides
IZAR
Grupo Navantia
MAYASA
Agencia EFE
Grupo Cofivacasa
Grupo Correos
Hipódromo de la Zarzuela
Alimentos y Aceites
SAECA
Cetarsa
Corporación RTVE
Grupo Enusa
Defex
Grupo Mercasa
Tragsa
Indra
Enresa
REE
España Expansión Exterior
Hispasat
Enagás
EADS
IAG
Chart 7
Shareholding of Deoleo following the entry of CVC
Before the entry After the entry
Source: Prepared by authors, 2014.
Free float 37%
Others 7.4%
Ebro Foods 2.9%
Kutxa 4.8%
CaixaBank 5.28%
Unicaja 11.4%
Bankia16.5%
CVC29.9%
BMN 4.8%
Dcoop 9.9% Dcoop 1.32%
Chart 1
Asian sovereign wealth funds swoop on theSpanish real estate sector
Offices70.0%
Residential17.0%
Hotels 8.0%
Commercial 2.0%
Industrial 2.0%
Source: Prepared by authors, 2014.
Source: Prepared by authors, 2014.
Chart 5
Main shareholders of ONO followingbefore the entry of Vodafone
CCMP15.2%
Thomas H. Lee15.0%
Quadrangle9.0%
Providence15.2%
General Electric9.0%
Multitel6.0%
5.4%Val Tel.
Caisse dedépôt etplacementdu Québec6.8%
OntarioTeachersPensionPlan4.8%
Sodinteleco3.9%
Otros1.6%
Northwestern2.3%
Bregal1.4%
BancoSantander4.4%
Source: Prepared by authors, 2014.
Chart 6
Major shareholders of Applus+
Carlyle35.5%
Morgan Stanley6.9%
GIC6.1%
AmeripriseFinancial3.8%
Source: Prepared by authors, 2014.
Chart 4
Shareholding of Heathrow Airport Holdings
Ferrovial25.0%
Caisse dedépôt etplacementdu Québec
13.3%
Qatar Holding20.0%
10.0%
China InvestmentCorporartión
11.2%
Alinda Airports
11.9%
Government of Singapore
8.7%
UniversitiesSuperannuationScheme
Source: Prepared by authors, 2014.
Chart 3
Shareholding of Société Foncière Lyonnaisefollowing the entry of QIA
Colonial53.1%
Qatar Holding22.1%
CréditAgricole(Predica)12.3%
ORION IIIEuropean 36.4%
Reig CapitalGroup4.4%
Free Float1.7%
Source: Prepared by authors, 2014.
Chart 2
Shareholding of Colonial following the entry of QIA
Free-Float31.0%
Grupo Villar Mir29.0%
Coral Partners9.4%
13.1%Grupo Santo Domingo7.5%
MoraBanc7.0%
Fidelity 2.7%
Qatar Investment Authority
The Deoleo episode underlines the growing role of the sovereign
wealth funds as strategic funds too. Attention focused on a primary
sector (vegetable oils) representing barely 0.8% of Spain’s total
exports, albeit highly symbolic, perhaps more from a political than
an economic point of view.
Spain is the world’s leading producer of olive oil, but more than a
third of its exports go to Italy, in the form of low added value bulk
oil. In Italy, they increase the value of the raw material, they build
brands and supply oils at higher margins when they are re-exported
to other markets. Just as Spain has managed to move up the value
chain in the wine sector (another transformed raw material), so
work remains to be done in the olive oil sector.
It is possible that this valorisation will now come from the new
British owners. Indeed, olive oil is considered a luxury product in the
UK. Moving up the value chain should be the aim of all Spanish
industries, something that iconic companies in the sector such as
Osborne are doing for example in the field of Iberian AOC
(designation of origin)-labelled ham. Interestingly, Osborne was
established by English settlers in Cadiz and Jerez in the nineteenth
century, and now it is allied, as a symbol of the new times, with
Fosun, China’s leading private industrial conglomerate.
Despite the worldwide success of brands such as Zara, Massimo Dutti,
Pull&Bear (Inditex), Mango and Desigual, there are also cases such as
the bags made in the workshops of Ubrique, with top-quality material
and craftsmanship but subsequently sold by French or Italian brands. In
all these sectors, the main Spanish brands were transferred to foreign
banners, be it Loewe in the luxury goods sector (now French) or
Campofrío in food (now Chinese and Mexican). We clearly have a long
way to go before «Made in Spain» is a globally recognised quality
standard. And not just among our European neighbours, but also in the
most remote emerging countries such as Mexico, Brazil and China.
a strategic fund for Spain?
Spain lacks the usual resources that nourish sovereign wealth funds
(generally raw materials such as oil, natural gas or copper) and so
proposing a sovereign wealth fund for Spain may be considered
somewhat paradoxical. However, Spain has public financing
instruments that could be reinvented.
The ICO played an important role in providing financial
«oxygenation» for many businesses throughout the 2007-2014
crisis. But above all it did something that deserves special attention:
it created and promoted a fund of funds for private equity and
venture capital. With €1.2 billion of capital, this fund of funds has
played a fundamental role in fuelling and reactivating the dormant
alternative investment market and in particular investment in
innovation, i.e. venture capital 4.
In 2013 and 2014 several competitive bidding processes were
carried out to capitalise the venture capital funds. This enabled
fourteen teams to consolidate or be created and to become a
driving force in Spain’s entrepreneurial ecosystem. Although in 2010
the volume of venture capital in Spain represented barely €2 of
investment per inhabitant (compared with $70 in the US, or $140 in
Israel), by 2014 this figure had more than doubled. Admittedly there
is still a long way to go, but here as in other countries few would
expect to adopt an interventionist stance, such as Chile, Israel or
Singapore, the state’s involvement has been decisive. Such is the
case of Israel, where the funds of funds strategy also allows private
4 On FOND-ICO see: http://www.ico.es/web/ico/fond-ico-global.

Sovereign Wealth Funds 2014Sovereign wealth funds in Spain and Latin America38
4. Sovereign wealth funds in Spain and Latin America
rather than public initiative to be promoted and driven so that it can
lead investments in search of returns, income and value creation.
Funds of funds such as Amerigo were also promoted during the crisis,
via CDTI and ENISA. Driven in Spain by Telefónica, it had the decisive
support of the CDTI -with equal contributions of €50 million 5- and
enabled two venture capital funds to be formed in the country, one of
them completely new. These initiatives, led by the CDTI, ENISA and the
ICO, allowed Spain to start consolidating itself as a focus of attention
in the start-up ecosystems. Much remains to be done, but who would
have thought, when the crisis burst, that Spanish start-ups would raise
tens of millions of euros in capital, as Scytl did in 2014, from American
and English international investors?
Looking to the future, the funds of funds of the ICO, CDTI and ENISA
constitute a triptych to consolidate, perhaps with some adjustments,
but the heading seems appropriate if the objective is to achieve a
more innovative ‘Spain 3.0’.
At the time, Sociedad Española de Participaciones Industriales (SEPI)
also played an important and sometimes controversial role. This is
another public entity with financial capacity that could take a fresh
look at its strategy. SEPI still holds a portfolio of highly disparate
companies. Some of them are remarkable, such as the now small
minority stakes in airlines (IAG), the space and aviation sector
(Hispasat and EADS), communications (RTVE, EFE and Correos) and
more recently the technology sector, headed by Indra, in which SEPI
has a 20% stake. All these sectors are high added value, and some
face significant challenges by way of transformation and innovation.
In any case, all point towards a 3.0 country.
5 In 2013, Global Corporate Venturing recognised Amerigo for this public-private, open innovation approach focused on Europe and Latin America.
Millions of dollars
Chart 10
Changes in Latin American and Caribbean foreignexchange reserves (1994-2013)
Source: IAD and CAF, 2014.
0
300,000
600,000
900,000
1995 2000 2005 2010
814,903
Source: IMF, 2014.
Chart 9
Flow of foreign capital by type (1980-2013)
-50,000
0
50,000
100,000
150,000
200,000
Direct Investment, net Portfolio Investment, net Millions of dollars
1980 1985 1990 1995 2000 2005 2010
5.0%
51.0%
51.0%
51.0%
2.5%
4.2%
7.4%
11.9%
20.0%
20.0%
20.1%
60.0%
77.8%
79.2%
80.0%
92.0%
95.8%
100%
100%
100%
100%
100%
100%
100%
100%
100%
Source: Prepared by authors, 2014.
Chart 8
SEPI's industrial holdings
Ensa
Grupo Hunosa
Grupo Sepides
IZAR
Grupo Navantia
MAYASA
Agencia EFE
Grupo Cofivacasa
Grupo Correos
Hipódromo de la Zarzuela
Alimentos y Aceites
SAECA
Cetarsa
Corporación RTVE
Grupo Enusa
Defex
Grupo Mercasa
Tragsa
Indra
Enresa
REE
España Expansión Exterior
Hispasat
Enagás
EADS
IAG
Chart 7
Shareholding of Deoleo following the entry of CVC
Before the entry After the entry
Source: Prepared by authors, 2014.
Free float 37%
Others 7.4%
Ebro Foods 2.9%
Kutxa 4.8%
CaixaBank 5.28%
Unicaja 11.4%
Bankia16.5%
CVC29.9%
BMN 4.8%
Dcoop 9.9% Dcoop 1.32%
Chart 1
Asian sovereign wealth funds swoop on theSpanish real estate sector
Offices70.0%
Residential17.0%
Hotels 8.0%
Commercial 2.0%
Industrial 2.0%
Source: Prepared by authors, 2014.
Source: Prepared by authors, 2014.
Chart 5
Main shareholders of ONO followingbefore the entry of Vodafone
CCMP15.2%
Thomas H. Lee15.0%
Quadrangle9.0%
Providence15.2%
General Electric9.0%
Multitel6.0%
5.4%Val Tel.
Caisse dedépôt etplacementdu Québec6.8%
OntarioTeachersPensionPlan4.8%
Sodinteleco3.9%
Otros1.6%
Northwestern2.3%
Bregal1.4%
BancoSantander4.4%
Source: Prepared by authors, 2014.
Chart 6
Major shareholders of Applus+
Carlyle35.5%
Morgan Stanley6.9%
GIC6.1%
AmeripriseFinancial3.8%
Source: Prepared by authors, 2014.
Chart 4
Shareholding of Heathrow Airport Holdings
Ferrovial25.0%
Caisse dedépôt etplacementdu Québec
13.3%
Qatar Holding20.0%
10.0%
China InvestmentCorporartión
11.2%
Alinda Airports
11.9%
Government of Singapore
8.7%
UniversitiesSuperannuationScheme
Source: Prepared by authors, 2014.
Chart 3
Shareholding of Société Foncière Lyonnaisefollowing the entry of QIA
Colonial53.1%
Qatar Holding22.1%
CréditAgricole(Predica)12.3%
ORION IIIEuropean 36.4%
Reig CapitalGroup4.4%
Free Float1.7%
Source: Prepared by authors, 2014.
Chart 2
Shareholding of Colonial following the entry of QIA
Free-Float31.0%
Grupo Villar Mir29.0%
Coral Partners9.4%
13.1%Grupo Santo Domingo7.5%
MoraBanc7.0%
Fidelity 2.7%
Qatar Investment Authority

Sovereign Wealth Funds 2014Sovereign wealth funds in Spain and Latin America
39
Bilateral sovereign wealth funds?
As we have commented, both Italy and France have reached
investment agreements with sovereign wealth funds to invest in
their countries’ companies. Admittedly these agreements do not yet
have any real effect on their economies, being more precisely
expressions of intention to co-invest rather than actual investments.
Nevertheless, they open the door to possible collaborations in Spain
which would be extremely attractive: with the creation of bilateral
funds.
One could imagine the ICO setting up a fund together with a
co-investor from the Middle East, the CDTI doing likewise with a
partner from South-east Asia and ENISA with one from North Asia
(South Korea might be a good partner). They would establish funds
of funds which would also seek to mobilise smart capital. In other
words, not only would they contribute capital but also expansion
capital to regions where we need to open up new markets,
specifically Asia.
Thus, one could think in terms of a bilateral Spain-Qatar (or Spain-
UAE) fund of funds, for medium-size companies with annual sales of
between €100 million and €5 billion. The fund would contribute
capital, but also the ability to provide international support in the
Middle East through a major local investor. A bilateral Spain-
Singapore (or Spain-Korea) fund of funds, also for companies of the
same type, would provide expansion capital for South (or North) Asia.
Italy uses its sovereign wealth fund, Fondo Strategico Italiano, with
$6 billion under management, to establish relations with other
sovereign wealth funds (so far with Qatar, Kuwait and Russia, apart
from its historical country linkage with Libya and its Libyan
Investment Autority) and to strengthen the financing of Italian
companies 6. In the case of Qatar, the agreement, signed in March
2013 as a joint venture agreement, established a new company (IQ
Made in Italy) jointly managed by Qatar Holding and the FSI, to
invest in sectors linked to «Made in Italy»: brands, furniture and
design, food and tourism. Each partner contributed €1 billion.
In the case of Russia, as part of the 2013 bilateral Italy-Russia
meeting, the FSI signed an agreement to commit €1 billion (€500
million each) for investment in enterprises and projects favouring
greater economic cooperation between Italy and Russia.
Relations with Kuwait provide an additional push in this direction.
Signed in July 2014, the co-investment agreement involved the
incorporation of a new investment company (FSI Investimenti) with
assets valued at nearly €2.19 billion 7. Among the assets that FSI
6 See the list of agreements and JVs at http://www.fondostrategico.it/en/joint-venture/joint-venture.html7 See https://www.zawya.com/story/Italys_FSI_and_Kuwaits_KIA_create_investment_firm_with_USD298bn_in_assets-TR20140701nL6N0PC60KX2/
transferred to this new company were notably its equity holdings in
Metroweb Italia (optic fibre), Kedrion Group (bio-pharmaceuticals),
Valvitalia (equipment) and, above all, IQ Made in Italy. Thus, the
new joint venture created with Qatar is included under the umbrella
of FSI Investimenti, in which Kuwait holds a stake. As well as the
assets contributed by the FSI (totalling €1,185 million), each partner
committed to contribute a further €500 million. The company’s
capital is 77% held by FSI, with KIA holding the remaining 23%. FSI
Investimenti has exactly the same investment mission as its parent
FSI, although it excludes companies in the alcoholic drinks and
gambling segments, given KIA’s presence.
We should point out that, in spite of the figures, in the majority of
cases these are still commitments to invest that have not yet
materialised in deals. Nonetheless, the objective is clear, as is the
need, so the transactions will shortly increase. Italy has a limited
fabric of medium-size companies. It has barely 1,400 companies
selling more than €200 million a year, compared with more than
3,000 in France and over 5,000 in Germany. Like Spain, it needs
more companies of this size, and it needs them to then grow bigger.
It comes as no surprise to find that Italy accounts for barely 5% of
European private equity whereas its economy represents 18% of the
EU total 8. Thus, these agreements with Qatar, Kuwait and Russia
could cover these shortfalls in non-bank financing suffered by Italian
companies seeking to grow.
France too has set up a bilateral fund. In 2013, together with Qatar,
it set up a fund similar to the Italian one, a €300 million vehicle
designed to invest in medium-sized French companies. France was a
pioneer among OECD countries in this respect when in 2009 it put
together a co-investment fund between the Fonds Stratégique
d’Investissement as the French sovereign wealth was then called
(now Banque Publique d’Investissement), and Mubadala, one of
Abu Dhabi’s sovereign wealth funds. The fund, with $150 million in
assets, focuses on added-value investments, technology,
biotechnology and renewable energy sources. Mubadala has
already built up some experience in this field with the creation of
similar funds to invest in Russia: two private equity funds in 2010
($100 million) and 2013 ($900 million); and a co-investment fund
with the Russian government for $2 billion.
Ireland is a particularly interesting case for Spain, in that it has gone
even further, establishing a bilateral fund to play on rapid-growth
technology start-ups. Created in 2014, the fund has two (private)
managers and two promoters, the Irish and Chinese governments.
With a total of $100 million, the China Ireland Technology Capital
Fund seeks to invest in Irish start-ups (which are also seeking to
expand into Asia and could use China as an entry-point) and in
8 On the venture capital ecosystem in Italy, see Valerio Vacca’s study «Financing innovation in Italy: an analysis of venture capital and private equity in Italy», Banca d’Italia, Occasional Papers, October 2013. Available at: http://www.bancaditalia.it/studiricerche/convegni/atti/innovation-in-Italy/Vacca.pdf
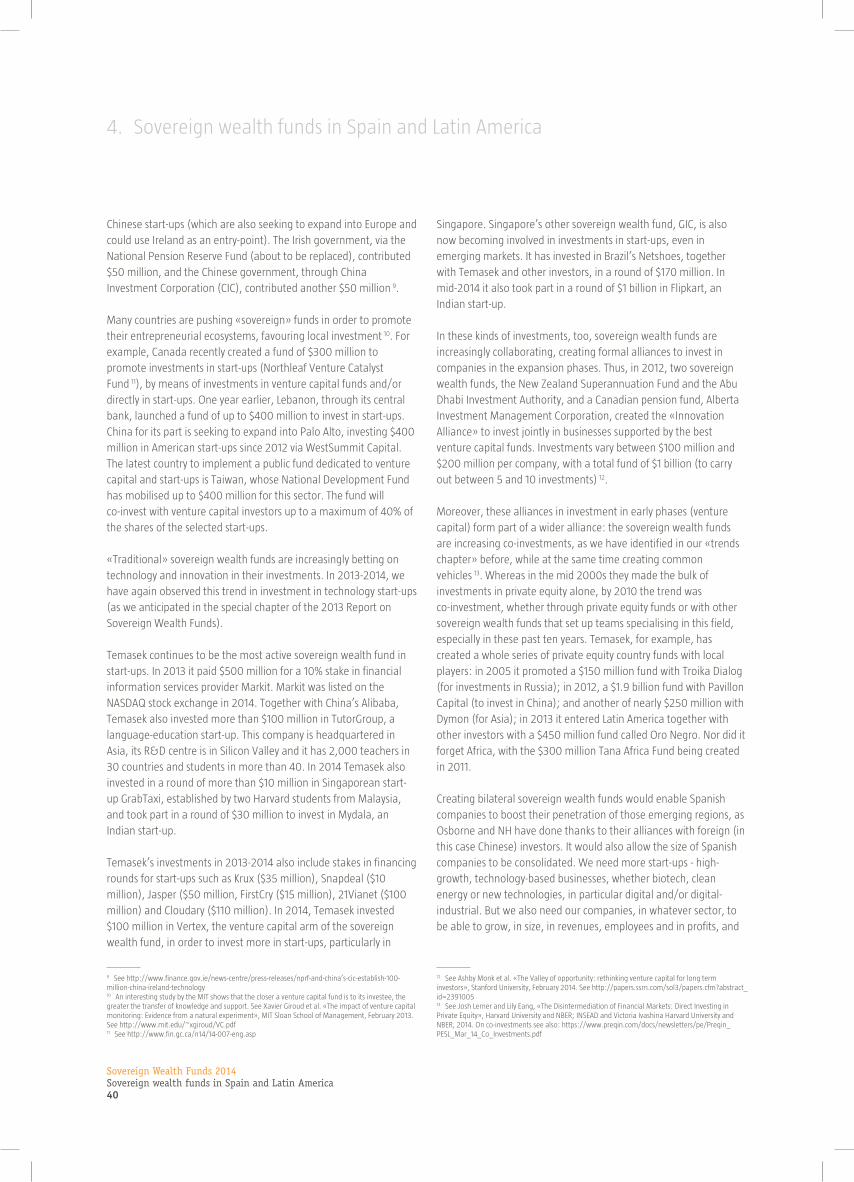
Sovereign Wealth Funds 2014Sovereign wealth funds in Spain and Latin America40
4. Sovereign wealth funds in Spain and Latin America
Chinese start-ups (which are also seeking to expand into Europe and
could use Ireland as an entry-point). The Irish government, via the
National Pension Reserve Fund (about to be replaced), contributed
$50 million, and the Chinese government, through China
Investment Corporation (CIC), contributed another $50 million 9.
Many countries are pushing «sovereign» funds in order to promote
their entrepreneurial ecosystems, favouring local investment 10. For
example, Canada recently created a fund of $300 million to
promote investments in start-ups (Northleaf Venture Catalyst
Fund 11), by means of investments in venture capital funds and/or
directly in start-ups. One year earlier, Lebanon, through its central
bank, launched a fund of up to $400 million to invest in start-ups.
China for its part is seeking to expand into Palo Alto, investing $400
million in American start-ups since 2012 via WestSummit Capital.
The latest country to implement a public fund dedicated to venture
capital and start-ups is Taiwan, whose National Development Fund
has mobilised up to $400 million for this sector. The fund will
co-invest with venture capital investors up to a maximum of 40% of
the shares of the selected start-ups.
«Traditional» sovereign wealth funds are increasingly betting on
technology and innovation in their investments. In 2013-2014, we
have again observed this trend in investment in technology start-ups
(as we anticipated in the special chapter of the 2013 Report on
Sovereign Wealth Funds).
Temasek continues to be the most active sovereign wealth fund in
start-ups. In 2013 it paid $500 million for a 10% stake in financial
information services provider Markit. Markit was listed on the
NASDAQ stock exchange in 2014. Together with China’s Alibaba,
Temasek also invested more than $100 million in TutorGroup, a
language-education start-up. This company is headquartered in
Asia, its R&D centre is in Silicon Valley and it has 2,000 teachers in
30 countries and students in more than 40. In 2014 Temasek also
invested in a round of more than $10 million in Singaporean start-
up GrabTaxi, established by two Harvard students from Malaysia,
and took part in a round of $30 million to invest in Mydala, an
Indian start-up.
Temasek’s investments in 2013-2014 also include stakes in financing
rounds for start-ups such as Krux ($35 million), Snapdeal ($10
million), Jasper ($50 million, FirstCry ($15 million), 21Vianet ($100
million) and Cloudary ($110 million). In 2014, Temasek invested
$100 million in Vertex, the venture capital arm of the sovereign
wealth fund, in order to invest more in start-ups, particularly in
9 See http://www.finance.gov.ie/news-centre/press-releases/nprf-and-china’s-cic-establish-100-million-china-ireland-technology10 An interesting study by the MIT shows that the closer a venture capital fund is to its investee, the greater the transfer of knowledge and support. See Xavier Giroud et al. «The impact of venture capital monitoring: Evidence from a natural experiment», MIT Sloan School of Management, February 2013. See http://www.mit.edu/~xgiroud/VC.pdf11 See http://www.fin.gc.ca/n14/14-007-eng.asp
Singapore. Singapore’s other sovereign wealth fund, GIC, is also
now becoming involved in investments in start-ups, even in
emerging markets. It has invested in Brazil’s Netshoes, together
with Temasek and other investors, in a round of $170 million. In
mid-2014 it also took part in a round of $1 billion in Flipkart, an
Indian start-up.
In these kinds of investments, too, sovereign wealth funds are
increasingly collaborating, creating formal alliances to invest in
companies in the expansion phases. Thus, in 2012, two sovereign
wealth funds, the New Zealand Superannuation Fund and the Abu
Dhabi Investment Authority, and a Canadian pension fund, Alberta
Investment Management Corporation, created the «Innovation
Alliance» to invest jointly in businesses supported by the best
venture capital funds. Investments vary between $100 million and
$200 million per company, with a total fund of $1 billion (to carry
out between 5 and 10 investments) 12.
Moreover, these alliances in investment in early phases (venture
capital) form part of a wider alliance: the sovereign wealth funds
are increasing co-investments, as we have identified in our «trends
chapter» before, while at the same time creating common
vehicles 13. Whereas in the mid 2000s they made the bulk of
investments in private equity alone, by 2010 the trend was
co-investment, whether through private equity funds or with other
sovereign wealth funds that set up teams specialising in this field,
especially in these past ten years. Temasek, for example, has
created a whole series of private equity country funds with local
players: in 2005 it promoted a $150 million fund with Troika Dialog
(for investments in Russia); in 2012, a $1.9 billion fund with Pavillon
Capital (to invest in China); and another of nearly $250 million with
Dymon (for Asia); in 2013 it entered Latin America together with
other investors with a $450 million fund called Oro Negro. Nor did it
forget Africa, with the $300 million Tana Africa Fund being created
in 2011.
Creating bilateral sovereign wealth funds would enable Spanish
companies to boost their penetration of those emerging regions, as
Osborne and NH have done thanks to their alliances with foreign (in
this case Chinese) investors. It would also allow the size of Spanish
companies to be consolidated. We need more start-ups - high-
growth, technology-based businesses, whether biotech, clean
energy or new technologies, in particular digital and/or digital-
industrial. But we also need our companies, in whatever sector, to
be able to grow, in size, in revenues, employees and in profits, and
12 See Ashby Monk et al. «The Valley of opportunity: rethinking venture capital for long term investors», Stanford University, February 2014. See http://papers.ssrn.com/sol3/papers.cfm?abstract_id=239100513 See Josh Lerner and Lily Eang, «The Disintermediation of Financial Markets: Direct Investing in Private Equity», Harvard University and NBER; INSEAD and Victoria Ivashina Harvard University and NBER, 2014. On co-investments see also: https://www.preqin.com/docs/newsletters/pe/Preqin_PESL_Mar_14_Co_Investments.pdf

Sovereign Wealth Funds 2014Sovereign wealth funds in Spain and Latin America
41
to that end we need them to internationalise and innovate. The
sooner the better; and the more far-reaching the better, too.
Strategic partners for international expansion
Sovereign wealth funds’ stakes sometimes work in favour of Spanish
companies. An interesting example is that of Abertis, which in 2014
embarked on a major offensive in Australia. The Spanish company
tendered for Queensland Motorways, a concession valued at some
€4 billion. On this occasion Abertis was accompanied in its bidding
by some heavyweight partners, Australia’s Hastings Funds
Management, the Dutch pension fund APG and the Kuwaiti
sovereign wealth fund KIA. For its part, Abertis’ rival (led by a local
consortium which eventually won the concession) also tendered
together with other investors, one of which was another sovereign
wealth fund, ADIA.
In 2014, FCC also made its mark in Qatar, with a €500 million
contract for the construction of the Doha metro. It had previously
also won the contract to build the Riyadh metro. Other companies
such as Acciona, Abengoa and Indra also managed to consolidate
stable relationships with sovereign wealth funds and investors in the
region, although these did not always materialise in the form of
equity stakes or financing schemes like that of Abertis in Australia.
In any case it is interesting to see how global transactions are
increasingly configured with industrial operators allied directly with
sovereign wealth funds, proof that SWFs are carrying out more and
more direct investment transactions (not just through funds of funds
or third-party funds). In the case of Spain it also provides access to
long-term financing, with banks increasingly being replaced by this
type of investor.
Millions of dollars
Chart 10
Changes in Latin American and Caribbean foreignexchange reserves (1994-2013)
Source: IAD and CAF, 2014.
0
300,000
600,000
900,000
1995 2000 2005 2010
814,903
Source: IMF, 2014.
Chart 9
Flow of foreign capital by type (1980-2013)
-50,000
0
50,000
100,000
150,000
200,000
Direct Investment, net Portfolio Investment, net Millions of dollars
1980 1985 1990 1995 2000 2005 2010
5.0%
51.0%
51.0%
51.0%
2.5%
4.2%
7.4%
11.9%
20.0%
20.0%
20.1%
60.0%
77.8%
79.2%
80.0%
92.0%
95.8%
100%
100%
100%
100%
100%
100%
100%
100%
100%
Source: Prepared by authors, 2014.
Chart 8
SEPI's industrial holdings
Ensa
Grupo Hunosa
Grupo Sepides
IZAR
Grupo Navantia
MAYASA
Agencia EFE
Grupo Cofivacasa
Grupo Correos
Hipódromo de la Zarzuela
Alimentos y Aceites
SAECA
Cetarsa
Corporación RTVE
Grupo Enusa
Defex
Grupo Mercasa
Tragsa
Indra
Enresa
REE
España Expansión Exterior
Hispasat
Enagás
EADS
IAG
Chart 7
Shareholding of Deoleo following the entry of CVC
Before the entry After the entry
Source: Prepared by authors, 2014.
Free float 37%
Others 7.4%
Ebro Foods 2.9%
Kutxa 4.8%
CaixaBank 5.28%
Unicaja 11.4%
Bankia16.5%
CVC29.9%
BMN 4.8%
Dcoop 9.9% Dcoop 1.32%
Chart 1
Asian sovereign wealth funds swoop on theSpanish real estate sector
Offices70.0%
Residential17.0%
Hotels 8.0%
Commercial 2.0%
Industrial 2.0%
Source: Prepared by authors, 2014.
Source: Prepared by authors, 2014.
Chart 5
Main shareholders of ONO followingbefore the entry of Vodafone
CCMP15.2%
Thomas H. Lee15.0%
Quadrangle9.0%
Providence15.2%
General Electric9.0%
Multitel6.0%
5.4%Val Tel.
Caisse dedépôt etplacementdu Québec6.8%
OntarioTeachersPensionPlan4.8%
Sodinteleco3.9%
Otros1.6%
Northwestern2.3%
Bregal1.4%
BancoSantander4.4%
Source: Prepared by authors, 2014.
Chart 6
Major shareholders of Applus+
Carlyle35.5%
Morgan Stanley6.9%
GIC6.1%
AmeripriseFinancial3.8%
Source: Prepared by authors, 2014.
Chart 4
Shareholding of Heathrow Airport Holdings
Ferrovial25.0%
Caisse dedépôt etplacementdu Québec
13.3%
Qatar Holding20.0%
10.0%
China InvestmentCorporartión
11.2%
Alinda Airports
11.9%
Government of Singapore
8.7%
UniversitiesSuperannuationScheme
Source: Prepared by authors, 2014.
Chart 3
Shareholding of Société Foncière Lyonnaisefollowing the entry of QIA
Colonial53.1%
Qatar Holding22.1%
CréditAgricole(Predica)12.3%
ORION IIIEuropean 36.4%
Reig CapitalGroup4.4%
Free Float1.7%
Source: Prepared by authors, 2014.
Chart 2
Shareholding of Colonial following the entry of QIA
Free-Float31.0%
Grupo Villar Mir29.0%
Coral Partners9.4%
13.1%Grupo Santo Domingo7.5%
MoraBanc7.0%
Fidelity 2.7%
Qatar Investment Authority

Sovereign Wealth Funds 2014Sovereign wealth funds in Spain and Latin America42
4. Sovereign wealth funds in Spain and Latin America
partner Spanish companies (perhaps turning, as in the past, to the
new head of state and royal family). This action should be
coordinated, i.e. under Spanish government auspices, so as to avoid
any contradictory or confusing signals and thus maximise the
impact and benefit for the country as a whole.
Sovereign wealth funds’ investments in latin america.
Latin America has become an attractive region for foreign
investment, both portfolio and direct. This is mainly due to the past
few years of economic growth, accompanied by the expansion of
the middle class, greater regional macroeconomic stability,
increased opportunities offered by the traditional natural resource
sectors and new developments in the areas of infrastructure,
manufacturing and technology. In fact, flows of foreign direct
investment went from $33.82 billion in 2006 to $154.68 billion in
2013, while flows of portfolio investment increased from $8.18
billion to $53.05 billion during the same period (see Chart 9). There
is clearly enormous investor interest in such dynamic regions as
Latin America, and the sovereign wealth funds are no exception.
Other interesting phenomena seen in Latin America are the
significant financial savings and the increases in foreign exchange
reserves in most countries, thanks to the substantial price increases
of the main raw materials exported by the region. Part of the
surplus savings has been channelled into creating new savings
mechanisms. Thus, Latin America’s foreign exchange reserves grew
from $146.63 billion in 2002 to $814.90 billion in 2013 (see Chart
10). As well as reflecting the strength of the region’s balance of
trade, several countries have decided to establish mechanisms to
channel savings from the positive external shock due to the increase
in commodity prices. One of these mechanisms consists in
establishing their own sovereign wealth funds.
While it is true that the region has had significant achievements,
such as greater macroeconomic stability and progress on the reform
agenda, there still remain significant challenges for development,
especially at the microeconomic level. Two of the most pressing
problems to be overcome are low productivity and the gap in
infrastructure. It is estimated that Latin America invests about 3% of
its GDP in infrastructure, and that this is only half of what is needed
to close the gap and maintain the pace of economic growth.
Available public funds and multilateral financing are not enough to
attain this objective, so the private sector’s participation is essential.
Sovereign wealth funds can play a fundamental role in providing the
necessary financing to take on many of the infrastructure projects
that the region requires in order to clear bottlenecks and promote
regional integration. Furthermore, as we explained in the 2013
report, sovereign wealth funds can serve as «anchor investors» for
other institutional investors and co-invest in very large projects.
In many African and Latin American, not to mention Asian,
countries, we are likely to see more transactions of this kind. Having
financial and strategic teams that handle not just the financial but
also the industrial dimension and the operational business
proposition will be increasingly decisive for the major IBEX
companies. Some are achieving notable transactions, as we have
seen (Iberdrola, Repsol and Abertis), but they are still the exception.
Many markets still remain to be explored: in Africa, to mention just
one continent, numerous and powerful sovereign wealth funds and
quasi-SWFs are springing up.
In Angola, for example, oil represents more than 97% of exports and
80% of the country’s revenues. Angola now has its own sovereign
wealth fund. The same applies to Nigeria, currently the continent’s
biggest economy, with a GDP still behind Norway’s but already ahead
of Belgium’s. In South Africa, the Public Investment Corporation
already has more than $150 billion under management. Today it is
Africa’s biggest asset manager, a hundred-year-old institution with a
structure, strategy and functioning of which more closely resemble
those of the major Canadian or US public pension funds than those of
the sovereign wealth funds. It recently started to expand outside the
country, carrying out investments in Nigeria ($290 million invested in
Nigerian cement works Dangote, the biggest transaction of 2013 on
the Nigerian stock exchange). In 2010 it took the decision to invest
10% of its assets outside South Africa. Half of the $15 billion went into
global investment funds such as BlackRock, the other half went to
other African countries.
Botswana, for its part, has set up a similar fund, the Botswana
Public Officers Pension Fund (it also has a sovereign wealth fund
handled by the Central Bank, Pula Fund) which already has more
than $4 billion under management, with 60% invested outside the
country. Further north, the Revenue Regulation Fund of Algeria has
more than $77 billion in assets, more than Libya’s SWF ($65 billion),
the Pula Fund of Botswana, the Fundo Soberano of Angola ($5
million), or that of Nigeria ($1 billion). And of all of them have great
growth potential in terms of assets under management which will
place them among the biggest in the world in a couple of decades.
In all these cases (Angola, Nigeria, South Africa, Botswana and Algeria),
the infrastructure needs should also inspire future alliances similar to
those of Abertis in Australia. This could also go hand in hand with
Spanish companies taking root in Africa, where they currently have very
little presence. The same could be done in Asia, together with sovereign
wealth funds from Malaysia, Singapore or South Korea, this being
another region where Spain’s business presence is rather lacking. To
these countries we could also add Indonesia, another major emerging
country that is considering setting up a sovereign wealth fund.
Business diplomacy could find a priority here: focusing on countries,
particularly emerging ones, with sovereign wealth funds that could

Sovereign Wealth Funds 2014Sovereign wealth funds in Spain and Latin America
43
Millions of dollars
Chart 10
Changes in Latin American and Caribbean foreignexchange reserves (1994-2013)
Source: IAD and CAF, 2014.
0
300,000
600,000
900,000
1995 2000 2005 2010
814,903
Source: IMF, 2014.
Chart 9
Flow of foreign capital by type (1980-2013)
-50,000
0
50,000
100,000
150,000
200,000
Direct Investment, net Portfolio Investment, net Millions of dollars
1980 1985 1990 1995 2000 2005 2010
5.0%
51.0%
51.0%
51.0%
2.5%
4.2%
7.4%
11.9%
20.0%
20.0%
20.1%
60.0%
77.8%
79.2%
80.0%
92.0%
95.8%
100%
100%
100%
100%
100%
100%
100%
100%
100%
Source: Prepared by authors, 2014.
Chart 8
SEPI's industrial holdings
Ensa
Grupo Hunosa
Grupo Sepides
IZAR
Grupo Navantia
MAYASA
Agencia EFE
Grupo Cofivacasa
Grupo Correos
Hipódromo de la Zarzuela
Alimentos y Aceites
SAECA
Cetarsa
Corporación RTVE
Grupo Enusa
Defex
Grupo Mercasa
Tragsa
Indra
Enresa
REE
España Expansión Exterior
Hispasat
Enagás
EADS
IAG
Chart 7
Shareholding of Deoleo following the entry of CVC
Before the entry After the entry
Source: Prepared by authors, 2014.
Free float 37%
Others 7.4%
Ebro Foods 2.9%
Kutxa 4.8%
CaixaBank 5.28%
Unicaja 11.4%
Bankia16.5%
CVC29.9%
BMN 4.8%
Dcoop 9.9% Dcoop 1.32%
Chart 1
Asian sovereign wealth funds swoop on theSpanish real estate sector
Offices70.0%
Residential17.0%
Hotels 8.0%
Commercial 2.0%
Industrial 2.0%
Source: Prepared by authors, 2014.
Source: Prepared by authors, 2014.
Chart 5
Main shareholders of ONO followingbefore the entry of Vodafone
CCMP15.2%
Thomas H. Lee15.0%
Quadrangle9.0%
Providence15.2%
General Electric9.0%
Multitel6.0%
5.4%Val Tel.
Caisse dedépôt etplacementdu Québec6.8%
OntarioTeachersPensionPlan4.8%
Sodinteleco3.9%
Otros1.6%
Northwestern2.3%
Bregal1.4%
BancoSantander4.4%
Source: Prepared by authors, 2014.
Chart 6
Major shareholders of Applus+
Carlyle35.5%
Morgan Stanley6.9%
GIC6.1%
AmeripriseFinancial3.8%
Source: Prepared by authors, 2014.
Chart 4
Shareholding of Heathrow Airport Holdings
Ferrovial25.0%
Caisse dedépôt etplacementdu Québec
13.3%
Qatar Holding20.0%
10.0%
China InvestmentCorporartión
11.2%
Alinda Airports
11.9%
Government of Singapore
8.7%
UniversitiesSuperannuationScheme
Source: Prepared by authors, 2014.
Chart 3
Shareholding of Société Foncière Lyonnaisefollowing the entry of QIA
Colonial53.1%
Qatar Holding22.1%
CréditAgricole(Predica)12.3%
ORION IIIEuropean 36.4%
Reig CapitalGroup4.4%
Free Float1.7%
Source: Prepared by authors, 2014.
Chart 2
Shareholding of Colonial following the entry of QIA
Free-Float31.0%
Grupo Villar Mir29.0%
Coral Partners9.4%
13.1%Grupo Santo Domingo7.5%
MoraBanc7.0%
Fidelity 2.7%
Qatar Investment Authority
recent sovereign wealth fund activity in latin america.
In this section we briefly describe the main activities of some of the
sovereign wealth funds that are active in the region. In 2013, the
Norway’s GPFG showed confidence in the region’s good
performance, investing in 71 new Latin American companies. In this
way it consolidated its stock of investments in more than 338
companies and maintained in portfolio more than 150 different
types of bonds issued by 42 companies operating in Latin America.
We should point out that the market value of its assets in the region
grew by 26%, reaching $21.2 billion. This fund has been very active
in Colombia, where it invested $800 million, and in Mexico, where
its position in sovereign debt amounts to $5.39 billion.
For its part, Singapore’s GIC, which recently made changes to its
investment strategy, focusing on long-term growth factors to
manage its investment portfolio; it has 4% of its portfolio invested
in Latin America, an amount equivalent to $12.4 billion. This fund
has positioned itself mainly in Brazil, where it holds significant
investments in companies operating in a wide variety of sectors
(see Table 8).
Table 8
GIC´s holdings in Brazilian companies
Company Stake Country Type
Linx SA 5.02% Brazil Technology/Communications
BRF SA 4.40% Brazil Food processing
CETIP SA 4.00% Brazil Clearing house
Aliansce Shopping Centers SA 5.90% Brazil Development and management of shopping centres
Direcional Engenharia SA 5.00% Brazil Development and construction of properties and buildings
Source: Bloomberg and ESADEgeo 2013.
* Millions of dollars.
This fund recently invested $135 million in Brazil’s Aegea
Saneamiento e Participações SA, which is involved in water and
sanitation, and it is also the leader in the $170 million investment in
Netshoes, a manufacturer that sells sports articles online. Other
participants in this investment were Temasek Holdings, another
Singapore sovereign wealth fund, Tiger Global Management, Iconiq
Capital and Kszed Ventures.
Temasek, through its new investments and by revaluing
existing ones, increased its consolidated position in the region,
reaching $3.43 billion in 2013, compared with $1.58 billion at
the end of 2012. These investments were made in a variety of
sectors, such as energy, technology, industry and transport,
etc. (see table 9).
Table 9
Recent investments by Temasek Holdings
Company Investment Country
Integradora de Servicios Petroleros Oro Negro 126 Mexico
Hidrovias do Brasil 20 Brazil
Amyris Biotechnologies 20 Brazil
Source: Bloomberg y ESADEgeo 2013.
* Millions of dollars.
We would also highlight the investment made in 2012 in Banco
Bajío, Mexico’s eighth biggest bank at the time. Another transaction
worth mentioning was Temasek Holdings’ participation in the $86
million capital increase of Virgin Mobile Latinoamérica, which

Sovereign Wealth Funds 2014Sovereign wealth funds in Spain and Latin America44
4. Sovereign wealth funds in Spain and Latin America
operates in Chile and Colombia and which, through this investment,
plans to expand to Brazil and Mexico.
The Alaska Permanent Fund is another major fund that has
increased its positions in the region. In 2013 it already dedicated 4%
of its investments to Latin America, equivalent to $1.9 billion.
Another active fund, in this case a pension fund, is the Canada
Pension Plan Investment Board (CPPIB), which opened an office in
São Paulo to seek attractive investment opportunities in the region.
This fund has a stock of investments in Latin America of nearly $4.6
billion, mainly concentrated in real estate and infrastructure. CPPIB
has been very active, participating in the capital of both public and
private companies. For example it recently invested in the Peruvian
company Transportadora de Gas del Perú S.A.
latin american and caribbean sovereign wealth funds
Latin America has not only consolidated itself as an attractive region
for capturing investments by the world’s biggest sovereign wealth
funds, as reflected both in the increase in positions in the region and
the growing number of transactions carried out, but we should also
highlight the significant number of Latin American countries that
have allocated resources to their own sovereign wealth funds or to
creating new funds 14.
The strategy used varies from country to country, with different
objectives in each case, but in general their mission is
stabilisation, given their dependency on raw materials and the
volatility of commodity prices. They also pursue an objective of
inter-generational wealth transfer, or at least endeavour to
ensure that there are national savings with which to face
negative external shocks. Sovereign wealth funds can also
function as a mechanism for handling the effects of new capital
inflows on domestic currency markets, complementing other
measures used previously such as accumulating reserves or
imposing taxes to control capital inflows.
14 See Javier Capapé and Javier Santiso (2014), Latin American Linkages, in Global Public Investor, 2014 (London: OMFIF).
As part of its strategy to preserve its macroeconomic stability,
Colombia recently approved a series of tax measures, including the
creation of a sovereign wealth fund. This fund will receive resources
from royalties obtained from the oil and mining sector. The
objective of this fund is to avoid the negative effects of excessive
capital inflows that might cause the currency to appreciate, making
the country’s industry less competitive through the phenomenon of
«Dutch disease». It is estimated that this fund will save in the order
of $2 billion in resources a year.
Panama created its Fondo de Ahorro de Panamá, with the objective
of serving as a long-term savings mechanism for the Panamanian
State and to be used in situations of economic recession or natural
disasters. This sovereign wealth fund has resources that come from
the total assets transferred from the Fondo Fiduciario para el
Desarrollo (or Fiduciary Fund for Development, for approximately
$1.3 billion), as well as the contributions of the Panama Canal
Authority to the National Treasury, which are more than 3.5% of this
year’s GDP, plus the inheritances, legacies and donations
corresponding by law.
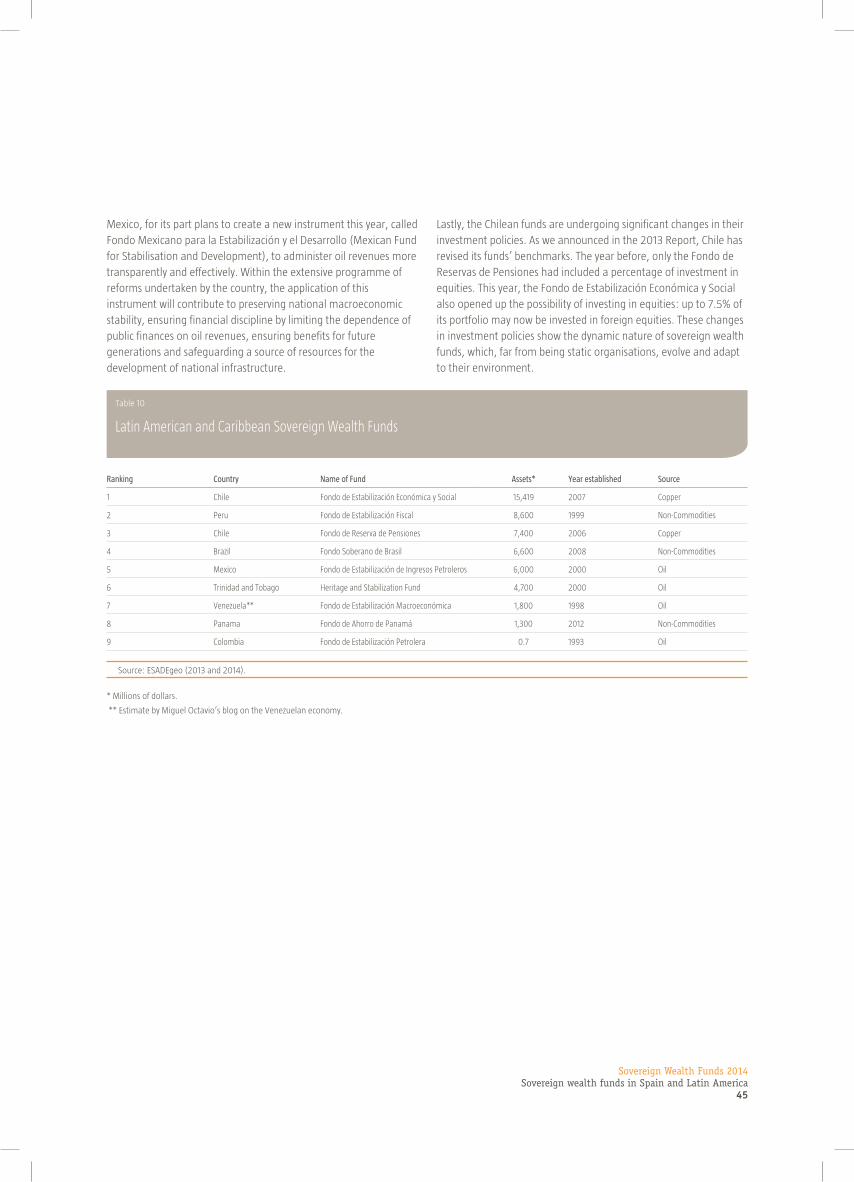
Sovereign Wealth Funds 2014Sovereign wealth funds in Spain and Latin America
45
Mexico, for its part plans to create a new instrument this year, called
Fondo Mexicano para la Estabilización y el Desarrollo (Mexican Fund
for Stabilisation and Development), to administer oil revenues more
transparently and effectively. Within the extensive programme of
reforms undertaken by the country, the application of this
instrument will contribute to preserving national macroeconomic
stability, ensuring financial discipline by limiting the dependence of
public finances on oil revenues, ensuring benefits for future
generations and safeguarding a source of resources for the
development of national infrastructure.
Lastly, the Chilean funds are undergoing significant changes in their
investment policies. As we announced in the 2013 Report, Chile has
revised its funds’ benchmarks. The year before, only the Fondo de
Reservas de Pensiones had included a percentage of investment in
equities. This year, the Fondo de Estabilización Económica y Social
also opened up the possibility of investing in equities: up to 7.5% of
its portfolio may now be invested in foreign equities. These changes
in investment policies show the dynamic nature of sovereign wealth
funds, which, far from being static organisations, evolve and adapt
to their environment.
Table 10
Latin American and Caribbean Sovereign Wealth Funds
Ranking Country Name of Fund Assets* Year established Source
1 Chile Fondo de Estabilización Económica y Social 15,419 2007 Copper
2 Peru Fondo de Estabilización Fiscal 8,600 1999 Non-Commodities
3 Chile Fondo de Reserva de Pensiones 7,400 2006 Copper
4 Brazil Fondo Soberano de Brasil 6,600 2008 Non-Commodities
5 Mexico Fondo de Estabilización de Ingresos Petroleros 6,000 2000 Oil
6 Trinidad and Tobago Heritage and Stabilization Fund 4,700 2000 Oil
7 Venezuela** Fondo de Estabilización Macroeconómica 1,800 1998 Oil
8 Panama Fondo de Ahorro de Panamá 1,300 2012 Non-Commodities
9 Colombia Fondo de Estabilización Petrolera 0.7 1993 Oil
Source: ESADEgeo (2013 and 2014).
* Millions of dollars.
** Estimate by Miguel Octavio’s blog on the Venezuelan economy.

Sovereign Wealth Funds 2014Sovereign wealth funds in Spain and Latin America46
4. Sovereign wealth funds in Spain and Latin America
the virtues of sovereign wealth funds
In conclusion, we may highlight a few more attractions and even
virtues that sovereign wealth funds are, in some cases, bringing to
Spain and could bring to Latin America, too. It is not merely a
question of capital. although this is their main contribution, but also
capital that allows and helps companies to gain a foothold in
emerging regions, where they will need to expand if they want to
continue (or start) growing and aspire to greater size. Spain has
barely a hundred companies with annual sales of more than €1
billion.
The presence of the Norway fund in the capital of more than 70
listed Spanish companies is helping to improve the corporate
governance of orthodox capitalism, case by case or potentially. As
more and more institutional investors appear (such as Norway,
Canada, or others from the English-speaking world like Australia or
New Zealand) previously automatic validations of director
appointments, compensation or corporate practices, which used to
be carried out in private, among friends, are increasingly becoming
an uncertain and open exercise, subjected to the scrutiny of ever
more sophisticated investors.
Make no mistake: with close to $900 billion under management,
Norway’s sovereign wealth fund is not just the World’s biggest, but
also one of the most sophisticated and most determined to improve
corporate governance practices. The increasing presence of this type
of fund in the Spanish economy can only be good news: it confirms
the attractiveness of the country’s companies and of Spain in
general; but it also brings with it hidden benefits, over and above
the influx of capital: increased pressure on listed companies to
improve their corporate practices.
If we want a Spain 3.0, also more modern in its corporate practices,
perhaps we should applaud and do more to encourage the arrival of
these institutional investors. Beyond that, maybe we need to think
seriously about rolling out co-investment strategies with them, in
particular to promote investments as an alternative to the bank
financing on which Spain and its companies have depended so
much in the past few decades.

Sovereign Wealth Funds 2014Sovereign wealth funds in Spain and Latin America
47
Table 11
Norway’s GPFG: an active shareholder for the companies listed in the Ibex-35
Company Holding (%) Agenda Items of the Annual General Meetings on which it voted against
Abengoa 3.16 Re-election of directors and capital increase excluding the preferential right to subscribe.
Abertis 0.72 Re-election of directors and Report on remuneration.
Acciona 1.29 Share allocation plan and Remuneration Report.
Acerinox 1.85 Re-election of directors and Report on remuneration.
ACS 1.12 Remuneration Report.
Atresmedia 0.72 Remuneration Report.
Bankia 0.30Board of Director's conduct of business from 1 January to 25 May 2012. Capital increase and issue of other instruments excluding shareholders' preferential right to subscribe.
Bankinter 1.52 Re-election of directors.
BME 1.89 Re-election of directors.
B. Popular 1.15 Re-election of directors and issue of instruments excluding shareholders' preferential right to subscribe.
CaixaBank 0.53 Ratification of the appointment of directors by co-optation. Capital increase and issue of other instruments excluding shareholders' preferential right to subscribe.
Ebro Foods 1.67 Ratification of the appointment of a director by co-optation.
Endesa 0.24 Re-election of directors and Report on remuneration.
FCC 0.81 Remuneration Report.
Ferrovial 2.17 Re-election of a director and share-based remuneration for senior management.
Gas Natural 0.87 Re-election of directors and Report on remuneration.
Grifols 1.08 Remuneration Report.
Indra 2.98 Re-election of directors.
Mapfre 0.99 Re-election of directors. Remuneration Report. Capital increase without preferential right to subscribe.
OHL 1.94 Inclusion of executive directors in the share incentive scheme.
Prisa 0.89 Capital increase and issue of other instruments excluding shareholders' preferential right to subscribe.
Repsol 1.24 Re-election of directors and Report on remuneration.
Sacyr 0.94 Re-election of directors. Remuneration Report. Remuneration received by the executive board in 2012.
Santander 1.70 Re-election of directors.
T. Reunidas 1.61 Appointment of auditor and report on remuneration.
Telefónica 1.78 Re-election of directors and issue of instruments excluding shareholders' preferential right to subscribe.
Source: In-house, with data from NBIM and Expansión, 2014.
Equity investments
wealth fund for Europe
Javier Capapé
PhD Candidate, ESADE Business School and Researcher, ESADEgeo-Center for Global Economy and Geopolitics
Tomás Guerrero
PhD Candidate, Universidad Carlos III and Researcher, ESADEgeo-Center for Global Economy and Geopolitics
orway´s GPFG:A European sovereign of N
Sovereign Wealth Funds 2014 Equity investments of the Norway’s GPFG: A European sovereign wealth fund for Europe
49
Sovereign Wealth Funds 2014 Equity investments of the Norway’s GPFG: A European sovereign wealth fund for Europe50
5. Equity investments of the Norway’s GPFG: A European sovereign wealth fund for Europe
The Norway Government Pension Fund Global (GPFG) is the World’s
biggest sovereign wealth fund. Managed by an investment unit of
the central bank (NBIM) it counts with $900 billion under
management. To give you some sense of the size of the Fund, it
owns 1.3% of all World’s listed companies. In this chapter we show
the origins of the fund. We also explain something very important:
why the GPFG, despite having the word “pension” in its name, is not
a pension fund. We analyse the investment model peculiar to the
Norwegian fund (already being referred to as the ‘Norway model’)
and we compare it with the better-known Yale model. Our analysis
of the equity fund’s portfolio from 1998 to 2014 is one of a kind: the
first time the fund’s investments have been analysed from its
inception at microeconomic (company) level and also at sector,
country and continent level. The analysis reveals a fundamental
bias: The GPFG is a European fund for Europe. The fund has taken a
deliberate decision to give preference to investments in European
companies and to penalise stakes in North American, especially US,
companies. The chapter also addresses matters such as the
governance of the fund, its investments in the BRICS, how its
Spanish investments have evolved and its presence in tax havens.
history of the world’s biggest sovereign wealth fund
In 1990, the Norwegian government established a fiscal policy
instrument to improve the long-term management of the revenues
from its abundant oil resources: the Petroleum Fund.
Its establishment was the result of years of deliberations in the
Storting (Norwegian parliament). These deliberations had started in
1974 when the Minister of Finance presented the parliamentary report
“The role of petroleum activity in Norwegian society”, which posited
different uses for the country’s oil wealth, and ended in 1983 with the
Tempo Committee’s approval of Report NOU 1983:27, which
proposed the creation of a fund in which the government would be
able to store the profits arising from the exploitation of the oil
resources and spend only the real profitability deriving from them.
Following its establishment, the fund received its first transfer of
capital from the Ministry of Finance in 1996. Until 1997, its
investment strategy was the same as that of the Norwegian central
bank with its foreign currency reserves. The fund, which at that time
managed $20 billion, was invested entirely in fixed income.
In 1997, following a gruelling parliamentary debate, the Ministry of
Finance redefined the fund’s investment strategy and decided to
invest 40% of its assets in equities. Consequently, on 1 January 1998
Norges Bank Investment Management (NBIM) was established to
manage the fund under the supervision of the Ministry of Finance. In
that first year it made 7,851 investments, most of them in the US
(2,265), Japan (1,363) and the UK (454).
In the period from 2000 to 2008, higher oil prices led to more and
bigger transfers of capital from the Ministry of Finance, causing the
fund to grow more than expected (from $44 billion to $322 billion).
During this period the fund also changed its name to Government
Pension Fund Global (GPFG), and the Ministry of Finance decided to
increase the weight of equities in the portfolio by 20% to 60%.
In 2009 the fund’s ethical standards were evaluated, investments in
equities reached 60% of the portfolio in June, and the fund
published a return of 25.6%, a record at the time.
In the past four years the fund has reoriented its investment strategy,
taking in more sophisticated assets and emerging market equities. In
2010 it introduced a mandate for the fund to be allowed to invest up to
5% in the real estate sector1, and in 2012 the Ministry of Finance
announced a plan to gradually reduce its European exposure to 40% and
increase investments in emerging markets to 10%. The fund recently took
a further step in its strategy of diversification by announcing that it would
allocate around 1% to investments in frontier markets2 such as Nigeria
and Pakistan. This is aimed not only at diversifying the portfolio, but also
at generating greater returns in the coming years.
clarification: the Government Pension fund Global is not a pension fund
In 2006 the fund changed its name to Government Pension Fund
Global. With this change the Norwegian government was hinting at
the fund’s possible role in a future characterised by an ageing
population: defraying the increased costs of public pensions. And
yet despite the change of name and the declaration of intent
implicit therein, the fund has never operated as a pension fund.
Unlike the traditional pension funds, such as those of Canada or
Japan, the GPFG has no pension obligations. In fact the Norwegian
government has not yet taken any decision on how to finance its
existing pension commitments. It has not even decided the date
from which the fund can be used to cover the costs arising from
future pensions. This, together with the limitations on the
Norwegian executive’s use of the fund’s resources, not only ensure
the fund’s long-term view but also determine the nature of the
vehicle: For many commentators, this absence of pension
commitments is what defines a sovereign wealth fund3.
1 Last August, GPFG changed its investment units aiming to increase in-house investment capabilities. It named three new CIOs and strengthened its real estate team (See http://www.ipe.com/norwegian-oil-fund-restructures-investment-team-grows-property/10002781.fullarticle)2 See http://blogs.ft.com/beyond-brics/2014/05/22/guest-post-frontier-markets-more-profitable-less-volatile/3 Capapé, Javier and Guerrero, Tomás, “More Layers than an Onion: Looking for a Definition of Sovereign Wealth Funds” (June 1, 2013). SovereigNET Research Papers; ESADE Business School Research Paper No. 21. Available at SSRN: http://ssrn.com/abstract=2391165 or http://dx.doi.org/10.2139/ssrn.2391165.

Sovereign Wealth Funds 2014Equity investments of the Norway’s GPFG: A European sovereign wealth fund for Europe
51
However, the absence of current pension obligations does not
prevent some sovereign wealth funds from aiming to meet future
pension contingencies (what in 2008 the IMF called ‘contingent
pension reserve funds’). Two clear examples of this type of sovereign
wealth funds are in Australia and New Zealand. Australia’s Future
Fund ($97.57 billion) and New Zealand’s sovereign wealth fund,
New Zealand Superannuation Fund ($25.51 billion) were set up with
the purpose of serving as a deposit to face future pension
obligations, although they do not currently pay any pensions. The
Irish sovereign wealth fund (National Pensions Reserve Fund) was
also created with this intention of accumulating returns to face the
future cost of pensions. However, following the serious crisis the
country has come through, in 2009 the Ministry of Finance decided
to change the purpose of the NPRF as reserve for pensions and to
use it to recapitalise the two stricken major banks: Allied Irish Banks
(AIB) and Bank of Ireland. They invested $20.7 billion in this
operation. At the end of 2013, the positions and cash generated by
the sale of stakes in the two banks were valued at €15.4 billion4.
They lost 26% of the value of the initial investment in the
transaction. The question that still hangs in the air is: Will Australia,
New Zealand or Chile resist the temptation to apply short-term
economic policies if their economies or key sectors run into serious
problems?
From the Yale to the Norway model
The workings of the GPFG and the returns it obtains have not gone
unnoticed by institutional investors around the world. In the past
few years, the management of the Norwegian fund has not only
become a reference in terms of transparency and corporate
governance for other sovereign wealth funds, but an exemplary
model of asset management for private investors, given the track
record.
But what investment principles can private investors incorporate in
order to follow a strategy similar to that of the Norwegian fund? The
white paper5 “Yale versus Norway”6 published in September 2012 by
Curtis Greycourt, addresses this matter, comparing the investment
strategies followed by David Swensen at the head of the Yale
endowment portfolio with those of Yngve Slyngstad at the head of
Norges Bank Investment Management.
The Yale model bases its strategy on concentrating its investments
in illiquid assets such as property, infrastructure and private equity.
This investment model, designed by David Swensen, has generated
an average annual return of 13.7% for the Yale endowment over the
past twenty years. As a result, the Yale model, which also informs
4 More information on the website of the (still existent) NPRF on its transition to a public strategic investment fund: http://www.nprf.ie/DirectedInvestments/directedInvestments.htm5 Based on Chambers, Dimson and Ilmanen’s “The Norway Model” http://www.iijournals.com/doi/full/10.3905/jpm.2012.38.2.0676 http://www.greycourt.com/wp-content/uploads/2012/09/WhitePaperNo55-YaleVersusNorway.pdf
the investment style of the Harvard and Stanford endowments, has
consolidated its position in recent decades as the main investment
strategy among institutional investors.
However, the model appears to be exhausted, or at least not to
have successfully come through the crisis and its consequences. The
Yale endowment has posted returns below the S&P 500 for five
years in a row, and we are seeing a change of paradigm. The poor
results being posted by the asset management industry since the
onset of the crisis have led many investors to explore new models.
One of those gaining most favour is the model behind the workings
of the Government Pension Fund Global. The Norwegian model,
unlike the Yale one, is showing that attractive returns can be
obtained by investing a good part of the portfolio in equities (more
than 60%), and with a reduced exposure to illiquid assets (up to 5%
in real estate).
From the comparison carried out by Greycourt, we can draw
several conclusions allowing us to pinpoint the differences and
similarities between the two models. In fact the two models are
not so very different, sharing as they do a number of investment
principles such as:
(1) Markets are mostly efficient (2) diversification is one of the best ways of controlling risk (3) the profitability of equities is the main source of returns (4) the fund must be administered on the basis of a specific benchmark and (5) external managers are important.
Nonetheless, the Norwegian model presents a series of differences
compared with the Yale model:
(1) It stresses risk reduction though diversification (2) it has very little or no exposure to short-term bonds (3) it has a much smaller exposure to illiquid assets such as real estate or invest-ments in timber (4) it has rigorous allocation of assets, which significantly reduces tracking error and protects the investment strategy (5) it follows socially responsible investment criteria (6) it plays the role of activist shareholder to improve the gover-nance of the companies in which it invests (7) it has less complex management and significantly lower costs (8) it has a gover-nance structure designed to follow a clear investment strategy, avoiding improvised changes (9) it reduces possible principal-agent problems (between the owner and the manager of the as-sets) since the valuation of the assets is carried out by the market and is easily identifiable.
Furthermore, as we noted in the second difference, the majority of
sovereign wealth funds do not have defined liabilities (pensions)
and therefore do not suffer the problems of asset and liability
mismatch seen in the Yale model. It therefore seems logical for
sovereign wealth funds to follow the Norwegian model rather than
the Yale one. In other words, to follow the model designed by one

Sovereign Wealth Funds 2014 Equity investments of the Norway’s GPFG: A European sovereign wealth fund for Europe52
5. Equity investments of the Norway’s GPFG: A European sovereign wealth fund for Europe
of their peers, which also does not face defined commitments and
which has a long-term investment horizon.
Of course, the Norwegian model, despite being behind the
management of what is considered to be one of the world’s most
transparent sovereign wealth funds and with the best corporate
governance7, is neither perfect nor universally applicable. Not all
investors can adopt the investment principles followed by the fund,
because among other things they do not have the institutional and
organisational framework of the Norwegian fund (parliamentary
support or in-house investment teams). Nor can these principles be
applied unaltered by managers who have to meet recurring short-
term obligations. Even so, the model presents a number of
advantages compared with the Yale one, which could be used by
institutional investors to improve and modernise their investment
strategies.
corporate governance
The Norwegian fund is a world reference for good governance. As
well as heading the ranking of sovereign wealth funds by assets
under management, the GPFG is a reference for good governance,
both corporate (with regard to the manager, NBIM) and in its
relations with its other stakeholders: parliament, central bank,
ministry of finance and Norwegian society.
Moreover, the GPFG is also a reference as regards transparency.
None of the other funds in the top ten by volume of assets has a
similar level of transparency. This is in stark contrast to the
opaqueness of its counterparts in the Middle East or South-east
Asia. The Norwegian fund publishes information, updated in real
time on the value of its portfolio. Every year it also discloses the
content of its portfolio in detail, with the names of all companies
and bodies receiving its fixed income and equity investments. It also
recently started to provide breakdowns of its activity in the real
estate sector. In the case of equities, on which we focus in this
chapter, it has equity investments in 8,213 companies in 74 different
countries. For each one of them it details the volume of the
investment, the percentage of the capital that it represents, and the
percentage of voting rights it can exercise. The fund has an upper
limit of 10 percent of ownership in any given listed company. As at
31 December 2013 the five companies in which GPFG holds the
largest ownership positions were Irish packaging Smurfit Kappa
Group (9.40%), British property and development Great Portland
Estates (8.86%), two Finnish companies in the paper, bio and
forestry industries, Stora Enso (8.16%) and UPM-Kymmene (7.76%);
lastly, American financial giant BlackRock (7.08%).
7 Truman, E. M. (2011). Sovereign Wealth Funds: Threat or Salvation? Peterson Institute for International Economics.
This same transparency extends to the rules governing entries to
and exits from the fund’s capital. Norway is one of the world’s
biggest exporters of oil (seventh) and natural gas (third, behind
Russia and Canada). Therefore clear rules on contributions to the
fund are essential. Specifically, since 2001 the fund’s “spending
rule” establishes that not more than 4% of the fund may be spent
on the government’s annual budget.
Together with this transparency and good corporate governance it
used to be argued that the Norwegian fund was an example for
other funds as regards the non-interference of political
considerations in the NBIM’s investment decisions. However, even
the Norwegian fund is subject to this political interference.
In October 2008 in Santiago de Chile, the then members of the
International Working Group of Sovereign Wealth Funds signed a
declaration of 24 Principles on the practices that should govern
sovereign wealth funds. This non-binding declaration, known since
then as the ‘Santiago Principles’, had a clear intention: to dispel the
fears that many governments then had about sovereign wealth
funds’ possibly investing for political reasons. Balance, to date
appears satisfactory, given Heathrow airport’s current shareholders
(including three SWFs) or Qatar Holding’s leading role in the $66
billion Glencore Xstrata mega-merge in 2012 (the fifth-largest in the
history of the natural resources sector).
However, this same declaration leaves room for discretionality in
many highly significant aspects. Specifically, sub-principle 19.1
stipulates that “If investment decisions are subject to other than
economic and financial considerations, these should be clearly set
out in the investment policy and be publicly disclosed.” When a
fund, for example Mubadala, decides to serve as a financial lever in
changing its country’s production base, it does not specify which
activities are in pursuit of a purely economic and/or financial
objective and which serve a political interest that facilitates (or in
some cases hinders) this diversification.
By this we do not mean to assert that there is necessarily anything
wrong with pursuing objectives that go beyond economic-financial
ones. Sometimes funds can be used as instruments in international
relations, for example, establishing alliances with globally influential
governments so as to facilitate the establishment of trading,
learning and investment relations, for example.
It is therefore logical that the finance industry, multilateral bodies,
receiving countries and regulators should seek to minimise the
effect of these other objectives of the sovereign wealth funds.
However, isolating public entities, which in the final analysis are
governed by politicians, from political interests, is something really
hard to achieve. Furthermore, it will be difficult to correct in the
context of this new “state capitalism” on which many emerging

Sovereign Wealth Funds 2014Equity investments of the Norway’s GPFG: A European sovereign wealth fund for Europe
53
economies have embarked, in which the connections between
governments and corporate managers are so ingrained: former
politicians managing state companies, former managers of state
companies going on to manage public investment agencies, etc.
In the case of Norway, the risk of political interference is limited, but
it does exist. The procedures and accountability to which the NBIM-
managed fund is subject, both to the Ministry of Finance itself and
ultimately to Parliament, ensure that investment policies are not
dictated by short-term political considerations. Furthermore, in
Norway, the fact that the fund does not invest in any domestic
assets (equities, debt or real estate), reduces the incentive to
interfere in particular industries or companies for political reasons.8
However, the Norwegian fund’s determination to become a global
reference as a “responsible investor” exposes it to non-economic-
financial interference or influence. In 2002, the Parliament set up a
committee of experts, the Graver Committee, to implement a
mechanism to ensure responsible investment by the fund. Two years
later, the fund’s lines of action in the field of ethics were defined
and the Board of Ethics was set up. The Board, composed of five
persons with varied profiles (a lawyer, an engineering agronomist, a
biologist and two economists from different fields), is charged with
reviewing all the GPFG’s investments and assessing which, if any, are
inconsistent with the fund’s ethical approach. These
recommendations are submitted to the Ministry of Finance, which
decides, based on the recommendations received, whether to
exclude these investments or place them on a watch list.
The Committee’s recommendations have led to the exclusion of 21
companies in the tobacco sector. Moreover, those which the Ethics
Committee described as causing serious environmental damage (as in
the case of Rio Tinto in 2008), or having seriously or systematically
violated human rights (Walmart being the best-known case, with its
exclusion in May 2006), or producing nuclear weapons (EADS, Boeing
and Lockheed Martin), have also been excluded from the GPFG’s
investment universe by the Ministry of Finance.
It is in this area that the Committee, and ultimately the GPFG may be or
may have been subject to significant political or other influence. In fact,
when the new government came to power, it attempted to dissolve this
independent Committee and incorporate it into the central bank (where
NBIM operates). Although this move was not approved, because it did
not receive majority parliamentary support, a significant reform has
nevertheless been proposed. The recommendations of the Committee,
which will continue to operate independently, would be submitted
directly to the central bank, not passing through the Ministry of Finance.
The main reason given in support of this change is to avoid projecting
8 For more information on how political interference affects funds’ returns and investment decisions, see Bernstein, S., Lerner, J., & Schoar, A. (2013). The Investment Strategies of Sovereign Wealth Funds. Journal of Economic Perspectives, 27(2), 219–238.
an image of the fund as an instrument of Norway’s foreign policy. If this
change comes about based on the reason put forward, then it is hard to
avoid thinking that at some time in the past the fund has been used as
an instrument of foreign policy.
Therefore we may conclude that at least the “responsible
investment” decisions are not necessarily based on strictly economic
or financial considerations. The case of the Norwegian fund
demonstrates that the “risk” of being subjected to non-economic
influence in its investment decisions is real; whether to exclude
individual companies or certain entire sectors, or to include
mandates in ‘responsible’ investment sectors. And all this in the
context of a fund that operates with very well defined and
transparent internal policies. Therefore, in light of the Norwegian
case, we may conclude that the likelihood of a public financial
instrument’s being used as a tool of the country in the pursuit of
other (more or less laudable) objectives is still very significant.
investment strategy: long-term investor, the European bias and external managers
The GPFG was created in order to provide the Norwegian
government with an instrument with which to handle the country’s
fiscal policy in the event that oil prices should fall or Norway’s
onshore economy (i.e. excluding oil and gas) should contract.
In order to safeguard the fund’s founding mandate, the Ministry of
Finance established a clear investment strategy from the outset,
with the objective of taking advantage of its long-term view to
generate high profitability and preserve the country’s wealth for
future generations.
The long-term view is the cornerstone on which the Norwegian
sovereign wealth fund’s investment strategy rests. The NBIM has no
short-term commitments. It identifies long-term investment
opportunities in sectors and specific companies, invests in assets
that it expects to generate high returns over time, and is able to
withstand periods of high volatility in the capital markets. It thus
takes advantage of opportunities that arise, while other investors
find themselves constrained to take short-term decisions.
Geographical spread of the fund’s investments: preference for Europe
Another of the key elements in the fund’s strategy is the setting of
benchmarks for its investments. The fund’s investments are valued
against the benchmark indices for equities, bonds and real estate
compiled by FTSE Group, Barclays Capital and Investment Property
Databank (IPD) respectively. At present, the fund holds 60% of its
assets in equities, 35% in fixed income and up to 5% in real estate.
All GPFG’s investments are made outside Norway.

Sovereign Wealth Funds 2014 Equity investments of the Norway’s GPFG: A European sovereign wealth fund for Europe54
5. Equity investments of the Norway’s GPFG: A European sovereign wealth fund for Europe
Source: ESADEgeo (2014)
1º
2º
3º
4º
5º
6º
7º
8º
9º
10º
Nestlé
Shell
Novartis
HSBC
Vodafone
Roche
BlackRock
BG Group
Apple
BP
Basic materials Consumer goods Consumer services Financials Health care Industrials Oil&gas Technology Telecommunications Utilities
1998 1999 2000 2001 2002 2003 2004 2005 2006 2007 2008 2009 2010 2011 2012 2013
GPFG Top 10: Conquering the world´s largest companies
Infographic 4
6,412.4108.9
92.9
89.3
87.9
87.7
80.9
79.1
71.9
67.4
61.5
4,258.5
4,077.2
4,019.3
3,949.1
3,709.7
3,615.7
3,441.6
3,290.6
4,728.8
Basic materials 6.34
Consumer goods 13.91
Consumer services 10.10
Financials 23.65
Health Care 8.66
Industrials 14.29
Oil & Gas 8.34
Technology 7.43
Telecommunications 3.84
Utilities 3.43
Major investments in emerging-markets companies in 2013 Volume of GPFG investments by sector in 2013
1º
TaiwanSemicond.Manufact.Company
1.001.1
2º
ChinaPacific
InsuranceGroup
922.2
VTBBank
3º
891.9
Tencent
4º
655.1
Petrobras
5º
588.5
Vale
6º
563.6
ICBC
7º
561.2
Gazprom
8º
540.6
ChinaConstruction
Bank
9º
459.0
ChinaMobile
10º
433.1
Holdings(milion $)
Spanish companies<500 500-2.000 >2000
.

Sovereign Wealth Funds 2014Equity investments of the Norway’s GPFG: A European sovereign wealth fund for Europe
55
Source: ESADEgeo (2014)
1º
2º
3º
4º
5º
6º
7º
8º
9º
10º
Nestlé
Shell
Novartis
HSBC
Vodafone
Roche
BlackRock
BG Group
Apple
BP
Basic materials Consumer goods Consumer services Financials Health care Industrials Oil&gas Technology Telecommunications Utilities
1998 1999 2000 2001 2002 2003 2004 2005 2006 2007 2008 2009 2010 2011 2012 2013
GPFG Top 10: Conquering the world´s largest companies
Infographic 4
6,412.4108.9
92.9
89.3
87.9
87.7
80.9
79.1
71.9
67.4
61.5
4,258.5
4,077.2
4,019.3
3,949.1
3,709.7
3,615.7
3,441.6
3,290.6
4,728.8
Basic materials 6.34
Consumer goods 13.91
Consumer services 10.10
Financials 23.65
Health Care 8.66
Industrials 14.29
Oil & Gas 8.34
Technology 7.43
Telecommunications 3.84
Utilities 3.43
Major investments in emerging-markets companies in 2013 Volume of GPFG investments by sector in 2013
1º
TaiwanSemicond.Manufact.Company
1.001.1
2º
ChinaPacific
InsuranceGroup
922.2
VTBBank
3º
891.9
Tencent
4º
655.1
Petrobras
5º
588.5
Vale
6º
563.6
ICBC
7º
561.2
Gazprom
8º
540.6
ChinaConstruction
Bank
9º
459.0
ChinaMobile
10º
433.1
Holdings(milion $)
Spanish companies<500 500-2.000 >2000
.

Sovereign Wealth Funds 2014 Equity investments of the Norway’s GPFG: A European sovereign wealth fund for Europe56
5. Equity investments of the Norway’s GPFG: A European sovereign wealth fund for Europe
According to the latest annual report of the NBIM (31 December
2013), the fund measures the relative returns of its portfolio against
the FTSE Global All Cap index, which contains 7,476 large-, mid- and
small-cap companies from 47 countries. It includes frontier markets
such as Pakistan, Morocco and the Philippines (with a total weight
in the portfolio of less than 1%).
The analysis of the NBIM’s portfolio at the end of 2013 also allows us
to evaluate the geographical distribution of the shares. The Fund
held shares in 8,213 different companies in 74 countries (or
territories, as we shall see).
From this group of 8,000 companies we have filtered the Top 10
investments yearly since 1998 (See Infographic 4). Many trends can
be identified. First, some telecoms simply disappear from the Top 10
(the most prominent case is Nokia which topped in 1999, but British
Telecom, NTT, Cisco, Ericsson, fell too). Second, The oil company BP
is the only firm which endured in the Top 10 since the beginning of
the Fund’s activity in 1998 (the trend shows that most probably it
will not be the case in 2014). Third, two pharmaceutical Swiss
companies represent well the Swiss GPFG’s preference, now
including consumer goods Nestle as top investment destination,
too. Fourth, analyzing sectors, many conclusions arise but current
diversification remains on top. This diversification is even more
evident now if compared with recent 2008, when four over five
largest holdings were oil&gas companies.
If we compare the geographical distribution of the FTSE index with
that of the NBIM, we find some very significant differences. Most of
these differences are explained by deliberate decisions: NBIM
applies a different geographical weighting from that of the FTSE
Global All Cap index. NBIM receives the investment mandate drawn
up by the Ministry of Finance and applies it to its management of
the GPFG. Specifically, NBIM applies an over-weighting of 2.5 to
European equities, relative to the weight assigned by the FTSE index.
It does likewise with “other developed markets” (1.5) and
“emerging markets” (1.5). However it maintains the weighting of
the US and Canada unchanged. In other words, according to the
FTSE index, Europe should account for 23% of the portfolio.
However, applying the NBIM’s weighting, it must represent 40% of
its portfolio. The current weight of Europe in the portfolio is 40.3%.
So in aggregate terms, the GPFG maintains its European investment
in excess of its benchmark. In the opposite extreme is the US, with a
weight of 49% in the FTSE index, assigned just 34% in the new
weighting and accounting for only 29% of the GPFG’s investment.
The following figures show the deviations. First, we compare the
FTSE benchmarks with those of the NBIM (Chart 1). We see an
almost perfect offsetting between the extra weight allocated to
Europe and the penalisation of the US. Specifically, the UK, with
5.52% more, is the clear winner from the adjusted index used by the
NBIM. In monetary terms, the new index increases exposure to the
UK by more than $28.2 billion given the Fund’s current market
value. France, Germany and Switzerland also gain in this respect. At
the other extreme, the US sees its benchmark reduced by just over
15%, which in monetary terms is more than €79.5 billion. In terms
of the benchmark then, the European bias is patent.
5.5
2.3
2.2
2.1
0.9
0.8
0.7
0.7
-1.2
-15.7
Source: Prepared by the authors, with data from FTSE and NBIM (2014).
Percentage
Chart 1
Gap between FTSE and NBIM benchmarksfor selected countries
United States
Canada
Italy
Netherlands
Sweden
Spain
Switzerland
Germany
France
United Kingdom
Millions of euros
Chart 2
Gap between NBIM's adjusted benchmarkand investment received
United States
Japan
Australia
Canada
India
South Africa
Spain
Russia
Finland
Netherlands
China
Sweden
Switzerland
France
Germany
United Kingdom
Source: Prepared by the authors, with data from FTSE and NBIM (2014)
8,283
7,416
5,764
4,660
4,149
2,595
1,349
1,321
1,050
-1,102
-1,128
-1,206
-1,947
-4,422
-5,066
-23,081
AsiaNorth AmericaEurope Middle East Oceania Latin America Africa
Source: Prepared by the authors, with annual report data from NBIM
Billions of dollars
Chart 3
Distribution of the portfolio by continents
0
100
200
300
400
500
600
2013201220112010200920082007200620052004200320022001200019991998
2013201020052000
Source: Prepared by the authors, with annual report data from NBIM
Chart 4
Changes in top ten investments in Europe
Billions of dollars
0
50
100
150
200
FranceGermanyUK Switzerland Sweden
Spain Finland RussiaNetherland Italy
China Brazil Russia India South Africa
Source: Prepared by the authors, with annual report data from NBIM.
Billions of dollars
Chart 5
GPFG investment in the BRICS
0
5
10
15
20
25
30
2013201220112010200920082007200620052004200320022001
.
.
.
We can also see the fund’s real position in comparison with the
adjusted benchmark (Chart 2). In other words, we can see which
countries receive greater or lesser amounts than those determined
by the adjusted benchmark. In this regard, the US again comes out
as the main loser. The gap or difference between the benchmark
and the amount invested in the country is $23 billion. Japan and
Australia ($5 billion and $4.4 billion respectively), are the other two
countries affected by this. We should also highlight two European
countries receiving less investment than envisaged in 2013. These
are Spain, with a negative gap of $1.1 billion, and Denmark, with
$544 million. At the other extreme, the UK ($8.3 billion), Germany
($7.4 billion), France ($5.7 billion), Switzerland ($4.7 billion) and
Sweden ($4.1 billion), received a “surplus” in 2013. Also notable on
the “surplus” side are investments in two emerging countries, China
and Russia, with “surpluses” of $2.6 billion and $1.05 billion
respectively.
This therefore constitutes a deliberate play on investment in Europe.
This domestic (regional) bias is also seen in other institutional

Sovereign Wealth Funds 2014Equity investments of the Norway’s GPFG: A European sovereign wealth fund for Europe
57
investors. The pursuit of an “adjusted” diversification which, in
terms of portfolio weighting, “favours” markets that are culturally,
and above all geographically, close, while “penalising” more distant
markets, specifically the US. Moreover, as we have seen, the actual
investments made further emphasise this weighting. In general
terms, the countries with the greatest positive benchmark gaps to
start with are also those that subsequently receive investments in
excess of the adjusted benchmark.
5.5
2.3
2.2
2.1
0.9
0.8
0.7
0.7
-1.2
-15.7
Source: Prepared by the authors, with data from FTSE and NBIM (2014).
Percentage
Chart 1
Gap between FTSE and NBIM benchmarksfor selected countries
United States
Canada
Italy
Netherlands
Sweden
Spain
Switzerland
Germany
France
United Kingdom
Millions of euros
Chart 2
Gap between NBIM's adjusted benchmarkand investment received
United States
Japan
Australia
Canada
India
South Africa
Spain
Russia
Finland
Netherlands
China
Sweden
Switzerland
France
Germany
United Kingdom
Source: Prepared by the authors, with data from FTSE and NBIM (2014)
8,283
7,416
5,764
4,660
4,149
2,595
1,349
1,321
1,050
-1,102
-1,128
-1,206
-1,947
-4,422
-5,066
-23,081
AsiaNorth AmericaEurope Middle East Oceania Latin America Africa
Source: Prepared by the authors, with annual report data from NBIM
Billions of dollars
Chart 3
Distribution of the portfolio by continents
0
100
200
300
400
500
600
2013201220112010200920082007200620052004200320022001200019991998
2013201020052000
Source: Prepared by the authors, with annual report data from NBIM
Chart 4
Changes in top ten investments in Europe
Billions of dollars
0
50
100
150
200
FranceGermanyUK Switzerland Sweden
Spain Finland RussiaNetherland Italy
China Brazil Russia India South Africa
Source: Prepared by the authors, with annual report data from NBIM.
Billions of dollars
Chart 5
GPFG investment in the BRICS
0
5
10
15
20
25
30
2013201220112010200920082007200620052004200320022001
.
.
.
Additionally, the map showing the geographical spread of the
NBIM’s equity portfolio shows some other interesting facts. One is
struck by the presence of “tax havens” among some of the Fund’s
portfolio companies’ holdings. Thus, the Cayman Islands (0.2%)
have more investment from Norway than does Greece or Colombia;
Bermuda (0.06%) has a higher percentage of the portfolio than the
United Arab Emirates or New Zealand; other tax havens, accounting
for less than 0.05% of the fund’s portfolio, are Guernsey, Jersey and
the British Virgin Islands. In view of the Fund’s wish to become a
reference for “responsible investment”, it is not clear how that
objective meshes with the fund’s positions in these tax havens. It
seems reasonable to suppose that it will withdraw from positions in
these territories, as has been seen with sensitive sectors such as
tobacco, nuclear weapons and palm oil.
External Managers
The GPFG uses external managers to administer part of the fund’s
investments in fixed income and equities. The fund grants
investment mandates to entities with experience and a positive
track record in clearly defined areas for which it is not appropriate to
develop in-house skills and teams. Through them, the fund looks for
managers to outperform the markets in which they operate and
obtain a differential return for the fund. The mandates usually cover
investments in emerging markets and small-caps in developed
markets.
At the end of 2013 the fund had $31 billion (3.8% of its total assets,
compared to 2.9% a year before) in hands of external managers.
This was 30% more than at the beginning of the year. To date, the
fund has granted a total of 70 investment mandates to 59
institutions. Of the 70 mandates granted, 50 have been to
administer investments in equities in emerging and frontier
markets, 13 for investments in equities of small-caps in developed
markets, 5 for investments relating to the environment and 2 for
fixed income in emerging markets.
Historical analysis: GPFG’s equity investments from 1998 to 2013
The GPGF shows a European bias in 2013, as discussed previously.
This bias is nothing new: The Norwegian fund’s investment history
contains a permanent bias in favour of European companies. To
date, GFPF owns 2.5% of Europe’s listed companies.
In Chart 3 we show the changes in GPFG’s equity portfolio from
inception until the end of last year. We see a relatively stable history,
with Europe dominating throughout, followed by the US and Asia
and to a lesser extent Australasia. In 2001 it incorporated Latin
America (Brazil and Mexico) and in 2004: Africa (South Africa) and
the Middle East (Israel dominates investments in the region, with
UAE and Qatar joining later).

Sovereign Wealth Funds 2014 Equity investments of the Norway’s GPFG: A European sovereign wealth fund for Europe58
5. Equity investments of the Norway’s GPFG: A European sovereign wealth fund for Europe
5.5
2.3
2.2
2.1
0.9
0.8
0.7
0.7
-1.2
-15.7
Source: Prepared by the authors, with data from FTSE and NBIM (2014).
Percentage
Chart 1
Gap between FTSE and NBIM benchmarksfor selected countries
United States
Canada
Italy
Netherlands
Sweden
Spain
Switzerland
Germany
France
United Kingdom
Millions of euros
Chart 2
Gap between NBIM's adjusted benchmarkand investment received
United States
Japan
Australia
Canada
India
South Africa
Spain
Russia
Finland
Netherlands
China
Sweden
Switzerland
France
Germany
United Kingdom
Source: Prepared by the authors, with data from FTSE and NBIM (2014)
8,283
7,416
5,764
4,660
4,149
2,595
1,349
1,321
1,050
-1,102
-1,128
-1,206
-1,947
-4,422
-5,066
-23,081
AsiaNorth AmericaEurope Middle East Oceania Latin America Africa
Source: Prepared by the authors, with annual report data from NBIM
Billions of dollars
Chart 3
Distribution of the portfolio by continents
0
100
200
300
400
500
600
2013201220112010200920082007200620052004200320022001200019991998
2013201020052000
Source: Prepared by the authors, with annual report data from NBIM
Chart 4
Changes in top ten investments in Europe
Billions of dollars
0
50
100
150
200
FranceGermanyUK Switzerland Sweden
Spain Finland RussiaNetherland Italy
China Brazil Russia India South Africa
Source: Prepared by the authors, with annual report data from NBIM.
Billions of dollars
Chart 5
GPFG investment in the BRICS
0
5
10
15
20
25
30
2013201220112010200920082007200620052004200320022001
.
.
.
A more detailed analysis of changes in European investments
can be found in Figure 4. Dominated by the UK from the outset,
the European portfolio presents some peculiarities: among
them, the historical preponderance of France over Germany,
although in 2013 France fell to fourth place, behind Switzerland.
Moreover, the domestic bias puts Sweden in seventh place by
cumulative investment (stock). Within Europe, Italy is relegated
to eighth position, in contradiction to the weight of its GDP in
Europe’s economy, which is far greater than that of Switzerland,
the Netherlands or Sweden, all of which are ahead of it in the
ranking.
We sought to ascertain the Norwegian fund’s exposure to the
BRICS (Figure 5). In this case, as has already been said, both Brazil
and South Africa are reference countries in their respective
regions: They served as entry points for their continents and
continue to lead the fund’s investment. In the case of South
African companies, for example, Naspers receives more
investment than Alcatel-Lucent (France), Aviva (UK) or
Commerzbank (Germany); likewise with the MTN Group, which has
investments ahead of those in Vestas (Denmark), EDP (Portugal)
and Fiat (Italy). In the case of Brazil, giants such as Petrobras, Vale
and Itaú also have more investment than many European and
North American companies.
In the case of Russia, already analysed under Europe, banking
(VTB Bank and Sberbank) and commodities (Gazprom, Lukoil and
Surgutneftegas) are the GPFG’s managers’ priority destinations.
In any case, it will be interesting to see whether there is any
reaction to the conflict in Ukraine and whether the successive
sanctions and embargoes between Russia and the rest of the
world have any repercussions for the Norwegian fund’s portfolio
selection in 2014.
In Asia, India and mainland China entered the fund’s investment
universe in 2005. This was some years after Japan, Hong Kong
and South Korea. However, China’s growth is far greater than that
of India. Investments were made in 45 Chinese companies in
2005, 116 in 2007 and 941 in 2009. In 2011, GPGF invested in
almost as many Chinese companies as Japanese ones. The
investments are headed up by insurer China Pacific Insurance
Group, the major state banks ICBC and CCB and telecoms groups
China Mobile and China Unicom. India for its part shows no
particular increase, maintaining a steady number of investments
in around 200 different companies and a volume of around $2.5
billion, heavily concentrated in Infosys, Bharti Airtel, financial
groups Axis Bank, ICICI and Housing Development Finance
Corporation and natural resources, through Reliance Industries for
example.

Sovereign Wealth Funds 2014Equity investments of the Norway’s GPFG: A European sovereign wealth fund for Europe
59
GPGf ups its play on Spanish companies
Since the Norwegian Ministry of Finance redefined the fund’s
investment strategy in 1997, allowing it to allocate 40% of its
assets to investments in equities, Spain and its companies have
been one of the main destinations for the fund’s investments in
Europe.
Unlike our main European neighbours, the Norwegian fund’s entry
into Spanish companies was timid, with an investment barely
surpassing $200 million (spread among 34 companies) in 1998. For
its initial foray, the fund plumped for multinationals well-established
in Spain and with a strong presence in Latin America. Essentially,
these were financial institutions such as BBVA and Banco Santander,
and energy companies such as Endesa and Gas Natural. Prominent
among the first batch of investments in Spanish companies were
Telefónica, in which the fund initially invested nearly $38 million,
and BBVA and Endesa, in each of which it invested more than $22
million.
During the first few years of the twenty-first century, the fund’s
play on Spain and its companies grew continuously, reaching
$1.1 billion in 2003. In that year, the fund’s plays were still
headed up by Telefónica, and the main investments were still
being channelled into financial institutions and energy
companies. However, companies from other sectors were
beginning to make their appearances, such as Altadis (the
result of the merger between Tabacalera and France’s Seita in
1999) with an investment of nearly $106 million, Inditex and
construction companies such as ACS, with investments of close
to $50 million.
At the onset of the financial crisis, the fund kept its faith in Spanish
companies, and in 2008 it invested $5.63 billion in 83 different
Spanish companies, for the first time surpassing its investment in
Italian companies, with Spain thus becoming the fund’s fifth biggest
European investment destination. In 2009, the fund’s stock of
investment in Spanish companies reached a new new record,
surpassing $9.2 billion and becoming the second biggest year
behind last year’s $9.99 billion. In 2010 and 2011 the fund
considerably reduced its exposure to Spanish equities, bringing its
stock down to less than $7.5 billion. Also, in 2011 the fund granted
an investment mandate to the Spanish firm Bestinver Gestión. With
this mandate, the NBIM not only entrusted to Bestinver the
management of a substantial part of its Spanish portfolio, but also
charged it with overseeing the fund’s investments in listed Spanish
mid-caps.
5.5
2.3
2.2
2.1
0.9
0.8
0.7
0.7
-1.2
-15.7
Source: Prepared by the authors, with data from FTSE and NBIM (2014).
Percentage
Chart 1
Gap between FTSE and NBIM benchmarksfor selected countries
United States
Canada
Italy
Netherlands
Sweden
Spain
Switzerland
Germany
France
United Kingdom
Millions of euros
Chart 2
Gap between NBIM's adjusted benchmarkand investment received
United States
Japan
Australia
Canada
India
South Africa
Spain
Russia
Finland
Netherlands
China
Sweden
Switzerland
France
Germany
United Kingdom
Source: Prepared by the authors, with data from FTSE and NBIM (2014)
8,283
7,416
5,764
4,660
4,149
2,595
1,349
1,321
1,050
-1,102
-1,128
-1,206
-1,947
-4,422
-5,066
-23,081
AsiaNorth AmericaEurope Middle East Oceania Latin America Africa
Source: Prepared by the authors, with annual report data from NBIM
Billions of dollars
Chart 3
Distribution of the portfolio by continents
0
100
200
300
400
500
600
2013201220112010200920082007200620052004200320022001200019991998
2013201020052000
Source: Prepared by the authors, with annual report data from NBIM
Chart 4
Changes in top ten investments in Europe
Billions of dollars
0
50
100
150
200
FranceGermanyUK Switzerland Sweden
Spain Finland RussiaNetherland Italy
China Brazil Russia India South Africa
Source: Prepared by the authors, with annual report data from NBIM.
Billions of dollars
Chart 5
GPFG investment in the BRICS
0
5
10
15
20
25
30
2013201220112010200920082007200620052004200320022001
.
.
.

Sovereign Wealth Funds 2014 Equity investments of the Norway’s GPFG: A European sovereign wealth fund for Europe60
5. Equity investments of the Norway’s GPFG: A European sovereign wealth fund for Europe
5.5
2.3
2.2
2.1
0.9
0.8
0.7
0.7
-1.2
-15.7
Source: Prepared by the authors, with data from FTSE and NBIM (2014).
Percentage
Chart 1
Gap between FTSE and NBIM benchmarksfor selected countries
United States
Canada
Italy
Netherlands
Sweden
Spain
Switzerland
Germany
France
United Kingdom
Millions of euros
Chart 2
Gap between NBIM's adjusted benchmarkand investment received
United States
Japan
Australia
Canada
India
South Africa
Spain
Russia
Finland
Netherlands
China
Sweden
Switzerland
France
Germany
United Kingdom
Source: Prepared by the authors, with data from FTSE and NBIM (2014)
8,283
7,416
5,764
4,660
4,149
2,595
1,349
1,321
1,050
-1,102
-1,128
-1,206
-1,947
-4,422
-5,066
-23,081
AsiaNorth AmericaEurope Middle East Oceania Latin America Africa
Source: Prepared by the authors, with annual report data from NBIM
Billions of dollars
Chart 3
Distribution of the portfolio by continents
0
100
200
300
400
500
600
2013201220112010200920082007200620052004200320022001200019991998
2013201020052000
Source: Prepared by the authors, with annual report data from NBIM
Chart 4
Changes in top ten investments in Europe
Billions of dollars
0
50
100
150
200
FranceGermanyUK Switzerland Sweden
Spain Finland RussiaNetherland Italy
China Brazil Russia India South Africa
Source: Prepared by the authors, with annual report data from NBIM.
Billions of dollars
Chart 5
GPFG investment in the BRICS
0
5
10
15
20
25
30
2013201220112010200920082007200620052004200320022001
.
.
.
In 2012 the fund regained its appetite for Spanish equities and
again reached $8 billion in investment, in Banco Santander,
Telefónica and BBVA, each with investments of more than $1 billion.
There were also significant investments in R&D&I-intensive
companies such as Amadeus, with more than $173 million, and
Grifols, with $140 million. This shows the Norwegian fund’s interest
in investing beyond the usual suspects: financial, construction and
energy.
In 2013 the GPFG increased its investment in Spanish equities by
20.1%, from $8.32 billion in 2012 to $9.99 billion in 2013. In total,
at the end of 2013, the Norwegian fund had investments in 73 listed
Spanish companies, compared with 69 in 2012.
Within the IBEX 35 (see following table in euros) the main
investments continue to be concentrated in Banco Santander
(€1.245 billion), Telefónica (€952 million) and BBVA (€840 million).
However the only one of these in which the fund increased its stake
relative to 2012 was BBVA (up by 0.8%). These multinationals are
followed by others such as Inditex (€651 million), Iberdrola (€471
million) and Repsol (€272 million). The fund increased its
investments in these three relative to 2012.
However the fund did not confine itself to the usual suspects in the
IBEX 35, but took positions beyond them. For example, it made a
strong play on Gamesa, one of the stocks that has performed best
so far in 2014, increasing its investment by 3,150%. Today, GPFG
owns 2.58%, which represents the largest equity holding (relative to
the market capitalization) within Top 20, followed by Ferrovial or
DIA (it controls 1.92%) and Telefónica (1.73%). It also bet on
financial institutions such as Bankinter and CaixaBank, reaching €67
million and €97 million of investment respectively, and Mapfre,
which has a strong presence in Latin America, in which its
investment increased by 102.2% compared with 2012. Furthermore,
the fund also took a position in the group resulting from the merger
of Iberia and British Airways, IAG, in which it invested €100 million.

Sovereign Wealth Funds 2014Equity investments of the Norway’s GPFG: A European sovereign wealth fund for Europe
61
Table 1
Main Spanish investments of the GPFG
Top 20 Company / Bank 2013 2012 2013/2012
1 Santander 1,245 1,389 -10.4%
2 Telefónica 952 990 -3.8%
3 BBVA 840 833 0.8%
4 Inditex 651 600 8.5%
5 Iberdrola 471 447 5.4%
6 Repsol 292 240 21.7%
7 Ferrovial 222 181 22.7%
8 Amadeus 172 131 31.3%
9 Gas Natural 160 123 30.1%
10 Grifols 127 106 19.8%
11 Banco de Sabadell 109 90 21.1%
12 IAG 100 - -
13 Abertis 98 93 5.4%
14 CaixaBank 97 38 155.3%
15 Banco Popular 95 53 79.2%
16 Mapfre 93 46 102.2%
17 ACS 87 77 13%
18 DIA 76 70 8.6%
19 Bankinter 67 24 179%
20 Gamesa 65 2 3.150%
total* 6,019 5,533 8.7%
Source: In-house with NBIM data as at 31 December 2013.
* Millions of euros.

Paul Rose
Executive Director, Law, Finance & Governance @ Ohio State
Professor of Law, Ohio State University – Moritz College of Law
North American Dream: U.S. and Canadian Public Funds

Paul Rose
Executive Director, Law, Finance & Governance @ Ohio State
Professor of Law, Ohio State University – Moritz College of Law
North American Dream: U.S. and Canadian Public Funds
Sovereign Wealth Funds 2014North American Dream: U.S. and Canadian Public Funds
63

Sovereign Wealth Funds 2014North American Dream: U.S. and Canadian Public Funds64
6. North American Dream: U.S. and Canadian Public Funds
introduction
On March 8, 2014, the West Virginia Legislature approved the
creation of a West Virginia “Future Fund,” the latest in a series of
North American sovereign wealth funds (SWFs) created in recent
decades. Following a model used by other states and provinces, 3% of
all funds received from severance taxes on coal, oil, natural gas,
minerals and timber extracted in West Virginia will be diverted to a
permanent trust fund 1. West Virginia’s fund will almost certainly not
be the last SWF: recent estimates by the U.S. Energy Information
Administration place the amount of technically recoverable shale oil
in the United States at 48 billion barrels, and technically recoverable
shale gas at 1,161 trillion cubic feet, in deposits from New York to
California, while Canada has technically recoverable shale oil deposits
of 9 billion barrels, and technically recoverable shale gas at 573 trillion
cubic feet 2. Using revenues from some of the same natural resource
reserves enjoyed by their U.S. neighbors, Saskatchewan and the
Northwest Territories are preparing to launch wealth funds.
Meanwhile, some of the most important recent innovations in
investment management of public funds are being developed north
of the border. Large Canadian funds and managers, including the
Canada Pension Plan Investment Board (CPPIB), Ontario Teachers’
Pension Plan (OTTP), PSP Investments and the Ontario Municipal
Employees Retirement System (OMERS), are developing strong
in-house expertise and investing directly in private equity,
infrastructure and property deals. Not only does this style of
investing save billions in fees that would otherwise go to external
asset managers, but the funds are also able to take advantage of
their natural time horizon advantages over other large investors,
exercise more control over their investments, and reap higher
returns. OTTP, for example, reports the highest 10-year returns
among global peer funds for the years 2010, 2011 and 2012.
The governance structures and investment policies employed by North
American public funds vary from state to state and from province to
province. With respect to structure and payouts, some jurisdictions
retain the principal funds in a central account and use interest
generated to supplement the state budget. Others create separate
funds for specific social and economic programs. And Alaska, in an
innovative model befitting its image as a frontier state, distributes
income generated from its wealth fund directly to Alaska residents.
With respect to investment policies, some funds have limitations on
the types of assets in which they can invest, following the “legal list”
methodology that has been a common feature of public pension fund
investing for decades. Others simply hold their fiduciaries to a
1 Under the provisions of the S. B. 461, the Future Fund will only receive its 3% when West Virginia’s “Rainy Day” fund is equal to at least 13.5% of the general revenue. The state also may not draw from the fund until 2019. S. B. 461 (W. Va. 2014).2 U.S. Energy Information Administration, Technically Recoverable Shale Oil and Shale Gas Resources: An Assessment of 137 Shale Formations in 41 Countries Outside the United States (June 2013), available at http://www.eia.gov/analysis/studies/worldshalegas/pdf/fullreport.pdf.
“prudent person” standard without requiring or prohibiting specific
investment or setting specific asset allocation targets, allowing the
funds to operate at the cutting edge of investment policy and practice.
This article will briefly discuss some of the innovations developed by
North American public funds, with a particular focus on their distribution
policies, governance and investment decision-making. This is a story
decades in the making. Although the creation of new funds like West
Virginia’s Future Fund and North Dakota’s Legacy Fund have received
significant popular attention in recent years, many North American
funds have existed for decades, and the legislative history of some funds
dates back to two years prior to the adoption of the U.S. Constitution.
And, with significant oil, natural gas and mineral wealth remaining to
be tapped in the United States and Canada, West Virginia, the
Northwest Territories and Saskatchewan’s funds may just be the latest
in a continuing wave of North American public funds.
a Short history of north american Public funds
Recently created wealth funds like Quebec’s Generations Fund, North
Dakota’s Legacy Fund and West Virginia’s Future Fund, as well as
funds that are now a few decades old, such as the Alaska Permanent
Fund and the Alberta Heritage Fund, typically have a common funding
source: a percentage of the severance taxes paid on natural resource
extraction 3 . However, as described in this section, many of these
funds are not the result of newly-discovered petroleum wealth.
Indeed, the oldest North American sovereign wealth funds trace their
origins to the early days of the United States itself.
Permanent School Trust Funds
The history of North American sovereign wealth begins with the Land
Ordinance Act of 1785 and the Northwest Ordinance Act of 1787. Congress
intended these two legislative acts to provide a funding mechanism for
U.S. territories that would support public school systems and other vital
governmental services. Indeed, the acts had a crucial political purpose;
some members of the Continental Congress feared that as settlements
expanded in the new territories under federal control, land speculation
would quickly ensue, natural resources would deplete and, most
worryingly, “the fragile new Union might fracture if settlements decided
to secede or establish non-democratic governments” 4.
3 Quebec’s funding is more diverse than other funds, however, as it includes “the revenue resulting from indexing the price of heritage electricity as of 2014; all mining royalties as of 2015-2016; the revenue of $215 million per year, as of 2017-2018, stemming from the increase in Hydro-Québec’s net earnings resulting from the closure of the Gentilly-2 nuclear power plant; as of 2014-2015, $100 million per year arising from the increase in the specific tax on alcoholic beverages.” Québec, 2013 economic and Financial ProFile oF Québec 19 (2013), available at http://www.finances.gouv.qc.ca/documents/Autres/en/AUTEN_profile2013.pdf.4 ctr. on educ. Policy, Public SchoolS and the original Federal land grant Program: a background PaPer From the center on education Policy 5 (2011), available at http://www.cep-dc.org/cfcontent_file.cfm?Attachment=Usher_Paper_FederalLandGrants_041311.pdf.

Sovereign Wealth Funds 2014North American Dream: U.S. and Canadian Public Funds
65
Table 1
Permanent School Trust Funds
fund Primary income Source(s) aum (millions uSD) inception
The Texas Permanent School Fund Oil & gas $30,600 1854
The Texas Permanent University Fund Oil & gas $15,300 1876
New Mexico Land Grant Permanent Fund Oil & gas $5,932 1912
Wyoming Permanent Land Funds Oil, gas, coal & minerals $2,696 1890
The Oklahoma Permanent Funds Investments and oil & gas $2,000 1906
Utah Permanent State School & Institutional Trust Funds Oil & Gas $1,600 1896
The Oregon Common School Funds Investments $1,200 1859
Minnesota Permanent School Fund Mineral lease $1,000 1849
Source: Funds’ websites.
Through the Land Ordinance Act, lot No. 16 of every township—
physically located at the center of each township—was reserved for
the maintenance of public schools within each township, thereby
providing the critical funding mechanism for state public schools.
The Northwest Ordinance of 1787 next provided more formal
mechanisms by which states would apply for statehood to be
achieved through the passage of an Enabling Act for each state,
which would set out the specific land grant. The typical structure
involved a land grant for the benefit of the state’s schools.
During these early years, when many states were created and
subsequently joined the Union, no state set aside income from the
lands in a permanent trust fund. Many states sold off the land and
immediately used the money for the benefit of the local schools. It was
not until 1835 that the first permanent fund was created by the territory
of Michigan, coincident with its entry into the Union in 1837. Other
states followed Michigan’s model, although it was not until the
Colorado Enabling Act of 1875, when the U.S. Congress itself specifically
placed restrictions on the sale of lands set aside for public schools, that
the sales of such lands would constitute a “permanent school fund.”
Many of the original grant lands have been sold, with most states
taking the view that the pressing needs of fledgling school systems
required substantial and immediate funding through sales, rather
than a trickle of funding through leasing of the trust lands. In
Oregon, for example, the state engaged in a systematic liquidation
of state trust lands “based on the theory that once this property was
in private hands, the lands would generate more revenue for the
state in property taxes than it would in public ownership” 5. Most of
the states formed prior to 1850 have sold the majority of their
5 Peter W. culP et al., lincoln inSt oF land Policy & Sonoran inSt. Joint Venture on State land truStS, truSt landS in the american WeSt: a legal oVerVieW and Policy aSSeSSment (2005), available at https://www.lincolninst.edu/subcenters/managing-state-trust-lands/publications/trustlands-report.pdf.
holdings. California, for example, retains only about 10% of its
original grant. A few other states, however, hold a majority of their
grant lands, including Nevada (87%) and Arizona (75%). For those
states with significant trust lands, revenue generated from the lands
can provide a significant portion of the state’s overall budget. As an
example, in New Mexico, state funds make up approximately 67%
of the revenue for public schools, and trust lands provide
approximately 14% of this funding. Although there are many state
land grant funds in operation, only the funds in Table 1 have assets
under management of a billion dollars or more.
Severance Tax Funds
In 1973, New Mexico was the first state to use severance tax
revenues on natural resources to establish a permanent fund. A
number of other states followed. As states created these funds, one
of the primary arguments for the creation of the funds was not only
(or perhaps even predominantly) to generate revenue, but rather to
offset costs associated with resource extraction, such as damage to
water systems, air quality, or loss of arable land or natural habitats.
Not all states with natural resource wealth have used severance
taxes to create permanent funds, however, and many resource
extractors and other beneficiaries of the resources have argued that
severance taxes are merely a form of rent extraction by politicians of
resource-rich states. Notwithstanding these complaints, however,
many severance tax funds have reached or are approaching 40
years of continued operation, and form an important part of many
states’ budget systems. The largest severance tax funds—with
assets greater than $2 billion—are shown in Table 2. With the
exception of the Alaska Permanent fund, most severance tax funds
are relatively small.
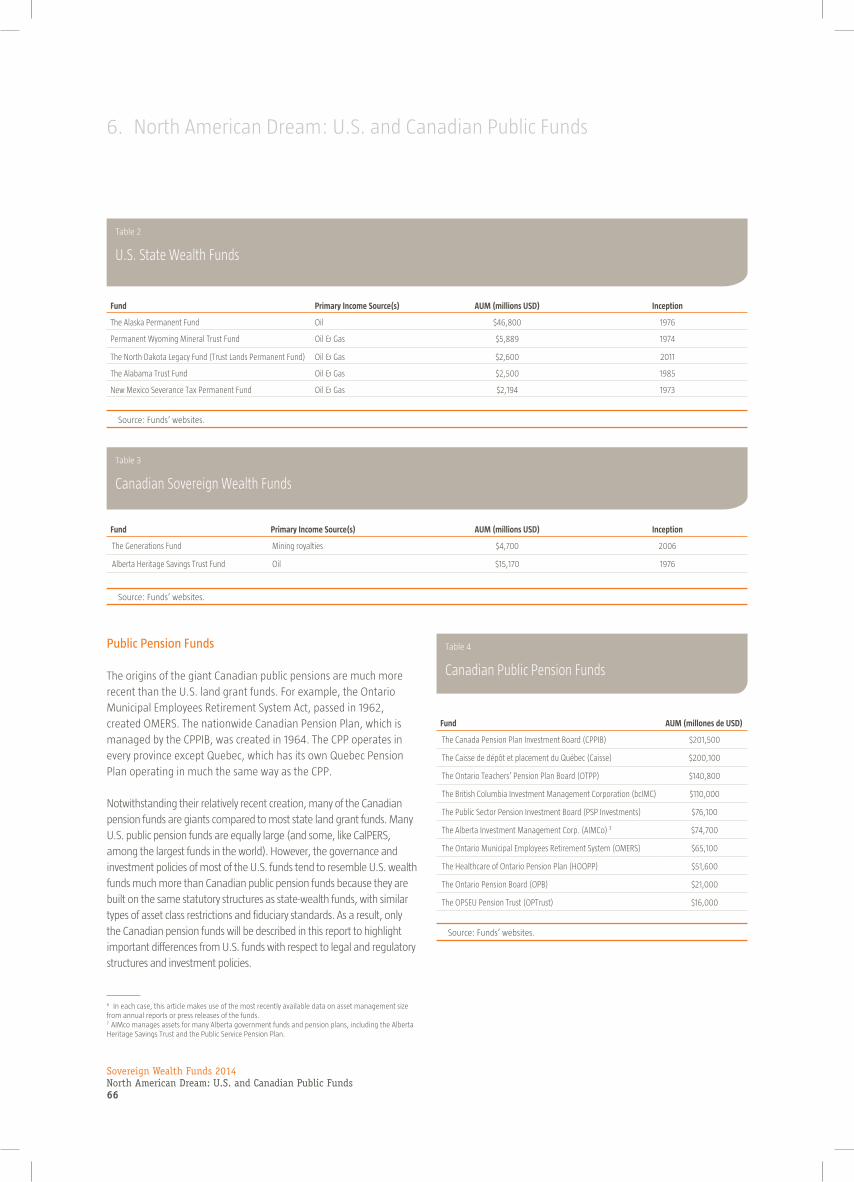
Sovereign Wealth Funds 2014North American Dream: U.S. and Canadian Public Funds66
6. North American Dream: U.S. and Canadian Public Funds
Table 2
U.S. State Wealth Funds
fund Primary income Source(s) aum (millions uSD) inception
The Alaska Permanent Fund Oil $46,800 1976
Permanent Wyoming Mineral Trust Fund Oil & Gas $5,889 1974
The North Dakota Legacy Fund (Trust Lands Permanent Fund) Oil & Gas $2,600 2011
The Alabama Trust Fund Oil & Gas $2,500 1985
New Mexico Severance Tax Permanent Fund Oil & Gas $2,194 1973
Source: Funds’ websites.
Table 3
Canadian Sovereign Wealth Funds
fund Primary income Source(s) aum (millions uSD) inception
The Generations Fund Mining royalties $4,700 2006
Alberta Heritage Savings Trust Fund Oil $15,170 1976
Source: Funds’ websites.
Public Pension Funds 6
The origins of the giant Canadian public pensions are much more
recent than the U.S. land grant funds. For example, the Ontario
Municipal Employees Retirement System Act, passed in 1962,
created OMERS. The nationwide Canadian Pension Plan, which is
managed by the CPPIB, was created in 1964. The CPP operates in
every province except Quebec, which has its own Quebec Pension
Plan operating in much the same way as the CPP.
Notwithstanding their relatively recent creation, many of the Canadian
pension funds are giants compared to most state land grant funds. Many
U.S. public pension funds are equally large (and some, like CalPERS,
among the largest funds in the world). However, the governance and
investment policies of most of the U.S. funds tend to resemble U.S. wealth
funds much more than Canadian public pension funds because they are
built on the same statutory structures as state-wealth funds, with similar
types of asset class restrictions and fiduciary standards. As a result, only
the Canadian pension funds will be described in this report to highlight
important differences from U.S. funds with respect to legal and regulatory
structures and investment policies. 7
6 In each case, this article makes use of the most recently available data on asset management size from annual reports or press releases of the funds. 7 AIMco manages assets for many Alberta government funds and pension plans, including the Alberta Heritage Savings Trust and the Public Service Pension Plan.
Table 4
Canadian Public Pension Funds
fund aum (millones de uSD)
The Canada Pension Plan Investment Board (CPPIB) $201,500
The Caisse de dépôt et placement du Québec (Caisse) $200,100
The Ontario Teachers’ Pension Plan Board (OTPP) $140,800
The British Columbia Investment Management Corporation (bcIMC) $110,000
The Public Sector Pension Investment Board (PSP Investments) $76,100
The Alberta Investment Management Corp. (AIMCo) 7 $74,700
The Ontario Municipal Employees Retirement System (OMERS) $65,100
The Healthcare of Ontario Pension Plan (HOOPP) $51,600
The Ontario Pension Board (OPB) $21,000
The OPSEU Pension Trust (OPTrust) $16,000
Source: Funds’ websites.
Sovereign Wealth Funds 2014North American Dream: U.S. and Canadian Public Funds
67
innovation in Distribution Policy: the alaska Permanent fund
For public pension funds, distribution goals are relatively simple in
theory (but often difficult to implement in practice); public pensions
must be able to pay liabilities of pensioners as they become due. By
contrast, sovereign wealth funds typically do not have specific
liabilities 8. What, then, are SWFs designed to do? Much of the writing
on SWFs explains them in terms of political risk or the potential use of
SWFs as political tools. The use of a SWF as a political tool is but one
among many explanations for the existence of SWFs, and while it may
be true that some SWFs are used for political purposes on occasion—
though there exists scant evidence of this—less nefarious purposes
drive the creation of most SWFs, whether at the national or state
level. Although the specific reasons justifying the existence of a SWF
are expressed in unique ways, the various justifications may be
grouped together under several general categories, including revenue
smoothing, protecting against Dutch Disease, or providing
intergenerational welfare. Because these policy goals have been
discussed at length elsewhere, this article will address only one
innovative means of achieving an essential fund goal: the Alaska
Permanent Fund’s unique distribution policy 9.
Alaska’s SWF, like many others, was designed to be a mechanism
for ensuring intergenerational equity. The term intergenerational
equity is somewhat ambiguous, as it can refer both to an imperative
to save present capital in order to use it to satisfy future
commitments, such as pension benefits, or to an imperative to save
it specifically for the benefit of future generations, irrespective of
commitments to present generations. In ageing populations,
intergenerational equity suggests a fairness concern that if a citizen
has paid taxes and social security or equivalent public pension
payments, they have a proper claim against the government for a
reasonable income in their retirement. Intergenerational equity can
also refer to a principle of distributive justice. The primary concern in
this sense of the term is not that present generations may enjoy
some of the fruits of their life’s work through government benefits in
retirement, but that future generations should be able to enjoy the
fruits of the nation’s resources just as present generations. Thus, a
natural resource fund is not created so that (or merely that) it may
provide a present generation with an acceptable standard of
retirement benefits, but also that future generations should also
benefit from the sale of a finite store of resources taken from the
land that they are to inherit.
The decision to set up a fund for future generations is a crucial
economic decision because it may well be the case that economic
8 Admittedly, this is not a universally accepted statement. See Javier Capapé & Tomas Guerrero Blanco, More Layers than an Onion: Looking for a Definition of Sovereign Wealth Funds (ESADE Bus. Sch. Research Paper No. 21, 2013), available at http://ssrn.com/abstract=2391165.9 Some of the following observations were first developed in Paul Rose, Managing Public Natural Resource Wealth, reViSta braSileira de PolíticaS PublicaS (2013), available at http://papers.ssrn.com/sol3/papers.cfm?abstract_id=2220218.
development initiatives could pay greater dividends than the
benefits offered by a SWF that merely pays its interest back into
state coffers. Alternatively, a state may decide that it will instead
pay out a dividend, as Alaska does, rather than leave the
determination of how funds should be spent to the government.
The debate in Alaska over the issue of how best to serve future
generations is instructive. Proponents of the Alaska Permanent
Fund offered several rationales for the creation of the Alaska
Permanent Fund: first, the Fund would “help to create an
investment base from which to generate future income. Then,
when oil revenues ran out, there would still be a major source of
state revenues to pay out the costs of government services”;
second, the APF would “remove a significant portion of the oil
revenues from the legislative spending stream, thus reducing the
opportunities for excessive spending by the Legislature”; and
third, the fund would prudently “transform” oil wealth into a
“renewable source of wealth for future generations” 10.
Although the APF had several clear purposes for its existence, the
particular means of achieving these general goals had not yet
crystallized by the time the APF began receiving funds. The debate
focused on generational issues: should the APF be managed as an
investment fund that would distribute income over the long-term, or
should it be managed as a development bank and used to “force-
feed” Alaska’s economy in the short-term? 11. This second possibility
is not necessarily inconsistent with the third rationale,
intergenerational wealth transfer, justifying the creation of the APF.
By using the APF as a development bank that provides loans and
grants to Alaskan businesses, the fund could increase the number of
small businesses in Alaska, which would serve to increase the
number of jobs and broaden the economy, thereby ultimately
decreasing the dependence of the state on oil and other natural
resource revenues. On the other hand, a development bank would
increase the possibility of political mischief as the Fund could be
used as a mechanism for political patronage.
Those arguing in favor of the investment fund model were
motivated by the protection of the principal managed by the APF.
They believed the APF should manage the funds in accordance with
the prudent investor rule and only make investments that were of
“trust-grade quality” at market rates. Ultimately, the proponents of
the investment fund model prevailed, although the state allocated
some funds that were not part of the 25% of revenues dedicated to
the APF to create several state agencies 12 charged with achieving
some of the short-term goals envisioned by the proponents of the
development bank model.
10 Gordon L. Clark & Eric R. W. Knight, Temptation and the Virtues of Long-Term Commitment: The Governance of Sovereign Wealth Fund Investment, 1 aSian J. int’l l. 321, 335 (2011).11 Id. at 328.12 These agencies include the Alaska Housing Finance Corporation, the Alaska Industrial Development and Export Authority and the Alaska Renewable Resources Corporation.
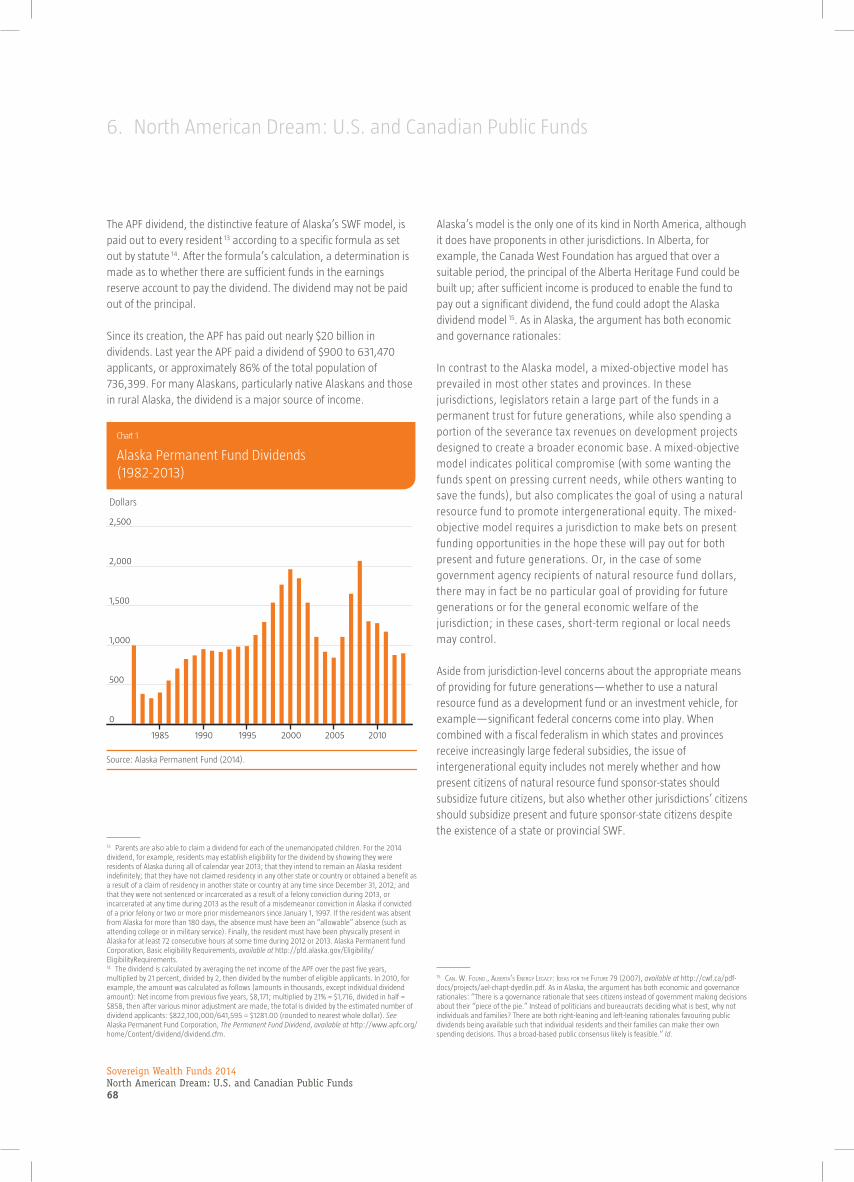
Sovereign Wealth Funds 2014North American Dream: U.S. and Canadian Public Funds68
6. North American Dream: U.S. and Canadian Public Funds
Alaska’s model is the only one of its kind in North America, although
it does have proponents in other jurisdictions. In Alberta, for
example, the Canada West Foundation has argued that over a
suitable period, the principal of the Alberta Heritage Fund could be
built up; after sufficient income is produced to enable the fund to
pay out a significant dividend, the fund could adopt the Alaska
dividend model 15. As in Alaska, the argument has both economic
and governance rationales:
In contrast to the Alaska model, a mixed-objective model has
prevailed in most other states and provinces. In these
jurisdictions, legislators retain a large part of the funds in a
permanent trust for future generations, while also spending a
portion of the severance tax revenues on development projects
designed to create a broader economic base. A mixed-objective
model indicates political compromise (with some wanting the
funds spent on pressing current needs, while others wanting to
save the funds), but also complicates the goal of using a natural
resource fund to promote intergenerational equity. The mixed-
objective model requires a jurisdiction to make bets on present
funding opportunities in the hope these will pay out for both
present and future generations. Or, in the case of some
government agency recipients of natural resource fund dollars,
there may in fact be no particular goal of providing for future
generations or for the general economic welfare of the
jurisdiction; in these cases, short-term regional or local needs
may control.
Aside from jurisdiction-level concerns about the appropriate means
of providing for future generations—whether to use a natural
resource fund as a development fund or an investment vehicle, for
example—significant federal concerns come into play. When
combined with a fiscal federalism in which states and provinces
receive increasingly large federal subsidies, the issue of
intergenerational equity includes not merely whether and how
present citizens of natural resource fund sponsor-states should
subsidize future citizens, but also whether other jurisdictions’ citizens
should subsidize present and future sponsor-state citizens despite
the existence of a state or provincial SWF.
15 can. W. Found., alberta’S energy legacy: ideaS For the Future 79 (2007), available at http://cwf.ca/pdf-docs/projects/ael-chapt-dyedlin.pdf. As in Alaska, the argument has both economic and governance rationales: “There is a governance rationale that sees citizens instead of government making decisions about their “piece of the pie.” Instead of politicians and bureaucrats deciding what is best, why not individuals and families? There are both right-leaning and left-leaning rationales favouring public dividends being available such that individual residents and their families can make their own spending decisions. Thus a broad-based public consensus likely is feasible.” Id.
The APF dividend, the distinctive feature of Alaska’s SWF model, is
paid out to every resident 13 according to a specific formula as set
out by statute 14. After the formula’s calculation, a determination is
made as to whether there are sufficient funds in the earnings
reserve account to pay the dividend. The dividend may not be paid
out of the principal.
Since its creation, the APF has paid out nearly $20 billion in
dividends. Last year the APF paid a dividend of $900 to 631,470
applicants, or approximately 86% of the total population of
736,399. For many Alaskans, particularly native Alaskans and those
in rural Alaska, the dividend is a major source of income.
Source: Alaska Permanent Fund (2014)
Chart 1
Alaska Permanent Fund Dividends(1982-2013)
Source: Author’s elaboration.
Chart 2
Politicized Public Fund
0
500
1,000
1,500
2,000
2,500
1985 1990 1995 2000 2005 2010
Limitations on pay of fund
staff
External management of
assets
Higher fees, lower
overall returns
Fund directly
governed within political system
Source: Author’s elaboration.
Chart 3
Depoliticized Public Fund
Investment restrictions to limit the
risk of politically-damaging
losses and to limit interest group influence
Fewer limitations on
staff pay
Lees external management of
assets, more internal management
Lower fees, higher overall
returns
Fund insulated from political system
Less need for investment restrictions
to manage political risk and rent-seeking
Dollars
.
13 Parents are also able to claim a dividend for each of the unemancipated children. For the 2014 dividend, for example, residents may establish eligibility for the dividend by showing they were residents of Alaska during all of calendar year 2013; that they intend to remain an Alaska resident indefinitely; that they have not claimed residency in any other state or country or obtained a benefit as a result of a claim of residency in another state or country at any time since December 31, 2012; and that they were not sentenced or incarcerated as a result of a felony conviction during 2013, or incarcerated at any time during 2013 as the result of a misdemeanor conviction in Alaska if convicted of a prior felony or two or more prior misdemeanors since January 1, 1997. If the resident was absent from Alaska for more than 180 days, the absence must have been an “allowable” absence (such as attending college or in military service). Finally, the resident must have been physically present in Alaska for at least 72 consecutive hours at some time during 2012 or 2013. Alaska Permanent fund Corporation, Basic eligibility Requirements, available at http://pfd.alaska.gov/Eligibility/EligibilityRequirements.14 The dividend is calculated by averaging the net income of the APF over the past five years, multiplied by 21 percent, divided by 2, then divided by the number of eligible applicants. In 2010, for example, the amount was calculated as follows (amounts in thousands, except individual dividend amount): Net income from previous five years, $8,171; multiplied by 21% = $1,716, divided in half = $858, then after various minor adjustment are made, the total is divided by the estimated number of dividend applicants: $822,100,000/641,595 = $1281.00 (rounded to nearest whole dollar). See Alaska Permanent Fund Corporation, The Permanent Fund Dividend, available at http://www.apfc.org/home/Content/dividend/dividend.cfm.

Sovereign Wealth Funds 2014North American Dream: U.S. and Canadian Public Funds
69
Source: Alaska Permanent Fund (2014)
Chart 1
Alaska Permanent Fund Dividends(1982-2013)
Source: Author’s elaboration.
Chart 2
Politicized Public Fund
0
500
1,000
1,500
2,000
2,500
1985 1990 1995 2000 2005 2010
Limitations on pay of fund
staff
External management of
assets
Higher fees, lower
overall returns
Fund directly
governed within political system
Source: Author’s elaboration.
Chart 3
Depoliticized Public Fund
Investment restrictions to limit the
risk of politically-damaging
losses and to limit interest group influence
Fewer limitations on
staff pay
Lees external management of
assets, more internal management
Lower fees, higher overall
returns
Fund insulated from political system
Less need for investment restrictions
to manage political risk and rent-seeking
Dollars
.
innovation in investment Policy: the canadian Public Pension funds
Of critical importance to the success of a public fund is the legal
and governance framework in which it operates; without the
proper framework, the fund is less likely to achieve its stated goals,
and, of even more concern, is at risk of becoming a tool for
corruption. A large part of the governance structure is written into
the investment policies of the funds, but the policies themselves
depend on the political framework in which the fund operates.
Transferring high-level justifications for public funds into sound
fund investment decision-making is exceedingly difficult, and state
and provincial funds differ significantly in their governance and
investment philosophies.
The management and investment policies of the Canadian funds
differ significantly from the U.S. state wealth funds in several
crucial ways. First, the Canadian funds tend to be much larger
than the U.S. funds. Economies of scale play a significant role in
determining whether a fund will be able to justify and support a
large in-house management team. Second (and in part a
function of their comparatively large size), Canadian funds tend
to invest very differently from their American counterparts. As
others have noted (and the Canadian funds themselves have
pointed out), Canadian funds tend not to have explicit statutory
restrictions on their investments. The size and flexibility of
Canadian funds allows them to make direct alternative
investments in infrastructure, venture capital, or private equity
that many other public funds, including U.S. state wealth funds,
could not make.
Finally, Canadian funds differ in the way in which they are governed.
Canadian funds are well-insulated from political pressure, and tend
to have independent, professional boards rather than, as The
Economist bluntly stated, boards “stuffed with politicians, cronies
and union hacks” 16. Also, compared to their U.S. counterparts,
Canadian funds tend to pay much closer to the compensation rates
of external asset managers.
Although economies of scale explain much of the differences in
investment policy between large Canadian funds and smaller pension
funds, political independence also appears to play a significant role. U.S.
funds—wealth funds, to some extent, but particularly public pension
funds—suffer from a lack of political independence, and this lack of
independence has serious consequences for investment policies. This is
certainly not to say that funds are corrupt, but that public fund
managers must regularly contend with political pressures from
legislatures and interest groups; this is particularly true for funds that
are tightly controlled by state legislatures. How investment policies are
connected to political forces is best understood by considering the
incentives of the elected government officials that create and supervise
the fund. Politicians are faced with difficult choices about how the
government will ensure that the public fund remains accountable.
There may also be political gamesmanship that occurs as the various
constituencies with an interest in the fund’s performance (such as public
employee union officials or elected officials such as state treasurers) vie
for a seat at the board table. Thus, boards are staffed with politicians or
their appointees, rather than professional managers. The incentives of
appointed or elected policy-makers can reasonably be expected to differ
from professional managers along several dimensions. First, they may
be concerned with representing their political constituency, such as
unionized employees or a particular political party, in addition to (or in
egregious cases, rather than) the beneficiaries of the fund. Politicians
may also be concerned that the fund could serve as a vehicle to advance
the interests of rival political parties or interest groups. And, because
16 Canada’s Pension Funds: Maple Revolutionaries, econ. (Mar. 3, 2012), http://www.economist.com/node/21548970.
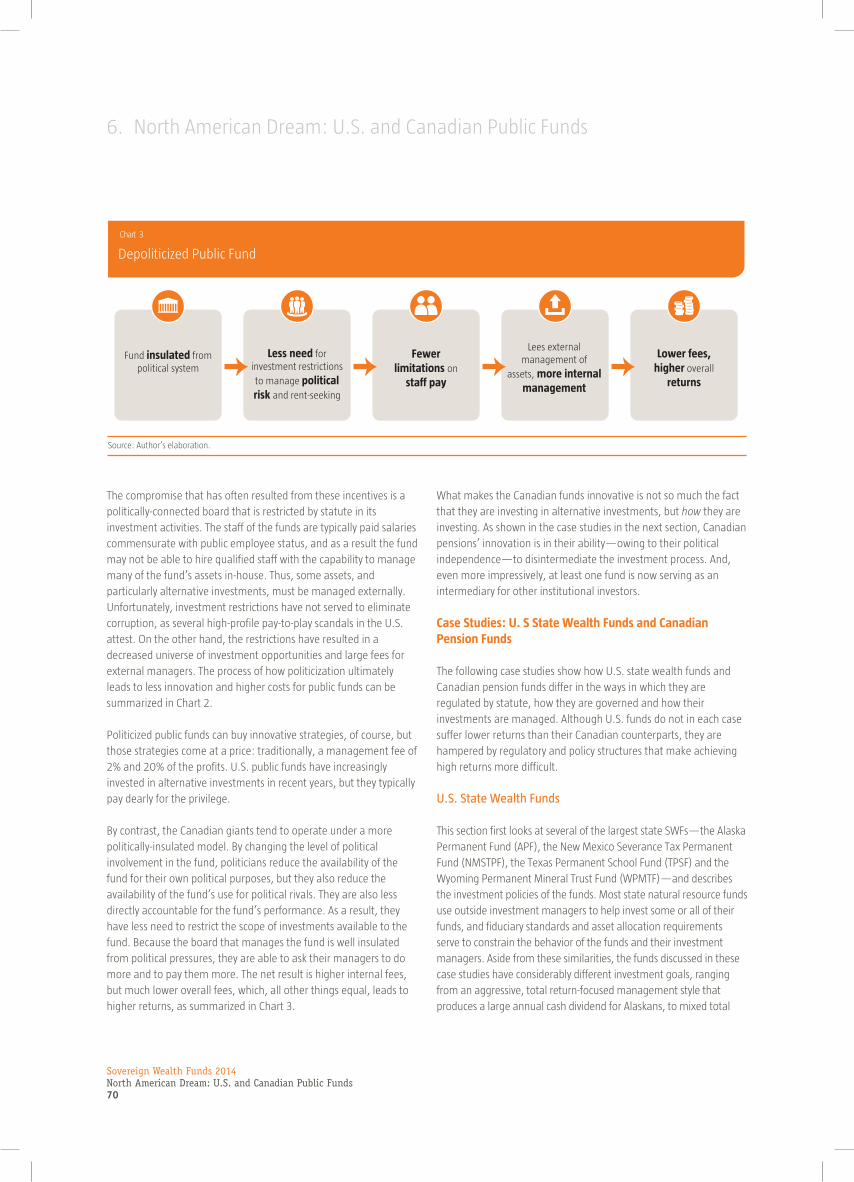
Sovereign Wealth Funds 2014North American Dream: U.S. and Canadian Public Funds70
6. North American Dream: U.S. and Canadian Public Funds
they are politically linked to the fund, they become more accountable
for its performance.
Source: Alaska Permanent Fund (2014)
Chart 1
Alaska Permanent Fund Dividends(1982-2013)
Source: Author’s elaboration.
Chart 2
Politicized Public Fund
0
500
1,000
1,500
2,000
2,500
1985 1990 1995 2000 2005 2010
Limitations on pay of fund
staff
External management of
assets
Higher fees, lower
overall returns
Fund directly
governed within political system
Source: Author’s elaboration.
Chart 3
Depoliticized Public Fund
Investment restrictions to limit the
risk of politically-damaging
losses and to limit interest group influence
Fewer limitations on
staff pay
Lees external management of
assets, more internal management
Lower fees, higher overall
returns
Fund insulated from political system
Less need for investment restrictions
to manage political risk and rent-seeking
Dollars
.
The compromise that has often resulted from these incentives is a
politically-connected board that is restricted by statute in its
investment activities. The staff of the funds are typically paid salaries
commensurate with public employee status, and as a result the fund
may not be able to hire qualified staff with the capability to manage
many of the fund’s assets in-house. Thus, some assets, and
particularly alternative investments, must be managed externally.
Unfortunately, investment restrictions have not served to eliminate
corruption, as several high-profile pay-to-play scandals in the U.S.
attest. On the other hand, the restrictions have resulted in a
decreased universe of investment opportunities and large fees for
external managers. The process of how politicization ultimately
leads to less innovation and higher costs for public funds can be
summarized in Chart 2.
Politicized public funds can buy innovative strategies, of course, but
those strategies come at a price: traditionally, a management fee of
2% and 20% of the profits. U.S. public funds have increasingly
invested in alternative investments in recent years, but they typically
pay dearly for the privilege.
By contrast, the Canadian giants tend to operate under a more
politically-insulated model. By changing the level of political
involvement in the fund, politicians reduce the availability of the
fund for their own political purposes, but they also reduce the
availability of the fund’s use for political rivals. They are also less
directly accountable for the fund’s performance. As a result, they
have less need to restrict the scope of investments available to the
fund. Because the board that manages the fund is well insulated
from political pressures, they are able to ask their managers to do
more and to pay them more. The net result is higher internal fees,
but much lower overall fees, which, all other things equal, leads to
higher returns, as summarized in Chart 3.
What makes the Canadian funds innovative is not so much the fact
that they are investing in alternative investments, but how they are
investing. As shown in the case studies in the next section, Canadian
pensions’ innovation is in their ability—owing to their political
independence—to disintermediate the investment process. And,
even more impressively, at least one fund is now serving as an
intermediary for other institutional investors.
case Studies: u. S State wealth funds and canadian Pension funds
The following case studies show how U.S. state wealth funds and
Canadian pension funds differ in the ways in which they are
regulated by statute, how they are governed and how their
investments are managed. Although U.S. funds do not in each case
suffer lower returns than their Canadian counterparts, they are
hampered by regulatory and policy structures that make achieving
high returns more difficult.
U.S. State Wealth Funds
This section first looks at several of the largest state SWFs—the Alaska
Permanent Fund (APF), the New Mexico Severance Tax Permanent
Fund (NMSTPF), the Texas Permanent School Fund (TPSF) and the
Wyoming Permanent Mineral Trust Fund (WPMTF)—and describes
the investment policies of the funds. Most state natural resource funds
use outside investment managers to help invest some or all of their
funds, and fiduciary standards and asset allocation requirements
serve to constrain the behavior of the funds and their investment
managers. Aside from these similarities, the funds discussed in these
case studies have considerably different investment goals, ranging
from an aggressive, total return-focused management style that
produces a large annual cash dividend for Alaskans, to mixed total

Sovereign Wealth Funds 2014North American Dream: U.S. and Canadian Public Funds
71
return and social investment strategies in Wyoming and New Mexico.
A large percentage of assets are managed by external managers.
Some states may have more than one fund in operation. For
example, a state may have both a land grant SWF and a severance
tax SWF. State trust lands are typically invested through an
investment division operating within the state’s land management
department or the state’s education department, or, in the case of
states with a severance tax fund, both of the state’s natural resource
funds are managed by a single investment entity that may operate
as a stand-alone entity. In Texas, for example, the Permanent
School Fund (PSF) is managed by the State Board of Education,
while the administrative activities for the PSF are handled by an
investment division of the Texas Education Agency. In New Mexico,
on the other hand, both the Land Grant Permanent Fund and the
Severance Tax Permanent Fund investments are managed by the
State Investment Council (SIC).
Because the income generated by the funds is typically dedicated to
various public entity beneficiaries, land grant funds traditionally do
not invest funds in social programs. Texas is an exception to this rule,
however, as legislation passed in 2007 allows the State Land
Commissioner to designate some funds that would have been
deposited in the PSF to be redirected to a “real estate special fund
account,” and also expanded the PSF’s investment authority, allowing
the PSF to invest in “land; interests in real property for biological,
commercial, geological, cultural or recreational purposes... [to make
investments] to protect, maintain, or enhance the value of public
school lands; [or, to make investments to] acquire... an investment or
interest in public infrastructure, or other interests” 17.
The New Mexico Severance Tax Permanent Fund 18
Target Asset Allocation18
Broad U.S. Equity 31%
Broad International Equity 15%
Fixed Income 16%
Real Return 10%
Core Real Estate 10%
Absolute Return 8%
Private Equity 10%
17 tex. nat. reS. code ann. § 51.402 (West 2007).18 N. M. STATE INV. COUNCIL, JANUARY 2014-JUNE 2015 ANNUAL INVESTMENT PLAN (2014), available at http://www.sic.state.nm.us/uploads/files/2014%20Annual%20Plan%20Public.pdf.
New Mexico’s State Investment Council (SIC) is tasked with
management of the NMSTPF. As is generally true for state and
provincial SWFs, the SIC and its external managers are obligated by
statute to apply a “prudent investor” standard of care. The SIC
“seeks to manage the Funds to ensure that future generations
receive the same or greater benefits as current beneficiaries, while
maximizing current distributions through time to provide current
revenue sources to the state’s General Fund. Total return, which
includes realized and unrealized gains, plus income, less expenses,
is the primary goal of the Funds” 19.
Notwithstanding this basic total return focus, the investment
activities of the SIC from STPF funds are complicated by numerous
statutory imperatives. When the STPF was formed, New Mexico’s
legislature created a patchwork of investment targets for the STPF,
with a specific social policy associated with each type of investment
target. While most investments are designed to maximize a risk-
adjusted rate of return, these economically targeted investments
are designed to “first obtain a risk-adjusted rate of return under the
Prudent Investor Rule, and second, to enhance the economy of New
Mexico” 20 . To make sure these objectives are achieved while
minimizing the risk of wasteful or corrupt investments, the fund
managers are required, among other things, to ensure that the
investments will stimulate the economy of New Mexico on a
continuing basis, expand business activity in the state, and promote
the creation and preservation of jobs.
The investment criteria for the NMSTPF’s other investments are
relatively standard and similar to those employed by other large
institutional investors. The investment policies set out a list of
“permitted investments,” for example, and set asset allocation
targets. The investment policies place limitations on the type of
equity securities that may be owned, for instance, and restrict the
percentage of ownership of any given company. On the other hand,
the list of economically-targeted investments over the course of the
life of the fund reveals a remarkable effort at social engineering on
the state level, with some of the investments paralleling federal
efforts. Among other things, the SIC has invested in mortgage pass-
through securities (stimulating the mortgage market and increasing
home ownership levels), New Mexico small businesses and the New
Mexico film industry (which one clever observer has dubbed
“Tamalewood”).
19 N. M. State inV. council, inVeStment Policy Statement (2012), available at http://www.sic.state.nm.us/uploads/FileLinks/47799e8b33064817a9838767216d86af/2012_07_24_NM_SIC_Investment_Policy.pdf.20 Id. at 25.

Sovereign Wealth Funds 2014North American Dream: U.S. and Canadian Public Funds72
6. North American Dream: U.S. and Canadian Public Funds
The Wyoming Permanent Mineral Trust Fund 21
Target Asset Allocation21
Large Cap U.S. Equity 15.0%
Small Cap U.S. Equity 3.0%
International Equity 13.0%
Private Equity 4.0%
Real Estate 7.5%
Absolute Return 7.5%
Convertibles 2.0%
Fixed Income 45.0%
Cash Equivalents 3.0%
Wyoming also has multiple objectives for its severance tax fund
investment program. The general policy for Wyoming trust funds
requires the State Loan and Investment Board and its external
managers to invest public funds “in a manner that strives for
maximum safety, provides adequate liquidity to meet all operating
requirements, and achieves the highest possible investment return
consistent with the primary objectives of safety and liquidity” 22.
Wyoming has set out by statute a set of permissible investments and
investment allocations, but the statutes contain only two minor
restrictions on investments. First, only up to 55% of the fund may be
invested in common stocks. Second, prior board approval must be
obtained before the state is allowed to invest in “alternative
investments.” The Board’s investment policy adds to these
restrictions by prohibiting self-dealing transactions, floating rate
securities, individual certificates of deposit, letter stock and other
unregistered equity, commodities (if not part of an alternative
investment), most real estate transactions, natural resource
properties, and short sales and margin transactions. Derivatives may
be used to manage risk, but “managers must review their use of
derivatives with the Board prior to employing derivative tactics” 23.
Like New Mexico, Wyoming’s statutes also expressly permit state
natural resource funds to invest in various investments that further
targeted social policies. Among other things, the state treasurer is
permitted to invest (or in some cases, pledge) up to $25 million in
non-delinquent federally guaranteed or insured higher education
21 STATE LOAN & INV. BD., WYO., MASTER INVESTMENT POLICY AND SUB-POLICIES 23 (2012), available at http://treasurer.state.wy.us/pdf/investmentpolicy120612.pdf22 Id. at 1.23 Id. at 9.
loans from any nonprofit Wyoming corporation organized to acquire
such loans; up to $300 million from the common school account in
the permanent land fund to guarantee school district bonds; up to
$100 million to guarantee local government bonds; and, “to
promote economic development,” the state treasurer may invest up
to $100 million in industrial development bonds issued by joint
powers boards, municipalities or counties. The state treasurer may
not invest more than $50 million “for a specific public purpose
authorized or directed by the legislature” 24, although the amount
may be adjusted by recommendation of the state treasurer and
approval by a Board subcommittee on capital financing and
investments.
The state investment policy also sets out various portfolio guidelines.
For example, the state may only own 1% or less of the common
stock of any corporation, and only up to 1.5% of the total book value
of the funds may be invested in the common stock of any
corporation. Like many funds—and particularly state-owned
funds—Wyoming also faces the challenge of matching its
investment policy to its fiduciary duties when a higher return may be
generated with investments that are at odds with other social,
ethical and political goals. In a somewhat convoluted provision, the
state investment policy states that “while the Board cannot make
investments based on social or political objectives, it does consider
the economic effects of social and humanitarian issues in the
analysis of investments. The Board seeks to avoid investments that
support terrorism or the violation of human rights.”
The Alaska Permanent Fund
The Alaska Permanent Fund is directly overseen by the Alaska
Permanent Fund Corporation (APFC), a state-owned entity that
operates as a “quasi-independent state entity, designed to be
insulated from political decisions yet accountable to the people as a
whole” 25. The APFC retains direct political accountability through an
annual APFC report to the Legislative Budget and Audit Committee,
and through approval of the APFC budget by the Alaska Legislature.
As discussed above, the distinguishing feature of Alaska’s fund is
that a significant portion of the income generated by the fund is
paid out to Alaskan citizens in the form of an annual dividend. The
dividend is paid out according to a specific formula set out by
statute 26. After this calculation, a determination is made as to
whether there are sufficient funds in the earnings reserve account to
pay the dividend. The dividend may not be paid out of the principal.
For many Alaskans, particularly native Alaskans and those in rural
Alaska, the dividend is a major source of income.
24 Wyo. Stat. Ann. § 9-4-715(n) (West 1977).25 alaSka Permanent Fund corP., an alaSkan’S guide to the Permanent Fund 31 (2009), available at http://www.apfc.org/home/Media/publications/2009AlaskansGuide.pdf.26 Roughly speaking, the dividend is calculated by averaging the net income of the APF over the past 5 years, multiplied by 21%, divided by 2, then divided by the number of eligible applicants.

Sovereign Wealth Funds 2014North American Dream: U.S. and Canadian Public Funds
73
Target Asset Allocation (APF) 27
risk class asset class risk class target asset class target
Cash and Interest Rates 6%
Cash 1.2%
U.S. Government Bonds and International Developed Government Bonds (currency hedged)
4.8%
Company Exposure 55%
Global Credit 11%
Public/Private Credit 2%
Global Equity 36%
Private Equity 6%
Real Assets 19%
Real Estate 12%
Infrastructure 4%
U.S. Treasury Inflation Protected Securities 3%
Special Opportunities 20%
Absolute Return Mandate 6%
Real Return Mandate 7%
Emerging Markets Multi-Asset 2%
Fixed-income Domestic Aggregate 2%
Other (debt opportunities and true special opportunities) 2%
In the early years of the APF, the fund’s investment policy was
based on traditional asset allocation techniques, and was heavily
invested in bonds. However, in 2009, the Board of Trustees
“recognized that some investments might have more in common
with investments from other asset classes with regard to their
expected levels of risk and return.” For example, corporate
bonds may not act like U.S. Treasuries as much as they act like
stock; “this makes sense when you consider that the companies
that issue these corporate bonds are the same companies traded
in the stock markets.” Under its new strategy, the Board thus
determined to group assets by risk characteristics, rather than by
asset class. So rather than grouping assets as stocks, bonds,
cash, etc., the APF now classifies investments as “Cash,”
“Interest Rates,” “Company Exposure,” “Real Assets,” and
“Special Opportunities.” “Cash” includes liquid instruments with
durations of less than twelve months. “Interest rates” includes
low credit-risk securities such as U.S. Treasury bonds and non-
U.S. government bonds. “Company Exposure” includes
investment grade and high-yield bonds, U.S. and foreign stocks,
bank loans and private equity investments. “Real Assets”
includes real estate, infrastructure and Treasury inflation
protected securities (TIPS). The “Special Opportunities” category
includes, among other things, absolute return assets, distressed
debt and commercial mortgage-backed securities. 27
The Texas Permanent School Fund
The investment policies of the TPSF, the largest North American
fund next to the Alaska Permanent Fund, are limited by what
seems to be a fairly restrictive statutory framework. Under the
Texas Administrative Code, the TPSF may only invest in certain
“permissible investments.” However, the definition lists fairly
standard, modern and broad categories of investments, including
stocks on national or well-known exchanges, fixed income, private
equity, “absolute return” investments, “real return” investments,
“risk parity” investments and cash equivalents. The State Board of
Education, which has fiduciary responsibility for the management
of the TPSF, may allow for other investments, provided the
investment is consistent with TPSF goals and objectives. The target
asset allocation in 2013 reflected a high number of alternative
investments.
27 ALASKA PERMANENT FUND CORP., ALASKA PERMANENT FUND CORPORATION INVESTMENT POLICY 8-9 (2014), available at http://www.apfc.org/home/Media/investments/20140521InvestmentPolicy.pdf.

Sovereign Wealth Funds 2014North American Dream: U.S. and Canadian Public Funds74
6. North American Dream: U.S. and Canadian Public Funds
Target Asset Allocation (TPSF) 28
EQUITY
Domestic Small/Mid Cap 7%
Domestic Large Cap 18%
Total Domestic Equity 25%
International Developed and Emerging Large Cap 18%
International Small/Mid Cap 0%
Emerging International Equities 3%
Total International Equity 21%
Total Public Market Equity 46%
FIXED INCOME
Core Fixed Income 12%
Emerging Market Debt 5%
Total Fixed Income 17%
ALTERNATIVE INVESTMENTS
Absolute Return 10%
Real Estate 8%
Private Equity Investments 6%
Risk Parity 7%
Real Return 6%
Total Alternative Investments 37%
The statute also sets out a list of prohibited investments, including,
among other things, short sales, restricted stock, buying or selling
on margin, options, commodities futures, precious metals, or
buying common stock or fixed income securities in a single
corporation in an amount exceeding 2.5% of the TPSF total market
value or 5.0% of the manager’s total portfolio market value. 28
While the TPSF statutory framework seems firmly entrenched in
the legal list era of public fund investing, it is important to note
that the TPSF does not have a statutorily mandated asset
allocation, which allows it more freedom in selecting investments.
In the pension fund statutes of many jurisdictions, on the other
hand, legal lists of permitted and prohibited investments were
coupled with strict asset allocation standards in an effort to reduce
the risk of mismanagement and loss. This risk reduction comes at
a price, however, as managers are constrained in their investment
choices and may actually have more difficulty in meeting their
28 TEXAS PERMANENT SCHOOL FUND, COMPREHENSIVE ANNUAL FINANCIAL REPORT 20 (2013), available at http://www.tea.state.tx.us/index4.aspx?id=2147489178&.
fiduciary duties to prudently manage the fund. Managers cannot
easily alter poorly performing investment strategies particularly
when investment restrictions are enshrined in statutes. This
inflexibility costs many funds dearly during the Financial Crisis, as
traditional asset allocation strategies, often mandated by statute,
proved disastrously inappropriate. CalPERS, for example, lost an
astounding $100 billion in eighteen months when its asset
allocation strategy failed 29.
Canadian Public Pensions
Although the Canadian giants have fewer explicit restrictions than
the U.S. wealth funds described above, the pension funds employ
asset allocations targets as a part of good fund governance practice.
The striking difference is, of course, in the Canadian funds’ direct
(rather than intermediated) use of alternative investments and
direct investments, as described below.
29 Ashby Monk, Factor Based Allocation Strategies (Feb. 10, 2011), http://www.investmentreview.com/expert-opinion/factor-based-allocation-strategies-5128.

Sovereign Wealth Funds 2014North American Dream: U.S. and Canadian Public Funds
75
Ontario Teachers’ Pension Plan
The OTPP diversifies its investments across four broad asset classes:
equities, fixed income, natural resources (including commodity
derivatives and physical assets such as timber and oil) and real
assets (including real estate and infrastructure). As a pension fund,
OTPP must maintain adequate liquidity to ensure that it is able to
meet its current liabilities. However, it also maintains liquidity and
to “opportunistically acquire assets in a cost-effective manner 30.” 31
Target Asset Allocation (OTPP)31
asset class minimum Goal maximum
Equities 39% 44% 49%
Fixed income 36% 48% 56%
Natural resources 3% 8% 13%
Real assets 18% 23% 28%
Money market* (26)% (23)% (16)%
* Money-market activity provides funding for investments in all asset classes, and is comparable to a treasury department in a corporation.
The OTPP is also one of the best-known “responsible” investors in
the world. It is a signatory to the UN Principles for Responsible
Investment and objectively evaluates investments against “financial
and non-financial factors, including risks associated with
environmental, social and governance (ESG) issues, because we
believe they can materially impact the value of our investments 32.”
One of the most surprising investments by OTPP in recent years—
and yet, completely consistent with its commitment to corporate
governance issues—is its acquisition of proxy advisor Glass Lewis,
the number two competitor in the corporate governance industry
behind market leader Institutional Shareholder Services. And
unsurprisingly, when OTPP looked to diversify the ownership base of
Glass Lewis in 2013 by selling a 20% stake in the firm, it looked to a
like-minded, Canadian public fund investor: AIMCo.
30 ontario teacherS’ PenSion Plan, 2013 annual rePort 20 (2013).31 ontario teacherS’ PenSion Plan, Statement oF inVeStment PolicieS and ProcedureS For ontario teacherS’ PenSion Plan 6 (2014), Available at http://www.otpp.com/documents/10179/20940/-/72Ae966f-7Aa9-40Ae-B8fa-3642E76597df/Statement%20Of%20Investment%20Policies%20&%20Procedures%202013.pdf.32 Id at 21. OTPP notes that “[w]hile responsible investing does not preclude ownership of assets that some plan members may find objectionable, it does mean Teachers’ considers all material ESG risks and opportunities in selecting and managing assets.” Id.
PSP Investments
PSP’s statutory mandate is to “manage the amounts transferred to
it in the best interests of contributors and beneficiaries under the
Plans; and to maximize returns without undue risk of loss, having
regard to the funding, policies and requirements of the Plans and
the ability of those Plans to meet their financial obligations 33.”
PSP’s guiding philosophy consists of two pillars: the Policy Portfolio,
which sets the strategic asset allocation for the fund, and active
management activities. The Policy Portfolio sets out the following
target allocations.
PSP defines active management as those activities that deviate from
the approved Policy Portfolio, and that are used to supplement the
returns of the Policy Portfolio within an active risk budget. The active
management program can be thought of as an internal hedging
strategy, because PSP “seeks to minimize over time the correlation
of returns between the Active Portfolio and the Policy Portfolio 34.”
Reviewing the Policy Portfolio allocations, it is clear that PSP does
not engage in alternative investments as a sideshow to a larger,
standardized asset allocation strategy. Instead, alternative
investments are baked in to the Policy Portfolio itself, and PSP then
uses active management strategies to further diversify its
investments and risk allocation.
Target Asset Allocation (PSP)35
asset class target weight
World Equity
Public Market Equity 40%
Private Equity 14%
Real Return Assets
Real Estate 13%
Infrastructure 13%
World Inflation-Linked Bonds 5%
Renewable Resources 2%
Nominal Fixed Income
Fixed Income 11%
Cash & Cash Equivalents 2%
33 Pub. Sector PenSion inV. bd., 2013 annual rePort 12 (2013).34 Id at 6.35 Pub. Sector PenSion inVS., STATEMENT OF INVESTMENT POLICIES, STANDARDS AND PROCEDURES FOR ASSETS MANAGED BY THE PUBLIC SECTOR PENSION INVESTMENT BOARD 14 (2013).
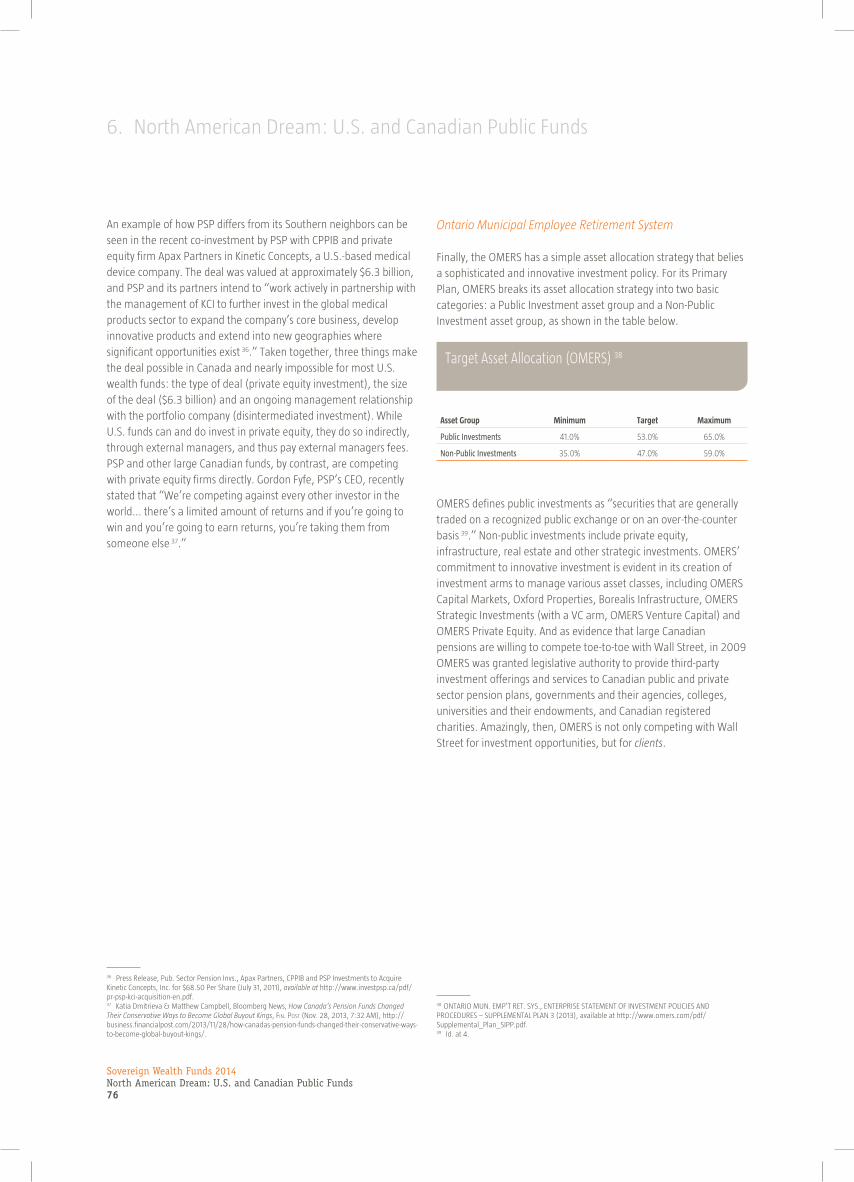
Sovereign Wealth Funds 2014North American Dream: U.S. and Canadian Public Funds76
6. North American Dream: U.S. and Canadian Public Funds
Ontario Municipal Employee Retirement System
Finally, the OMERS has a simple asset allocation strategy that belies
a sophisticated and innovative investment policy. For its Primary
Plan, OMERS breaks its asset allocation strategy into two basic
categories: a Public Investment asset group and a Non-Public
Investment asset group, as shown in the table below. 38
Target Asset Allocation (OMERS) 38
asset Group minimum target maximum
Public Investments 41.0% 53.0% 65.0%
Non-Public Investments 35.0% 47.0% 59.0%
OMERS defines public investments as “securities that are generally
traded on a recognized public exchange or on an over-the-counter
basis 39.” Non-public investments include private equity,
infrastructure, real estate and other strategic investments. OMERS’
commitment to innovative investment is evident in its creation of
investment arms to manage various asset classes, including OMERS
Capital Markets, Oxford Properties, Borealis Infrastructure, OMERS
Strategic Investments (with a VC arm, OMERS Venture Capital) and
OMERS Private Equity. And as evidence that large Canadian
pensions are willing to compete toe-to-toe with Wall Street, in 2009
OMERS was granted legislative authority to provide third-party
investment offerings and services to Canadian public and private
sector pension plans, governments and their agencies, colleges,
universities and their endowments, and Canadian registered
charities. Amazingly, then, OMERS is not only competing with Wall
Street for investment opportunities, but for clients.
38 ONTARIO MUN. EMP’T RET. SYS., ENTERPRISE STATEMENT OF INVESTMENT POLICIES AND PROCEDURES – SUPPLEMENTAL PLAN 3 (2013), available at http://www.omers.com/pdf/Supplemental_Plan_SIPP.pdf.39 Id. at 4.
An example of how PSP differs from its Southern neighbors can be
seen in the recent co-investment by PSP with CPPIB and private
equity firm Apax Partners in Kinetic Concepts, a U.S.-based medical
device company. The deal was valued at approximately $6.3 billion,
and PSP and its partners intend to “work actively in partnership with
the management of KCI to further invest in the global medical
products sector to expand the company’s core business, develop
innovative products and extend into new geographies where
significant opportunities exist 36.” Taken together, three things make
the deal possible in Canada and nearly impossible for most U.S.
wealth funds: the type of deal (private equity investment), the size
of the deal ($6.3 billion) and an ongoing management relationship
with the portfolio company (disintermediated investment). While
U.S. funds can and do invest in private equity, they do so indirectly,
through external managers, and thus pay external managers fees.
PSP and other large Canadian funds, by contrast, are competing
with private equity firms directly. Gordon Fyfe, PSP’s CEO, recently
stated that “We’re competing against every other investor in the
world... there’s a limited amount of returns and if you’re going to
win and you’re going to earn returns, you’re taking them from
someone else 37.”
36 Press Release, Pub. Sector Pension Invs., Apax Partners, CPPIB and PSP Investments to Acquire Kinetic Concepts, Inc. for $68.50 Per Share (July 31, 2011), available at http://www.investpsp.ca/pdf/pr-psp-kci-acquisition-en.pdf.37 Katia Dmitrieva & Matthew Campbell, Bloomberg News, How Canada’s Pension Funds Changed Their Conservative Ways to Become Global Buyout Kings, Fin. PoSt (Nov. 28, 2013, 7:32 AM), http://business.financialpost.com/2013/11/28/how-canadas-pension-funds-changed-their-conservative-ways-to-become-global-buyout-kings/.

Sovereign Wealth Funds 2014North American Dream: U.S. and Canadian Public Funds
77
conclusion
While North American public funds share a common goal of
maximizing risk-adjusted returns, they show a remarkable diversity
in how they are regulated, how they invest and—at least in the case
of Alaska—how they pay out their earnings. In a well-known
corporate law text, Yale law professor Roberta Romano argued that
the “genius of American corporate law is in its federalist
organization 40.” A central point of her argument was that the
diversity of approaches from state to state—the experimentation in
governance and legal frameworks—provides a useful benefit to
society. States and citizens can evaluate the effects of other
jurisdictions’ regulatory systems. Efficient and fair approaches can
be adopted, and wasteful and unsuccessful approaches abandoned.
The same can be said for North American public funds. Provinces
and states use a variety of governance and investment approaches,
and by examining and discussing the performance of these
approaches, the legislators and fund fiduciaries can learn from one
another how to best serve their current and future citizens. This
knowledge will be essential as states and provinces struggle to pay
retirement and healthcare benefits, and more states and provinces
consider the creation of SWFs to smooth revenues, stimulate local
economies and provide for future generations.
40 roberta romano, the geniuS oF american corPorate laW 1 (1993).


IISector Analysis
II

Sovereign Wealth Fund Investment in Infrastructure
Victoria Barbary
Director, Institutional Investor's Sovereign Wealth Center
Non-Resident Fellow, ESADEgeo - Center for Global Economy and Geopolitics (ESADEgeo)

Sovereign Wealth Fund Investment in Infrastructure
Victoria Barbary
Director, Institutional Investor's Sovereign Wealth Center
Non-Resident Fellow, ESADEgeo - Center for Global Economy and Geopolitics (ESADEgeo)
Sovereign Wealth Funds 2014Sovereign Wealth Fund Investment in Infrastructure
81

Sovereign Wealth Funds 2014Sovereign Wealth Fund Investment in Infrastructure82
7. Sovereign Wealth Fund Investment in Infrastructure
introduction
Sovereign wealth funds have invested in infrastructure for over 20
years, but since 2006 they have become more interested in the
sector. Sovereign wealth funds believe the return profiles of
infrastructure investments match their long-term liabilities and
intergenerational savings mandates, while the inelastic demand for
infrastructure service implies bond-like, steady and inflation-hedged
cash flows. Most importantly, the risk-return characteristics of
infrastructure are intended to be a source of portfolio diversification
as the asset class has an apparently low correlation with traditional
assets like stocks and bonds.
This chapter addresses how sovereign wealth funds approach
infrastructure investing. The analysis excludes other state
investment vehicles and sovereign funds that have been established
to invest at home to develop the local economy. These have to take
into account a whole other set of considerations, which have to
offset financial returns with the impact it has on citizen welfare and
local economic development 1.
challenges faced by Sovereign wealth funds in infrastructure
Traditionally, sovereign wealth funds have gained exposure to
infrastructure through private-equity style funds. But as they have
become more experienced players in the sector they have become
aware of the shortcomings of this type of vehicle for investing in
infrastructure.
At the top of the list of sovereign wealth funds’ gripes about the
private equity-style structure is a potential mismatch in interests
between investors and fund managers. The role of managers is to
package infrastructure assets in a way that aligns with institutional
investors’ risk and volatility tolerances, as well as delivering returns
over timeframes that match their investment horizons. But in the
mid-2000s boom it was not uncommon for managers to ramp up
leverage and the number of riskier assets in the portfolio to increase
the value of their options, rather than prioritizing the interests of
their investors 2. Consequently, according to research undertaken for
the European Investment Bank, investors “felt ‘mis-sold’ when they
were looking for stable, long-term income... but ended up with a
highly leveraged, high-risk fund” 3. This concern exacerbated
sovereign funds’ downward pressure on management fees, which
many believe do not accurately reflect the value the managers add
to the portfolio.
1 Walt Schubert, “Sovereign Wealth Funds and Dedicated Infrastructure Investment,” Journal of Applied Business and Economics 12(6), pp.32-39 (2011).2 Further analysis of this challenge can be found in Gordon Clark, Ashby HB Monk, Ryan Orr and William Scott, “The New Era of Infrastructure Investing”, Pensions: An International Journal, 17, pp. 103-111 (May 2012).3 Georg Inderst, “Infrastructure as an Asset Class”, EIB Papers 15(1), p.97 (2010).
Sovereign wealth funds have also highlighted that there is a
mismatch between the 10-year duration of most private-equity-style
infrastructure funds and the longer return horizons of some of the
assets 4. John McCarthy, ADIA’s global head of infrastructure, told
Institutional Investor’s Sovereign Wealth Center that “One of the
benefits of being a long-term investor, with different liabilities from
more-traditional investors, is the tremendous flexibility you have to
buy and sell when the time is right, not when you are forced to 5.”
Disconnecting the timespan of the fund from the return profile of
the assets undermines sovereign wealth funds’ competitive
advantage in this space and limits their ability to realize the
maximum gain from the assets over their investment horizon.
The obvious alternative to committing to funds is investing directly,
which provides the sovereign wealth fund a greater degree of
control without having to pay high management fees. Insourcing
infrastructure allocation and management has been a growing
trend among sovereign funds, for instance the Abu Dhabi
Investment Authority (ADIA) and Singapore’s GIC, are large-scale,
direct infrastructure investors. ADIA’s strategy in the sector –to
acquire “minority equity stakes alongside proven partners, with an
emphasis on developed markets 6” – is a stark contrast to the
management of its traditional assets, which is largely outsourced.
ADIA now holds stakes in London’s Gatwick Airport, Norway’s
Gassled gas pipelines, Open Grid Europe, which operates about
12,000 kilometers (7,450 miles) of gas transmission pipes in
Germany, and three major ports in Australia.
There are, however, many challenges to investing directly in
infrastructure. Although sovereign wealth funds can easily mobilize
enough resources to invest in large infrastructure projects, at a
strategic level, they must consider whether the portfolio
concentration and illiquidity risk of a single big-ticket infrastructure
asset can be tolerated by their liabilities, liquidity needs and
mandated risk profile. An important part of this decision is an
assessment of the hurdle rate: What return does an investment
need to make to compensate for these factors? Most sovereign
funds will be looking for internal rates of return of between 8
percent and 9 percent, but outside of the energy sector, such
returns are often difficult to find particularly as the valuations of
high-quality assets increases with competition 7.
At a practical level sovereign wealth funds need to be able to attract
the talent to become a world-class infrastructure investor. ADIA and
GIC have had the money and reputation to build a department with
4 Georg Inderst, “Infrastructure as an Asset Class”, EIB Papers 15(1), p.97 (2010).5 Victoria Barbary, “Building Bridges: Sovereign Wealth Fund Partnerships in Real Estate and Infrastructure Development Projects,” Institutional Investor’s Sovereign Wealth Center, March 17, 2014. http://www.sovereignwealthcenter.com/Article/3320082/portfolio-strategy/Building-Bridges-Sovereign-Wealth-Fund-Partnerships-in-Real-Estate-and-Infrastructure-Development.html6 Abu Dhabi Investment Authority, 2011 Review.7 Edward Russell-Walling, “Infrastructure Goes Down the Capital Markets Road,” Financial News, January 13, 2014.

Sovereign Wealth Funds 2014Sovereign Wealth Fund Investment in Infrastructure
83
broad mix of experienced professionals since they started investing
in infrastructure in 2007 and 2006 respectively. But finding and
securing the right people with appropriate skills, often on public-
servant salaries, can be challenging. Moreover, when trying to
attract talent, sovereign wealth funds have to be careful not to
replicate the principal-agent problems apparent in the third-party
management model, by ensuring incentives are aligned with the
desired returns and the aims of the broader organization.
Securing assets is also becoming harder for sovereign wealth funds
as competition heats up. From 2006 to 2012 sovereign wealth
funds faced little competition when they looked to invest directly in
established infrastructure assets in developed markets. The high
financial barriers to entry – infrastructure projects are big-ticket
items – meant that a relatively small pool of investors could play in
this space, particularly following the financial crisis when the
previously dominant investment banks pulled back to shrink their
balance sheets to meet Basel III requirements.
The landscape changed during 2013. With bond yields remaining at
historic lows, other institutional investors, like pension funds and
endowments, turned to infrastructure to generate higher low-risk,
consistent, long-term returns. Sovereign wealth funds also stated
facing competition from commercial enterprises in the sector. Many
companies have been sitting on cash reserves since the financial
crisis as they have struggled to find attractive investment
opportunities, and are now seeking to deploy this capital. As a
result, sovereign wealth funds foreign direct infrastructure
investment more than halved from $7.5 billion in 2012 to $3.0
billion in 2013.
The increased competition has driven valuations up. In April 2014, a
consortium led by Australian toll road operator Transurban Group,
which included ADIA, agreed to acquire Queensland Motorways,
which operates less than 40 miles of toll roads in the Australian
state. The company’s sale by the Queensland government attracted
bids from four consortiums, each of which had the backing of a
sovereign wealth fund, which ratcheted up the price. Ultimately the
Transurban consortium agreed to pay $7.05 billion ($6.55 billion)
for the company – 28 times annual earnings before interest, tax,
depreciation and amortization 8.
The experience of the Kuwait Investment Authority (KIA) offers a
good example of the challenges sovereign wealth funds face when
investing directly in infrastructure. In April 2013 the fund established
a new London-based company, Wren House Infrastructure
Management, to invest directly in infrastructure. KIA staffed Wren
House with two former Bank of America Merrill Lynch investment
8 Brett Cole, “Transurban group to pay $7.05bn for Qld Motorways,” The Australian, April 23, 2014.
bankers: Hakim Drissi-Kaitouni as head of the new subsidiary and
Marc Keller as associate.
Despite hiring top-notch talent, the Kuwaiti fund has yet to secure a
single direct infrastructure investment. It partnered with pension
funds in two failed public-to-private buyouts – one for London-listed
water utility Severn Trent and another for Sydney Airport Holdings –
and has lost out to its regional peers in two major Australian deals
in 2014. KIA-supported investor groups lost out to an Abu Dhabi
Investment Council-backed consortium for Royal Dutch Shell’s
Australian oil refinery and filling stations, and to the Transurban-led
consortium part-funded by ADIA for Queensland Motorways 9.
KIA’s experience illustrates the challenges sovereign wealth funds
face when identifying appropriate targets and selecting the right
partners, even with an experienced team. The fund’s failure to
secure a direct investment in developed markets has also shown
how rising competition for infrastructure in these economies has
made assets harder to secure than they were two years ago.
Sovereign wealth funds also face asset-related challenges to
investing directly. There are many attractive long-term infrastructure
opportunities in demanding emerging markets, for example in sub-
Saharan Africa, where there is a substantial infrastructure deficit, a
fast-growing economy, rapid urbanization and an increasing and
more-affluent population. These opportunities have strong
fundamentals but require local knowledge and contacts to navigate
local bureaucracy, legal jurisdiction and political networks. For many
sovereign funds, such opportunities remain shut without the help of
local specialists.
In some developed markets there are also other barriers to entry,
particularly in more strategic infrastructure sectors such as
telecommunications, where direct foreign state-owned investors are
not welcomed. For instance, in the U.S., the China Investment
Corporation (CIC) has been “politely asked to look elsewhere, even
when the investment represents only a small stake of an
infrastructure asset,” according to Gao Xiqing, CIC’s former vice
chairman and president, speaking at the Economic Club of New York
in October 2012.
In such situations, if sovereign funds want exposure in these
markets, often the best way is through third-party managed funds.
Sovereign Wealth Center data appears to support the hypothesis
that sovereign wealth funds appear to favor gaining U.S.
infrastructure exposure through externally managed funds: 36
percent of all sovereign wealth fund allocations to infrastructure
9 Institutional Investor’s Sovereign Wealth Center, Prisoners of Fortune: Sovereign Wealth Fund Investment Trends in 2013. http://www.sovereignwealthcenter.com/quarterly-reports.html

Sovereign Wealth Funds 2014Sovereign Wealth Fund Investment in Infrastructure84
7. Sovereign Wealth Fund Investment in Infrastructure
sovereign wealth fund may choose to invest in publicly listed
infrastructure funds, including mutual and exchange-traded funds,
or in publicly listed infrastructure companies. Equities in companies
that operate in the infrastructure sector appear to have relative
stability in comparison to other major asset classes 12, and can
provide sovereign wealth funds with tailored and liquid exposure to
infrastructure.
However, listed infrastructure allocations also have their challenges.
Since the financial crisis correlations across asset classes have risen.
Analysts widely considered that infrastructure had escaped this
convergence, but research from Zürich-based investment bank
Credit Suisse and the University of Regensburg (Germany) shows
that while infrastructure is an important asset for portfolio
diversification, particularly in low- and medium-risk portfolios like
those of many sovereign wealth funds 13, it exhibits a high positive
correlation with large-cap stocks 14. This makes an investment less
attractive when a certain proportion of total assets are already
allocated to large-cap stocks, as in many sovereign wealth fund
portfolios.
Finally, with investor appetite growing through the entire
infrastructure lifecycle, more recently sovereign wealth funds have
shown an interest in infrastructure debt. As investment banks have
been forced to withdraw from financing large projects to comply
with Basel III regulations, the infrastructure sector has started
tapping the capital markets for financing. Sovereign Wealth Center
has observed sovereign wealth funds buying infrastructure bonds
and underwriting loans directly as well as allocating to infrastructure
debt funds. Infrastructure debt has the advantage of providing an
ongoing coupon for the investment and enables sovereign funds to
get exposure to assets at the appropriate time in each project’s
evolution. Debt securities are now being structured to separate the
higher-yield, higher-risk construction period of an asset from
operating cashflows, which are longer term, safer and lower yield.
Such innovative structures enable sovereign funds to tailor their
exposure to an asset and provide a degree of liquidity to the
investment 15.
12 See for example, LPX Group’s NMX Infrastructure index funds, http://www.lpx-group.com/nmx/36-month-chart/indices/nmx-composite.html13 See, for example, David Russ, Yogi Thambiah and Nicolo Foscari, “Can Infrastructure Investing Enhance Portfolio Efficiency?” Credit Suisse White Paper, May 2010.14 Tobias Dechant, Konrad Finkenzeller, “The Role of Infrastructure Investments in a Multi-Asset Portfolio – Answers from Dynamic Asset Allocation”, http://papers.ssrn.com/sol3/papers.cfm?abstract_id=1992520 (2012)15 Edward Russell-Walling, “Infrastructure Goes Down the Capital Markets Road,” Financial News, January 13, 2014.
managers since 2006 were for U.S.-focused strategies, a stark
contrast to the 11 percent that targeted European infrastructure.
But sovereign funds do not face a simple choice between private-
equity style funds and direct investing. As the infrastructure market
has become more challenging over the past year, some sovereign
wealth funds have started changing the way they invest in
infrastructure. Instead of simply awarding mandates or committing
to commingled investment vehicles, they are creating strategic
partnerships with commercial partners.
Partnerships in the infrastructure space have benefits to both sides,
enabling the sovereign wealth fund to leverage the manager’s
expertise, while the commercial partner has a guaranteed backer
over the period of the investment. But perhaps the greatest
advantage of this arrangement is that it helps align interests,
thereby relieving tensions over fee arrangements. In a partnership,
the manager will usually commit a large proportion of the overall
capital; for example, in the case of the Goodman Japan
Development Partnership, a collaboration between Sydney-based
industrial property investor, developer and manager Goodman
Group and the Abu Dhabi Investment Council, each party has
committed $400 million of equity 10.
Partnerships also give sovereign wealth funds greater transparency
into, and control over, the assets that form the portfolio and how
they are managed. This visibility allays anxiety on the part of the
sovereign wealth fund by ensuring that only assets it is comfortable
with become part of its portfolio. Such transparency enables the
fund to manage the risk of the partnership’s investments in relation
to the rest of its portfolio more effectively, ensuring that risks are
not concentrated in any single geography or sector, for example 11.
Another way that sovereign wealth funds have sought to increase
transparency and reduce fee burdens is by setting up co-investment
partnerships. For instance, the Alaska Permanent Fund, the U.S.
state’s oil revenue savings fund, has established an infrastructure
co-investment program with New York–based Global Infrastructure
Partners. In 2013, the fund made its first co-investment alongside
GIP when the two investors acquired 35 percent of Netherlands-
based Terminal Investment, which invests and operates container
terminals around the world.
But such partnerships and co-investment arrangements are not for
all sovereign wealth funds. There are funds that value liquidity, due
to ongoing liabilities, or are prohibited from investing in unlisted
assets under their founding legislation — for example Norway’s
giant Government Pension Fund Global. In these cases, the
10 Victoria Barbary, “Building Bridges: Sovereign Wealth Fund Partnerships in Real Estate and Infrastructure Development Projects” Institutional Investor’s Sovereign Wealth Center, March 17, 2014.11 For more detail see Elizabeth Pfeuti, “Escaping the Establishment”, aiCIO, April 2014.

Sovereign Wealth Funds 2014Sovereign Wealth Fund Investment in Infrastructure
85
Source: Sovereign Wealth Center (2014).
Airports & Ports Water Utilities
Power DistributionPower Generation
Gas Pipelines
Transportation
Telecommunications Other
Chart 3
Sector of sovereign wealth fund foreign directinvestment in infrastructure 2006-2013
0
2,000
4,000
6,000
8,000
2006 2007 2008 2009 2010 2011 2012 2013
Source: Sovereign Wealth Center (2014).
Developed Markets
Percentage Millions of dollars
Chart 2
Sovereign wealth fund foreign direct investmentin infrastructure: Developed vs. Emerging Markets
Emerging Markets
0
20
40
60
80
100
2006 2007 2008 2009 2010 2011 2012 2013
5.8 4.214.5
94.2 100.0 85.5
23.3
76.7
9.2
90.8
7.4
92.695.8
2.6
97.4
Source: Sovereign Wealth Center (2014).
Millions of dollars Asia - Pacific OtherOceania South AsiaEurope North America
Chart 1
Sovereign wealth fund foreign direct investment in infrastructureby region 2006-2013
0
2,000
4,000
6,000
8,000
2006 2007 2008 2009 2010 2011 2012 2013
trends in Swf investment in infrastructure 2006-Present
With the exception of 2007, since 2006, sovereign wealth fund
infrastructure investments have been biased towards European
markets. Between 2006 and 2013, Europe accounted for 68 percent
of all sovereign wealth funds’ foreign direct investment into
infrastructure, a total of $25 billion. Europe has been an attractive
infrastructure market for sovereign wealth funds, due to strong and
stable regulatory regimes. In particular, sovereign wealth funds
favored the U.K. with its privatized market. For example, sovereign
wealth funds hold shares in Reading-based Kemble Water Holdings,
the owner of Thames Water, which serves London and the South
East of England; London’s Gatwick Airport and major port operator
Associated British Ports. However, the U.K. is losing its shine as the
government has changed the regulatory framework of water
provision, and the opposition Labour Party suggested a price freeze
for domestic electricity prices until 2017. Increased uncertainty
about the U.K.’s future regulatory regimes has spooked sovereign
investors; for example, Leo de Bever, the outgoing CEO of the
Alberta Investment Management Corporation (AIMCo), which
manages the Canadian province’s sovereign wealth fund and state
pension funds, told that he is wary of investing in U.K. infrastructure
because he thinks British regulators are less consistent than they
were five years ago.
In continental Europe, where there are more nationalized
infrastructure monopolies, sovereign fund investments tend to be in
listed infrastructure companies, such as the Qatar Investment
Authority (QIA)’s 2010 purchase of 5 percent of Paris-based utility
company Veolia Environnement through its property development
arm, Qatari Diar Real Estate Investment Co. Australia has also been
a target for sovereign wealth funds, with investments in ports and
toll roads both directly and through unlisted funds.
Sovereign wealth funds’ cautious approach to infrastructure has
been evident in their investments in emerging markets, where they
have tended to invest in European companies with large emerging-
market exposure. For example QIA has invested in Spanish energy
company Iberdrola and Portuguese power distributor Energias de
Portugal, not because of these companies’ position in Europe, but
because both generate substantial revenues in Latin America 16. The
only exception to this rule was at the height of the pre-crisis boom in
2007, when all the infrastructure investments Sovereign Wealth
Center recorded were in emerging markets. Even then, however,
large established players dominated the transactions. Major
investments that year included Singapore’s Temasek Holdings’ $2
billion investment in Indian telecoms provider Bharti Airtel, and KIA’s
investment in Turkish airports operator Havalimanlari Holding.
16 See Javier Santiso “Sovereign Wealth Funds in Spain and Latin America” in ESADEgeo Sovereign Wealth Funds Report 2013 and “Sovereign Wealth Funds and Spain: (re) thinking opportunities” in ESADEgeo Sovereign Wealth Funds Report 2012.

Sovereign Wealth Funds 2014Sovereign Wealth Fund Investment in Infrastructure86
7. Sovereign Wealth Fund Investment in Infrastructure
Source: Sovereign Wealth Center (2014).
Airports & Ports Water Utilities
Power DistributionPower Generation
Gas Pipelines
Transportation
Telecommunications Other
Chart 3
Sector of sovereign wealth fund foreign directinvestment in infrastructure 2006-2013
0
2,000
4,000
6,000
8,000
2006 2007 2008 2009 2010 2011 2012 2013
Source: Sovereign Wealth Center (2014).
Developed Markets
Percentage Millions of dollars
Chart 2
Sovereign wealth fund foreign direct investmentin infrastructure: Developed vs. Emerging Markets
Emerging Markets
0
20
40
60
80
100
2006 2007 2008 2009 2010 2011 2012 2013
5.8 4.214.5
94.2 100.0 85.5
23.3
76.7
9.2
90.8
7.4
92.695.8
2.6
97.4
Source: Sovereign Wealth Center (2014).
Millions of dollars Asia - Pacific OtherOceania South AsiaEurope North America
Chart 1
Sovereign wealth fund foreign direct investment in infrastructureby region 2006-2013
0
2,000
4,000
6,000
8,000
2006 2007 2008 2009 2010 2011 2012 2013
Recently, however, sovereign funds have once more started taking
an interest in emerging-market infrastructure. Last year, according
to Sovereign Wealth Center data, the proportion of sovereign
wealth fund foreign direct investment in emerging-market
infrastructure reached 23.3 percent ($700 million) of the total
committed to the sector, up from only 2.6 percent ($196 million)
the previous year. Latin America, where the regulatory regimes are
considered stable and transparent, and competition is less fierce,
has been a particularly attractive region. For example, Temasek
invested almost $70 million in waterways operator Hidrovias do
Brasil alongside AIMCo and P2 Brazil Infrastructure Fund, managed
by local firm P2Brasil in 2012; the following year its sister fund GIC
injected 300 million Brazilian reais ($135 million) into Agea
Saneamento, the wastewater management unit of local sanitation
company Grupo Equipav.
Sovereign wealth funds appear to be fairly opportunistic in terms of
the infrastructure sectors in which they invest. Since 2006, the funds
have collectively invested $9.1 billion in ports and airports globally,
$7.0 billion in water utilities (primarily in the U.K.), $5.5 billion in
power distribution grids and $4 billion in power generation
companies and approximately $3.5 billion in both gas pipelines and
transportation assets, such as toll roads and railroads.
Such wide-ranging interests may be due to the fact that most
infrastructure assets are sold through a competitive bidding process.
As competition has increased, sovereign wealth funds have become
less likely to win the assets for which they bid. The upshot of
increased competition is that sovereign wealth funds have to target
a wider range of assets to gain the exposure they want and have
less control over the assets they win.
Source: Sovereign Wealth Center (2014).
Airports & Ports Water Utilities
Power DistributionPower Generation
Gas Pipelines
Transportation
Telecommunications Other
Chart 3
Sector of sovereign wealth fund foreign directinvestment in infrastructure 2006-2013
0
2,000
4,000
6,000
8,000
2006 2007 2008 2009 2010 2011 2012 2013
Source: Sovereign Wealth Center (2014).
Developed Markets
Percentage Millions of dollars
Chart 2
Sovereign wealth fund foreign direct investmentin infrastructure: Developed vs. Emerging Markets
Emerging Markets
0
20
40
60
80
100
2006 2007 2008 2009 2010 2011 2012 2013
5.8 4.214.5
94.2 100.0 85.5
23.3
76.7
9.2
90.8
7.4
92.695.8
2.6
97.4
Source: Sovereign Wealth Center (2014).
Millions of dollars Asia - Pacific OtherOceania South AsiaEurope North America
Chart 1
Sovereign wealth fund foreign direct investment in infrastructureby region 2006-2013
0
2,000
4,000
6,000
8,000
2006 2007 2008 2009 2010 2011 2012 2013
The only sector that is relatively underrepresented in sovereign
wealth funds’ foreign direct infrastructure investments is
telecommunications. Sovereign funds did target this sector,
particularly in emerging markets, before the financial crisis as

Sovereign Wealth Funds 2014Sovereign Wealth Fund Investment in Infrastructure
87
mobile telephony took off in Africa and Asia. But increasing
competition in emerging economies and consolidation in developed
markets has led to more strategic mergers and acquisitions activity
by trade buyers, which has made telecoms a challenging industry for
sovereign wealth funds. That is not to say that they’re not
interested. In April 2014, GIC joined a consortium that planned to
commit a total of €2.85 billion ($3.9 billion) to back an unsuccessful
bid by Paris-based Bouygues Telecom for French conglomerate
Vivendi’s SFR unit. A month later, Temasek led a capital raising by
Virgin Mobile Latin America, which provides operates mobile
telecoms networks in Chile and Colombia, and is seeking to expand
into Mexico and Brazil.
Table 1
Largest Direct Sovereign Wealth Fund Investments in Infrastructure since 2006
fund investment country Sector Year value ($ millions)
Qatar Investment Authority Iberdrola Spain Power Distribution 2011 2,811
GIC Heathrow Airport Holdings U.K. Ports and Airports 2006 2,389
Temasek Holdings Bharti Airtel India Telecoms 2007 2,000
GIC Kelda Group U.K. Water Utilities 2008 1,985
Abu Dhabi Investment Authority Thames Water U.K. Water Utilities 2011 1,608
China Investment Corp. AES Corp. U.S.A. Power Distribution 2010 1,581
GIC Associated British Ports Holdings U.K. Ports and Airports 2006 1,437
Qatar Investment Authority Heathrow Airport Holdings U.K. Transportation 2012 1,413
China Investment Corp. Thames Water U.K. Water Utilities 2012 1,349
GIC Sintonia Italy Transportation 2008 1,343
GIC Transport et Infrastructures Gaz France France Gas Pipelines 2013 1,086
Abu Dhabi Investment Authority Gassled Norway Gas Pipelines 2012 1,085
Abu Dhabi Investment Authority Port Kembla, Port Botany Australia Ports and Airports 2013 1,065
Source: Sovereign Wealth Center (2014).
conclusions
Over the past eight years, sovereign wealth funds have become
more canny investors in infrastructure as the sector has become
more competitive. This has led them to change the way they access
the sector. While some established sovereign wealth funds have
successfully built in-house infrastructure teams, others have
struggled, or have decided against taking this course. Instead, some
sovereign wealth funds have forged partnerships with commercial
investors that enable them to access markets and sectors where
there is less competition, by leveraging their partners’ expertise.
While sovereign wealth funds’ interest in infrastructure is
increasing, they are finding it harder to source and secure assets
with an attractive risk-return profile at an acceptable price,
resulting in a drop-off of direct sovereign wealth fund expenditure
in this sector in 2013.
As a result we may see more sovereign funds returning to asset
managers – albeit with a greater degree of transparency and control
over the portfolio – or to listed equities to secure assets in more
challenging but less competitive geographies than Europe.

Xavier Reig
CEO and Co-Founder, Black Capital
Sovereign wealth funds and real estate: Spain's awakening
Xavier Reig
CEO and Co-Founder, Black Capital
Sovereign wealth funds and real estate: Spain's awakening
Sovereign Wealth Funds 2014Sovereign wealth funds and real estate: Spain’s awakening
89

Sovereign Wealth Funds 2014Sovereign wealth funds and real estate: Spain’s awakening90
8. Sovereign wealth funds and real estate: Spain’s awakening
In our previous report we explained that there was too much
timidity and not enough liquidity in the Spanish real estate market,
given that international investors were bidding below sellers’
expectations. We also mentioned that there was a need for the
market to change gear, i.e. for a series of consecutive transactions
by prominent players to instil confidence by establishing credible
market prices.
Well, that gear-change has happened, the timidity has been
dispelled and liquidity has returned. Between the time we
completed the previous report in June 2013 and the time of writing
this one, July 2014, the Spanish real estate market has become an
international reference.
As a result, the Iberian Peninsula has been shaken by a first wave of
mainly opportunistic investors, taking positions in the two main
cities, Barcelona and Madrid, reaching a total of €6.63 billion 1
in 2013 and representing 32% of the total for all sectors invested in
Spain. That is three times the €2.1 billion invested in the sector
in 2012 which we referred to in our last report.
This exuberant awakening was brought about by a new climate of
confidence, combined with the distress situation and the excess of
the various players, which we will explain presently, all fuelled by
eagerness to return to the fray following five years of paralysis in the
sector.
Thus, on the sellers’ side, we have the following panorama: private
sector companies with an imperative need to reduce their liabilities
to clean up their balance sheets; banks obliged to provide for the
impairment of the assets on their books; government bodies
needing cash to meet payroll and other obligations and, lastly, the
so-called bad bank, the SAREB 2, with more than €50.78 billion 3 in
assets and the objective of offloading approximately 45% of them in
the next five years. On the buyers’ side, we find mainly international
investors with plenty of cash, eager to enter the Spanish market in
view of its current dimensions and propitious circumstances.
During the first wave of investment, the market fundamentals, and
in particular the occupancy ratio and the pressure on rentals, were
still in a critical state, with no signs of recovery. Also, the
investments had more to do with expectations based on European
exuberance, together with increased liquidity. Now the scenario is
significantly different. The fundamentals have not changed,
admittedly, but both the negative dynamic and the negative
expectations are largely dissipating, and indeed the first green
shoots are appearing in very specific areas and products. For
1 See Expansión, 2 January 2014.2 SAREB - Sociedad de Gestión de Activos Procedentes de la Reestructuración Bancaria (“Management Company for Assets Arising from the Banking Sector Reorganisation”).3 Data from SAREB (valued at transfer price).
example, the slight upturn in rentals 4 in the market for offices in the
business districts of Barcelona and Madrid during the early part of
2014 allow new prices to settle around €15/m2 and €23/m2
respectively, following a continuous correction of as much as 40%
since 2007. These are only small upturns in a market that has been
completely paralysed until now, but this is where we see green
shoots.
The best example to illustrate the new situation of the real estate
investment market is to be found in Barcelona, with one of the
transactions that brought about the change of gear in the market.
In June 2013 the regional Catalonian government auctioned off
thirteen buildings 5 which went into AXA Real Estate’s portfolio for
€174 million, giving a yield of 9.5%. Well, twelve months later,
insurance group Zurich acquired a second lot for €201 million, but in
this case the yield fell to 6.5% as a result of the increased
competition from bidders.
We anticipated in our previous report that the greatest
opportunities were to be found in asset conversion and, in this
particular case, seeking the potential offered by high-end tourism.
Right now there are three stellar projects increasing the supply in
the high-end segment, with iconic buildings in Madrid and
Barcelona. Firstly, Madrid’s Edificio España, sold to the Chinese
group Dailan Wanda for €265 million by Santander, which will be
converted into 300 luxury apartments, a shopping centre and a
hotel. Secondly, Torre Agbar in Barcelona, acquired for €150 million,
which will be converted into a Grand Hyatt hotel. And lastly, the
Deutsche Bank building, also in Barcelona, acquired for €90 million
and to be converted into a Four Seasons hotel. Both Barcelona
transactions were conducted via a local fund.
In Barcelona, the bulk of transactions concern the hotel sector.
Investment in the hotel sector in 2013 reached €511 million,
compared with the €303 million 6 invested in offices. Again, we
should not forget the city’s growing attractiveness as a tourist
destination. In 2013, 7.5 million tourists visited it, and in spite of the
increased hotel capacity, with 77 new hotels since 2008, the
occupancy ratio has increased year after year, reaching 75%. In the
case of offices, the limited supply of quality office space in the CBD is
forcing up prices and shifting interest towards other areas such as
the 22@ innovation district.
The case of Madrid is completely different. Offices have captured the
major part of investments: €488 million, representing 70% of the
€697 million invested in the two cities during the first half of 2014.
When all is said and done, Madrid is Madrid, the political and
financial capital. At present the offices in the CBD are practically
4 See Aguirre Newman, IMAN - Spanish Real Estate Market, 13-14.5 Lettable area: 105,000 m2
6 Source: Jones Lang Lasalle

Sovereign Wealth Funds 2014Sovereign wealth funds and real estate: Spain’s awakening
91
obsolete and in need of renovation in the hope that economic
recovery will resume pressure on sluggish vacancy rates and rentals.
The potential for recovery in rentals is what is arousing the appetite
of investors, who are hoping for revaluations of between 15% and
20% in the next three to four years.
We should also mention shopping centres, which, though there has
been no resurgence in consumer spending, have also seen a change
in expectations. Partly also as a result of several funds such as British
Land and Vastned needing to disinvest, shopping centres accounted
for a large number of transactions in these first four months of
2014, totalling €1.42 billion and thus surpassing in just four months
the total for the whole year 2013. The biggest transaction in
shopping centres so far this year was the purchase of the Diagonal
Mar shopping mall in Barcelona by Northwood Investors, for an
estimated €150 million, from NAMA, the Irish counterpart of Spain’s
SAREB. The previous owner had paid €300 million for it in 2007.
Yields on offer for prime assets in the first four months of 2014 have
been around 6.5%.
The logistics segment is also feeling the effects of investors’
excitement, although so far only in the initial stages. No doubt this
will be the next segment to be shaken up by market logic if there
are expectations of increased consumption and therefore economic
activity. In 2013 investment reached €98 million spread between
the two main cities, double the figure for 2012. The biggest
transaction last year was carried out by the US fund Blackstone,
which bought various assets in Madrid and Barcelona for €47
million, and in 2014 it also acquired a European portfolio including
four logistics platforms in Spain.
As has happened in other European countries, Spanish banks have
also found themselves obliged to start deleveraging in the sector.
This has led to innumerable transactions involving the sale of
packages of mortgage debt, real estate management platforms and
other assets. The opportunistic US fund Lone Star was one of the
first to appear on the scene in February 2013, with the purchase of
Banco Santander’s real estate bad debt portfolio for €200 million. It
has also been one of the star funds so far in 2014 acquiring,
together with JP Morgan, Commerzbank’s Spanish real estate
portfolio, the so-called EuroHypo, for €3.5 billion. This was followed
by Blackstone’s successful bid to acquire from Spain’s bank
restructuring fund, known by its Spanish acronym FROB, €6.37
billion of toxic mortgage loans previously held by Catalunya Banc,
covering 40,000 properties, for which the fund will pay some €3.5
billion.
One of the main tax reforms introduced by the Spanish executive is
proving crucial as a catalyst for investment in the sector. We are
referring to Spain’s new REITs, known as SOCIMIS, created in 2009,
which since the latest amendment 7 now have a number of tax
advantages, paying a 0% rate, and are becoming a very important
factor in oxygenating the sector.
It is precisely through a SOCIMI that George Soros, one of the
international investors with most experience in our market, has
returned to the fray, with €92 million becoming one of the
reference investors in the SOCIMI, Hispania, through his vehicle
Quantum Fund. Hispania, with the participation of other
international investors, went public in March 2014, reaching a total
capitalisation of €500 million. The company is 100% controlled by
the local asset manager Azora, and has as its objective investment
in high-quality assets, where possible unlisted.
The case of the SOCICMI, Hispania, is not the only one. Six
companies with similar profiles have been listed in the first half
of 2014. The biggest of them, Merlin Properties, with a final
capitalisation of €1.25 billion, is partly held by UBS (11.5%) and
Goldman Sachs (6%). As in the previous case, it is managed by a
Spanish shareholder, Magic Real Estate. Its first acquisition was of
BBVA’s 880 offices for €740 million. The remaining €510 million will
be invested in the services sector, offices and logistics.
The sovereign wealth funds have not missed out on all this
movement, but have so far focused their direct investment efforts
on very specific transactions. The most active funds in the past few
months have been on the one hand the more personalistic Arab
funds, and on the other, the Canadian pension funds.
We ended the 2013 report with the purchase of Barcelona’s Hotel W
by Qatari Diar, which was without doubt one of the triggers of the
step-change in the investment market, together with the auction
previously referenced. The next transaction by a government fund
was the purchase by the Canadian pension fund CPPIB, together
with the U.K.’s retail leader Intu Properties, of the Parque Príncipe
shopping mall in Oviedo, in October 2013 for €162 million. The new
owners’ expected yield is 7.2%. This is a very high-quality asset, in
which the Canadian fund served as a financial lung for the U.K. one,
with equity of €40 million in the transaction.
In the next case the protagonist was IPIC, from Abu Dhabi, which in
November 2013 acquired a purchase option until 2016 for €450
million on the Torre Foster in Madrid, which belongs to the
nationalised bank Bankia. This option was a consequence of
Bankia’s recently having leased practically all of the Torre Foster to
CEPSA, the Spanish oil company owned by IPIC.
If the purchase option is eventually exercised, the asset could end
up in the portfolio of Aabar Properties, a subsidiary of IPIC with real
7 Act 16/2012, in force since 1 January 2013.

Sovereign Wealth Funds 2014Sovereign wealth funds and real estate: Spain’s awakening92
8. Sovereign wealth funds and real estate: Spain’s awakening
estate projects in its domestic market as well as in Jordan and New
York. Another option would be to transfer the asset to Abu Dhabi’s
parent sovereign wealth fund, ADIA, which already has a presence in
Spain with various office and commercial properties.
This asset, given its absolutely singular nature and its total vacancy
prior to the contract with CEPSA, could only be acquired by a
sovereign wealth fund giving great weight to the very long term or
else for emotional reasons beyond market criteria; no other fund,
whether public or private, having to render account to a board of
directors would have been able to allow itself to do so. In any case,
the needs of its Spanish subsidiary CEPSA provided the opportunity
of expanding the sovereign wealth fund’s portfolio.
Qatar was back on stage in January 2014, first buying the Hotel
Renaissance in Barcelona for €78.5 million from the Marriott chain.
The transaction was carried out through the investing arm QAFIP
(Qatar Armed Forces Investment Portfolio) by paying €44 million
and transferring obligations valued at €33 million. The sale
agreement included a long-term contract for Marriott to continue
operating the hotel. Together with QIA, QAFIP is one of the founders
of and current investors in Qatar’s main Islamic bank, Masraf Al
Rayan.
The second transaction of the year was carried out by Qatar
Holding’s new hotel division brand, Katara Hospitality 8, with the
purchase of a portfolio of five European hotels including Madrid’s
Intercontinental. valued at €70 million, which belonged to a former
manager of Barwa Real Estate, another state enterprise of Qatari
Diar, both of which are extensively dealt with in the 2013 ESADEgeo
report.
However, the most significant transaction was without doubt
Qatar’s taking up a position as the second biggest shareholder in
Colonial, a listed company. This Spanish property company, with
€5.3 billion in real estate assets in Barcelona, Madrid and Paris, has
been a reliable reflector of the sector’s state of health. The fact that
international funds are once more betting on it in 2014 is the best
sign of a credible economic recovery.
Qatar first invested in Colonial at the beginning of April 2013, with a
3.7% stake, subsequently increased to 13.1% before the end of the
month when it reaffirmed its position by subscribing to the €1.2
billion capital increase. The capital increase was carried out in order
to restructure the Spanish company’s liabilities, reducing them to €1
billion. The issue of debt also attracted the attention of other
sovereign wealth funds such as Singapore’s GIC, which subscribed
16%. Returning to Qatar, its play on Colonial is a double one.
8 Both vehicles are described in detail in the 2013 ESADEgeo Sovereign Wealth Funds Report, in the chapter devoted to the real estate sector.
Colonial controls 53% of the French SIIC (REIT) SFL, in which the
Qatari sovereign wealth fund acquired a 22% shareholding in the
same month of April. In both cases, Qatar used its investment
vehicle Qatar Holding as well as DIC Holding to attain its objectives.
The latest public transaction was carried out by Canadian pension
fund PSP, together with Spain’s Drago Capital, with the purchase of
the Castellana 200 shopping and office complex in Madrid, in the
first half of 2014. The Canadian fund had already had a Spanish
presence since 2011, when it bought part of the so-called “Prisa
portfolio” with three buildings in Barcelona and Madrid 9, one of
which was sold last year.
Sovereign wealth funds may have taken part in more transactions
during this period, since in many cases they hide behind screening
vehicles of other funds or asset managers, both in order to conduct
the transaction without driving the price up and simply to avoid
publicity.
We should also point out that the sovereign wealth funds do not fit
into the profile of “vulture funds” in the biggest transactions carried
out to date, particularly those relating to “toxic” assets. On the
other hand, the fact that they might not have participated directly
does not mean that they are not interested, simply that they prefer
to take part by investing in the various funds specialising in this type
of product, such as Blackstone, Cerberus, Lone Star or Apollo,
among others. Moreover, once the asset, whether real estate or
financial, has been recovered, these same entities can transfer it to
a fund with a more conservative profile, whether institutional or
sovereign.
Let us remember that the core strategy is the preferred one for
direct investment. Assets in prime zones, with solvent (triple A)
tenants, preferably corporate, with long-term contracts. To which
variables we must add a minimum investment volume of €100
million, as well as a liquid market. The objective is to minimise the
need for management, and the risk, and to obtain economies of
scale, given that the most conservative sovereign wealth funds
consider real estate investment as just another financial transaction,
competing with government bonds; at present, with current interest
rates, bricks and mortar clearly come out on top.
Thus we can affirm that the institutional and sovereign funds have
had and continue to have Spain firmly in their sights. Nevertheless
there are several characteristics impeding a greater presence on the
part of international investors: firstly, the structural scarcity of core-
profile large-scale products; secondly, the fact that current
transactions are mainly opportunistic and require subsequent
management by a local team, something to which these giants of
9 Gran Vía, 32 and Miguel Yuste, 40 in Madrid and Caspe, 6-20 in Barcelona.

Sovereign Wealth Funds 2014Sovereign wealth funds and real estate: Spain’s awakening
93
investment are not accustomed; and thirdly, the slow recovery of
the fundamentals. These three factors have so far prevented
international investors from having a greater presence. We can
therefore conclude that it is still too soon for most of them, and that
we shall see them appearing as we move ahead in the economic
cycle.
All the same, despite their preference for core product, sovereign
wealth funds are increasingly entering at earlier stages of the value
creation chain, especially in transactions involving conversion and
promotion or development, but always through specific individual
actions in search of high-quality assets. The exception is Nigeria’s
NSIA, with social housing development projects. To date, this non-
core investment has not extended to Spain, but we do not discount
the possibility of its happening, as it is in other European centres
such as London, Paris and Milan.
Barcelona has an old thermal power station called Besós, with its
three iconic chimneys. With an area of 28 hectares and more than a
kilometre of shore-front, it is the city’s last remaining free shore-
front space. Various institutions are already working on having a
proposed director plan for the end of 2014.
It is impossible to think of this old industrial site without evoking the
image of the current development of London’s 15-hectare Battersea
Park Power Station. The old power station and its surroundings at
this iconic site on the banks of the Thames are being transformed
into a new urban district, preserving the power station’s chimneys
and structure as its main icon. The promoters are a consortium of
Malaysian public-private enterprises 10, together with the Malaysian
government pension fund EPF, which won the bidding against
strong competition from Arab funds.
In the case of Besós, the first sovereign wealth fund that comes to
mind to form part of the project would not be Malaysian, but Qatar
Holding and Qatari Diar, given their string play on Barcelona in
recent years.
We should remember that Qatar is currently the world’s leading
producer of LNG, and its real estate investment policy may be
conditioned in some cases by energy interests. Spain accounted for
4.5% of its gas exports in 2011, and Qatar supplied Spain with 20%
of its consumption. Given its location, Spain could play a key role at
geopolitical level in reducing European dependence on Russian gas,
becoming Europe’s point of entry for LNG. Spain already has six
regasification plants (Barcelona, Valencia, Cartagena, Huelva, La
Coruña and Bilbao) and it would be necessary to extend the existing
ones and improve the energy interconnection with France. Spain, as
an importer of LNG, and Qatar as its biggest producer, should join
10 For more details, please refer to the 2013 ESADEgeo Sovereign Wealth Funds Report.
forces to make this vision come true, which could also lead to an
increase in Qatar’s investments in Spain. In this case real estate.
Staying on the Mediterranean coast, we find the future leisure and
entertainment city Barcelona World, located next to the Port
Aventura amusement park in Tarragona, which receives four million
visitors a year, the expansion of which, with the second Ferrari
theme park after that of Abu Dhabi, Ferrari Land, will be completed
in 2016. The merger of these three enclaves could also become a
focus of attraction. In this case however it is unlikely that an Arab or
Malaysian sovereign wealth fund would become involved specifically
in the gaming industry. Although there is already a precedent: in
2007, Dubai World took a stake in MGM Resorts International,
which has hotels and iconic casinos such as the Mirage in Las Vegas.
Continuing with the Arab funds, the Malaga region offers various
enclaves where residential and hotel complexes focusing on luxury
for their compatriots could be developed. It is all a matter of time.
Spain is in the middle of a change of cycle, and both the private
sector (banks and companies) and the public sector will continue to
need to convert assets into cash, offering the market a constant
drip-feed of unique opportunities. At the same time, current
investors will unwind positions, leaving clean assets ready to be
taken by less intrepid, more institutional, and in some cases
sovereign investors.
Now we can assert that 2014 was the year in which the Spanish
economy left hospital and set out on the road to recovery. The Spain
brand is back, and with it, capital.

Looking Back and Launching Forward: SWF Investment in Financial Services
Patrick J. Schena
PhD, Adjunct Assistant Professor & Senior Fellow and Co-Head SovereigNET: The Fletcher Network for Sovereign Wealth and Global Capital
The Fletcher School, Tufts University

Looking Back and Launching Forward: SWF Investment in Financial Services
Patrick J. Schena
PhD, Adjunct Assistant Professor & Senior Fellow and Co-Head SovereigNET: The Fletcher Network for Sovereign Wealth and Global Capital
The Fletcher School, Tufts University
Sovereign Wealth Funds 2014Looking Back and Launching Forward: SWF Investment in Financial Services
95

Sovereign Wealth Funds 2014Looking Back and Launching Forward: SWF Investment in Financial Services96
9. Looking Back and Launching Forward: SWF Investment in Financial Services
introduction
It is inevitable that we begin a review of the 2013 investment trends
of SWFs in banking and financial services with one an eye on the
past. While seemingly far distant, the throes of the financial crisis of
2008-09 in some ways reoriented our thinking about the role of
SWFs as strategic global investors. In the few years prior to the crisis,
the world had become captivated by these amassing pools of state-
controlled wealth, but with growing concern for their impacts on
capital markets and global financial stability 1. As the economies
gasped for liquidity, deep pools of long horizon capital were sought
out to arrest the fleeting capital base of large global financial
institutions.
Whether cross border –as in the case of GIC or Temasek– or to
stabilize a domestic banking sector –as in the case of Ireland– SWFs
nimbly anchored over $70 billion in recapitalizations and emerged
as among the largest investors in global financial services. With
nearly 270 deals in the sector since 2006, over 70% of these were
completed after the onset of the global financial crises (from now
on referred as GFC) in many cases representing follow-on
commitments. Rather than destabilize, these transactions represent
a base of long-term capital that has contributed to the stability of
the global financial system and some respects forced a
reconsideration of the SWF from that of “powerbroker” 2 to
sophisticated strategic financier. As the memory of the Global and
Euro crises begins to fade the legacy of these investments continues
to define the portfolios of SWFs. This poses an important question
about the future role of SWFs as investors in the sector: What
defines the current strategic objectives of SWFs in global financial
services and what are the resulting implications?
Financial services without question remains the largest sector into
which SWFs invest, representing over 30% of all transactions since
2006. In the years preceding the GFC, SWF investment in financial
services increased steadily, peaked in 2010 at 50 transactions,
dropped precipitously by over 40% in 2011, and has been recovering
since. SWF investment activity in 2013 in particular marked
resurgence in financial services, driven largely by investments in
banks and various forms of fund or privately intermediated
structures. Of the 45 deals completed in financial services in 2013,
13 were investments in commercial and investment banks, 6 in
insurance firms, and 2 in exchanges. In addition, 20 investments
were made in intermediary vehicles or fund structures, heavily
dominated by real estate, infrastructure, and private equity funds.
1 See for example McKinsey 2014, “The new power brokers: How oil, Asia, hedge funds, and private equity are shaping global capital markets …” accessible via http://www.mckinsey.com/insights/global_capital_markets/how_the_new_power_brokers_are_shaping_global_capital_markets2 Ibid..
A key driver of investment in this sector, we suggest, has been a
recovery of returns to global financial services generally. As a proxy
for SWF returns in the sector we take as a benchmark an ETF
indexed to the S&P Global Financials Sector. When measured since
the second quarter of 2008, i.e. in the midst of the GFC, the sector
has significantly underperformed the MSCI All Country World Index
on a cumulative basis. This is clearly discernible in Chart 1 as both
indices drop to lows in the first quarter of 2009. The global financial
services index has yet to return to 2008 levels on an adjusted basis,
suggesting that holding period returns on some SWF global financial
positions remain flat. However, the recovery in global equities since
the GFC, and with it the financial sector, has offered opportunities to
enhance performance. Importantly, informing the sector investment
focus by SWFs since 2012, the global financial services index
returned over 31% in 2012 compared to a 16.7% return in the same
period for the MSCI all countries index. In 2013, returns were
respectively 26% versus 22%, i.e. continued though more modest
outperformance.
Source: Yahoo Finance (2014) and author’s calculations.
Chart 1
Relative Price Movement of the S&P GlobalFinancials (IXG) against the MSCI All CountryWorld Index (ACWI)
0
20
40
60
80
IXG ACWI
2008 2009 2010 2011 2012 2013
2010 2011 2012 2013
Source: Yahoo Finance (2014) and authors calculations.
Base year 2010 = 100
Chart 2
Relative Price Movement of China’s Four Leading State-owned Banks (A-Shares)against the Shanghai Index
60
80
100
120
SSE
BOC
ICBC
CCB
ABC
(SSE)
Traditionally, the most active SWFs in the financial sector are among
the largest each with considerable scale and commitment to a long-
term investing horizon. These have included ADIC, CIC, GIC, KIA, QIA,
and Temasek, who together have been responsible for almost 60%

Sovereign Wealth Funds 2014Looking Back and Launching Forward: SWF Investment in Financial Services
97
and the Bank of Ireland. Share ownership is through what was
originally the National Pensions Reserve Fund of Ireland from the
assets of which the banks were —somewhat by fiat— re-capitalized.
Here however, the similarities end.
Huijin’s management style might be described as decidedly
macro-policy driven and proactive. Huijin has been an active
acquirer of shares in Chinese state banks through what have
amounted to open market operations that are design not only
to provide price support to Chinese bank shares, but also
-through a form of forward guidance- to signal government
support for Chinese equity values more generally. Beginning in
2011 and continuing through four consecutive quarters into the
fall of 2012, Huijin added to its sizeable positions in Chinese
banks 4.
In June, 2013, Huijin resumed this share purchase program and
again formally announced its intention to increase its equity
stake it all four Chinese state-owned banks over the succeeding
six months. The operation, executed through purchases of free
float shares on the Shanghai stock exchange, left the banks’
registered capital levels unaffected 5. Once completed in mid-
December, Huijin had increased in stakes in ICBC by 175 million
A-shares or to a share ownership position of about 35.36
percent. Likewise, Huijin acquired 103 million A-shares of CCB
resulting in ownership of 57.26 percent. Huijin also bought 113
million of its A-shares of Bank of China to increase its stake to
67.75 percent. Lastly, it acquired 179 million A-shares of
Agricultural Bank of China resulting in an ownership position of
40.28 percent 6. In a similar program executed simultaneously,
Huijin also acquired additional shares in China Everbright Bank
and New China Life Insurance Co 7.
During the three years period ending December 31, 2013,
depicted in the chart 2, the Shanghai index declined cumulatively
nearly 25%, while the shares of these Chinese four state-owned
banks (SOBs) remained relatively flat, returning -0.5%.
Nonetheless, the impact of Huijin’s share purchase programs can
casually discernible when tracing the relative price movements of
the Shanghai index and those of China’s four largest state-
owned banks. During the period of the 2013 Huijin share
purchase operation from June through mid-December, the
Shanghai indexed increased in value by approximately 7%.
4 “Central Huijin continues purchase of bank shares,” China Daily, 10 October 2012.5 “China sovereign fund Huijin completes purchase of bank shares”, Reuters, 16 December 2013.6 “Central Huijin raises stake in four state banks”, Xinhua, 17 December 2013 at http://news.xinhuanet.com/english/china/2013-12/17/c_132974582.htm7 “China Central Huijin adds to Big Four bank stakes”, MarketWatch, 17 June 2013 at http://www.marketwatch.com/story/china-central-huijin-adds-to-big-four-bank-stakes-2013-06-17
of SWF transactions in financial services since 2006. As a result they
hold sizeable legacy positions in global banking institutions. In 2013
Malaysia’s Khazanah, an active investor in the insurance sector,
joined this cohort, which as a whole combined for 78% of the
financial sector deals by SWFs.
The legacy of SWF in financial services has perhaps been most
pronounced and effectual in the banking sector specifically. In global
markets their list of active engagement is long: Citigroup by among
others Kuwait and ADIA; Morgan Stanley by CIC among others;
European banking sector, including UBS by GIC; Barclays by
International Petroleum Investment and Qatar; Credit Suisse and
Greek banks, EFG Eurobank and Alpha Bank, by Qatar; in Unicredito
by LIA. And, of course, the Chinese state banking sector by any
number of funds including GIC and Temasek.
In domestic markets, SWF investments in financial services, and
banking in particularly, have reflected the complex realities of the
strategic links between the financial and real economies. In some
cases, China for example, the role of the SWF in domestic banking has
been institutionalized through the establishment of a discrete
subsidiary or holding company whose mandate is to administer the
state’s investment in the domestic banking sector. In other cases, the
assets of an existing sovereign entity without such a mandate have
been actively deployed to recapitalize elements of the domestic
banking sector in some cases with significant structural implications
for the fund itself. In 2013 we were able examine this dichotomy as it
unfolds in a present day tale of two cities: Beijing and Dublin.
Beijing and Dublin: a tale of two cities
In Beijing, the China Investment Corporation (CIC) directs investment
in China’s banking sector through Central Huijin Investment, whose
responsibility it is to manage the Chinese government’s ownership in
the national banking sector. Huijin was established in 2003 and,
along with its holdings of Chinese bank shares, was later acquired by
CIC. Its current positions include the Chinese state government’s
ownership interests in Agricultural Bank of China, Bank of China,
China Construction Bank, and Industrial and Commercial Bank of
China among other banks and non-bank financial institutions. Huijin’s
positions in these four banks constituted on average 50% of their
share capital (ranging from approximately 35% in the case of ICBC to
over 67% for the Bank of China). The total book value of its holdings
as of December 2013 was approximately $136 billion 3.
In Dublin, the Irish government also holds substantial ownership
interests in two key national banking institutions: Allied Irish Banks
3 To put this number into context, at December 31, 2013 the CIC, in its annual financial statements, reported total assets of $653B and specifically the value of its “financial assets at fair value” as $205B and the value of its “long-term equity investments” as $412B. See http://www.china-inv.cn/wps/wcm/connect/5c337c13-8677-4862-aa36-4efbc1b243ae/中投年报电子书文件-英文.pdf?MOD=AJPERES&CACHEID=5c337c13-8677-4862-aa36-4efbc1b243ae

Sovereign Wealth Funds 2014Looking Back and Launching Forward: SWF Investment in Financial Services98
9. Looking Back and Launching Forward: SWF Investment in Financial Services
Source: Yahoo Finance (2014) and author’s calculations.
Chart 1
Relative Price Movement of the S&P GlobalFinancials (IXG) against the MSCI All CountryWorld Index (ACWI)
0
20
40
60
80
IXG ACWI
2008 2009 2010 2011 2012 2013
2010 2011 2012 2013
Source: Yahoo Finance (2014) and authors calculations.
Base year 2010 = 100
Chart 2
Relative Price Movement of China’s Four Leading State-owned Banks (A-Shares)against the Shanghai Index
60
80
100
120
SSE
BOC
ICBC
CCB
ABC
(SSE)
The share prices of Chinese leading SOBs all experience positive
price movements in the late spring in apparent response to the
purchase programs, but underperformed the index (returning
-1.6%) during the balance of 2013. While anecdotal, these share
price movements suggest that discrete interventions by Huijin
can in fact provide price support to share values of Chinese banks
and as well may contribute to broader macro-economic policy
objectives of the Chinese government related specifically to asset
values 8.
In sharp relief to Huijin, are the remnants of Ireland’s National
Pensions Reserve Fund (NPRF). The NPRF was established in 2001 to
prefund social welfare and public service pensions of Irish citizens.
For many years the NPRF maintained a broadly diversified portfolio
of global securities. However, in 2009, in response to threats to the
financial viability of Allied Irish Banks (AIB) and Bank of Ireland, the
Funds, at the direction of the Minister for Finance, began to invest
directly in both banks. In the intervening years, investments by the
Fund in both banks have totaled €20.7 billion 9. The first of these
8 Definitive causal effects on the broader market in China related to the impact of SOB share purchases awaits a more robust analysis of joint share price movements.9 See http://www.nprf.ie/DirectedInvestments/directedInvestments.htm for further details of the timing of the capital infusions.
investments - €7 billion – was used to acquire preference shares
issued by AIB and Bank of Ireland in order to recapitalize them. In
2010 the NPRF participated in a share and rights issue of Bank of
Ireland. Also in 2010 made a follow-on investment of €3.7 billion in
the ordinary shares of AIB increasing its to 92.8%. In July 2011 an
additional €10 billion was again made in both banks. In July 2012
began to trim some of its bank holdings. This continued in
December 2013. However at year end 2013 of the nearly €20 billion
in NPRF asset, over €13 billion remained committed to the Irish
banking sector and specifically AIB and Bank of Ireland.
The Irish experience of SWF investment in financial services has indeed
been transformative for the NPRF. In June 2013 the Irish government
announced the establishment of the Ireland Strategic Investment Fund
(ISIF). This newly created entity has absorbed the assets of the NPRF.
Perhaps as importantly, its mandate, unlike that of a pension reserve
fund, has been entirely restructured in order to contribute directly to
promote economic activity and employment in Ireland 10. Accordingly,
the approximately €7 billion in fund assets not invested in banks will be
directed to commercial investment opportunity in Ireland itself.
10 See http://www.nprf.ie/ISIF/IrishStrategicInvestmentFund.htm

Sovereign Wealth Funds 2014Looking Back and Launching Forward: SWF Investment in Financial Services
99
Even as the Irish government is forced to continual revisit its legacy
investments in AIB and Bank of Ireland and their impact on its
strategic objectives as global investor, it has launched ahead with a
new investment program that over time will be financed in part by
privatizing its strategic bank holdings. It is this strategic eye to the
future, which also emerges as a second key theme in the investment
activity of SWFs in 2013, focused not as in the past on developed
market banks, but rather on emerging market financial institutions,
specifically banks in South and Southeast Asia and Russia, and
motivated by a steadily rise in middle income families and an
increased demand for housing and other forms of consumer
finance. Several examples will serve to illustrate.
investing on emerging markets financial institutions: Philippines, india, cambodia and russia
We begin with GIC in Singapore, who along with Temasek, have
been active, knowledgeable investors in Asia for a number of years.
In 2013, GIC combined with the Philippine conglomerate Ayala Corp
to acquire 9.9% stake in Bank of the Philippine Islands from
Singapore’s DBS Group Holdings Ltd. The target is the third largest
lender in the Philippines and the investment was valued at $680
million, making it the largest banking deal in the Philippines since
2006. Under the structure of the co-investment, GIC will acquire a
5.6% ownership position in Bank of the Philippine Islands. Ayala,
already a major shareholder in the bank, will increase its existing
position by 4.3% to hold 48.3% in total. For GIC, the deal
strengthens its position in the banking sector in Southeast Asia and
allows it to access both the stability and potential growth rooted in
the positive demographics of a rapidly growing middle class among
its population of more than 600 million 11.
This Philippine deal complements a second Asia banking transaction
completed by GIC in April 2013 in India. Heliconia Pte Ltd, an affiliate
of GIC, subscribed to 20 million shares - about 2.6% of outstanding
shares of Kotak Mahindra Bank at price of Rs 648 per share or a
total of Rs 1,296 crore ($237 million). The deal was intend to
strengthen the bank’s Tier I capital to position it to take better
advance of near-term growth opportunities 12.
Not to be undone, Temasek, Singapore’s second wealth fund,
likewise investment turned to the financial sector in Southeast Asia
in what may have been its first deal in Cambodia. The SWF became
a minority partner in commercial bank established in cooperation
with Canadia Bank PLC and Cambodia’s postal service. Temasek’s
investment was placed though its subsidiary - Fullerton Financial
Holdings. Temasek, through Fullerton, was expected to holding a
11 “GIC, Ayala Pay $680 Million for Philippine Bank Stake”, Wall Street Journal, 11 November 2013 at http://online.wsj.com/news/articles/SB1000142405270230464410457919280214941508212 “Kotak Mahindra Bank gains on preferential issue to Heliconia”, Business Standard, 12 April 2013 at http://www.business-standard.com/article/markets/kotak-mahindra-bank-gains-on-preferential-issue-to-heliconia-113041200215_1.html
45% stake in Cambodia Post Bank, while Canadia Bank will hold an
effective majority 50% position 13.
Lastly, we turn to Russia, where Qatari, Norwegian, Azerbaijani
funds jointly participated in a $3.3 billion offering by VTB, the
proceeds of which the bank intends to invest to expand its domestic
market share 14. VTB, Russia’s second-largest bank, is state-
controlled. Together the SWFs –all from oil producing countries-
contributed approximately $1 billion of the new capital raised. While
certainly not a transaction that would offer strategic diversification
benefits, the deal rather was reported as a motivated as a proxy, i.e.
a channel through which to gain increased exposure to Russia’s
positive demographics: 140 million raising middle class
consumers 15.
conclusions
We close here with a brief reflection on an important, but
sometimes neglected linked between SWFs and the global financial
services industry: capacity building. In 2013 there appeared an
increased number of reports that SWFs had begun more actively to
move away from civil-service pay structures - higher base pay versus
bonuses - and were changing compensation schemes to more
effectively compete with international financial services firms for top
banking talent. 16 Despite being both clients to and competitors of
global financial institutions, it is often easy to overlook the
expanding network effects of SWFs as they become even more
integrated into the fabric of global finance. Whether through
enhanced training, relationships with investment partners,
co-investment or employment mobility, many SWFs took another
step forward in 2013 to build and acquire the advance capacity that
will serve them well as strategic global investors, particularly in
banking and finance.
The financial services investment activity by SWF in 2013 was marked
as a year of growth and increased sector penetration that reflected
legacy themes, but also a launch forward into new regions,
motivated in part by positive outlooks for growth spurred by
advancing socio-economic demographics. Certainly, for some
sovereign investors, strategic objectives remain very much centered
on preserving domestic financial stability and strengthening the
foundations of their domestic banking systems. However, as the
negative effects of the GFC slide further into our past, the question
of SWF strategic engagement in financial services takes on new
meaning. Rather than rescue and recapitalization, perhaps the time
is soon approaching to focus on innovation and growth.
13 “Singapore Invests in New Cambodian Bank”, The Cambodian Daily, 11 September 2013 at http://www.cambodiadaily.com/archives/singapore-invests-in-new-cambodian-bank-42137/14 “Russia’s VTB wins sovereign backing for $3.3 billion share issue”, Reuters, 29 April 2013 at http://www.reuters.com/article/2013/04/29/us-russia-vtb-idUSBRE93S0482013042915 Ibid..
16 See http://news.efinancialcareers.com/us-en/150642/working-for-a-sovereign-wealth-fund-has-the-potential-to-be-extremely-lucrative/

Appendix. ESADEgeoSovereign Wealth Funds Ranking 2014

Appendix. ESADEgeoSovereign Wealth Funds Ranking 2014
Sovereign Wealth Funds 2014Appendix. ESADEgeo Sovereign Wealth Funds Ranking 2014
101

Sovereign Wealth Funds 2014Appendix. ESADEgeo Sovereign Wealth Funds Ranking 2014102
ESADEgeo Sovereign Wealth Funds Ranking 2014
Table 1
ESADEgeo Sovereign Wealth Funds Ranking 2014*
Ranking Sovereign Wealth Fund Assets under Management ($bn) Country Established
1 Government Pension Fund Global 897.60 Norway 1990
2 SAMA Foreign Holdings 741.80 Saudi Arabia 19523 Abu Dhabi Investment Authority 589.00 UAE 19764 China Investment Corporation 575.10 China 20075 Kuwait Investment Authority 355.00 Kuwait 19536 GIC 315.00 Singapore 19817 State Administration of Foreign Exchange (SAFE) 300.00 China 19978 Temasek Holdings 215.00 Singapore 19749 National Social Security Fund 179.60 China 200010 Qatar Investment Authority 175.00 Qatar 200511 Investment Corporation of Dubai ^ 160.00 UAE 200612 Samruk-Kazyna ^ 103.30 Kazakhstan 200813 Dubai World 100.00 UAE 200614 Australia Future Fund 97.57 Australia 200415 National Wealth Fund 87.62 Russia 200816 Revenue Regulation Fund ^ 77.00 Algeria 200017 National Oil Fund of Republic of Kazakhstan 72.70 Kazakhstan 200018 Libyan Investment Authority 66.00 Libya 200619 Hong Kong Monetary Authority Inv. 65.10 Hong Kong (China) 199320 International Petroleum Investment Company 63.40 UAE 200021 Mubadala Development Company PJSC 60.90 UAE 200222 National Development 58.60 Iran 201123 Korea Investment Corporation 56.60 South Korea 200524 Alaska Permanent Fund 51.10 USA – Alaska 197625 Khazanah Nasional Berhard 40.90 Malaysia 199326 Brunei Investment Agency 39.00 Brunei 198327 State Oil Fund of Azerbaijan (SOFAZ) 36.60 Azerbaijan 199928 Banque Publique d'Investissement ^ 33.60 France 200829 Texas Permanent School Fund 30.60 USA – Texas 185430 New Zealand Superannuation Fund 25.51 New Zealand 200131 National Pensions Reserve Fund 20.20 Ireland 200132 New Mexico State Investment Council 19.10 USA – New Mexico 195833 Alberta Heritage Savings Trust Fund 17.30 Canada 197634 Timor-Leste Petroleum Fund 15.70 Timor-Leste 200535 Fondo de Estabilidad Económica y Social (FEES) 15.20 Chile 200736 State General Reserve Fund 13.00 Oman 198037 Russian Direct Investment Fund 10.00 Russia 201138 Fondo de Estabilización Fiscal ^ 8.50 Peru 201139 Fondo de Reserva de Pensiones 7.50 Chile 200640 Sovereign Fund of Brazil 7.00 Brazil 200841 Bahrain Mumtalakat Holding Company BSC 6.80 Bahrain 200642 Permanent Wyoming Mineral Trust Fund 6.70 USA – Wyoming 197443 Fondo Strategico Italiano ^ 6.00 Italy 201144 Oman Investment Fund 6.00 Oman 200645 Quebec’s Generations Fund ^ 5.20 Canada 200646 Pula Fund ^ 5.10 Botswana 199447 Heritage and Stabilization Fund 5.10 Trinidad and Tobago 200048 Fundo Soberano de Angola 5.00 Angola 201249 Alabama Trust Fund 2.20 USA – Alabama 198550 Oil Revenues Stabilization Fund of Mexico ^ 1.90 Mexico 200051 Fonds de Stabilisation des Recettes Budgétaires ^ 1.70 Dem. Rep. Congo 200552 Idaho Endowment Fund 1.70 USA – Idaho 196953 North Dakota Legacy Fund 1.70 USA – North Dakota 201154 Fondo de Ahorro de Panamá (FAP) 1.40 Panama 201155 Nigerian Sovereign Investment Authority 1.00 Nigeria 201156 Western Australia Future Fund 1.00 Australia 201257 Fonds souverain d’investissement stratégiques (FONSIS) ^ 1.00 Senegal 201258 Fondo para la Estabilización Macroeconímica (FEM) ^ 0.70 Venezuela 199859 Palestine Investment Fund 0.70 Palestine 2003
60 State Capital Investment Corporation 0.70 Vietnam 2006

Sovereign Wealth Funds 2014Appendix. ESADEgeo Sovereign Wealth Funds Ranking 2014
103
Ranking Sovereign Wealth Fund Assets under Management ($bn) Country Established
61 Revenue Equalization Reserve Fund 0,52 Kiribati 195662 Ghana Stabilization Fund ^ 0,30 Ghana 201163 Ghana Heritage Fund ^ 0,10 Ghana 201164 Agaciro Development Fund 0,03 Rwanda 201465 National Investment Corporation N/A Kazakhstan 201266 Emirates Investment Authority N/A UAE 200767 Abu Dhabi Investment Council N/A UAE 199968 China-Africa Development Fund N/A China 200769 Public Investment Fund N/A Saudi Arabia 200870 1Malaysia Development Fund Bhd (1MDB) N/A Malaysia 200971 Mauritius Sovereign Wealth Fund N/A Mauritius 201072 Ras Al Khaimah (RAK) Investment Authority N/A UAE 200573 Colombia Sovereign Wealth Fund N/A Colombia 201174 Sovereign Fund of the Gabonese Republic ^ N/A Gabon 199875 Government Investment Unit ^ N/A Indonesia 200676 National Fund for Hydrocarbon Reserves ^ N/A Mauritania 200677 Oil Revenue Stabilization Fund (ORSF) N/A South Sudan 200878 Fund for Future Generations ^ N/A Equatorial Guinea 200279 Human Development Fund ^ N/A Mongolia 2008
80 National Investment Fund ^ N/A Syria 201281 Permanent Fund for Future Generation N/A Santo Tomé y Principe 2004
82 Stabilization Fund ^ N/A Mongolia 2011
83 Oman Investment Corporation N/A Oman 2005
84 Papua New Guinea SWF N/A Papua New Guinea 2011
Total ($bn) 5,865
Source: ESADEgeo (2014) with information obtained from funds’ annual reports and websites. In their absence we relied inter alia on the estimates of SovereigNet (The Fletcher
School-Tufts University), Sovereign Wealth Center, Ashby Monk (Institutional Investor) and Preqin.
* This list contains the 84 active sovereign wealth funds as at September 2014.
^ Using a stricter definition (see Capapé and Guerrero, 2013), these sovereign wealth funds would be excluded from the ranking. For example funds dedicated exclusively to stabilisation, with 100% domestic portfolios, or investing only in fixed income.
Table 2
Potential new funds
Ranking Sovereign Wealth Fund Assets under Management ($bn) Country Established
83 Slovenia SWF N/A Slovenia N/A
84 Northwest Territories SWF N/A Canada N/A
85 Japan SWF N/A Japan N/A
86 India SWF N/A India N/A
87 Israel SWF N/A Israel N/A
88 Philippines SWF N/A Philippines N/A
89 South Africa SWF N/A South Africa N/A
90 Lebanon SWF N/A Lebanon N/A
91 Bolivia SWF N/A Bolivia N/A
92 Georgia SWF N/A Georgia N/A
93 Sierra Leone SWF N/A Sierra Leone N/A
94 Tunisia SWF N/A Tunisia N/A
95 Kenya SWF N/A Kenya N/A
96 Uganda SWF N/A Uganda N/A
97 Zambia SWF N/A Zambia N/A
98 Mozambique SWF N/A Mozambique N/A
99 Namibia SWF N/A Namibia N/A
100 Zimbabue SWF N/A Zimbabwe N/A
101 Tanzania SWF N/A Tanzania N/A
102 Liberia SWF N/A Liberia N/A
103 Guatemala SWF N/A Guatemala N/A
104 Saskatchewan SWF N/A Canada N/A
Note: These 22 funds were not active when this edition went to press. Their establishent is currently being discussed in the various States.
This report was developed by ICEX Spain Trade & Investment initiative by:
• Javier Santiso (Editor) Professor of Economics, ESADE Business School Vice President, ESADEgeo Center for Global Economy and Geopolitics
• Germán Ríos Director of Strategic Affairs, CAF - Development Bank of Latin America
• Patrick Schena Adjunct Assistant Professor, The Fletcher School, Tufts University Senior Fellow and Co-Head, SovereigNet, The Fletcher School, Tufts University
• Neeraj Prasad PhD Candidate, The Fletcher School, Tufts University
• Javier Capapé PhD Candidate, ESADE Business School Researcher, ESADEgeo Center for Global Economy and Geopolitics
• Tomás Guerrero PhD Candidate, University Carlos III Madrid Researcher, ESADEgeo Center for Global Economy and Geopolitics
• Paul Rose Professor of Law, Ohio State University – Moritz College of Law Executive Director, Law, Finance & Governance @ Ohio State Non-Resident Fellow, ESADEgeo Center for Global Economy and Geopolitics
• Victoria Barbary Director, Sovereign Wealth Center. Non-Resident Fellow, ESADEgeo Center for Global Economy and Geopolitics
• Xavier Reig CEO & Co-Founder, Black Capital
Analysis and Coordination
Javier Capapé & Tomás Guerrero
Infographics and Design
Samuel Granados
Yolanda Clemente & Irene de la Torre (Infographic #4 and Charts)
Catálogo de publicaciones de la AGE: http://publicacionesoficiales.boe.es
NIPO (paper): 726-14-051-5
NIPO (on line): 726-14-052-0
DL: M-30590-2014

