magneto-telluric (mt) data processing
TRANSCRIPT

Presented at Short Course VII on Exploration for Geothermal Resources, organized by UNU-GTP, GDC and KenGen, at Lake Bogoria and Lake Naivasha, Kenya, Oct. 27 – Nov. 18, 2012.
GEOTHERMAL TRAINING PROGRAMME Kenya Electricity Generating Co., Ltd.
MAGNETO-TELLURIC (MT) DATA PROCESSING
Raymond Mwakirani Geothermal Development Company Ltd,
P. O. Box 1770, Nakuru KENYA
ABSTRACT
One of the most successful ways to improve the quality of MT transfer functions estimations is to follow the principles of robust statistics. Adaptation of robust statistics to the MT data processing problem has been discussed by Egbert and Booker (1986), Chave et al. (1987) and Chave and Thomson (2003). This paper is intended to guide on the Magneto-telluric data processing. It introduces softwares applied in data processing. It details procedures used in the MT data processing with emphasis on actual steps that are followed to realise good results.
1. INTRODUCTION The MT method is a passive-surface electromagnetic geophysical technique that measures variations in the Earth's natural electromagnetic fields to investigate the electrical resistivity structure of the subsurface from depths of tens of meters to tens of kilometers (Vozoff, 1991). Worldwide lightning activity at frequencies of 10,000 to 1 Hertz (Hz) and geomagnetic micro-pulsations at frequencies of 1 to 0.001 Hz provide the majority of natural signal used by the MT method. A small amount of electromagnetic energy reflects and propagates vertically into the earth due to the resistivity contrast at the air-earth interface (Vozoff, 1972). The natural fields are recorded in the xyz direction for the magnetic field and the xy direction for the electric field at the Earth’s surface. The resulting time-series signals are used to derive tensor apparent-resistivities and phases by first converting them to complex cross-spectra using Fourier-transform techniques. Least squares, cross-spectral analysis (Bendat and Piersol, 1971) is used to solve for a tensor transfer function. Prior to conversion to apparent resistivity and phase, the tensor is normally rotated into principal directions that usually correspond to the direction of maximum and minimum apparent resistivity. Checks for coherency, smoothness and correspondence between magnetic and electric channels is critically evaluated so as to ensure good resistivity results. An introduction to the MT method and references for a more advanced understanding are contained in Dobrin and Savit (1988) and Vozoff (1991). 2. DATA PROCESSING OVERVIEW The following steps are followed:
Mwakirani 2 Magneto-telluric data processing
1. Transfer the files from the MTU-A’s Flash card to your PC hard drive. 2. Verify and edit the parameters saved in the Site Parameters Table (.TBL) file of each site. 3. Archive the raw data and Site Parameters on CD-R, DVD, or other storage medium. 4. Create Fourier coefficients from the raw data. 5. Reprocess the Fourier coefficients using a robust reprocessing program and possibly data from the reference site. 6. Edit the resulting crosspowers one frequency at a time to verify the viability of the sounding and to reduce or eliminate low quality data. 7. Translate the edited crosspowers into industry standard EDI format for use by interpretation software.
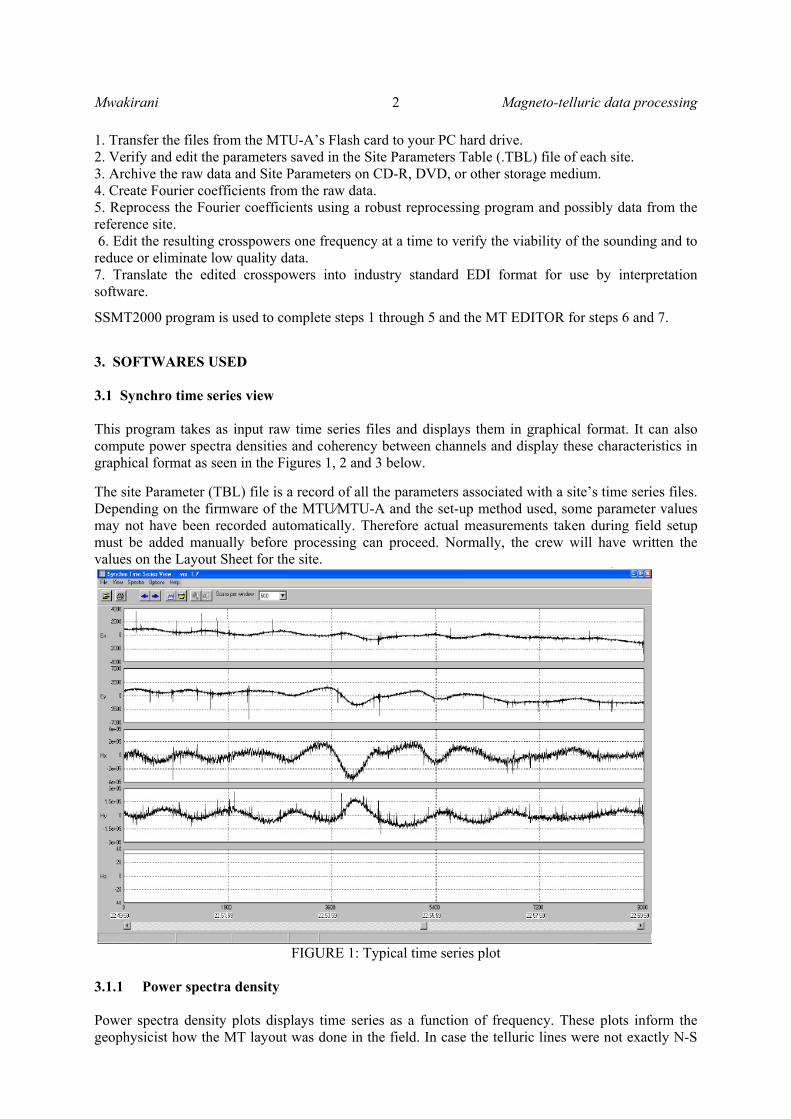
SSMT2000 program is used to complete steps 1 through 5 and the MT EDITOR for steps 6 and 7. 3. SOFTWARES USED 3.1 Synchro time series view This program takes as input raw time series files and displays them in graphical format. It can also compute power spectra densities and coherency between channels and display these characteristics in graphical format as seen in the Figures 1, 2 and 3 below.
The site Parameter (TBL) file is a record of all the parameters associated with a site’s time series files. Depending on the firmware of the MTU⁄MTU-A and the set-up method used, some parameter values may not have been recorded automatically. Therefore actual measurements taken during field setup must be added manually before processing can proceed. Normally, the crew will have written the values on the Layout Sheet for the site.
FIGURE 1: Typical time series plot
3.1.1 Power spectra density Power spectra density plots displays time series as a function of frequency. These plots inform the geophysicist how the MT layout was done in the field. In case the telluric lines were not exactly N-S

Magneto-telluric data processing 3 Mwakirani
and E-W then the curves in the upper plot will be far apart. Similarly if the magnetic coils were not aligned exactly in their respective direction or they are not properly leveled then the lower curves will out of phase by a big margin.
FIGURE 2: Power spectra density plot
3.1.2 Coherency test Coherence is a factor that relates the magnetic field to its orthorgonal electric field. If the data is coherent then Hx and Ey should be similar so is the Hy and Ex. Ideally the coherence should be 1 but that does not happen, therefore the closer it is to 1 the more coherent the data is.
FIGURE 3: Coherence plot, blue shows Hx vs Ey and green shows Hy vs Ex

Mwakirani 4 Magneto-telluric data processing
3.2 SSMT2000 This program takes as input raw time series files, calibration files, and site parameter files to produce Fourier coefficients, which are then reprocessed with data from reference sites, using robust routines. The output is MT Plot files containing multiple crosspowers for each of the frequencies analysed. The processing starts with editing site parameters to reflect the measured readings from the field as shown in Figure 5. The data is then fourier transformed by TStoFT to generate fourier coefficients.
FIGURE 4: SSMT 2000 processing package
FIGURE 5: Field parameter file

Magneto-telluric data processing 5 Mwakirani
3.2.1 Verifying acquisition times Typically, data is combined from one or two survey sites with data from a remote reference site in the robust processing stage, in order to reduce the effects of noise. However, only data acquired over the same time span can be combined. SSMT2000 makes it easy to review the time spans over which data were acquired. To review data acquisition time spans, click on View Time icon from the main menu and the data acquisition period is displayed as seen below.
FIGURE 6: Acquisition time display
3.2.2 Robust processing parameters Two schemes of initial processing that attempt to filter out noise-affected data are controlled by the robust processing parameters: Coherency and Rho variance. This process reduces the size of the error bars and smooth the curves in plots of apparent resistivity. “Coherency” refers to eight processing schemes that compare survey site data with reference site data, and process only data that are coherent. Cultural noise that is present at the survey site but not at the reference site is therefore reduced. Before running robust processing it is first necessary to set up the parameters for this stage of processing. Robust Parameter (PRM) files are unique to each site and cannot be copied to other folders and used to process other data. This parameter file is available from the SSMT program by clicking on Edit PRM. At this stage you have a choice of whether to process data using local or remote magnetic reference.

Mwakirani 6 Magneto-telluric data processing
FIGURE 7: Robust processing parameter file
3.3 MT-Editor This program takes as input the MT Plot files created by SSMT2000 and displays the resistivity and phase curves as well as the individual crosspowers that are used to calculate each point on the curves. Crosspowers that were affected by noise can automatically or manually be excluded from the calculations. The program also allows you to display a variety of parameters of the plot files such as tipper magnitude, coherency between channels, and strike direction. The output is industry-standard EDI files suitable for use with geophysical interpretation software such as WinGLink or LINUX based TEMTD. The primary objective of editing is to create a smooth apparent resistivity curve, by eliminating from the calculation of each data point any crosspowers that were affected by noise. The editing is done by deleting or restoring individual crosspowers in the two graphs on the right of the window. The effect can be seen in the two graphs on the left of the window. There are two methods of editing, auto and manual, though it’s best to start with autoediting and then refine the result with manual editing.

Magneto-telluric data processing 7 Mwakirani
FIGURE 8: MT-editor frame
REFERENCES Bendat, J.S., and Piersol, A.G., 1971: Random data analysis and measurement procedures: New York, Wiley Interscience, 407 p. Chave, A.D., and D.J. Thomson, 2003: A bounded influence regression estimator based on the statistics of the hat matrix, J. Roy. Stat. Soc., Ser. C, 52, 307-322. Chave, A.D., D.J. Thomson, and M.E. Ander, 1987: On the robust estimation of power spectra, coherences, and transfer functions, J. Geophys. Res., 92, 633-648. Dobrin, M.D., and Savit, C.H., 1988: Introduction to geophysical prospecting (4th ed.): New York, McGraw-Hill, 867 p. Egbert, G.D., and Booker, J.R., 1986: Robust estimation of geomagnetic transfer functions, Geophys. J. R. astr. Soc., 87, 173-194. Vozoff, K., 1972: The magnetotelluric method in the exploration of sedimentary basins: Geophysics, v. 37, p. 980–1041. Vozoff, K., 1991: The magnetotelluric method, in Nabighian, M.N., Electromagnetic methods in applied geophysics: Tulsa, Okla., Society of Exploration Geophysicists, v. 2, pt. B, p. 641–711.