macroeconomic & political dynamics agenda • economic and demand trends for 2016 • us...
TRANSCRIPT

Macroeconomic & Political Dynamics
Peter Morris, Chief Economist, Ascend

Macro Economics and Political Dynamics - 2016
Peter Morris Chief Economist Aviation Frontiers 2016 Dublin January 2016

3
Agenda • Economic and Demand Trends for 2016 • US Domestic Trends • Oil price and effects on the market • Aircraft orders • Global Risks 2015/16

4
Western Europe likely to see the weakest growth, Asia the strongest

5
Majority of regions expect slight improvement in 2016
EIU Dec 2015

6
Tourism - 2015 slightly better than 2014, with some significant regional variances

7
World Trade sees continued slow growth in 2015
Source: WTO

8
Overall, OECD lead indicators suggest stability. US a concern?
Source: OECD 2016
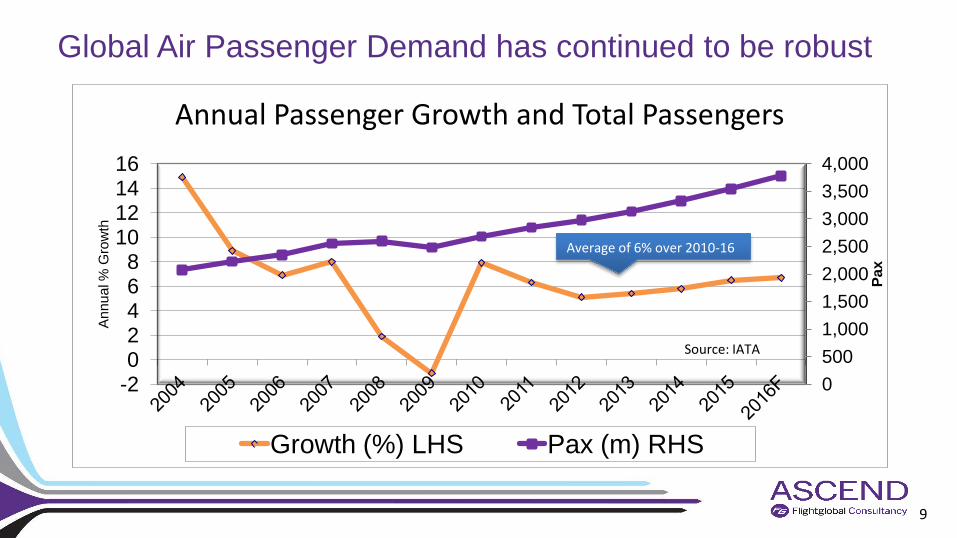
9
Global Air Passenger Demand has continued to be robust
0 500 1,000 1,500 2,000 2,500 3,000 3,500 4,000
-2 0 2 4 6 8
10 12 14 16
Pax
Annu
al %
Gro
wth
Annual Passenger Growth and Total Passengers
Growth (%) LHS Pax (m) RHS
Source: IATA
Average of 6% over 2010-16

10
Overall industry profits, margins solid since 2010
-1 0 1 2 3 4 5 6 7 8 9
-10 0
10 20 30 40 50 60 70
% M
argi
n
$Bn
Global Airline Profits and % (EBIT) Margin
Profit ($Bn) % margin
Source: IATA

11
Asia-Pacific (APAC) and Middle East (ME) continued to lead demand growth globally in 2015
Source – IATA, Year to Date to end November 2015, IATA Dec Forecast
0%
2%
4%
6%
8%
10%
12%
14%
16%
Africa Asia-Pacific Middle East Latin America North America
Europe Global 2015
Pre
dict
ed /
Actu
al G
row
th
Predicted Traffic Growth Predicted Capacity Growth Year to Date Traffic Year to Date Capacity

12
Traffic and Capacity expected to grow by 6-7% globally in 2016
Source – IATA
0%
2%
4%
6%
8%
10%
12%
14%
Africa Asia-Pacific Middle East Latin America North America
Europe Global
2016
Pre
dict
ed G
row
th
Predicted Traffic Growth Predicted Capacity Growth

13
The changing face of the industry – U.S. Consolidation
0
20
40
60
80
100
Airlines Flights(*10^4) Seats(*10^6) O-D pairs(*10)
Changes in the US Domestic Market 2005-2015
Aug-05 Aug-15

14
60 + airports lost domestic service
0
50
100
150
200
250
300
350
400
450
No flights < 10 flights 10-50 flights 50-100 flights 100-200 flights
200-350 flights
350-700 flights
700-1000 flights
> 1000 Fllights
Airp
orts
Distribution of US scheduled daily flight departures by airport 2005 vs 2015 (August)
2005 2015

In a decade, 21% fewer flights, and some major US airports have lost 50%+ of domestic service
Change in monthly departing scheduled flights (Top 10) 2015 vs 2005
SFO 3455 SEA 2812 DAL 2181 JFK 1855 CLT 1738 AUS 743 LAX 702 LKE 700 DCA 584 MIA 554
IAH -4173 -21% MSP -4414 -22% PIT -4702 -49% SLC -5090 -34%
DTW -5276 -26% ATL -5281 -13% CLE -5689 -57%
MEM -6456 -72% IAD -9595 -54% CVG -15606 -79%
Growth Decline
August Schedules, Innovata

16
How have oil prices played through?
•Dramatically falling oil price since 2014Q2
•Falling expectations on future oil prices
•Additional supply on horizon
Oil
•GDP stimulus for oil import countries, and overall
•Reduced inflation •Losers among ‘oil rent’
economies
GDP •Reduction in ticket price possible
•Hedging a factor •Exchange rate effects vs. $ •Competition level drives
speed of price change?
Price
•Increases in travel and
aircraft demand •Could be +2%/+4% extra
under certain scenarios •Big benefit for previously
marginal airlines •6.7% RPK growth 2015
Air Travel

17
A view from 2008

History lesson? There were dire predictions of the impact of fuel price on demand in 2008. While it was still a huge challenge, demand proved more robust, and supply costs more flexible than expected
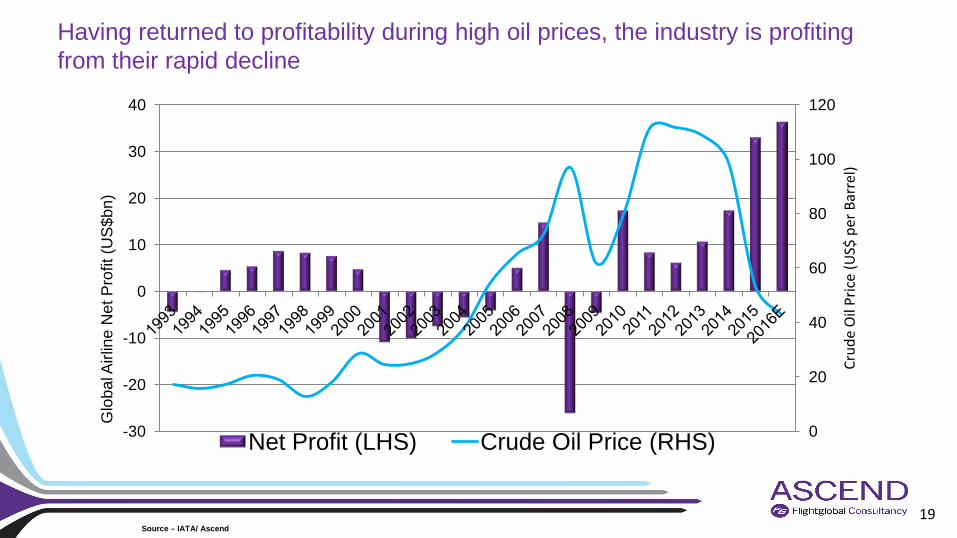
19
Having returned to profitability during high oil prices, the industry is profiting from their rapid decline
0
20
40
60
80
100
120
-30
-20
-10
0
10
20
30
40
Crud
e O
il Pr
ice
(US$
per
Bar
rel)
Glo
bal A
irlin
e N
et P
rofit
(US$
bn)
Net Profit (LHS) Crude Oil Price (RHS)
Source – IATA/ Ascend

20
70%+ Collapse of oil price in 18 months

21
Oil ‘Futures’ prices suggests only slow rebound - and have reduced dramatically since last year
Source: Barchart
0
20
40
60
80
100
Jan-15 Jan-16 Jan-17 Jan-18 Jan-19 Jan-20
Future Brent Crude Price ($/Barrel) for Delivery 2016-20
At Jan 2015 At Jan 2016

22
Next generation lease rate premiums are sensitive to fuel price

23
Next generation fuel burn environmentally more efficient
Source – Ascend analysis of Airbus and Boeing data, 3,000nm sector
0
10
20
30
40
50
60
70
80
90
767-300ER 787-8 A330-300 A330-900neo
CO
2 em
issi
ons
(g p
er p
ax-k
m) -13%
-14%

24
Order volumes continue to be high
Source: Flightglobal Fleets Analyzer – orders for commercial customers only
0
500
1,000
1,500
2,000
2,500
3,000
3,500
4,000
2005 2006 2007 2008 2009 2010 2011 2012 2013 2014 2015
Com
mer
cial
jet o
rder
s
Jet Gross Orders Jet Net Orders
$123bn
$209bn

25
Commercial jet backlog at record high
Source: Flightglobal Fleets Analyzer & Ascend Values (2016$ Base Full Life Value)
0%
10%
20%
30%
40%
50%
60%
70%
0
2,000
4,000
6,000
8,000
10,000
12,000
14,000
16,000
1990
19
91
1992
19
93
1994
19
95
1996
19
97
1998
19
99
2000
20
01
2002
20
03
2004
20
05
2006
20
07
2008
20
09
2010
20
11
2012
20
13
2014
20
15
Bac
klog
as
% o
f Fle
et
Com
mer
cial
Jet
Ord
er B
ackl
og
Backlog at Year End Backlog as % of Fleet
Backlog Value Now $960bn

26
Deliveries represent typically 6-8% of the global fleet
Source: Flightglobal Fleets Analyzer & Flightglobal Fleet Forecast
0% 1% 2% 3% 4% 5% 6% 7% 8% 9% 10% 11%
0 200 400 600 800
1000 1200 1400 1600 1800 2000 2200
1990
19
91
1992
19
93
1994
19
95
1996
19
97
1998
19
99
2000
20
01
2002
20
03
2004
20
05
2006
20
07
2008
20
09
2010
20
11
2012
20
13
2014
20
15
2016
20
17
2018
20
19
2020
20
21
2022
20
23
2024
Del
iver
ies
as %
of F
leet
in S
ervi
ce
Pass
enge
r Airl
iner
Del
iver
ies
Deliveries / Forecast Deliveries Deliveries as % of Fleet in Service

27
Comparing take off - Widebody programme
0
200
400
600
800
1,000
1,200
Year 1 Year 2 Year 3 Year 4 Year 5 Year 6 Year 7 Year 8 Year 9 Year 10 Year 11
A350 and 787 Cumulative Orders from First Year
787 A350

28
Comparing Take Off - Narrowbody Programmes
0 500
1,000 1,500 2,000 2,500 3,000 3,500 4,000
Year 1 Year 2 Year 3 Year 4 Year 5
A320neo and 737 Max Cumulative Orders from First Year
A320neo 737 Max

29
Trying to categorise and assess Global Risk
Source: World Economic Forum

30
Ratings for Likelihood and Impact of Global Risks
Source: Global Risks Survey 2015 World Economic Forum

31
Significant variance in risk factors by region

32
Heightened concerns on geopolitical issues and terrorism
Source: McKinsey, Dec 15

33
Caution in Developing Markets
Source: McKinsey, Dec 15

Summary
GDP growth continues (if weak) and cost structures under control Oil price continuing fall is a big plus for industry, and continues (for five years?) Global Traffic Demand 2016 will likely be higher than previously forecast, with local exceptions Various stakeholders will bid for a share of the ‘new’ profitability Aircraft demand strong, with a few ‘widows and orphans’ Current orders seem robust and younger/mid life aircraft more attractive Wider demand risk factors continue to fission

A final thought, after analysing the industry for 30 years
• Positive GDP Growth • Profitable Industry • Full Order Books • Possible 50% (and more) fuel cost decline • New aircraft technology coming on stream

36
Flightglobal and Ascend – Aviation Connected
Peter Morris Chief Economist +44 (0)20 8564 6790 [email protected]
The information contained in our databases and used in this presentation has been assembled from many sources, and whilst reasonable care has been taken to ensure accuracy, the information is supplied on the understanding that no legal liability whatsoever shall attach to Ascend Advisory, its offices, or employees in respect of any error or omission that may have occurred.