machine vision algorithms applied to dynamic traffic … · machine vision algorithms applied to...
TRANSCRIPT

Dyna, year 80, Nro. 178, pp. 132-140. Medellin, April, 2013. ISSN 0012-7353
MACHINE VISION ALGORITHMS APPLIED TO DYNAMIC TRAFFIC LIGHT CONTROL
ALGORITMOS DE VISIÓN DE MÁQUINA APLICADOS AL CONTROL DINAMICO DE INTERSECCIONES SEMÁFORIZADAS
FABIO ANDRÉS ESPINOSA VALCÁRCELMechatronic Engineer, Universidad Militar Nueva Granada, [email protected]
CAMILO ANDRÉS GORDILLO CHAVESMechatronic Engineer, Universidad Militar Nueva Granada, [email protected]
ROBINSON JIMÉNEZ MORENOM.Sc. Electronic Engineer, Universidad Militar Nueva Granada, [email protected]
OSCAR FERNANDO AVILÉS SANCHEZPh.D. Electronic Engineer Universidad Militar Nueva Granada, [email protected]
Received for review March 25 th, 2012, accepted October 23th, 2012, final version October, 30 th, 2012
ABSTRACT: This paper presents a fuzzy traffic controller that in an autonomous, centralized and efficient way, manages vehicular traffic flow in a group of intersections. The system uses a computer vision algorithm to detect the number of cars in images captured by a set of strategically placed cameras at every intersection. Using this information, the system selects the sequence of actions that optimize traffic flow within the control area, in a simulated scenario. The results obtained show that the system reduces the delay times for each vehicle by 20% and that the controller is able to adapt smoothly to different flow changes.
KEYWORDS: Traffic control, computer vision, optimization, fuzzy control, object detection.
RESUMEN: Este artículo presenta el desarrollo de un controlador de tráfico difuso capaz de gestionar de manera autónoma, centralizada y eficiente, el flujo vehicular en un grupo de intersecciones. El sistema emplea un algoritmo de visión artificial que le permite detectar el número de autos presentes en imágenes capturadas por un conjunto de cámaras estratégicamente ubicadas en cada intersección. Usando esta información, el sistema selecciona la secuencia de acciones que optimicen el flujo vehicular dentro de la zona de control, en un escenario simulado. Los resultados obtenidos muestran que el sistema disminuye en un 20% los tiempos de retraso para cada vehículo y que además es capaz de adaptarse rápida y eficientemente a los cambios de flujo.
PALABRAS CLAVE: Control de tráfico, visión de máquina, optimización, control difuso, detección de objetos.
1. INTRODUCTION
Nowadays Bogota city presents serious mobility problems, which affects a large percent of citizens and drastically harms its productivity and competitiveness [1]. According to [2], one of the main reasons that contribute to this situation, is the use of inefficient and obsolete traffic controllers, which are not capable of efficiently managing the traffic flow in the city. These fixed time controllers, require a periodical configuration based on statistical flow analysis, which generally do not reflect in an accurate way the traffic flow conditions.
Several intelligent traffic control systems have been
made; these are capable of managing vehicular flow efficiently and dynamically, relying on information provided by a sensor network of different kinds, but mostly by inductive and magnetic sensors.
Although the performance of these systems easily exceeds the performance of fixed time controllers [3], they present a maintenance problem mainly concerning the kind of sensors used. The great majority of current solutions use the information provided by inductive sensors, which are installed directly into the asphalt. This kind of deployment leaves them exposed to all kinds of physical interactions, which significantly reduce their lifespan[4].
Dyna 178, 2013 133
In order to avoid this problem, this work presents a completely autonomous dynamic controller, which is capable of managing the state of the traffic lights in a simulated scenario in a coordinated and centralized way, using the information provided by a set of cameras. According to [5], this kind of sensor gives the system great installation flexibility, due to the possibility of strategic location within the control zone, avoiding the problems described above and increasing the durability, efficiency and profitability of the system.
The main contribution of this controller’s development is the use of a vehicular detection algorithm, which accurately identifies, the number of vehicles present in each road. Besides, the controller has a fuzzy optimization algorithm, which using the data provided by the detection algorithm, switches the state of the traffic lights, ensuring a continuous and homogeneous traffic flow.
This paper consists of six sections besides this introduction: In section 2, the basic theory of vehicular traffic controllers and object detection techniques are summarized. Section 3 presents the details of the developed system. Section 4 presents the characteristics of the designed test scenario, while the results are showed at Section 5. Finally, Section VI presents achieved conclusions.
2. BACKGROUND AND PREVIOUS RESEARCH
Below, the most relevant terms and investigations in the area of traffic controllers and vehicle detection from images are mentioned.
2.1. Traffic controllers
There are two main kinds of traffic controllers: static ones and dynamical ones. The former are those where a sequence of previously programmed actions are followed, while the latter makes use of a certain acquisition method, which allows the system to identify the state of the traffic flow on the roads and to control it in a more dynamic and effective way [6].
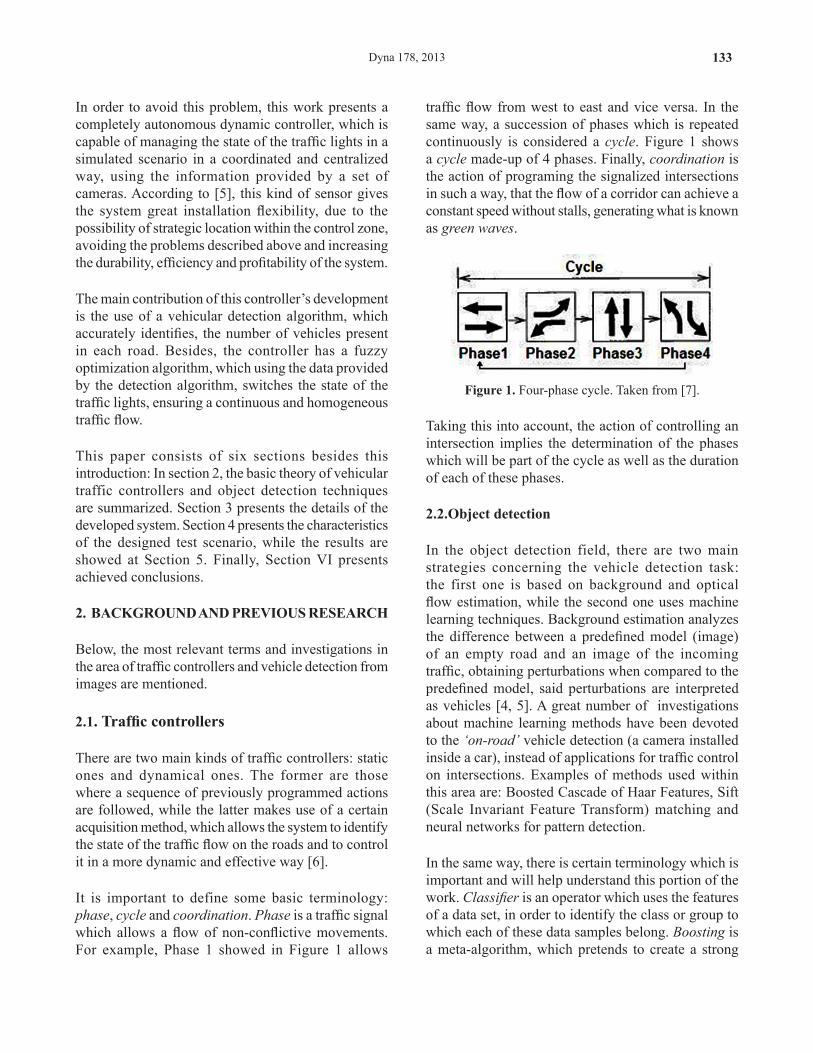
It is important to define some basic terminology: phase, cycle and coordination. Phase is a traffic signal which allows a flow of non-conflictive movements. For example, Phase 1 showed in Figure 1 allows
traffic flow from west to east and vice versa. In the same way, a succession of phases which is repeated continuously is considered a cycle. Figure 1 shows a cycle made-up of 4 phases. Finally, coordination is the action of programing the signalized intersections in such a way, that the flow of a corridor can achieve a constant speed without stalls, generating what is known as green waves.
Figure 1. Four-phase cycle. Taken from [7].
Taking this into account, the action of controlling an intersection implies the determination of the phases which will be part of the cycle as well as the duration of each of these phases.
2.2.Object detection
In the object detection field, there are two main strategies concerning the vehicle detection task: the first one is based on background and optical flow estimation, while the second one uses machine learning techniques. Background estimation analyzes the difference between a predefined model (image) of an empty road and an image of the incoming traffic, obtaining perturbations when compared to the predefined model, said perturbations are interpreted as vehicles [4, 5]. A great number of investigations about machine learning methods have been devoted to the ‘on-road’ vehicle detection (a camera installed inside a car), instead of applications for traffic control on intersections. Examples of methods used within this area are: Boosted Cascade of Haar Features, Sift (Scale Invariant Feature Transform) matching and neural networks for pattern detection.
In the same way, there is certain terminology which is important and will help understand this portion of the work. Classifier is an operator which uses the features of a data set, in order to identify the class or group to which each of these data samples belong. Boosting is a meta-algorithm, which pretends to create a strong
Espinosa et al134
classifier through the addition of weak classifiers, and a feature is considered as an important piece of information, which represents a similarity between the elements in a data set [8].
There are plenty of investigations in the area of vehicle detection through images; the following are some of the most important research articles in this field: in [9] and [10], an on-road vehicle detector was developed using a Haar-like feature detector, obtaining a detection accuracy of 88.6% and 76% respectively. In [11] and [12] authors used the background estimation technique with an efficiency rate over 90% in both cases. On the other hand, in [13] a morphological edge detector (SMED) was developed, which presents higher insensitivity to illumination changes than the background estimation, obtaining an accuracy of 95%.
3. TRAFFIC CONTROL SYSTEM
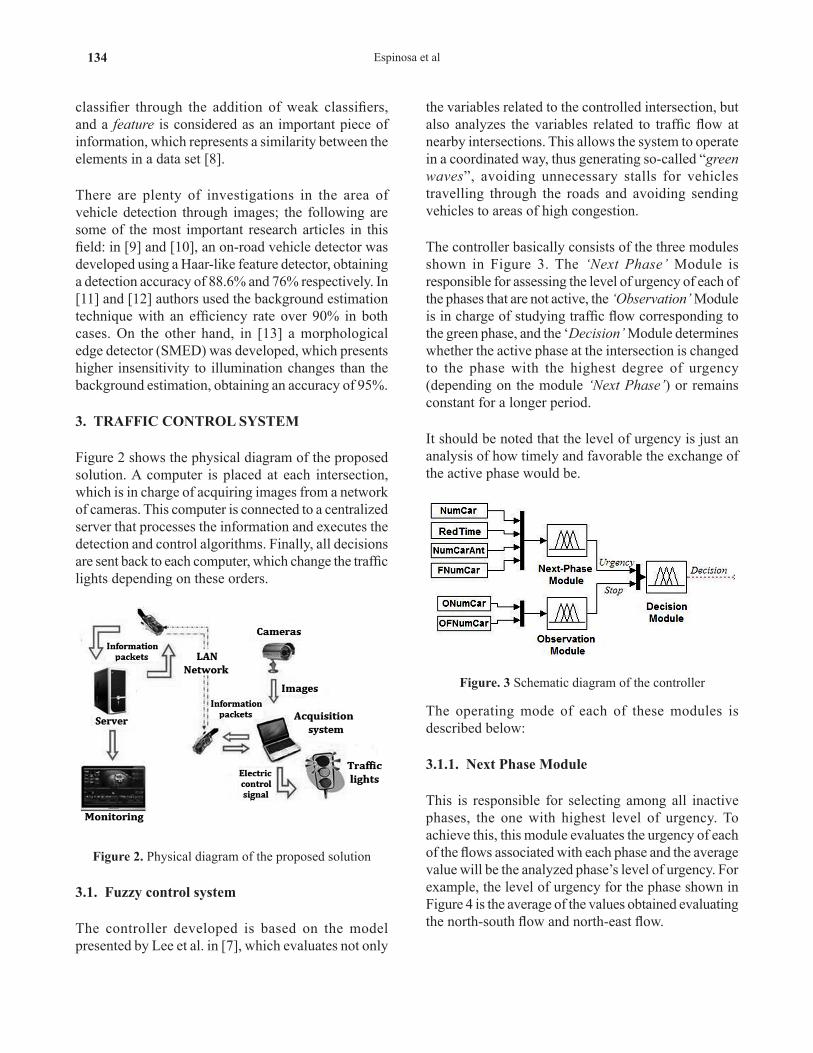
Figure 2 shows the physical diagram of the proposed solution. A computer is placed at each intersection, which is in charge of acquiring images from a network of cameras. This computer is connected to a centralized server that processes the information and executes the detection and control algorithms. Finally, all decisions are sent back to each computer, which change the traffic lights depending on these orders.
Figure 2. Physical diagram of the proposed solution
3.1. Fuzzy control system
The controller developed is based on the model presented by Lee et al. in [7], which evaluates not only
the variables related to the controlled intersection, but also analyzes the variables related to traffic flow at nearby intersections. This allows the system to operate in a coordinated way, thus generating so-called “green waves”, avoiding unnecessary stalls for vehicles travelling through the roads and avoiding sending vehicles to areas of high congestion.
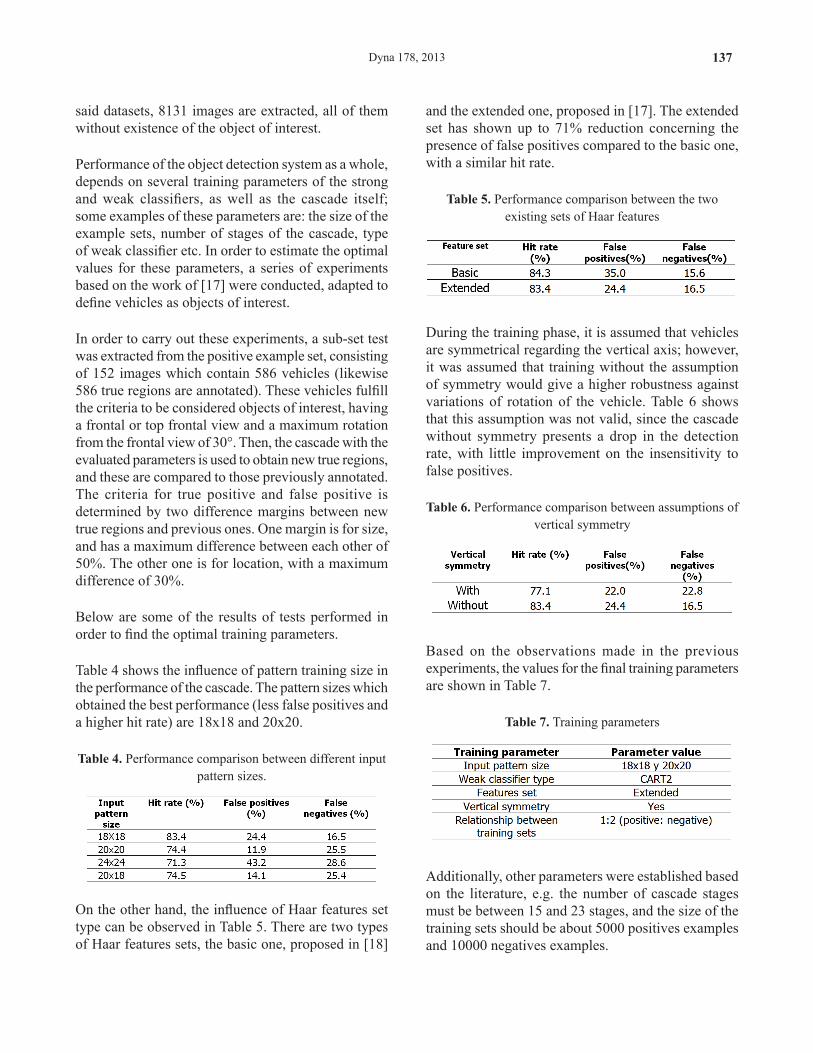
The controller basically consists of the three modules shown in Figure 3. The ‘Next Phase’ Module is responsible for assessing the level of urgency of each of the phases that are not active, the ‘Observation’ Module is in charge of studying traffic flow corresponding to the green phase, and the ‘Decision’ Module determines whether the active phase at the intersection is changed to the phase with the highest degree of urgency (depending on the module ‘Next Phase’) or remains constant for a longer period.
It should be noted that the level of urgency is just an analysis of how timely and favorable the exchange of the active phase would be.
Figure. 3 Schematic diagram of the controller
The operating mode of each of these modules is described below:
3.1.1. Next Phase Module
This is responsible for selecting among all inactive phases, the one with highest level of urgency. To achieve this, this module evaluates the urgency of each of the flows associated with each phase and the average value will be the analyzed phase’s level of urgency. For example, the level of urgency for the phase shown in Figure 4 is the average of the values obtained evaluating the north-south flow and north-east flow.

Dyna 178, 2013 135
Figure 4. Sample situation
To obtain the level of urgency of each flow, four variables are evaluated: NumCar is the number of vehicles waiting for the green signal, in Figure 4 they are located in north; RedTime represents the number of periods that the evaluated phase has been deactivated; NumCarAnt is an estimate of the number of vehicles that could arrive in the current cycle, from the lanes leading up to this intersection, and FNumCar is the number of vehicles on the road in front of the intersection, for the north-south flow in Figure 4 this variable is represented for those vehicles in the south road. This way, the variables RedTime and NumCar reflect traffic conditions locally, while NumCarAnt and FNumCar allow the system to coordinate different neighboring intersections.
Figure 5. The Fuzzy Set of NumCar, FNumCar, RedTime, NumCarAnt and Urgency
Figure 5 shows this module’s Fuzzy Set and Table 1 presents some of its rules. For example, R2 states that if the number of vehicles waiting to cross is High (NumCar = H), the number of periods in which the analyzed phase has not been active is High (RedTime = H) and the number of vehicles waiting in the following lane is Low (FNumCar = L), then the urgency of this
phase will be very high (Urgency = VH).
Table 1. A few rules of the Next Phase Module
3.1.2. Observation Module
This module is responsible for assessing traffic conditions for the active phase and determines how timely it would be to stop that phase. The fuzzy rules of this module have two inputs and one output: ONumCar indicates the number of cars that are still waiting; OFNumCar represents the number of vehicles at the next intersection and Stop is the output of the module, indicating whether or not it is necessary to stop the phase. The behavior of the input variables is very similar to variables NumCar and FNumCar, therefore their fuzzy sets are equal. Figure 6 shows the Fuzzy Set for the Stop variable.
Figure 6. The Fuzzy Set of Stop
Table 2 presents some rules of this module. R4 indicates that if the number of vehicles waiting for the active phase is still high (ONumCar = H) and the number of vehicles in the following lane is high as well
(OFNumCar = H), then the phase must be stopped (Stop = Yes). This is because it would be a waste of time to allow a flow that will be obstructed later.
Table 2. A few rules of the Observation Module

Espinosa et al136
3.1.3. Decision Module
This module decides whether or not to change the active phase. The inputs in this module are Urgency and Stop and the output is Decision. The two input variables are the outputs of the modules ‘Next Phase’ and ‘Observation’, respectively. The module changes the active phase, as long as the defuzzification’s result is above a given threshold.
Table 3 shows some of the rules of this module. The first rule indicates that, although the candidate phase has medium congestion (Urgency = M), if the Stop level of the active phase is low (Stop = N), then the module will have to keep the same phase (Decision = N, no change). The Fuzzy Set of this module is presented in Figure 7 (Urgency and Stop variables appear in the previous modules).
Table 3. A few rules of the Decision Module
Figure 7. The Fuzzy Set of Decision
3.2. Detection algorithms
The detection algorithm proposed in [14, 15] is used, consisting of a Haar feature classifier cascade; according to several authors [8, 9, 16] this method presents higher or at least similar performance as the best previous object detector systems. The implementation of this method was developed in two phases, one, dedicated to training of the classifiers through a machine learning algorithm called Adaboost and the construction of the cascade, and the other phase
where the detection is adapted to the needs of the object of interest and the context where these objects exist.
Within the training phase, Adaboost creates several weak classifiers (ℎ𝑗𝑗 ) , each of these evaluates a Haar characteristic (𝑗𝑗) over an image (𝑥𝑥𝑗𝑗 ) and through the comparison between the obtained value from the evaluation and a threshold (𝜃𝜃𝑗𝑗 ) , it decides if this characteristic represents effectively the object of interest. A weak classifier is defined by Equation (1).
ℎ𝑗𝑗 (𝑥𝑥) = �1; 𝑓𝑓𝑗𝑗 (𝑥𝑥) < 𝜃𝜃𝑗𝑗0; 𝑓𝑓𝑗𝑗 (𝑥𝑥) ≥ 𝜃𝜃𝑗𝑗 (1)
Adaboost will find the best threshold and the best classifier through linear searches and a reweighting of the examples with the highest classification error (𝜀𝜀𝑗𝑗 ), thus maximizing the margin between a positive and negative set of examples ( 𝑥𝑥𝑗𝑗 ,𝑦𝑦𝑗𝑗 ), being 𝑦𝑦𝑗𝑗 = 1 or 𝑦𝑦𝑗𝑗 = 0 or for positives and negatives examples respectively. This classification error is defined by Equation (2).
𝜀𝜀𝑗𝑗 = �𝑤𝑤𝑖𝑖�ℎ𝑗𝑗 �𝑥𝑥𝑗𝑗 � − 𝑦𝑦𝑖𝑖�𝑖𝑖
(2)
In Equation (2) the term (𝑤𝑤𝑖𝑖) represents the weight given to the samples after each classification; as 𝑤𝑤𝑖𝑖 increases for those misclassified samples, this will allow future iterations to pay more attention to these examples [14, 16]. Through this process Adaboost will use the best classifier to create a combination with better discrimination accuracy; this combination is called strong classifier (ℎ𝑗𝑗 ) and is defined by Equation (3).
ℎ𝑗𝑗 (𝑥𝑥) =
⎩⎨
⎧1 � 𝛼𝛼ℎ𝑗𝑗 (𝑥𝑥) ≥� 𝛼𝛼𝑇𝑇
𝑡𝑡=1
𝑇𝑇
𝑡𝑡=1
0 � 𝛼𝛼ℎ𝑗𝑗 (𝑥𝑥) < � 𝛼𝛼𝑇𝑇
𝑡𝑡=1
𝑇𝑇
𝑡𝑡=1
(3)
For the present work, the positive examples set �𝑥𝑥𝑗𝑗 ,𝑦𝑦𝑗𝑗 � = 1 , are extracted from traffic videos of several points of the city. 6364 images are obtained from these videos, for each one of these images, true regions are annotated (regions where the object of interest is present); 10050 true regions were found, thus obtaining the same number of positive examples. In order to obtain the negative example set, videos from daily scenes of parks and walkways are used, as well as image datasets from Google, CALTECH, CMU, TU Darmstadt, UIUC, VOC2005 and TU GRAZ. From
Dyna 178, 2013 137
said datasets, 8131 images are extracted, all of them without existence of the object of interest.
Performance of the object detection system as a whole, depends on several training parameters of the strong and weak classifiers, as well as the cascade itself; some examples of these parameters are: the size of the example sets, number of stages of the cascade, type of weak classifier etc. In order to estimate the optimal values for these parameters, a series of experiments based on the work of [17] were conducted, adapted to define vehicles as objects of interest.
In order to carry out these experiments, a sub-set test was extracted from the positive example set, consisting of 152 images which contain 586 vehicles (likewise 586 true regions are annotated). These vehicles fulfill the criteria to be considered objects of interest, having a frontal or top frontal view and a maximum rotation from the frontal view of 30°. Then, the cascade with the evaluated parameters is used to obtain new true regions, and these are compared to those previously annotated. The criteria for true positive and false positive is determined by two difference margins between new true regions and previous ones. One margin is for size, and has a maximum difference between each other of 50%. The other one is for location, with a maximum difference of 30%.
Below are some of the results of tests performed in order to find the optimal training parameters.
Table 4 shows the influence of pattern training size in the performance of the cascade. The pattern sizes which obtained the best performance (less false positives and a higher hit rate) are 18x18 and 20x20.
Table 4. Performance comparison between different input pattern sizes.
On the other hand, the influence of Haar features set type can be observed in Table 5. There are two types of Haar features sets, the basic one, proposed in [18]
and the extended one, proposed in [17]. The extended set has shown up to 71% reduction concerning the presence of false positives compared to the basic one, with a similar hit rate.
Table 5. Performance comparison between the two existing sets of Haar features
During the training phase, it is assumed that vehicles are symmetrical regarding the vertical axis; however, it was assumed that training without the assumption of symmetry would give a higher robustness against variations of rotation of the vehicle. Table 6 shows that this assumption was not valid, since the cascade without symmetry presents a drop in the detection rate, with little improvement on the insensitivity to false positives.
Table 6. Performance comparison between assumptions of vertical symmetry
Based on the observations made in the previous experiments, the values for the final training parameters are shown in Table 7.
Table 7. Training parameters
Additionally, other parameters were established based on the literature, e.g. the number of cascade stages must be between 15 and 23 stages, and the size of the training sets should be about 5000 positives examples and 10000 negatives examples.
Espinosa et al138
4. EXPERIMENTAL FRAMEWORK
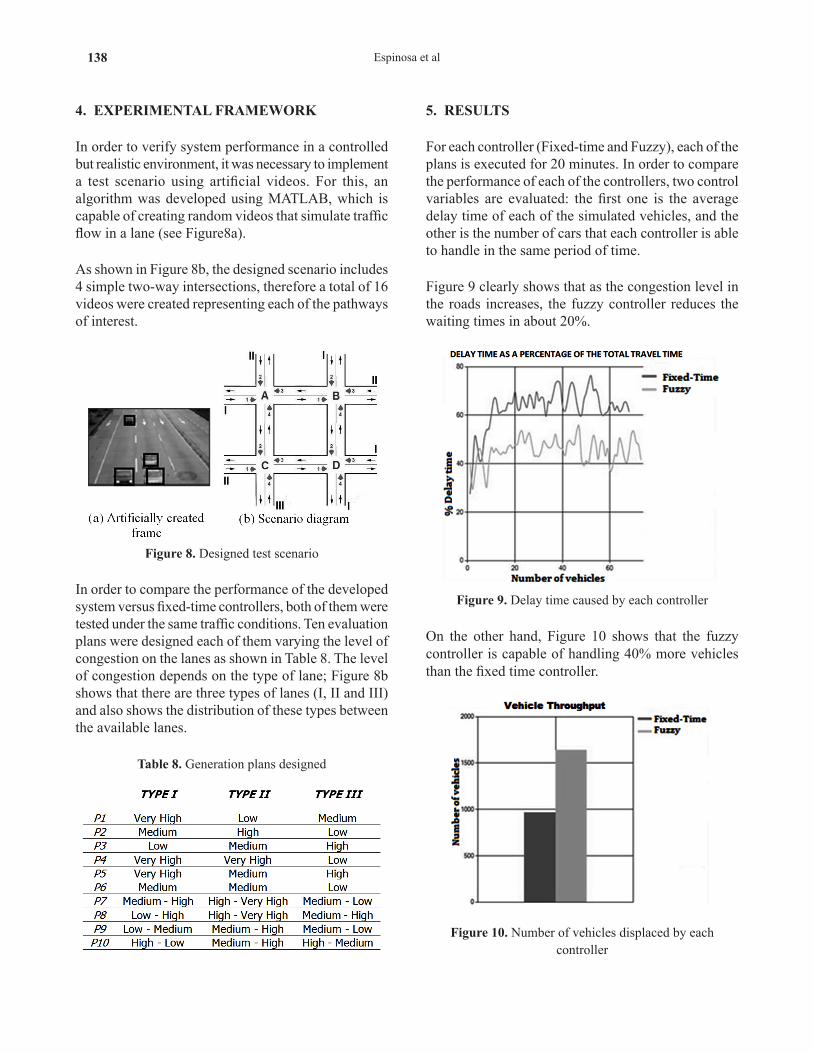
In order to verify system performance in a controlled but realistic environment, it was necessary to implement a test scenario using artificial videos. For this, an algorithm was developed using MATLAB, which is capable of creating random videos that simulate traffic flow in a lane (see Figure8a).
As shown in Figure 8b, the designed scenario includes 4 simple two-way intersections, therefore a total of 16 videos were created representing each of the pathways of interest.
Figure 8. Designed test scenario
In order to compare the performance of the developed system versus fixed-time controllers, both of them were tested under the same traffic conditions. Ten evaluation plans were designed each of them varying the level of congestion on the lanes as shown in Table 8. The level of congestion depends on the type of lane; Figure 8b shows that there are three types of lanes (I, II and III) and also shows the distribution of these types between the available lanes.
Table 8. Generation plans designed
5. RESULTS
For each controller (Fixed-time and Fuzzy), each of the plans is executed for 20 minutes. In order to compare the performance of each of the controllers, two control variables are evaluated: the first one is the average delay time of each of the simulated vehicles, and the other is the number of cars that each controller is able to handle in the same period of time.
Figure 9 clearly shows that as the congestion level in the roads increases, the fuzzy controller reduces the waiting times in about 20%.
Figure 9. Delay time caused by each controller
On the other hand, Figure 10 shows that the fuzzy controller is capable of handling 40% more vehicles than the fixed time controller.
Figure 10. Number of vehicles displaced by each controller
Dyna 178, 2013 139
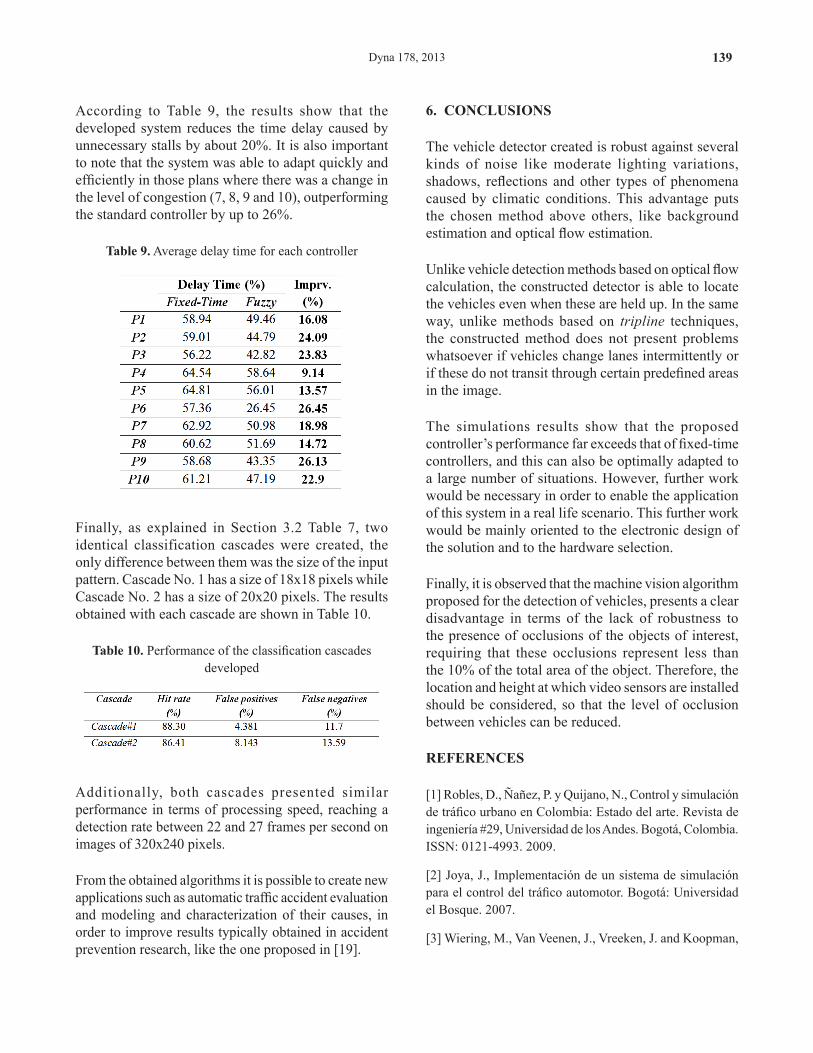
According to Table 9, the results show that the developed system reduces the time delay caused by unnecessary stalls by about 20%. It is also important to note that the system was able to adapt quickly and efficiently in those plans where there was a change in the level of congestion (7, 8, 9 and 10), outperforming the standard controller by up to 26%.
Table 9. Average delay time for each controller
Finally, as explained in Section 3.2 Table 7, two identical classification cascades were created, the only difference between them was the size of the input pattern. Cascade No. 1 has a size of 18x18 pixels while Cascade No. 2 has a size of 20x20 pixels. The results obtained with each cascade are shown in Table 10.
Table 10. Performance of the classification cascades developed
Additionally, both cascades presented similar performance in terms of processing speed, reaching a detection rate between 22 and 27 frames per second on images of 320x240 pixels.
From the obtained algorithms it is possible to create new applications such as automatic traffic accident evaluation and modeling and characterization of their causes, in order to improve results typically obtained in accident prevention research, like the one proposed in [19].
6. CONCLUSIONS
The vehicle detector created is robust against several kinds of noise like moderate lighting variations, shadows, reflections and other types of phenomena caused by climatic conditions. This advantage puts the chosen method above others, like background estimation and optical flow estimation.
Unlike vehicle detection methods based on optical flow calculation, the constructed detector is able to locate the vehicles even when these are held up. In the same way, unlike methods based on tripline techniques, the constructed method does not present problems whatsoever if vehicles change lanes intermittently or if these do not transit through certain predefined areas in the image.
The simulations results show that the proposed controller’s performance far exceeds that of fixed-time controllers, and this can also be optimally adapted to a large number of situations. However, further work would be necessary in order to enable the application of this system in a real life scenario. This further work would be mainly oriented to the electronic design of the solution and to the hardware selection.
Finally, it is observed that the machine vision algorithm proposed for the detection of vehicles, presents a clear disadvantage in terms of the lack of robustness to the presence of occlusions of the objects of interest, requiring that these occlusions represent less than the 10% of the total area of the object. Therefore, the location and height at which video sensors are installed should be considered, so that the level of occlusion between vehicles can be reduced.
REFERENCES
[1] Robles, D., Ñañez, P. y Quijano, N., Control y simulación de tráfico urbano en Colombia: Estado del arte. Revista de ingeniería #29, Universidad de los Andes. Bogotá, Colombia. ISSN: 0121-4993. 2009.
[2] Joya, J., Implementación de un sistema de simulación para el control del tráfico automotor. Bogotá: Universidad el Bosque. 2007.
[3] Wiering, M., Van Veenen, J., Vreeken, J. and Koopman,

Espinosa et al140
A., Intelligent Traffic Light Control. Institute of Information and Computing Sciences. Utrecht University. 2004.
[4] Klein, A., Sensor Technologies for ITS, Transportation Research Board Freeway Operations and Signal Systems Mid-Year Committee Meeting 2002.
[5] Mimbela, L., Summary of Vehicle Detection and Surveillance Technologies used in Intelligent Transportation Systems, Federal Highway Administration s (FHWA) Intelligent Transportation Systems Joint Program Office, 2000.
[6] Kok, K., Marzuki, K., Rubiyah, Y., Intelligent traffic lights control by Fuzzy Logic. Artificial Intelligence Center. Universiti Teknologi Malaysia. Malaysian Journal of Computer Science, Vol. 9 No. 2, December 1996, pp. 29-35.
[7] Lee, J. and Lee-Kwang, H., Distributed and Cooperative Fuzzy Controllers for Traffic Intersections Group. IEEE Transactions on Systems, Man, and Cybernetics, Part: C. Vol. 29, No. 2. 1999.
[8] Szeliski, R., Computer Vision: Algorithms and Applications. September, 2010.
[9] Choi, J., Realtime On-Road Vehicle Detection with Optical Flows and Haar-like feature detector, Department of Computer Science University of Illinois at Urbana-Champaign, 2007.
[10] Han, S., Han, Y. and Hahn, H., Vehicle Detection Method using Haar-like Feature on Real Time System, 2009.
[11 Masakatsu, H., Hinenoya, T. and Takeuchi, K., Traffic Queue Length Measurement Using an Image Processing Sensor.
[12] Michalopoulos, P., Vehicle Detection Video through Image Processing: The Autoscope System. 1991.
[13] Fathy, M. and Siyal, M., Real-time image processing approach to measure traffic queue parameters. 1995.
[14] Viola, P. and Jones, M., Rapid Object Detection using a Boosted Cascade of Simple Features, conference on computer vision and pattern recognition, 2001.
[15] Lienhart, R. and Maydt, J., “An extended set of Haar-like features for rapid object detection,” Image Processing. 2002. Proceedings. 2002 International Conference on, vol.1, no., pp. I-900- I-903 vol.1, 2002
[16] Weber, B., Generic Object Detection using AdaBoost, Department of Computer Science University of California, Santa Cruz, 2008.
[17] Lienhart, R., Kuranov, A. and Vadim, P., Empirical Analysis of Detection Cascades of Boosted Classifiers for Rapid Object Detection, MRL Technical Report, Intel Labs, 2002.
[18] Papageorgiou, O., A general framework for object detection, Computer Vision, 1998. Sixth International Conference on , vol., no., pp.555-562, 4-7, 1998
[19] García, R., Delgado, D., Díaz, E. y García, R., Caracterización de la accidentalidad Vehicular y análisis de las causas en la provincia de villa clara, Cuba, Revista DYNA, Edición 175, Vol. 79, ISSN 0012-7353, 2012.