machine learning basics lecture 1: linear regression · machine learning basics lecture 1: linear...
TRANSCRIPT

Machine Learning Basics Lecture 1: Linear Regression
Princeton University COS 495
Instructor: Yingyu Liang

Machine learning basics

What is machine learning?
• “A computer program is said to learn from experience E with respect to some class of tasks T and performance measure P, if its performance at tasks in T as measured by P, improves with experience E.”
------- Machine Learning, Tom Mitchell, 1997

Example 1: image classification
Task: determine if the image is indoor or outdoorPerformance measure: probability of misclassification

Example 1: image classification
indoor outdoor
Experience/Data: images with labels
Indoor

Example 1: image classification
• A few terminologies• Training data: the images given for learning
• Test data: the images to be classified
• Binary classification: classify into two classes

Example 1: image classification (multi-class)
ImageNet figure borrowed from vision.standford.edu

Example 2: clustering images
Task: partition the images into 2 groupsPerformance: similarities within groupsData: a set of images
Example 2: clustering images
• A few terminologies• Unlabeled data vs labeled data
• Supervised learning vs unsupervised learning
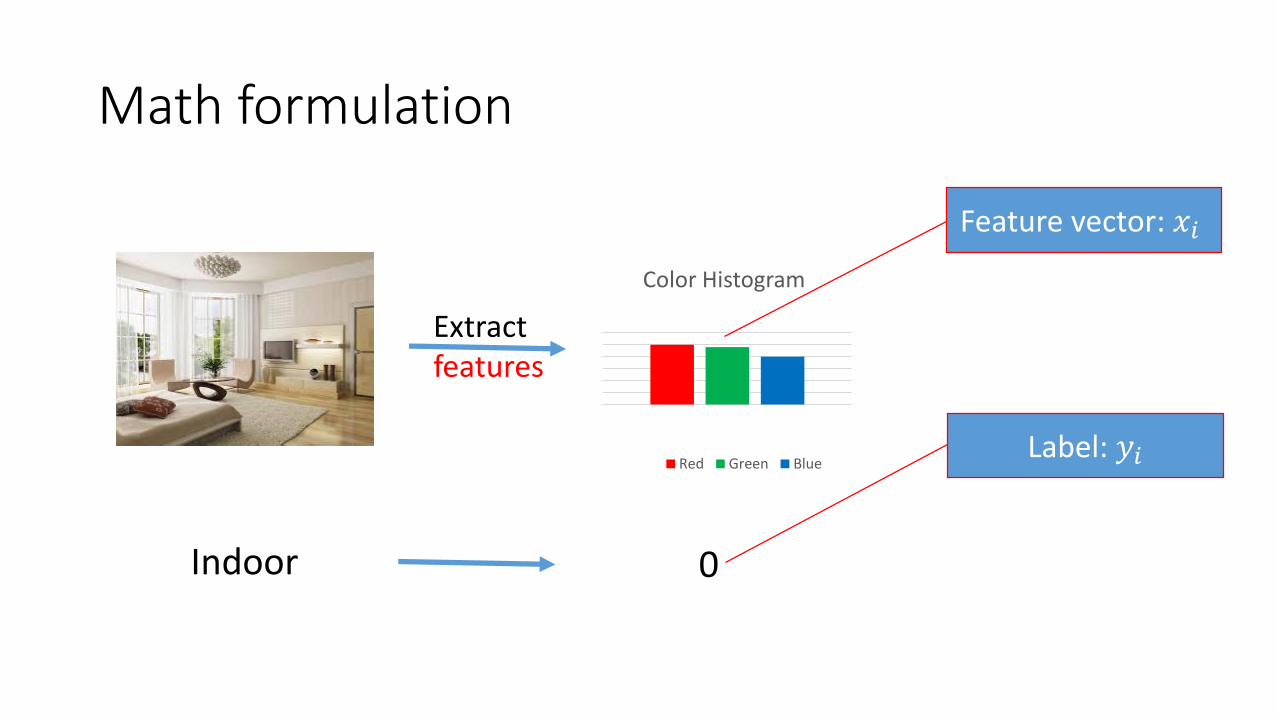
Math formulation
Color Histogram
Red Green Blue
Indoor 0
Feature vector: 𝑥𝑖
Label: 𝑦𝑖
Extract features

Math formulation
Color Histogram
Red Green Blue
outdoor 1
Feature vector: 𝑥𝑗
Label: 𝑦𝑗
Extract features

Math formulation
• Given training data 𝑥𝑖 , 𝑦𝑖 : 1 ≤ 𝑖 ≤ 𝑛
• Find 𝑦 = 𝑓(𝑥) using training data
• s.t. 𝑓 correct on test dataWhat kind of functions?

Math formulation
• Given training data 𝑥𝑖 , 𝑦𝑖 : 1 ≤ 𝑖 ≤ 𝑛
• Find 𝑦 = 𝑓(𝑥) ∈ 𝓗 using training data
• s.t. 𝑓 correct on test dataHypothesis class
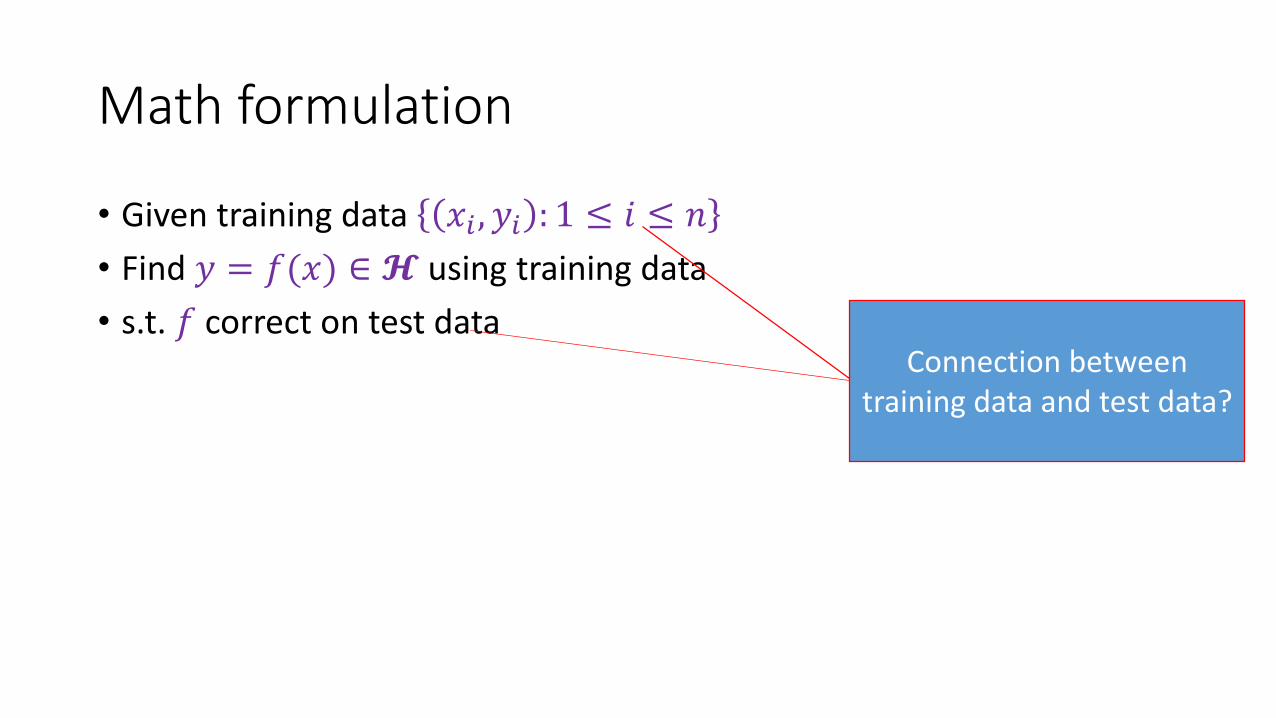
Math formulation
• Given training data 𝑥𝑖 , 𝑦𝑖 : 1 ≤ 𝑖 ≤ 𝑛
• Find 𝑦 = 𝑓(𝑥) ∈ 𝓗 using training data
• s.t. 𝑓 correct on test dataConnection between
training data and test data?

Math formulation
• Given training data 𝑥𝑖 , 𝑦𝑖 : 1 ≤ 𝑖 ≤ 𝑛 i.i.d. from distribution 𝐷
• Find 𝑦 = 𝑓(𝑥) ∈ 𝓗 using training data
• s.t. 𝑓 correct on test data i.i.d. from distribution 𝐷They have the same
distribution
i.i.d.: independently identically distributed

Math formulation
• Given training data 𝑥𝑖 , 𝑦𝑖 : 1 ≤ 𝑖 ≤ 𝑛 i.i.d. from distribution 𝐷
• Find 𝑦 = 𝑓(𝑥) ∈ 𝓗 using training data
• s.t. 𝑓 correct on test data i.i.d. from distribution 𝐷
What kind of performance measure?
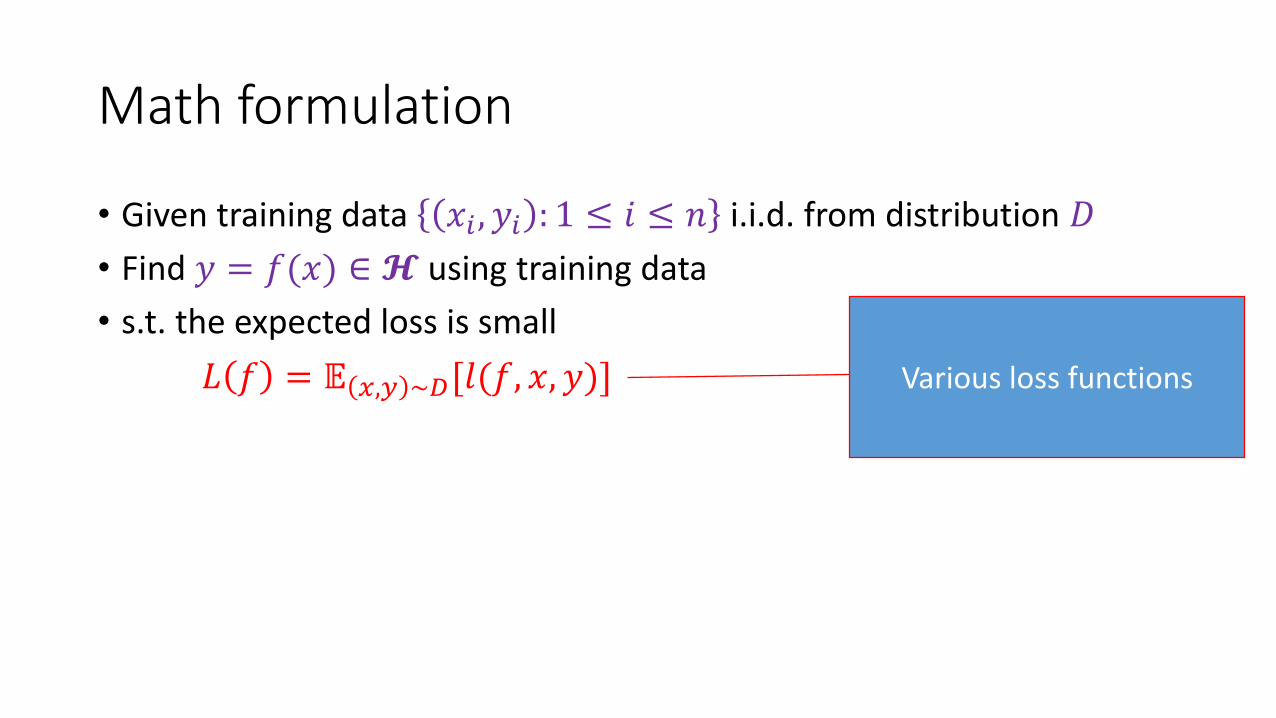
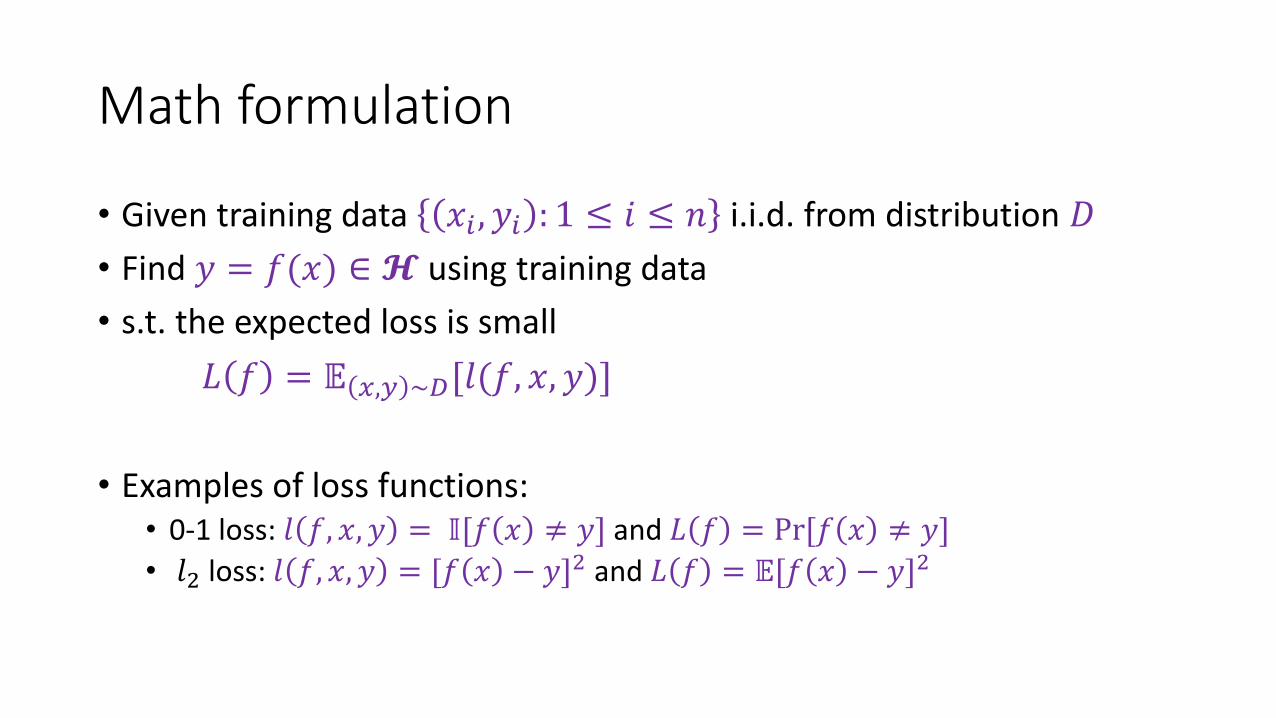
Math formulation
• Given training data 𝑥𝑖 , 𝑦𝑖 : 1 ≤ 𝑖 ≤ 𝑛 i.i.d. from distribution 𝐷
• Find 𝑦 = 𝑓(𝑥) ∈ 𝓗 using training data
• s.t. the expected loss is small
𝐿 𝑓 = 𝔼 𝑥,𝑦 ~𝐷[𝑙(𝑓, 𝑥, 𝑦)] Various loss functions
Math formulation
• Given training data 𝑥𝑖 , 𝑦𝑖 : 1 ≤ 𝑖 ≤ 𝑛 i.i.d. from distribution 𝐷
• Find 𝑦 = 𝑓(𝑥) ∈ 𝓗 using training data
• s.t. the expected loss is small
𝐿 𝑓 = 𝔼 𝑥,𝑦 ~𝐷[𝑙(𝑓, 𝑥, 𝑦)]
• Examples of loss functions:• 0-1 loss: 𝑙 𝑓, 𝑥, 𝑦 = 𝕀[𝑓 𝑥 ≠ 𝑦] and 𝐿 𝑓 = Pr[𝑓 𝑥 ≠ 𝑦]
• 𝑙2 loss: 𝑙 𝑓, 𝑥, 𝑦 = [𝑓 𝑥 − 𝑦]2 and 𝐿 𝑓 = 𝔼[𝑓 𝑥 − 𝑦]2

Math formulation
• Given training data 𝑥𝑖 , 𝑦𝑖 : 1 ≤ 𝑖 ≤ 𝑛 i.i.d. from distribution 𝐷
• Find 𝑦 = 𝑓(𝑥) ∈ 𝓗 using training data
• s.t. the expected loss is small
𝐿 𝑓 = 𝔼 𝑥,𝑦 ~𝐷[𝑙(𝑓, 𝑥, 𝑦)] How to use?

Math formulation
• Given training data 𝑥𝑖 , 𝑦𝑖 : 1 ≤ 𝑖 ≤ 𝑛 i.i.d. from distribution 𝐷
• Find 𝑦 = 𝑓(𝑥) ∈ 𝓗 that minimizes 𝐿 𝑓 =1
𝑛σ𝑖=1𝑛 𝑙(𝑓, 𝑥𝑖 , 𝑦𝑖)
• s.t. the expected loss is small
𝐿 𝑓 = 𝔼 𝑥,𝑦 ~𝐷[𝑙(𝑓, 𝑥, 𝑦)]
Empirical loss
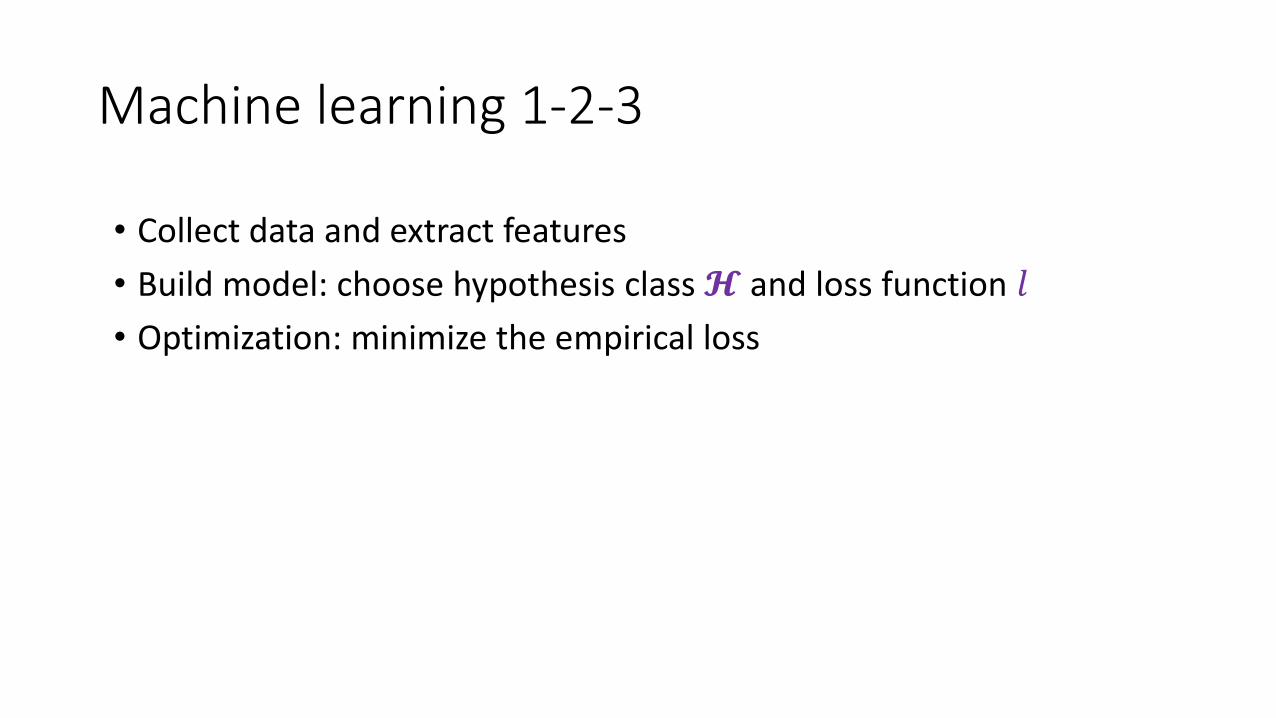
Machine learning 1-2-3
• Collect data and extract features
• Build model: choose hypothesis class 𝓗 and loss function 𝑙
• Optimization: minimize the empirical loss
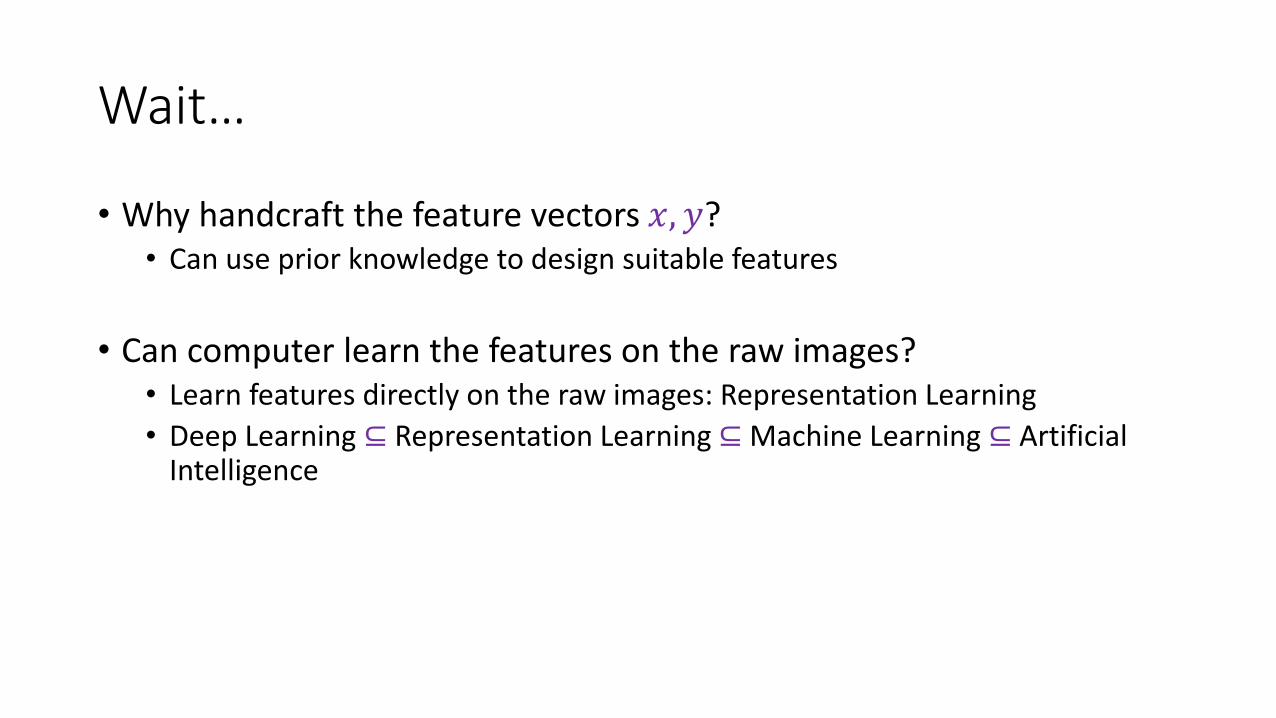
Wait…
• Why handcraft the feature vectors 𝑥, 𝑦? • Can use prior knowledge to design suitable features
• Can computer learn the features on the raw images?• Learn features directly on the raw images: Representation Learning
• Deep Learning ⊆ Representation Learning ⊆ Machine Learning ⊆ Artificial Intelligence

Wait…
• Does MachineLearning-1-2-3 include all approaches?• Include many but not all
• Our current focus will be MachineLearning-1-2-3

Example: Stock Market Prediction
2013 2014 2015 2016
Stock Market (Disclaimer: synthetic data/in another parallel universe)
Orange MacroHard Ackermann
Sliding window over time: serve as input 𝑥; non-i.i.d.

Linear regression

Real data: Prostate Cancerby Stamey et al. (1989)
Figure borrowed from The Elements of Statistical Learning
𝑦: prostate specific antigen
(𝑥1, … , 𝑥8):clinical measures

Linear regression
• Given training data 𝑥𝑖 , 𝑦𝑖 : 1 ≤ 𝑖 ≤ 𝑛 i.i.d. from distribution 𝐷
• Find 𝑓𝑤 𝑥 = 𝑤𝑇𝑥 that minimizes 𝐿 𝑓𝑤 =1
𝑛σ𝑖=1𝑛 𝑤𝑇𝑥𝑖 − 𝑦𝑖
2
𝑙2 loss; also called mean square error
Hypothesis class 𝓗

Linear regression: optimization
• Given training data 𝑥𝑖 , 𝑦𝑖 : 1 ≤ 𝑖 ≤ 𝑛 i.i.d. from distribution 𝐷
• Find 𝑓𝑤 𝑥 = 𝑤𝑇𝑥 that minimizes 𝐿 𝑓𝑤 =1
𝑛σ𝑖=1𝑛 𝑤𝑇𝑥𝑖 − 𝑦𝑖
2
• Let 𝑋 be a matrix whose 𝑖-th row is 𝑥𝑖𝑇, 𝑦 be the vector 𝑦1, … , 𝑦𝑛
𝑇
𝐿 𝑓𝑤 =1
𝑛
𝑖=1
𝑛
𝑤𝑇𝑥𝑖 − 𝑦𝑖2 =
1
𝑛⃦𝑋𝑤 − 𝑦 ⃦2
2

Linear regression: optimization
• Set the gradient to 0 to get the minimizer
𝛻𝑤 𝐿 𝑓𝑤 = 𝛻𝑤1
𝑛⃦𝑋𝑤 − 𝑦 ⃦2
2 = 0
𝛻𝑤[ 𝑋𝑤 − 𝑦 𝑇(𝑋𝑤 − 𝑦)] = 0
𝛻𝑤[ 𝑤𝑇𝑋𝑇𝑋𝑤 − 2𝑤𝑇𝑋𝑇𝑦 + 𝑦𝑇𝑦] = 0
2𝑋𝑇𝑋𝑤 − 2𝑋𝑇𝑦 = 0
w = 𝑋𝑇𝑋 −1𝑋𝑇𝑦

Linear regression: optimization
• Algebraic view of the minimizer• If 𝑋 is invertible, just solve 𝑋𝑤 = 𝑦 and get 𝑤 = 𝑋−1𝑦
• But typically 𝑋 is a tall matrix
𝑋
𝑤=
𝑦
𝑋𝑇𝑋 𝑤=𝑋𝑇𝑦
Normal equation: w = 𝑋𝑇𝑋 −1𝑋𝑇𝑦

Linear regression with bias
• Given training data 𝑥𝑖 , 𝑦𝑖 : 1 ≤ 𝑖 ≤ 𝑛 i.i.d. from distribution 𝐷
• Find 𝑓𝑤,𝑏 𝑥 = 𝑤𝑇𝑥 + 𝑏 to minimize the loss
• Reduce to the case without bias:• Let 𝑤′ = 𝑤; 𝑏 , 𝑥′ = 𝑥; 1
• Then 𝑓𝑤,𝑏 𝑥 = 𝑤𝑇𝑥 + 𝑏 = 𝑤′ 𝑇(𝑥′)
Bias term