maban host community food security & livelihood … host community food security &...
TRANSCRIPT
Maban Host Community Food
Security & Livelihood Assessment
Maban County, Upper Nile State,
South Sudan
Project Title:
Improve food and nutrition security through better agricultural practices,
enhanced livestock health and strengthened resilience to external shocks
Presented to European Commission
Date of Publication:
9/1/2015
ACTED HQ
33, rue Godot de Mauroy
75009 Paris,France
Tel: +33 1 42653333
ACTED South Sudan, Juba
Hai Malakal
Opposite MSF Belgium
Juba, Central Equatoria
ACTED – Maban Host Community Food Security & Livelihoods Assessment
1
Table of Contents
Executive Summary ................................................................................................................... 3
Background ................................................................................................................................ 5
Methodology .............................................................................................................................. 6
Survey Findings ......................................................................................................................... 6
Village Assessment Questionnaire ............................................................................................. 6
Demographic Profile ............................................................................................................... 6
Livelihoods & Food Security ................................................................................................... 8
Market Assessment Questionnaire ............................................................................................15
Market Demographic Profile ..................................................................................................15
Focus Group Discussion Findings .............................................................................................22
Kula 1 & 2 ..............................................................................................................................22
Pakaji East ............................................................................................................................24
Participatory Seasonal Calendar ...............................................................................................25
Conclusion ................................................................................................................................25
Recommendations ....................................................................................................................26
Annexes ....................................................................................................................................27
Annex I, Survey Questionnaire – Market Assessment ...........................................................27
Annex II, Survey Questionnaire – Village Assessment ..........................................................32
Table of Figures Figure 1 - Village Assessment Distribution ................................................................................. 6 Figure 2 - Household Occupation ............................................................................................... 7 Figure 3 - Livestock Type Owned by Households ...................................................................... 8 Figure 4 - Reported Livestock Deaths due to Untreated Disease ............................................... 8 Figure 5 - Main Water Source for Livestock ............................................................................... 9 Figure 6 - Common Crops Produced .........................................................................................10 Figure 7 - Common Months for Sale of Agro-Pastoral Produce to be Sold ................................10 Figure 8 - Reasons for Market Inaccessibility ............................................................................11 Figure 9 - Village Reliable Water Source...................................................................................12 Figure 10 - Identified NGOs Working in Host Community ..........................................................13 Figure 11 - Services Offered in Village Vicinity ..........................................................................13 Figure 12 - Services Identified as Useful if Offered in Maban ....................................................14 Figure 13 - Diversity of Market Traders Nationality ....................................................................15 Figure 14 - Types of Shops Found Within the Market................................................................16 Figure 15 - Items Sold During Dry Season & Rainy Season ......................................................17 Figure 16 - Source of Goods Sold in Bunj .................................................................................18 Figure 17 - Methods of Transport by Season ............................................................................18 Figure 18 - Challenges Identified to Purchasing More Local Products .......................................19
ACTED – Maban Host Community Food Security & Livelihoods Assessment
2
Figure 19 - External Shocks Identified by Vendors as Affecting their Business .........................20 Figure 20 - Length of Time Business was Affected by External Shocks ....................................21 Figure 21 - Distance of Market to Vendors Household ..............................................................22
Table 1 - Types of External Shocks Experienced in Past 12 Months .........................................20
ACTED – Maban Host Community Food Security & Livelihoods Assessment
3
Executive Summary
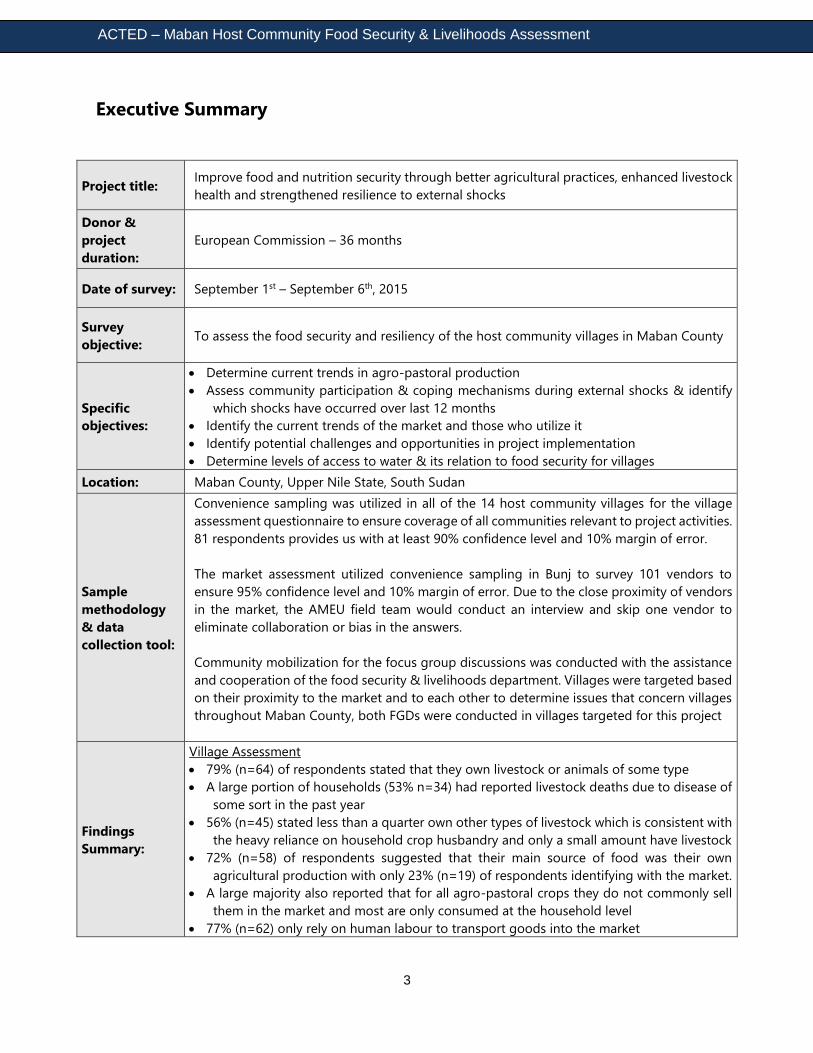
Project title: Improve food and nutrition security through better agricultural practices, enhanced livestock
health and strengthened resilience to external shocks
Donor &
project
duration:
European Commission – 36 months
Date of survey: September 1st – September 6th, 2015
Survey
objective: To assess the food security and resiliency of the host community villages in Maban County
Specific
objectives:
Determine current trends in agro-pastoral production
Assess community participation & coping mechanisms during external shocks & identify
which shocks have occurred over last 12 months
Identify the current trends of the market and those who utilize it
Identify potential challenges and opportunities in project implementation
Determine levels of access to water & its relation to food security for villages
Location: Maban County, Upper Nile State, South Sudan
Sample
methodology
& data
collection tool:
Convenience sampling was utilized in all of the 14 host community villages for the village
assessment questionnaire to ensure coverage of all communities relevant to project activities.
81 respondents provides us with at least 90% confidence level and 10% margin of error.
The market assessment utilized convenience sampling in Bunj to survey 101 vendors to
ensure 95% confidence level and 10% margin of error. Due to the close proximity of vendors
in the market, the AMEU field team would conduct an interview and skip one vendor to
eliminate collaboration or bias in the answers.
Community mobilization for the focus group discussions was conducted with the assistance
and cooperation of the food security & livelihoods department. Villages were targeted based
on their proximity to the market and to each other to determine issues that concern villages
throughout Maban County, both FGDs were conducted in villages targeted for this project
Findings
Summary:
Village Assessment
79% (n=64) of respondents stated that they own livestock or animals of some type
A large portion of households (53% n=34) had reported livestock deaths due to disease of
some sort in the past year
56% (n=45) stated less than a quarter own other types of livestock which is consistent with
the heavy reliance on household crop husbandry and only a small amount have livestock
72% (n=58) of respondents suggested that their main source of food was their own
agricultural production with only 23% (n=19) of respondents identifying with the market.
A large majority also reported that for all agro-pastoral crops they do not commonly sell
them in the market and most are only consumed at the household level
77% (n=62) only rely on human labour to transport goods into the market

ACTED – Maban Host Community Food Security & Livelihoods Assessment
4
Slaughter slabs were largely identified as being far away from most of the respondents with
23% (n=19) claiming it was too far to travel regularly to the site and 35% (n=28) stating
they did not know where a slaughter slab was located
53% (n=34) of respondents with livestock stated in the past year their livestock were
vaccinated by ICRC or VSF and 65% (n=22) of these respondents claimed they paid
between 50-100SSP for the vaccination service.
43% (n=35) of respondents stated it was too expensive to pay for veterinary services or
medicine and another 11% (n=9) claimed they were using local medicines as an alternative
Market Assessment
Most of the items sold in Bunj were sourced from either the local economy and producers,
as well as Juba, or Sudan with Ethiopia and Uganda represented slightly lower
During the rainy season, the percentage of vendors claiming they use road transport
significantly falls from 71% (n=72) to 44% (n=44)
Approximately 56% (n=57) of traders surveyed purchase either agro-pastoral products or
crafted items from the local producers to re-sell in their shops inside Bunj market
44% (n=44) of respondents stated that they only sold products that came from the
production of their own household
Only 42% (n=42) of respondents stated that they have experienced external shocks that
have effected their business in the past 12 months
Many identified primarily the economic shocks and the devaluation of the South Sudanese
Pound as the main shocks of the past 12 months (52% n=22). Others suggested conflict
(26% n=11). Only 15% (n=6) of respondents stated that livestock or agricultural disease
had effected them
71% (n=30) of those who had their business impacted by external shocks stated that higher
prices was the main effect for them. 57% (n=24) of the vendors claimed that the increase
in the product prices was an extreme increase. 93% (n=39) of vendors effected by external
shocks claimed they had to close for a month or less
ACTED – Maban Host Community Food Security & Livelihoods Assessment
5
Background
The political and military situation of South Sudan has had an impact on the economy of the
country, notably a drop in oil production levels and spikes in inflation, thus limiting the expansion
of any governmental services. The protracted conflict has also led to major population
displacements, loss of livelihoods, depleted food stocks, broken supply lines, dysfunctional
markets and thus high levels of malnutrition/food insecurity and absence of livelihood
opportunities. This is particularly true in Upper Nile, where approximately 47% of the population
was classified as IPC Level 3 (Crisis) or 4 (Emergency) in May 2015, a percentage that was expected
to rise to 57.2% by July 20151. In Maban County, where the Action will be implemented, the
situation is similar to what has been portrayed for all Upper Nile. In addition, the county had to
absorb the vast majority of the influx of refugees. In this agro-pastoral area, whose population
totaled only 50,000 before 2011, the impact of these arrivals has been difficult to bear for the host
communities, notably as it increased strains on already limited resources. Host communities who
mostly resolve to subsistence farming have been forced to share access to water and land. (). The
villages surveyed in this assessment consisted of 14 villages that are the closest in proximity to
ACTEDs operations in Maban County and logistically feasible destinations for project activities.
The distance from Gendrassa Refugee Camp ranges from within 2km up to 20km in the case of
Kula 1 & 2 which is in close proximity to Kaya Refugee Camp.
Population information is as follows:
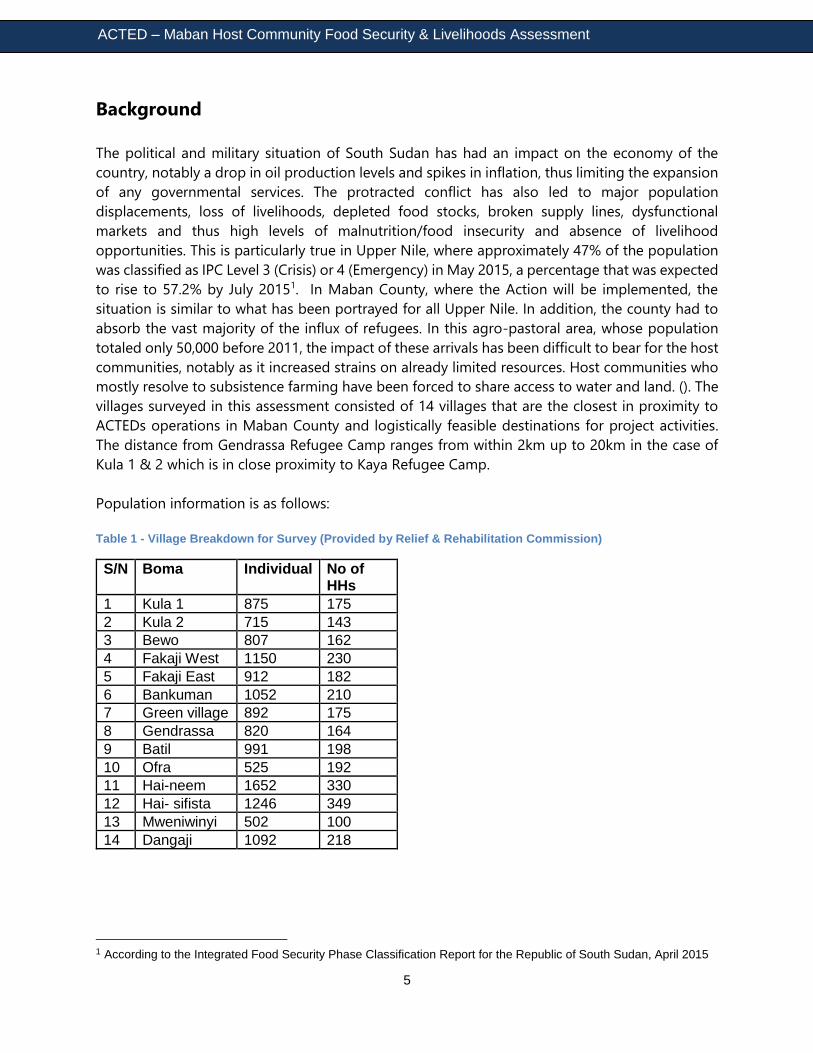
Table 1 - Village Breakdown for Survey (Provided by Relief & Rehabilitation Commission)
S/N Boma Individual No of HHs
1 Kula 1 875 175
2 Kula 2 715 143
3 Bewo 807 162
4 Fakaji West 1150 230
5 Fakaji East 912 182
6 Bankuman 1052 210
7 Green village 892 175
8 Gendrassa 820 164
9 Batil 991 198
10 Ofra 525 192
11 Hai-neem 1652 330
12 Hai- sifista 1246 349
13 Mweniwinyi 502 100
14 Dangaji 1092 218
1 According to the Integrated Food Security Phase Classification Report for the Republic of South Sudan, April 2015
ACTED – Maban Host Community Food Security & Livelihoods Assessment
6
Methodology
Convenience sampling was utilized in all of the 14 host community villages for the village
assessment questionnaire to ensure coverage of all communities relevant to project activities. 81
respondents provides us with a 90% confidence level and 10% margin of error.
The market assessment utilized convenience sampling in Bunj to survey 101 vendors to ensure
95% confidence level and 10% margin of error. Due to the close proximity of vendors in the
market, the AMEU field team would conduct an interview and skip one vendor to eliminate
collaboration or bias in the answers.
Community mobilization for the focus group discussions was conducted with the assistance and
cooperation of the food security & livelihoods department. Villages were targeted based on their
proximity to the market and to each other to determine variation and consistency in issues that
concern villages throughout Maban County.
Survey Findings
Village Assessment Questionnaire
Demographic Profile
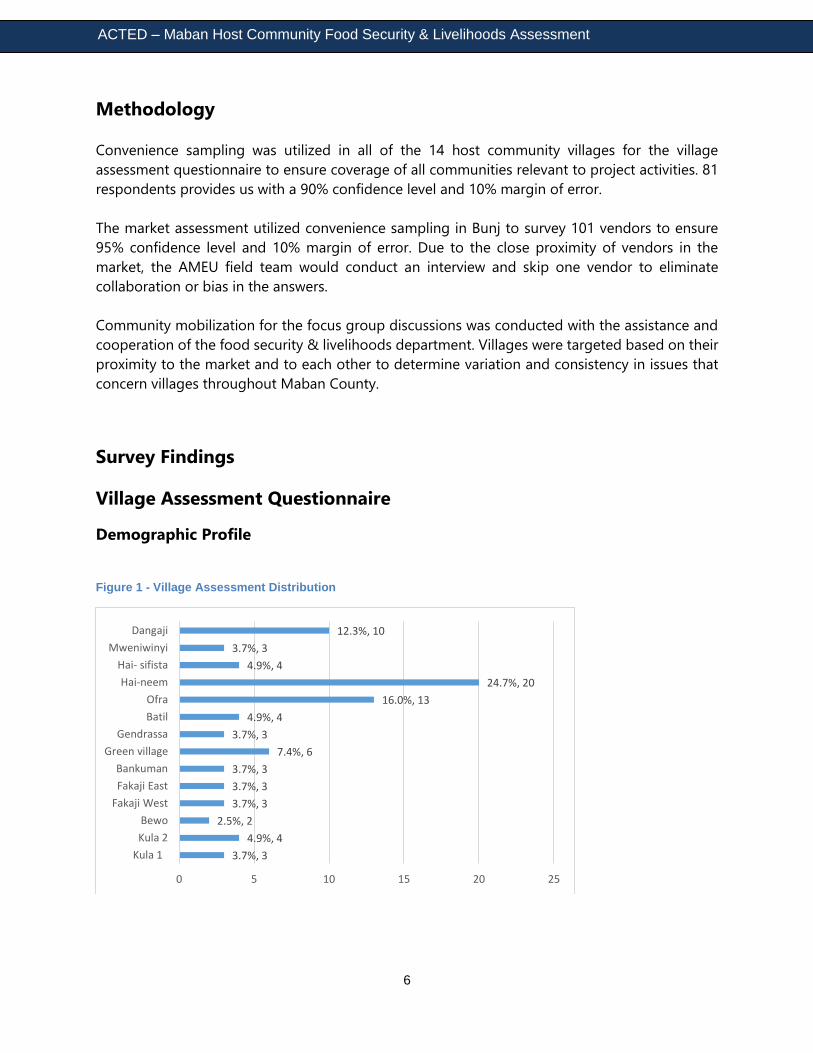
Figure 1 - Village Assessment Distribution
3.7%, 3
4.9%, 4
2.5%, 2
3.7%, 3
3.7%, 3
3.7%, 3
7.4%, 6
3.7%, 3
4.9%, 4
16.0%, 13
24.7%, 20
4.9%, 4
3.7%, 3
12.3%, 10
0 5 10 15 20 25
Kula 1
Kula 2
Bewo
Fakaji West
Fakaji East
Bankuman
Green village
Gendrassa
Batil
Ofra
Hai-neem
Hai- sifista
Mweniwinyi
Dangaji
ACTED – Maban Host Community Food Security & Livelihoods Assessment
7
65% (n=53) of the respondents were female with the other 35% (n=28) being male. The majority
of heads of household interviewed were between the ages of 26-35 (57% n=47) with another 24%
(n=20) within the age range of 36-45.
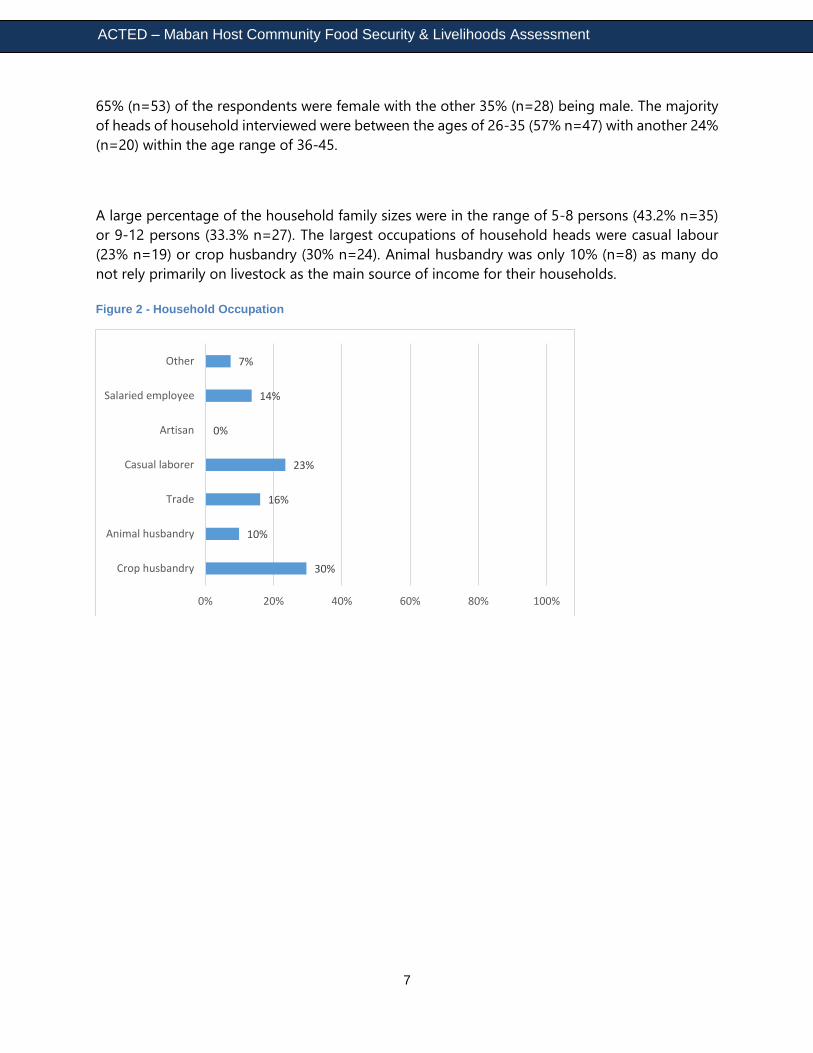
A large percentage of the household family sizes were in the range of 5-8 persons (43.2% n=35)
or 9-12 persons (33.3% n=27). The largest occupations of household heads were casual labour
(23% n=19) or crop husbandry (30% n=24). Animal husbandry was only 10% (n=8) as many do
not rely primarily on livestock as the main source of income for their households.
Figure 2 - Household Occupation
30%
10%
16%
23%
0%
14%
7%
0% 20% 40% 60% 80% 100%
Crop husbandry
Animal husbandry
Trade
Casual laborer
Artisan
Salaried employee
Other
ACTED – Maban Host Community Food Security & Livelihoods Assessment
8
Livelihoods & Food Security
79% (n=64) of respondents stated that they own livestock or animals of some type. The most
common livestock types owned by households are goats (80% n=51), pigs (86% n=55), and
chickens (77% n=49).
Figure 3 - Livestock Type Owned by Households
Cattle was only owned by 17% (n=11) of the respondents. Most of the respondents stated that
they owned between 11-20 cattle, goats, or sheep (36% n=23) with another 31% (n=20) stating
1-5 animals, and 19% (n=12) between 6-10 animals. For poultry, (58% n=37), most of the
respondents owned 1-10 chickens or ducks per household. Another 23% (n=15) of respondents
did not own any poultry.
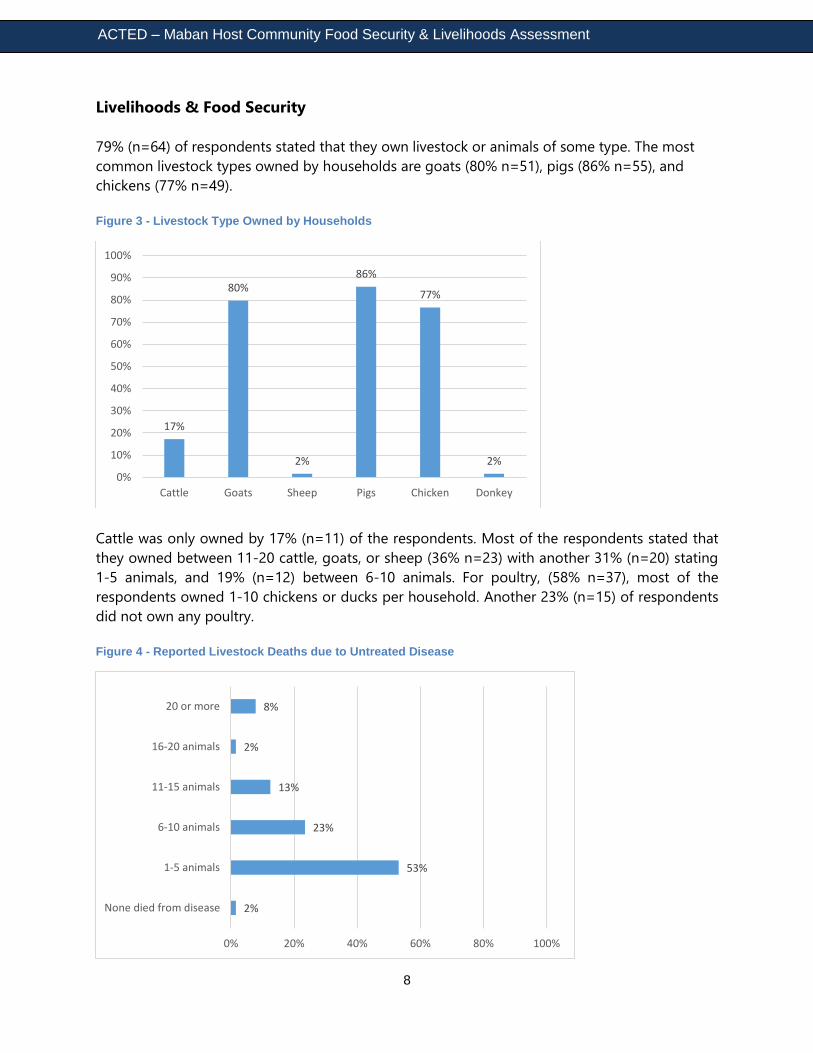
Figure 4 - Reported Livestock Deaths due to Untreated Disease
17%
80%
2%
86%
77%
2%
0%
10%
20%
30%
40%
50%
60%
70%
80%
90%
100%
Cattle Goats Sheep Pigs Chicken Donkey
2%
53%
23%
13%
2%
8%
0% 20% 40% 60% 80% 100%
None died from disease
1-5 animals
6-10 animals
11-15 animals
16-20 animals
20 or more
ACTED – Maban Host Community Food Security & Livelihoods Assessment
9
A large portion of households (53% n=34) had reported livestock deaths due to disease of some
sort in the past year. Additionally a large majority of households (56% n=36) slaughter 1-5 animals
for their own household consumption in a month. 52% (n=33) of households have sold 1-5
animals this month alone. This may be slightly higher, according to some respondents spoken to
in the focus group discussions, due to the concerns over lack of rain over the past few months
which continues to delay crop growth and harvesting. 78% (n=63) of respondents stated that less
than a quarter of the residents in their community own cattle specifically. 56% (n=45) stated less
than a quarter own other types of livestock which is consistent with the data reporting heavy
reliance on household crop husbandry and only a small amount, allegedly, have livestock
regularly. This also indicates that perceptions of livestock ownership amongst community
members is much lower than reported by the household owners themselves. 63% (n=40) of
respondents stated that the grazing and waterhole they use for their livestock is relatively close
to their household averaging 10-20 minutes’ walk, with another 28% (n=18) claiming 30-40
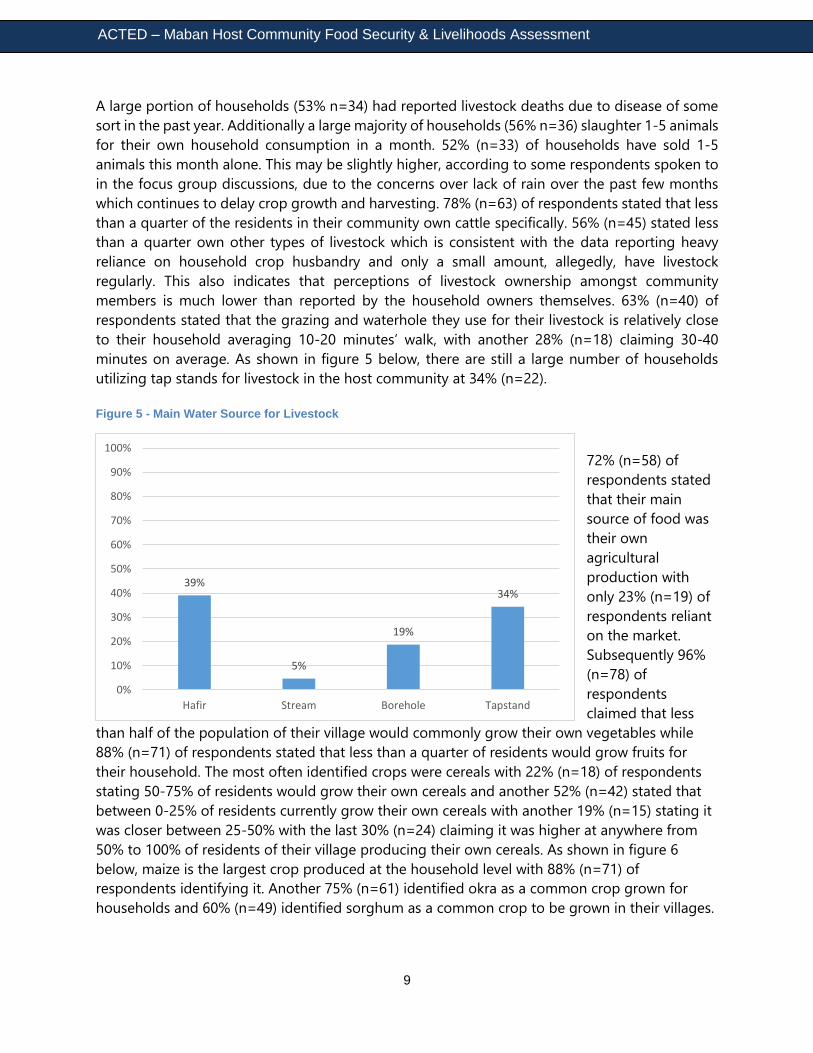
minutes on average. As shown in figure 5 below, there are still a large number of households
utilizing tap stands for livestock in the host community at 34% (n=22).
Figure 5 - Main Water Source for Livestock
72% (n=58) of
respondents stated
that their main
source of food was
their own
agricultural
production with
only 23% (n=19) of
respondents reliant
on the market.
Subsequently 96%
(n=78) of
respondents
claimed that less
than half of the population of their village would commonly grow their own vegetables while
88% (n=71) of respondents stated that less than a quarter of residents would grow fruits for
their household. The most often identified crops were cereals with 22% (n=18) of respondents
stating 50-75% of residents would grow their own cereals and another 52% (n=42) stated that
between 0-25% of residents currently grow their own cereals with another 19% (n=15) stating it
was closer between 25-50% with the last 30% (n=24) claiming it was higher at anywhere from
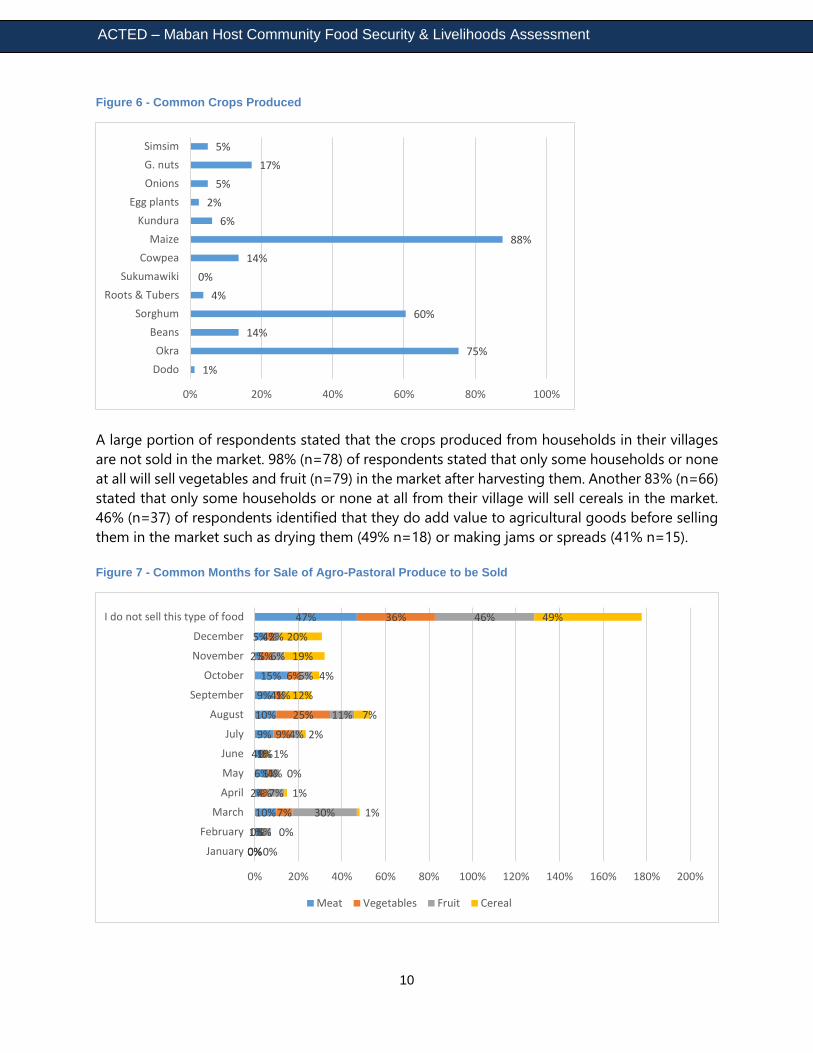
50% to 100% of residents of their village producing their own cereals. As shown in figure 6
below, maize is the largest crop produced at the household level with 88% (n=71) of
respondents identifying it. Another 75% (n=61) identified okra as a common crop grown for
households and 60% (n=49) identified sorghum as a common crop to be grown in their villages.
39%
5%
19%
34%
0%
10%
20%
30%
40%
50%
60%
70%
80%
90%
100%
Hafir Stream Borehole Tapstand
ACTED – Maban Host Community Food Security & Livelihoods Assessment
10
Figure 6 - Common Crops Produced
A large portion of respondents stated that the crops produced from households in their villages
are not sold in the market. 98% (n=78) of respondents stated that only some households or none
at all will sell vegetables and fruit (n=79) in the market after harvesting them. Another 83% (n=66)
stated that only some households or none at all from their village will sell cereals in the market.
46% (n=37) of respondents identified that they do add value to agricultural goods before selling
them in the market such as drying them (49% n=18) or making jams or spreads (41% n=15).
Figure 7 - Common Months for Sale of Agro-Pastoral Produce to be Sold
1%
75%
14%
60%
4%
0%
14%
88%
6%
2%
5%
17%
5%
0% 20% 40% 60% 80% 100%
Dodo
Okra
Beans
Sorghum
Roots & Tubers
Sukumawiki
Cowpea
Maize
Kundura
Egg plants
Onions
G. nuts
Simsim
0%
1%
10%
2%
6%
4%
9%
10%
9%
15%
2%
5%
47%
0%
0%
7%
4%
1%
1%
9%
25%
4%
6%
5%
4%
36%
0%
6%
30%
7%
4%
0%
4%
11%
1%
5%
6%
2%
46%
0%
0%
1%
1%
0%
1%
2%
7%
12%
4%
19%
20%
49%
0% 20% 40% 60% 80% 100% 120% 140% 160% 180% 200%
January
February
March
April
May
June
July
August
September
October
November
December
I do not sell this type of food
Meat Vegetables Fruit Cereal
ACTED – Maban Host Community Food Security & Livelihoods Assessment
11
As you can see in Figure 7 above, a large majority also reported that for all agro-pastoral crops
they do not commonly sell them in the market and most are only consumed at the household
level. However there were some notable months such as August, December, and November for
cereals and August for vegetables as well. January and February were not reported at all for any
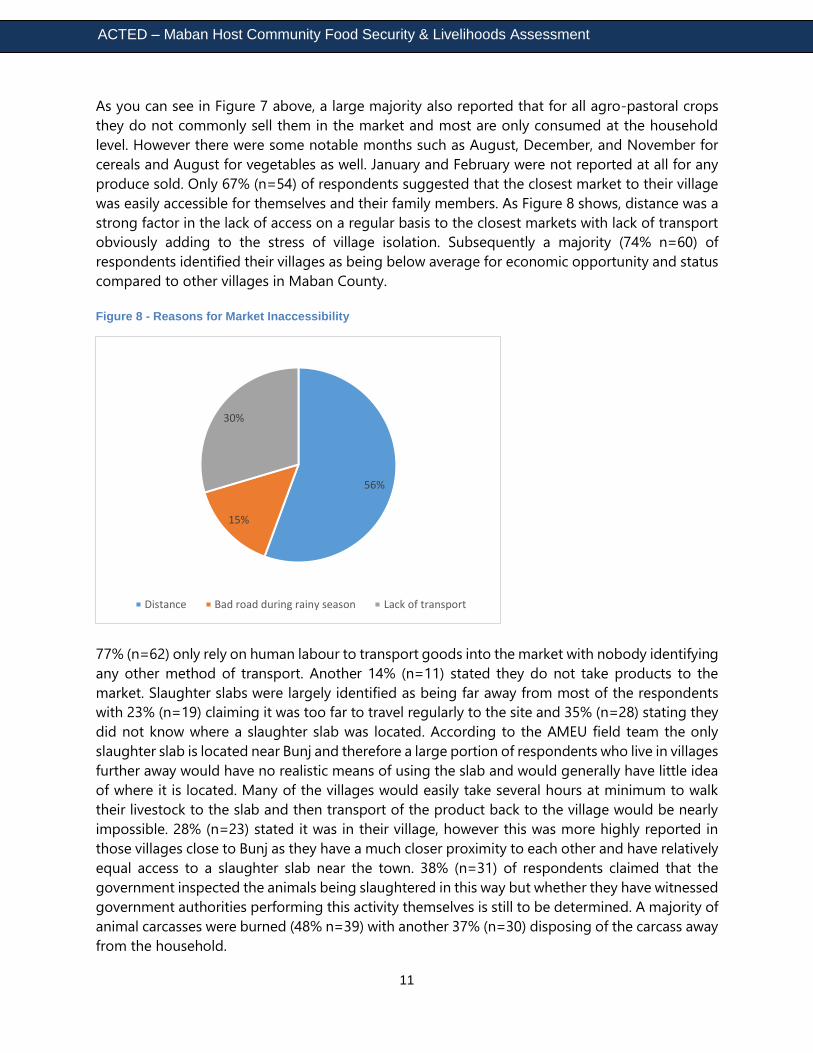
produce sold. Only 67% (n=54) of respondents suggested that the closest market to their village
was easily accessible for themselves and their family members. As Figure 8 shows, distance was a
strong factor in the lack of access on a regular basis to the closest markets with lack of transport
obviously adding to the stress of village isolation. Subsequently a majority (74% n=60) of
respondents identified their villages as being below average for economic opportunity and status
compared to other villages in Maban County.
Figure 8 - Reasons for Market Inaccessibility
77% (n=62) only rely on human labour to transport goods into the market with nobody identifying
any other method of transport. Another 14% (n=11) stated they do not take products to the
market. Slaughter slabs were largely identified as being far away from most of the respondents
with 23% (n=19) claiming it was too far to travel regularly to the site and 35% (n=28) stating they
did not know where a slaughter slab was located. According to the AMEU field team the only
slaughter slab is located near Bunj and therefore a large portion of respondents who live in villages
further away would have no realistic means of using the slab and would generally have little idea
of where it is located. Many of the villages would easily take several hours at minimum to walk
their livestock to the slab and then transport of the product back to the village would be nearly
impossible. 28% (n=23) stated it was in their village, however this was more highly reported in
those villages close to Bunj as they have a much closer proximity to each other and have relatively
equal access to a slaughter slab near the town. 38% (n=31) of respondents claimed that the
government inspected the animals being slaughtered in this way but whether they have witnessed
government authorities performing this activity themselves is still to be determined. A majority of
animal carcasses were burned (48% n=39) with another 37% (n=30) disposing of the carcass away
from the household.
56%
15%
30%
Distance Bad road during rainy season Lack of transport
ACTED – Maban Host Community Food Security & Livelihoods Assessment
12
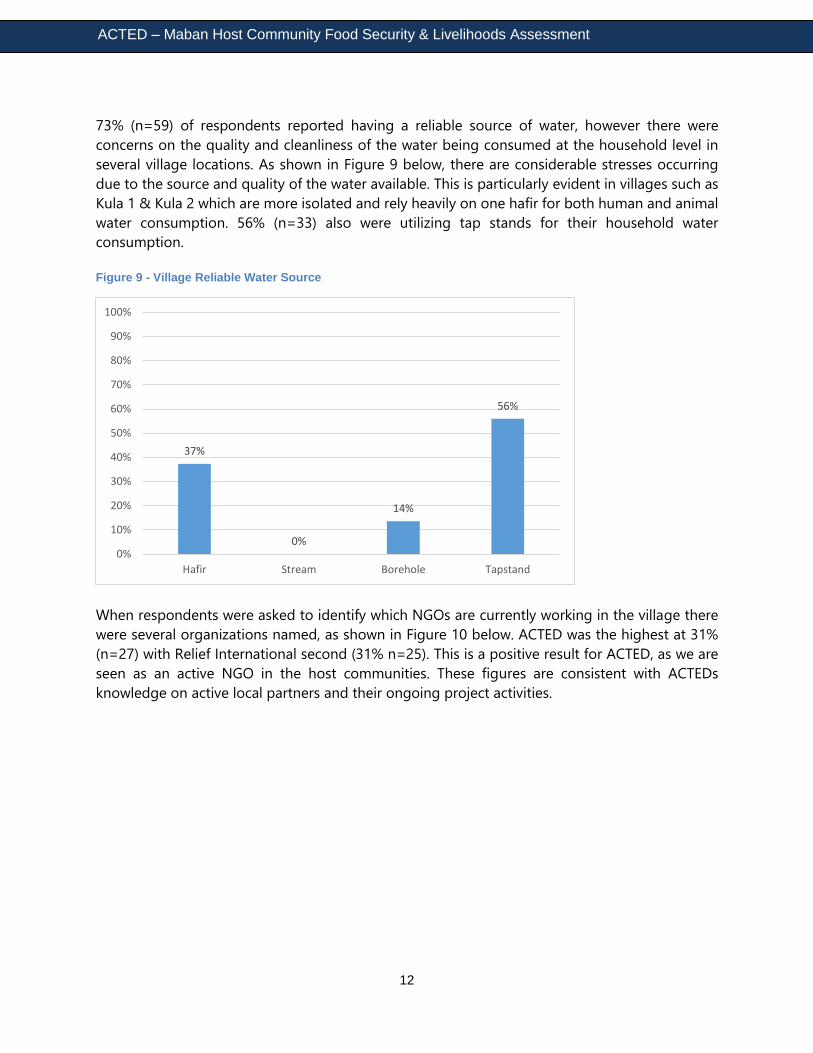
73% (n=59) of respondents reported having a reliable source of water, however there were
concerns on the quality and cleanliness of the water being consumed at the household level in
several village locations. As shown in Figure 9 below, there are considerable stresses occurring
due to the source and quality of the water available. This is particularly evident in villages such as
Kula 1 & Kula 2 which are more isolated and rely heavily on one hafir for both human and animal
water consumption. 56% (n=33) also were utilizing tap stands for their household water
consumption.
Figure 9 - Village Reliable Water Source
When respondents were asked to identify which NGOs are currently working in the village there
were several organizations named, as shown in Figure 10 below. ACTED was the highest at 31%
(n=27) with Relief International second (31% n=25). This is a positive result for ACTED, as we are
seen as an active NGO in the host communities. These figures are consistent with ACTEDs
knowledge on active local partners and their ongoing project activities.
37%
0%
14%
56%
0%
10%
20%
30%
40%
50%
60%
70%
80%
90%
100%
Hafir Stream Borehole Tapstand
ACTED – Maban Host Community Food Security & Livelihoods Assessment
13
Figure 10 - Identified NGOs Working in Host Community
Figure 11 - Services Offered in Village Vicinity
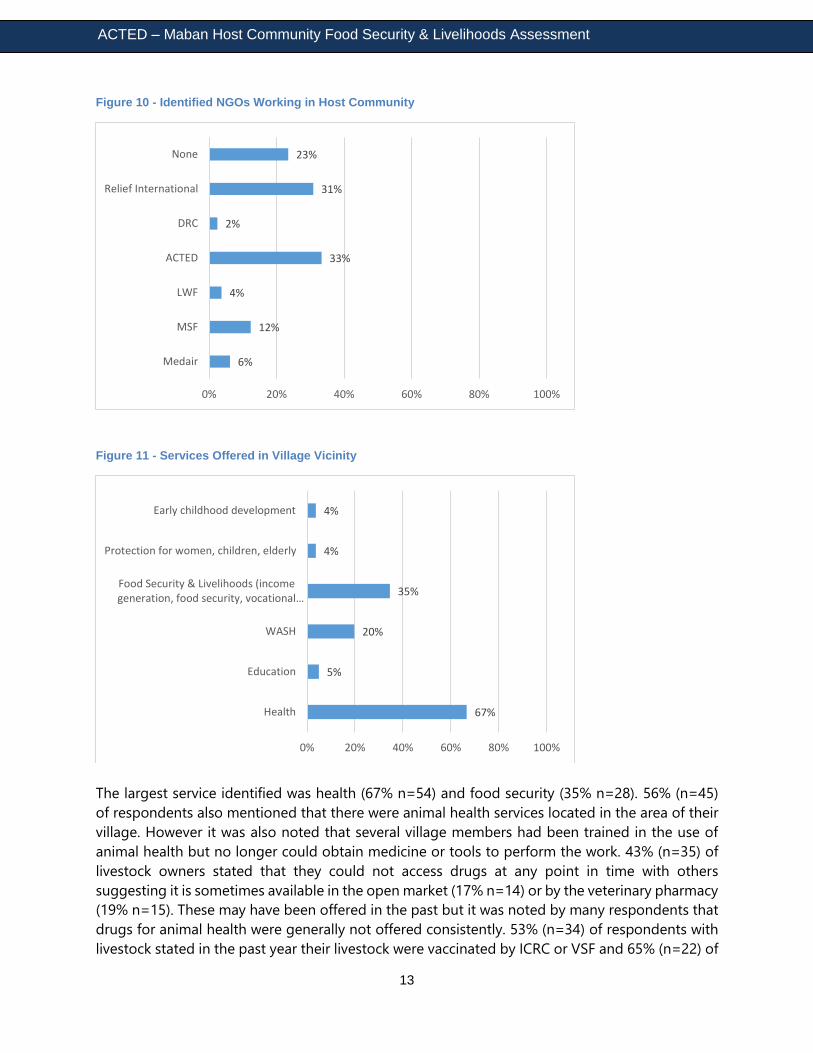
The largest service identified was health (67% n=54) and food security (35% n=28). 56% (n=45)
of respondents also mentioned that there were animal health services located in the area of their
village. However it was also noted that several village members had been trained in the use of
animal health but no longer could obtain medicine or tools to perform the work. 43% (n=35) of
livestock owners stated that they could not access drugs at any point in time with others
suggesting it is sometimes available in the open market (17% n=14) or by the veterinary pharmacy
(19% n=15). These may have been offered in the past but it was noted by many respondents that
drugs for animal health were generally not offered consistently. 53% (n=34) of respondents with
livestock stated in the past year their livestock were vaccinated by ICRC or VSF and 65% (n=22) of
6%
12%
4%
33%
2%
31%
23%
0% 20% 40% 60% 80% 100%
Medair
MSF
LWF
ACTED
DRC
Relief International
None
67%
5%
20%
35%
4%
4%
0% 20% 40% 60% 80% 100%
Health
Education
WASH
Food Security & Livelihoods (incomegeneration, food security, vocational…
Protection for women, children, elderly
Early childhood development
ACTED – Maban Host Community Food Security & Livelihoods Assessment
14
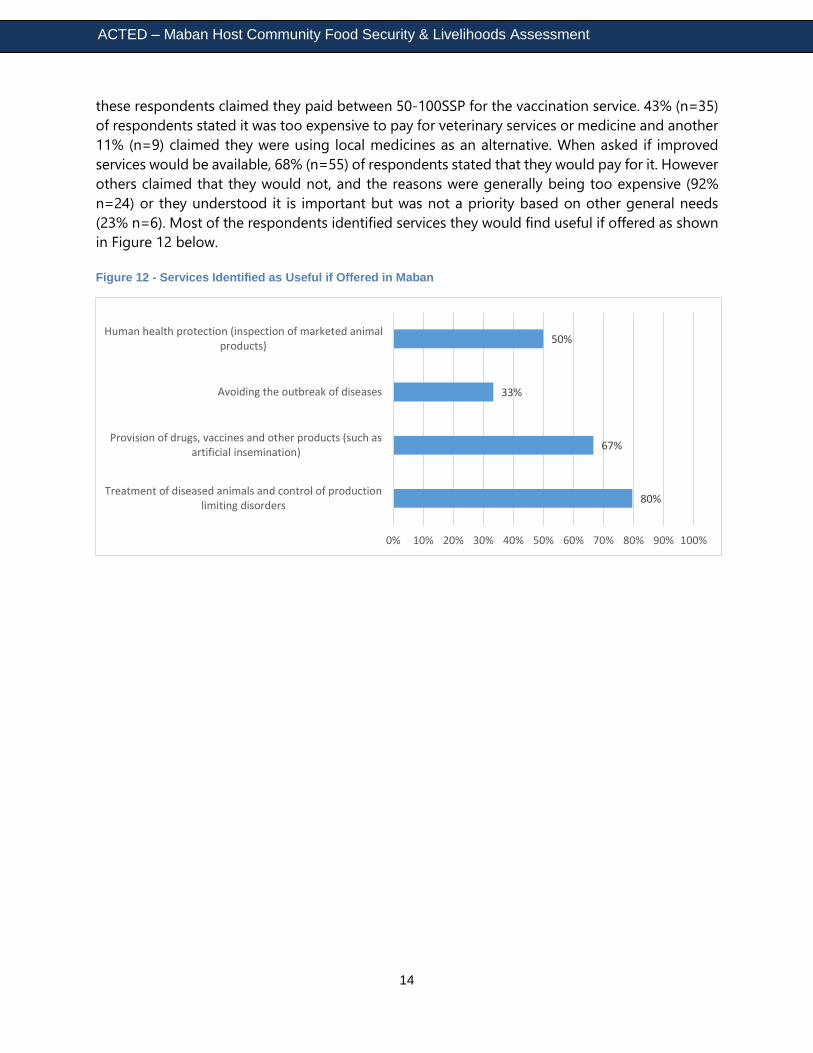
these respondents claimed they paid between 50-100SSP for the vaccination service. 43% (n=35)
of respondents stated it was too expensive to pay for veterinary services or medicine and another
11% (n=9) claimed they were using local medicines as an alternative. When asked if improved
services would be available, 68% (n=55) of respondents stated that they would pay for it. However
others claimed that they would not, and the reasons were generally being too expensive (92%
n=24) or they understood it is important but was not a priority based on other general needs
(23% n=6). Most of the respondents identified services they would find useful if offered as shown
in Figure 12 below.
Figure 12 - Services Identified as Useful if Offered in Maban
80%
67%
33%
50%
0% 10% 20% 30% 40% 50% 60% 70% 80% 90% 100%
Treatment of diseased animals and control of productionlimiting disorders
Provision of drugs, vaccines and other products (such asartificial insemination)
Avoiding the outbreak of diseases
Human health protection (inspection of marketed animalproducts)
ACTED – Maban Host Community Food Security & Livelihoods Assessment
15
Market Assessment Questionnaire
Market Demographic Profile
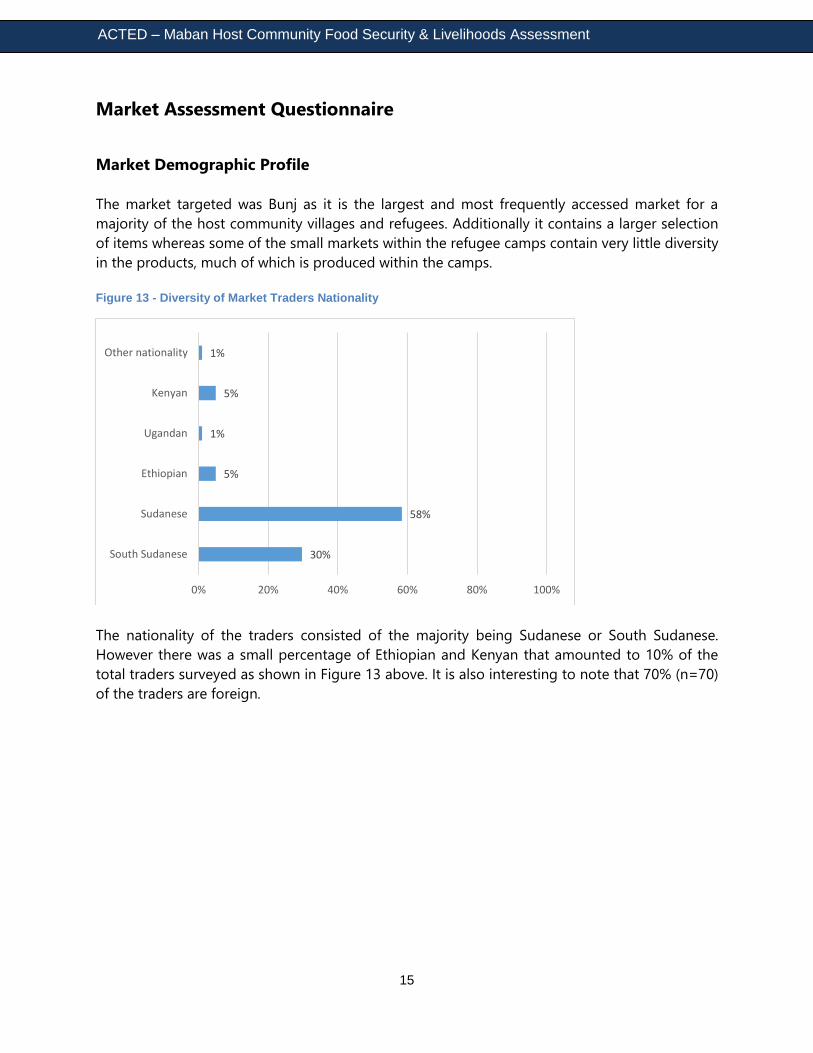
The market targeted was Bunj as it is the largest and most frequently accessed market for a
majority of the host community villages and refugees. Additionally it contains a larger selection
of items whereas some of the small markets within the refugee camps contain very little diversity
in the products, much of which is produced within the camps.
Figure 13 - Diversity of Market Traders Nationality
The nationality of the traders consisted of the majority being Sudanese or South Sudanese.
However there was a small percentage of Ethiopian and Kenyan that amounted to 10% of the
total traders surveyed as shown in Figure 13 above. It is also interesting to note that 70% (n=70)
of the traders are foreign.
30%
58%
5%
1%
5%
1%
0% 20% 40% 60% 80% 100%
South Sudanese
Sudanese
Ethiopian
Ugandan
Kenyan
Other nationality
ACTED – Maban Host Community Food Security & Livelihoods Assessment
16
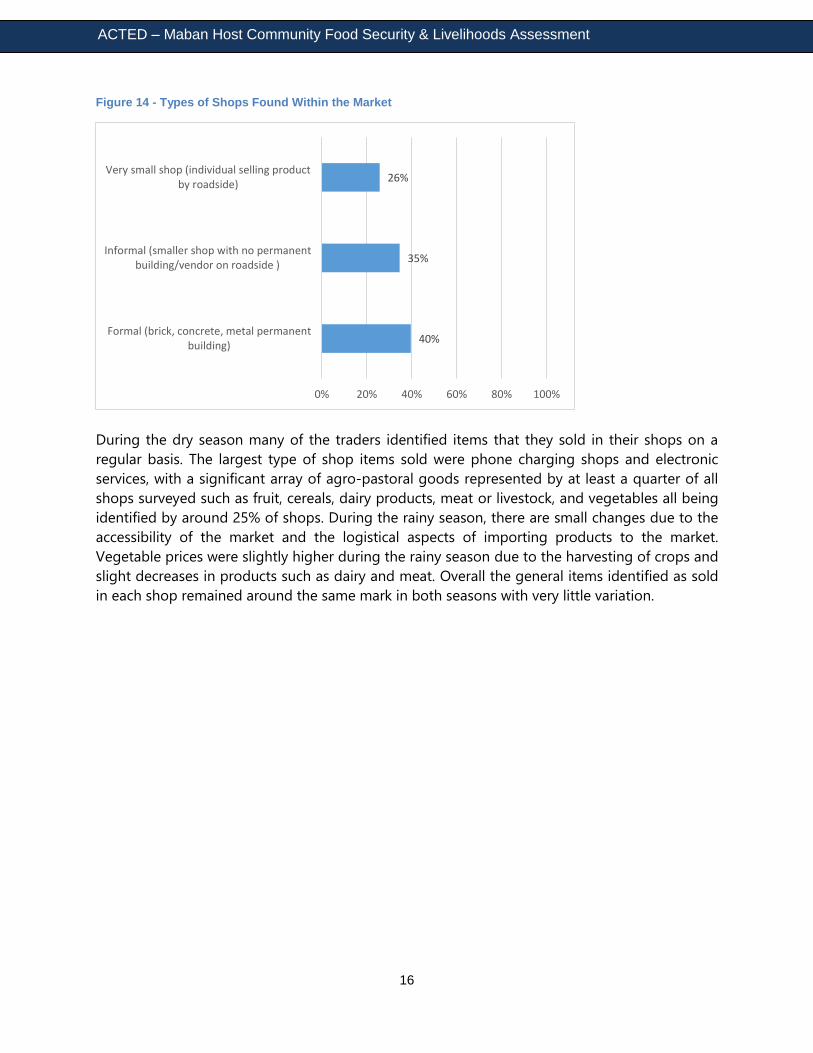
Figure 14 - Types of Shops Found Within the Market
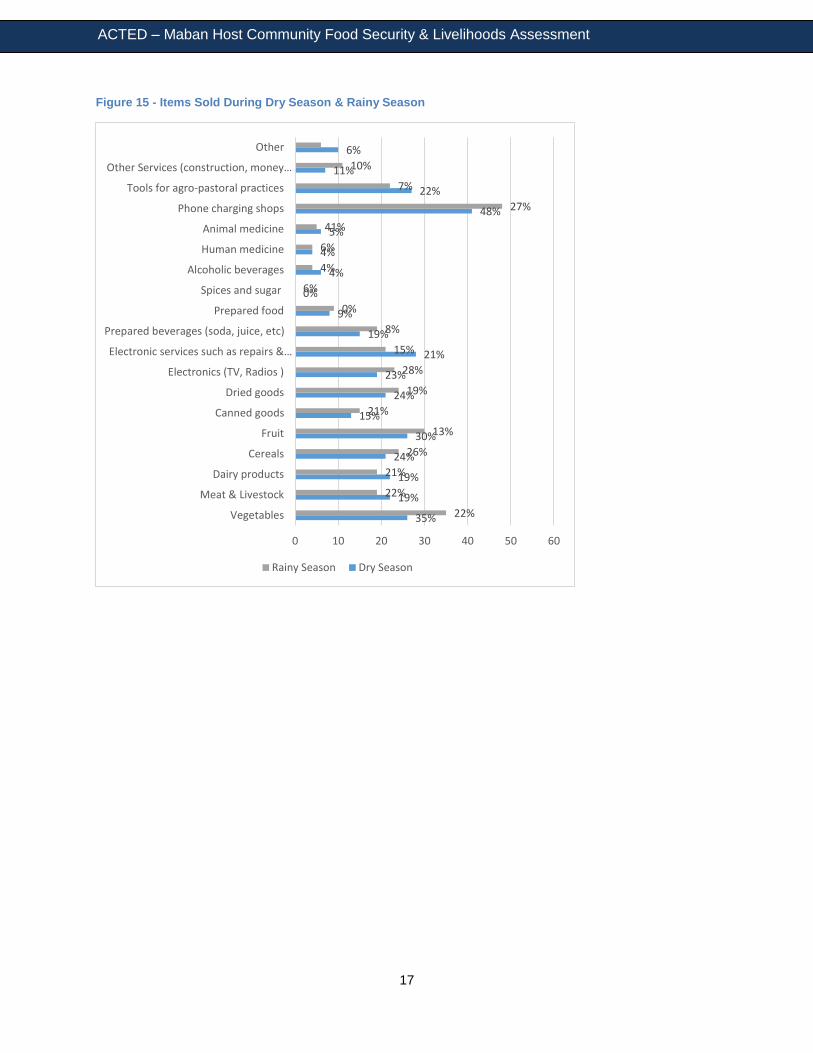
During the dry season many of the traders identified items that they sold in their shops on a
regular basis. The largest type of shop items sold were phone charging shops and electronic
services, with a significant array of agro-pastoral goods represented by at least a quarter of all
shops surveyed such as fruit, cereals, dairy products, meat or livestock, and vegetables all being
identified by around 25% of shops. During the rainy season, there are small changes due to the
accessibility of the market and the logistical aspects of importing products to the market.
Vegetable prices were slightly higher during the rainy season due to the harvesting of crops and
slight decreases in products such as dairy and meat. Overall the general items identified as sold
in each shop remained around the same mark in both seasons with very little variation.
40%
35%
26%
0% 20% 40% 60% 80% 100%
Formal (brick, concrete, metal permanentbuilding)
Informal (smaller shop with no permanentbuilding/vendor on roadside )
Very small shop (individual selling productby roadside)
ACTED – Maban Host Community Food Security & Livelihoods Assessment
17
Figure 15 - Items Sold During Dry Season & Rainy Season
35%
19%
19%
24%
30%
15%
24%
23%
21%
19%
9%
0%
4%
4%
5%
48%
22%
11%
6%
22%
22%
21%
26%
13%
21%
19%
28%
15%
8%
0%
6%
4%
6%
41%
27%
7%
10%
0 10 20 30 40 50 60
Vegetables
Meat & Livestock
Dairy products
Cereals
Fruit
Canned goods
Dried goods
Electronics (TV, Radios )
Electronic services such as repairs &…
Prepared beverages (soda, juice, etc)
Prepared food
Spices and sugar
Alcoholic beverages
Human medicine
Animal medicine
Phone charging shops
Tools for agro-pastoral practices
Other Services (construction, money…
Other
Rainy Season Dry Season
ACTED – Maban Host Community Food Security & Livelihoods Assessment
18
Figure 16 - Source of Goods Sold in Bunj
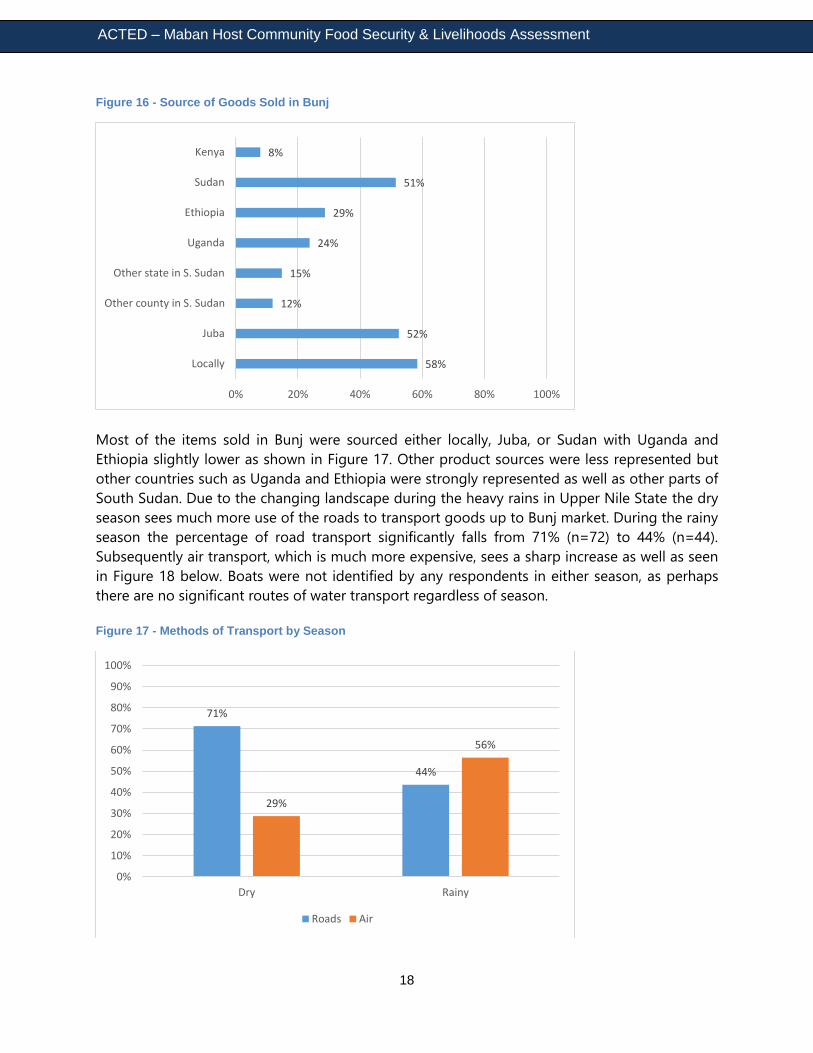
Most of the items sold in Bunj were sourced either locally, Juba, or Sudan with Uganda and
Ethiopia slightly lower as shown in Figure 17. Other product sources were less represented but
other countries such as Uganda and Ethiopia were strongly represented as well as other parts of
South Sudan. Due to the changing landscape during the heavy rains in Upper Nile State the dry
season sees much more use of the roads to transport goods up to Bunj market. During the rainy
season the percentage of road transport significantly falls from 71% (n=72) to 44% (n=44).
Subsequently air transport, which is much more expensive, sees a sharp increase as well as seen
in Figure 18 below. Boats were not identified by any respondents in either season, as perhaps
there are no significant routes of water transport regardless of season.
Figure 17 - Methods of Transport by Season
58%
52%
12%
15%
24%
29%
51%
8%
0% 20% 40% 60% 80% 100%
Locally
Juba
Other county in S. Sudan
Other state in S. Sudan
Uganda
Ethiopia
Sudan
Kenya
71%
44%
29%
56%
0%
10%
20%
30%
40%
50%
60%
70%
80%
90%
100%
Dry Rainy
Roads Air
ACTED – Maban Host Community Food Security & Livelihoods Assessment
19
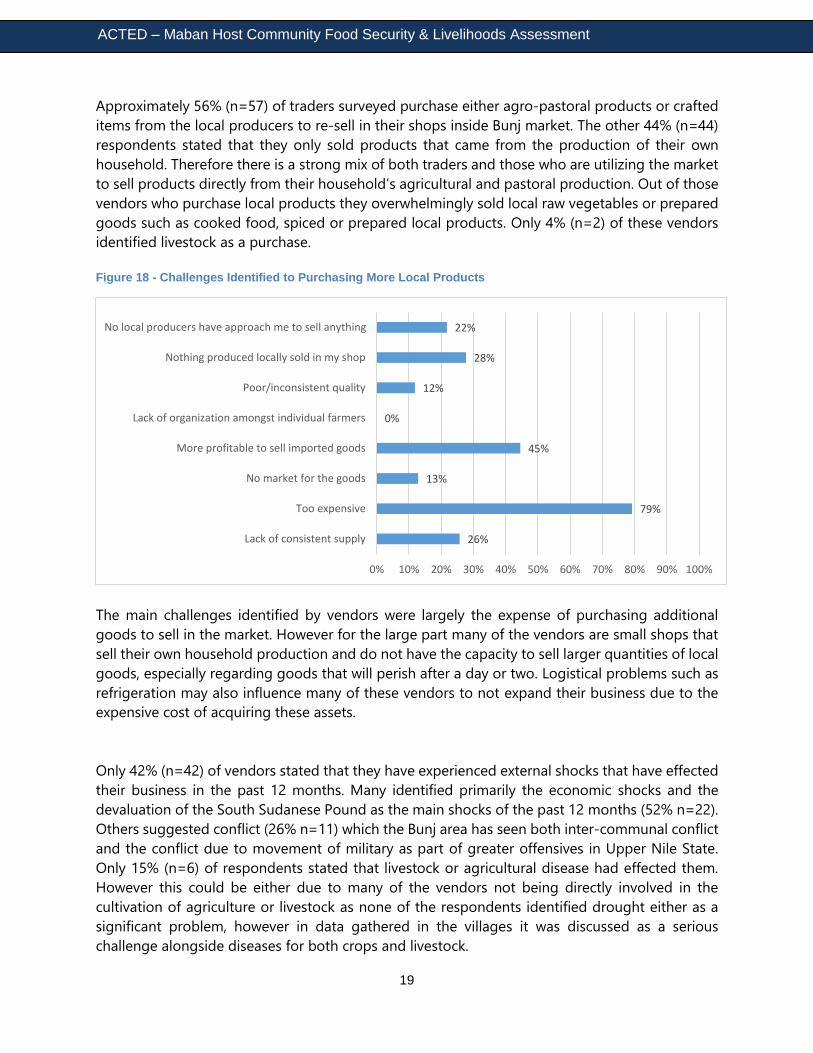
Approximately 56% (n=57) of traders surveyed purchase either agro-pastoral products or crafted
items from the local producers to re-sell in their shops inside Bunj market. The other 44% (n=44)
respondents stated that they only sold products that came from the production of their own
household. Therefore there is a strong mix of both traders and those who are utilizing the market
to sell products directly from their household’s agricultural and pastoral production. Out of those
vendors who purchase local products they overwhelmingly sold local raw vegetables or prepared
goods such as cooked food, spiced or prepared local products. Only 4% (n=2) of these vendors
identified livestock as a purchase.
Figure 18 - Challenges Identified to Purchasing More Local Products
The main challenges identified by vendors were largely the expense of purchasing additional
goods to sell in the market. However for the large part many of the vendors are small shops that
sell their own household production and do not have the capacity to sell larger quantities of local
goods, especially regarding goods that will perish after a day or two. Logistical problems such as
refrigeration may also influence many of these vendors to not expand their business due to the
expensive cost of acquiring these assets.
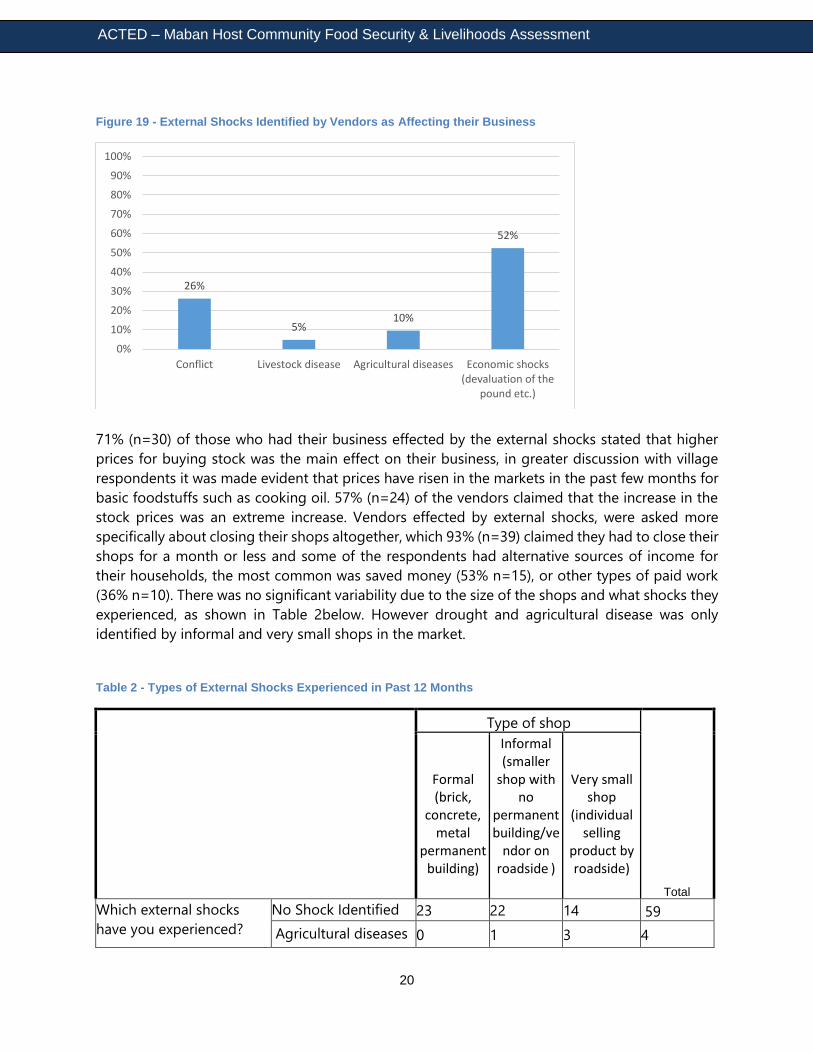
Only 42% (n=42) of vendors stated that they have experienced external shocks that have effected
their business in the past 12 months. Many identified primarily the economic shocks and the
devaluation of the South Sudanese Pound as the main shocks of the past 12 months (52% n=22).
Others suggested conflict (26% n=11) which the Bunj area has seen both inter-communal conflict
and the conflict due to movement of military as part of greater offensives in Upper Nile State.
Only 15% (n=6) of respondents stated that livestock or agricultural disease had effected them.
However this could be either due to many of the vendors not being directly involved in the
cultivation of agriculture or livestock as none of the respondents identified drought either as a
significant problem, however in data gathered in the villages it was discussed as a serious
challenge alongside diseases for both crops and livestock.
26%
79%
13%
45%
0%
12%
28%
22%
0% 10% 20% 30% 40% 50% 60% 70% 80% 90% 100%
Lack of consistent supply
Too expensive
No market for the goods
More profitable to sell imported goods
Lack of organization amongst individual farmers
Poor/inconsistent quality
Nothing produced locally sold in my shop
No local producers have approach me to sell anything
ACTED – Maban Host Community Food Security & Livelihoods Assessment
20
Figure 19 - External Shocks Identified by Vendors as Affecting their Business
71% (n=30) of those who had their business effected by the external shocks stated that higher
prices for buying stock was the main effect on their business, in greater discussion with village
respondents it was made evident that prices have risen in the markets in the past few months for
basic foodstuffs such as cooking oil. 57% (n=24) of the vendors claimed that the increase in the
stock prices was an extreme increase. Vendors effected by external shocks, were asked more
specifically about closing their shops altogether, which 93% (n=39) claimed they had to close their
shops for a month or less and some of the respondents had alternative sources of income for
their households, the most common was saved money (53% n=15), or other types of paid work
(36% n=10). There was no significant variability due to the size of the shops and what shocks they
experienced, as shown in Table 2below. However drought and agricultural disease was only
identified by informal and very small shops in the market.
Table 2 - Types of External Shocks Experienced in Past 12 Months
Type of shop
Total
Formal (brick,
concrete, metal
permanent building)
Informal (smaller
shop with no
permanent building/ve
ndor on roadside )
Very small shop
(individual selling
product by roadside)
Which external shocks
have you experienced?
No Shock Identified 23 22 14 59
Agricultural diseases 0 1 3 4
26%
5%10%
52%
0%
10%
20%
30%
40%
50%
60%
70%
80%
90%
100%
Conflict Livestock disease Agricultural diseases Economic shocks(devaluation of the
pound etc.)
ACTED – Maban Host Community Food Security & Livelihoods Assessment
21
Conflict 4 4 3 11
Drought 0 0 3 3
Economic 12 7 3 22
Livestock disease 1 1 0 2
Total 40 35 26 101
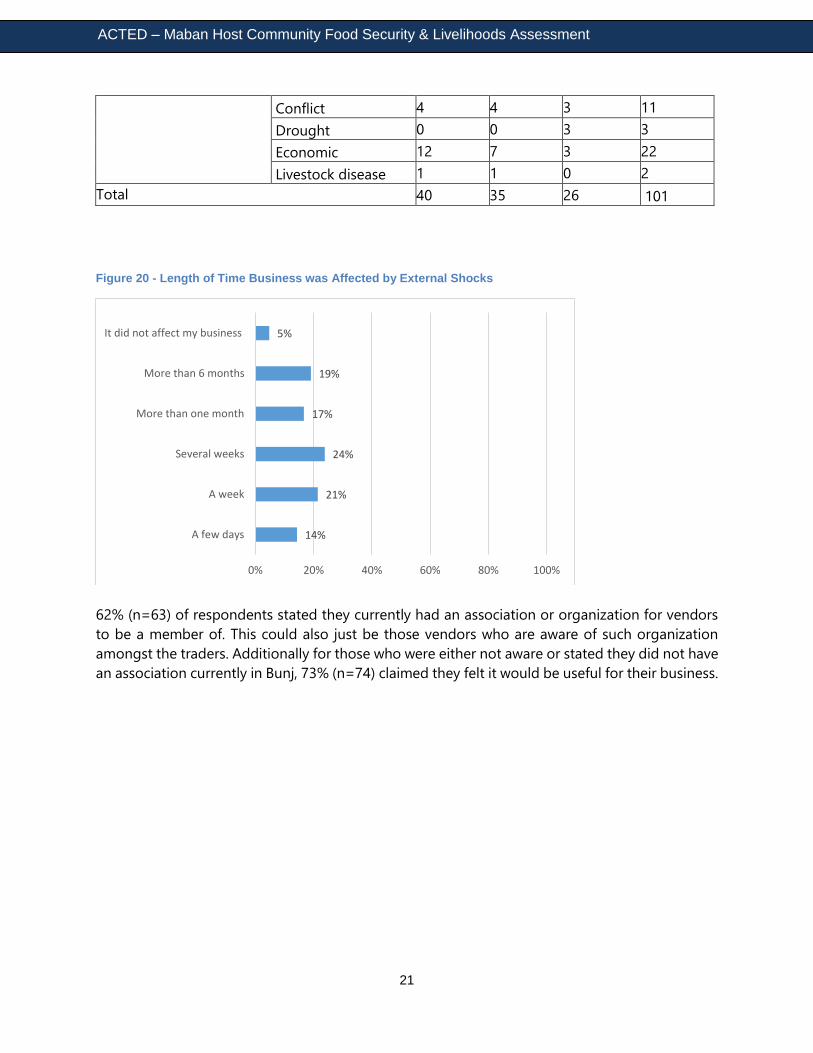
Figure 20 - Length of Time Business was Affected by External Shocks
62% (n=63) of respondents stated they currently had an association or organization for vendors
to be a member of. This could also just be those vendors who are aware of such organization
amongst the traders. Additionally for those who were either not aware or stated they did not have
an association currently in Bunj, 73% (n=74) claimed they felt it would be useful for their business.
14%
21%
24%
17%
19%
5%
0% 20% 40% 60% 80% 100%
A few days
A week
Several weeks
More than one month
More than 6 months
It did not affect my business
ACTED – Maban Host Community Food Security & Livelihoods Assessment
22
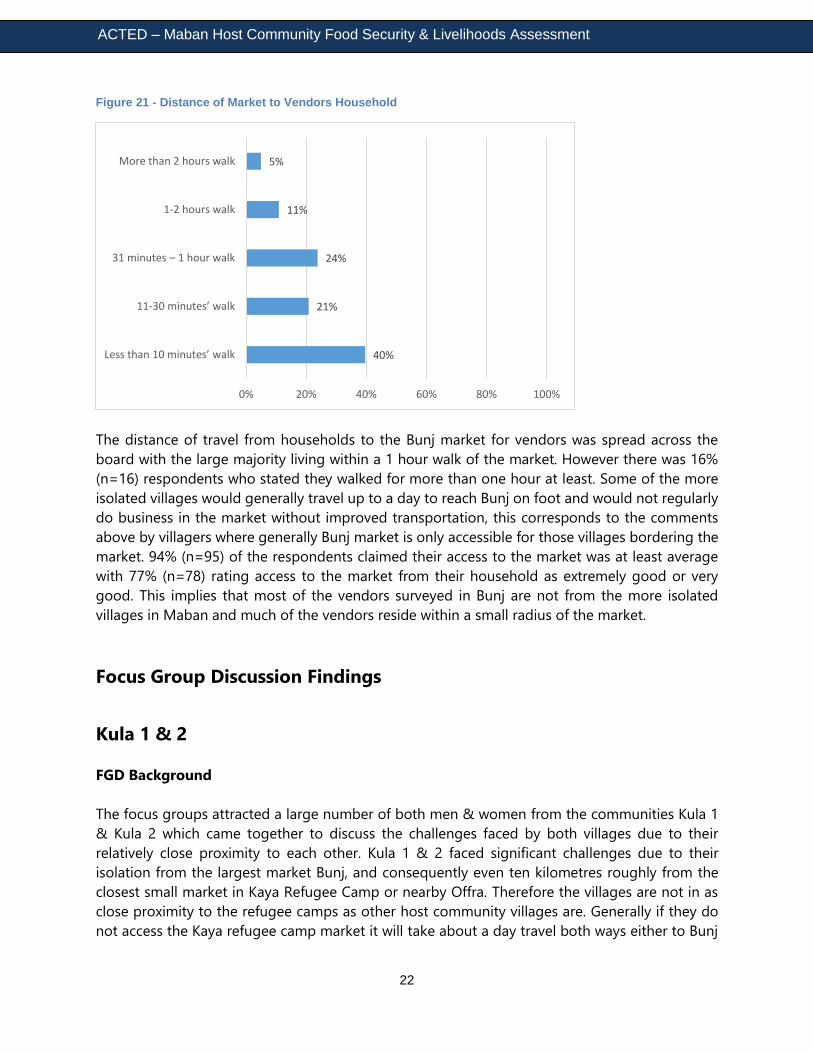
Figure 21 - Distance of Market to Vendors Household
The distance of travel from households to the Bunj market for vendors was spread across the
board with the large majority living within a 1 hour walk of the market. However there was 16%
(n=16) respondents who stated they walked for more than one hour at least. Some of the more
isolated villages would generally travel up to a day to reach Bunj on foot and would not regularly
do business in the market without improved transportation, this corresponds to the comments
above by villagers where generally Bunj market is only accessible for those villages bordering the
market. 94% (n=95) of the respondents claimed their access to the market was at least average
with 77% (n=78) rating access to the market from their household as extremely good or very
good. This implies that most of the vendors surveyed in Bunj are not from the more isolated
villages in Maban and much of the vendors reside within a small radius of the market.
Focus Group Discussion Findings
Kula 1 & 2
FGD Background
The focus groups attracted a large number of both men & women from the communities Kula 1
& Kula 2 which came together to discuss the challenges faced by both villages due to their
relatively close proximity to each other. Kula 1 & 2 faced significant challenges due to their
isolation from the largest market Bunj, and consequently even ten kilometres roughly from the
closest small market in Kaya Refugee Camp or nearby Offra. Therefore the villages are not in as
close proximity to the refugee camps as other host community villages are. Generally if they do
not access the Kaya refugee camp market it will take about a day travel both ways either to Bunj
40%
21%
24%
11%
5%
0% 20% 40% 60% 80% 100%
Less than 10 minutes’ walk
11-30 minutes’ walk
31 minutes – 1 hour walk
1-2 hours walk
More than 2 hours walk
ACTED – Maban Host Community Food Security & Livelihoods Assessment
23
or Jamam without access to a vehicle. Therefore the hafir and water supply are solely utilized by
their villages and other smaller villages in the area.
Community Challenges
Community members identified several distinct challenges, when asked about the main concerns
that they experience on a day-to-day basis: Water, Food (seeds), human & animal health,
education, & agricultural support (e.g. grinding mills).
Community members expressed serious concern over the annual drought that has occurred for
the past several months in Maban. This has significantly affected crop production with huge
depletion of food stocks without replenishment. If the crops do not grow well enough due to the
drought there will be significant food insecurity in the area. Some community members claimed
they had witnessed crops being infested by insects and they could not prevent this. Coping
mechanisms were identified such as the selling of timber, in the form of firewood or charcoal,
from nearby forests to ensure an income for households. This has contributed to the deforestation
of the region and long term will reinforce the challenges related to drought. Livestock was also
identified to have suffered some ailments such as diarrhea by pastoralists in the community. Most
of the members of the community only had around 2-5 livestock on average each and so when
they sold livestock for money or food in the market due to lack of agricultural production it is a
severe loss of assets for a household, however this would be a very severe coping mechanism for
many households and would not occur until there was a clear and sustained drought and crops
have not produced by September or October during which initial crop harvest should take place
according to the community. Members of the community discussed that there was a grinding mill
provided to the community but the community lacks the technical knowledge for its maintenance
as well as the capacity to replace parts when they fall into disrepair, however the FSL technical
team identified the machine as a high quality brand when it was shown to the ACTED team.
Water was the main issue highlighted for these communities, as they were now obtaining water
for both animal and human consumption from a hafir that was built previously by ACTED solely
for the host community. There were previous attempts to construct functioning tap stands in Kula
1 by OXFAM however they have ceased to function properly and require maintenance. Some
community members explained that there were functioning tap stands but there was both a lack
of technical knowledge for maintenance on the motor as well as a lack of material for replacement
in case parts broke. Therefore it would seem more self-sustaining approaches would be useful in
the more remote villages for the provision of water. Additionally the community members brought
up that the tap stand attracted other villages further out to come utilize their water supply which
could not provide enough water for both their own households and the other villages.
The community brought up the fact that they had high capacity to mobilize as a community when
they were facing challenges and often worked together to resolve the problems identified above.
However after they discussed as a community they noted there is little capacity through official
government channels to resolve any of these issues so they have reported several times to the
ACTED – Maban Host Community Food Security & Livelihoods Assessment
24
commissioner through the local Sheikh. The villagers seemed to be slightly discouraged by both
the actions of NGOs and local authorities up until this point. They noted both failed projects by
NGOs in their village, as well as, no feedback from local authorities. To be realistic the government
has very little presence in the area and therefore any action on their behalf would not satisfy the
communities material requirements yet they also stressed it would be useful to receive feedback
on where the reports from the local community leaders have been sent.
Pakaji East
Pakaji East is located between Gendrassa Refugee Camp and Bunj market on the main road. It is
closer in proximity to Bunj and therefore has slightly better opportunities to profit from the
market. However it shared very similar challenges to Kula 1 & 2 regarding food security and water.
Community Challenges
The community claimed that there was only one small hand pump for the community which was
not sufficient for the population in the area. Additionally the lack of rain was also noted as a
serious problem in this community with seeds planted and a lack of rain threatening to spoil early
and healthy crop harvest. Additionally they have been the target of thefts for livestock in the past
and tension has grown between other communities and their own.
Coping mechanisms for Pakaji East were similar with many households cutting trees and selling it
as firewood or charcoal in Bunj market. There were only a handful of community members
employed in other income generating activities and therefore relied heavily on their own
agricultural and livestock production. Livestock was fairly small scale for most households with
only around 2-5 livestock and therefore most of the households were relying more on the
agricultural crops they produced. Whenever they had problems to discuss as a community they
would raise the issue to their Sheikh and he would then be in charge of reporting the issue to the
commissioner and local authorities. This, however, is similar to the case of Kula in which local
government lacks the capacity to do anything about the grievances.
The community members claimed that some individuals were trained as CAHW (Community
Animal Health Workers) through an NGO project but that they lacked any capability to obtain
drugs to treat animals in the area on a regular basis. Additionally they had been targeted for a
grinding mill but the project never materialized and it created tension between the community
and the organization involved as the community had been instructed to build a structure that is
still there and once it was completed the project activity was not concluded. Therefore they remain
skeptical of project activities in their community, however community mobilization and their
willingness to work together to achieve results that benefit all of their community members
seemed incredibly high due to the activities they had reported collaborating on in the past such
as the construction of shelters, granaries, and the planting and maintenance of a pilot tree nursery
project and in some cases such as the grinding mill shelter they took strong initiative and followed
up several times as a community with the NGO at their office to no avail. They were interested,
ACTED – Maban Host Community Food Security & Livelihoods Assessment
25
however, in pursuing the idea of cooperation with ACTED and have also been working with the
FSL team on a pilot project for tree nursery and have responded well and mentioned this in the
discussion as useful.
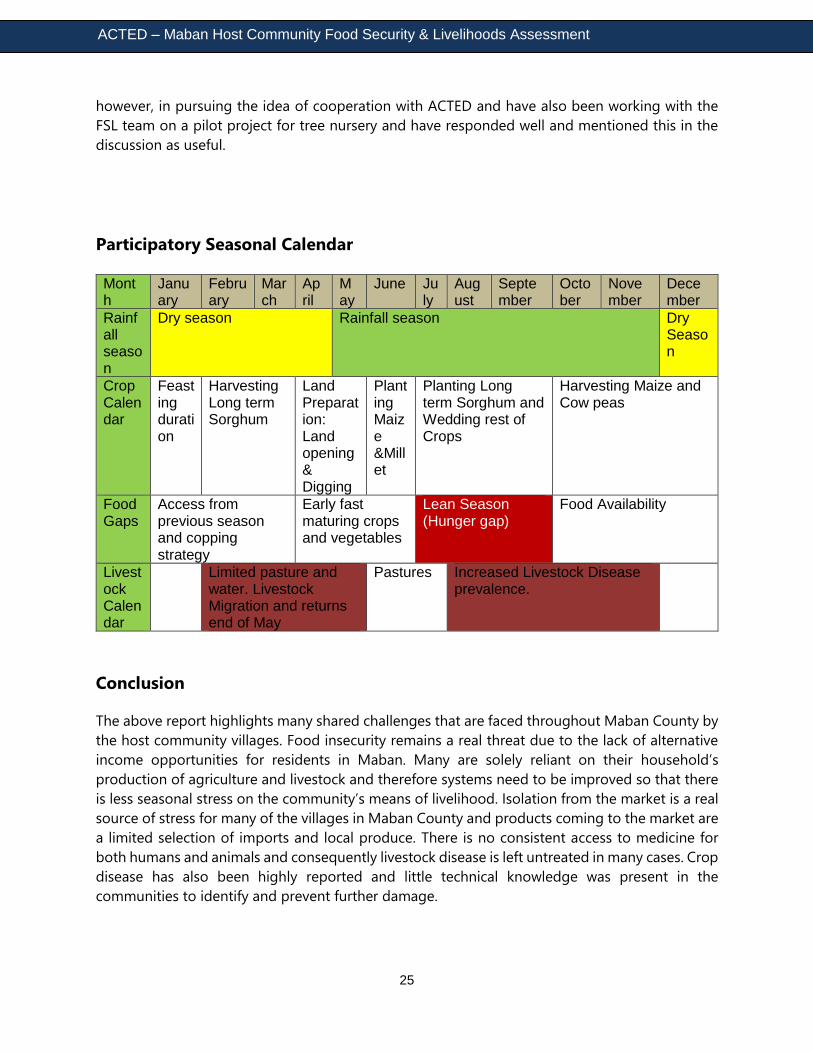
Participatory Seasonal Calendar
Month
January
February
March
April
May
June July
August
September
October
November
December
Rainfall season
Dry season Rainfall season Dry Season
Crop Calendar
Feasting duration
Harvesting Long term Sorghum
Land Preparation: Land opening & Digging
Planting Maize &Millet
Planting Long term Sorghum and Wedding rest of Crops
Harvesting Maize and Cow peas
Food Gaps
Access from previous season and copping strategy
Early fast maturing crops and vegetables
Lean Season (Hunger gap)
Food Availability
Livestock Calendar
Limited pasture and water. Livestock Migration and returns end of May
Pastures Increased Livestock Disease prevalence.
Conclusion
The above report highlights many shared challenges that are faced throughout Maban County by
the host community villages. Food insecurity remains a real threat due to the lack of alternative
income opportunities for residents in Maban. Many are solely reliant on their household’s
production of agriculture and livestock and therefore systems need to be improved so that there
is less seasonal stress on the community’s means of livelihood. Isolation from the market is a real
source of stress for many of the villages in Maban County and products coming to the market are
a limited selection of imports and local produce. There is no consistent access to medicine for
both humans and animals and consequently livestock disease is left untreated in many cases. Crop
disease has also been highly reported and little technical knowledge was present in the
communities to identify and prevent further damage.
ACTED – Maban Host Community Food Security & Livelihoods Assessment
26
Recommendations
Project interventions have to consider the local capacity to acquire materials due to the
isolation of many villages in question. Low maintenance and sustainable approaches are
more advisable.
Water has been identified as a serious issue in many of the villages. The food insecurity in
the villages has been intensified by the lack of adequate water provision for both animals
and humans.
Interventions focused on training should take into consideration the local seasonal
calendar for any project activities to ensure they are effectively presented to ensure
optimal knowledge transfer.
ACTED – Maban Host Community Food Security & Livelihoods Assessment
27
Annexes
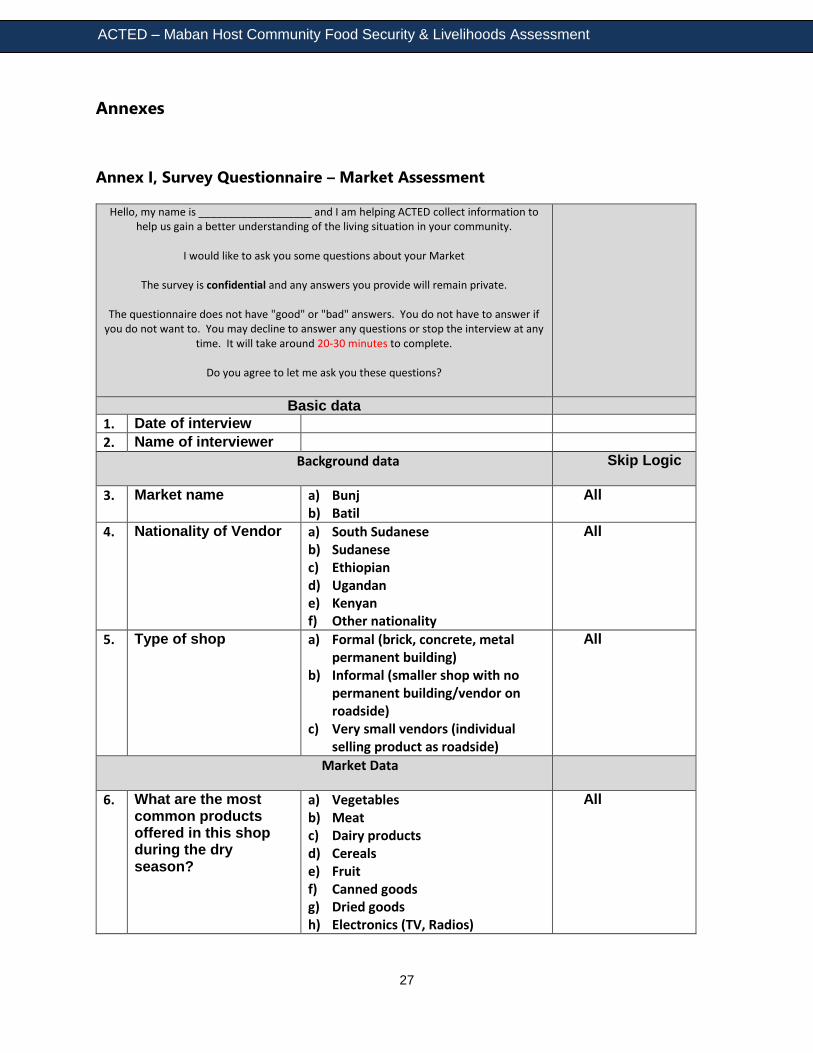
Annex I, Survey Questionnaire – Market Assessment
Hello, my name is ___________________ and I am helping ACTED collect information to help us gain a better understanding of the living situation in your community.
I would like to ask you some questions about your Market
The survey is confidential and any answers you provide will remain private.
The questionnaire does not have "good" or "bad" answers. You do not have to answer if
you do not want to. You may decline to answer any questions or stop the interview at any time. It will take around 20-30 minutes to complete.
Do you agree to let me ask you these questions?
Basic data
1. Date of interview
2. Name of interviewer
Background data Skip Logic
3. Market name a) Bunj b) Batil
All
4. Nationality of Vendor a) South Sudanese b) Sudanese c) Ethiopian d) Ugandan e) Kenyan f) Other nationality
All
5. Type of shop a) Formal (brick, concrete, metal permanent building)
b) Informal (smaller shop with no permanent building/vendor on roadside)
c) Very small vendors (individual selling product as roadside)
All
Market Data
6. What are the most common products offered in this shop during the dry season?
a) Vegetables b) Meat c) Dairy products d) Cereals e) Fruit f) Canned goods g) Dried goods h) Electronics (TV, Radios)
All
ACTED – Maban Host Community Food Security & Livelihoods Assessment
28
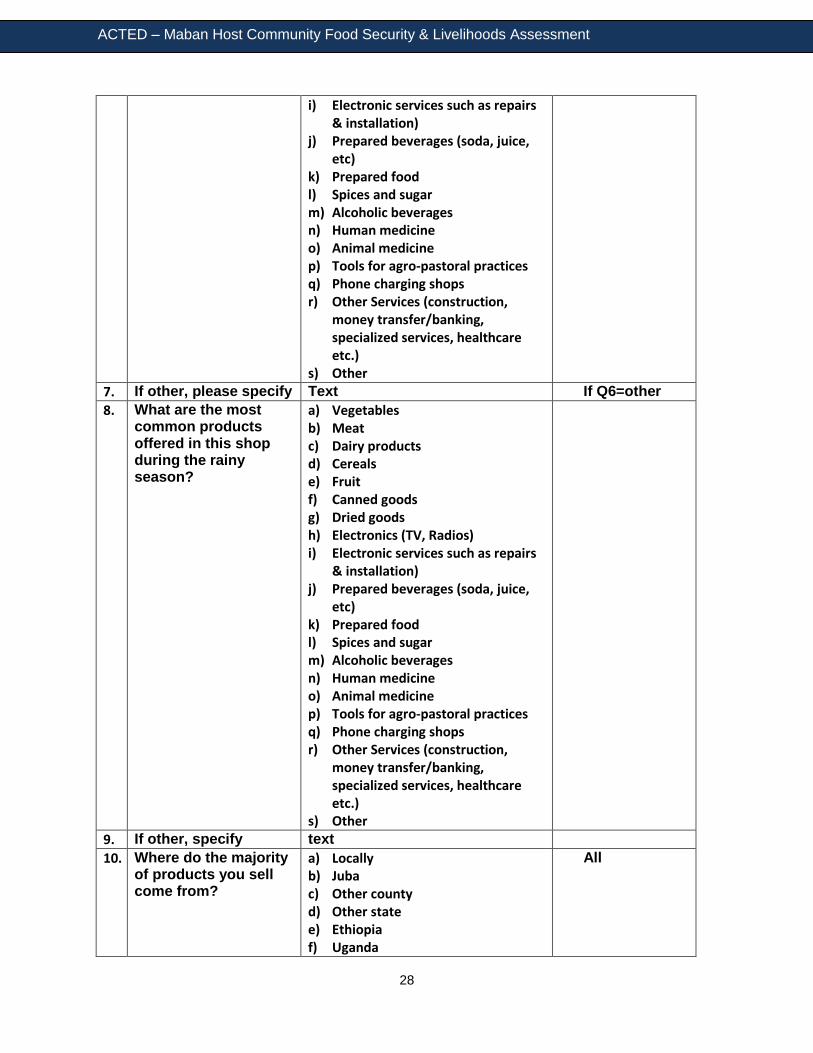
i) Electronic services such as repairs & installation)
j) Prepared beverages (soda, juice, etc)
k) Prepared food l) Spices and sugar m) Alcoholic beverages n) Human medicine o) Animal medicine p) Tools for agro-pastoral practices q) Phone charging shops r) Other Services (construction,
money transfer/banking, specialized services, healthcare etc.)
s) Other
7. If other, please specify Text If Q6=other
8. What are the most common products offered in this shop during the rainy season?
a) Vegetables b) Meat c) Dairy products d) Cereals e) Fruit f) Canned goods g) Dried goods h) Electronics (TV, Radios) i) Electronic services such as repairs
& installation) j) Prepared beverages (soda, juice,
etc) k) Prepared food l) Spices and sugar m) Alcoholic beverages n) Human medicine o) Animal medicine p) Tools for agro-pastoral practices q) Phone charging shops r) Other Services (construction,
money transfer/banking, specialized services, healthcare etc.)
s) Other
9. If other, specify text
10. Where do the majority of products you sell come from?
a) Locally b) Juba c) Other county d) Other state e) Ethiopia f) Uganda
All
ACTED – Maban Host Community Food Security & Livelihoods Assessment
29
g) Sudan
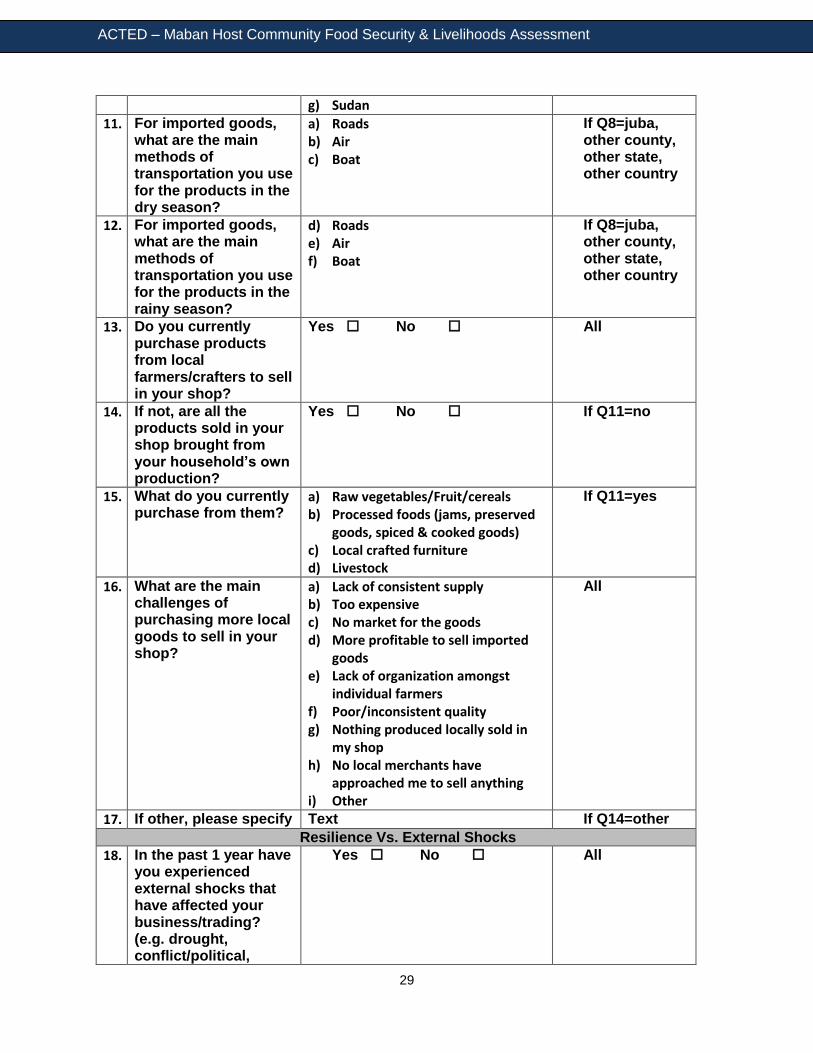
11. For imported goods, what are the main methods of transportation you use for the products in the dry season?
a) Roads b) Air c) Boat
If Q8=juba, other county, other state, other country
12. For imported goods, what are the main methods of transportation you use for the products in the rainy season?
d) Roads e) Air f) Boat
If Q8=juba, other county, other state, other country
13. Do you currently purchase products from local farmers/crafters to sell in your shop?
Yes No All
14. If not, are all the products sold in your shop brought from your household’s own production?
Yes No If Q11=no
15. What do you currently purchase from them?
a) Raw vegetables/Fruit/cereals b) Processed foods (jams, preserved
goods, spiced & cooked goods) c) Local crafted furniture d) Livestock
If Q11=yes
16. What are the main challenges of purchasing more local goods to sell in your shop?
a) Lack of consistent supply b) Too expensive c) No market for the goods d) More profitable to sell imported
goods e) Lack of organization amongst
individual farmers f) Poor/inconsistent quality g) Nothing produced locally sold in
my shop h) No local merchants have
approached me to sell anything i) Other
All
17. If other, please specify Text If Q14=other
Resilience Vs. External Shocks
18. In the past 1 year have you experienced external shocks that have affected your business/trading? (e.g. drought, conflict/political,
Yes No All

ACTED – Maban Host Community Food Security & Livelihoods Assessment
30
livestock disease, flooding, human disease 1outbreaks, etc.)
19. Which ones have you experienced?
a) Drought b) Conflict c) Livestock disease d) Flooding e) Agricultural diseases f) Economic shocks (devaluation of
the pound, etc.)
If Q16=yes
20. How did this effect your business?
a) Less customers b) More customers c) Less products available d) Higher prices to purchase products
If Q16=yes
21. How did this change product prices?
a) Extreme increase b) Large increase c) Stayed the same d) Large decrease e) Extreme decrease
If Q16=yes
22. How did this change product availability?
a) No products available for purchase/import
b) Very few products available for purchase/import
c) Stayed the same d) Longer transport time e) Other
If Q16=yes
23. If other, specify Text If Q20=other
24. Did you have to locate new sources of products to bring your products to market?
Yes No If Q16=yes
25. Did you have to change your methods of transport?
Yes No
26. How long, would you estimate, your business was affected significantly by the external shocks? (e.g. closing shop, product price increase, product availability, etc.)
a) A few days b) A week c) Several weeks d) More than one month e) More than 6 months but continues
to affect my business f) More than 6 months but it has
returned to normal g) It did not affect my business
If Q16=yes
27. Has there been any point where you could not operate your shop for an extended period
a) 1 week b) 2 weeks c) 1 month d) More than 1 month
If Q16=yes
ACTED – Maban Host Community Food Security & Livelihoods Assessment
31
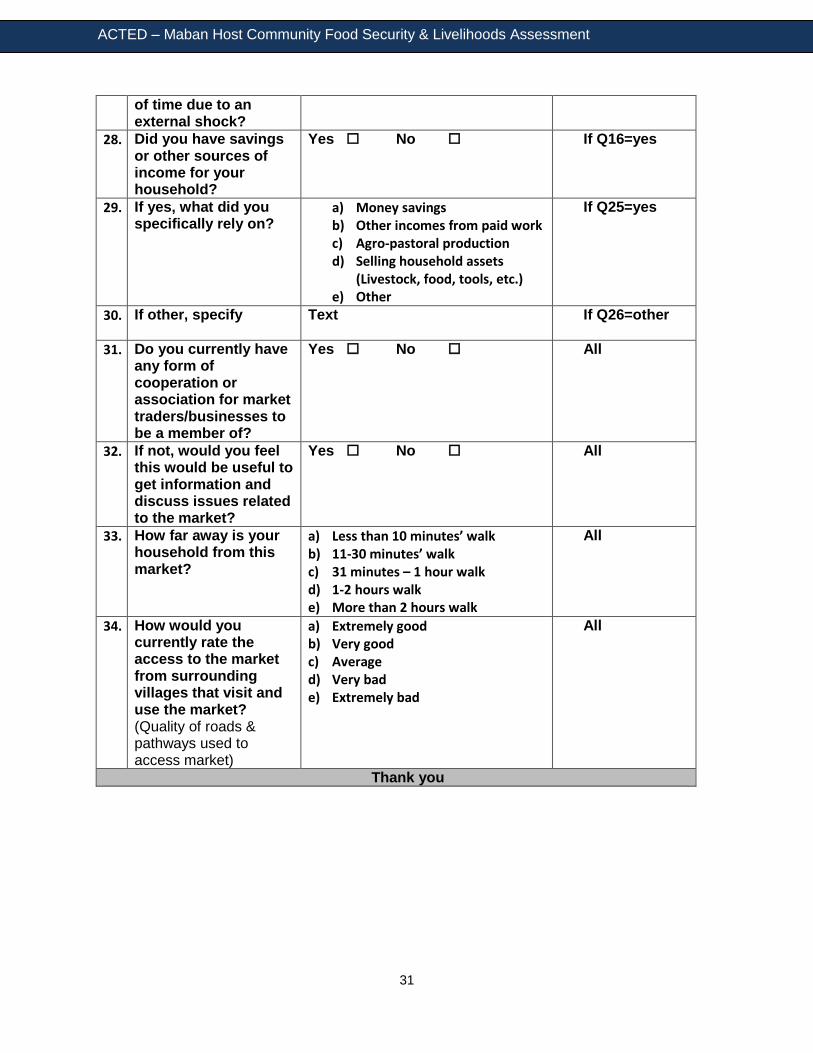
of time due to an external shock?
28. Did you have savings or other sources of income for your household?
Yes No If Q16=yes
29. If yes, what did you specifically rely on?
a) Money savings b) Other incomes from paid work c) Agro-pastoral production d) Selling household assets
(Livestock, food, tools, etc.) e) Other
If Q25=yes
30. If other, specify Text If Q26=other
31. Do you currently have any form of cooperation or association for market traders/businesses to be a member of?
Yes No All
32. If not, would you feel this would be useful to get information and discuss issues related to the market?
Yes No All
33. How far away is your household from this market?
a) Less than 10 minutes’ walk b) 11-30 minutes’ walk c) 31 minutes – 1 hour walk d) 1-2 hours walk e) More than 2 hours walk
All
34. How would you currently rate the access to the market from surrounding villages that visit and use the market? (Quality of roads & pathways used to access market)
a) Extremely good b) Very good c) Average d) Very bad e) Extremely bad
All
Thank you

ACTED – Maban Host Community Food Security & Livelihoods Assessment
32
Annex II, Survey Questionnaire – Village Assessment
Hello, my name is ___________________ and I am helping ACTED collect information to help us gain a better understanding of the living situation in your community.
I would like to ask you some questions about your household & village food security &
livelihoods
The survey is confidential and any answers you provide will remain private.
The questionnaire does not have "good" or "bad" answers. You do not have to answer if you do not want to. You may decline to answer any questions or stop the interview at any
time. It will take around 20-30 minutes to complete.
Do you agree to let me ask you these questions?
Basic data
35. Date of interview
36. Name of interviewer
Background data Skip Logic
37. Village name a) Kula 1 b) Kula 2 c) Bewo d) Fakaji West e) Fakaji East f) Bankuman g) Green village h) Gendrassa i) Batil j) Ofra k) Hai-neem l) Hai- sifista m) Mweniwinyi n) Dangaji
All
38. Sex of respondent Male Female All
39. What is your age? a) 15-25 b) 26-35 c) 36-45 d) 45 or older
All
40. Number of people living in your household including yourself?
a) 1-4 b) 5-8 c) 9-12 d) 13-16 e) 16 or more
All
41. Are you the head of the HH?
Yes No All
ACTED – Maban Host Community Food Security & Livelihoods Assessment
33
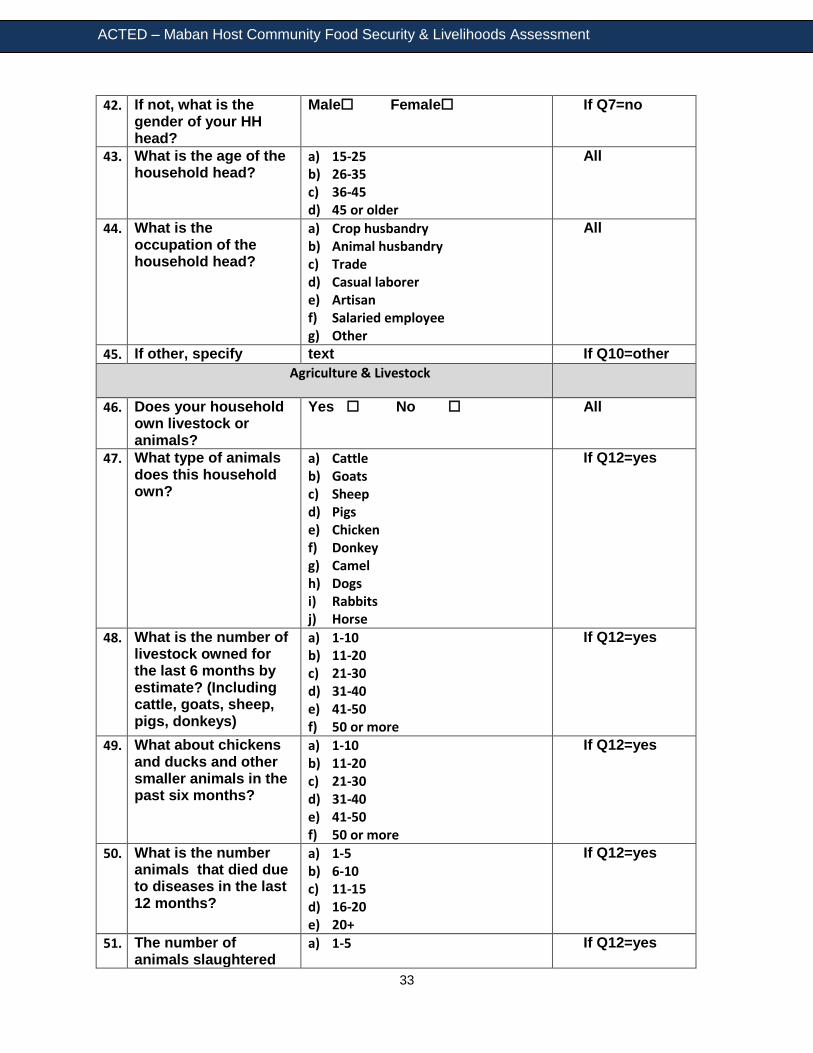
42. If not, what is the gender of your HH head?
Male Female If Q7=no
43. What is the age of the household head?
a) 15-25 b) 26-35 c) 36-45 d) 45 or older
All
44. What is the occupation of the household head?
a) Crop husbandry b) Animal husbandry c) Trade d) Casual laborer e) Artisan f) Salaried employee g) Other
All
45. If other, specify text If Q10=other
Agriculture & Livestock
46. Does your household own livestock or animals?
Yes No All
47. What type of animals does this household own?
a) Cattle b) Goats c) Sheep d) Pigs e) Chicken f) Donkey g) Camel h) Dogs i) Rabbits j) Horse
If Q12=yes
48. What is the number of livestock owned for the last 6 months by estimate? (Including cattle, goats, sheep, pigs, donkeys)
a) 1-10 b) 11-20 c) 21-30 d) 31-40 e) 41-50 f) 50 or more
If Q12=yes
49. What about chickens and ducks and other smaller animals in the past six months?
a) 1-10 b) 11-20 c) 21-30 d) 31-40 e) 41-50 f) 50 or more
If Q12=yes
50. What is the number animals that died due to diseases in the last 12 months?
a) 1-5 b) 6-10 c) 11-15 d) 16-20 e) 20+
If Q12=yes
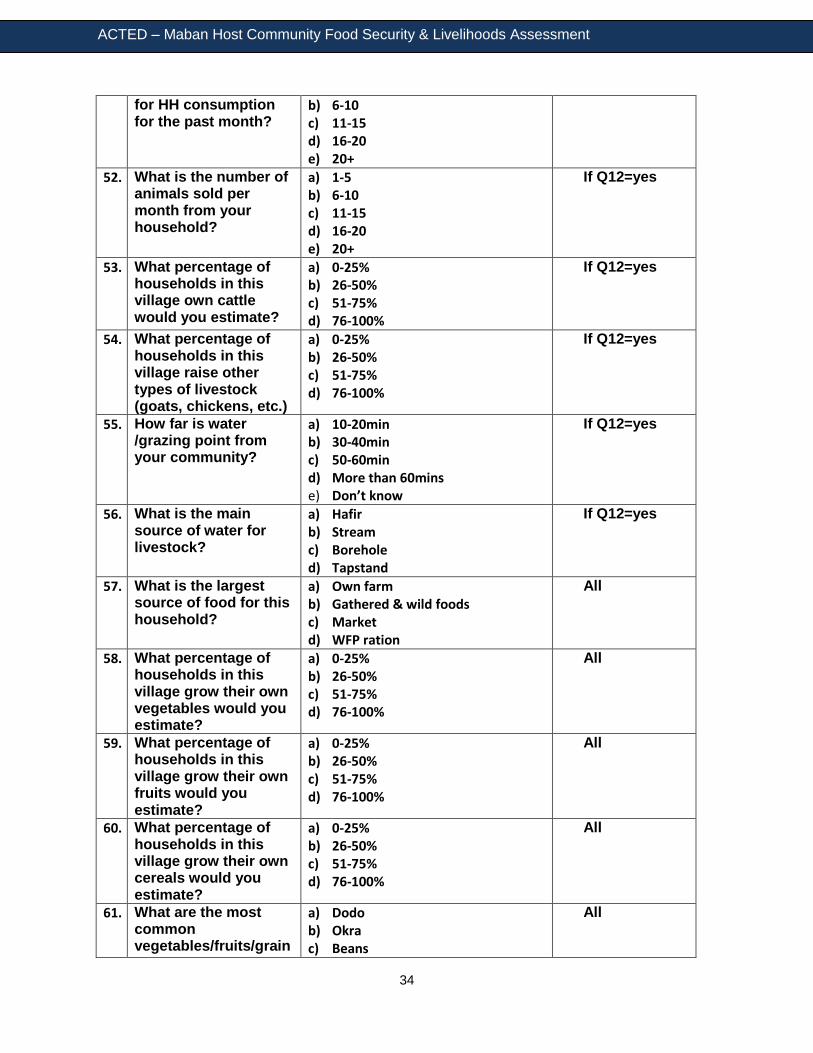
51. The number of animals slaughtered
a) 1-5 If Q12=yes
ACTED – Maban Host Community Food Security & Livelihoods Assessment
34
for HH consumption for the past month?
b) 6-10 c) 11-15 d) 16-20 e) 20+
52. What is the number of animals sold per month from your household?
a) 1-5 b) 6-10 c) 11-15 d) 16-20 e) 20+
If Q12=yes
53. What percentage of households in this village own cattle would you estimate?
a) 0-25% b) 26-50% c) 51-75% d) 76-100%
If Q12=yes
54. What percentage of households in this village raise other types of livestock (goats, chickens, etc.)
a) 0-25% b) 26-50% c) 51-75% d) 76-100%
If Q12=yes
55. How far is water /grazing point from your community?
a) 10-20min b) 30-40min c) 50-60min d) More than 60mins e) Don’t know
If Q12=yes
56. What is the main source of water for livestock?
a) Hafir b) Stream c) Borehole d) Tapstand
If Q12=yes
57. What is the largest source of food for this household?
a) Own farm b) Gathered & wild foods c) Market d) WFP ration
All
58. What percentage of households in this village grow their own vegetables would you estimate?
a) 0-25% b) 26-50% c) 51-75% d) 76-100%
All
59. What percentage of households in this village grow their own fruits would you estimate?
a) 0-25% b) 26-50% c) 51-75% d) 76-100%
All
60. What percentage of households in this village grow their own cereals would you estimate?
a) 0-25% b) 26-50% c) 51-75% d) 76-100%
All
61. What are the most common vegetables/fruits/grain
a) Dodo b) Okra c) Beans
All
ACTED – Maban Host Community Food Security & Livelihoods Assessment
35
s /legumes/oil crops grown in this village?
d) Sorghum e) Roots & Tubers f) Sukumawiki g) Cowpea h) Maize i) Kundura j) Egg plants k) Onions l) G. nuts m) Simsim
62. How many households who grow their own vegetables/fruits/cereals, would you say, sell them in the market?
a) Almost everyone b) Many households c) Some households d) Almost nobody
All
63. Does anyone who sells vegetables/fruits, add value to them in any way before selling? (i.e. dry them, make jams, prepare them in any way)
Yes No All
64. If yes, what do they do to add value?
a) Dry them b) Make jams or spreads c) Preserve them in jars/containers
for longer shelf life d) Spice/flavor them before selling
If Q29=yes
65. What month of the year do you sell a majority of your food produce?
a) January b) February c) March d) April e) May f) June g) July h) August i) September j) October k) November l) December m) I do not sell food produce
All
66. Is the closest large market easily accessible for you or your family members?
Yes No All
67. If not, what is the largest reason why?
a) Distance b) Bad road during rainy season c) Lack of transport
If Q32=no
ACTED – Maban Host Community Food Security & Livelihoods Assessment
36
68. What means of transport do you usually use to take your products and inputs to and from market
a) Donkey cart b) Bicycle c) Motorcycle d) Human labor e) Other vehicle types f) I do not take products to the
market
All
69. Where is the closest slaughter slab for livestock?
a) In this village b) In a nearby village c) In a village far away d) Too far to travel regularly
All
70. How often would you say people use it?
a) Once every day b) Once every other day c) Once every week d) Once every 2 weeks e) Once a month f) Almost never
All
71. Are the animals slaughtered on these slabs inspected before human consumption?
Yes No All
72. If yes, who inspects them?
a) Gov’t vet personnel b) CAHWs c) Other authority
If Q37=yes
73. How do you dispose of animal carcasses?
a) Burning b) Burying c) Throw away from household d) Other method
All
74. Besides agro-pastoral, what other livelihoods activities do you have in your village?
a) Trading of goods b) Vocational trades (metal work,
electro-mechanic, baking, etc.) c) Other services/business ventures
(beekeeping, soap making, other crafts & supply manufacturing)
d) None of the above
All
75. Does your village have a reliable source of water?
Yes No All
76. If yes, what type of water source is it?
a) Borehole b) Stream/river c) Tap stand d) Hafir
If Q41=yes
Service Assessment
77. How would you rate the economic status in this village compared to others villages in Maban?
a) Far above average b) Above Average c) Average d) Below Average e) Far below average
All
ACTED – Maban Host Community Food Security & Livelihoods Assessment
37
78. What NGOs are working in this village?
a) Medair b) MSF c) LWF d) ACTED e) DRC f) Relief International g) Other
All
79. If other, specify Text If Q44=other
80. What services do they provide to you or your village?
a) Health b) Education c) WASH d) Food Security & Livelihoods
(income generation, food security, vocational training, etc.)
All
81. Are there any animal health services offered in your village or the surrounding area?
Yes No All
82. If yes, what services do they provide?
a) Treatment of diseased animals and control of production limiting disorders
b) Provision of drugs, vaccines and other products (such as artificial insemination)
c) Avoiding the outbreak of diseases d) Human health protection
(inspection of marketed animal products)
e) Other services
If Q47=yes
83. How do you access drugs for your animals?
a) Veterinary pharmacy b) Open market c) MARF d) I cannot access drugs or do not
know how
All
84. Have your household animals been vaccinated/de-wormed?
Yes No All
85. If no, why? a) Lack of vaccines b) Lack of service providers c) Lack of money d) Other
If Q50=no
86. If other, specify Text If Q51=other
87. If yes, Which organization or group vaccinated your animals?
a) MARF b) VSF c) ICRC d) FAO
If Q50=yes
ACTED – Maban Host Community Food Security & Livelihoods Assessment
38
88. Did you pay for the vaccination/treatment of your animals
Yes No If Q50=yes
89. If yes, how much did you pay?
a) 50-100 SSP b) 150-200 SSP c) 250-300 SSP d) 400-500 SSP e) 500 or more SSP
If Q54=yes
90. Are there Baytaris(CAHWs) working in your community?
Yes No All
91. Are there other animal health services not provided that you feel would be extremely useful?
Yes No All
92. If yes, which ones? f) Treatment of diseased animals and control of production limiting disorders
g) Provision of drugs, vaccines and other products (such as artificial insemination)
h) Avoiding the outbreak of diseases i) Human health protection
(inspection of marketed animal products)
j) Other services
If Q57=yes
93. Do people in your village currently pay for any veterinary services?
Yes No All
94. What are some common reasons people do not want to pay for veterinary services?
a) Too expensive b) Don’t believe it will help
productivity c) Nothing useful is available d) Local medicine or herbs are
available instead e) Other
All
95. If other, specify text If Q60=other
96. If better veterinary services were available in the area, do you feel people would pay for them? (Improved services would be more access
Yes No All
ACTED – Maban Host Community Food Security & Livelihoods Assessment
39
to medicine, knowledgeable veterinary health care workers who can properly diagnosis and treat common illnesses)
97. If no, what are the main reasons why you feel people would still not pay?
a) Too expensive b) Not informed of benefits c) Understand benefits but feel there
are more important things to spend income on
d) Other
All
98. If other, specify text If Q63=other
Thank you