m&a and private equity overview: 2009/2010 trends …a and private equity overview: 2009/2010...
TRANSCRIPT
M&A and Private Equity Overview:2009/2010 Trends and 2010 Outlook
Presented by:
Jeff Moore, Managing Director
11 South 12th Street, Third Floor, Richmond, VA 23219www.matrixcapitalmarkets.com
2
Leading middle market investment bank focusing on closely held middle market companies thatare institutional, corporate and family & founder owned with EBITDA of over $3 million
Since 1988 Matrix professionals have exceeded the expectations of over 200 clients:– Approach is to focus the intellectual capital and resources of the firm on a limited number of
transactions– 79 transactions closed from 2004 – present
Results driven “Deal Teams” dedicated to creating maximum value for our clients– Hands-on, senior level attention– Historical close rate of 90%+
Our 16 deal professionals include seasoned investment bankers, who have many years offinancial and operating experience handling highly complex transactions
– Managing Directors have an average tenure of 15 years with the Firm and Vice Presidentshave over 10 years
– Experience, professionalism & confidentiality
Matrix maintains a proprietary database of over 2,100 middle market private equity groups andother capital providers, tracking investment preferences, portfolio companies, and fundmanagement
Matrix Private Equities, Inc. is a registered Broker/Dealer and member of FINRA and SIPC
Matrix Overview
3
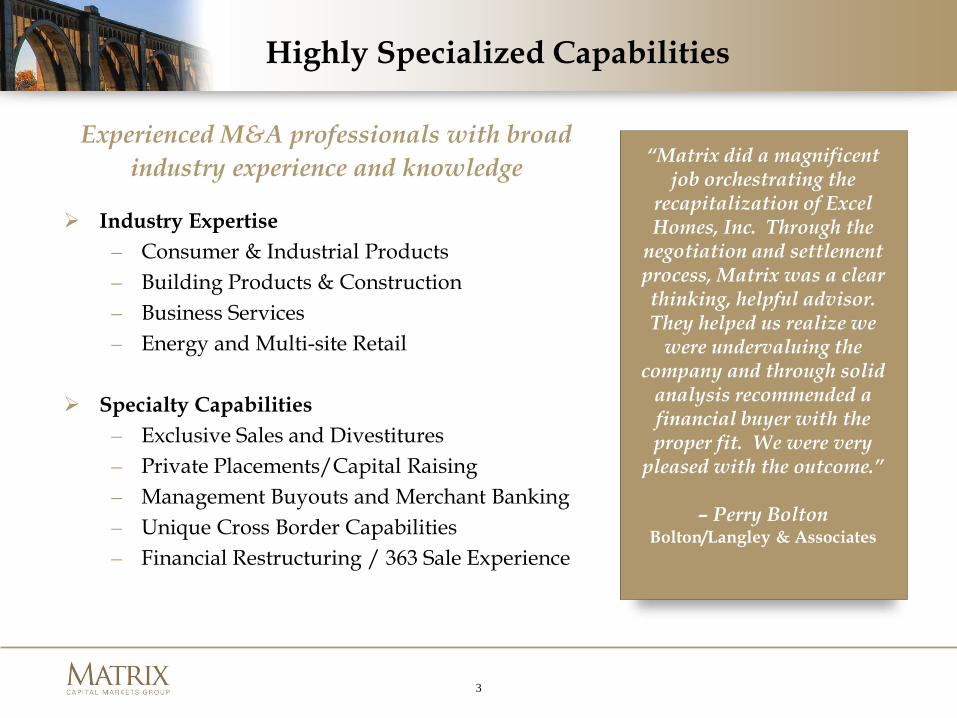
Industry Expertise– Consumer & Industrial Products– Building Products & Construction– Business Services– Energy and Multi-site Retail
Specialty Capabilities– Exclusive Sales and Divestitures– Private Placements/Capital Raising– Management Buyouts and Merchant Banking– Unique Cross Border Capabilities– Financial Restructuring / 363 Sale Experience
Experienced M&A professionals with broadindustry experience and knowledge “Matrix did a magnificent
job orchestrating the recapitalization of Excel Homes, Inc. Through the
negotiation and settlement process, Matrix was a clear thinking, helpful advisor. They helped us realize we
were undervaluing the company and through solid
analysis recommended a financial buyer with the proper fit. We were very
pleased with the outcome.”
– Perry BoltonBolton/Langley & Associates
Highly Specialized Capabilities
4
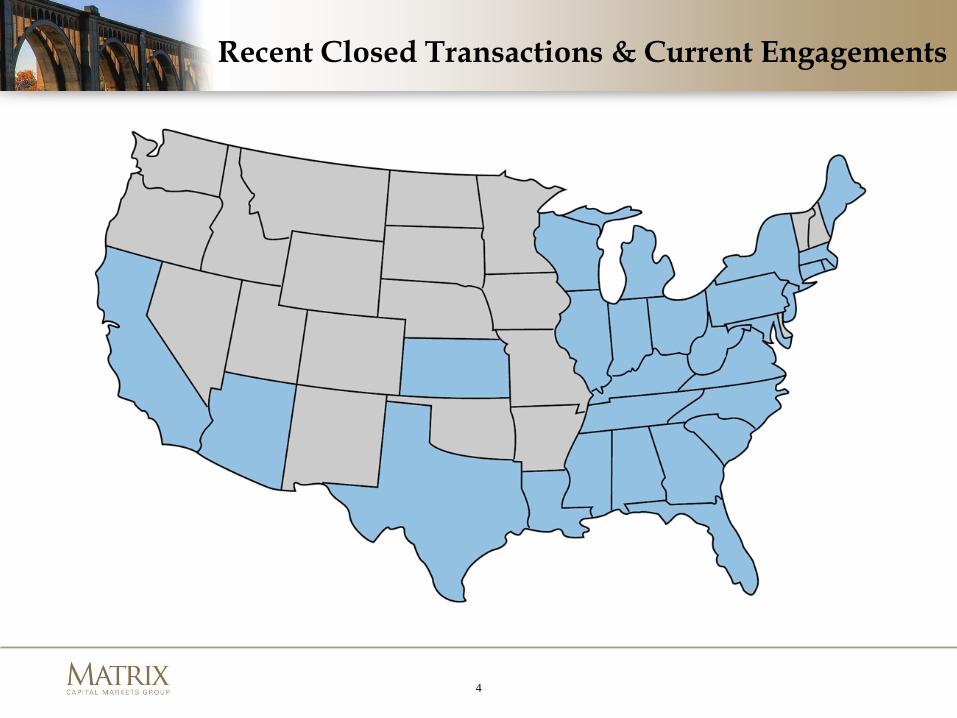
Recent Closed Transactions & Current Engagements
5
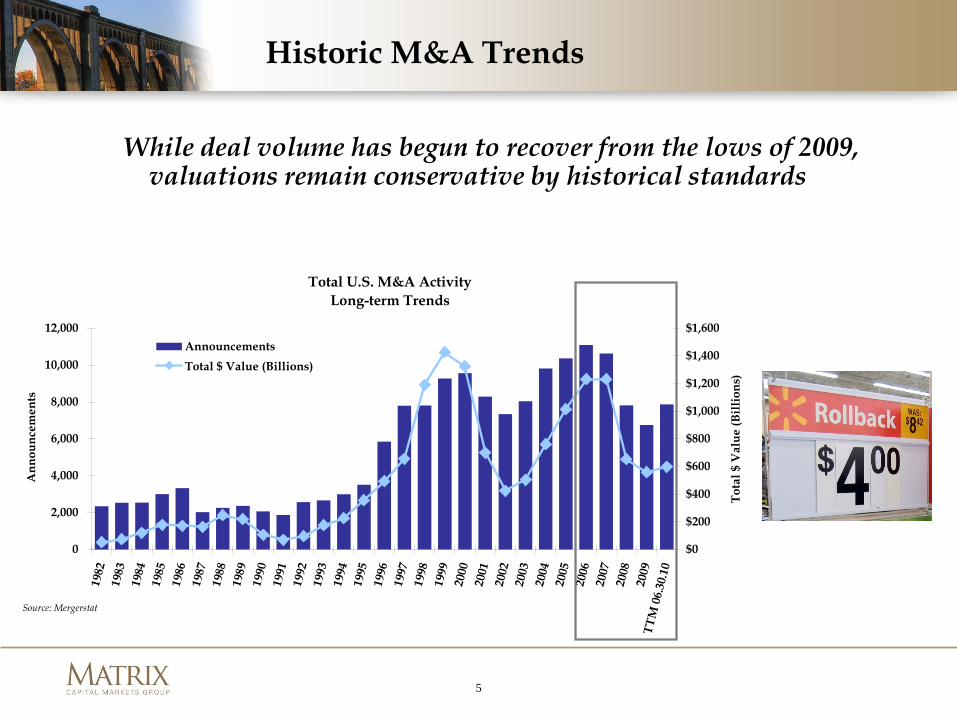
Total U.S. M&A ActivityLong-term Trends
0
2,000
4,000
6,000
8,000
10,000
12,000
1982
1983
1984
1985
1986
1987
1988
1989
1990
1991
1992
1993
1994
1995
1996
1997
1998
1999
2000
2001
2002
2003
2004
2005
2006
2007
2008
2009
TTM
06.
30.1
0
Ann
ounc
emen
ts
$0
$200
$400
$600
$800
$1,000
$1,200
$1,400
$1,600
Tota
l $ V
alue
(Bill
ions
)
AnnouncementsTotal $ Value (Billions)
Source: Mergerstat
Historic M&A Trends
While deal volume has begun to recover from the lows of 2009, valuations remain conservative by historical standards
6
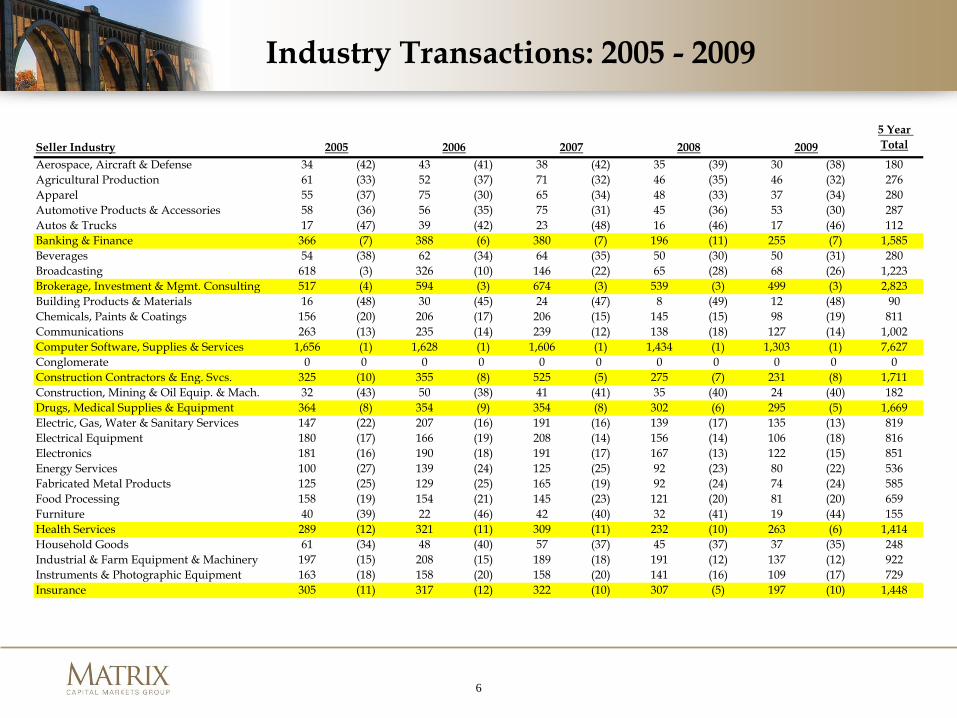
Industry Transactions: 2005 - 2009
Seller Industry 2005 2006 2007 2008 20095 Year Total
Aerospace, Aircraft & Defense 34 (42) 43 (41) 38 (42) 35 (39) 30 (38) 180Agricultural Production 61 (33) 52 (37) 71 (32) 46 (35) 46 (32) 276Apparel 55 (37) 75 (30) 65 (34) 48 (33) 37 (34) 280Automotive Products & Accessories 58 (36) 56 (35) 75 (31) 45 (36) 53 (30) 287Autos & Trucks 17 (47) 39 (42) 23 (48) 16 (46) 17 (46) 112Banking & Finance 366 (7) 388 (6) 380 (7) 196 (11) 255 (7) 1,585Beverages 54 (38) 62 (34) 64 (35) 50 (30) 50 (31) 280Broadcasting 618 (3) 326 (10) 146 (22) 65 (28) 68 (26) 1,223Brokerage, Investment & Mgmt. Consulting 517 (4) 594 (3) 674 (3) 539 (3) 499 (3) 2,823Building Products & Materials 16 (48) 30 (45) 24 (47) 8 (49) 12 (48) 90Chemicals, Paints & Coatings 156 (20) 206 (17) 206 (15) 145 (15) 98 (19) 811Communications 263 (13) 235 (14) 239 (12) 138 (18) 127 (14) 1,002Computer Software, Supplies & Services 1,656 (1) 1,628 (1) 1,606 (1) 1,434 (1) 1,303 (1) 7,627Conglomerate 0 0 0 0 0 0 0 0 0 0 0Construction Contractors & Eng. Svcs. 325 (10) 355 (8) 525 (5) 275 (7) 231 (8) 1,711Construction, Mining & Oil Equip. & Mach. 32 (43) 50 (38) 41 (41) 35 (40) 24 (40) 182Drugs, Medical Supplies & Equipment 364 (8) 354 (9) 354 (8) 302 (6) 295 (5) 1,669Electric, Gas, Water & Sanitary Services 147 (22) 207 (16) 191 (16) 139 (17) 135 (13) 819Electrical Equipment 180 (17) 166 (19) 208 (14) 156 (14) 106 (18) 816Electronics 181 (16) 190 (18) 191 (17) 167 (13) 122 (15) 851Energy Services 100 (27) 139 (24) 125 (25) 92 (23) 80 (22) 536Fabricated Metal Products 125 (25) 129 (25) 165 (19) 92 (24) 74 (24) 585Food Processing 158 (19) 154 (21) 145 (23) 121 (20) 81 (20) 659Furniture 40 (39) 22 (46) 42 (40) 32 (41) 19 (44) 155Health Services 289 (12) 321 (11) 309 (11) 232 (10) 263 (6) 1,414Household Goods 61 (34) 48 (40) 57 (37) 45 (37) 37 (35) 248Industrial & Farm Equipment & Machinery 197 (15) 208 (15) 189 (18) 191 (12) 137 (12) 922Instruments & Photographic Equipment 163 (18) 158 (20) 158 (20) 141 (16) 109 (17) 729Insurance 305 (11) 317 (12) 322 (10) 307 (5) 197 (10) 1,448
7
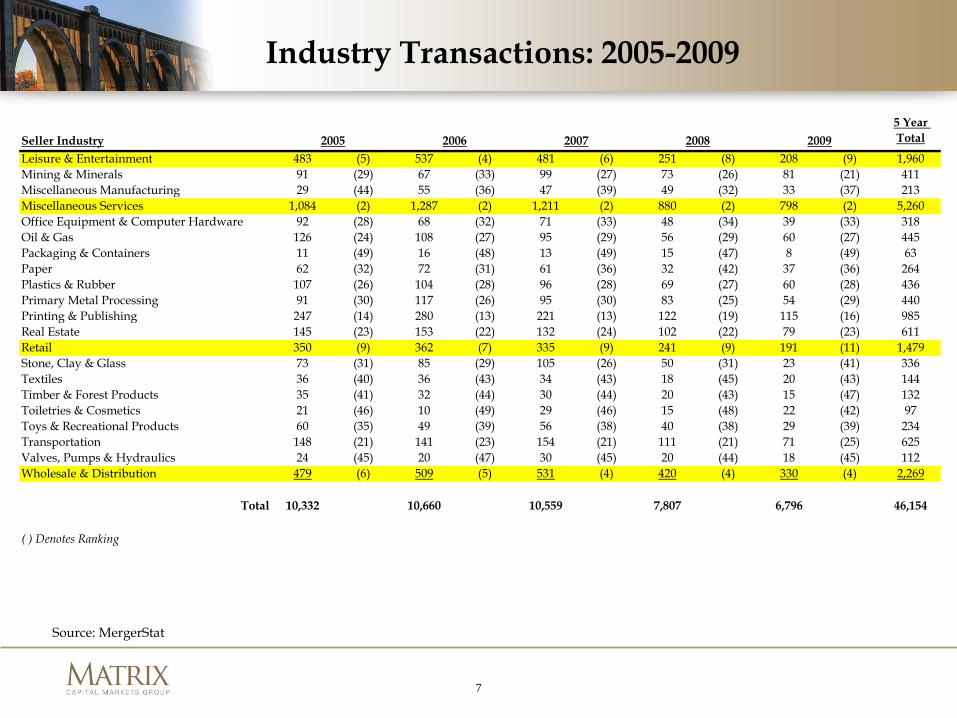
Industry Transactions: 2005-2009
Seller Industry 2005 2006 2007 2008 20095 Year Total
Leisure & Entertainment 483 (5) 537 (4) 481 (6) 251 (8) 208 (9) 1,960Mining & Minerals 91 (29) 67 (33) 99 (27) 73 (26) 81 (21) 411Miscellaneous Manufacturing 29 (44) 55 (36) 47 (39) 49 (32) 33 (37) 213Miscellaneous Services 1,084 (2) 1,287 (2) 1,211 (2) 880 (2) 798 (2) 5,260Office Equipment & Computer Hardware 92 (28) 68 (32) 71 (33) 48 (34) 39 (33) 318Oil & Gas 126 (24) 108 (27) 95 (29) 56 (29) 60 (27) 445Packaging & Containers 11 (49) 16 (48) 13 (49) 15 (47) 8 (49) 63Paper 62 (32) 72 (31) 61 (36) 32 (42) 37 (36) 264Plastics & Rubber 107 (26) 104 (28) 96 (28) 69 (27) 60 (28) 436Primary Metal Processing 91 (30) 117 (26) 95 (30) 83 (25) 54 (29) 440Printing & Publishing 247 (14) 280 (13) 221 (13) 122 (19) 115 (16) 985Real Estate 145 (23) 153 (22) 132 (24) 102 (22) 79 (23) 611Retail 350 (9) 362 (7) 335 (9) 241 (9) 191 (11) 1,479Stone, Clay & Glass 73 (31) 85 (29) 105 (26) 50 (31) 23 (41) 336Textiles 36 (40) 36 (43) 34 (43) 18 (45) 20 (43) 144Timber & Forest Products 35 (41) 32 (44) 30 (44) 20 (43) 15 (47) 132Toiletries & Cosmetics 21 (46) 10 (49) 29 (46) 15 (48) 22 (42) 97Toys & Recreational Products 60 (35) 49 (39) 56 (38) 40 (38) 29 (39) 234Transportation 148 (21) 141 (23) 154 (21) 111 (21) 71 (25) 625Valves, Pumps & Hydraulics 24 (45) 20 (47) 30 (45) 20 (44) 18 (45) 112Wholesale & Distribution 479 (6) 509 (5) 531 (4) 420 (4) 330 (4) 2,269
Total 10,332 10,660 10,559 7,807 6,796 46,154
( ) Denotes Ranking
Source: MergerStat
8
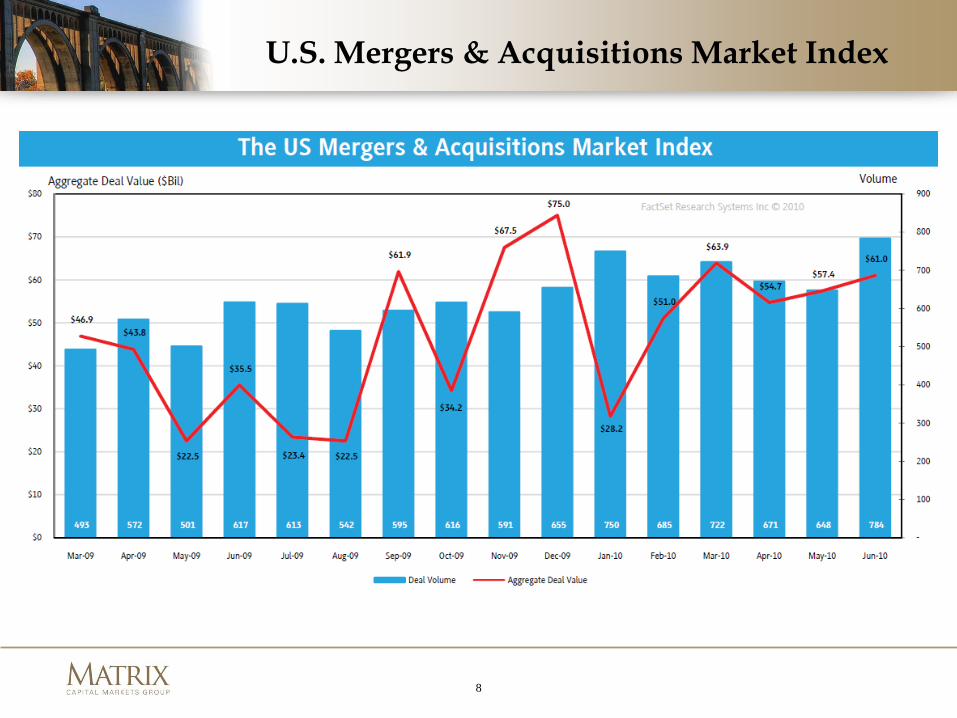
U.S. Mergers & Acquisitions Market Index
9
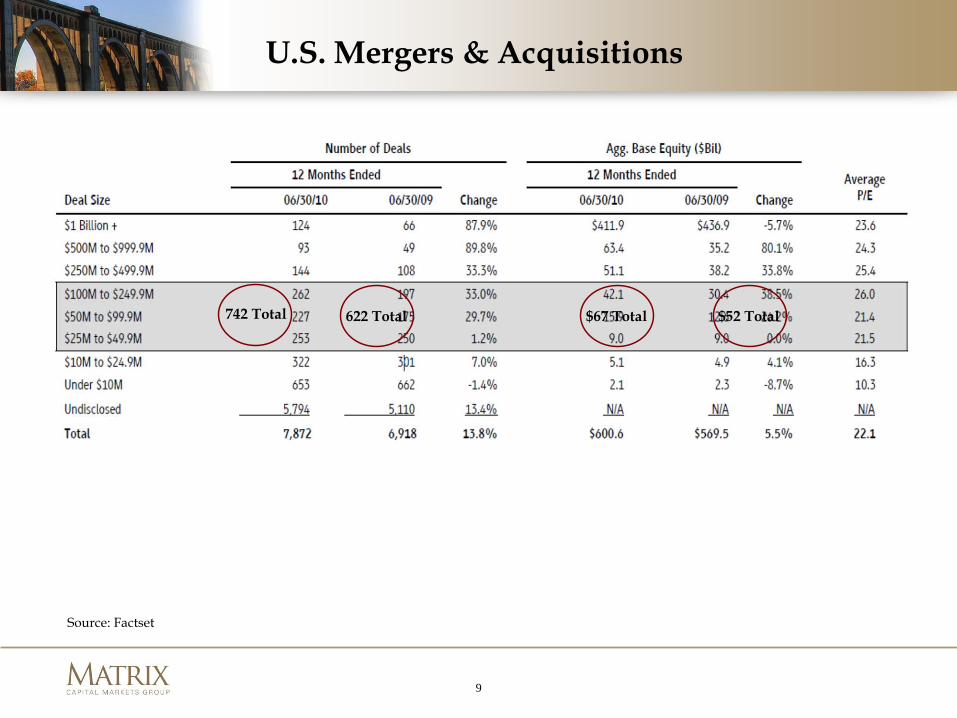
U.S. Mergers & Acquisitions
742 Total 622 Total $67 Total $52 Total
742 Total 622 Total $67 Total $52 Total
Source: Factset
10
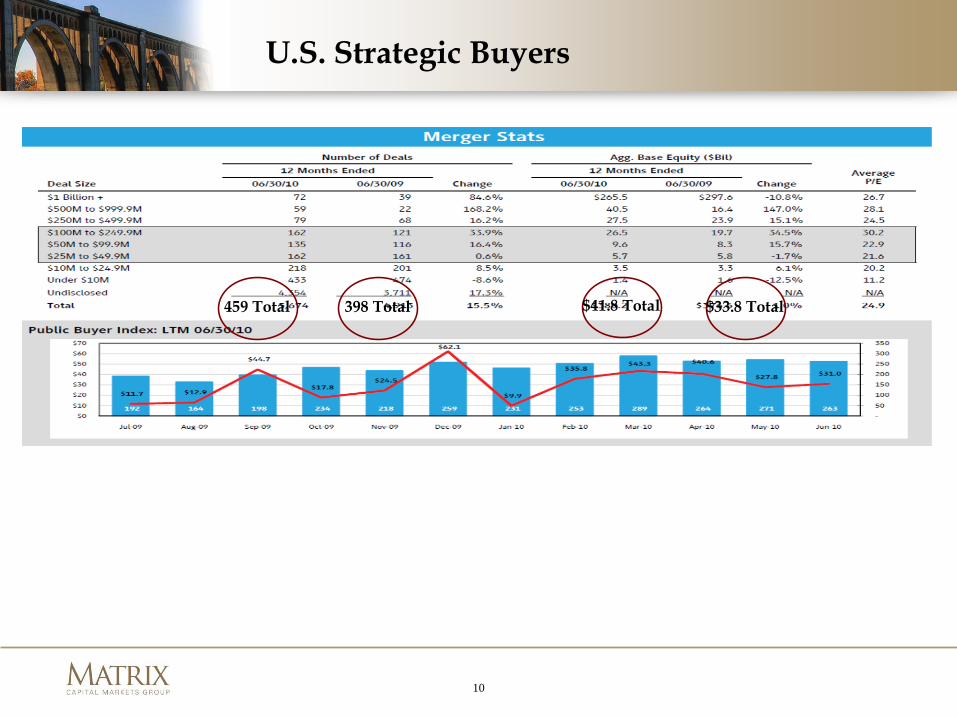
U.S. Strategic Buyers
459 Total 398 Total $41.8 Total $33.8 Total
11
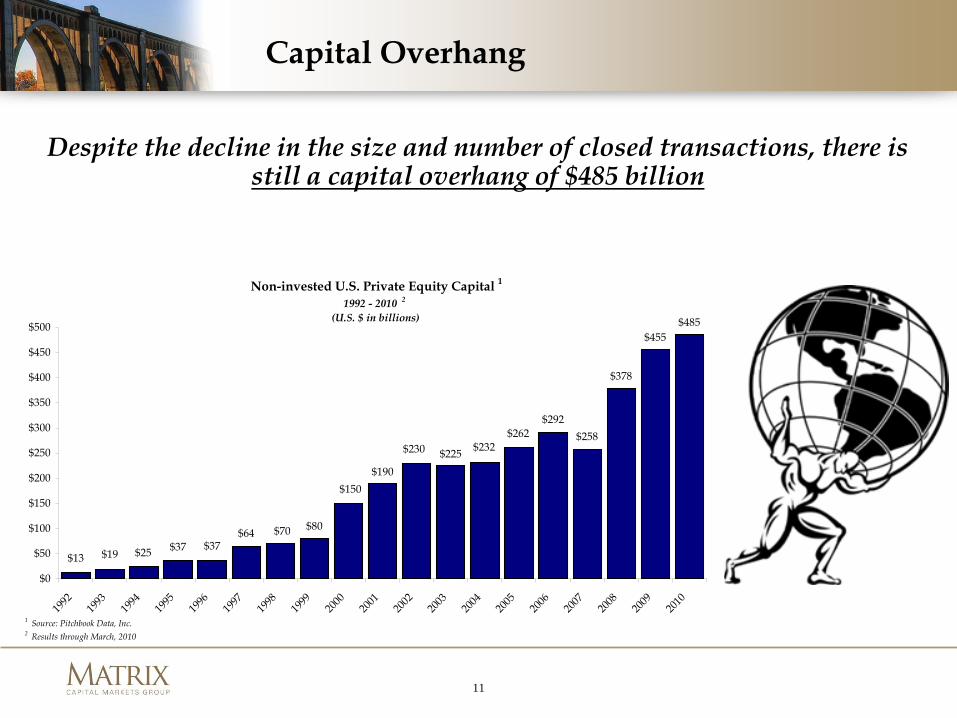
Capital Overhang
Despite the decline in the size and number of closed transactions, there is still a capital overhang of $485 billion
Non-invested U.S. Private Equity Capital 1
1992 - 2010 2
(U.S. $ in billions)
$378
$455$485
$258$292
$262$232$225$230
$190$150
$80$70$64
$25$19$13$37 $37
$0
$50
$100
$150
$200
$250
$300
$350
$400
$450
$500
1992
1993
1994
1995
1996
1997
1998
1999
2000
2001
2002
2003
2004
2005
2006
2007
2008
2009
2010
1 Source: Pitchbook Data, Inc.2 Results through March, 2010
12
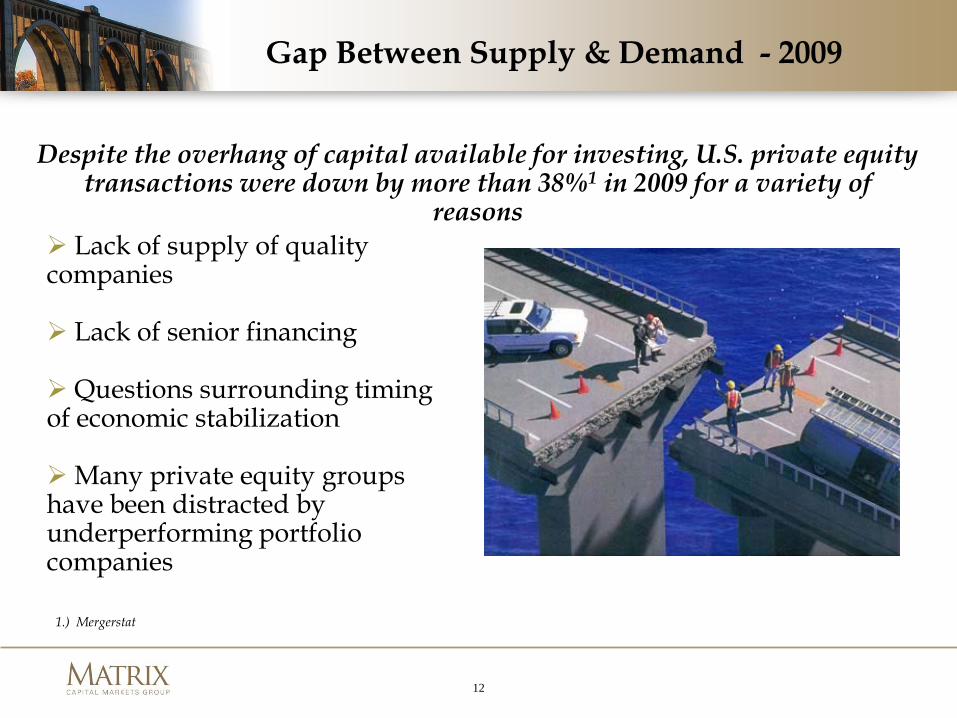
Gap Between Supply & Demand - 2009
Despite the overhang of capital available for investing, U.S. private equity transactions were down by more than 38%1 in 2009 for a variety of
reasons
1.) Mergerstat
Lack of supply of quality companies
Lack of senior financing
Questions surrounding timing of economic stabilization
Many private equity groups have been distracted by underperforming portfolio companies
13
Bridging the Gap - 2010
As a result of improving conditions in the capital markets, U.S. private equity transactions have increased by 9.7% on a trailing twelve month basis1
1) Mergerstat
Increasing supply of quality companies (but still not in line with demand)
Senior financing becoming more available
Questions still remain surrounding timing of economic stabilization
Diminished distraction of underperforming portfolio companies for private equity groups
Ask us about our award-winning Photoshop department!
14
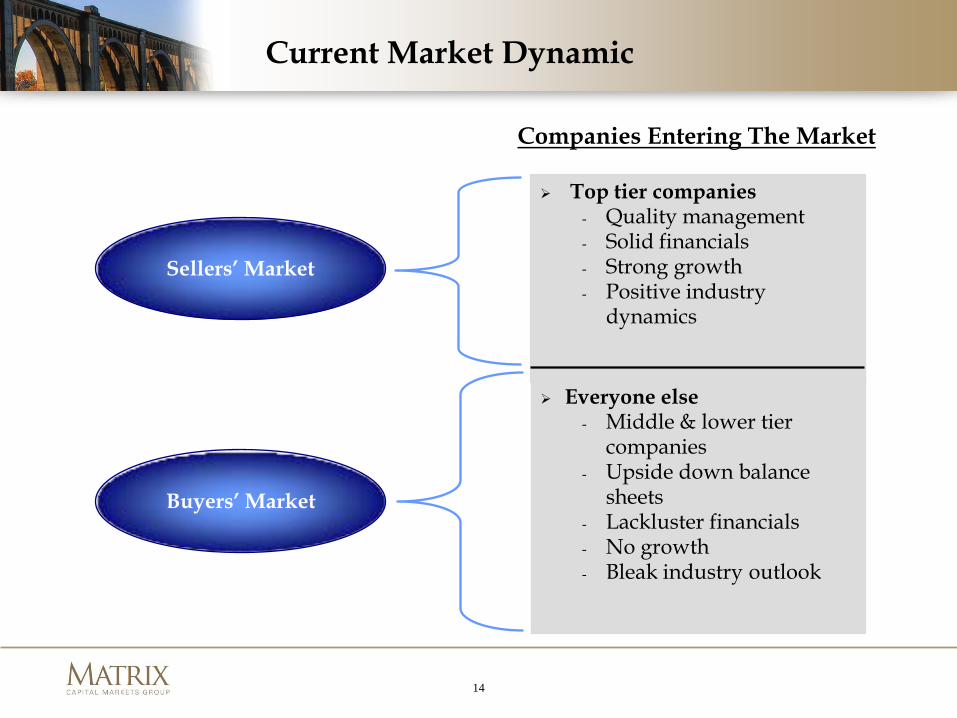
Top tier companies- Quality management- Solid financials- Strong growth- Positive industry
dynamics
Everyone else- Middle & lower tier
companies- Upside down balance
sheets- Lackluster financials- No growth- Bleak industry outlook
Current Market Dynamic
Sellers’ Market
Buyers’ Market
Companies Entering The Market

15
Recent Matrix Process
Matrix Process Offer Summary
3.50x
4.00x
4.50x
5.00x
5.50x
6.00x
6.50x
7.00x
7.50x
1 2 3 4 5 6 7 8 9 10 11 12 13 14 15 16 17 18 19 20 21 22 23 24 25 26 27 28 29 30 31 32 33 34 35 36 37 38
Private Equity Bidders
Mul
tiple
of E
BIT
DA
Round 1 IOI Round 2 IOI Round 2 LOI
16
Valuation Trends
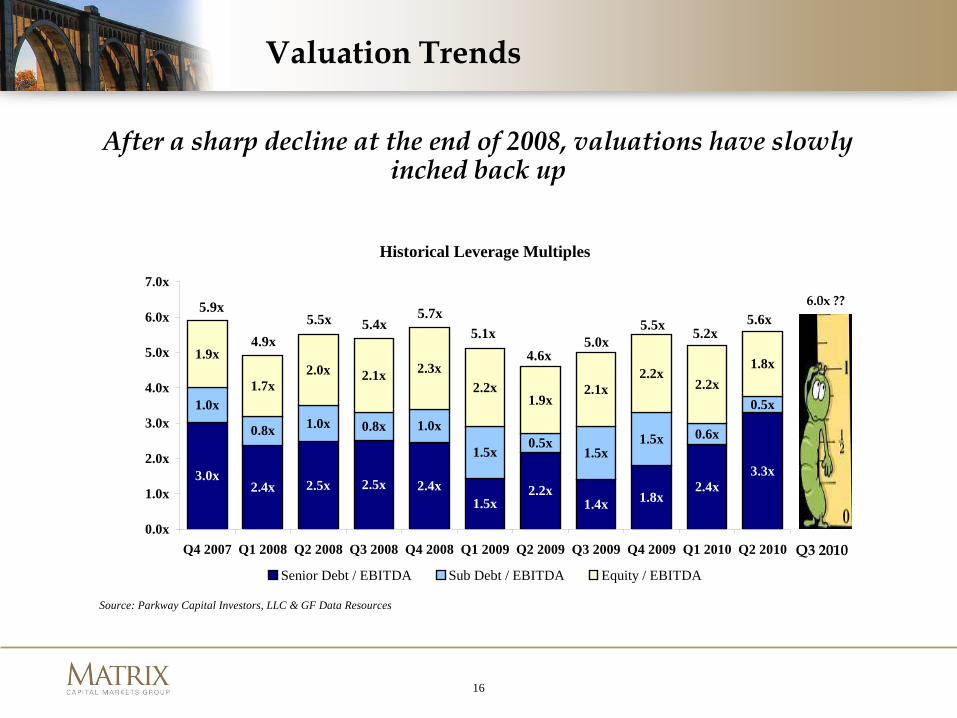
After a sharp decline at the end of 2008, valuations have slowly inched back up
Historical Leverage Multiples
3.0x2.4x 2.5x 2.5x 2.4x
1.5x2.2x
1.4x 1.8x2.4x
3.3x
1.0x
0.8x 1.0x 0.8x 1.0x
1.5x0.5x
1.5x1.5x 0.6x
0.5x
1.9x
1.7x2.0x 2.1x 2.3x
2.2x1.9x
2.1x2.2x
2.2x1.8x
0.0x
1.0x
2.0x
3.0x
4.0x
5.0x
6.0x
7.0x
Q4 2007 Q1 2008 Q2 2008 Q3 2008 Q4 2008 Q1 2009 Q2 2009 Q3 2009 Q4 2009 Q1 2010 Q2 2010
Senior Debt / EBITDA Sub Debt / EBITDA Equity / EBITDA
5.9x
4.9x5.5x 5.4x
5.7x5.1x 5.0x
4.6x
5.5x
Source: Parkway Capital Investors, LLC & GF Data Resources
5.2x5.6x
Q3 2010
6.0x ??
17
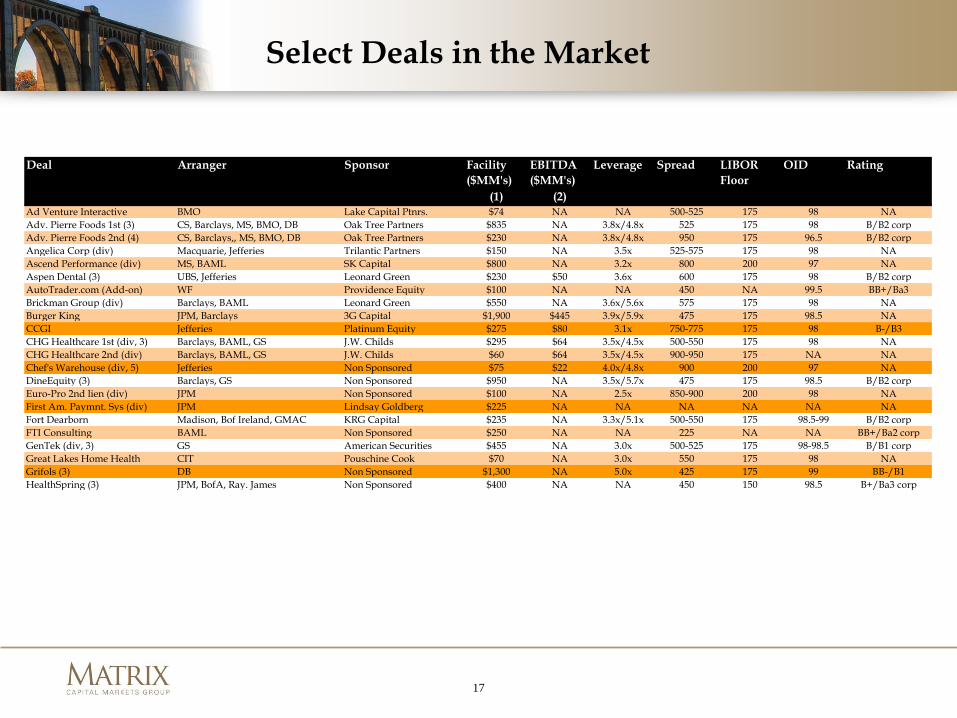
Deal Arranger Sponsor Facility ($MM's)
EBITDA ($MM's)
Leverage Spread OID
(1) (2)Ad Venture Interactive BMO Lake Capital Ptnrs. $74 NA NA 500-525 175 98 NAAdv. Pierre Foods 1st (3) CS, Barclays, MS, BMO, DB Oak Tree Partners $835 NA 3.8x/4.8x 525 175 98 B/B2 corpAdv. Pierre Foods 2nd (4) CS, Barclays,, MS, BMO, DB Oak Tree Partners $230 NA 3.8x/4.8x 950 175 96.5 B/B2 corpAngelica Corp (div) Macquarie, Jefferies Trilantic Partners $150 NA 3.5x 525-575 175 98 NAAscend Performance (div) MS, BAML SK Capital $800 NA 3.2x 800 200 97 NAAspen Dental (3) UBS, Jefferies Leonard Green $230 $50 3.6x 600 175 98 B/B2 corpAutoTrader.com (Add-on) WF Providence Equity $100 NA NA 450 NA 99.5 BB+/Ba3Brickman Group (div) Barclays, BAML Leonard Green $550 NA 3.6x/5.6x 575 175 98 NABurger King JPM, Barclays 3G Capital $1,900 $445 3.9x/5.9x 475 175 98.5 NACCGI Jefferies Platinum Equity $275 $80 3.1x 750-775 175 98 B-/B3CHG Healthcare 1st (div, 3) Barclays, BAML, GS J.W. Childs $295 $64 3.5x/4.5x 500-550 175 98 NACHG Healthcare 2nd (div) Barclays, BAML, GS J.W. Childs $60 $64 3.5x/4.5x 900-950 175 NA NAChef's Warehouse (div, 5) Jefferies Non Sponsored $75 $22 4.0x/4.8x 900 200 97 NADineEquity (3) Barclays, GS Non Sponsored $950 NA 3.5x/5.7x 475 175 98.5 B/B2 corpEuro-Pro 2nd lien (div) JPM Non Sponsored $100 NA 2.5x 850-900 200 98 NAFirst Am. Paymnt. Sys (div) JPM Lindsay Goldberg $225 NA NA NA NA NA NAFort Dearborn Madison, Bof Ireland, GMAC KRG Capital $235 NA 3.3x/5.1x 500-550 175 98.5-99 B/B2 corpFTI Consulting BAML Non Sponsored $250 NA NA 225 NA NA BB+/Ba2 corpGenTek (div, 3) GS American Securities $455 NA 3.0x 500-525 175 98-98.5 B/B1 corpGreat Lakes Home Health CIT Pouschine Cook $70 NA 3.0x 550 175 98 NAGrifols (3) DB Non Sponsored $1,300 NA 5.0x 425 175 99 BB-/B1HealthSpring (3) JPM, BofA, Ray. James Non Sponsored $400 NA NA 450 150 98.5 B+/Ba3 corp
LIBOR Floor
Rating
Select Deals in the Market
18
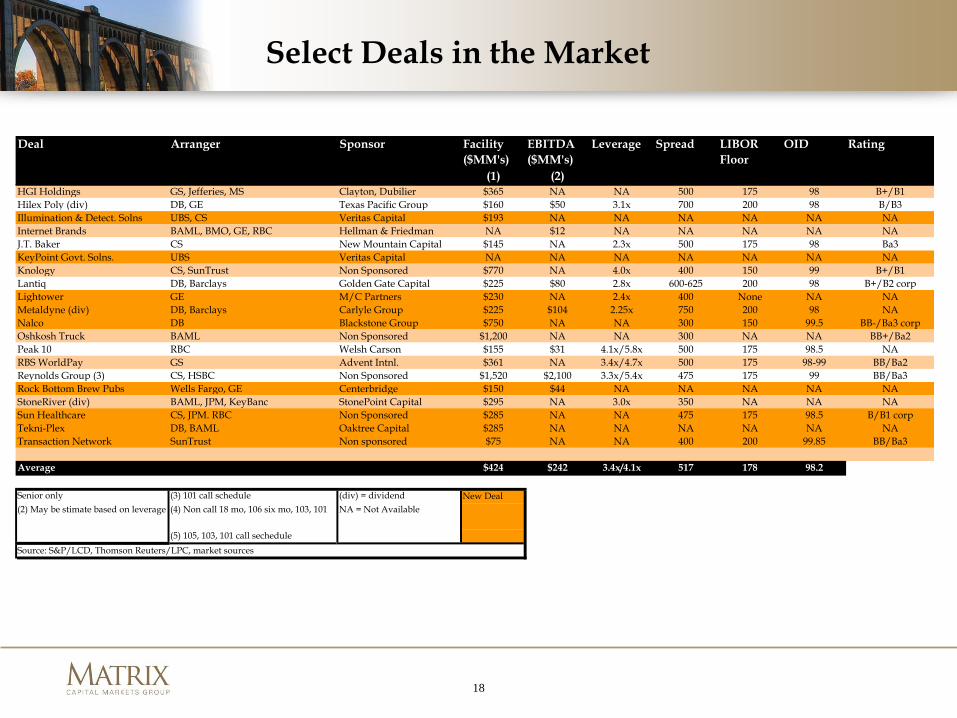
Deal Arranger Sponsor Facility ($MM's)
EBITDA ($MM's)
Leverage Spread OID
(1) (2)HGI Holdings GS, Jefferies, MS Clayton, Dubilier $365 NA NA 500 175 98 B+/B1Hilex Poly (div) DB, GE Texas Pacific Group $160 $50 3.1x 700 200 98 B/B3Illumination & Detect. Solns UBS, CS Veritas Capital $193 NA NA NA NA NA NAInternet Brands BAML, BMO, GE, RBC Hellman & Friedman NA $12 NA NA NA NA NAJ.T. Baker CS New Mountain Capital $145 NA 2.3x 500 175 98 Ba3KeyPoint Govt. Solns. UBS Veritas Capital NA NA NA NA NA NA NAKnology CS, SunTrust Non Sponsored $770 NA 4.0x 400 150 99 B+/B1Lantiq DB, Barclays Golden Gate Capital $225 $80 2.8x 600-625 200 98 B+/B2 corpLightower GE M/C Partners $230 NA 2.4x 400 None NA NAMetaldyne (div) DB, Barclays Carlyle Group $225 $104 2.25x 750 200 98 NANalco DB Blackstone Group $750 NA NA 300 150 99.5 BB-/Ba3 corpOshkosh Truck BAML Non Sponsored $1,200 NA NA 300 NA NA BB+/Ba2Peak 10 RBC Welsh Carson $155 $31 4.1x/5.8x 500 175 98.5 NARBS WorldPay GS Advent Intnl. $361 NA 3.4x/4.7x 500 175 98-99 BB/Ba2Reynolds Group (3) CS, HSBC Non Sponsored $1,520 $2,100 3.3x/5.4x 475 175 99 BB/Ba3Rock Bottom Brew Pubs Wells Fargo, GE Centerbridge $150 $44 NA NA NA NA NAStoneRiver (div) BAML, JPM, KeyBanc StonePoint Capital $295 NA 3.0x 350 NA NA NASun Healthcare CS, JPM. RBC Non Sponsored $285 NA NA 475 175 98.5 B/B1 corpTekni-Plex DB, BAML Oaktree Capital $285 NA NA NA NA NA NATransaction Network SunTrust Non sponsored $75 NA NA 400 200 99.85 BB/Ba3
Average $424 $242 3.4x/4.1x 517 178 98.2
Senior only (3) 101 call schedule (div) = dividend New Deal (2) May be stimate based on leverage (4) Non call 18 mo, 106 six mo, 103, 101 NA = Not Available
(5) 105, 103, 101 call sechedule
LIBOR Floor
Rating
Source: S&P/LCD, Thomson Reuters/LPC, market sources
Select Deals in the Market
19
Mezzanine Lenders
Mezzanine lenders filled the void created by the lack of senior lending of the past year and a half
This increased demand has allowed mezzanine providers to command higher pricing
Whereas just a few years ago substantial warrants were the exception rather than the rule, they have now become commonplace
Matrix has seen pricing on several deals in the last six months with relatively consistent targeted returns of high teens to low twenties
Current “cash” interest of 12-14%
PIK, or capitalized interest, of 2-4%
Warrants ranging from 2-15%
20
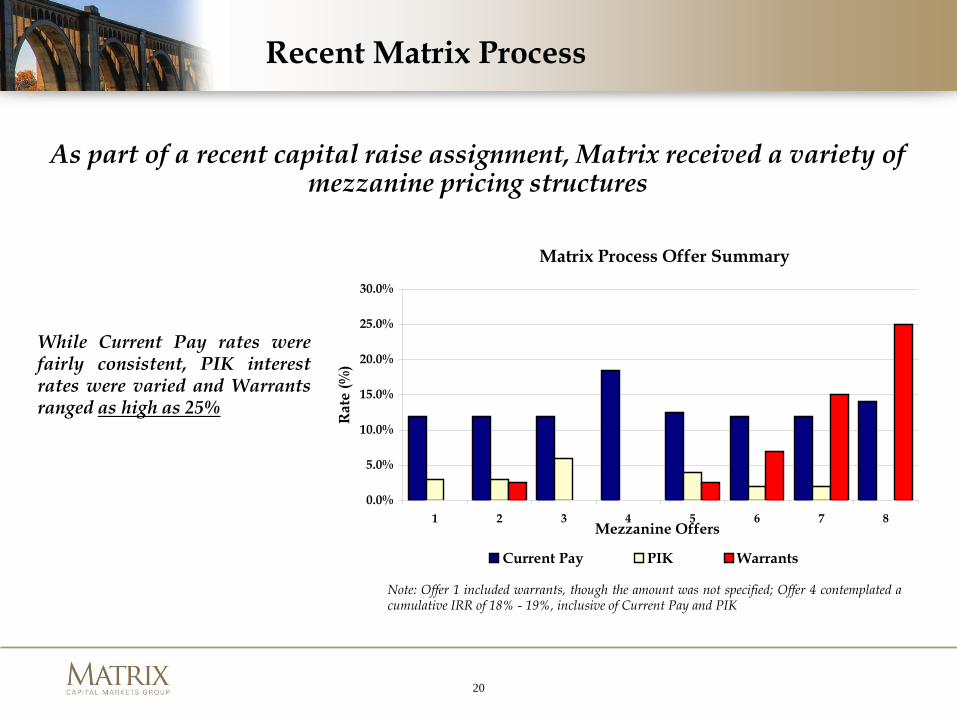
Recent Matrix Process
Note: Offer 1 included warrants, though the amount was not specified; Offer 4 contemplated acumulative IRR of 18% - 19%, inclusive of Current Pay and PIK
As part of a recent capital raise assignment, Matrix received a variety of mezzanine pricing structures
Matrix Process Offer Summary
0.0%
5.0%
10.0%
15.0%
20.0%
25.0%
30.0%
1 2 3 4 5 6 7 8Mezzanine Offers
Rat
e (%
)
Current Pay PIK Warrants
While Current Pay rates werefairly consistent, PIK interestrates were varied and Warrantsranged as high as 25%
21
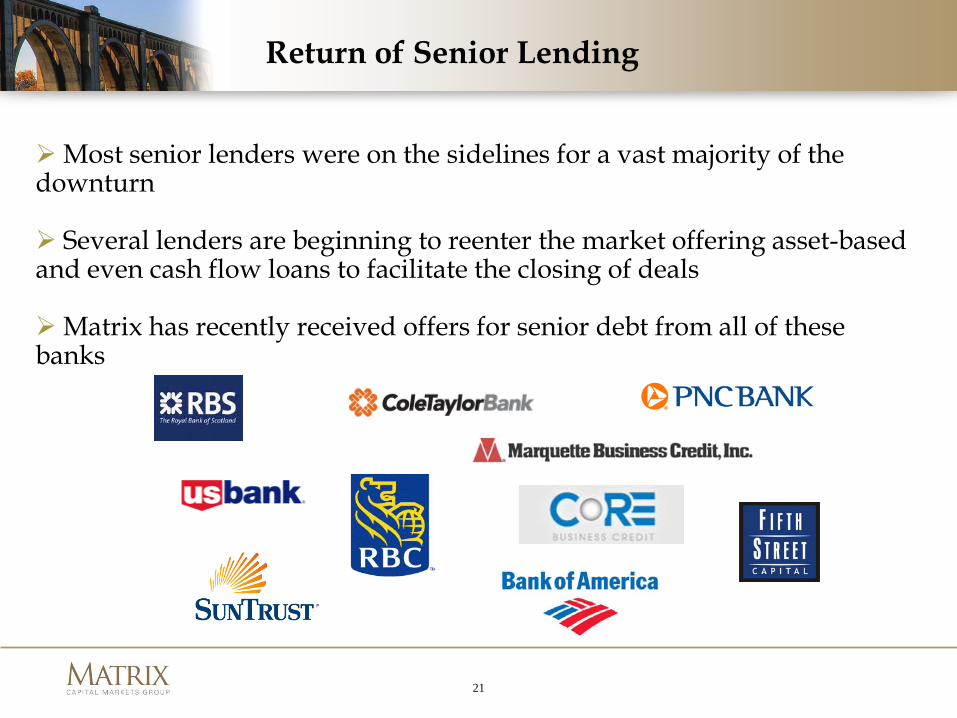
Return of Senior Lending
Most senior lenders were on the sidelines for a vast majority of the downturn
Several lenders are beginning to reenter the market offering asset-based and even cash flow loans to facilitate the closing of deals
Matrix has recently received offers for senior debt from all of these banks
22
2010 Update and 2011 Outlook
Anticipate an increase in private equity deals – both acquisitions and sales
- Driven by pent-up demand for both portfolio exits and new investments
Strategic buyers will probably re-enter the market as their balance sheets get back to normal
- After spending nearly 2 years on the sidelines, strategic buyers are flush with cash
Valuations are likely to begin to increase over the next 6 – 12 months- If capital gains increases are postponed to 2012, M&A activity in 2011
could be further bolstered by sellers trying to lock in a lower tax rate
Senior lending will continue to return as a viable way to finance transactions
23
Goldman Quotes
As of December 2009, the U.S. accounted for 24.9% of the world’s GDP ($14.3 trillion)
The U.S. GDP per capita is $46,000, highest amount major world powers and one of the highest overall (it is nearly 13x the GDP per capita of China and 46x India’s)
The U.S. spends significantly more than any other country on R&D and spent 4.4x as much as large emerging market countries (Brazil, Russia, India and China)
In the last 10 years, 46% of Nobel Laureates have been U.S.-based
The U.S. is the only developed country that the UN forecasts to have a growing population over the next 20+ years
Initial jobless claims have fallen roughly 30% since their high in April 2009 and remained steady over the last few months; the last two “jobless” recoveries were only at 10% - 20% declines at this point in their recoveries
Although Q2 saw a slight increase, residential investment fell more than 57% from its peak in Q4 2005 through Q1 2010 (compared to a typical 20% decline in previous recessions)
Combined free cash flow of consumers and public companies over the first three quarters of 2009 was 7.5% of GDP (last seen at these levels in 1982)
For 2011 Goldman is predicting core inflation of 1.0%, GDP growth of 1.9% and unemployment of 10.0%

Highlighted 2010 Case Studies
25
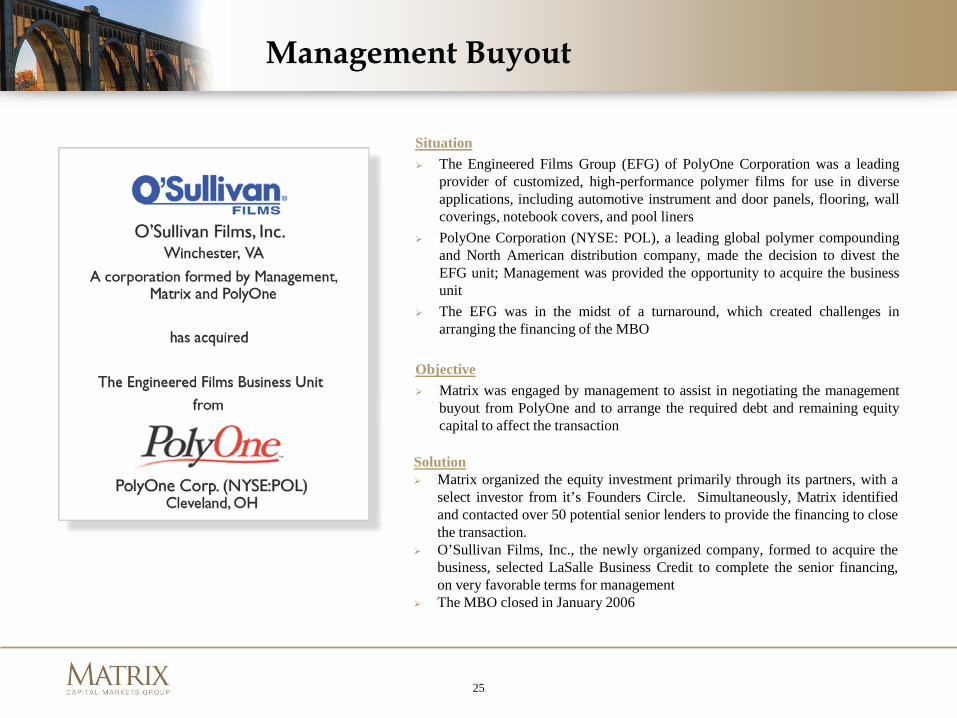
Situation The Engineered Films Group (EFG) of PolyOne Corporation was a leading
provider of customized, high-performance polymer films for use in diverseapplications, including automotive instrument and door panels, flooring, wallcoverings, notebook covers, and pool liners
PolyOne Corporation (NYSE: POL), a leading global polymer compoundingand North American distribution company, made the decision to divest theEFG unit; Management was provided the opportunity to acquire the businessunit
The EFG was in the midst of a turnaround, which created challenges inarranging the financing of the MBO
Objective Matrix was engaged by management to assist in negotiating the management
buyout from PolyOne and to arrange the required debt and remaining equitycapital to affect the transaction
Solution Matrix organized the equity investment primarily through its partners, with a
select investor from it’s Founders Circle. Simultaneously, Matrix identifiedand contacted over 50 potential senior lenders to provide the financing to closethe transaction.
O’Sullivan Films, Inc., the newly organized company, formed to acquire thebusiness, selected LaSalle Business Credit to complete the senior financing,on very favorable terms for management
The MBO closed in January 2006
Management Buyout
26
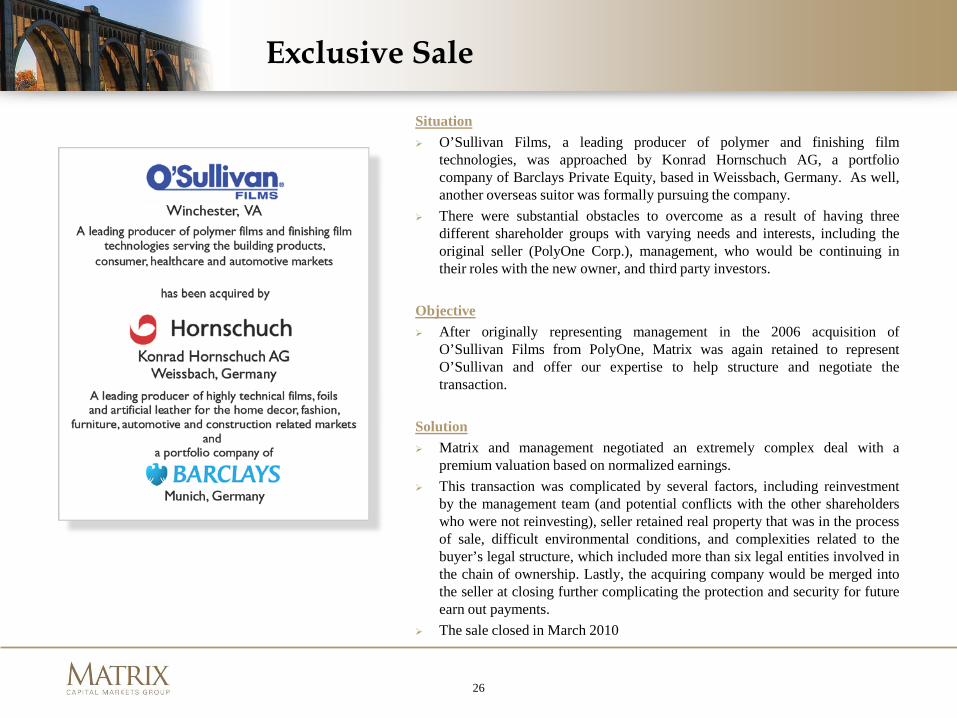
Situation O’Sullivan Films, a leading producer of polymer and finishing film
technologies, was approached by Konrad Hornschuch AG, a portfoliocompany of Barclays Private Equity, based in Weissbach, Germany. As well,another overseas suitor was formally pursuing the company.
There were substantial obstacles to overcome as a result of having threedifferent shareholder groups with varying needs and interests, including theoriginal seller (PolyOne Corp.), management, who would be continuing intheir roles with the new owner, and third party investors.
Objective After originally representing management in the 2006 acquisition of
O’Sullivan Films from PolyOne, Matrix was again retained to representO’Sullivan and offer our expertise to help structure and negotiate thetransaction.
Solution Matrix and management negotiated an extremely complex deal with a
premium valuation based on normalized earnings. This transaction was complicated by several factors, including reinvestment
by the management team (and potential conflicts with the other shareholderswho were not reinvesting), seller retained real property that was in the processof sale, difficult environmental conditions, and complexities related to thebuyer’s legal structure, which included more than six legal entities involved inthe chain of ownership. Lastly, the acquiring company would be merged intothe seller at closing further complicating the protection and security for futureearn out payments.
The sale closed in March 2010
Exclusive Sale
27
Situation Advantor is a leading global designer, manufacturer and integrator of
physical security systems with extensive experience securing high profilegovernment, Department of Defense and commercial organizations. Theirprimary business provides security solutions to identify and managethreats to critical infrastructures. Avantor has over 1,000 systemsdeployed worldwide.
Objective Matrix was retained on an exclusive basis to assist Advantor in
identifying a strong financial partner to provide a minority investment tosupport the retirement of existing subordinated debt, a dividend to theexisting shareholders and to provide growth capital for the Company.
Solution Matrix conducted a targeted sale process with a select group of private
equity funds that could expeditiously consummate a recapitalizationtransaction at maximum value.
Ultimately, a transaction was structured with McCarthy Capital, a $500million private equity fund based in Omaha, NE with offices in Denverand Boston. This provided a flexible capital structure to supportcontinued growth.
Recapitalization/Growth Capital