lunar heat flow: regional prospective of the apollo landing sites
TRANSCRIPT
Lunar heat flow: Regional prospective of the Apollo landing sites
M. A. Siegler1 and S. E. Smrekar1
Received 6 June 2013; revised 25 November 2013; accepted 26 November 2013; published 13 January 2014.
[1] We reexamine the Apollo Heat Flow Experiment in light of new orbital data. Usingthree-dimensional thermal conduction models, we examine effects of crustal thickness,density, and radiogenic abundance on measured heat flow values at the Apollo 15 and 17sites. These models show the importance of regional context on heat flux measurements. Wefind that measured heat flux can be greatly altered by deep subsurface radiogenic contentand crustal density. However, total crustal thickness and the presence of a near-surfaceradiogenic-rich ejecta provide less leverage, representing only minor (<1.5 mW m�2)perturbations on surface heat flux. Using models of the crust implied by Gravity Recoveryand Interior Laboratory results, we found that a roughly 9–13 mWm�2 mantle heat flux bestapproximate the observed heat flux. This equates to a total mantle heat production of2.8–4.1 × 10¹¹ W. These heat flow values could imply that the lunar interior is slightly lessradiogenic than the Earth’s mantle, perhaps implying that a considerable fraction of terrestrialmantle material was incorporated at the time of formation. These results may also imply thatheat flux at the crust-mantle boundary beneath the Procellarum potassium, rare earth element,and phosphorus (KREEP) Terrane (PKT) is anomalously elevated compared to the rest of theMoon. These results also suggest that a limited KREEP-rich layer exists beneath the PKTcrust. If a subcrustal KREEP-rich layer extends below the Apollo 17 landing site, requiredmantle heat flux can drop to roughly 7 mW m�2, underlining the need for future heat fluxmeasurements outside of the radiogenic-rich PKT region.
Citation: Siegler, M. A., and S. E. Smrekar (2014), Lunar heat flow: Regional prospective of the Apollo landing sites,J. Geophys. Res. Planets, 119, 47–63, doi:10.1002/2013JE004453.
1. Introduction
[2] Surface heat flow is a fundamental measurement for de-termining a body’s interior composition, structure, and evolu-tion. The partitioning of heat-producing elements such as U,Th, and K can provide tracers of original composition, mixingefficiency in early planetary formation, and distribution of pastmelt regions (which tend to concentrate incompatible ele-ments). Heat flow from the lunar interior is of fundamentalinterest as it can reveal details about the bulk composition ofthese elements as compared to the Earth, can provide evidenceof the validity of Earth-Moon forming impact models, andconstrain the origin of the material that now composes thedeep lunar interior. Heat flow can also reveal informationabout the density, radiogenic composition, and structure ofthe lunar crust, providing a window into the processes control-ling lunar differentiation. On the Moon, the distribution ofradiogenics, crustal thickness, and structure are known tobe heterogeneous, especially in a large province known asthe Procellarum KREEP Terrane (KREEP is a concentrated
basaltic material rich in chemically incompatible potassium,“K,” rare earth elements, and phosphorus) [Hubbard et al.,1971]. Regional crustal structure and composition are espe-cially important in this area, which includes both Apollo heatflow measurements. Here we explore how new measurements(topography, gravity, temperature, and radiogenic distribu-tion) can be combined with three-dimensional heat conductionmodels to aid in deconvolving the nature of lunar heat flow.[3] The Moon is currently the only body other than the
Earth for which we have a measured value of internal heat flux(upper limits have been obtained for Io [Matson et al., 2001]and Enceladus [e.g., Spencer et al., 2013]). These values,measured as part of the Apollo Heat Flow Experiment(HFE), differ from each other, with the Apollo 15 measuredheat flux of 21± 3mWm�2 and the Apollo 17 values of15± 2mW m�2 [Langseth et al., 1976]. For comparison, theEarth has means of 65.3mWm�2 and 100mWm�2 for thecontinental and oceanic crust [Jaupart and Mareschal,2007]. Since the thermal evolution of the Moon has been rela-tively simple compared to that of the Earth (e.g., due to thelack of plate tectonics), these values should relate directly tothe bulk radiogenic concentrations of the Moon. However,the interpretation of what these values mean for the composi-tion of the lunar interior and suggested reasons for their differ-ences has varied greatly.[4] Both Apollo Heat Flow Experiment sites lay at the
boundary of several of the Moon’s most prominent crustal fea-tures, straddling highlands and mare as well as observed crustal
1Jet Propulsion Laboratory, California Institute of Technology, Pasadena,California, USA.
Corresponding author: M. A. Siegler, Jet Propulsion Laboratory, CaliforniaInstitute of Technology, 4800 Oak Grove Dr., Pasadena, CA 91109, USA.([email protected])
©2013. American Geophysical Union. All Rights Reserved.2169-9097/14/10.1002/2013JE004453
47
JOURNAL OF GEOPHYSICAL RESEARCH: PLANETS, VOL. 119, 47–63, doi:10.1002/2013JE004453, 2014
radiogenic boundaries. The Apollo 15 HFE site (26.13°N,3.63°E; roughly 800 km from the center of Imbrium) liesat the intersection of Mares Imbrium and Serenitatis and ahighly radiogenic highlands mountain chain known as theApennines. Due to this regional context, it potentially repre-sents one of the most challenging places on the Moon forconstraining mantle heat flux. The Apollo 17 HFE site(20.19°N, 30.76°E; roughly 1600 km from the center ofImbrium) lay within the Taurus-Littrow Valley. The surfacehas less radiogenic enrichment than that of Apollo 15, butthe valley topography and thin mare fill are likely to causesome degree of geometric heat focusing. Both sites lay withina large surface Thorium anomaly that characterizes theProcellarum KREEP Terrane (PKT), which has led to the sug-gestion that neither represent the global heat flow of theMoon.There is an additional complication of a suggested subcrustalKREEP-rich layer below the crust, which has been proposedto underlie the Apollo 15 and possibly Apollo 17 site[Wieczorek and Phillips, 2000].[5] A flurry of new data is available to aid in reanalysis of
the Apollo Heat Flow Experiment data. Recent crustal thick-ness models from the Gravity Recovery and InteriorLaboratory (GRAIL) and Selene missions have revolution-ized our ability to model thickness, crustal density, andcrustal structure. Recent reanalysis of Apollo seismic data[Lognonné et al., 2003] and gravity measurements[Ishihara et al., 2009; Wieczorek et al., 2013] has nearlyhalved past estimates of crustal thickness. As we shall see,each of these aspects can have large effects on observedsurface heat flow. Our knowledge of topography, especiallyimportant on the regional-scale heat flow, has seen hugeadvances from stereo photoclinometry and laser altimetrydata from the Lunar Reconnaissance Orbiter (LRO) andother missions.[6] Crustal radiogenic composition has been mapped by
several gamma ray instruments [e.g., Lawrence et al., 1998]which will be used to identify the extent of the PKT [Jolliffet al., 2000] and serve as a boundary to extrapolate KREEPconcentration into the deeper crust. The KREEP (orurKREEP) layer is assumed to have formed from the lastremaining melt of the global magma ocean which concen-trated incompatible elements. If this layer exists, then either itformed into a large melt lens (centered near the ProcellarumKREEP Terrane, PKT) [Wieczorek and Phillips, 2000] orremained global and has simply had surface expression in afew areas [Jilly et al., 2011]. While this area contains most ofthe measured Th increase and about 60% of all lunar volcanism[Wieczorek and Phillips, 2000], areas of surface radiogenicenhancement (and generally associated mare volcanism) existoutside this region, complicating simple interpretation.[7] Several authors have proposed that the measured Apollo
HFE values either under represent or overrepresent the globalaverage heat flux by up to a factor of 3 due to the thermal path-ways and heat-producing material of the top ~100 km of theMoon [Langseth et al., 1976; Warren and Rasmussen, 1987;Wieczorek and Phillips, 2000; Hagermann and Tanaka,2006; Saito et al., 2007; Saito et al., 2008]. Equally variableare the reported causes for the differences between global andHFE-measured heat flux. Without a detailed model includinga comprehensive examination of near-surface (top ~100 km)effects on measured heat flux, it is difficult to extrapolate thesevalues to constrain the bulk composition of the Moon.
[8] Here we combine the proposed causes for the (gener-ally assumed) elevated heat flux at the Apollo 15 and 17landing sites into a complete, three-dimensional thermal con-duction model. This will allow us to weigh the net impact ofcompeting crustal effects on global surface heat flow. Wewill discuss implications these models would have on theglobal thermal evolution of the Moon and attempt to showwhat would be desirable in selecting future measurementlocation to differentiate between possible variables, such asradiogenic distribution and crustal thickness.
2. Prior Lunar Heat Flow Models
[9] Langseth et al. [1976] found that crustal thickness var-iations should dominate regional differences in lunar heatflow. They modeled the Apollo 15 and 17 heat flow valuesto be lower than the lunar average. They noted that bothApollo heat flow sites lay near the edge of an area of elevatedthorium, up to as much as 7 ppm, based on Apollo 15 orbitalGamma Ray Spectrometer data [Metzger et al., 1974]. Theyassumed this to be concentrated in a near-surficial, radio-genic-rich layer, giving it a small but measurable heat flux(which primarily affected the Apollo 15 measurement).However, these authors expected the small average crustalradiogenic content, estimated at 1 ppm Th, to dominate heatflow. Using a Th/U ratio of 3.7 and a K/U ratio of 3200, thisresults in about 15.5 × 10�2mWm�2 total heat productionper kilometer of crust. Therefore, as Apollo seismic datashowed the crust beneath the Apollo sites to be thin as com-pared to the lunar farside (though their estimated 56–74 kmnearside crustal thickness is nearly twice that estimated bymodern studies for the PKT region), they found the globalaverage heat flux (which they estimated as 18mWm�2)should exceed their measured value at the Apollo 17 landingsite. They additionally examined the effects of local topogra-phy, thermal focusing by local density contrasts, and near-surface temperature variations but found them to be minorcomponents in the total observed heat flux.[10] Conel and Morton [1975] proposed that crustal den-
sity variations would cause the greatest differences betweenthe Apollo sites. In their model, heat fluxes were enhancedby the large-scale contrast in thermal conductivity at thehighland/mare boundaries, where both HFE sites lay. Byconstructing a two-dimensional model of simple cylindricalmare imbedded in low-density crust (similar to that insection A2), they showed heat would preferentially flow intothe high conductivity zone, biasing the heat flux near the con-ductivity boundary. They were responding to an initial HFEclaim of 28–30mWm�2 [Langseth et al., 1973] that wasbased on flawed regolith thermal conductivity which waslater found to be due to compaction that was not accountedfor [Langseth et al., 1976; Grott and Breuer, 2010], so manyof their derived values are not comparable to other estimates.The idea, however, was sound, showing that near-surface(1–10 km depth) regolith/bedrock interfaces could cause en-hancements inside the denser mare. In area with thin regolith,like the mare, this could cause enhancements of heat fluxes ofup to an order of magnitude along the boundary with areas ofthicker regolith. Rasmussen and Warren [1985] and Warrenand Rasmussen [1987] revised this idea with updated modelsof regolith structure combined with assumption radiogenicenhancements at both Apollo sites (about 3.3 times the global
SIEGLER AND SMREKAR: REGIONAL LUNAR HEAT FLOW
48
mean at Apollo 15 and 1.2 times at Apollo 17) were not sim-ply near surface (as was assumed in Langseth et al. [1976]).Using their revised thermal conductivity models, they foundboth sites should have an expected upward heat flux bias andthe global mean to be around 12mWm�2, dropping the esti-mated Uranium content of the bulkMoon to 14–21 ppb, moreconsistent with terrestrial mantle material.[11] Warren and Rasmussen [1987] also included an en-
hancement of crustal heat flux at the Apollo sites in the formof extra radiogenic material throughout a 70 km thick crust.They noted, however, that the origin of the measured surfaceenhancement of radiogenics, a concentrated basaltic materialknown as KREEP was likely to have been delivered from adeeper source either by impact [Ryder and Wood, 1977;Haskin, 1998; Hagermann and Tanaka, 2006] or volcanicorigin [Spudis, 1978; Ryder, 1994]. However, the location,depth, and concentration of this presumed KREEP reservoirvaries dramatically, from local origin in the ApennineBench [Spudis, 1978] to a global layer at the base of the crust[Warren and Wasson, 1979].[12] Hagermann and Tanaka [2006] surveyed explanations
of the Apollo heat flow measurements with near-surface radio-genic enhancement. In their model they explore the hypothesisthat a KREEP-rich ejecta blanket, which has been partially ex-posed in the PKT region, could explain the difference betweentheApollo sites [Haskin, 1998]. Theymodeled an ejecta blanketaround the center of the Imbrium impact (37.5°N, 19°W)[Wieczorek and Zuber, 2001] with local thickness as modeledby Haskin [1998], resulting in 5.5–22 km for Apollo 15 and0.7–2.5 km for Apollo 17. They assume the radiogenic compo-nent of this blanket to be determined by the Lunar ProspectorGamma Ray Spectrometer (LP-GRS) data (with 5.237 and2.74 ppm Th, respectively, at Apollo 15 and 17). As more cen-tral ejecta originate from greater depths, this distribution wasattributed to a deep Th-rich layer having been excavated bythe impact [Warren, 2001]. These ejecta would thereforedecrease in radiogenic concentration with distance from theimpact point. Spudis [1978] and Ryder [1994] suggest im-pact-induced volcanism could account for the surface KREEPenhancement, which should result in a similar shallow crustalemplacement of heat-producing elements; however, the ther-mal consequences of this distribution have not been explored.[13] Alternatively, Wieczorek and Phillips [2000] pro-
posed the Apollo heat flux values were due to the deep,Imbrium ejecta source region. They assumed all the radio-genic enhancement of the PKT to be subsurface. Theymodeled the effect of a localized (10 km thick, 40° radiusspherical cap about the center of the PKT) subsurfaceKREEP layer at the base of a 60 km thick crust. They foundan area of this extent could retain heat within the coolingmantle long enough to keep a melt body that could cause rel-atively recent (< 900Ma) mare volcanism and a measuredseismic discontinuity at 500 km depth. More central to ourpaper, they also found such KREEP spherical cap (called“KREEP disk” here for shorthand) could explain the dropin heat flow between the Apollo 15 and 17 landing sites. Aswe discuss later, their ability to model the Apollo measure-ments depends both on crustal thickness and the extent of thisKREEP cap. Though this model provides predicable resultsfor measurements in given localities, it does not includenear-surface radiogenic enhancement or effects of variationsin crustal thickness and density.
[14] In summary, the measured values at Apollo HFE sitesare generally, though not universally, assumed higher thanthe global lunar average. Additionally, the Apollo 15 site,which is located closer to the center of the Thorium-richPKT, is found to have a higher heat flux than that of Apollo17. The magnitude of this variation has been proposed toresult from the following: (1) crustal thickness variations[Langseth et al., 1976], (2) focusing of heat flow at thermalconductivity boundaries [Conel and Morton, 1975; Rasmussenand Warren, 1985], (3) shallow enhancements of KREEP-likeradiogenics [Hagermann and Tanaka, 2006], or (4) deepconcentrations of KREEP-like radiogenic enhancement[Wieczorek and Phillips, 2000]. Each of these authors hasshown their assumed cause could dominate the resultingmeasured heat flow, substantially impacting the resultingextrapolation to unmeasured locations.
3. Model Approach
[15] We examine each of these possible effects in a three-di-mensional configuration, using actual lunar topography. Weexplore the effects of plausible values of crustal thickness,density, thermal properties, and radiogenic concentration. Inthis section, we will describe a nominal model that serves asa basis for comparison for exploration of these parameters.We choose to study a region 1500× 2700 km region surround-ing the two Apollo HFE sites and containing the largegeographic features (namely, Mare Imbrium and MareSerenitatis) that are most likely to impact measured heatfluxes. We extend the model to 150 km depth, which shouldbe deep enough to allow for lateral conduction within the up-per mantle, but shallow enough that no melting would occur.We generally refer to the heat flux at 150 km depth as the“mantle heat flux,” as the mantle layer between 150 km andthe base of the crust only accounts for about 0.5mWm�2
(with our assumption of 4.709× 10�9Wm�3 mantle heat pro-duction) which is small compared to the error of the ApolloHFE measurements. To examine the full three-dimensionalheat conduction effects of each variable, we combine currentlyavailable data using the commercially available COMSOLMultiphysics package. This software was chosen as it allowsus to create an accurate representation of irregular surfaceand crust/mantle topographic boundaries and compute theeffects of lateral heat flow with unprecedented detail.[16] The topography of the Moon is now well known. Here
we begin with a 16 pixel/degree resolution grid of the LunarOrbiting Laser Altimeter (LOLA) data set to act as a surfaceboundary. Figure 1 shows the topography used in our studyregion. Grid elements are vertically thin near the topographicsurface boundary to a resolution of 1 km to accommodatemodel dramatic changes in density near the surface as willbe discussed in section 4.2. Layers below this boundary layerincrease in vertical thickness by a factor of 1.2 for the first 10layers (1.0 km, 1.2 km, 1.44 km, 1.72 km, etc.). Grid resolu-tion is scaled based on geometry and thermal properties (thinlayers require smaller elements) and an internal check thatCOMSOL can come to a unique steady state solution, creatinghigh-resolution layers near thermal property boundaries.Distant from boundaries, elements are allowed to grow larger,up to about 35 km per side, though most crustal elements areless than 10 km per side. Horizontal resolution varies betweenroughly 5 km in vertically thin regions (like the mare) and
SIEGLER AND SMREKAR: REGIONAL LUNAR HEAT FLOW
49
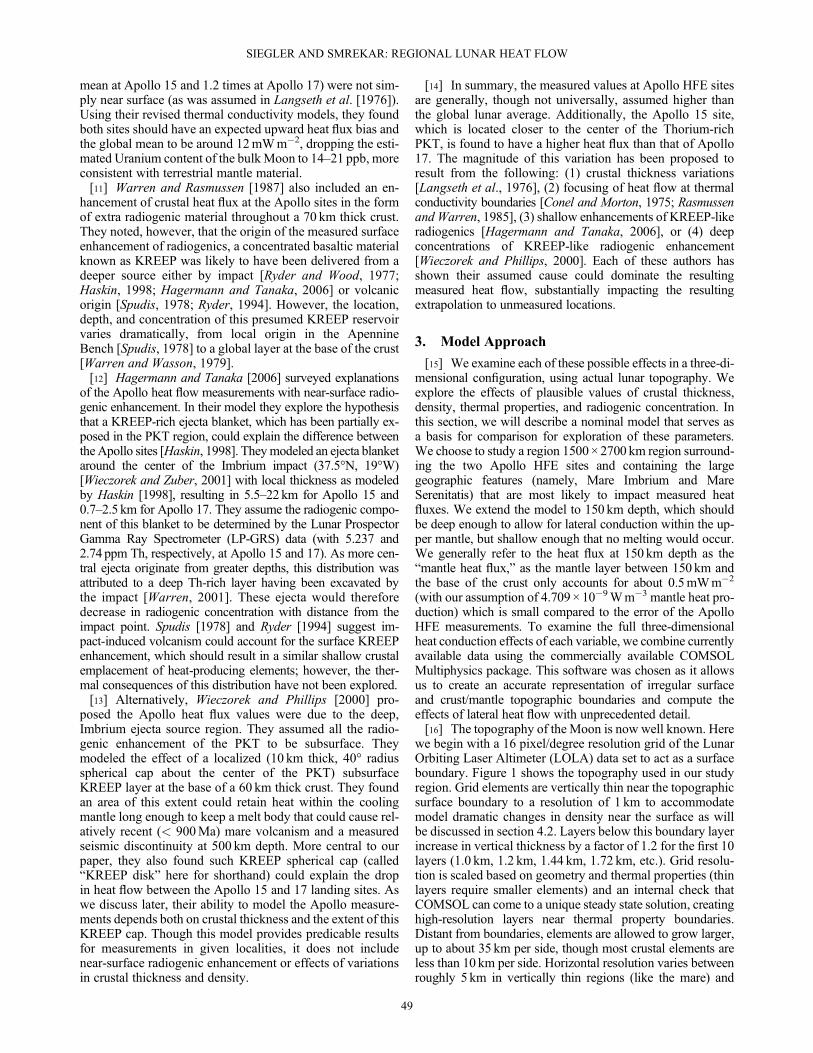
again nearly 35 km in regions far from any boundary. Modelshave been verified against standard analytic solutions usingsimplified geometries (planar surface and crust/mantle bound-aries and 2-D models in Appendix A). Figure 2 shows the tet-rahedral finite element grid used for study calculations with840,086 elements (the surface boundary layer and maregridding are too thin to be seen here).[17] Surface temperature is also well known. The Diviner
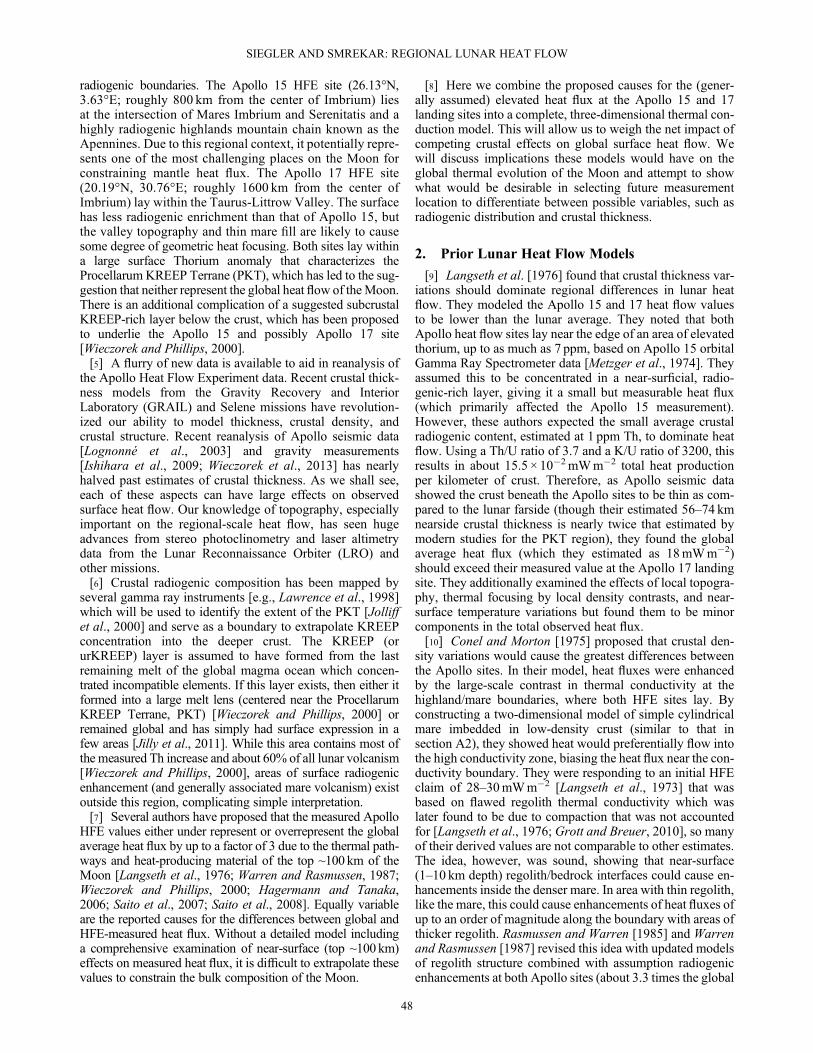
Lunar Radiometer Paige et al. [2010a], also aboard LRO hasnow mapped global surface temperatures to roughly 100mresolution. These data have been used to constrain global ther-mal properties models (at the scale of available topography),which allow for a calculation of temperatures below the lunarsurface [Paige et al., 2010b]. All models presented here as-sume a steady state, meaning we must use temperatures thatdo not change with time. By a depth of roughly 2m, diurnaltemperature cycles will have damped to a constant tempera-ture. Though this model temperature is itself dependent onan assumed heat flux (15mWm�2 in this model), the modeltemperature at 2m depth will serves as a reasonable, time-invariant surface temperature boundary condition, which fallsin temperature with increasing latitude (as seen in Figure 3).[18] Recent crustal thickness, based on data from the recent
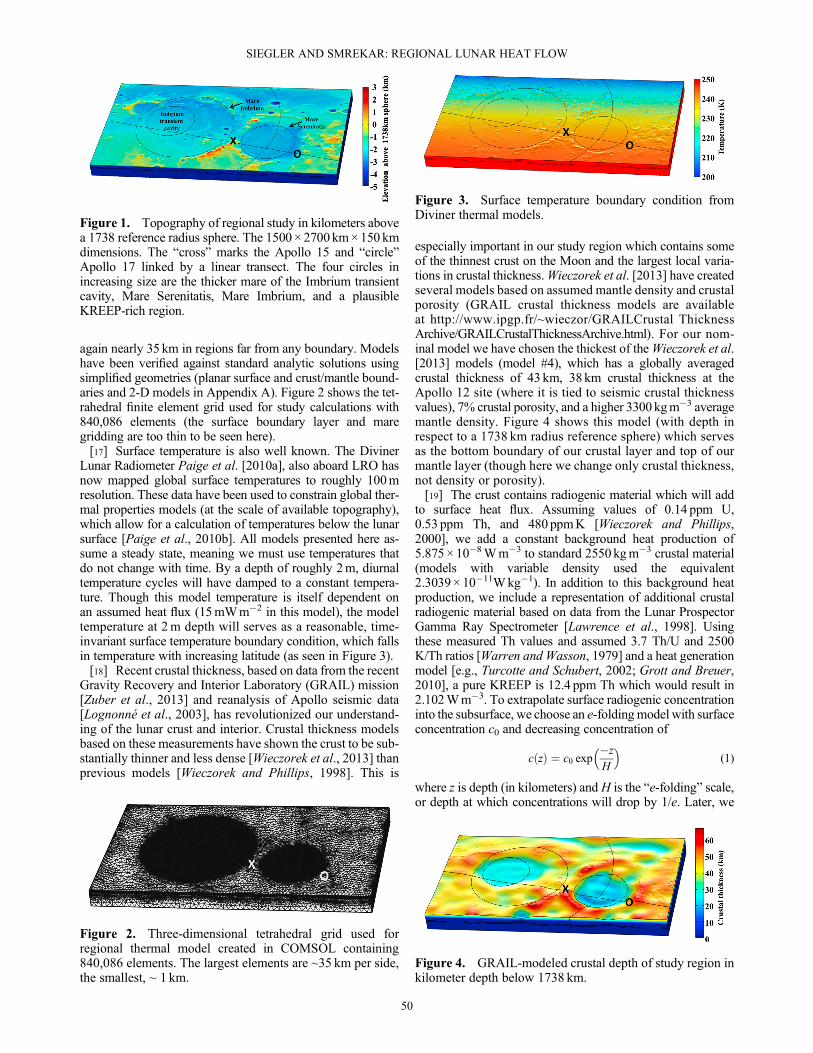
Gravity Recovery and Interior Laboratory (GRAIL) mission[Zuber et al., 2013] and reanalysis of Apollo seismic data[Lognonné et al., 2003], has revolutionized our understand-ing of the lunar crust and interior. Crustal thickness modelsbased on these measurements have shown the crust to be sub-stantially thinner and less dense [Wieczorek et al., 2013] thanprevious models [Wieczorek and Phillips, 1998]. This is
especially important in our study region which contains someof the thinnest crust on the Moon and the largest local varia-tions in crustal thickness.Wieczorek et al. [2013] have createdseveral models based on assumed mantle density and crustalporosity (GRAIL crustal thickness models are availableat http://www.ipgp.fr/~wieczor/GRAILCrustal ThicknessArchive/GRAILCrustalThicknessArchive.html). For our nom-inal model we have chosen the thickest of theWieczorek et al.[2013] models (model #4), which has a globally averagedcrustal thickness of 43 km, 38 km crustal thickness at theApollo 12 site (where it is tied to seismic crustal thicknessvalues), 7% crustal porosity, and a higher 3300 kgm�3 averagemantle density. Figure 4 shows this model (with depth inrespect to a 1738 km radius reference sphere) which servesas the bottom boundary of our crustal layer and top of ourmantle layer (though here we change only crustal thickness,not density or porosity).[19] The crust contains radiogenic material which will add
to surface heat flux. Assuming values of 0.14 ppm U,0.53 ppm Th, and 480 ppmK [Wieczorek and Phillips,2000], we add a constant background heat production of5.875 × 10�8Wm�3 to standard 2550 kgm�3 crustal material(models with variable density used the equivalent2.3039× 10�11Wkg�1). In addition to this background heatproduction, we include a representation of additional crustalradiogenic material based on data from the Lunar ProspectorGamma Ray Spectrometer [Lawrence et al., 1998]. Usingthese measured Th values and assumed 3.7 Th/U and 2500K/Th ratios [Warren and Wasson, 1979] and a heat generationmodel [e.g., Turcotte and Schubert, 2002; Grott and Breuer,2010], a pure KREEP is 12.4 ppm Th which would result in2.102Wm�3. To extrapolate surface radiogenic concentrationinto the subsurface, we choose an e-foldingmodel with surfaceconcentration c0 and decreasing concentration of
c zð Þ ¼ c0 exp�z
H
� �(1)
where z is depth (in kilometers) and H is the “e-folding” scale,or depth at which concentrations will drop by 1/e. Later, we
Figure 2. Three-dimensional tetrahedral grid used forregional thermal model created in COMSOL containing840,086 elements. The largest elements are ~35 km per side,the smallest, ~ 1 km.
Figure 3. Surface temperature boundary condition fromDiviner thermal models.
Figure 4. GRAIL-modeled crustal depth of study region inkilometer depth below 1738 km.
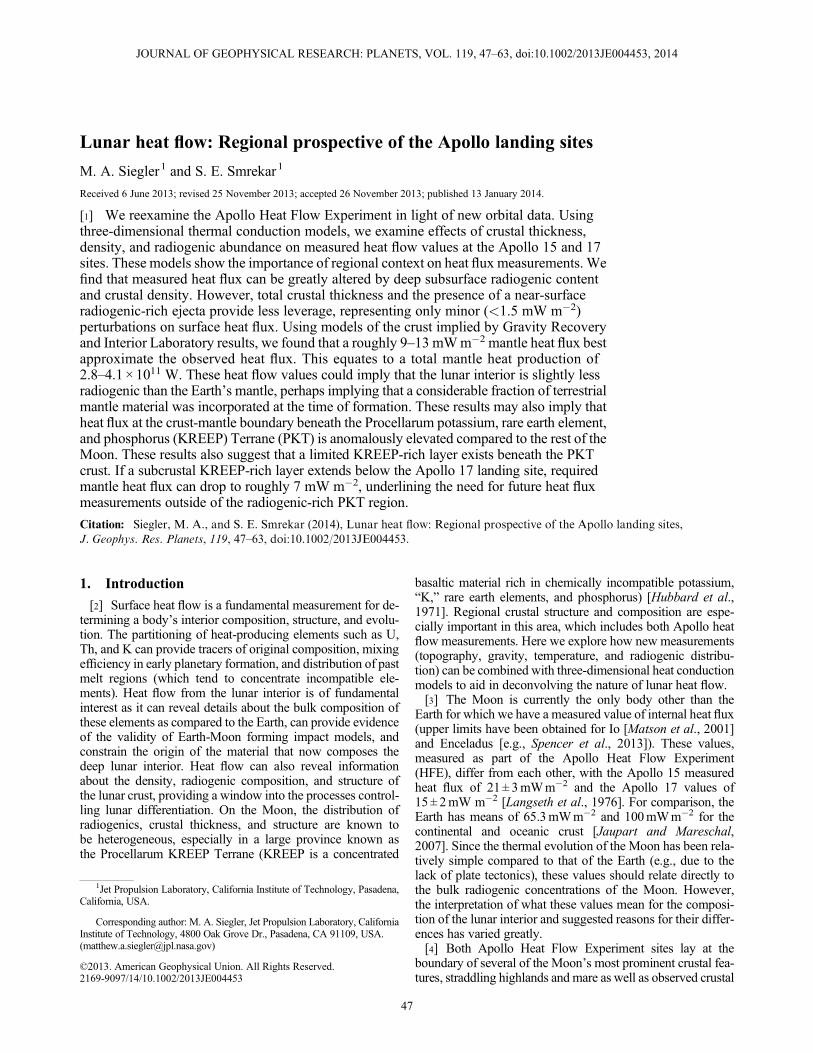
Figure 1. Topography of regional study in kilometers abovea 1738 reference radius sphere. The 1500× 2700 km×150 kmdimensions. The “cross” marks the Apollo 15 and “circle”Apollo 17 linked by a linear transect. The four circles inincreasing size are the thicker mare of the Imbrium transientcavity, Mare Serenitatis, Mare Imbrium, and a plausibleKREEP-rich region.
SIEGLER AND SMREKAR: REGIONAL LUNAR HEAT FLOW
50

will also use this formulation to approximate quantities that in-crease or decrease dramatically with depth (e.g., radiogenicmixing and density profiles). It is sensible for a surface depositthat has been mixed into the upper crust over several billionyears and corresponds well with mixing that might beexpected from crustal density models. In the nominal model,we will use a e�5 km scaling depth, shown in Figure 5.[20] Density, and its effect on thermal conductivity, varies
between primary lithosperic components (crust, mare, andmantle). Specific heat capacity of all materials is arbitary aswe are assuming the Moon has reached a thermal steady state.Even with precise gravity data, the density structure of the lu-nar crust is uncertain. The mare represents flood basaltemplaced sometime later than the primary crust, and they aregenerally believed to be denser than the surrounding olderhighlands crust. For our nominal model we assume a constantdensity crust of 2550 kgm�3 [Wieczorek et al., 2013]. Thecrust is given a thermal conductivity of 2Wm�1K�1 [fromWieczorek and Phillips, 2000].[21] Based on the mare models of Solomon and Head
[1980] combined with mare thickness constraints fromThomson et al. [2009], we chose a model for the mare, assum-ing several cylindrical bodies embedded within the crust. Theupper boundaries of these cylinders are determined by the sur-face topography. The main Imbrium and Serenitatis basins arerepresented by mare reaching to �5 km depth below a1738 km radius lunar sphere, with the upper surface definedby LOLA topography (this resulted in most of these mares be-ing about 3 km thick). Using available crustal thickness dataand topographic expressions of the mare and previous models[e.g., Hikida and Wieczorek, 2007], we chose to represent themain Mare Imbrium as a disk 550 km in radius centered at(34.5°N, 14.5°W), andMare Serinatatis as a disk 295 km in ra-dius, centered at (27°N, 18°E). Within the Imbrium basin; pre-vious authors found a deeper area of mare filling the Imbriumtransient cavity. To represent this area of increased mare thick-ness, we constructed a 270 km radius disk reaching to �7 kmdepth centered at (37.5°N, 20.5°W), the center of the Imbriumimpact (based on aligning the disk with the thinnest crust).Mares are given a density of 3000 kgm�3 and thermal conduc-tivity of 2Wm�1K�1 [from Wieczorek and Phillips, 2000].We chose a mare heat production based on an average ofApollo 15 mare samples (an average of 15,058 and 15,555),which showed radiogenic compositions similar to our nominalcrustal model, adding a constant background heat productionof 4.99 × 10�8Wm�3 to this material [Meyer, 2010; W.Kiefer, personal communication, 2013]. The model densitiesare shown in Figure 6. The edges of these mares are denotedas vertical lines in the transect figures (e.g., Figure 8) through-out this paper.
[22] We also chose to include a section of mantle material inthis model. This is important as heat can flow laterally throughthe mantle between two areas of the crust. The main con-straints on the depth of mantle we can include lie in the as-sumption of conduction and our planar geometry (going toodeep will require us to model a spherical, rather than planarMoon). Examining these constraints, we choose to extendthe base of our model to a depth of 150 km. Here we givethe mantle a density of 3200 kgm�3 and thermal conductivityof 3Wm�1K�1 [Wieczorek and Phillips, 2000]. The heat pro-duction per unit volume, also 4.709× 10�9Wm�3 (all modelsuse a constant density mantle), is too small for this roughly100 km thick section of mantle to have an appreciable effecton surface heat flux (adding at most ~0.5mWm�2).[23] Finally, we need to choose a nominal value for lower
boundary heat flux, which is the primary objective of thisstudy. By adjusting this value, we can then see the mantle ra-diogenic contribution required for a given crustal model tomatch the Apollo HFE results. Langseth et al. [1976] founda uniform mantle heat flux of 4mWm�2 best explained theobserved Apollo HFE values. This value is equivalent to a heatproduction of 2.5 ×10�9Wm�3 over the 1588 km columnbetween 150 km depth and the center of the Moon (neglectingthe core). Based on the values of mantle radiogenics inWieczorek and Phillips [2000], the mantle should have a heatproduction of 4.709 × 10�9Wm�3, or about 7mWm�2 at150 km depth. From initial model runs we found both thesemodels under predicted Apollo HFE values and found a10mWm�2 to be more appropriate for our nominal modelvalue. Assuming that the Moon is in a thermal steady state,10mWm�2 would represent about 6.3 × 10�9Wm�3 averagelunar mantle heat production, which is roughly 70% the heatproduction rate of the Earth’s mantle [Turcotte and Schubert,2002; Jaupart and Mareschal, 2007]. If the Moon is not inthermal equilibrium, less radiogenic material might plausiblygive the same heat flux, but this will require a thermal evolu-tion model including the effects of the low-density crust (suchmodels are reviewed in Zhang et al. [2013] and Laneuvilleet al. [2013]).[24] Assuming an infinite plane with periodic boundaries
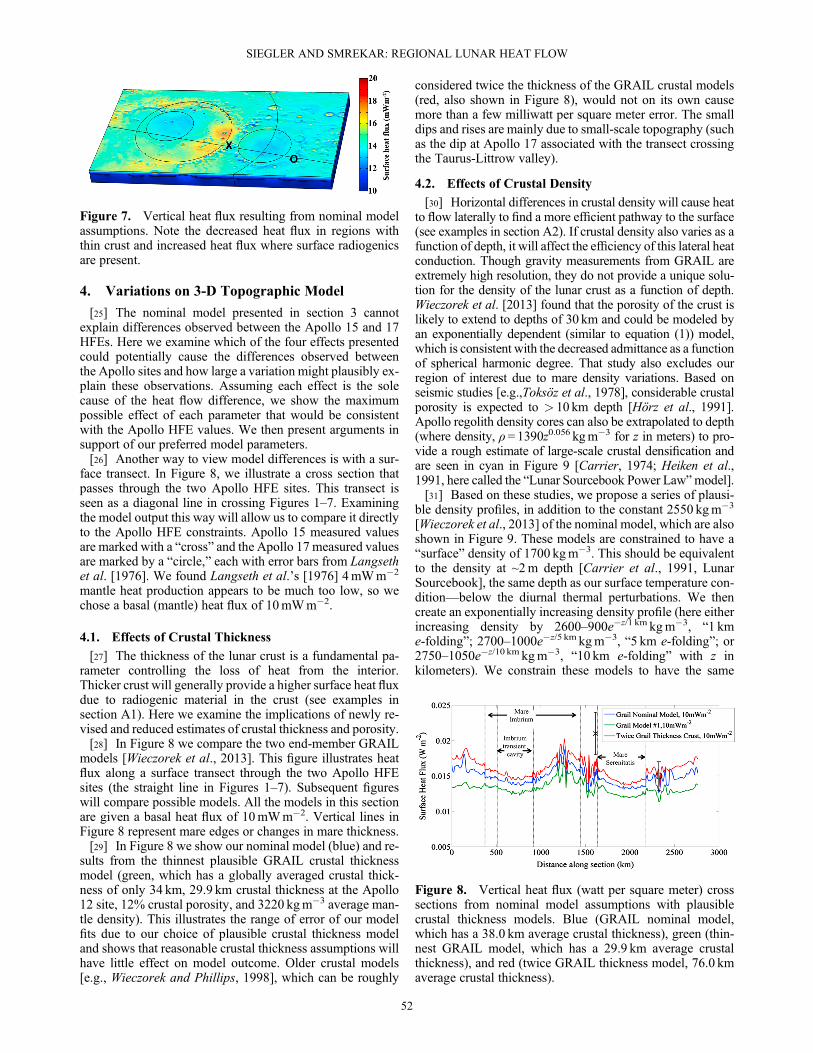
along the four remaining sides of our model, we can now cal-culate the steady state heat conduction and temperatures re-quired by our geometry, internal heat production, thermalproperties, and boundary conditions. Figure 7 shows theresulting heat flux in the vertical direction resulting fromour model assumptions. Here we can see that the highest heatflux values occur near the near-surface radiogenic concentra-tions surrounding Imbrium basin. The mares, which arelower in heat production and over areas of thinner crust,show somewhat lower surface heat flux.
Figure 5. GRS-measured Th converted into near-surfacevolumetric heat production.
Figure 6. Nominal model crustal density based onWieczorekand Phillips [2000] and Wieczorek et al. [2013].
SIEGLER AND SMREKAR: REGIONAL LUNAR HEAT FLOW
51
4. Variations on 3-D Topographic Model
[25] The nominal model presented in section 3 cannotexplain differences observed between the Apollo 15 and 17HFEs. Here we examine which of the four effects presentedcould potentially cause the differences observed betweenthe Apollo sites and how large a variation might plausibly ex-plain these observations. Assuming each effect is the solecause of the heat flow difference, we show the maximumpossible effect of each parameter that would be consistentwith the Apollo HFE values. We then present arguments insupport of our preferred model parameters.[26] Another way to view model differences is with a sur-
face transect. In Figure 8, we illustrate a cross section thatpasses through the two Apollo HFE sites. This transect isseen as a diagonal line in crossing Figures 1–7. Examiningthe model output this way will allow us to compare it directlyto the Apollo HFE constraints. Apollo 15 measured valuesare marked with a “cross” and the Apollo 17 measured valuesare marked by a “circle,” each with error bars from Langsethet al. [1976]. We found Langseth et al.’s [1976] 4mWm�2
mantle heat production appears to be much too low, so wechose a basal (mantle) heat flux of 10mWm�2.
4.1. Effects of Crustal Thickness
[27] The thickness of the lunar crust is a fundamental pa-rameter controlling the loss of heat from the interior.Thicker crust will generally provide a higher surface heat fluxdue to radiogenic material in the crust (see examples insection A1). Here we examine the implications of newly re-vised and reduced estimates of crustal thickness and porosity.[28] In Figure 8 we compare the two end-member GRAIL
models [Wieczorek et al., 2013]. This figure illustrates heatflux along a surface transect through the two Apollo HFEsites (the straight line in Figures 1–7). Subsequent figureswill compare possible models. All the models in this sectionare given a basal heat flux of 10mWm�2. Vertical lines inFigure 8 represent mare edges or changes in mare thickness.[29] In Figure 8 we show our nominal model (blue) and re-
sults from the thinnest plausible GRAIL crustal thicknessmodel (green, which has a globally averaged crustal thick-ness of only 34 km, 29.9 km crustal thickness at the Apollo12 site, 12% crustal porosity, and 3220 kgm�3 average man-tle density). This illustrates the range of error of our modelfits due to our choice of plausible crustal thickness modeland shows that reasonable crustal thickness assumptions willhave little effect on model outcome. Older crustal models[e.g., Wieczorek and Phillips, 1998], which can be roughly
considered twice the thickness of the GRAIL crustal models(red, also shown in Figure 8), would not on its own causemore than a few milliwatt per square meter error. The smalldips and rises are mainly due to small-scale topography (suchas the dip at Apollo 17 associated with the transect crossingthe Taurus-Littrow valley).
4.2. Effects of Crustal Density
[30] Horizontal differences in crustal density will cause heatto flow laterally to find a more efficient pathway to the surface(see examples in section A2). If crustal density also varies as afunction of depth, it will affect the efficiency of this lateral heatconduction. Though gravity measurements from GRAIL areextremely high resolution, they do not provide a unique solu-tion for the density of the lunar crust as a function of depth.Wieczorek et al. [2013] found that the porosity of the crust islikely to extend to depths of 30 km and could be modeled byan exponentially dependent (similar to equation (1)) model,which is consistent with the decreased admittance as a functionof spherical harmonic degree. That study also excludes ourregion of interest due to mare density variations. Based onseismic studies [e.g.,Toksöz et al., 1978], considerable crustalporosity is expected to > 10 km depth [Hörz et al., 1991].Apollo regolith density cores can also be extrapolated to depth(where density, ρ=1390z0.056 kgm�3 for z in meters) to pro-vide a rough estimate of large-scale crustal densification andare seen in cyan in Figure 9 [Carrier, 1974; Heiken et al.,1991, here called the “Lunar Sourcebook Power Law”model].[31] Based on these studies, we propose a series of plausi-
ble density profiles, in addition to the constant 2550 kgm�3
[Wieczorek et al., 2013] of the nominal model, which are alsoshown in Figure 9. These models are constrained to have a“surface” density of 1700 kgm�3. This should be equivalentto the density at ~2m depth [Carrier et al., 1991, LunarSourcebook], the same depth as our surface temperature con-dition—below the diurnal thermal perturbations. We thencreate an exponentially increasing density profile (here eitherincreasing density by 2600–900e�z/1 km kgm�3, “1 kme-folding”; 2700–1000e�z/5 km kgm�3, “5 km e-folding”; or2750–1050e�z/10 km kgm�3, “10 km e-folding” with z inkilometers). We constrain these models to have the same
Figure 7. Vertical heat flux resulting from nominal modelassumptions. Note the decreased heat flux in regions withthin crust and increased heat flux where surface radiogenicsare present.
Figure 8. Vertical heat flux (watt per square meter) crosssections from nominal model assumptions with plausiblecrustal thickness models. Blue (GRAIL nominal model,which has a 38.0 km average crustal thickness), green (thin-nest GRAIL model, which has a 29.9 km average crustalthickness), and red (twice GRAIL thickness model, 76.0 kmaverage crustal thickness).
SIEGLER AND SMREKAR: REGIONAL LUNAR HEAT FLOW
52
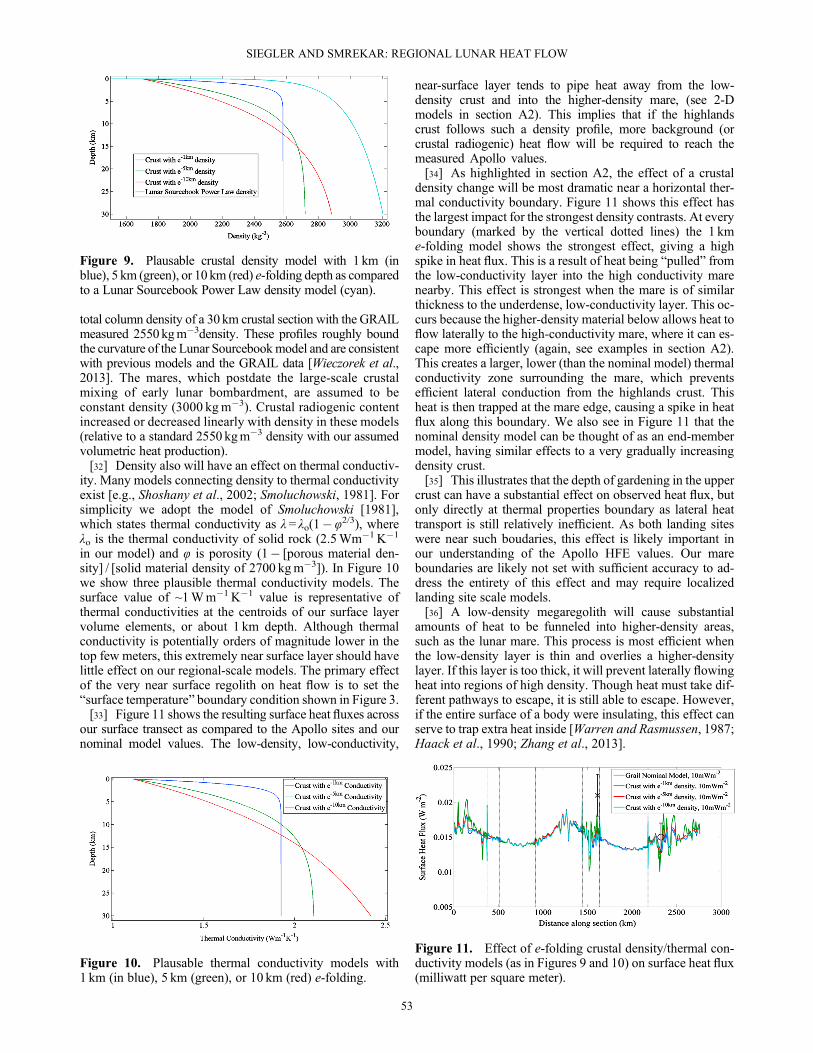
total column density of a 30 km crustal section with the GRAILmeasured 2550 kgm�3density. These profiles roughly boundthe curvature of the Lunar Sourcebookmodel and are consistentwith previous models and the GRAIL data [Wieczorek et al.,2013]. The mares, which postdate the large-scale crustalmixing of early lunar bombardment, are assumed to beconstant density (3000 kgm�3). Crustal radiogenic contentincreased or decreased linearly with density in these models(relative to a standard 2550 kgm�3 density with our assumedvolumetric heat production).[32] Density also will have an effect on thermal conductiv-
ity. Many models connecting density to thermal conductivityexist [e.g., Shoshany et al., 2002; Smoluchowski, 1981]. Forsimplicity we adopt the model of Smoluchowski [1981],which states thermal conductivity as λ= λo(1�φ2/3), whereλo is the thermal conductivity of solid rock (2.5Wm�1K�1
in our model) and φ is porosity (1� [porous material den-sity] / [solid material density of 2700 kgm�3]). In Figure 10we show three plausible thermal conductivity models. Thesurface value of ~1Wm�1 K�1 value is representative ofthermal conductivities at the centroids of our surface layervolume elements, or about 1 km depth. Although thermalconductivity is potentially orders of magnitude lower in thetop few meters, this extremely near surface layer should havelittle effect on our regional-scale models. The primary effectof the very near surface regolith on heat flow is to set the“surface temperature” boundary condition shown in Figure 3.[33] Figure 11 shows the resulting surface heat fluxes across
our surface transect as compared to the Apollo sites and ournominal model values. The low-density, low-conductivity,
near-surface layer tends to pipe heat away from the low-density crust and into the higher-density mare, (see 2-Dmodels in section A2). This implies that if the highlandscrust follows such a density profile, more background (orcrustal radiogenic) heat flow will be required to reach themeasured Apollo values.[34] As highlighted in section A2, the effect of a crustal
density change will be most dramatic near a horizontal ther-mal conductivity boundary. Figure 11 shows this effect hasthe largest impact for the strongest density contrasts. At everyboundary (marked by the vertical dotted lines) the 1 kme-folding model shows the strongest effect, giving a highspike in heat flux. This is a result of heat being “pulled” fromthe low-conductivity layer into the high conductivity marenearby. This effect is strongest when the mare is of similarthickness to the underdense, low-conductivity layer. This oc-curs because the higher-density material below allows heat toflow laterally to the high-conductivity mare, where it can es-cape more efficiently (again, see examples in section A2).This creates a larger, lower (than the nominal model) thermalconductivity zone surrounding the mare, which preventsefficient lateral conduction from the highlands crust. Thisheat is then trapped at the mare edge, causing a spike in heatflux along this boundary. We also see in Figure 11 that thenominal density model can be thought of as an end-membermodel, having similar effects to a very gradually increasingdensity crust.[35] This illustrates that the depth of gardening in the upper
crust can have a substantial effect on observed heat flux, butonly directly at thermal properties boundary as lateral heattransport is still relatively inefficient. As both landing siteswere near such boudaries, this effect is likely important inour understanding of the Apollo HFE values. Our mareboundaries are likely not set with sufficient accuracy to ad-dress the entirety of this effect and may require localizedlanding site scale models.[36] A low-density megaregolith will cause substantial
amounts of heat to be funneled into higher-density areas,such as the lunar mare. This process is most efficient whenthe low-density layer is thin and overlies a higher-densitylayer. If this layer is too thick, it will prevent laterally flowingheat into regions of high density. Though heat must take dif-ferent pathways to escape, it is still able to escape. However,if the entire surface of a body were insulating, this effect canserve to trap extra heat inside [Warren and Rasmussen, 1987;Haack et al., 1990; Zhang et al., 2013].
Figure 9. Plausable crustal density model with 1 km (inblue), 5 km (green), or 10 km (red) e-folding depth as comparedto a Lunar Sourcebook Power Law density model (cyan).
Figure 10. Plausable thermal conductivity models with1 km (in blue), 5 km (green), or 10 km (red) e-folding.
Figure 11. Effect of e-folding crustal density/thermal con-ductivity models (as in Figures 9 and 10) on surface heat flux(milliwatt per square meter).
SIEGLER AND SMREKAR: REGIONAL LUNAR HEAT FLOW
53
4.3. Effects of a KREEP-Rich Ejecta Blanket
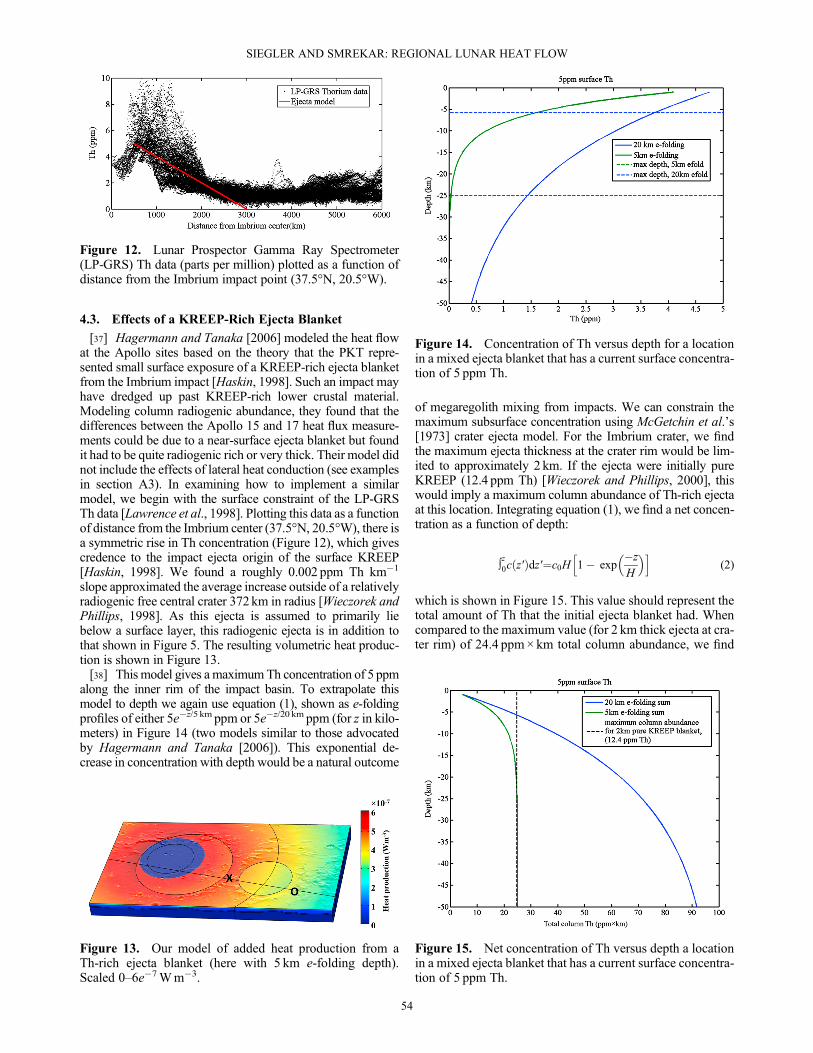
[37] Hagermann and Tanaka [2006] modeled the heat flowat the Apollo sites based on the theory that the PKT repre-sented small surface exposure of a KREEP-rich ejecta blanketfrom the Imbrium impact [Haskin, 1998]. Such an impact mayhave dredged up past KREEP-rich lower crustal material.Modeling column radiogenic abundance, they found that thedifferences between the Apollo 15 and 17 heat flux measure-ments could be due to a near-surface ejecta blanket but foundit had to be quite radiogenic rich or very thick. Their model didnot include the effects of lateral heat conduction (see examplesin section A3). In examining how to implement a similarmodel, we begin with the surface constraint of the LP-GRSTh data [Lawrence et al., 1998]. Plotting this data as a functionof distance from the Imbrium center (37.5°N, 20.5°W), there isa symmetric rise in Th concentration (Figure 12), which givescredence to the impact ejecta origin of the surface KREEP[Haskin, 1998]. We found a roughly 0.002 ppm Th km�1
slope approximated the average increase outside of a relativelyradiogenic free central crater 372km in radius [Wieczorek andPhillips, 1998]. As this ejecta is assumed to primarily liebelow a surface layer, this radiogenic ejecta is in addition tothat shown in Figure 5. The resulting volumetric heat produc-tion is shown in Figure 13.[38] This model gives a maximumTh concentration of 5 ppm
along the inner rim of the impact basin. To extrapolate thismodel to depth we again use equation (1), shown as e-foldingprofiles of either 5e�z/5 km ppm or 5e�z/20 km ppm (for z in kilo-meters) in Figure 14 (two models similar to those advocatedby Hagermann and Tanaka [2006]). This exponential de-crease in concentration with depth would be a natural outcome
of megaregolith mixing from impacts. We can constrain themaximum subsurface concentration using McGetchin et al.’s[1973] crater ejecta model. For the Imbrium crater, we findthe maximum ejecta thickness at the crater rim would be lim-ited to approximately 2 km. If the ejecta were initially pureKREEP (12.4 ppm Th) [Wieczorek and Phillips, 2000], thiswould imply a maximum column abundance of Th-rich ejectaat this location. Integrating equation (1), we find a net concen-tration as a function of depth:
∫z0c z′ð Þdz′¼c0H 1� exp�z
H
� �h i(2)
which is shown in Figure 15. This value should represent thetotal amount of Th that the initial ejecta blanket had. Whencompared to the maximum value (for 2 km thick ejecta at cra-ter rim) of 24.4 ppm× km total column abundance, we find
Figure 12. Lunar Prospector Gamma Ray Spectrometer(LP-GRS) Th data (parts per million) plotted as a function ofdistance from the Imbrium impact point (37.5°N, 20.5°W).
Figure 13. Our model of added heat production from aTh-rich ejecta blanket (here with 5 km e-folding depth).Scaled 0–6e�7Wm�3.
Figure 14. Concentration of Th versus depth for a locationin a mixed ejecta blanket that has a current surface concentra-tion of 5 ppm Th.
Figure 15. Net concentration of Th versus depth a locationin a mixed ejecta blanket that has a current surface concentra-tion of 5 ppm Th.
SIEGLER AND SMREKAR: REGIONAL LUNAR HEAT FLOW
54
that an e-folding model exceeding 5e�z/5 km is likely not pos-sible (i.e., a 20 km e-folding depth would require either athicker initial ejecta blanket or one with supra-KREEP con-centration). This imposes a strict limit on the amount of heatthat can be derived from an eject blanket source. Figure 14also illustrates how deep material could be mixed to witheach e-folding scenario before exceeding the total columnabundance of Th of the original ejecta blanket.[39] Figure 16 shows our transect through the Apollo sites.
In both models (5 km e-folding in green and 20 km e-foldingin red), there is a rise in heat flow nearer to Imbrium. This isconsistent with the Apollo 15 site having a higher heat fluxwith the Apollo 17. In order to create the difference betweenthe Apollo sites with an ejecta blanket alone is easily accom-plished by the 20 km e-folding model (red), but this places animplausible amount of radiogenic material in the initial ejectablanket. The maximum plausible 5 km e-folding model canexplain the difference, but just at the limit of the measure-ment errors. Therefore, we find that a radiogenic-rich ejectablanket alone is likely not a plausible explanation for the heatflux difference between the two Apollo sites.
4.4. Effects of Subcrustal KREEP Layer
[40] The concept that the Imbrium impact broughtKREEP-rich material up to the lunar surface implies thatthere is a subsurface reservoir of KREEP-rich material. Toexplain the enhanced nearside volcanism, basin relaxation[Wieczorek and Phillips, 1998], and the previously notedTh enhancements, Wieczorek and Phillips [2000] hypothe-sized that rather than being a global layer, this deepKREEP had pooled preferentially beneath the PKT. Using
surface LP-GRS measured Th as a guide, they approximatedthe localized deep KREEP as a disk 40° (~1200 km) in radiusabout the Imbrium impact center (37.5°N, 19.5°W). Thisresulted in the KREEP disk ending roughly halfway betweenthe Apollo 15 and 17 sites. Due to the assumed thick, 60 kmcrust, lateral heat conduction was large enough that Apollo15 was lower than the 35mWm�2 that this model impliesat the Imbrium center and Apollo 17 was elevated abovethe background 11mWm�2 predicted far afield from thePKT. Their modeled KREEP layer was ~10 km thick and atthe base of a 60 km, uniform thickness crust.[41] In this section, we revisit this model by assuming a
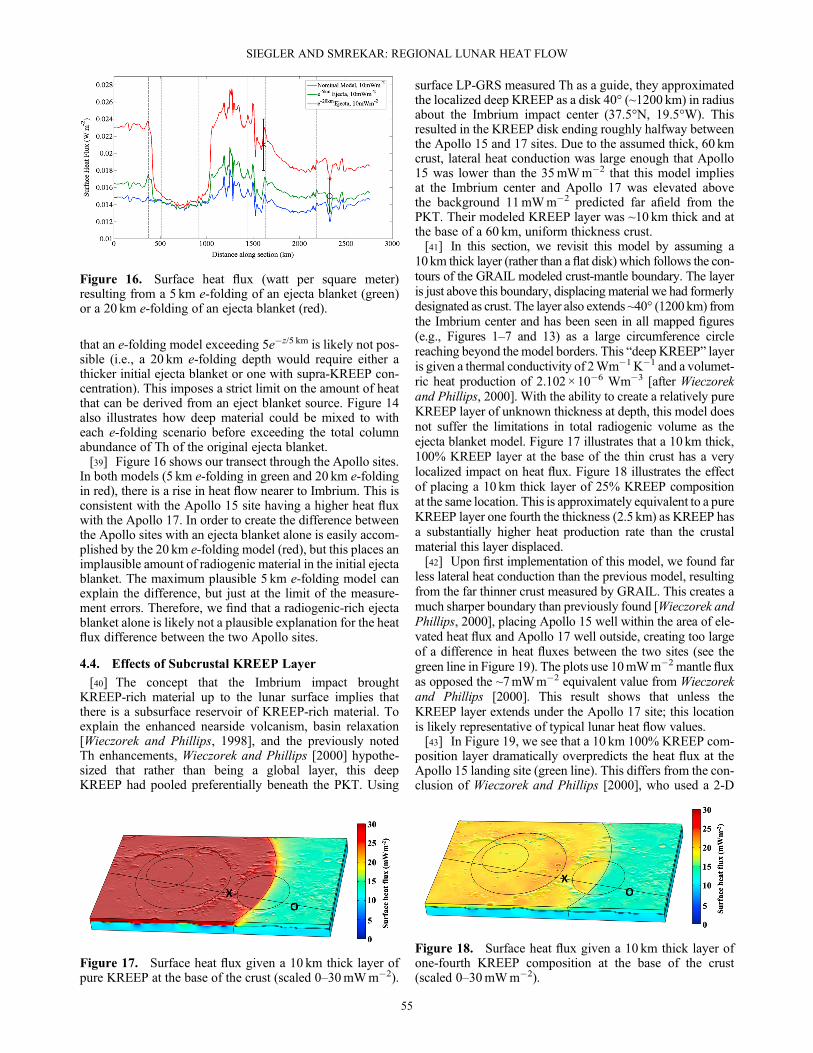
10km thick layer (rather than a flat disk) which follows the con-tours of the GRAIL modeled crust-mantle boundary. The layeris just above this boundary, displacing material we had formerlydesignated as crust. The layer also extends ~40° (1200km) fromthe Imbrium center and has been seen in all mapped figures(e.g., Figures 1–7 and 13) as a large circumference circlereaching beyond the model borders. This “deep KREEP” layeris given a thermal conductivity of 2Wm�1K�1 and a volumet-ric heat production of 2.102 × 10�6 Wm�3 [after Wieczorekand Phillips, 2000]. With the ability to create a relatively pureKREEP layer of unknown thickness at depth, this model doesnot suffer the limitations in total radiogenic volume as theejecta blanket model. Figure 17 illustrates that a 10 km thick,100% KREEP layer at the base of the thin crust has a verylocalized impact on heat flux. Figure 18 illustrates the effectof placing a 10 km thick layer of 25% KREEP compositionat the same location. This is approximately equivalent to a pureKREEP layer one fourth the thickness (2.5 km) as KREEP hasa substantially higher heat production rate than the crustalmaterial this layer displaced.[42] Upon first implementation of this model, we found far
less lateral heat conduction than the previous model, resultingfrom the far thinner crust measured by GRAIL. This creates amuch sharper boundary than previously found [Wieczorek andPhillips, 2000], placing Apollo 15 well within the area of ele-vated heat flux and Apollo 17 well outside, creating too largeof a difference in heat fluxes between the two sites (see thegreen line in Figure 19). The plots use 10mWm�2 mantle fluxas opposed the ~7mWm�2 equivalent value from Wieczorekand Phillips [2000]. This result shows that unless theKREEP layer extends under the Apollo 17 site; this locationis likely representative of typical lunar heat flow values.[43] In Figure 19, we see that a 10 km 100% KREEP com-
position layer dramatically overpredicts the heat flux at theApollo 15 landing site (green line). This differs from the con-clusion of Wieczorek and Phillips [2000], who used a 2-D
Figure 16. Surface heat flux (watt per square meter)resulting from a 5 km e-folding of an ejecta blanket (green)or a 20 km e-folding of an ejecta blanket (red).
Figure 17. Surface heat flux given a 10 km thick layer ofpure KREEP at the base of the crust (scaled 0–30mWm�2).
Figure 18. Surface heat flux given a 10 km thick layer ofone-fourth KREEP composition at the base of the crust(scaled 0–30mWm�2).
SIEGLER AND SMREKAR: REGIONAL LUNAR HEAT FLOW
55
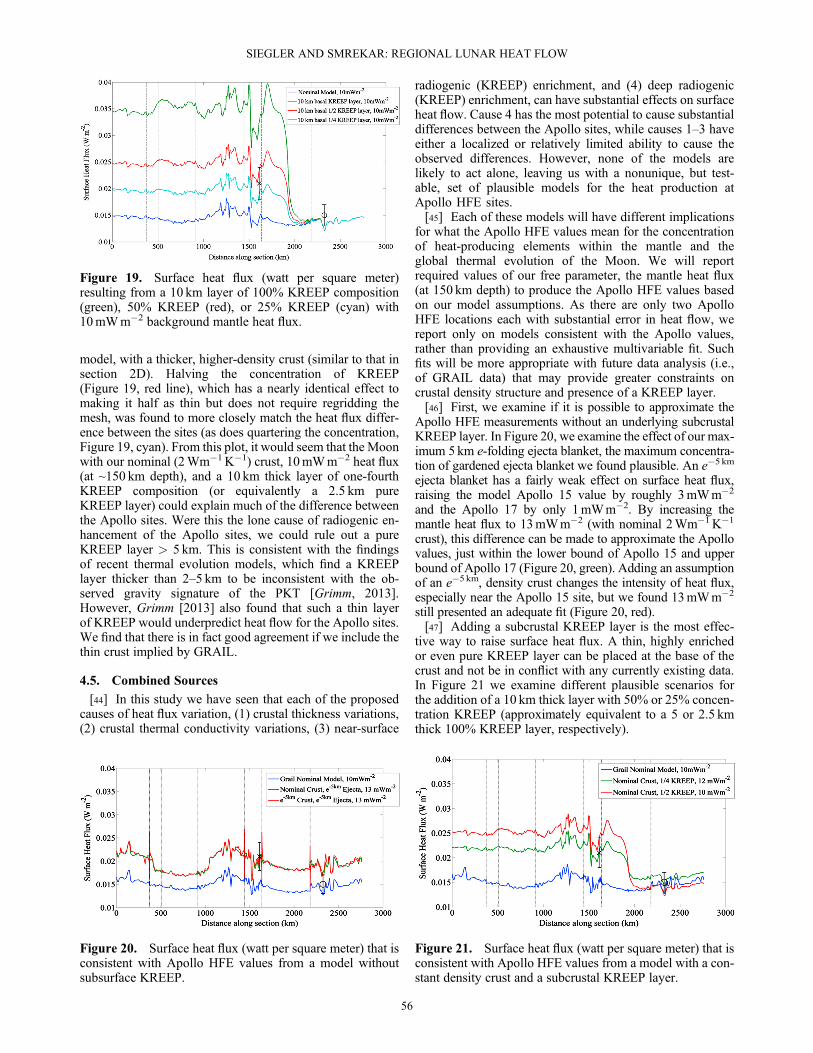
model, with a thicker, higher-density crust (similar to that insection 2D). Halving the concentration of KREEP(Figure 19, red line), which has a nearly identical effect tomaking it half as thin but does not require regridding themesh, was found to more closely match the heat flux differ-ence between the sites (as does quartering the concentration,Figure 19, cyan). From this plot, it would seem that the Moonwith our nominal (2Wm�1K�1) crust, 10mWm�2 heat flux(at ~150 km depth), and a 10 km thick layer of one-fourthKREEP composition (or equivalently a 2.5 km pureKREEP layer) could explain much of the difference betweenthe Apollo sites. Were this the lone cause of radiogenic en-hancement of the Apollo sites, we could rule out a pureKREEP layer > 5 km. This is consistent with the findingsof recent thermal evolution models, which find a KREEPlayer thicker than 2–5 km to be inconsistent with the ob-served gravity signature of the PKT [Grimm, 2013].However, Grimm [2013] also found that such a thin layerof KREEP would underpredict heat flow for the Apollo sites.We find that there is in fact good agreement if we include thethin crust implied by GRAIL.
4.5. Combined Sources
[44] In this study we have seen that each of the proposedcauses of heat flux variation, (1) crustal thickness variations,(2) crustal thermal conductivity variations, (3) near-surface
radiogenic (KREEP) enrichment, and (4) deep radiogenic(KREEP) enrichment, can have substantial effects on surfaceheat flow. Cause 4 has the most potential to cause substantialdifferences between the Apollo sites, while causes 1–3 haveeither a localized or relatively limited ability to cause theobserved differences. However, none of the models arelikely to act alone, leaving us with a nonunique, but test-able, set of plausible models for the heat production atApollo HFE sites.[45] Each of these models will have different implications
for what the Apollo HFE values mean for the concentrationof heat-producing elements within the mantle and theglobal thermal evolution of the Moon. We will reportrequired values of our free parameter, the mantle heat flux(at 150 km depth) to produce the Apollo HFE values basedon our model assumptions. As there are only two ApolloHFE locations each with substantial error in heat flow, wereport only on models consistent with the Apollo values,rather than providing an exhaustive multivariable fit. Suchfits will be more appropriate with future data analysis (i.e.,of GRAIL data) that may provide greater constraints oncrustal density structure and presence of a KREEP layer.[46] First, we examine if it is possible to approximate the
Apollo HFE measurements without an underlying subcrustalKREEP layer. In Figure 20, we examine the effect of our max-imum 5km e-folding ejecta blanket, the maximum concentra-tion of gardened ejecta blanket we found plausible. An e�5 km
ejecta blanket has a fairly weak effect on surface heat flux,raising the model Apollo 15 value by roughly 3mWm�2
and the Apollo 17 by only 1mWm�2. By increasing themantle heat flux to 13mWm�2 (with nominal 2Wm�1K�1
crust), this difference can be made to approximate the Apollovalues, just within the lower bound of Apollo 15 and upperbound of Apollo 17 (Figure 20, green). Adding an assumptionof an e�5 km, density crust changes the intensity of heat flux,especially near the Apollo 15 site, but we found 13mWm�2
still presented an adequate fit (Figure 20, red).[47] Adding a subcrustal KREEP layer is the most effec-
tive way to raise surface heat flux. A thin, highly enrichedor even pure KREEP layer can be placed at the base of thecrust and not be in conflict with any currently existing data.In Figure 21 we examine different plausible scenarios forthe addition of a 10 km thick layer with 50% or 25% concen-tration KREEP (approximately equivalent to a 5 or 2.5 kmthick 100% KREEP layer, respectively).
Figure 19. Surface heat flux (watt per square meter)resulting from a 10 km layer of 100% KREEP composition(green), 50% KREEP (red), or 25% KREEP (cyan) with10mWm�2 background mantle heat flux.
Figure 20. Surface heat flux (watt per square meter) that isconsistent with Apollo HFE values from a model withoutsubsurface KREEP.
Figure 21. Surface heat flux (watt per square meter) that isconsistent with Apollo HFE values from a model with a con-stant density crust and a subcrustal KREEP layer.
SIEGLER AND SMREKAR: REGIONAL LUNAR HEAT FLOW
56
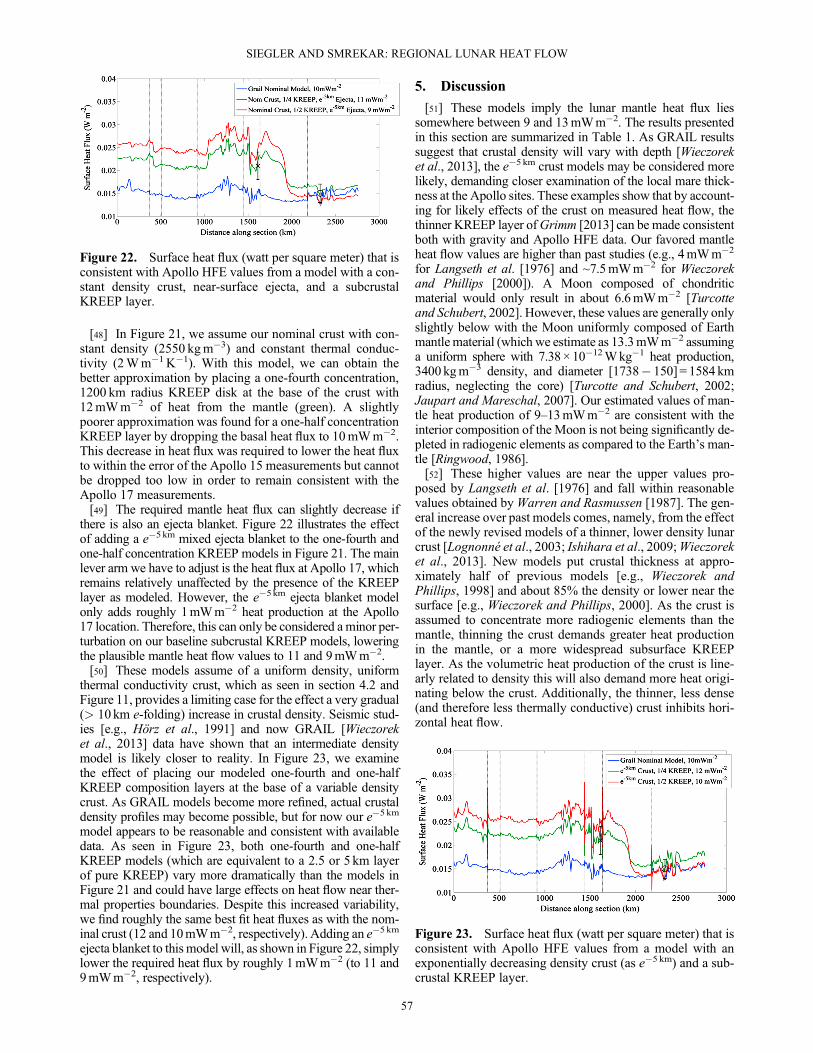
[48] In Figure 21, we assume our nominal crust with con-stant density (2550 kgm�3) and constant thermal conduc-tivity (2Wm�1 K�1). With this model, we can obtain thebetter approximation by placing a one-fourth concentration,1200 km radius KREEP disk at the base of the crust with12mWm�2 of heat from the mantle (green). A slightlypoorer approximation was found for a one-half concentrationKREEP layer by dropping the basal heat flux to 10mWm�2.This decrease in heat flux was required to lower the heat fluxto within the error of the Apollo 15 measurements but cannotbe dropped too low in order to remain consistent with theApollo 17 measurements.[49] The required mantle heat flux can slightly decrease if
there is also an ejecta blanket. Figure 22 illustrates the effectof adding a e�5km mixed ejecta blanket to the one-fourth andone-half concentration KREEP models in Figure 21. The mainlever arm we have to adjust is the heat flux at Apollo 17, whichremains relatively unaffected by the presence of the KREEPlayer as modeled. However, the e�5km ejecta blanket modelonly adds roughly 1mWm�2 heat production at the Apollo17 location. Therefore, this can only be considered a minor per-turbation on our baseline subcrustal KREEP models, loweringthe plausible mantle heat flow values to 11 and 9mWm�2.[50] These models assume of a uniform density, uniform
thermal conductivity crust, which as seen in section 4.2 andFigure 11, provides a limiting case for the effect a very gradual(> 10 km e-folding) increase in crustal density. Seismic stud-ies [e.g., Hörz et al., 1991] and now GRAIL [Wieczoreket al., 2013] data have shown that an intermediate densitymodel is likely closer to reality. In Figure 23, we examinethe effect of placing our modeled one-fourth and one-halfKREEP composition layers at the base of a variable densitycrust. As GRAIL models become more refined, actual crustaldensity profiles may become possible, but for now our e�5 km
model appears to be reasonable and consistent with availabledata. As seen in Figure 23, both one-fourth and one-halfKREEP models (which are equivalent to a 2.5 or 5 km layerof pure KREEP) vary more dramatically than the models inFigure 21 and could have large effects on heat flow near ther-mal properties boundaries. Despite this increased variability,we find roughly the same best fit heat fluxes as with the nom-inal crust (12 and 10mWm�2, respectively). Adding an e�5 km
ejecta blanket to this model will, as shown in Figure 22, simplylower the required heat flux by roughly 1mWm�2 (to 11 and9mWm�2, respectively).
5. Discussion
[51] These models imply the lunar mantle heat flux liessomewhere between 9 and 13mWm�2. The results presentedin this section are summarized in Table 1. As GRAIL resultssuggest that crustal density will vary with depth [Wieczoreket al., 2013], the e�5 km crust models may be considered morelikely, demanding closer examination of the local mare thick-ness at the Apollo sites. These examples show that by account-ing for likely effects of the crust on measured heat flow, thethinner KREEP layer ofGrimm [2013] can be made consistentboth with gravity and Apollo HFE data. Our favored mantleheat flow values are higher than past studies (e.g., 4mWm�2
for Langseth et al. [1976] and ~7.5mWm�2 for Wieczorekand Phillips [2000]). A Moon composed of chondriticmaterial would only result in about 6.6mWm�2 [Turcotteand Schubert, 2002]. However, these values are generally onlyslightly below with the Moon uniformly composed of Earthmantlematerial (which we estimate as 13.3mWm�2 assuminga uniform sphere with 7.38×10�12Wkg�1 heat production,3400 kgm�3 density, and diameter [1738� 150] = 1584 kmradius, neglecting the core) [Turcotte and Schubert, 2002;Jaupart and Mareschal, 2007]. Our estimated values of man-tle heat production of 9–13mWm�2 are consistent with theinterior composition of the Moon is not being significantly de-pleted in radiogenic elements as compared to the Earth’s man-tle [Ringwood, 1986].[52] These higher values are near the upper values pro-
posed by Langseth et al. [1976] and fall within reasonablevalues obtained byWarren and Rasmussen [1987]. The gen-eral increase over past models comes, namely, from the effectof the newly revised models of a thinner, lower density lunarcrust [Lognonné et al., 2003; Ishihara et al., 2009;Wieczoreket al., 2013]. New models put crustal thickness at appro-ximately half of previous models [e.g., Wieczorek andPhillips, 1998] and about 85% the density or lower near thesurface [e.g., Wieczorek and Phillips, 2000]. As the crust isassumed to concentrate more radiogenic elements than themantle, thinning the crust demands greater heat productionin the mantle, or a more widespread subsurface KREEPlayer. As the volumetric heat production of the crust is line-arly related to density this will also demand more heat origi-nating below the crust. Additionally, the thinner, less dense(and therefore less thermally conductive) crust inhibits hori-zontal heat flow.
Figure 22. Surface heat flux (watt per square meter) that isconsistent with Apollo HFE values from a model with a con-stant density crust, near-surface ejecta, and a subcrustalKREEP layer.
Figure 23. Surface heat flux (watt per square meter) that isconsistent with Apollo HFE values from a model with anexponentially decreasing density crust (as e�5 km) and a sub-crustal KREEP layer.
SIEGLER AND SMREKAR: REGIONAL LUNAR HEAT FLOW
57
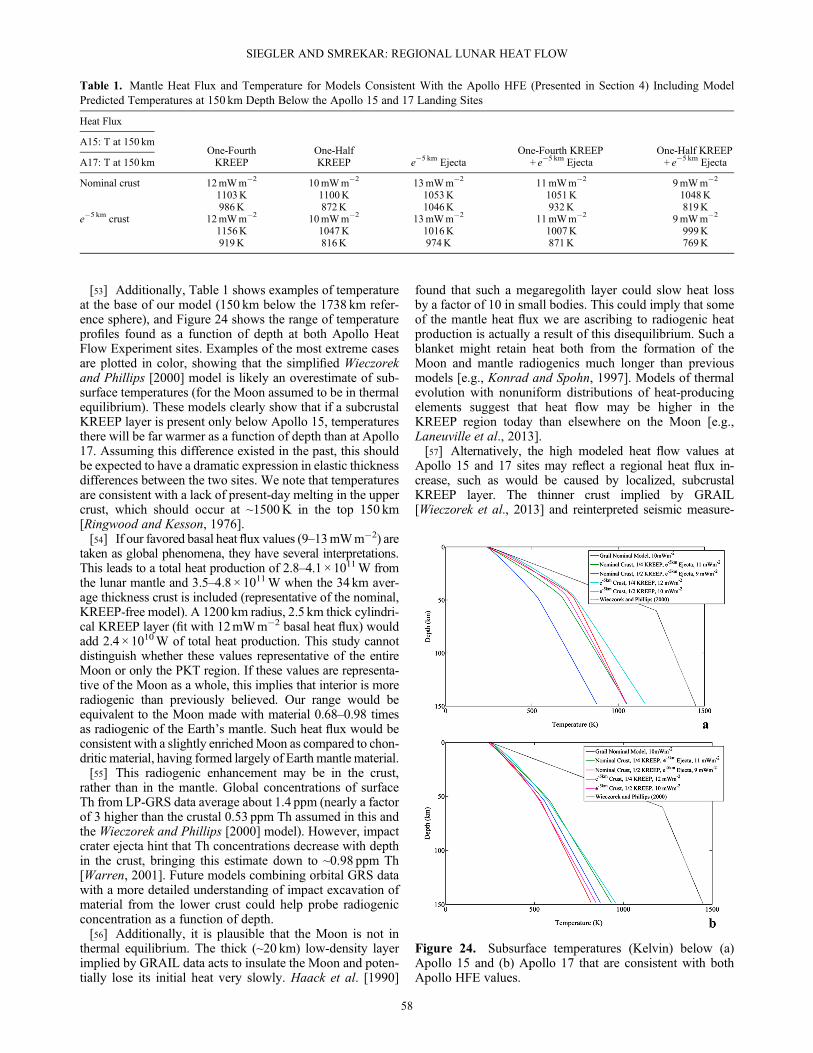
[53] Additionally, Table 1 shows examples of temperatureat the base of our model (150 km below the 1738 km refer-ence sphere), and Figure 24 shows the range of temperatureprofiles found as a function of depth at both Apollo HeatFlow Experiment sites. Examples of the most extreme casesare plotted in color, showing that the simplified Wieczorekand Phillips [2000] model is likely an overestimate of sub-surface temperatures (for the Moon assumed to be in thermalequilibrium). These models clearly show that if a subcrustalKREEP layer is present only below Apollo 15, temperaturesthere will be far warmer as a function of depth than at Apollo17. Assuming this difference existed in the past, this shouldbe expected to have a dramatic expression in elastic thicknessdifferences between the two sites. We note that temperaturesare consistent with a lack of present-day melting in the uppercrust, which should occur at ~1500K in the top 150 km[Ringwood and Kesson, 1976].[54] If our favored basal heat flux values (9–13mWm�2) are
taken as global phenomena, they have several interpretations.This leads to a total heat production of 2.8–4.1 × 10¹¹W fromthe lunar mantle and 3.5–4.8 × 10¹¹W when the 34 km aver-age thickness crust is included (representative of the nominal,KREEP-free model). A 1200 km radius, 2.5 km thick cylindri-cal KREEP layer (fit with 12mWm�2 basal heat flux) wouldadd 2.4 × 10¹⁰W of total heat production. This study cannotdistinguish whether these values representative of the entireMoon or only the PKT region. If these values are representa-tive of the Moon as a whole, this implies that interior is moreradiogenic than previously believed. Our range would beequivalent to the Moon made with material 0.68–0.98 timesas radiogenic of the Earth’s mantle. Such heat flux would beconsistent with a slightly enrichedMoon as compared to chon-dritic material, having formed largely of Earth mantle material.[55] This radiogenic enhancement may be in the crust,
rather than in the mantle. Global concentrations of surfaceTh from LP-GRS data average about 1.4 ppm (nearly a factorof 3 higher than the crustal 0.53 ppm Th assumed in this andthe Wieczorek and Phillips [2000] model). However, impactcrater ejecta hint that Th concentrations decrease with depthin the crust, bringing this estimate down to ~0.98 ppm Th[Warren, 2001]. Future models combining orbital GRS datawith a more detailed understanding of impact excavation ofmaterial from the lower crust could help probe radiogenicconcentration as a function of depth.[56] Additionally, it is plausible that the Moon is not in
thermal equilibrium. The thick (~20 km) low-density layerimplied by GRAIL data acts to insulate the Moon and poten-tially lose its initial heat very slowly. Haack et al. [1990]
found that such a megaregolith layer could slow heat lossby a factor of 10 in small bodies. This could imply that someof the mantle heat flux we are ascribing to radiogenic heatproduction is actually a result of this disequilibrium. Such ablanket might retain heat both from the formation of theMoon and mantle radiogenics much longer than previousmodels [e.g., Konrad and Spohn, 1997]. Models of thermalevolution with nonuniform distributions of heat-producingelements suggest that heat flow may be higher in theKREEP region today than elsewhere on the Moon [e.g.,Laneuville et al., 2013].[57] Alternatively, the high modeled heat flow values at
Apollo 15 and 17 sites may reflect a regional heat flux in-crease, such as would be caused by localized, subcrustalKREEP layer. The thinner crust implied by GRAIL[Wieczorek et al., 2013] and reinterpreted seismic measure-
Figure 24. Subsurface temperatures (Kelvin) below (a)Apollo 15 and (b) Apollo 17 that are consistent with bothApollo HFE values.
Table 1. Mantle Heat Flux and Temperature for Models Consistent With the Apollo HFE (Presented in Section 4) Including ModelPredicted Temperatures at 150 km Depth Below the Apollo 15 and 17 Landing Sites
Heat Flux
One-FourthKREEP
One-HalfKREEP e�5 km Ejecta
One-Fourth KREEP+ e�5 km Ejecta
One-Half KREEP+ e�5 km Ejecta
A15: T at 150 km
A17: T at 150 km
Nominal crust 12mWm�2 10mWm�2 13mWm�2 11mWm�2 9mWm�2
1103K 1100K 1053K 1051K 1048K986K 872K 1046K 932K 819K
e�5 km crust 12mWm�2 10mWm�2 13mWm�2 11mWm�2 9mWm�2
1156K 1047K 1016K 1007K 999K919K 816K 974K 871K 769K
SIEGLER AND SMREKAR: REGIONAL LUNAR HEAT FLOW
58
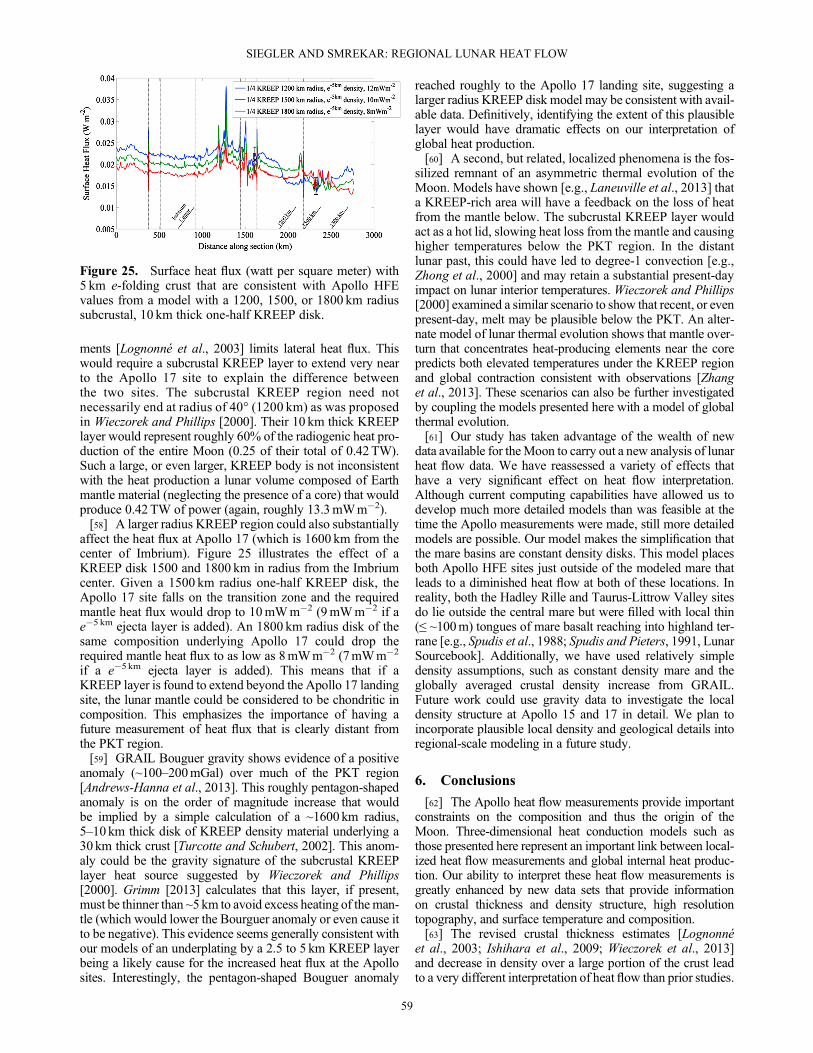
ments [Lognonné et al., 2003] limits lateral heat flux. Thiswould require a subcrustal KREEP layer to extend very nearto the Apollo 17 site to explain the difference betweenthe two sites. The subcrustal KREEP region need notnecessarily end at radius of 40° (1200 km) as was proposedin Wieczorek and Phillips [2000]. Their 10 km thick KREEPlayer would represent roughly 60% of the radiogenic heat pro-duction of the entire Moon (0.25 of their total of 0.42TW).Such a large, or even larger, KREEP body is not inconsistentwith the heat production a lunar volume composed of Earthmantle material (neglecting the presence of a core) that wouldproduce 0.42 TW of power (again, roughly 13.3mWm�2).[58] A larger radius KREEP region could also substantially
affect the heat flux at Apollo 17 (which is 1600 km from thecenter of Imbrium). Figure 25 illustrates the effect of aKREEP disk 1500 and 1800 km in radius from the Imbriumcenter. Given a 1500 km radius one-half KREEP disk, theApollo 17 site falls on the transition zone and the requiredmantle heat flux would drop to 10mWm�2 (9mWm�2 if ae�5 km ejecta layer is added). An 1800 km radius disk of thesame composition underlying Apollo 17 could drop therequired mantle heat flux to as low as 8mWm�2 (7mWm�2
if a e�5 km ejecta layer is added). This means that if aKREEP layer is found to extend beyond the Apollo 17 landingsite, the lunar mantle could be considered to be chondritic incomposition. This emphasizes the importance of having afuture measurement of heat flux that is clearly distant fromthe PKT region.[59] GRAIL Bouguer gravity shows evidence of a positive
anomaly (~100–200mGal) over much of the PKT region[Andrews-Hanna et al., 2013]. This roughly pentagon-shapedanomaly is on the order of magnitude increase that wouldbe implied by a simple calculation of a ~1600 km radius,5–10 km thick disk of KREEP density material underlying a30 km thick crust [Turcotte and Schubert, 2002]. This anom-aly could be the gravity signature of the subcrustal KREEPlayer heat source suggested by Wieczorek and Phillips[2000]. Grimm [2013] calculates that this layer, if present,must be thinner than ~5km to avoid excess heating of the man-tle (which would lower the Bourguer anomaly or even cause itto be negative). This evidence seems generally consistent withour models of an underplating by a 2.5 to 5 km KREEP layerbeing a likely cause for the increased heat flux at the Apollosites. Interestingly, the pentagon-shaped Bouguer anomaly
reached roughly to the Apollo 17 landing site, suggesting alarger radius KREEP disk model may be consistent with avail-able data. Definitively, identifying the extent of this plausiblelayer would have dramatic effects on our interpretation ofglobal heat production.[60] A second, but related, localized phenomena is the fos-
silized remnant of an asymmetric thermal evolution of theMoon. Models have shown [e.g., Laneuville et al., 2013] thata KREEP-rich area will have a feedback on the loss of heatfrom the mantle below. The subcrustal KREEP layer wouldact as a hot lid, slowing heat loss from the mantle and causinghigher temperatures below the PKT region. In the distantlunar past, this could have led to degree-1 convection [e.g.,Zhong et al., 2000] and may retain a substantial present-dayimpact on lunar interior temperatures. Wieczorek and Phillips[2000] examined a similar scenario to show that recent, or evenpresent-day, melt may be plausible below the PKT. An alter-nate model of lunar thermal evolution shows that mantle over-turn that concentrates heat-producing elements near the corepredicts both elevated temperatures under the KREEP regionand global contraction consistent with observations [Zhanget al., 2013]. These scenarios can also be further investigatedby coupling the models presented here with a model of globalthermal evolution.[61] Our study has taken advantage of the wealth of new
data available for theMoon to carry out a new analysis of lunarheat flow data. We have reassessed a variety of effects thathave a very significant effect on heat flow interpretation.Although current computing capabilities have allowed us todevelop much more detailed models than was feasible at thetime the Apollo measurements were made, still more detailedmodels are possible. Our model makes the simplification thatthe mare basins are constant density disks. This model placesboth Apollo HFE sites just outside of the modeled mare thatleads to a diminished heat flow at both of these locations. Inreality, both the Hadley Rille and Taurus-Littrow Valley sitesdo lie outside the central mare but were filled with local thin(≤ ~100m) tongues of mare basalt reaching into highland ter-rane [e.g., Spudis et al., 1988; Spudis and Pieters, 1991, LunarSourcebook]. Additionally, we have used relatively simpledensity assumptions, such as constant density mare and theglobally averaged crustal density increase from GRAIL.Future work could use gravity data to investigate the localdensity structure at Apollo 15 and 17 in detail. We plan toincorporate plausible local density and geological details intoregional-scale modeling in a future study.
6. Conclusions
[62] The Apollo heat flow measurements provide importantconstraints on the composition and thus the origin of theMoon. Three-dimensional heat conduction models such asthose presented here represent an important link between local-ized heat flow measurements and global internal heat produc-tion. Our ability to interpret these heat flow measurements isgreatly enhanced by new data sets that provide informationon crustal thickness and density structure, high resolutiontopography, and surface temperature and composition.[63] The revised crustal thickness estimates [Lognonné
et al., 2003; Ishihara et al., 2009; Wieczorek et al., 2013]and decrease in density over a large portion of the crust leadto a very different interpretation of heat flow than prior studies.
Figure 25. Surface heat flux (watt per square meter) with5 km e-folding crust that are consistent with Apollo HFEvalues from a model with a 1200, 1500, or 1800 km radiussubcrustal, 10 km thick one-half KREEP disk.
SIEGLER AND SMREKAR: REGIONAL LUNAR HEAT FLOW
59
Using the model of crustal density implied by GRAIL results[Wieczorek et al., 2013] and a thin subcrustal KREEP-richlayer, we found that a roughly 9–13mWm�2 mantle heat fluxwould be a most likely case to produce the surface heat fluxobserved at both Apollo sites. Variations in crustal thicknessand the possibility of a near-surface radiogenic-rich ejectablanket were found to have only minor (< 1.5mWm�2)effects on surface heat flow.[64] These values of internal heat flow are larger than
most prior models owing to either global or local effects.If heat flux is elevated globally, this could be due primarilyto the insulating effect of the low-density and low-conductivitymegaregolith suggested by GRAIL rather than simplyhigher radiogenic abundance. The presence of such a layerstrongly suggests that the Moon has retained a significantportion of its early heat. Future studies will need to considerthis possibility and assess the global heat budget related tothicker farside crust and higher conductivity mare bodies.[65] Alternatively, or in addition, the high heat flow values
may be a local (restricted to the PKT) effect due to the pres-ence of subsurface KREEP [Wieczorek and Phillips, 2000].However, new interpretations of crustal thickness meanthat a KREEP layer must be very close to or underlieboth Apollo 15 and 17. If a KREEP layer does underlieboth landing sites, mantle heat flows as low as roughly8mWm�2 (7mWm�2 if including the effects of surfaceradiogenic rich ejecta) are feasible. New gravity analysis [e.g.,Andrews-Hanna et al., 2013] may help constrain the extent ofsuch a high-density layer. Subsurface KREEP could also leadto past subsurface melt [Wieczorek and Phillips, 2000] andpossibly to asymmetric convection [Laneuville et al., 2013].[66] Distinguishing between global or local influences re-
quires heat flow measurements away from the PKT, wheresubcrustal, KREEP-rich material may dominate measured heatflow. The Apollo 17 site is ambiguously close to the edge ofthis region and, if it is not underlain by KREEP, may implya high global heat flux. More remote from this region,Diviner Lunar Radiometer polar surface temperature measure-ments may provide non-PKT constraints on heat flux [Paigeet al., 2010c; Siegler et al., 2012]. Although interpreting thisdata requires detailed three-dimensional modeling, similar tothat in this paper, the initial results suggest regional heat fluxenhancement in the PKT relative to other areas of the Moon.Further examination of this data will better refine the con-straints on non-PKT heat flow. Both the presence of a positiveBouguer anomaly in the PKT region [Andrews-Hanna et al.,2013] and Diviner results [Paige et al., 2010c; Siegler et al.,2012] point toward a regional effect from subsurface KREEPon the Apollo measurements. Future modeling of the long-term thermal evolution in the presence of a low-density crustand detailed analysis of gravity data at the Apollo (andDiviner) heat flow sites will allow us to better access the influ-ence of the global, low-density crustal layer. Finally, futurelanded measurements in areas distant from the PKT will allowfor a detailed understanding of the lunar interior [e.g., Cohenet al., 2008; Neal et al., 2010].
Appendix A: Model Variations in 2-D
[67] The previous models to explain the differences be-tween the Apollo HFE measurements can be summarizedinto four classes: (1) crustal thickness variations, (2) crustal
density and thermal conductivity variations, (3) near-surfaceradiogenic (KREEP) enrichment, and (4) deep radiogenic(KREEP) enrichment. Large temperature changes at depth(~50K) over short distances (~10 km) will also affect heatflow but are only an important factor in the polar regions ofthe Moon.[68] Here we will briefly illustrate the effect these four vari-
ations can have on a simple two-dimensional model. Themodels here represent an idealized crustal cross section100 km across and 60 km deep. The surface is held at a constant250K, a typical temperature at ~1m depth near the equator,and side boundaries reflected to assume an infinite horizontalextent. The lower boundary has been set to 4mWm�2; asuggested value for mantle heat flux [Langseth et al., 1976].For these simple models, thermal properties are arbitrarilythe following: thermal conductivity of 1Wm�1K�1, densityof 2000 kgm�3, and heat capacity of 1000 J kg�1K�1 (whichis not actually important in steady state) unless otherwisenoted. All computations were carried out using the commer-cially available COMSOL finite element package.
A1. Model 1: Crustal Thickness Variations
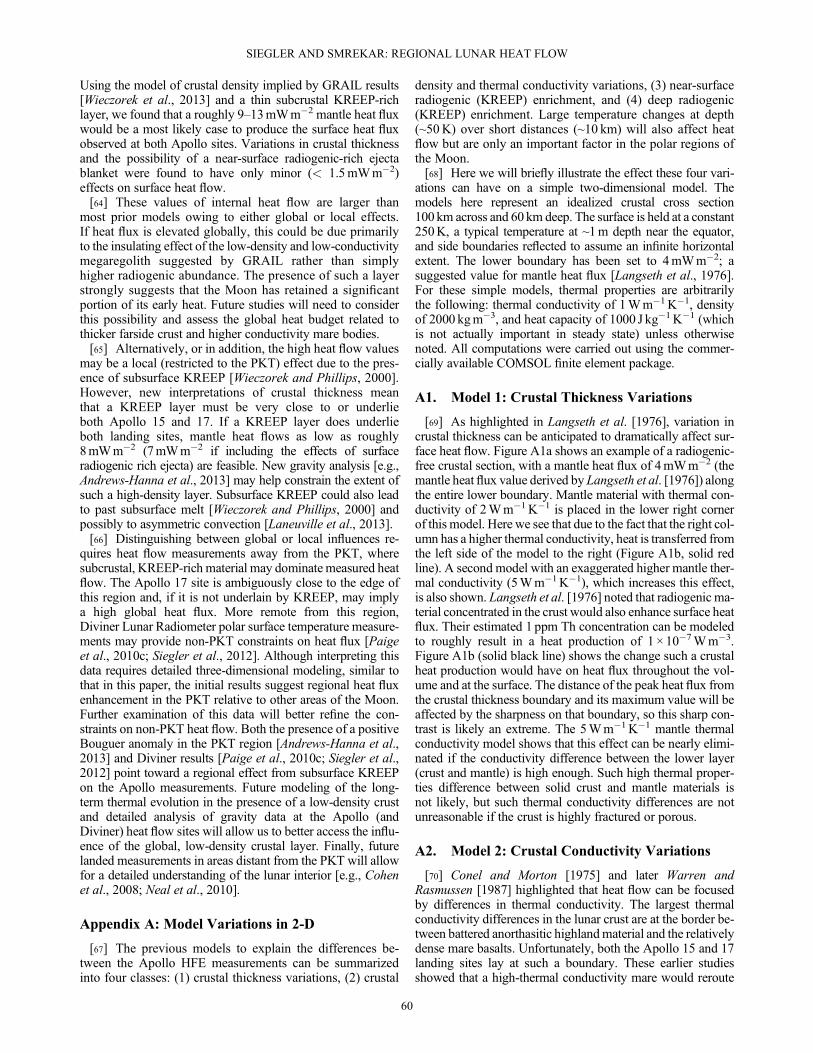
[69] As highlighted in Langseth et al. [1976], variation incrustal thickness can be anticipated to dramatically affect sur-face heat flow. Figure A1a shows an example of a radiogenic-free crustal section, with a mantle heat flux of 4mWm�2 (themantle heat flux value derived by Langseth et al. [1976]) alongthe entire lower boundary. Mantle material with thermal con-ductivity of 2Wm�1K�1 is placed in the lower right cornerof this model. Here we see that due to the fact that the right col-umn has a higher thermal conductivity, heat is transferred fromthe left side of the model to the right (Figure A1b, solid redline). A second model with an exaggerated higher mantle ther-mal conductivity (5Wm�1K�1), which increases this effect,is also shown. Langseth et al. [1976] noted that radiogenic ma-terial concentrated in the crust would also enhance surface heatflux. Their estimated 1 ppm Th concentration can be modeledto roughly result in a heat production of 1 × 10�7Wm�3.Figure A1b (solid black line) shows the change such a crustalheat production would have on heat flux throughout the vol-ume and at the surface. The distance of the peak heat flux fromthe crustal thickness boundary and its maximum value will beaffected by the sharpness on that boundary, so this sharp con-trast is likely an extreme. The 5Wm�1K�1 mantle thermalconductivity model shows that this effect can be nearly elimi-nated if the conductivity difference between the lower layer(crust and mantle) is high enough. Such high thermal proper-ties difference between solid crust and mantle materials isnot likely, but such thermal conductivity differences are notunreasonable if the crust is highly fractured or porous.
A2. Model 2: Crustal Conductivity Variations
[70] Conel and Morton [1975] and later Warren andRasmussen [1987] highlighted that heat flow can be focusedby differences in thermal conductivity. The largest thermalconductivity differences in the lunar crust are at the border be-tween battered anorthasitic highlandmaterial and the relativelydense mare basalts. Unfortunately, both the Apollo 15 and 17landing sites lay at such a boundary. These earlier studiesshowed that a high-thermal conductivity mare would reroute
SIEGLER AND SMREKAR: REGIONAL LUNAR HEAT FLOW
60
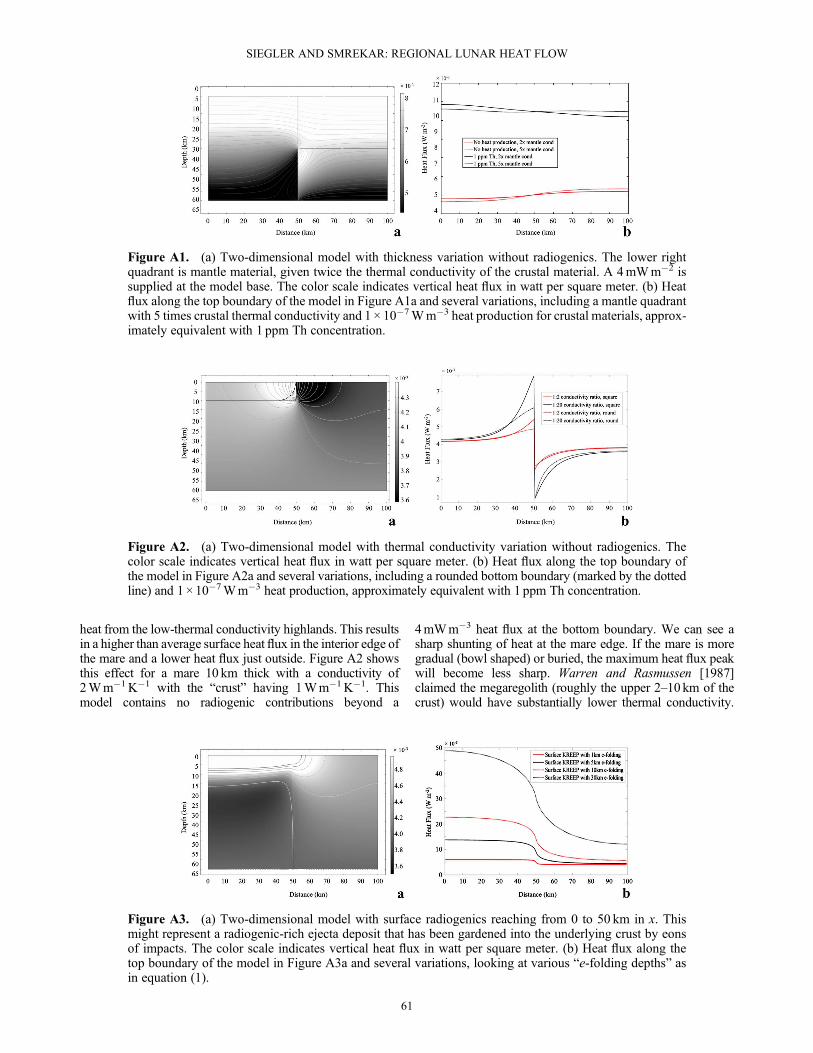
heat from the low-thermal conductivity highlands. This resultsin a higher than average surface heat flux in the interior edge ofthe mare and a lower heat flux just outside. Figure A2 showsthis effect for a mare 10 km thick with a conductivity of2Wm�1K�1 with the “crust” having 1Wm�1K�1. Thismodel contains no radiogenic contributions beyond a
4mWm�3 heat flux at the bottom boundary. We can see asharp shunting of heat at the mare edge. If the mare is moregradual (bowl shaped) or buried, the maximum heat flux peakwill become less sharp. Warren and Rasmussen [1987]claimed the megaregolith (roughly the upper 2–10 km of thecrust) would have substantially lower thermal conductivity.
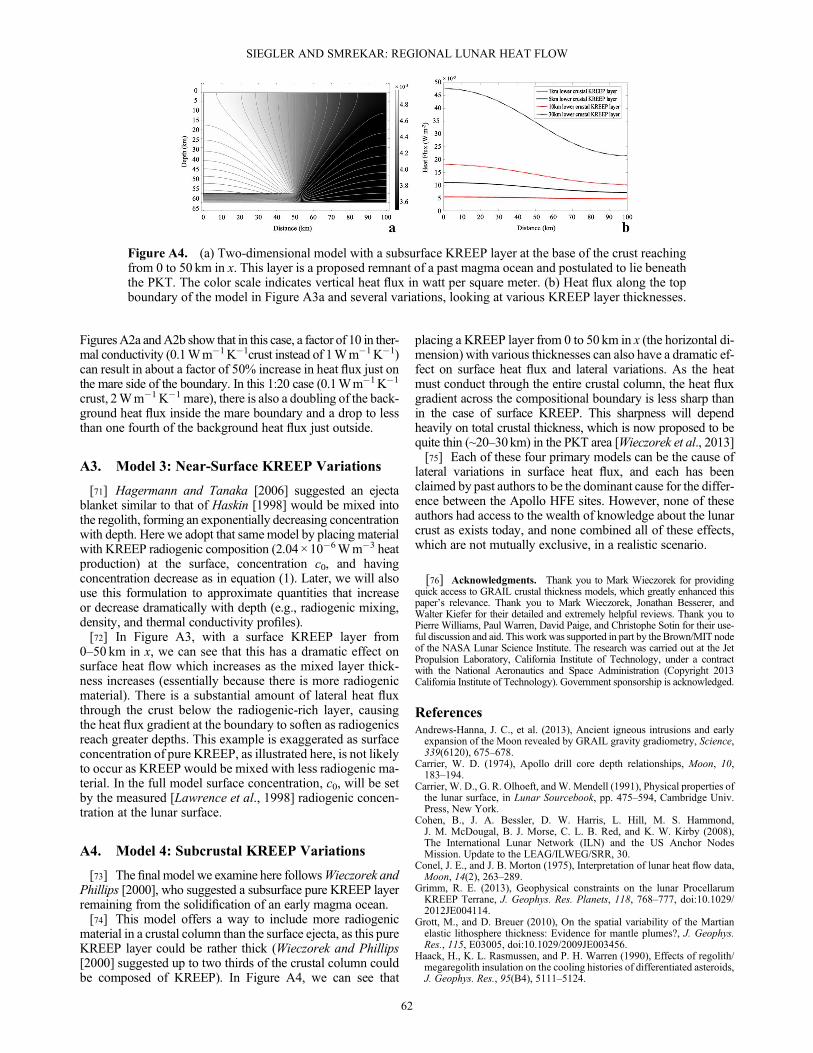
Figure A3. (a) Two-dimensional model with surface radiogenics reaching from 0 to 50 km in x. Thismight represent a radiogenic-rich ejecta deposit that has been gardened into the underlying crust by eonsof impacts. The color scale indicates vertical heat flux in watt per square meter. (b) Heat flux along thetop boundary of the model in Figure A3a and several variations, looking at various “e-folding depths” asin equation (1).
Figure A2. (a) Two-dimensional model with thermal conductivity variation without radiogenics. Thecolor scale indicates vertical heat flux in watt per square meter. (b) Heat flux along the top boundary ofthe model in Figure A2a and several variations, including a rounded bottom boundary (marked by the dottedline) and 1 × 10�7Wm�3 heat production, approximately equivalent with 1 ppm Th concentration.
Figure A1. (a) Two-dimensional model with thickness variation without radiogenics. The lower rightquadrant is mantle material, given twice the thermal conductivity of the crustal material. A 4mWm�2 issupplied at the model base. The color scale indicates vertical heat flux in watt per square meter. (b) Heatflux along the top boundary of the model in Figure A1a and several variations, including a mantle quadrantwith 5 times crustal thermal conductivity and 1 × 10�7Wm�3 heat production for crustal materials, approx-imately equivalent with 1 ppm Th concentration.
SIEGLER AND SMREKAR: REGIONAL LUNAR HEAT FLOW
61
FiguresA2a andA2b show that in this case, a factor of 10 in ther-mal conductivity (0.1Wm�1K�1crust instead of 1Wm�1K�1)can result in about a factor of 50% increase in heat flux just onthe mare side of the boundary. In this 1:20 case (0.1Wm�1K�1
crust, 2Wm�1K�1 mare), there is also a doubling of the back-ground heat flux inside the mare boundary and a drop to lessthan one fourth of the background heat flux just outside.
A3. Model 3: Near-Surface KREEP Variations
[71] Hagermann and Tanaka [2006] suggested an ejectablanket similar to that of Haskin [1998] would be mixed intothe regolith, forming an exponentially decreasing concentrationwith depth. Here we adopt that samemodel by placing materialwith KREEP radiogenic composition (2.04× 10�6Wm�3 heatproduction) at the surface, concentration c0, and havingconcentration decrease as in equation (1). Later, we will alsouse this formulation to approximate quantities that increaseor decrease dramatically with depth (e.g., radiogenic mixing,density, and thermal conductivity profiles).[72] In Figure A3, with a surface KREEP layer from
0–50 km in x, we can see that this has a dramatic effect onsurface heat flow which increases as the mixed layer thick-ness increases (essentially because there is more radiogenicmaterial). There is a substantial amount of lateral heat fluxthrough the crust below the radiogenic-rich layer, causingthe heat flux gradient at the boundary to soften as radiogenicsreach greater depths. This example is exaggerated as surfaceconcentration of pure KREEP, as illustrated here, is not likelyto occur as KREEP would be mixed with less radiogenic ma-terial. In the full model surface concentration, c0, will be setby the measured [Lawrence et al., 1998] radiogenic concen-tration at the lunar surface.
A4. Model 4: Subcrustal KREEP Variations
[73] The final model we examine here followsWieczorek andPhillips [2000], who suggested a subsurface pure KREEP layerremaining from the solidification of an early magma ocean.[74] This model offers a way to include more radiogenic
material in a crustal column than the surface ejecta, as this pureKREEP layer could be rather thick (Wieczorek and Phillips[2000] suggested up to two thirds of the crustal column couldbe composed of KREEP). In Figure A4, we can see that
placing a KREEP layer from 0 to 50 km in x (the horizontal di-mension) with various thicknesses can also have a dramatic ef-fect on surface heat flux and lateral variations. As the heatmust conduct through the entire crustal column, the heat fluxgradient across the compositional boundary is less sharp thanin the case of surface KREEP. This sharpness will dependheavily on total crustal thickness, which is now proposed to bequite thin (~20–30km) in the PKT area [Wieczorek et al., 2013][75] Each of these four primary models can be the cause of
lateral variations in surface heat flux, and each has beenclaimed by past authors to be the dominant cause for the differ-ence between the Apollo HFE sites. However, none of theseauthors had access to the wealth of knowledge about the lunarcrust as exists today, and none combined all of these effects,which are not mutually exclusive, in a realistic scenario.
[76] Acknowledgments. Thank you to Mark Wieczorek for providingquick access to GRAIL crustal thickness models, which greatly enhanced thispaper’s relevance. Thank you to Mark Wieczorek, Jonathan Besserer, andWalter Kiefer for their detailed and extremely helpful reviews. Thank you toPierre Williams, Paul Warren, David Paige, and Christophe Sotin for their use-ful discussion and aid. This work was supported in part by the Brown/MIT nodeof the NASA Lunar Science Institute. The research was carried out at the JetPropulsion Laboratory, California Institute of Technology, under a contractwith the National Aeronautics and Space Administration (Copyright 2013California Institute of Technology). Government sponsorship is acknowledged.
ReferencesAndrews-Hanna, J. C., et al. (2013), Ancient igneous intrusions and earlyexpansion of the Moon revealed by GRAIL gravity gradiometry, Science,339(6120), 675–678.
Carrier, W. D. (1974), Apollo drill core depth relationships, Moon, 10,183–194.
Carrier, W. D., G. R. Olhoeft, andW. Mendell (1991), Physical properties ofthe lunar surface, in Lunar Sourcebook, pp. 475–594, Cambridge Univ.Press, New York.
Cohen, B., J. A. Bessler, D. W. Harris, L. Hill, M. S. Hammond,J. M. McDougal, B. J. Morse, C. L. B. Red, and K. W. Kirby (2008),The International Lunar Network (ILN) and the US Anchor NodesMission. Update to the LEAG/ILWEG/SRR, 30.
Conel, J. E., and J. B. Morton (1975), Interpretation of lunar heat flow data,Moon, 14(2), 263–289.
Grimm, R. E. (2013), Geophysical constraints on the lunar ProcellarumKREEP Terrane, J. Geophys. Res. Planets, 118, 768–777, doi:10.1029/2012JE004114.
Grott, M., and D. Breuer (2010), On the spatial variability of the Martianelastic lithosphere thickness: Evidence for mantle plumes?, J. Geophys.Res., 115, E03005, doi:10.1029/2009JE003456.
Haack, H., K. L. Rasmussen, and P. H. Warren (1990), Effects of regolith/megaregolith insulation on the cooling histories of differentiated asteroids,J. Geophys. Res., 95(B4), 5111–5124.
Figure A4. (a) Two-dimensional model with a subsurface KREEP layer at the base of the crust reachingfrom 0 to 50 km in x. This layer is a proposed remnant of a past magma ocean and postulated to lie beneaththe PKT. The color scale indicates vertical heat flux in watt per square meter. (b) Heat flux along the topboundary of the model in Figure A3a and several variations, looking at various KREEP layer thicknesses.
SIEGLER AND SMREKAR: REGIONAL LUNAR HEAT FLOW
62
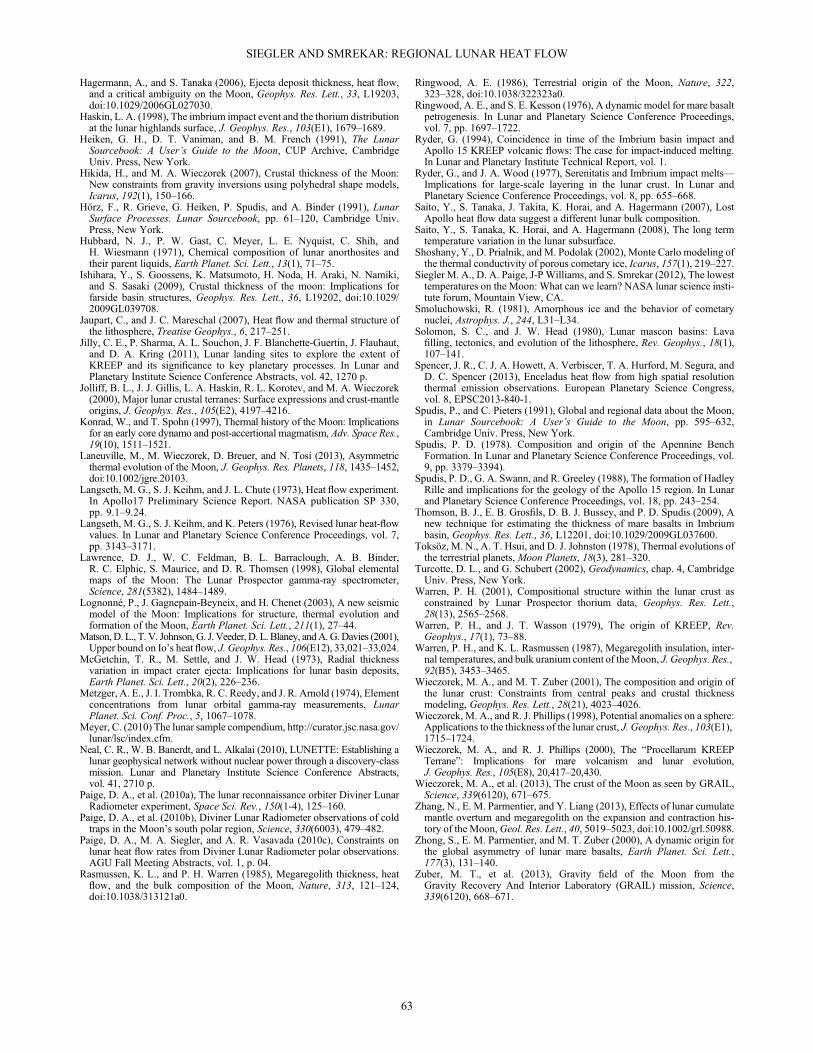
Hagermann, A., and S. Tanaka (2006), Ejecta deposit thickness, heat flow,and a critical ambiguity on the Moon, Geophys. Res. Lett., 33, L19203,doi:10.1029/2006GL027030.
Haskin, L. A. (1998), The imbrium impact event and the thorium distributionat the lunar highlands surface, J. Geophys. Res., 103(E1), 1679–1689.
Heiken, G. H., D. T. Vaniman, and B. M. French (1991), The LunarSourcebook: A User’s Guide to the Moon, CUP Archive, CambridgeUniv. Press, New York.
Hikida, H., and M. A. Wieczorek (2007), Crustal thickness of the Moon:New constraints from gravity inversions using polyhedral shape models,Icarus, 192(1), 150–166.
Hörz, F., R. Grieve, G. Heiken, P. Spudis, and A. Binder (1991), LunarSurface Processes. Lunar Sourcebook, pp. 61–120, Cambridge Univ.Press, New York.
Hubbard, N. J., P. W. Gast, C. Meyer, L. E. Nyquist, C. Shih, andH. Wiesmann (1971), Chemical composition of lunar anorthosites andtheir parent liquids, Earth Planet. Sci. Lett., 13(1), 71–75.
Ishihara, Y., S. Goossens, K. Matsumoto, H. Noda, H. Araki, N. Namiki,and S. Sasaki (2009), Crustal thickness of the moon: Implications forfarside basin structures, Geophys. Res. Lett., 36, L19202, doi:10.1029/2009GL039708.
Jaupart, C., and J. C. Mareschal (2007), Heat flow and thermal structure ofthe lithosphere, Treatise Geophys., 6, 217–251.
Jilly, C. E., P. Sharma, A. L. Souchon, J. F. Blanchette-Guertin, J. Flauhaut,and D. A. Kring (2011), Lunar landing sites to explore the extent ofKREEP and its significance to key planetary processes. In Lunar andPlanetary Institute Science Conference Abstracts, vol. 42, 1270 p.
Jolliff, B. L., J. J. Gillis, L. A. Haskin, R. L. Korotev, and M. A. Wieczorek(2000), Major lunar crustal terranes: Surface expressions and crust-mantleorigins, J. Geophys. Res., 105(E2), 4197–4216.
Konrad, W., and T. Spohn (1997), Thermal history of the Moon: Implicationsfor an early core dynamo and post-accertional magmatism, Adv. Space Res.,19(10), 1511–1521.
Laneuville, M., M. Wieczorek, D. Breuer, and N. Tosi (2013), Asymmetricthermal evolution of the Moon, J. Geophys. Res. Planets, 118, 1435–1452,doi:10.1002/jgre.20103.
Langseth, M. G., S. J. Keihm, and J. L. Chute (1973), Heat flow experiment.In Apollo17 Preliminary Science Report. NASA publication SP 330,pp. 9.1–9.24.
Langseth, M. G., S. J. Keihm, and K. Peters (1976), Revised lunar heat-flowvalues. In Lunar and Planetary Science Conference Proceedings, vol. 7,pp. 3143–3171.
Lawrence, D. J., W. C. Feldman, B. L. Barraclough, A. B. Binder,R. C. Elphic, S. Maurice, and D. R. Thomsen (1998), Global elementalmaps of the Moon: The Lunar Prospector gamma-ray spectrometer,Science, 281(5382), 1484–1489.
Lognonné, P., J. Gagnepain-Beyneix, and H. Chenet (2003), A new seismicmodel of the Moon: Implications for structure, thermal evolution andformation of the Moon, Earth Planet. Sci. Lett., 211(1), 27–44.
Matson,D. L., T. V. Johnson,G. J.Veeder, D. L.Blaney, andA.G.Davies (2001),Upper bound on Io’s heat flow, J. Geophys. Res., 106(E12), 33,021–33,024.
McGetchin, T. R., M. Settle, and J. W. Head (1973), Radial thicknessvariation in impact crater ejecta: Implications for lunar basin deposits,Earth Planet. Sci. Lett., 20(2), 226–236.
Metzger, A. E., J. I. Trombka, R. C. Reedy, and J. R. Arnold (1974), Elementconcentrations from lunar orbital gamma-ray measurements, LunarPlanet. Sci. Conf. Proc., 5, 1067–1078.
Meyer, C. (2010) The lunar sample compendium, http://curator.jsc.nasa.gov/lunar/lsc/index.cfm.
Neal, C. R., W. B. Banerdt, and L. Alkalai (2010), LUNETTE: Establishing alunar geophysical network without nuclear power through a discovery-classmission. Lunar and Planetary Institute Science Conference Abstracts,vol. 41, 2710 p.
Paige, D. A., et al. (2010a), The lunar reconnaissance orbiter Diviner LunarRadiometer experiment, Space Sci. Rev., 150(1-4), 125–160.
Paige, D. A., et al. (2010b), Diviner Lunar Radiometer observations of coldtraps in the Moon’s south polar region, Science, 330(6003), 479–482.
Paige, D. A., M. A. Siegler, and A. R. Vasavada (2010c), Constraints onlunar heat flow rates from Diviner Lunar Radiometer polar observations.AGU Fall Meeting Abstracts, vol. 1, p. 04.
Rasmussen, K. L., and P. H. Warren (1985), Megaregolith thickness, heatflow, and the bulk composition of the Moon, Nature, 313, 121–124,doi:10.1038/313121a0.
Ringwood, A. E. (1986), Terrestrial origin of the Moon, Nature, 322,323–328, doi:10.1038/322323a0.
Ringwood, A. E., and S. E. Kesson (1976), A dynamic model for mare basaltpetrogenesis. In Lunar and Planetary Science Conference Proceedings,vol. 7, pp. 1697–1722.
Ryder, G. (1994), Coincidence in time of the Imbrium basin impact andApollo 15 KREEP volcanic flows: The case for impact-induced melting.In Lunar and Planetary Institute Technical Report, vol. 1.
Ryder, G., and J. A. Wood (1977), Serenitatis and Imbrium impact melts—Implications for large-scale layering in the lunar crust. In Lunar andPlanetary Science Conference Proceedings, vol. 8, pp. 655–668.
Saito, Y., S. Tanaka, J. Takita, K. Horai, and A. Hagermann (2007), LostApollo heat flow data suggest a different lunar bulk composition.
Saito, Y., S. Tanaka, K. Horai, and A. Hagermann (2008), The long termtemperature variation in the lunar subsurface.
Shoshany, Y., D. Prialnik, and M. Podolak (2002), Monte Carlo modeling ofthe thermal conductivity of porous cometary ice, Icarus, 157(1), 219–227.
Siegler M. A., D. A. Paige, J-P Williams, and S. Smrekar (2012), The lowesttemperatures on the Moon: What can we learn? NASA lunar science insti-tute forum, Mountain View, CA.
Smoluchowski, R. (1981), Amorphous ice and the behavior of cometarynuclei, Astrophys. J., 244, L31–L34.
Solomon, S. C., and J. W. Head (1980), Lunar mascon basins: Lavafilling, tectonics, and evolution of the lithosphere, Rev. Geophys., 18(1),107–141.
Spencer, J. R., C. J. A. Howett, A. Verbiscer, T. A. Hurford, M. Segura, andD. C. Spencer (2013), Enceladus heat flow from high spatial resolutionthermal emission observations. European Planetary Science Congress,vol. 8, EPSC2013-840-1.
Spudis, P., and C. Pieters (1991), Global and regional data about the Moon,in Lunar Sourcebook: A User’s Guide to the Moon, pp. 595–632,Cambridge Univ. Press, New York.
Spudis, P. D. (1978). Composition and origin of the Apennine BenchFormation. In Lunar and Planetary Science Conference Proceedings, vol.9, pp. 3379–3394).
Spudis, P. D., G. A. Swann, and R. Greeley (1988), The formation of HadleyRille and implications for the geology of the Apollo 15 region. In Lunarand Planetary Science Conference Proceedings, vol. 18, pp. 243–254.
Thomson, B. J., E. B. Grosfils, D. B. J. Bussey, and P. D. Spudis (2009), Anew technique for estimating the thickness of mare basalts in Imbriumbasin, Geophys. Res. Lett., 36, L12201, doi:10.1029/2009GL037600.
Toksöz, M. N., A. T. Hsui, and D. J. Johnston (1978), Thermal evolutions ofthe terrestrial planets, Moon Planets, 18(3), 281–320.
Turcotte, D. L., and G. Schubert (2002), Geodynamics, chap. 4, CambridgeUniv. Press, New York.
Warren, P. H. (2001), Compositional structure within the lunar crust asconstrained by Lunar Prospector thorium data, Geophys. Res. Lett.,28(13), 2565–2568.
Warren, P. H., and J. T. Wasson (1979), The origin of KREEP, Rev.Geophys., 17(1), 73–88.
Warren, P. H., and K. L. Rasmussen (1987), Megaregolith insulation, inter-nal temperatures, and bulk uranium content of theMoon, J. Geophys. Res.,92(B5), 3453–3465.
Wieczorek, M. A., and M. T. Zuber (2001), The composition and origin ofthe lunar crust: Constraints from central peaks and crustal thicknessmodeling, Geophys. Res. Lett., 28(21), 4023–4026.
Wieczorek, M. A., and R. J. Phillips (1998), Potential anomalies on a sphere:Applications to the thickness of the lunar crust, J. Geophys. Res., 103(E1),1715–1724.
Wieczorek, M. A., and R. J. Phillips (2000), The “Procellarum KREEPTerrane”: Implications for mare volcanism and lunar evolution,J. Geophys. Res., 105(E8), 20,417–20,430.
Wieczorek, M. A., et al. (2013), The crust of the Moon as seen by GRAIL,Science, 339(6120), 671–675.
Zhang, N., E. M. Parmentier, and Y. Liang (2013), Effects of lunar cumulatemantle overturn and megaregolith on the expansion and contraction his-tory of the Moon,Geol. Res. Lett., 40, 5019–5023, doi:10.1002/grl.50988.
Zhong, S., E. M. Parmentier, and M. T. Zuber (2000), A dynamic origin forthe global asymmetry of lunar mare basalts, Earth Planet. Sci. Lett.,177(3), 131–140.
Zuber, M. T., et al. (2013), Gravity field of the Moon from theGravity Recovery And Interior Laboratory (GRAIL) mission, Science,339(6120), 668–671.
SIEGLER AND SMREKAR: REGIONAL LUNAR HEAT FLOW
63