lte phy -alcatel
TRANSCRIPT
From LTE basics to 9155 LTE RF Design
September 2009

All Rights Reserved © Alcatel-Lucent 2008, XXXXX2 | Presentation Title | Month 2008
LTE Basics
OFDM Fundamentals

All Rights Reserved © Alcatel-Lucent 2008, XXXXX3 | Presentation Title | Month 2008

All Rights Reserved © Alcatel-Lucent 2008, XXXXX4 | Presentation Title | Month 2008
Basic of OFDM

All Rights Reserved © Alcatel-Lucent 2008, XXXXX5 | Presentation Title | Month 2008
Basic of OFDMWaveform

All Rights Reserved © Alcatel-Lucent 2008, XXXXX6 | Presentation Title | Month 2008
Basic of OFDMSending modulation symbol in parallel
All Rights Reserved © Alcatel-Lucent 2008, XXXXX7 | Presentation Title | Month 2008
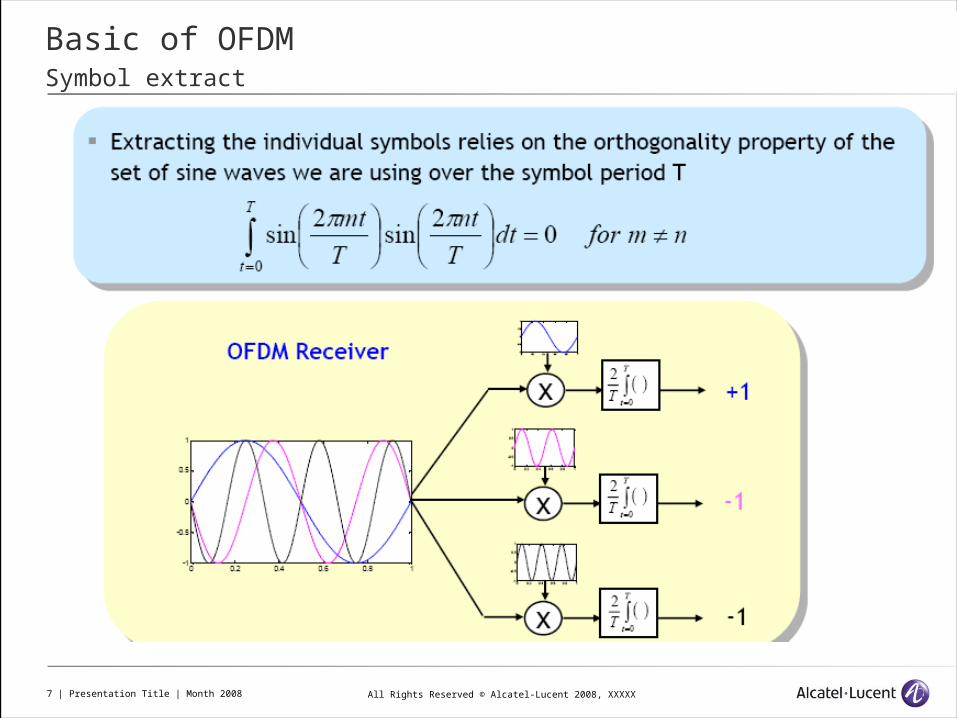
Basic of OFDMSymbol extract

All Rights Reserved © Alcatel-Lucent 2008, XXXXX8 | Presentation Title | Month 2008
Basic of OFDM

All Rights Reserved © Alcatel-Lucent 2008, XXXXX9 | Presentation Title | Month 2008
Basic of OFDMOrthogonality lost
All Rights Reserved © Alcatel-Lucent 2008, XXXXX10 | Presentation Title | Month 2008
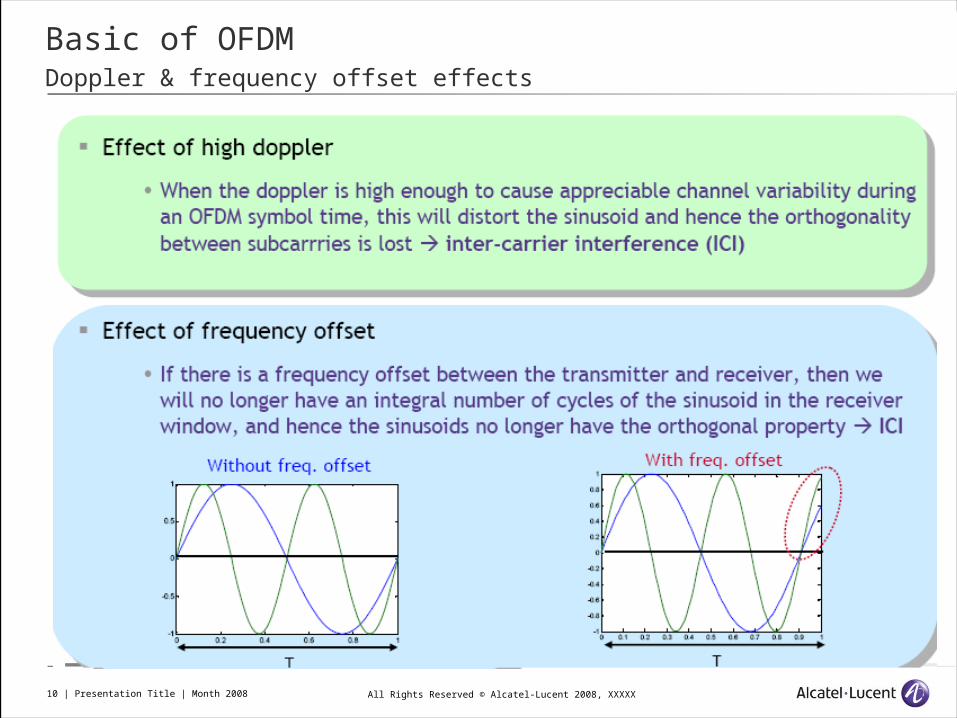
Basic of OFDMDoppler & frequency offset effects

All Rights Reserved © Alcatel-Lucent 2008, XXXXX11 | Presentation Title | Month 2008
Basic of OFDMMulti-path effect

All Rights Reserved © Alcatel-Lucent 2008, XXXXX12 | Presentation Title | Month 2008
Basic of OFDMMulti-path effect
All Rights Reserved © Alcatel-Lucent 2008, XXXXX13 | Presentation Title | Month 2008
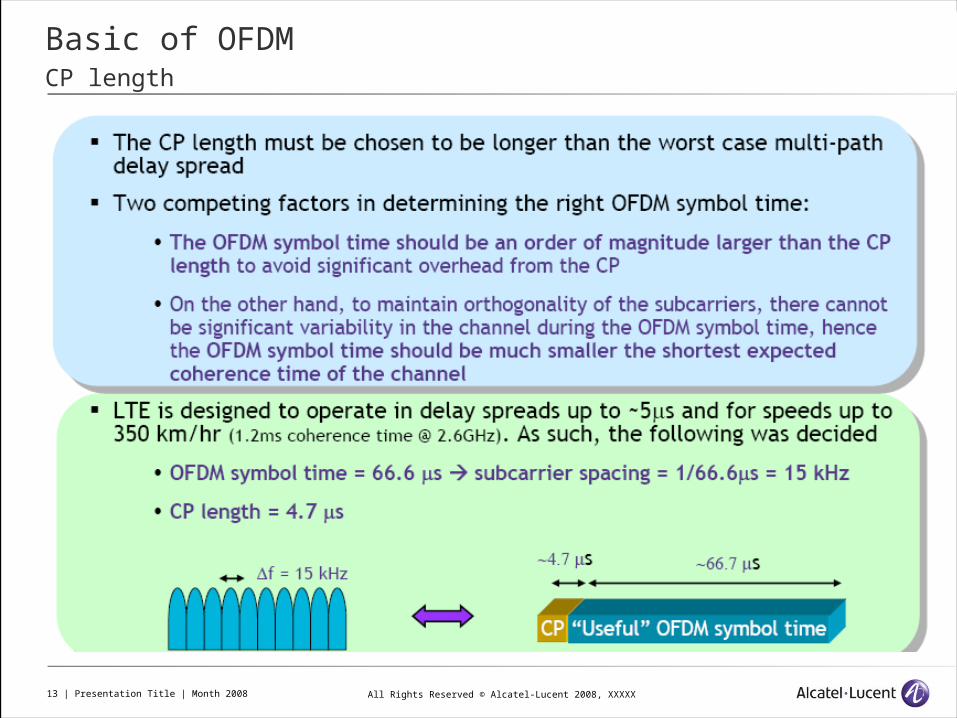
Basic of OFDMCP length

All Rights Reserved © Alcatel-Lucent 2008, XXXXX14 | Presentation Title | Month 2008
Basic of OFDMOFDM scalable

All Rights Reserved © Alcatel-Lucent 2008, XXXXX15 | Presentation Title | Month 2008
Basic of OFDMFull Tx/Rx chain

All Rights Reserved © Alcatel-Lucent 2008, XXXXX16 | Presentation Title | Month 2008
LTE Basics
DOWNLINK STRUCTURE

All Rights Reserved © Alcatel-Lucent 2008, XXXXX17 | Presentation Title | Month 2008
DL Physical Channels

All Rights Reserved © Alcatel-Lucent 2008, XXXXX18 | Presentation Title | Month 2008
DL Channels Mapping

All Rights Reserved © Alcatel-Lucent 2008, XXXXX19 | Presentation Title | Month 2008
LTE Downlink: Frame Format, Channel Structure & Terminology

All Rights Reserved © Alcatel-Lucent 2008, XXXXX20 | Presentation Title | Month 2008
LTE Downlink: Number of Resource Blocks & Numerology

All Rights Reserved © Alcatel-Lucent 2008, XXXXX21 | Presentation Title | Month 2008
Downlink common Reference Signal structure
Reference signal symbol distribution sequence over 12 subcarriers x 14 OFDM symbols.
The Reference signal sequence is correlated to Cell ID.

All Rights Reserved © Alcatel-Lucent 2008, XXXXX22 | Presentation Title | Month 2008
Downlink common Reference Signal structure per number of antenna port

All Rights Reserved © Alcatel-Lucent 2008, XXXXX23 | Presentation Title | Month 2008
PBCH, SCH Time and frequency location

All Rights Reserved © Alcatel-Lucent 2008, XXXXX24 | Presentation Title | Month 2008
Basic of cell search

All Rights Reserved © Alcatel-Lucent 2008, XXXXX25 | Presentation Title | Month 2008
Primary BCH & Dynamic BCH

All Rights Reserved © Alcatel-Lucent 2008, XXXXX26 | Presentation Title | Month 2008
Primary BCH & Dynamic BCH

All Rights Reserved © Alcatel-Lucent 2008, XXXXX27 | Presentation Title | Month 2008
PCFICH & PHICH

All Rights Reserved © Alcatel-Lucent 2008, XXXXX28 | Presentation Title | Month 2008
PDCCH
All Rights Reserved © Alcatel-Lucent 2008, XXXXX29 | Presentation Title | Month 2008
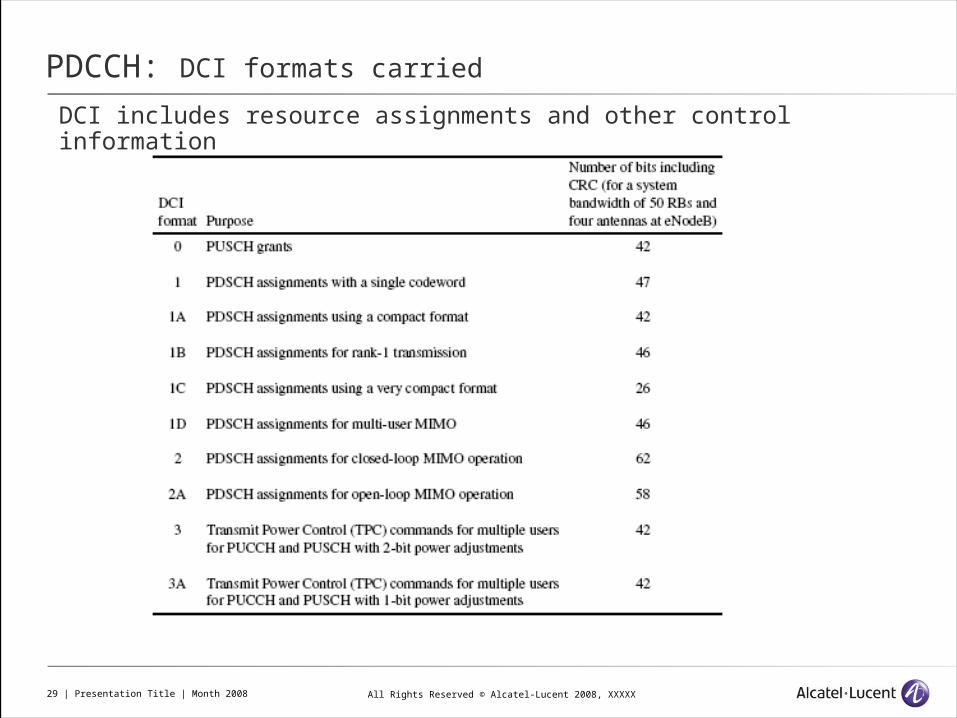
PDCCH: DCI formats carried
DCI includes resource assignments and other control information

All Rights Reserved © Alcatel-Lucent 2008, XXXXX30 | Presentation Title | Month 2008
Downlink Shared Channel (DL-SCH)
All Rights Reserved © Alcatel-Lucent 2008, XXXXX31 | Presentation Title | Month 2008
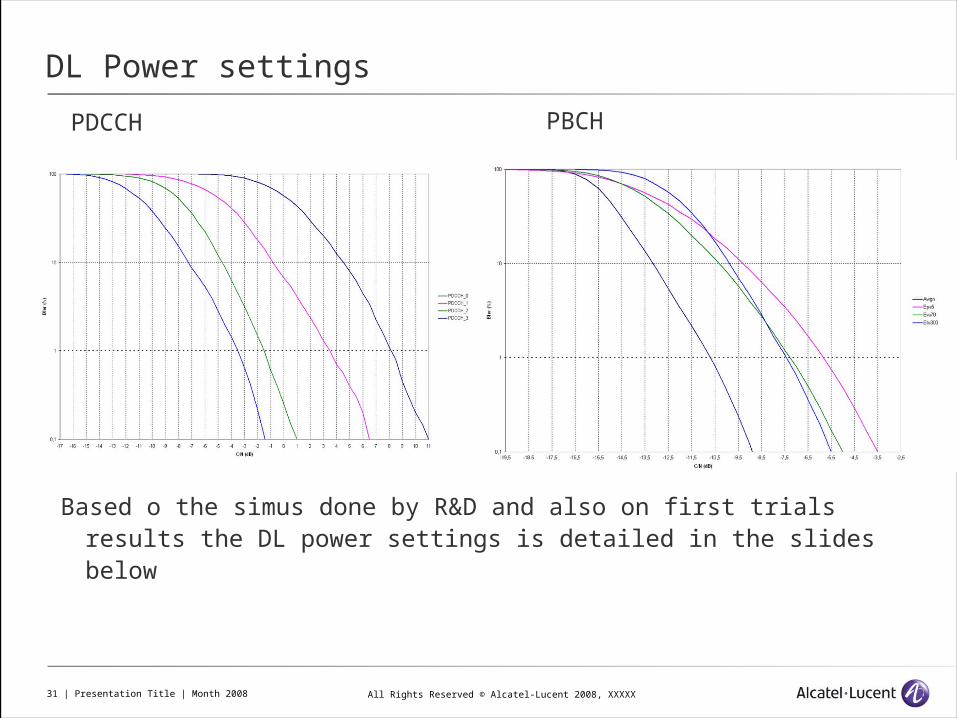
DL Power settings
PDCCH PBCH
Based o the simus done by R&D and also on first trials results the DL power settings is detailed in the slides below
All Rights Reserved © Alcatel-Lucent 2008, XXXXX32 | Presentation Title | Month 2008
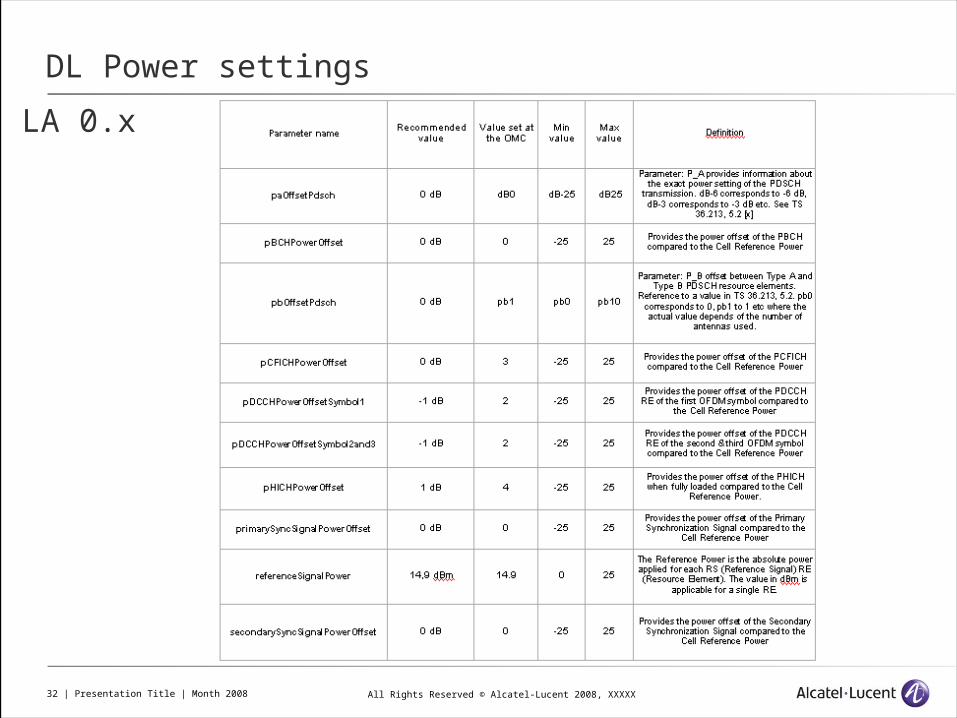
DL Power settings
LA 0.x
All Rights Reserved © Alcatel-Lucent 2008, XXXXX33 | Presentation Title | Month 2008
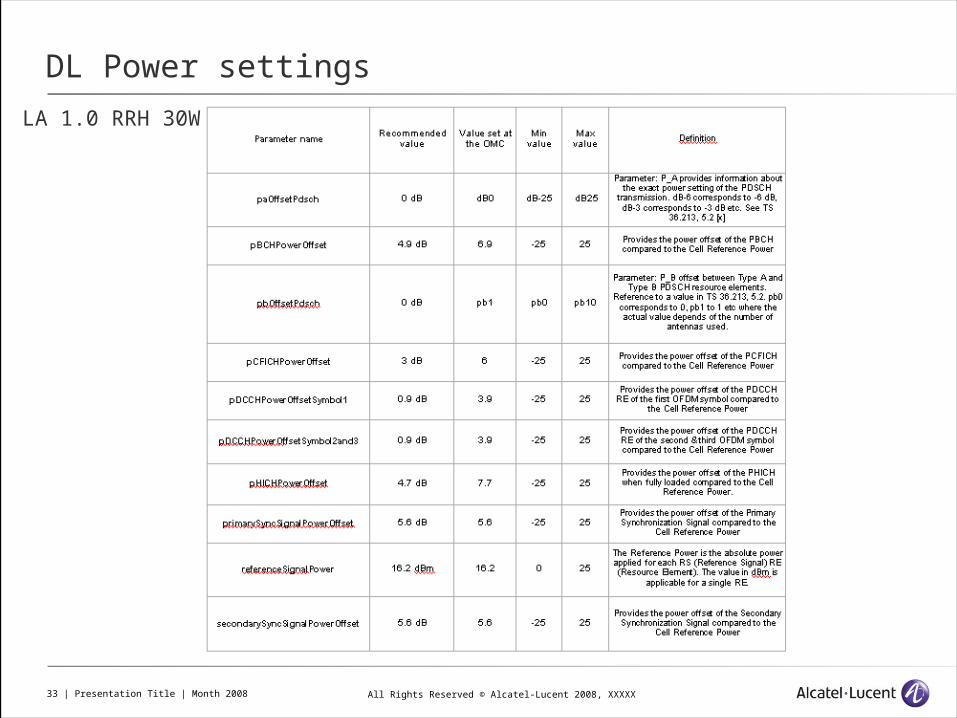
DL Power settings
LA 1.0 RRH 30W

All Rights Reserved © Alcatel-Lucent 2008, XXXXX34 | Presentation Title | Month 2008
DL Power settings
LA 1.0 RRH 40W

All Rights Reserved © Alcatel-Lucent 2008, XXXXX35 | Presentation Title | Month 2008
LTE Basics
UPLINK STRUCTURE

All Rights Reserved © Alcatel-Lucent 2008, XXXXX36 | Presentation Title | Month 2008
UL Physical Channels

All Rights Reserved © Alcatel-Lucent 2008, XXXXX37 | Presentation Title | Month 2008
UL Channels Mapping

All Rights Reserved © Alcatel-Lucent 2008, XXXXX38 | Presentation Title | Month 2008
SC-FDMA principle

All Rights Reserved © Alcatel-Lucent 2008, XXXXX39 | Presentation Title | Month 2008
SC-FDMA principle
All Rights Reserved © Alcatel-Lucent 2008, XXXXX40 | Presentation Title | Month 2008
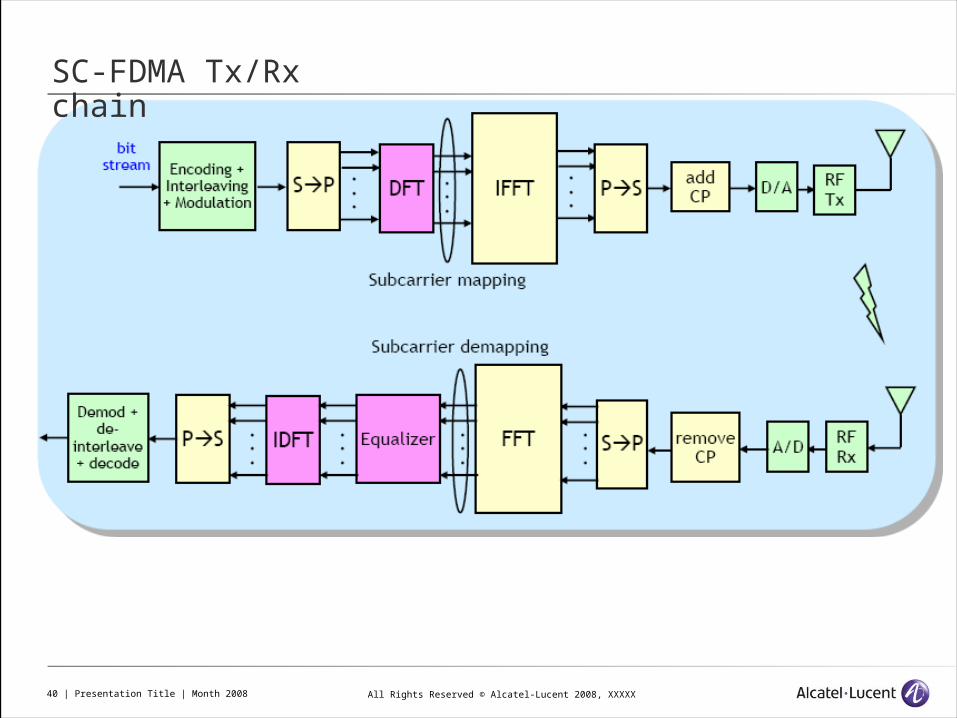
SC-FDMA Tx/Rx chain

All Rights Reserved © Alcatel-Lucent 2008, XXXXX41 | Presentation Title | Month 2008
LTE Uplink: Number of Resource Blocks & Numerology

All Rights Reserved © Alcatel-Lucent 2008, XXXXX42 | Presentation Title | Month 2008
Demodulation Reference Signal & Sounding Reference Signal

All Rights Reserved © Alcatel-Lucent 2008, XXXXX43 | Presentation Title | Month 2008
Demodulation Reference Signal & Sounding Reference Signal

All Rights Reserved © Alcatel-Lucent 2008, XXXXX44 | Presentation Title | Month 2008
PUCCH

All Rights Reserved © Alcatel-Lucent 2008, XXXXX45 | Presentation Title | Month 2008
PUCCH

All Rights Reserved © Alcatel-Lucent 2008, XXXXX46 | Presentation Title | Month 2008
PUCCH

All Rights Reserved © Alcatel-Lucent 2008, XXXXX47 | Presentation Title | Month 2008
PRACH

All Rights Reserved © Alcatel-Lucent 2008, XXXXX48 | Presentation Title | Month 2008
Radom Access procedures

All Rights Reserved © Alcatel-Lucent 2008, XXXXX49 | Presentation Title | Month 2008
LTE Basics
UL Power Control

All Rights Reserved © Alcatel-Lucent 2008, XXXXX50 | Presentation Title | Month 2008
IoT Control Mechanism (Inter-cell Power Control)
Setting of Target_SINR_dB determines the IoT operating point Especially in a reuse-1 deployment, it is critical to manage the uplink
interference level In LTE, e-NBs can send uplink overload indications to neighbor e-NBs via the
X2 interface Power control parameters (i.e. Target SINR) can be adapted based on
overload indicators Allows control of the IoT level to ensure coverage and system stability
PC params PC paramsMeasure
Interference, emit overload
indicator
Based on overload
indicator from neighbor cell,
adapt PC paramsinterference
Overload indicator (X-2
interface)

All Rights Reserved © Alcatel-Lucent 2008, XXXXX51 | Presentation Title | Month 2008
Fractional Power Control
While using the same target SINR for each user results in very good fairness (as far as power allocation is concerned), it also results in poor spectral efficiency
An improved power control scheme called Fractional Power Control adjusts the target SINR in relation to the UE’s path loss to its serving sector
UE_TxPSD_dBm = x PL_dB + Nominal_Target_SINR_dB + UL_Interference_dBm
is called the fractional compensation factor, and is sent via cell broadcast; 0 < < 1
Target SINR
Target_SINR_dB = Nominal_Target_SINR_dB - (1-) x
PL_dBTarget SINR increases with decreasing path
loss
Flexible trade-off between cell edge rate and average spectral efficiency

All Rights Reserved © Alcatel-Lucent 2008, XXXXX52 | Presentation Title | Month 2008
Improved Power Control Based on Neighbor Cell Path Loss
Path loss to the serving cell is not indicative of the amount of interference a user will generate to neighboring sectors
An improved power control scheme adjusts the target SINR in relation to PL_dB = PL_strongestNeighborCell_dB – PL_servingCell_dB
UE_TxPSD_dBm = PL_dB + Nominal_Target_SINR_dB + (1-) x PL_dB + UL_Interference_dBm
(1-) x PL_dB is sent to each UE via higher layer (RRC) signaling
Target SINRTarget_SINR_dB =
Nominal_Target_SINR_dB + (1-) x PL_dB
Target SINR increases with increasing “radio position”

All Rights Reserved © Alcatel-Lucent 2008, XXXXX53 | Presentation Title | Month 2008
LTE Basics
Scheduler

All Rights Reserved © Alcatel-Lucent 2008, XXXXX54 | Presentation Title | Month 2008
Scheduler

All Rights Reserved © Alcatel-Lucent 2008, XXXXX55 | Presentation Title | Month 2008
UL Scheduling mechanism

All Rights Reserved © Alcatel-Lucent 2008, XXXXX56 | Presentation Title | Month 2008
DL Scheduling mechanism

All Rights Reserved © Alcatel-Lucent 2008, XXXXX57 | Presentation Title | Month 2008
Channel Quality Indicator, Pre-coding Matrix Indicator, Rank Indicator

All Rights Reserved © Alcatel-Lucent 2008, XXXXX58 | Presentation Title | Month 2008
Scheduler weighted proportional fair

All Rights Reserved © Alcatel-Lucent 2008, XXXXX59 | Presentation Title | Month 2008
Scheduler proportional fair principles

All Rights Reserved © Alcatel-Lucent 2008, XXXXX60 | Presentation Title | Month 2008
Scheduler proportional fair principles

All Rights Reserved © Alcatel-Lucent 2008, XXXXX61 | Presentation Title | Month 2008
Scheduler proportional fair principles

All Rights Reserved © Alcatel-Lucent 2008, XXXXX62 | Presentation Title | Month 2008
Scheduler proportional fair principles

All Rights Reserved © Alcatel-Lucent 2008, XXXXX63 | Presentation Title | Month 2008
Frequency Non-Selective Scheme
The SRS SYNC SINR is a scalar quantity per user that is formed by averaging the SRS SINR across PRBs and then filtered in time; used to form a single priority metric, which is replicated and used for all PRBs
To support a large number of UEs, the SRS period needs to be reduced given the multiplexing
capabilities (max of 8 UEs per SRS transmission per frequency comb)
The regular MPE algorithm as in the FSS algorithm is then utilized, which minimizes testing/verification to just the new code introduced
Currently also investigating an intermediate solution where the resolution of the frequency selective scheduler is reduced by a certain factor in order to retain some frequency selectivenessin the scheduling while reducing complexity (study in progress)
Single priority metric formed and used in the first stage of the MPE algorithm
Then MPE algorithm continues as in FSS scheme
12
34
56
78
9
UE 1
UE 2
UE 30
1
2
3
4
5
6
Priority Metric
Resource Unit Index
UE 1
UE 2
UE 3
All Rights Reserved © Alcatel-Lucent 2008, XXXXX64 | Presentation Title | Month 2008
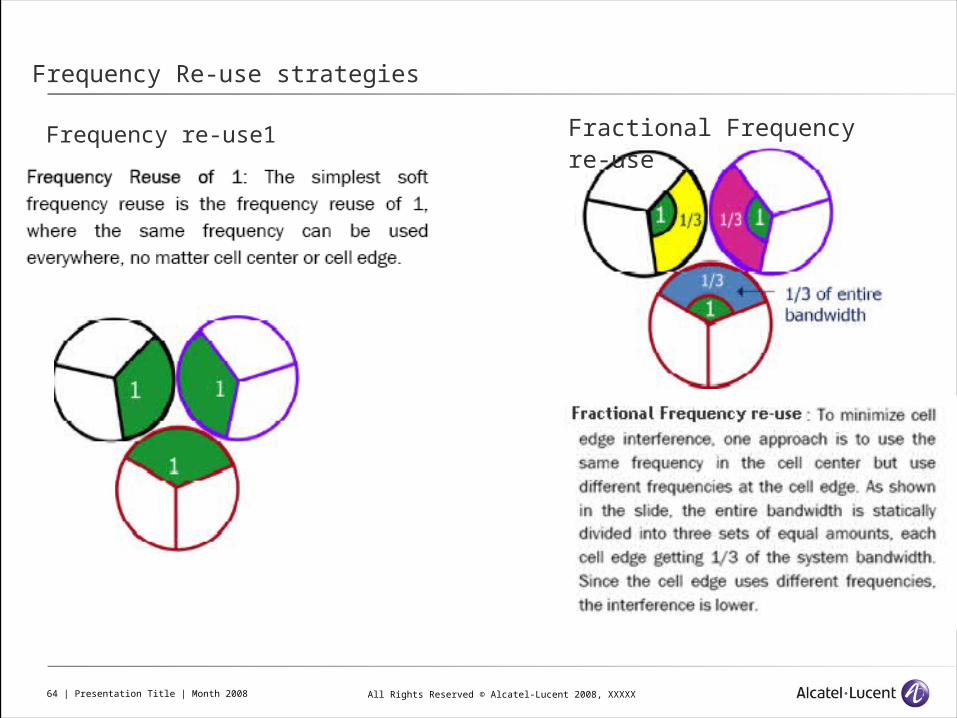
Frequency Re-use strategies
Frequency re-use1 Fractional Frequency re-use

All Rights Reserved © Alcatel-Lucent 2008, XXXXX65 | Presentation Title | Month 2008
Frequency Re-use strategies
Soft Frequency re-use or dynamic frequency re-use

All Rights Reserved © Alcatel-Lucent 2008, XXXXX66 | Presentation Title | Month 2008
LTE Basics
Link adaptation
All Rights Reserved © Alcatel-Lucent 2008, XXXXX67 | Presentation Title | Month 2008
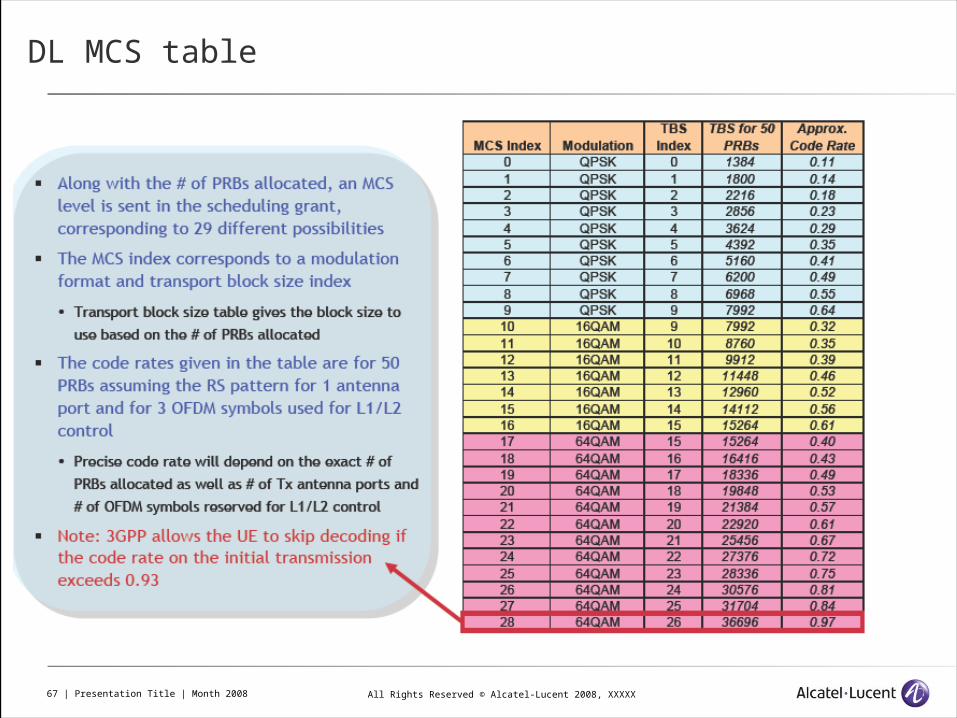
DL MCS table

All Rights Reserved © Alcatel-Lucent 2008, XXXXX68 | Presentation Title | Month 2008
UL MCS table

All Rights Reserved © Alcatel-Lucent 2008, XXXXX69 | Presentation Title | Month 2008
LTE Basics
Multi Antenna Technology Roadmap

All Rights Reserved © Alcatel-Lucent 2008, XXXXX70 | Presentation Title | Month 2008
MIMO Configuration

All Rights Reserved © Alcatel-Lucent 2008, XXXXX71 | Presentation Title | Month 2008
Antennas Configuration

All Rights Reserved © Alcatel-Lucent 2008, XXXXX72 | Presentation Title | Month 2008
Antennas Configuration

All Rights Reserved © Alcatel-Lucent 2008, XXXXX73 | Presentation Title | Month 2008
Spatial Multiplexing

All Rights Reserved © Alcatel-Lucent 2008, XXXXX74 | Presentation Title | Month 2008
LA1.0 Scheme supported
All Rights Reserved © Alcatel-Lucent 2008, XXXXX75 | Presentation Title | Month 2008
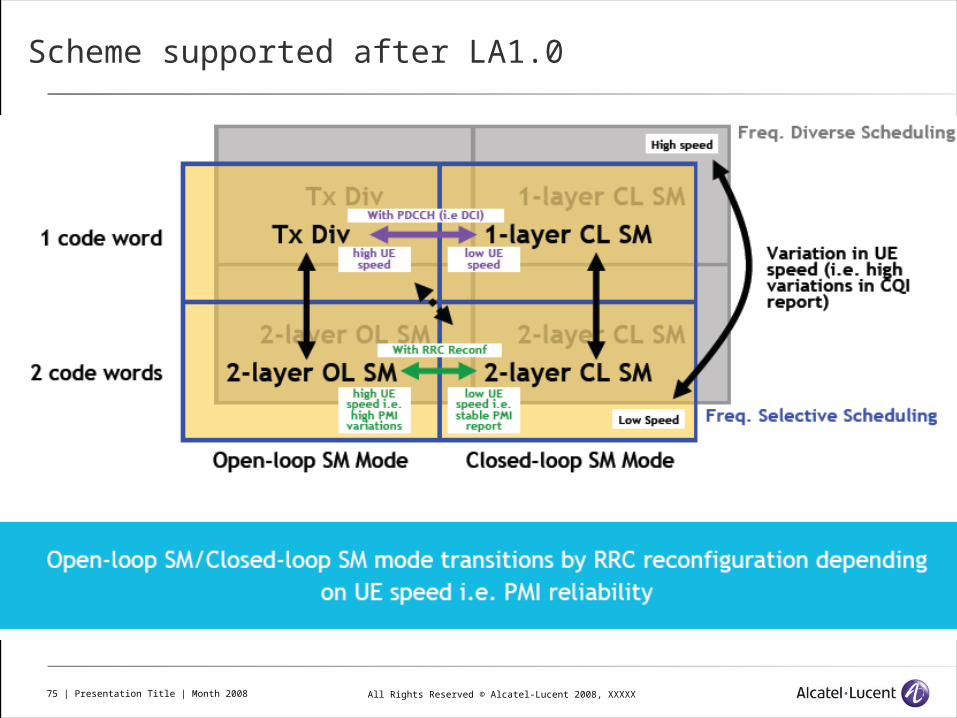
Scheme supported after LA1.0

LTE Link Budgets Uplink Link Budget Considerations

All Rights Reserved © Alcatel-Lucent 2008, XXXXX77 | Presentation Title | Month 2008
Uplink Link Budget
Main Principles
Link Budget is performed for one mobile located at cell edge (for each service) transmitting at max power
The IoT (Interference over Thermal Noise) experienced by this user on the UL depends on the frequency reuse scheme and the service data rate and corresponding SINR that is guaranteed for cell edge users
cell radius
MAPL
Required Received Signal
Max UE transmit PowerUPLINK Analysis is an MAPL analysis
UPLINK Analysis is an MAPL analysis

All Rights Reserved © Alcatel-Lucent 2008, XXXXX78 | Presentation Title | Month 2008
Uplink Link Budget
Main Principles
Receiver SensitivityReceiver
SensitivityTransmit
PowerTransmit
PowerLosses and Margins
Losses and Margins GainsGains InterferenceInterference
Feeder losses
Penetration Loss (outdoor/indoor)
Shadowing Margin
Handoff Gain
Body Loss
eNode-B Antenna
Gain
UE Antenna Gain
Derived from SINR
performances
Interference Margin
= MAPL
UE Transmitpower
(23dBm)
Uplink Path
Maximum Allowable Path Loss
UL link budget elaborated for user of service k at cell edge transmitting at maximum power
All Rights Reserved © Alcatel-Lucent 2008, XXXXX79 | Presentation Title | Month 2008
Uplink Link Budget
Rationale Behind LKB Formulation
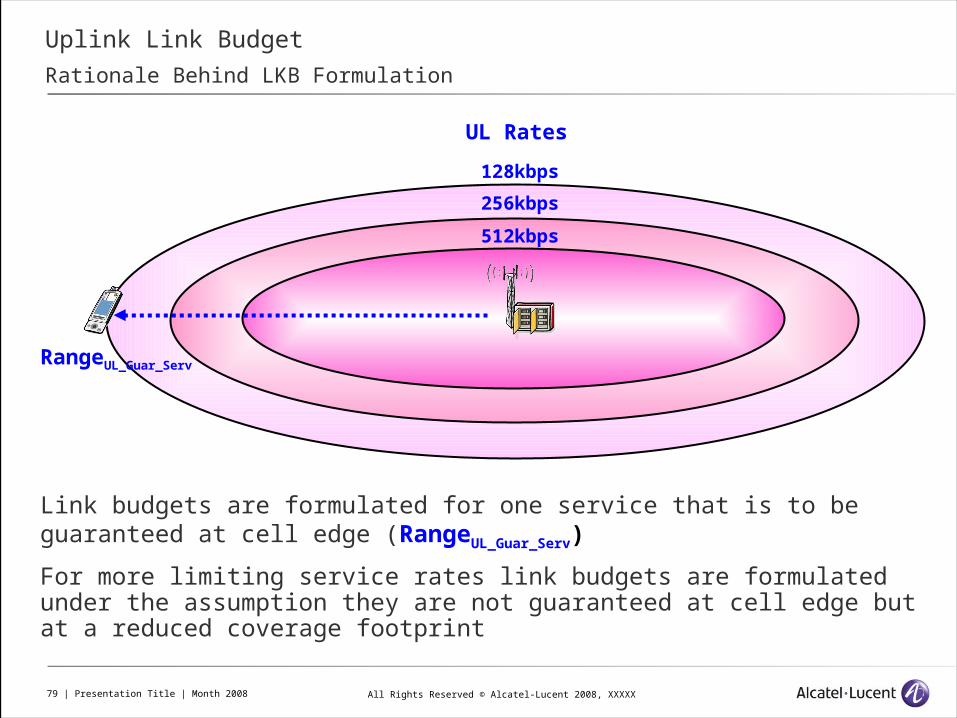
Link budgets are formulated for one service that is to be guaranteed at cell edge (RangeUL_Guar_Serv)
For more limiting service rates link budgets are formulated under the assumption they are not guaranteed at cell edge but at a reduced coverage footprint
RangeUL_Guar_Serv
128kbps
256kbps
512kbps
UL Rates

All Rights Reserved © Alcatel-Lucent 2008, XXXXX80 | Presentation Title | Month 2008
Uplink Link Budget
Example for one service
Dense Urban (2.6GHz) PS 128
Required Data Rate 128 kbpsNo. Resource Blocks
Required3 RB
MCS MCS 8Used Bandwidth 540 kHz
Target C/I -3.0 dBeNode-B Noise Figure 2.5 dB
eNode-B Sensitivity -117.2 dBmAntenna Gain 18.0 dBi
Cable & Connector Losses 0.5 dBBody Losses 0 dB
Additional UL Losses 0 dBCell area coverage
probability 95%Overall standard deviation 8.0 dB
Shadowing Margin 8.6 dBHandoff Gain 3.6 dB
Fast Fading Margin 0 dBPenetration Margin 21 dB
Fixed IoT 3.0 dBUE Antenna Gain 0 dBi
UE Max Transmit Power 23.0 dBmMAPL 128.7 dB
UL Cell Range 0.46 km
No. Resource Blocks to Reach Data Rate
Signal to Interference Ratio per Resource Block
Noise Figure of the eNode-B is supplier dependent
Based on SINR, Noise Figure, Thermal Noise, Bandwidth Used
Optimal Modulation & Coding Scheme (MCS)

All Rights Reserved © Alcatel-Lucent 2008, XXXXX81 | Presentation Title | Month 2008
Uplink Link Budget
Receiver Sensitivity
eNode-B Receiver Sensitivity
Minimum required signal level to reach a given quality (SINR target) when facing only thermal noise
Where:
F: eNode-B Noise figure in dB
Nth: Thermal noise density, 10log(Nth) =-174 dBm/Hz
SINRdB: Signal to Interference ratio per Resource Block
NRB: Number of resource blocks (RB) required to reach a given data rate
WRB: Bandwidth of one Resource Block
– One Resource Block is composed of 12 subcarriers, each of a 15kHz
bandwidth – so WRB = 180kHz.\
SensitivitydBm = SINRdB + 10.log10(F.Nth.NRB.WRB)
Service dependent

All Rights Reserved © Alcatel-Lucent 2008, XXXXX82 | Presentation Title | Month 2008
Uplink Link Budget
SINR Performances - Overview
SINR Target depends on:
eNode-B equipment performance
Radio conditions (multipath fading profile, mobile speed)
Receive diversity (2-way by default or optional 4-way)
Targeted data rate and quality of service
The Modulation and Coding Scheme (MCS)
Max allowed number of HARQ transmissions (Maximum of 4 on UL)
HARQ Operating Point – 1% Post HARQ BLER target considered by default
Derived from link level simulations or better by equipment measurements (lab or on-field measurements)

All Rights Reserved © Alcatel-Lucent 2008, XXXXX83 | Presentation Title | Month 2008
Uplink Link Budget
SINR Performances - Channel Model
In reality, a mix of multipath conditions exist across a typical cell
For coverage assessment, the worst case model should be considered
ITU VehA multipath channel model are considered a good compromise
For LTE some evolved multipath channel models have been defined such as EVA5Hz or EPA5Hz
These are an extension of the VehA and PedA models used in UMTS to make them more suitable for the wider bandwidths encountered with LTE, e.g. >5MHz
Main difference lies in the definition of a Doppler frequency instead of a speed, making the model useable for different frequency bands
All SINR performances used in the link budget are for all EVehA3 and EVehA50 channel models

All Rights Reserved © Alcatel-Lucent 2008, XXXXX84 | Presentation Title | Month 2008
Uplink Link Budget
SINR Performances - Link Level Results for 10MHz Bandwidth (50 RB)
LTE UL Throughput v.s. SNR, max 4HARQ Tx, EPedB-3km
0
5000
10000
15000
20000
25000
30000
35000
40000
-10 -5 0 5 10 15 20 25 30
SINR (dB)
Thro
ugh
put
(kbps)
MCS = 0 MCS = 1MCS = 2 MCS = 3MCS = 4 MCS = 5MCS = 6 MCS = 7MCS = 8 MCS = 9MCS = 10 MCS = 11MCS = 12 MCS = 13MCS = 14 MCS = 15MCS = 16 MCS = 17MCS = 18 MCS = 19MCS = 20 MCS = 21MCS = 22 MCS = 23MCS = 24 MCS = 25MCS = 26 MCS = 27MCS = 28 T'put (kbps)

All Rights Reserved © Alcatel-Lucent 2008, XXXXX85 | Presentation Title | Month 2008
Uplink Link Budget
SINR Performances - Selection of Optimal SINR Figures
There are a number of possible solutions that can be used to provide a given throughput – solutions comprise a combination of:
Modulation & Coding Scheme (MCS)
Number of Resource Blocks (RB)
Optimization Objective:
Select # RB’s and MCS so as to maximize the receiver sensitivity and thus the link budget
While at the same time respecting the selected HARQ operating point (1% post HARQ BLER objective)

All Rights Reserved © Alcatel-Lucent 2008, XXXXX86 | Presentation Title | Month 2008
Uplink Link Budget
SINR Performances - Summary for UL 10MHz Bandwidth (1x2 RxDiv)
Performance figures for typical UL link budget rates
Number of RB’s
SINR (include margins)
MCS, TBS and # HARQ Transmissions
Service VoIP PS 64 PS 128 PS 256 PS 384 PS 512 PS 768PS
1000PS
2000Bit Rate 12.2 64 128 256 384 512 768 1000 2000
MCS 6 6 8 10 10 10 10 10 10
TBS 328 176 392 872 1384 1736 2792 3496 6968
Modulation QPSK QPSK QPSK QPSK QPSK QPSK QPSK QPSK QPSK
Post HARQ BLER 1% 1% 1% 1% 1% 1% 1% 1% 1%
Required # of RB 1 2 3 5 8 10 16 20 40
SINR (EVehA 3km/h) -3.7 dB -3.6 dB -3.0 dB -2.4 dB -2.9 dB -3.1 dB -3.4 dB -2.9 dB -3.3 dB
Rx Sensitivity -123 dBm-120 dBm-117 dBm-114 dBm-113 dBm-112 dBm-110 dBm-109 dBm-106 dBm

All Rights Reserved © Alcatel-Lucent 2008, XXXXX87 | Presentation Title | Month 2008
Uplink Link Budget
SINR Peformances - MCS and TBS Tables
Some Background Info
Modulation & Coding Scheme (MCS)
This determines the Modulation Order which in turn determines the TBS Index
Number of Resource Blocks
For a given MCS the Transport Block Size (TBS) is given different numbers of resource blocks
MCS Index,
IMCS
Modulation Order, QM
TBS Index, ITBS
0 QPSK 01 QPSK 12 QPSK 23 QPSK 3… QPSK 4
NPRB
ITBS 1 2 3 4 …
0 16 32 56 88 120
1 24 56 88 144 176
2 32 72 144 176 208
3 40 104 176 208 256
4 56 120 208 256 328
5 72 144 224 328 424
6 328 176 256 392 504
… 104 224 328 472 584
MCS Table TBS Table

All Rights Reserved © Alcatel-Lucent 2008, XXXXX88 | Presentation Title | Month 2008
Uplink Link Budget
Implementation Margins
SINR performances from link level simulations assume ideal scheduling and link adaptation – reality will not be as good …
For example in the downlink, we consider: Error free CQI feedback, Perfect PDCCH-
PCFICH decoding, CQI feedback rate 1/20ms, etc.
To account for such ideal assumptions there are currently two key elements to the margins incorporated into in SINR performances used in UL budgets today:
Implementation margin to account for the assumptions implicit in the link level simulations used to derive the SINR performances
Currently considered to be ~1dB
No variability is assumed for different environments or UE mobility conditions
Will be tuned based on SINR measurements (not yet performed)
ACK/NACK margin to account for the puncturing of ACK/NACK onto the PUSCH
A 1dB margin is applied for VoIP services and 0.5dB for higher data throughputs

All Rights Reserved © Alcatel-Lucent 2008, XXXXX89 | Presentation Title | Month 2008
Uplink Link Budget
Consideration of Explicit Diversity Gains
The SINR performance figures considered by Alcatel-Lucent in UL and DL link budgets are based on link level simulations that already account for the corresponding transmit and receive diversity gains, i.e.
UL: default 1x2 Rx Diversity
2RxDiv gain accounted for in the SINR figures
To account for 4RxDiv on the UL an additional 2-3dB gain is considered on the 2RxDiv SINR figures
DL: default 2x2 Tx Diversity
SFBC pre-coding gains + 2RxDiv gain at the UE are accounted for in the SINR figures
Note that an additional power combining gain is considered at the transmit side, i.e. for a 2 x 40W TxDiv configuration a 80W transmit power is applied in DL link budgets

All Rights Reserved © Alcatel-Lucent 2008, XXXXX90 | Presentation Title | Month 2008
INTERNAL NOTE – Noise Figure
The Noise Figure of the eNode-B is supplier dependent
Typically the Noise Figures of e-NodeBs range between 2 to 3dB
RRH Type Typical Noise Figure
RRH2x (lower 700) 2.2dB
900 TBD - 2.5dB (assumed)
MC-TRX (1800) 3 dB
MC-RRH (1800) 2.5 dB
AWS TBD – 2.5dB (assumed)
RRH2x (2600) 2.6 dB
TRDU (2600) 2.6 dB
Typical RRH Noise Figures for ALU product (June 2009)

All Rights Reserved © Alcatel-Lucent 2008, XXXXX91 | Presentation Title | Month 2008
Uplink Link Budget
Exercise
Compute eNode-B sensitivity in VehA 3km/h
for VoIP 12.2kbps @ 1% Post-HARQ BLER
For PS 384kbps @ 1% Post-HARQ BLER
Alcatel-Lucent equipment:
Typical eNode-B Noise Figure: 2.5dB
SINR figures: -3.7 dB for VoIP 12.2, -3.3dB for PS384
ANSWER: Sensitivity: -122.6 dBm for speech, -113.2 dBm for PS384

All Rights Reserved © Alcatel-Lucent 2008, XXXXX92 | Presentation Title | Month 2008
Uplink Link Budget
Example for one service
Dense Urban (2.6GHz) PS 128
Required Data Rate 128 kbpsNo. Resource Blocks
Required3 RB
MCS MCS 8Used Bandwidth 540 kHz
Target C/I -3.0 dBeNode-B Noise Figure 2.5 dB
eNode-B Sensitivity -117.2 dBmAntenna Gain 18.0 dBi
Cable & Connector Losses 0.5 dBBody Losses 0 dB
Additional UL Losses 0 dBCell area coverage
probability 95%Overall standard deviation 8.0 dB
Shadowing Margin 8.6 dBHandoff Gain 3.6 dB
Fast Fading Margin 0 dBPenetration Margin 21 dB
Fixed IoT 3.0 dBUE Antenna Gain 0 dBi
UE Max Transmit Power 23.0 dBmMAPL 128.7 dB
UL Cell Range 0.46 km
Depends on UE Power Class
0dBi by default
3dB body loss when speech usage (UE near head), 0dB body loss when data
usage
Typical gain of Tri-sectored antenna, depends on frequency
band
Depends on feeder type, length and frequency band

All Rights Reserved © Alcatel-Lucent 2008, XXXXX93 | Presentation Title | Month 2008
Uplink Link Budget
UE Characteristics
LTE UE Max Transmit Power
Depends on the power class of the UE
Only one power class is defined in 3GPP TS 36.101: 23dBm output power is considered with a 0 dBi antenna gain; ± 2dB tolerance in the standard
WCDMA UE Max Transmit Power
Multiple power classes were defined in 3GPP TS 25.101, the most prevalent WCDMA UE’s today are considered to be class 3 (24dBm +1/-3dB)
The corresponding tolerance ranges for both WCDMA and LTE terminals are in fact the same:
4dB range 21-25dBm
While the nominal Tx powers differ by 1dB
Currently consider 23dBm in UL LTE link budgets

All Rights Reserved © Alcatel-Lucent 2008, XXXXX94 | Presentation Title | Month 2008
Uplink Link Budget
Example for one service
Dense Urban (2.6GHz) PS 128
Required Data Rate 128 kbpsNo. Resource Blocks
Required3 RB
MCS MCS 8Used Bandwidth 540 kHz
Target C/I -3.0 dBeNode-B Noise Figure 2.5 dB
eNode-B Sensitivity -117.2 dBmAntenna Gain 18.0 dBi
Cable & Connector Losses 0.5 dBBody Losses 0 dB
Additional UL Losses 0 dBCell area coverage
probability 95%Overall standard deviation 8.0 dB
Shadowing Margin 8.6 dBHandoff Gain 3.6 dB
Fast Fading Margin 0 dBPenetration Margin 21 dB
Fixed IoT 3.0 dBUE Antenna Gain 0 dBi
UE Max Transmit Power 23.0 dBmMAPL 128.7 dB
UL Cell Range 0.46 km
Depends on depth of coverage (e.g. deep indoor, indoor daylight, outdoor). Also accounts for the indoor shadowing
margin
Shadowing margin due to shadowing standard deviation
Handoff gain

All Rights Reserved © Alcatel-Lucent 2008, XXXXX95 | Presentation Title | Month 2008
Uplink Link Budget
Shadowing Margin
Shadowing Margin:
Slow fading signal level variations due to obstacles
Modelled (in dB) as a Gaussian variable with zero-mean and standard deviation depending on the environment, typically 6 to 8dB
The shadowing standard deviation can include the variability associated with the indoor penetration. However, it is recommended to consider this as part of the penetration margin
Impact on link budget :
Take a margin to ensure the received signal is well received (above required sensitivity) with a given probability
Typically 95% in Dense Urban, Urban and Suburban and 90% in Rural
Computation as for UMTS and CDMA.
All Rights Reserved © Alcatel-Lucent 2008, XXXXX96 | Presentation Title | Month 2008
Uplink Link BudgetHandoff Gain
Unlike UMTS/WCDMA or CDMA, there is no soft-handoff functionality for LTE
No soft-handoff gain considered for LTE
Far too pessimistic to only consider the shadowing margin computed with one cell
unless considering an isolated cell
A mobile at the cell edge can still handover to a neighbor cell with more favorable
shadowing, i.e. a lower path loss consider a Handoff Gain (or best server
selection gain)
Reference article: Analysis of fade margins for soft and hard handoffs,
Rege, K.M.; Nanda, S.; Weaver, C.F.; Peng, W.-C., PIMRC 95
INTERNAL NOTE: This hard handoff gain can be considered for any system without soft
handoff. So this is the case for GSM. However no gain is typically applied in GSM. For LTE the
sampling frequency for handoff decisions as well as the handoff speed itself is much faster
than GSM this leads to an LTE handoff gain not much less than that considered for
WCDMA.

All Rights Reserved © Alcatel-Lucent 2008, XXXXX97 | Presentation Title | Month 2008
Shadowing Standard Deviation 6 dB 6 dB 7 dB 7 dB 8 dB 8 dB 10 dB 10 dB
Cell Area Coverage Probability 90% 95% 90% 95% 90% 95% 90% 95%
Cell Edge Coverage Probability 71% 84% 73% 85% 75% 86% 78% 88%
Handoff Hysteresis 2 dB 2 dB 2 dB 2 dB 2 dB 2 dB 2 dB 2 dB
Shadowing Margin (no SHO gain) 3.3 dB 5.9 dB 4.3 dB 7.2 dB 5.4 dB 8.7 dB 7.7 dB 11.7 dB
SHO Gain 2.7 dB 2.8 dB 3.1 dB 3.4 dB 3.6 dB 3.9 dB 4.7 dB 5.0 dB
3 km/h - HHO Gain 2.3 dB 2.5 dB 2.8 dB 3.1 dB 3.4 dB 3.6 dB 4.4 dB 4.8 dB
50 km/h - HHO Gain 2.1 dB 2.2 dB 2.6 dB 2.8 dB 3.1 dB 3.3 dB 4.1 dB 4.4 dB
100 km/h - HHO Gain 2.0 dB 2.0 dB 2.4 dB 2.6 dB 2.8 dB 3.0 dB 3.7 dB 4.0 dB
Uplink Link Budget
Handoff Gain - Example
Antenna Height 30 m
K2 Propagation Model 35.2
Shadowing Correlation 0.5
Hysteresis 2 dB
HO sampling time 20 msec
# of samples to decide HO 4 samples
Correlation distance 50 m
Cell Range 100%
Reference article: Analysis of fade margins for soft and hard handoffs, Rege, K.M.; Nanda, S.; Weaver, C.F.; Peng, W.-C., PIMRC 95
Typical for Dense Urban, Urban and Suburban
Indoor
Typical for Dense Urban, Urban and Suburban
Indoor
Typical for Suburban Incar &
Rural
Typical for Suburban Incar &
Rural

All Rights Reserved © Alcatel-Lucent 2008, XXXXX98 | Presentation Title | Month 2008
Uplink Link Budget
Handoff Gain - Example
Note that the full Handoff Gain is only applicable for UE’s located at the cell edge where we consider one rate guaranteed at the cell edge and others guaranteed within that coverage footprint, the other services will not take benefit of the full handoff gain
Dense Urban, Sigma = 8dB, 95% coverage reliability, 3km/h mobility
128kbps256kbps512kbps
UL Rates
0.0 dB
0.5 dB
1.0 dB
1.5 dB
2.0 dB
2.5 dB
3.0 dB
3.5 dB
4.0 dB
0% 20% 40% 60% 80% 100%
% of Cell Range
Han
doff
Gai
n

All Rights Reserved © Alcatel-Lucent 2008, XXXXX99 | Presentation Title | Month 2008
Uplink Link Budget
Penetration Margin
The penetration losses characterize the level of indoor coverage targeted by the operator (deep indoor, indoor daylight, window, incar, outdoor, etc)
Highly dependent on the wall materials and number of walls/windows to be penetrated
It is recommended to consider the penetration margin as a single “worst case” margin as the shadowing standard deviation doesn’t include the indoor penetration variability
Typical Penetration Losses at 2GHz
Environment Penetration Margin (dB)
Dense Urban – Deep Indoor 20
Urban - Indoor 17
Suburban - Indoor 14
Rural – Incar 8
All Rights Reserved © Alcatel-Lucent 2008, XXXXX100 | Presentation Title | Month 2008
INTERNAL NOTE – Penetration Losses
For 700/850/900MHz, lower penetration losses can be considered
Note that the frequency dependency of the penetration losses is very material-dependent
Typically, we can assume 2dB lower penetration margins compared to those at 2GHz
For 2.6GHz, higher penetration losses could be considered
Note that the frequency dependency of the penetration losses is very material-dependent
Typically, we can assume 2dB higher penetration margins compared to those at 2GHz

All Rights Reserved © Alcatel-Lucent 2008, XXXXX101 | Presentation Title | Month 2008
Uplink Link Budget
Example for one service
Dense Urban (2.6GHz) PS 128
Required Data Rate 128 kbpsNo. Resource Blocks
Required3 RB
MCS MCS 8Used Bandwidth 540 kHz
Target C/I -3.0 dBeNode-B Noise Figure 2.5 dB
eNode-B Sensitivity -117.2 dBmAntenna Gain 18.0 dBi
Cable & Connector Losses 0.5 dBBody Losses 0 dB
Additional UL Losses 0 dBCell area coverage
probability 95%Overall standard deviation 8.0 dB
Shadowing Margin 8.6 dBHandoff Gain 3.6 dB
Fast Fading Margin 0 dBPenetration Margin 21 dB
Fixed IoT 3.0 dBUE Antenna Gain 0 dBi
UE Max Transmit Power 23.0 dBmMAPL 128.7 dB
UL Cell Range 0.46 km
Interference Margin or IoT
This sensitivity is calculated for noise only. A margin must be considered for
the interference above noise: Interference Margin

All Rights Reserved © Alcatel-Lucent 2008, XXXXX102 | Presentation Title | Month 2008
Uplink Link Budget
Interference Margin
Sensitivity figures typical consider only thermal noise, the real interference, Ij, must also be considered (not only the thermal noise)
Interference margin or IoT (Interference over Thermal Noise)
A reuse of 1 is typical (option to use schemes such as soft fractional reuse or interference coordination)
The IoT operating point can be set to achieve a minimum data rate at cell edge and/or to match incumbent technology coverage
dBdBmj ceMarginInterferenySensitivitC Power, ReceiveddBm
WN
I10logceMarginInterferen
th
jdB

All Rights Reserved © Alcatel-Lucent 2008, XXXXX103 | Presentation Title | Month 2008
Uplink Link Budget
WCDMA Noise Rise - What’s Different Between LTE and WCDMA?
By definition, Cell Load and Total Interference rise (“Noise Rise”) are linked:
where Itotal is the total received power at the node B (including the
useful signal)
Differences with LTE
Interference from adjacent cells onlyfor LTE (no intracell interference)
Max WCDMA cell load is dependenton power control stability
No concept of cell load for LTE
ULo
totaldBtot x
WNI
i
11010 log log_
0
5
10
15
20
25
30
0 10 20 30 40 50 60 70 80 90 100
Cell Load (%)
Nois
e R
ise
(dB
)
50% cell load3dB Noise Rise

All Rights Reserved © Alcatel-Lucent 2008, XXXXX104 | Presentation Title | Month 2008
LTE IoT
What Determines the IoT for LTE?
The average IoT is dependent upon the targeted cell edge data rate (SINR)
The higher the cell edge SINR target, the higher the average IoT
Ultimately there is a point at which the increased IoT can not be sustained with the corresponding SINR
Based on system level simulations:
0
1
2
3
4
5
6
7
8
9
-7 -6 -5 -4 -3 -2 -1 0 1 2
Cell Edge SINR Target, TSINR (dB)
Ave
rage
IoT (dB
)
0
100
200
300
400
0 1 2 3 4 5 6 7 8 9
Mean IoT (dB)
Avg
and
5% U
E Thro
ugh
put
(kbps)
Average Throughput
Cell Edge Throughput
All Rights Reserved © Alcatel-Lucent 2008, XXXXX105 | Presentation Title | Month 2008
LTE IoT
What Determines the IoT for LTE?
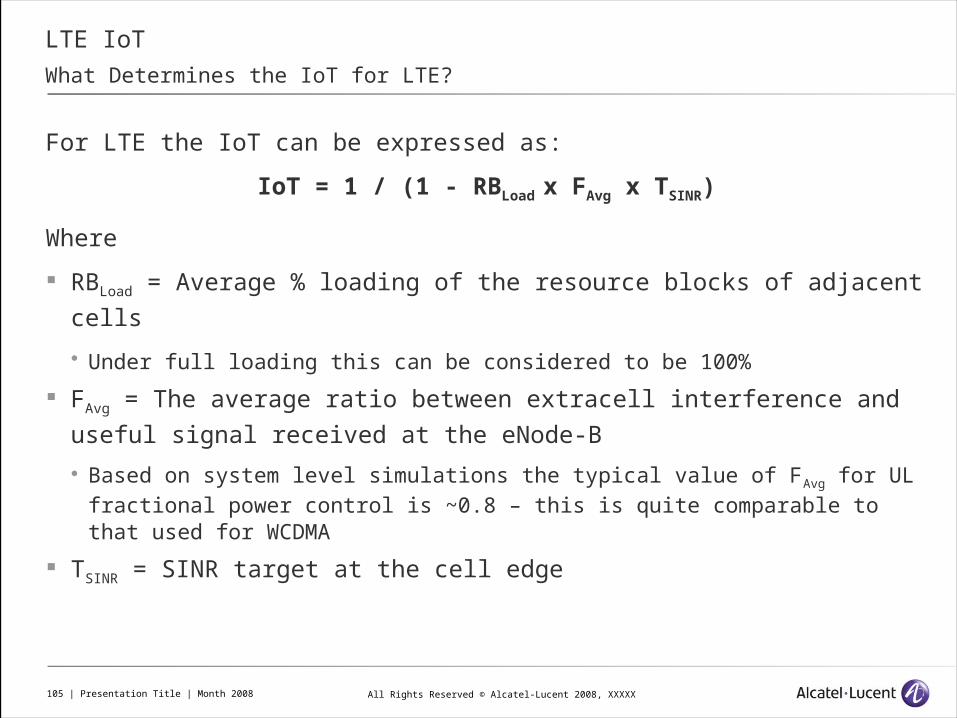
For LTE the IoT can be expressed as:
IoT = 1 / (1 - RBLoad x FAvg x TSINR)
Where
RBLoad = Average % loading of the resource blocks of adjacent cells
Under full loading this can be considered to be 100%
FAvg = The average ratio between extracell interference and useful
signal received at the eNode-B
Based on system level simulations the typical value of FAvg for UL fractional power control is ~0.8 – this is quite comparable to that used for WCDMA
TSINR = SINR target at the cell edge
All Rights Reserved © Alcatel-Lucent 2008, XXXXX106 | Presentation Title | Month 2008
LTE IoT
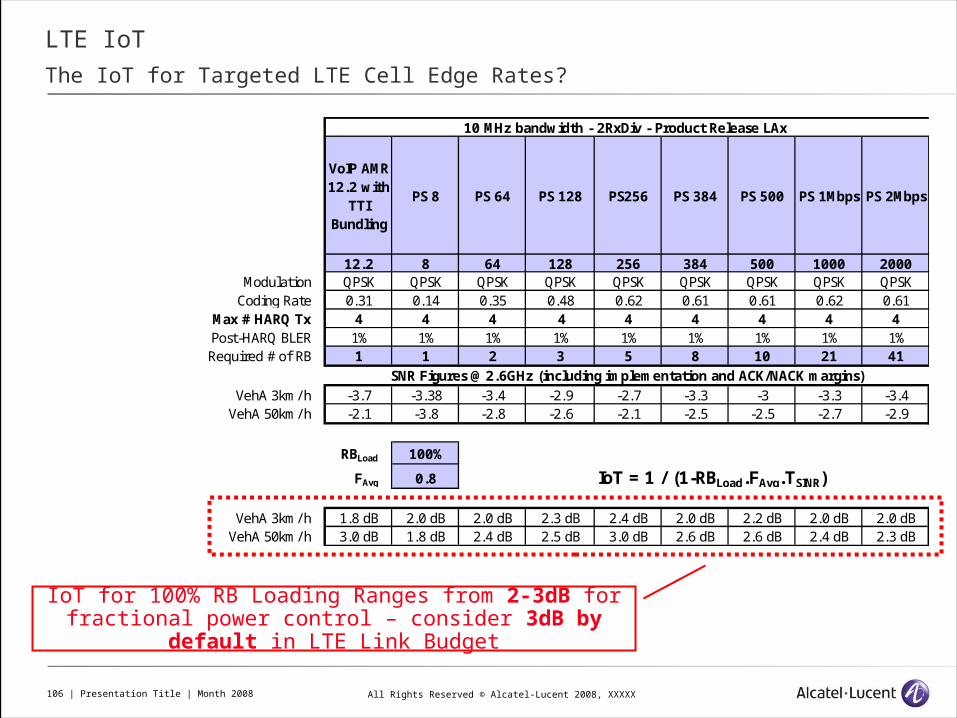
The IoT for Targeted LTE Cell Edge Rates?
VoIP AMR 12.2 with
TTI Bundling
PS 8 PS 64 PS 128 PS256 PS 384 PS 500 PS 1Mbps PS 2Mbps
12.2 8 64 128 256 384 500 1000 2000Modulation QPSK QPSK QPSK QPSK QPSK QPSK QPSK QPSK QPSK
Coding Rate 0.31 0.14 0.35 0.48 0.62 0.61 0.61 0.62 0.61Max # HARQ Tx 4 4 4 4 4 4 4 4 4Post-HARQ BLER 1% 1% 1% 1% 1% 1% 1% 1% 1%Required # of RB 1 1 2 3 5 8 10 21 41
VehA 3km/ h -3.7 -3.38 -3.4 -2.9 -2.7 -3.3 -3 -3.3 -3.4VehA 50km/ h -2.1 -3.8 -2.8 -2.6 -2.1 -2.5 -2.5 -2.7 -2.9
RBLoad 100%
FAvg 0.8 IoT = 1 / (1-RBLoad.FAvg.TSINR)
VehA 3km/ h 1.8 dB 2.0 dB 2.0 dB 2.3 dB 2.4 dB 2.0 dB 2.2 dB 2.0 dB 2.0 dBVehA 50km/ h 3.0 dB 1.8 dB 2.4 dB 2.5 dB 3.0 dB 2.6 dB 2.6 dB 2.4 dB 2.3 dB
10 MHz bandwidth - 2RxDiv - Product Release LAx
SNR Figures @ 2.6GHz (including implementation and ACK/NACK margins)
IoT for 100% RB Loading Ranges from 2-3dB for fractional power control – consider 3dB by default in
LTE Link Budget

All Rights Reserved © Alcatel-Lucent 2008, XXXXX107 | Presentation Title | Month 2008
0.1 dB
1.0 dB
10.0 dB
100.0 dB
-6.0 dB -4.0 dB -2.0 dB 0.0 dB 2.0 dB 4.0 dB 6.0 dB 8.0 dB
Cell Edge SINR Target
IoT
Omni UE Antenna
Directional UE Antenna
Uplink Link Budget
What Determines the IoT for LTE?
The average IoT is dependent upon the targeted cell edge data rate (SINR)
The higher the cell edge SINR target, the higher the average IoT
Based on system levelsimulations:
Omni and Directional UEantennas
SINRs resulting in an IoT> 5-6dB is not consideredreasonable
Realistic Cell Edge SINR Operating
Range

All Rights Reserved © Alcatel-Lucent 2008, XXXXX108 | Presentation Title | Month 2008
Uplink Link Budget
Overall MAPL & Cell Range
Overall MAPL for a given service:
dBdB
dBdBmdB
dBdBdBdBdBMaxTXdBj
HOGainarginShadowingM
ceMarginInterferenySensitivitnPenetratio
BodylossRxlossRxgainTxlossTxgainPMAPLdBm
Reference Sensitivity
Transmit Power
Losses and Margins
Gains
•= MAPL
Interferencecell radius
Maximum Allowable Pathloss
Reference Sensitivity
Max UE transmit Power
Gains - Losses- Margins
Interference marginextra cell interference

All Rights Reserved © Alcatel-Lucent 2008, XXXXX109 | Presentation Title | Month 2008
Uplink Link Budget
Example for Multiple Services cell21dBjdB RlogKKMAPLMinMAPL
Dense Urban (2.6GHz)
VoIP PS 64 PS 128 PS 256 PS 384 PS 512 PS 768 PS 1000 PS 2000
Required Data Rate 12.2 kbps 64 kbps 128 kbps 256 kbps 384 kbps 512 kbps 768 kbps 1000 kbps2000 kbpsNo. Resource Blocks
Required1 RB 2 RB 3 RB 5 RB 8 RB 10 RB 16 RB 20 RB 40 RB
MCS MCS 6 MCS 6 MCS 8 MCS 10 MCS 10 MCS 10 MCS 10 MCS 10 MCS 10
Used Bandwidth 180 kHz 360 kHz 540 kHz 900 kHz 1440 kHz 1800 kHz 2880 kHz 3600 kHz 7200 kHz
Target C/I -3.7 dB -3.6 dB -3.0 dB -2.4 dB -2.9 dB -3.1 dB -3.4 dB -2.9 dB -3.3 dB
eNode-B Noise Figure 2.5 dB 2.5 dB 2.5 dB 2.5 dB 2.5 dB 2.5 dB 2.5 dB 2.5 dB 2.5 dB
eNode-B Sensitivity-122.7 dBm-119.6 dBm-117.2 dBm-114.4 dBm-112.9 dBm-112.1 dBm-110.3 dBm-108.8 dBm-106.2 dBm
Antenna Gain 18.0 dBi 18.0 dBi 18.0 dBi 18.0 dBi 18.0 dBi 18.0 dBi 18.0 dBi 18.0 dBi 18.0 dBi
Cable & Connector Losses 0.5 dB 0.5 dB 0.5 dB 0.5 dB 0.5 dB 0.5 dB 0.5 dB 0.5 dB 0.5 dB
Body Losses 3 dB 0 dB 0 dB 0 dB 0 dB 0 dB 0 dB 0 dB 0 dB
Additional UL Losses 0 dB 0 dB 0 dB 0 dB 0 dB 0 dB 0 dB 0 dB 0 dBCell area coverage
probability95% 95% 95% 95% 95% 95% 95% 95% 95%
Overall standard deviation 8.0 dB 8.0 dB 8.0 dB 8.0 dB 8.0 dB 8.0 dB 8.0 dB 8.0 dB 8.0 dB
Shadowing Margin 8.6 dB 8.6 dB 8.6 dB 8.6 dB 8.6 dB 8.6 dB 8.6 dB 8.6 dB 8.6 dB
Handoff Gain 3.6 dB 3.6 dB 3.6 dB 3.0 dB 2.4 dB 2.0 dB 1.5 dB 1.1 dB 0.5 dB
Fast Fading Margin 0 dB 0 dB 0 dB 0 dB 0 dB 0 dB 0 dB 0 dB 0 dB
Penetration Margin 21 dB 21 dB 21 dB 21 dB 21 dB 21 dB 21 dB 21 dB 21 dB
Fixed IoT 3.0 dB 3.0 dB 3.0 dB 3.0 dB 3.0 dB 3.0 dB 3.0 dB 3.0 dB 3.0 dB
UE Antenna Gain 0 dBi 0 dBi 0 dBi 0 dBi 0 dBi 0 dBi 0 dBi 0 dBi 0 dBi
UE Max Transmit Power 23 dBm 23 dBm 23 dBm 23 dBm 23 dBm 23 dBm 23 dBm 23 dBm 23 dBm
MAPL 131.2 dB 131.1 dB 128.7 dB 125.3 dB 123.1 dB 122.0 dB 119.7 dB 117.8 dB 114.5 dB
UL Cell Range 0.53 km 0.53 km 0.46 km 0.37 km 0.32 km 0.30 km 0.25 km 0.23 km 0.18 km

All Rights Reserved © Alcatel-Lucent 2008, XXXXX110 | Presentation Title | Month 2008
Uplink Link Budget
Fractional Power Control – Handling in LKB (4/4)
Respecting the SINR slope (dictated by the fractional power control parameters) means for services requiring very high SINR values that:
Substantial reductions in allowable UE transmit power are required
The corresponding impact on the link budget is substantial

All Rights Reserved © Alcatel-Lucent 2008, XXXXX111 | Presentation Title | Month 2008
Uplink Link Budget
Propagation Models
For 700, 850 or 900 MHz - Okumura-Hata:
K1 = 69.55 + 26.16 x log10(FMHz) - 13.82 x log10(Hb) - a(Hm) + Kc
a(Hm) = (1.1 x log10(FMHz) - 0.7) x Hm - (1.56 x log10(FMHz) - 0.8) medium-sized city
K2 = 44.9 -6.55*log10(Hb)
For AWS, 1.9GHz or 2.1GHz - COST-231 Hata:
K1 = 46.3 + 33.9 x log10(FMHz) - 13.82 x log10(Hb) - a(Hm) + Kc
K2 = 44.9 - 6.55 x log10(Hb)
For 2.6GHz - modified COST-231 Hata: as COST-231 Hata is limited to 1.5GHz to 2GHz
Based on measurements at higher frequencies (2.5GHz & 3.5GHz):
K1 = 46.3 + 33.9 x log10(2000) + 20 x log10(FMHz/2000) - 13.82 x log10(Hb) - a(Hm) + Kc
K2 = 44.9 - 6.55 x log10(Hb)

All Rights Reserved © Alcatel-Lucent 2008, XXXXX112 | Presentation Title | Month 2008
Uplink Link Budget
Impact of TMA (1/3)
Tower Mounted Amplifier (TMA) also called Mast Head Amplifier (MHA)
Impact on link budget
Slightly Reduce the global NoiseFigure
Compensate the cable losses
0.4dB DL insertion losses
Usage recommended for ULcoverage-limited scenarios
eNode-B
Dual TMA
Jumper Cable
Jumper Cable
TX / RX TXdiv / RXdiv
Duplexer
Duplexer Duplexer
Duplexer
LNALNA
Feeder
AntennaVertical
Polarisation
All Rights Reserved © Alcatel-Lucent 2008, XXXXX113 | Presentation Title | Month 2008
Tower Mounted Amplifier
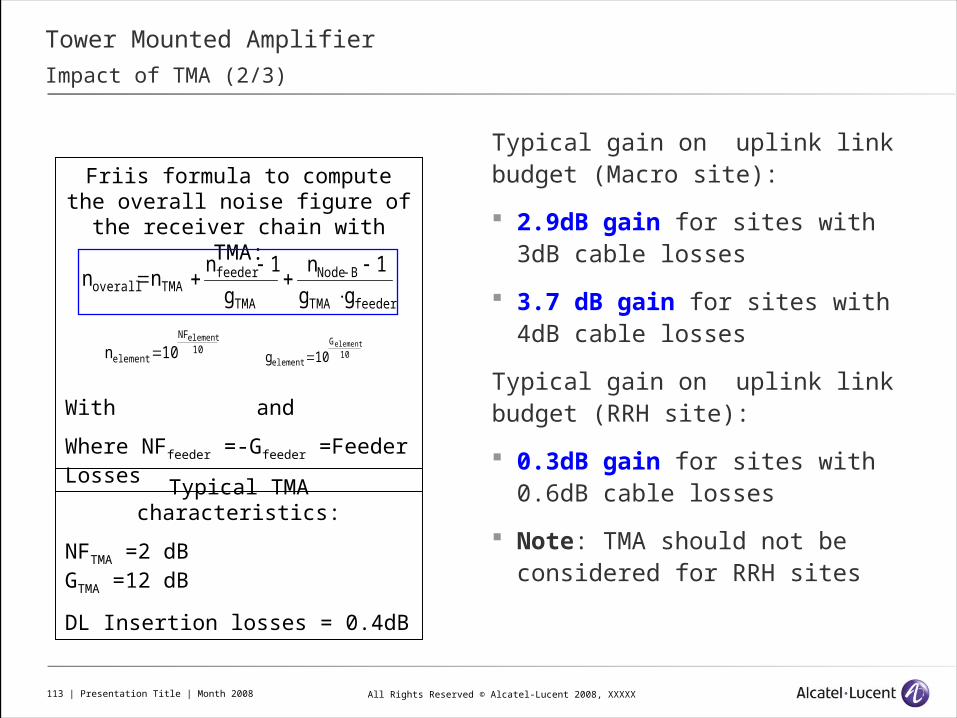
Impact of TMA (2/3)
Typical gain on uplink link budget (Macro site):
2.9dB gain for sites with 3dB cable losses
3.7 dB gain for sites with 4dB cable losses
Typical gain on uplink link budget (RRH site):
0.3dB gain for sites with 0.6dB cable losses
Note: TMA should not be considered for RRH sites
Friis formula to compute the overall noise figure of the receiver chain with TMA:
With and
Where NFfeeder =-Gfeeder =Feeder Losses
10NF
element
element
10n 10G
element
element
10g
feederTMA
BNode
TMA
feederTMAoverall gg
1ng
1nnn
Typical TMA characteristics:
NFTMA =2 dB GTMA =12 dB
DL Insertion losses = 0.4dB

All Rights Reserved © Alcatel-Lucent 2008, XXXXX114 | Presentation Title | Month 2008
Tower Mounted Amplifier
Impact of TMA (3/3)
Dense Urban (2.6GHz) PS 128 (no TMA)
PS 128 (TMA)
Required Data Rate 128 kbps 128 kbpsNo. Resource Blocks
Required3 RB 3 RB
MCS MCS 8 MCS 8Used Bandwidth 540 kHz 540 kHz
Target C/I -3.0 dB -3.0 dBeNode-B Noise Figure 2.5 dB 2.4 dB
eNode-B Sensitivity -117.2 dBm -117.3 dBmAntenna Gain 18.0 dBi 18.0 dBi
Cable & Connector Losses 3.0 dB 0.2 dBBody Losses 0 dB 0 dB
Additional UL Losses 0 dB 0 dBCell area coverage
probability95% 95%
Overall standard deviation
8.0 dB 8.0 dB
Shadowing Margin 8.6 dB 8.6 dBHandoff Gain 3.6 dB 3.6 dB
Fast Fading Margin 0 dB 0 dBPenetration Margin 21 dB 21 dB
Fixed IoT 3.0 dB 3.0 dBUE Antenna Gain 0 dBi 0 dBi
UE Max Transmit Power 23.0 dBm 23.0 dBmMAPL 126.2 dB 129.1 dB
UL Cell Range 0.39 km 0.47 km
No cable losses but 0.2dB jumper losses
Reduced Noise figure (based on Friis formula)
Around 2.9dB gain on MAPL for sites with 3dB cable
losses

All Rights Reserved © Alcatel-Lucent 2008, XXXXX115 | Presentation Title | Month 2008
Common & Control Channel Considerations
Overview
There are two main common and control channel considerations that should be assessed for an LTE network design to ensure that they will not limit the coverage. These include:
INTERNAL NOTE – Attach Procedure
ACK/NACK Transmission
Either punctured onto the Physical Uplink Shared Channel (PUSCH)
Or over the Physical Uplink Control Channel (PUCCH)

All Rights Reserved © Alcatel-Lucent 2008, XXXXX116 | Presentation Title | Month 2008
INTERNAL NOTE – Common & Control Channel Considerations
Attach Procedure
This is the procedure that the UE must go through to Attach to an LTE network
eNBUE MME
RACH Preamble (1)
Grant and TA (2)
RRC Connection Request (3)
RRC Connection Setup (4)
RRC Connection Setup Complete (5)
SGW PGW
No MME Relocation
Attach request (6)
Authentication (optional)/ security (7-8)Create Default Bearer
Request (9) CDB Request (10)
Limiting
Message

All Rights Reserved © Alcatel-Lucent 2008, XXXXX117 | Presentation Title | Month 2008
INTERNAL NOTE – Common & Control Channel Considerations
Attach Procedure
From a link budget perspective the limiting message from messages 1, 2, 3, 4, 5, 15 and 16 (that involve the air interface) must be considered to assess any link budget constraints
eNBUE MME
Attach accepted (13)
SGW PGW
Create Default Bearer Response (12)
CDB Response (11)
RRC Connection reconfiguration (14)
RRC Connection reconfiguration complete (15)
Attach complete (16)
No MME Relocation
1st UL bearer packet
Update Bearer Request (20)
Update Bearer Response (21)
1st DL bearer packet

All Rights Reserved © Alcatel-Lucent 2008, XXXXX118 | Presentation Title | Month 2008
INTERNAL NOTE – Common & Control Channel Considerations
Attach Procedure
Message 3 (RRC Connection Request)
1 resource block with QPSK rate 1/3 providing an average effective data rate of 20.8 kbps (after 5 HARQ transmissions)
SINR requirement = 0.7dB(including margins)
UL link budget
Dense Urban
2.6GHz band
Attach LKB Can be Limiting Depending on Cell Edge Rate Target

All Rights Reserved © Alcatel-Lucent 2008, XXXXX119 | Presentation Title | Month 2008
Common & Control Channel Considerations
ACK/NACK Transmission
DL transmission requires a steady stream of ACK transmissions over the UL to acknowledge the DL packets
Correct ACK reception iscritical for optimizing the DLefficiency
ALU punctures ACK over thePUSCH initially and over thePUCCH in the longer term
ACK/NACK Transmission:
1 RB, QPSK, SINR -3.4dB(PUSCH) & -4.2dB (PUCCH)
UL LKB for Urban, 2.6GHz band
ACK Is Never Foreseen to Limit UL Coverage

All Rights Reserved © Alcatel-Lucent 2008, XXXXX120 | Presentation Title | Month 2008
LTE Link Budgets
Downlink Link Budget Considerations

All Rights Reserved © Alcatel-Lucent 2008, XXXXX121 | Presentation Title | Month 2008
Downlink Link Budget
Rationale Behind Downlink LKB Formulation (1/3)
1. DL Cell range defined by UL cell edge service link budget
2. DL throughputs computed for coverage probabilities associated with each corresponding UL service
3. Geometry distribution used for determining the cell edge throughput

All Rights Reserved © Alcatel-Lucent 2008, XXXXX122 | Presentation Title | Month 2008
Downlink Link Budget
Rationale Behind Downlink LKB Formulation (2/3)
The above example illustrates the detailed DL Link Budget on the subsequent slides …
Urban morphology, indoor 0dBi omni UE configuration, cell range fixed for UL 128kbps, 100% adjacent cell DL RB Loading, No TMA
Note: The diagram is not to scale and doesn’t include all rates
RangeUL_Guar_Serv
128kbps (3RB) - guaranteed at cell edge
256kbps (5RB)
512kbps (10RB)
UL Rates
DL Rates
3921kbps (50RB)
8623kbps (50RB)
1323kbps (50RB)

All Rights Reserved © Alcatel-Lucent 2008, XXXXX123 | Presentation Title | Month 2008
Downlink Link Budget
Rationale Behind Downlink LKB Formulation (3/3)
Uniform power per RB is assumed on the DL
DL performances extracted from link level simulations
The optimal MCS is selected for given number of RB to maximize throughput while ensuring a 20% initial BLER
Only TxDiv is assumed for referenced DL link level simulations
As the DL link budget is focusing on cell edge performances it is considered that the rank and geometry are insufficient to justify Spatial Multiplexing (SM)
Where a relatively low rate is guaranteed on the UL at cell edge, e.g. 512kbps) the relative UL cell ranges for the high UL rates will be very small and thus the corresponding DL SINRs will be relatively high due to the reduced coverage reliability – in such cases there is some justification for consideration SM performances (not yet incorporated here)

All Rights Reserved © Alcatel-Lucent 2008, XXXXX124 | Presentation Title | Month 2008
Downlink Budget
Example: 10MHz BW
Dense Urban (2.6GHz) PS 128 PS 256No. Resource Blocks 50 RB 50 RB
Used Bandwidth 9000 kHz 9000 kHzUE Noise Figure 7 dB 7 dB
eNode-B Antenna Gain 18 dBi 18 dBiCable & Connector Losses 0.5 dB 0.5 dB
Body Loss 0 dB 0 dBPenetration Margin 21 dB 21 dB
Limiting UL Cell Range 0.46 km 0.46 km# DL Tx Paths 2 paths 2 paths
Total DL eNode-B Tx Power / Path 30 W 30 W
% DL Power for PDSCH 80% 80%Max eNode-B Tx Power /
Service 46.8 dBm 46.8 dBmUE Antenna Gain 0 dBi 0 dBi
Adjacent Cell Loading 100% 100%UL Service Cell Range 0.46 km 0.37 km
DL Path Loss @ UL Cell Edge 129.1 dB 125.7 dBTotal DL Losses @ UL Cell
Edge 150.6 dB 147.2 dBDL Cell Area Coverage
Probability 95% 61%Geometry at UL Service Cell
Range -4.9 dB -0.1 dBDesired Signal -85.8 dBm -82.3 dBm
Adjacent Cell Signal -80.9 dBm -82.2 dBmNoise -97.5 dBm -97.5 dBm
Cell Edge SINR -5.0 dB -0.2 dBOptimal MCS MCS 2 MCS 7
Data Rate at UL Service Cell Edge 1323 kbps 3921 kbps
Cell Range for Limiting UL Service (128kbps)
Cell Range for Equivalent UL Service
(256kbps)
Coverage Probability for DL service
95% x (0.36)2 / (0.46)2
Equivalent UL Service

All Rights Reserved © Alcatel-Lucent 2008, XXXXX125 | Presentation Title | Month 2008
Downlink Budget
Example: 10MHz BW
Dense Urban (2.6GHz) PS 128 PS 256No. Resource Blocks 50 RB 50 RB
Used Bandwidth 9000 kHz 9000 kHzUE Noise Figure 7 dB 7 dB
eNode-B Antenna Gain 18 dBi 18 dBiCable & Connector Losses 0.5 dB 0.5 dB
Body Loss 0 dB 0 dBPenetration Margin 21 dB 21 dB
Limiting UL Cell Range 0.46 km 0.46 km# DL Tx Paths 2 paths 2 paths
Total DL eNode-B Tx Power / Path
30 W 30 W
% DL Power for PDSCH 80% 80%Max eNode-B Tx Power /
Service46.8 dBm 46.8 dBm
UE Antenna Gain 0 dBi 0 dBiAdjacent Cell Loading 100% 100%UL Service Cell Range 0.46 km 0.37 km
DL Path Loss @ UL Cell Edge 129.1 dB 125.7 dBTotal DL Losses @ UL Cell
Edge150.6 dB 147.2 dB
DL Cell Area Coverage Probability
95% 61%
Geometry at UL Service Cell Range
-4.9 dB -0.1 dB
Desired Signal -85.8 dBm -82.3 dBmAdjacent Cell Signal -80.9 dBm -82.2 dBm
Noise -97.5 dBm -97.5 dBmCell Edge SINR -5.0 dB -0.2 dB
Optimal MCS MCS 2 MCS 7Data Rate at UL Service Cell
Edge1323 kbps 3921 kbps
% of total DL power dedicated to PDSCH
Geometry at the corresponding UL service
range
The cell edge SINR

All Rights Reserved © Alcatel-Lucent 2008, XXXXX126 | Presentation Title | Month 2008
Downlink Budget
DL Power Settings
Depending on the OAM power offset settings for the Resource Elements (RE) of different channel types we can compute the Average PDSCH Power / OFDM Symbol
Example below for 10MHz, 2 x 40W PA Power
Average % power / symbol allocated to PDSCH RE’s 32.1 / 40 = 80.2%

All Rights Reserved © Alcatel-Lucent 2008, XXXXX127 | Presentation Title | Month 2008
Downlink Budget
Geometry & SINR (1/2)
Geometry distributions from system simulations
A range of UE configurations, both
omni and, directional UEs (fixed wireless)
Examples in LKB are for coverage
reliabilities of 95% and 61%
Yield Geometries of -3.9 & 4.7dB
respectively
95% Coverage Reliability
Geometry-3.9dB
Geometry Distributions (Different UE Configs)
0%
10%
20%
30%
40%
50%
60%
70%
80%
90%
100%
-5.0 dB -1.0 dB 3.0 dB 7.0 dB 11.0 dB 15.0 dB 19.0 dB 23.0 dB
Geometry
CDF
Outdoor - 2 dBi - OmniOutdoor - 4 dBi - OmniOutdoor - 4 dBi - Direc.Outdoor - 6 dBi - Direc.Outdoor - 8 dBi - Direc.Outdoor - 10 dBi - Direc.Indoor - 0 dBi - OmniIndoor - 2 dBi - OmniIndoor - 4 dBi - Omni
61% Coverage Reliability
Geometry4.7dB
An additional 1dB is subtracted from these geometry values to align
with field expectations
AllSiteAdjacent
SiteServing
PowerRx
PowerRxGeometry

All Rights Reserved © Alcatel-Lucent 2008, XXXXX128 | Presentation Title | Month 2008
Downlink Budget
Geometry & SINR (2/2)
PDSCH SINR for a defined cell range and coverage reliability:
PDSCHSINR = PDSCHRx / [ PDSCHRx – Geometry + Thermal Noise]
Where:
PDSCHRx = PowerPDSCH – Total DL Losses
PowerPDSCH = PowerMax PA x Power FractionPDSCH x RBService / RBMax
– Power FractionPDSCH is the average fraction of the total power allocated to PDSCH Resource Elements (REs) per symbol across all RB’s
Thermal Noise = 10 x log10( F x Nth x NRB x WRB )
– F: eNode-B Noise figure in dB– Nth: Thermal noise density, 10log(Nth) =-174 dBm/Hz
– NRB: Number of resource blocks (RB) required to reach a given data rate
– WRB: Bandwidth of one Resource Block

All Rights Reserved © Alcatel-Lucent 2008, XXXXX129 | Presentation Title | Month 2008
Downlink Budget
Example: 10MHz BW
Dense Urban (2.6GHz) PS 128 PS 256No. Resource Blocks 50 RB 50 RB
Used Bandwidth 9000 kHz 9000 kHzUE Noise Figure 7 dB 7 dB
eNode-B Antenna Gain 18 dBi 18 dBiCable & Connector Losses 0.5 dB 0.5 dB
Body Loss 0 dB 0 dBPenetration Margin 21 dB 21 dB
Limiting UL Cell Range 0.46 km 0.46 km# DL Tx Paths 2 paths 2 paths
Total DL eNode-B Tx Power / Path
30 W 30 W
% DL Power for PDSCH 80% 80%Max eNode-B Tx Power /
Service46.8 dBm 46.8 dBm
UE Antenna Gain 0 dBi 0 dBiAdjacent Cell Loading 100% 100%UL Service Cell Range 0.46 km 0.37 km
DL Path Loss @ UL Cell Edge 129.1 dB 125.7 dBTotal DL Losses @ UL Cell
Edge150.6 dB 147.2 dB
DL Cell Area Coverage Probability
95% 61%
Geometry at UL Service Cell Range
-4.9 dB -0.1 dB
Desired Signal -85.8 dBm -82.3 dBmAdjacent Cell Signal -80.9 dBm -82.2 dBm
Noise -97.5 dBm -97.5 dBmCell Edge SINR -5.0 dB -0.2 dB
Optimal MCS MCS 2 MCS 7Data Rate at UL Service Cell
Edge1323 kbps 3921 kbps
Max # RB for the bandwidth is assumed by default
Corresponding L1 Throughput for #RB, MCS
and SINR
The optimal MCS for the #RB and SINR

All Rights Reserved © Alcatel-Lucent 2008, XXXXX130 | Presentation Title | Month 2008
Downlink Link Budget
SINR Performances - Overview
Like the UL the DL SINR Performances depends on:
eNode-B equipment performance
Radio conditions (multipath fading profile, mobile speed)
Receive diversity (2-way by default or optional 4-way)
Targeted data rate and quality of service
The Modulation and Coding Scheme (MCS)
Max allowed number of HARQ transmissions
HARQ Operating Point – 20% BLER for 1st HARQ Transmission considered by default
Derived from link level simulations
Note: Currently the Link Level Simulations referenced in the DL LKB are for EVehA3km/h, 2x2 TxDiv

All Rights Reserved © Alcatel-Lucent 2008, XXXXX131 | Presentation Title | Month 2008
Downlink Link Budget
SINR - Selection of Optimal SINR Figures
Based on a set of link level simulation results:
Full range of MCS values
Full range of # RB’s
Example for Downlink 50RB,
10MHz Bandwidth (2x2 MIMO)
LTE DL 2x2 MIMO. EVA-3km/hr
0
10000
20000
30000
40000
50000
60000
-10 -5 0 5 10 15 20 25 30 35 40 45 50
SNR (dB)
Thro
ughpu
t (k
bps)
MCS = 0 MCS = 1
MCS = 2 MCS = 3
MCS = 4 MCS = 5
MCS = 6 MCS = 7
MCS = 8 MCS = 9
MCS = 10 MCS = 11
MCS = 12 MCS = 13
MCS = 14 MCS = 15
MCS = 16 MCS = 17
MCS = 18 MCS = 19
MCS = 20 MCS = 21
MCS = 22 MCS = 23
MCS = 24 MCS = 25
MCS = 26 MCS = 27
MCS = 28 T'put (kbps)

All Rights Reserved © Alcatel-Lucent 2008, XXXXX132 | Presentation Title | Month 2008
Downlink Link Budget
Downlink Performance Analysis (1/3)
Downlink Link Level Results for:
25 RB, MCS 28, TxDiv and 5MHz Bandwidth
0 kbps
2000 kbps
4000 kbps
6000 kbps
8000 kbps
10000 kbps
12000 kbps
14000 kbps
16000 kbps
12.00 dB 14.00 dB 16.00 dB 18.00 dB 20.00 dB 22.00 dB 24.00 dB 26.00 dB
SINR
Thro
ughpu
t
0.0%
20.0%
40.0%
60.0%
80.0%
100.0%
120.0%
BLE
R
Throughput
BLER_0 20% BLER19.4
dB
SIN
R
12Mbps Throughput

All Rights Reserved © Alcatel-Lucent 2008, XXXXX133 | Presentation Title | Month 2008
Downlink Link Budget
Downlink Performance Analysis (2/3)
Downlink Link Level Results for:
25 RB, 1-28 MCS, TxDiv and 5MHz Bandwidth
-5dB cell edge SINR
0 kbps
2000 kbps
4000 kbps
6000 kbps
8000 kbps
10000 kbps
12000 kbps
14000 kbps
0 5 10 15 20 25
MCS Index
Thro
ugh
put
-10 dB
-5 dB
0 dB
5 dB
10 dB
15 dB
20 dB
25 dB
SINR
Throughput
SINR
-5dB Cell Edge SINR Target
MCS 1
660 kbps T’put

All Rights Reserved © Alcatel-Lucent 2008, XXXXX134 | Presentation Title | Month 2008
Downlink Link Budget
Downlink Performance Analysis (3/3)
Downlink Link Level Results for:
1 to 25 RB, All MCS, TxDiv and 5MHz Bandwidth
-5dB cell edge SINR
1 kbps
10 kbps
100 kbps
1000 kbps
2 RB 7 RB 12 RB 17 RB 22 RB
# Resource Blocks
Thr
ough
put
MCS 0
MCS 1
MCS 2
MCS 3
MCS 4
MCS 5
MCS 6
Mod
ulat
ion
& C
odin
g Sc
hem
e
Throughput
Throughput / RB
MCS

All Rights Reserved © Alcatel-Lucent 2008, XXXXX135 | Presentation Title | Month 2008
Downlink Budget
Example: 10MHz BW (Multiple Services)
Dense Urban (2.6GHz) PS 128 PS 256 PS 512No. Resource Blocks 50 RB 50 RB 50 RB
Used Bandwidth 9000 kHz 9000 kHz 9000 kHzUE Noise Figure 7 dB 7 dB 7 dB
eNode-B Antenna Gain 18 dBi 18 dBi 18 dBiCable & Connector Losses 0.5 dB 0.5 dB 0.5 dB
Body Loss 0 dB 0 dB 0 dBPenetration Margin 21 dB 21 dB 21 dB
Limiting UL Cell Range 0.46 km 0.46 km 0.46 km# DL Tx Paths 2 paths 2 paths 2 paths
Total DL eNode-B Tx Power / Path
30 W 30 W 30 W
% DL Power for PDSCH 80% 80% 80%Max eNode-B Tx Power / Service 46.8 dBm 46.8 dBm 46.8 dBm
UE Antenna Gain 0 dBi 0 dBi 0 dBiAdjacent Cell Loading 100% 100% 100%UL Service Cell Range 0.46 km 0.37 km 0.30 km
DL Path Loss @ UL Cell Edge 129.1 dB 125.7 dB 122.4 dBTotal DL Losses @ UL Cell Edge 150.6 dB 147.2 dB 143.9 dB
DL Cell Area Coverage Probability
95% 61% 40%
Geometry at UL Service Cell Range
-4.9 dB -0.1 dB 3.3 dB
Desired Signal -85.8 dBm -82.3 dBm -79.1 dBmAdjacent Cell Signal -80.9 dBm -82.2 dBm -82.4 dBm
Noise -97.5 dBm -97.5 dBm -97.5 dBmCell Edge SINR -5.0 dB -0.2 dB 3.2 dB
Optimal MCS MCS 2 MCS 7 MCS 10Data Rate at UL Service Cell
Edge1323 kbps 3921 kbps 8623 kbps

All Rights Reserved © Alcatel-Lucent 2008, XXXXX136 | Presentation Title | Month 2008
Downlink Link Budget
Summary
The downlink link budgets presented here are indicative of what rates are achievable within the corresponding UL service coverage areas
LTE coverage is not considered to be limited by the DL for typical eNode-B output powers and deployment scenarios with a 23dBm UE output power, link budgets should remain uplink limited
It is important to understand that:
DL cell edge performances are strongly dependent upon scheduler parameters (e.g. tuning of the fairness of the proportional fair scheduler algorithm) or the available bandwidth (e.g. 10MHz vs 5MHz)
DL performances in the link budget are based only on long term average PDSCH SINR values and do not account for dynamic channel variations that can be addressed with frequency selective scheduling functionalities
Better estimates of DL performances can be achieved by means of:
System level simulations and/or Radio Network Planning (RNP) analysis

All Rights Reserved © Alcatel-Lucent 2008, XXXXX137 | Presentation Title | Month 2008
Downlink Link Budget
Required DL Output Power ?
A series of system simulation studies were performed to assess the required Power Amplifier (PA) sizing for 3 different important cases
700 MHz (10 MHz), 2.1 GHz (10 MHz), 2.1 GHz/AWS (5 MHz) and 2.6 GHz (20 MHz)
All scenarios considered 2x2 MIMO on the DL and 2RxDiv on the UL
In principle, all studies concluded the following:
Spectrum efficiency for “reasonable” cell sizes is relatively invariant to reasonable choices for PA sizes
Edge rates become much more sensitive to the choice of power at large cell radiuses

All Rights Reserved © Alcatel-Lucent 2008, XXXXX138 | Presentation Title | Month 2008
Downlink Link Budget
Downlink PA Sizing for LTE – Conclusions
Carrier Bandwidths
PA Power
1.4 MHz 2 x 10 W
3.0 MHz 2 x 10 W
5.0 MHz 2 x 20 W
10.0 MHz 2 x 30 W
15.0 MHz 2 x 40 W
20.0 MHz 2 x 40 W
Recommendations from study(independent of
frequency)

All Rights Reserved © Alcatel-Lucent 2008, XXXXX139 | Presentation Title | Month 2008
RF Design

All Rights Reserved © Alcatel-Lucent 2008, XXXXX140 | Presentation Title | Month 2008
LTE eNode-B Dimensioning
Key Issues to be considered
Cell edge coverage expectations + depth of coverage
Target operating frequency band + propagation assumptions
Overlay versus Greenfield deployment
Antenna system sharing requirements (impact on coverage + optimization constraints)
Radio features, e.g. TMA, RRH, ICIC
Covera
ge
Subscriber usage profile
Subscriber forecast
Spectrum constraints
Peak throughput requirements
Radio features, e.g. ICIC
Cap
acit
y
All Rights Reserved © Alcatel-Lucent 2008, XXXXX141 | Presentation Title | Month 2008
Rollout Phase
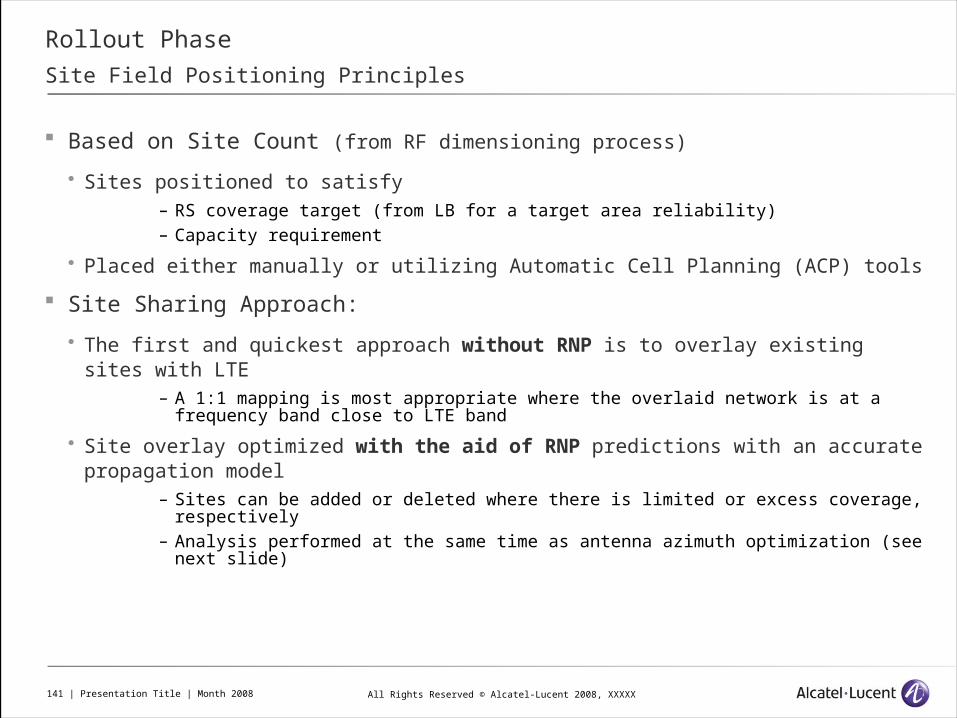
Site Field Positioning Principles
Based on Site Count (from RF dimensioning process)
Sites positioned to satisfy – RS coverage target (from LB for a target area reliability)– Capacity requirement
Placed either manually or utilizing Automatic Cell Planning (ACP) tools
Site Sharing Approach:
The first and quickest approach without RNP is to overlay existing sites with LTE
– A 1:1 mapping is most appropriate where the overlaid network is at a frequency band close to LTE band
Site overlay optimized with the aid of RNP predictions with an accurate propagation model
– Sites can be added or deleted where there is limited or excess coverage, respectively
– Analysis performed at the same time as antenna azimuth optimization (see next slide)

All Rights Reserved © Alcatel-Lucent 2008, XXXXX142 | Presentation Title | Month 2008
Rollout Phase
RF Optimization Criteria
Azimuth optimization and tilt optimization are the main rules to optimize the network in order to have the best radio environment before implementing any features.
The aim are
Optimize coverage in order to reach RSRP targets
To reduce the number of servers covering the same area in order to avoid excessive overlapping.
– This minimize interference without impacting coverage, improve SINR so network performances like
– Throughput – Capacity– Frequency re-use efficiency

All Rights Reserved © Alcatel-Lucent 2008, XXXXX143 | Presentation Title | Month 2008
Rollout Phase
RSRP target
RS-RSSI: total power transmitted dedicated for Reference signal during one OFDM symbol duration
Currently in Atoll it is more RS-RSSI is calculated, and the total power dedicated to RS is 1/6 of Max power. This approach is not 100% of the time in line wit power settings on the field
LA0.x for a 30W PA power energy per RE for RS is 14.9 dBm. Considering 10MHz bandwidth 100 RE are used to calculate RS-RSSI, so total power dedicated to RS over one OFDM symbol is 34.9dBm, but Atoll calculates 30W/6, so 37dBm, so to do the right calculation for this configuration max power set in Atoll should be 43dBm instead of 45dBm.

All Rights Reserved © Alcatel-Lucent 2008, XXXXX144 | Presentation Title | Month 2008
Rollout Phase
RSRP target
LA1.0 for RRH 30W PA power energy per RE for RS is 16.2 dBm. Considering 10MHz bandwidth 100 RE are used to calculate RS-RSSI, so total power dedicated to RS over one OFDM symbol is 36.2dBm, but Atoll calculates 30W/6, so 37dBm, so to do the right calculation for this configuration max power set in Atoll should be 44dBm instead of 45dBm.
LA1.0 for TRDU 40W PA power energy per RE for RS is 18.2 dBm. Considering 10MHz bandwidth 100 RE are used to calculate RS-RSSI, so total power dedicated to RS over one OFDM symbol is 38.2dBm, Atoll calculates 40W/6, so 38dBm, so it is ok
3GPP RSRP definition:
Reference signal received power (RSRP), is determined for a considered cell as the linear average over the power contributions (in [W]) of the resource elements that carry cell-specific reference signals within the considered measurement frequency bandwidth.

All Rights Reserved © Alcatel-Lucent 2008, XXXXX145 | Presentation Title | Month 2008
Rollout Phase
RF Optimization CriteriaOutdoor RSRP target depending on environment and frequencies for UL PS 128 service and UL PS 256, considering 45dBm PA power and 14.9 dBm Reference signal Tx power per RE. RSRP value does not depends on the number of transmit
DL RS EIRP per RE and per transmit:
30.9dBm @ 2600MHz/2100MHz/AWS/1900MHz/1800MHz with 18dBi antenna gain & 2dB cable losses
30.9dBm @ 900MHz/850MHz with 17dBi antenna gain & 1dB cable losses
28.9dBm @700MHz with 15dBi antenna gain & 1 dB cable losses

All Rights Reserved © Alcatel-Lucent 2008, XXXXX146 | Presentation Title | Month 2008
Rollout Phase
RF Optimization Criteria
Currently the calculation done in 9155 is the sum of all Reference signal resource elements power transmitted in a same OFDM time period over all the bandwidth. This approach is not in line with 3GPP as 3GPP specify the linear average of reference signal resource elements.
To compensate this error the following work around must be followed and based on the same analysis done for RS-RSSI calculation
LA0.x for RRH 30W PA power energy per RE for RS is 14.9 dBm. – For 5MHz bandwidth set in Cell table Max power column:
eNode-B PA power -19dB– For 10MHz bandwidth set in Cell table Max power column:
eNode-B PA power -22dB– For 20MHz bandwidth set in Cell table Max power column:
eNode-B PA power -25dB

All Rights Reserved © Alcatel-Lucent 2008, XXXXX147 | Presentation Title | Month 2008
Rollout Phase
RF Optimization Criteria
LA1.0 for RRH 30W PA power energy per RE for RS is 16.2 dBm. – For 5MHz bandwidth set in Cell table Max power column:
eNode-B PA power -18dB– For 10MHz bandwidth set in Cell table Max power column:
eNode-B PA power -21dB– For 20MHz bandwidth set in Cell table Max power column:
eNode-B PA power -24dB
LA1.0 for TRDU 40W PA power energy per RE for RS is 18.2 dBm. – For 5MHz bandwidth set in Cell table Max power column:
eNode-B PA power -17dB– For 10MHz bandwidth set in Cell table Max power column:
eNode-B PA power -20dB– For 20MHz bandwidth set in Cell table Max power column:
eNode-B PA power -23dB

All Rights Reserved © Alcatel-Lucent 2008, XXXXX148 | Presentation Title | Month 2008
Rollout Phase
RF Optimization Criteria
The method proposed is to:
Set indoor penetration losses in 9155 clutter table
Use the UL Link Budget Available Path loss with 0dB penetration losses set in the LB for the dimensioning service selected,
Design RSRP = RS per RE EIRP+ ANT_GAIN – Available Uplink Pathloss – indoor
losses
where:
– RS per RE EIRP = Reference signal EIRP per resource element , it is automatically calculated by 9155 when the work around specified above is followed
– ANT_GAIN = Node-B antenna gain
– Available Uplink Pathloss: UL available pathloss calculated with the link budget when penetration loss is set to 0dB
The RSRP target values specified in slide , have been defined with this approach.
If the user apply this approach, the following recommendation must be respected
Select “indoor loss” icon in 9155 coverage study Do not select
“shadowing taken into account “ icon as it is already done in RSRP target
calculated below

All Rights Reserved © Alcatel-Lucent 2008, XXXXX149 | Presentation Title | Month 2008 149 | Presentation Title | Month 2008
RF optimization criteria
Overlapping optimization
The following rules are not technology specifics, and their efficiency have already been measured on GSM, W-CDMA networks.
Pollution and interference analysis– Within 4dB of the best server
– number of servers should ≤ 4 – % area with 4 servers should be < 2%.– % of area with 2 servers should be < 30%.
– Within 10dB of the best server– number of servers should ≤ 7– % of area with 7 servers should be < 2%.
– High signal level overlap analysis:– Increase the design threshold for the covered area by 10dB– % of 3 servers in the design area should not exceed 10%..– Example: if the RS design threshold is -85dBm, a number of server’s
analysis is done with a threshold equal to -75dBm.

All Rights Reserved © Alcatel-Lucent 2008, XXXXX150 | Presentation Title | Month 2008 150 | Presentation Title | Month 2008
RF optimization criteria
SINR target
This target can be used with 9155 RNP tool, but it is not 100% sure that it can be measured on the field with high accuracy as it is not 3GPP measurement criteria.
In 9155 SINR can be calculated based on reference signal, or PDSCH, and for loaded cases it provides the same results as power per RE RS= power per RE PDSCH
The SINR target value depends on the traffic load:– 95% of the design area should have SINR ≥ -5dB, with 100% DL load– 95% of the design area should have a SINR ≥-2dB with 50% DL load
SINR does not depends on number of transmits
All Rights Reserved © Alcatel-Lucent 2008, XXXXX151 | Presentation Title | Month 2008 151 | Presentation Title | Month 2008
RF optimization criteria
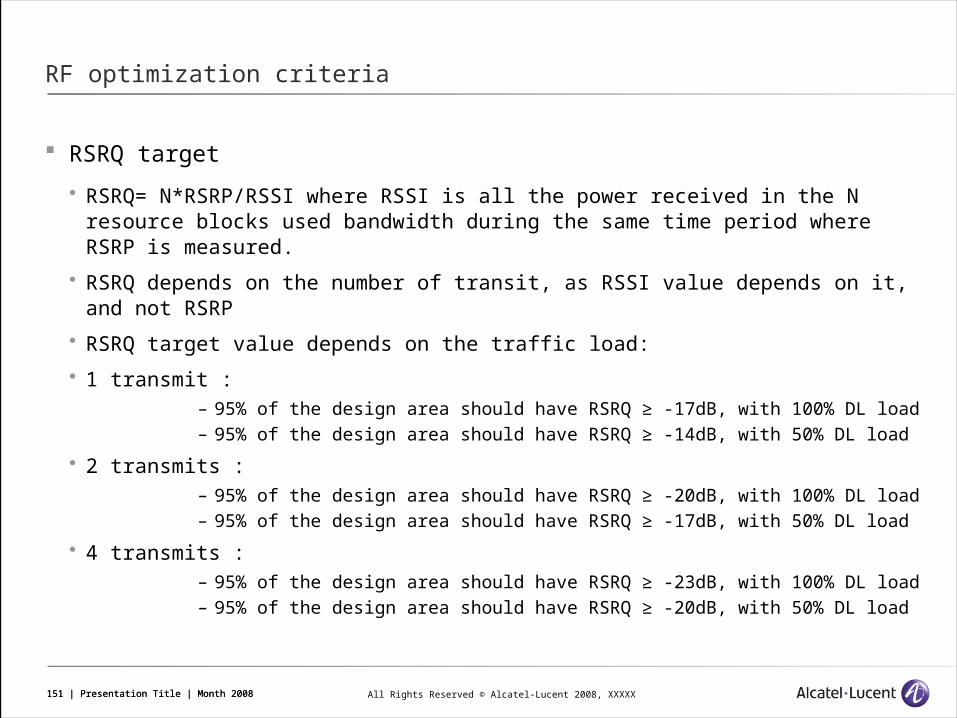
RSRQ target
RSRQ= N*RSRP/RSSI where RSSI is all the power received in the N resource blocks used bandwidth during the same time period where RSRP is measured.
RSRQ depends on the number of transit, as RSSI value depends on it, and not RSRP
RSRQ target value depends on the traffic load:
1 transmit : – 95% of the design area should have RSRQ ≥ -17dB, with 100% DL load– 95% of the design area should have RSRQ ≥ -14dB, with 50% DL load
2 transmits : – 95% of the design area should have RSRQ ≥ -20dB, with 100% DL load– 95% of the design area should have RSRQ ≥ -17dB, with 50% DL load
4 transmits : – 95% of the design area should have RSRQ ≥ -23dB, with 100% DL load– 95% of the design area should have RSRQ ≥ -20dB, with 50% DL load

All Rights Reserved © Alcatel-Lucent 2008, XXXXX152 | Presentation Title | Month 2008 152 | Presentation Title | Month 2008
RF optimization criteria
These targets are been obtained on several well known environments ; where a very good optimization has been done in W-CDMA due to critical inter-site distance : 400m. Same RNP environment has been re-used for LTE predictions without changing anything to evaluate the best SINR & RSRQ reachable in different full traffic load condition.
The RNP prediction and RF optimization done for the different trials in US and Europe confirm that these targets can be reach and are a good way to optimize throughput and reduce interferences.
Overlapping criteria, RSRQ target and SINR target defined above are in line to provide the same RF design. They allow managing interferences in order to obtain a RF network design able to support the best throughput .
10Mbps in cell center for mono-user when all surrounded cells have 100% load
1.5Mbps at cell edge in mono-user for 10MHz bandwidth when all surrounded cells have 100% load

All Rights Reserved © Alcatel-Lucent 2008, XXXXX153 | Presentation Title | Month 2008 153 | Presentation Title | Month 2008
RF optimization criteria
Neighbors & Cell ID planning criteria
Cell id is required to identify each cell, a cell id is the combination of one of the 3 sequences supported by P-SCH and the group Id supported by S-SCH.
– So Realizing a cell id planning = realizing P-SCH planning and S-SCH planning– The strategy recommended is to use the same S-CH per site which induces
that each sector uses a different P-SCH sequence
This distance depends on propagation path loss, the environment and the frequency.
The main criteria are the following one:
Considering two cells cell A and cell B, on the same frequency carrier using the same cell ID, the distance between those must satisfy the following criterias:
– RSRP criteria– At cell A edge (RSRPcellA ≤ -115dBm) : RSRPcellA ≥ : RSRPcellB + 10dB– At cell B edge (RSRPcellB ≤ -115dBm): RSRPcellB ≥ : RSRPcellA + 10dB
– RSRQ criteria for 100% load case ( 2 transmits)– At cell A edge (RSRQcellA ≤ -20dB) : RSRQcellA ≥ : RSRQcellB + 10dB– At cell B edge (RSRQcellB ≤ -20dB): RSRQcellB ≥ : RSRQcellA + 10dB
All Rights Reserved © Alcatel-Lucent 2008, XXXXX154 | Presentation Title | Month 2008 154 | Presentation Title | Month 2008
RF optimization criteria
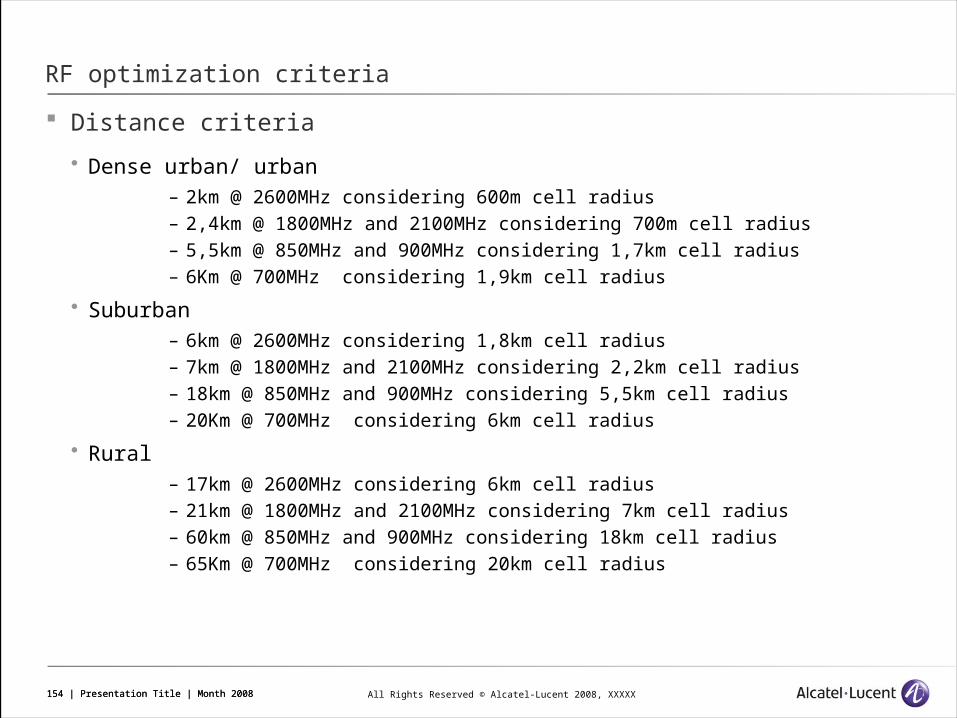
Distance criteria
Dense urban/ urban – 2km @ 2600MHz considering 600m cell radius– 2,4km @ 1800MHz and 2100MHz considering 700m cell radius– 5,5km @ 850MHz and 900MHz considering 1,7km cell radius– 6Km @ 700MHz considering 1,9km cell radius
Suburban– 6km @ 2600MHz considering 1,8km cell radius– 7km @ 1800MHz and 2100MHz considering 2,2km cell radius– 18km @ 850MHz and 900MHz considering 5,5km cell radius– 20Km @ 700MHz considering 6km cell radius
Rural– 17km @ 2600MHz considering 6km cell radius– 21km @ 1800MHz and 2100MHz considering 7km cell radius– 60km @ 850MHz and 900MHz considering 18km cell radius– 65Km @ 700MHz considering 20km cell radius

All Rights Reserved © Alcatel-Lucent 2008, XXXXX155 | Presentation Title | Month 2008
www.alcatel-lucent.comwww.alcatel-lucent.com

All Rights Reserved © Alcatel-Lucent 2008, XXXXX156 | Presentation Title | Month 2008
Hard Handover

All Rights Reserved © Alcatel-Lucent 2008, XXXXX157 | Presentation Title | Month 2008
Hard Handover

All Rights Reserved © Alcatel-Lucent 2008, XXXXX158 | Presentation Title | Month 2008
Hard HandoverPreparation Phase

All Rights Reserved © Alcatel-Lucent 2008, XXXXX159 | Presentation Title | Month 2008
Hard HandoverExecution Phase
All Rights Reserved © Alcatel-Lucent 2008, XXXXX160 | Presentation Title | Month 2008
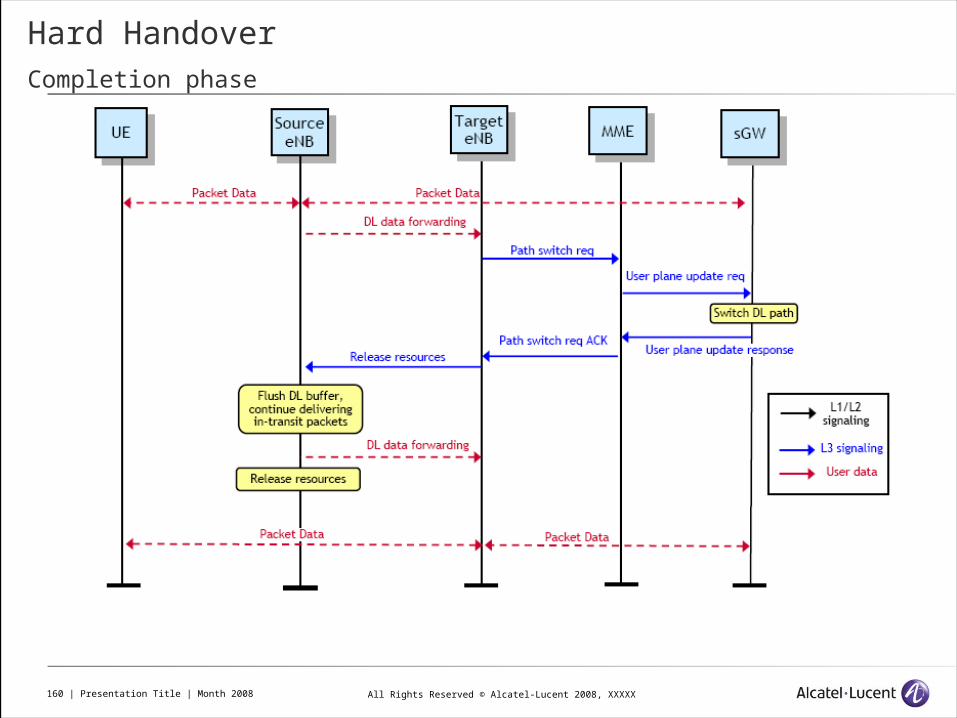
Hard HandoverCompletion phase
All Rights Reserved © Alcatel-Lucent 2008, XXXXX161 | Presentation Title | Month 2008
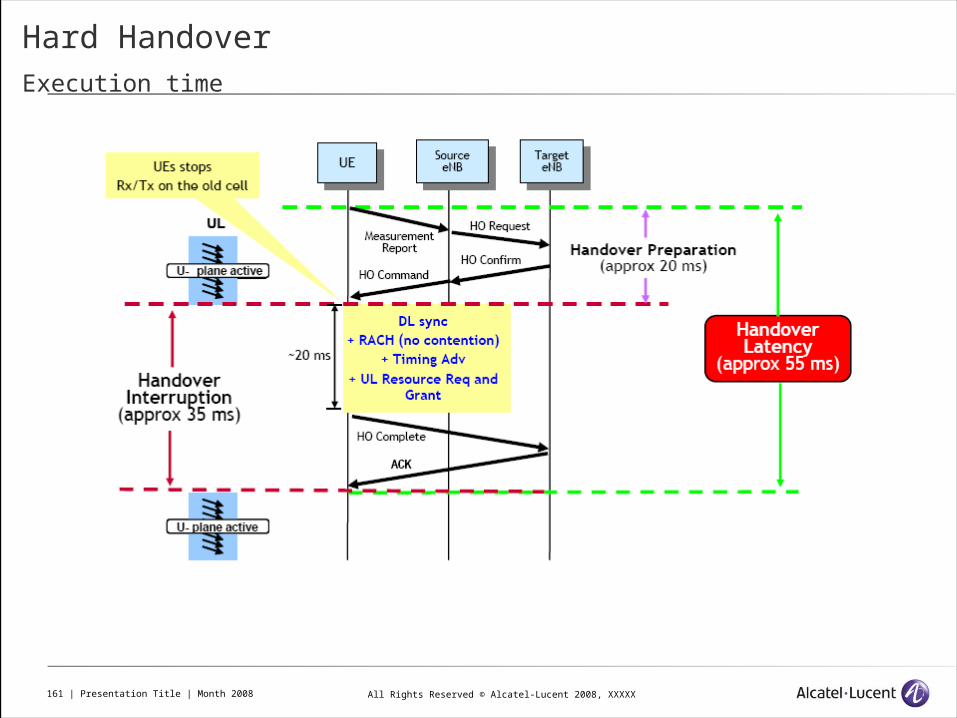
Hard HandoverExecution time