lower cretaceous geology, northwestern karnes...
TRANSCRIPT

T H E A M E R I C A N A S S O C I A T I O N O F P E T R O L E U M G E O L O G I S T S B U L L E T I N V. 52. NO. 5 (MAY. 1968). P. 820-851, 28 FIGS.
LOWER CRETACEOUS GEOLOGY, NORTHWESTERN KARNES COUNTY, TEXAS'
DELOS R, TUCKBR= La Canada, California OIOU
ABSTRACT Northwestern Karnes County, Texas, is underlain by about ,\0OO ft ol Lower Cretaceous sedi
ments. Most of this sequence consists of two dolomitic limestone bodies which were deposited in the backreef provinces of two barrier-reef complexes. Each carbonate body underlies a blanket-type deposit of impermeable shale and shaly limestone; hydrocarbon accumulations are in the carbonales below the upper impermeable sequence but have not been located below the lower.
The sediments were deposited on the nearly level San Marcos platform and in the more rapidly subsiding Karnes trough which crosses the platform to connect the Bast Texas and Rio Grande basins. Post-Early Cretaceous regional tilting on the southeast added to depositionally produced dips on the northwestern side of the trough and subtracted from them on the southeastern side. Hydrocarbons probably accumulated in the structural closure formed along the trough's southeastern hingeline before the directions of depositional dips on the southeastern side were reversed. Up-to-the-coast faulting occurred to trap part of these hydrocarbons before further regional tilting emptied the closures. Isopachous maps of key-bed-bounded units reveal the position of the critical southeastern hingeline as well as the overall configurations of the Karnes trough and surrounding San Marcos platform. Histograms and scatter diagrams of various production, structural, and stratigraphic quantities verify and dramatize the relations established by the conventional isopachous and structural contour maps.
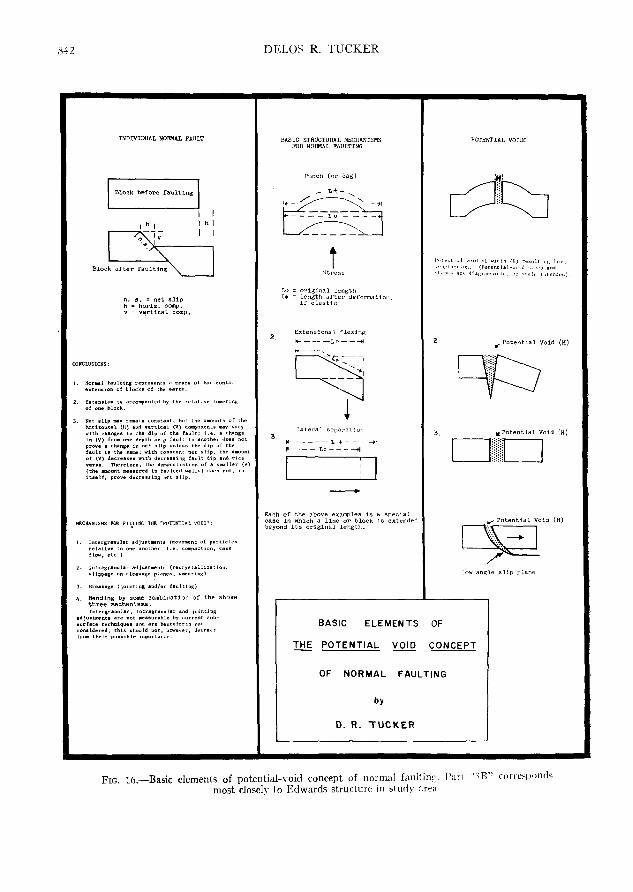
Normal faults of the Sample fault system follow the trend of the Karnes trough through the study area. Two down-to-the-coast normal faults with a total vertical displacement of about 1,4(X) ft exist on the northwestern side of the trough and at least 12 up-to-the-coast normal faults with a total vertical displacement of about 1,400 ft occur on the other side. The total horizontal displacement of all faults is about 2,000 ft. The nearly equal vertical displacements, the "opposing t\'pe" fault pattern, and the geometric configuration of the strata closely fit a gravitational slide-block model. The down-to-the-coast faults are thought to flatten at depth to represent the major slip planes along which the slide block moved downdip toward the axis of the (julf Coast geosyncline. .\ potential void 2,000 ft wide was generated at the head of the slide and u|i-lr)-llie coast faulting occurred to "fill" the potential void.
The potential void concept can be extended to provide a philosophical basis for a quantitative approach to many extensional tectonics problems, especially those connected with normal faults. The three basic tectonic mechanisms which create potential voids and the resulting normal faults are "punch or sag" type stresses, extensional flexing, and lateral separation. The spatial characteristics and historical development of the faults associated with the several type^ of potential \()ids are distinctive and predictable.
INTRODUCTION injr the la.st S-IO years: this activity has been di-
Northwestern Karnes County, Texas, has been rected primarily toward finding petroleum depos-
the site of considerable deep drilling activity dur- its in the Edwards Limestone. To date, several major fields producing from the Edwards have
'Modified from a paper published by the South ' ' e ^ " discovered, and continued drilling suggests Texas Geological Society (Tucker, IQft.S). Manuscript that the final cha])ter i> yet to be written, received March 27, 1967; accepted July 12, 1%7. j ^ e purpose of thi.- |)aper is to present an anal-
• Glendale College, Glendale, Calif. . ' . ^ . , •, , , • My sincere thanks are extended to Edgar W. Owen YSis of the information currently available in a
for his ever-inspiring, often agitating, and always form which may aid in the further development challenging discussions on many subjects, includirig ^ j ^ ^ • ; j ^|^,, „ , .^j^, ^^ ^^^ ^ j ^ ^ ^ ^ ^ ^^^_ most of the ones of this report. John R. Sandidge " read the manuscript and offered many helpful and siderable knowledge ol the Early Cretaceous his-appreciated suggestions. The writer also expresses his tory of Central and South Texas. deep appreciation to the South Texas Geological So- „,, . . . ., . .,, r . ciety for financial support covering part of the draft- l^e writer hopes thai others will see fit to ex-ing expenses. Porter A. Montgomery, William G. Pitt-man, and Wilford L. Stapp contributed much through — their suggestions and reflections on various parts of My wife, Fran, did most of the preliminary typing the subject matter; they are sincerely thanked. The and all of the drafting with the poorest equipnient study began under a summer grant from The Uni- and working conditions imaginable; the instructions versity of Texas Foundation. The writer also is given her were not the best and were constantly grateful to Sherman A. Wengcrd for helpful discus- evolving so that changes of well-done diagrams were sions, and for suggesting certain changes which were required. My ajiologies to her for the adversities that incorporated in the manuscript (Wengerd and Szabo, she endured, and my endearing appreciation for her 1Q67). fortitude, perseverance, and thoughtfulness.
820
LOWER CRETACEOUS GEOLOGY, NORTHWESTERN KARNES COUNTY, TEXAS 821
LOCATION MAP
T E X A / S
r^' > / '
/GONZALES
/ < ,A „/WILSON ^^^/ \
/ ' ^^ DEWITT / '
/ ! A T A S C 0 8 A ^ 5 ' * * ' " ' " ^ ^ ^ " - "
/ /
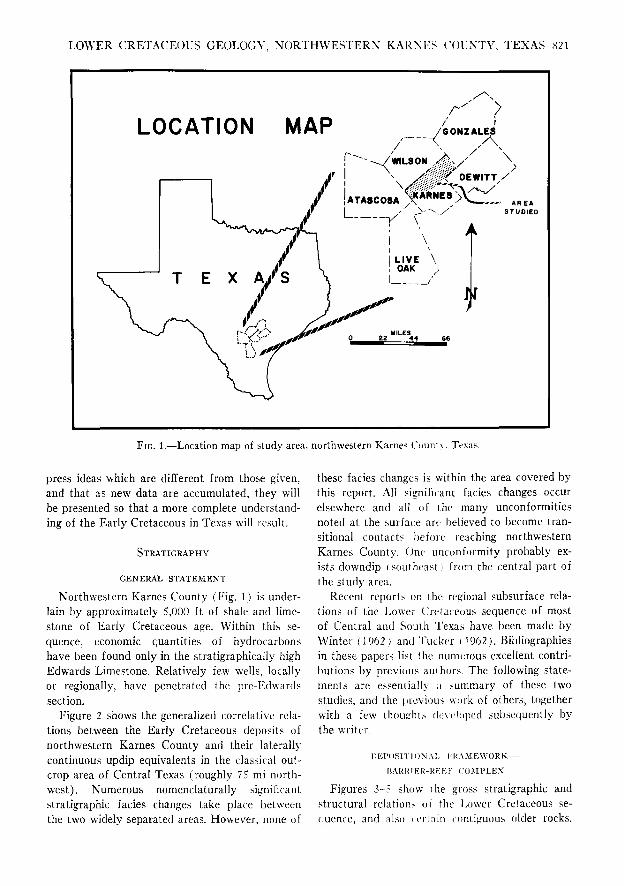
Fro. 1.—Location map of study area, northwestern Karnes County, Texas.
press ideas which are different from those given, and that as new data are accumulated, they will be presented so that a more complete understanding of the Early Cretaceous in Texas will result.
STRATIGRAPHY
GENERAL STATEMENT
Northwestern Karnes County (Fig. 1) is underlain by approximately 5,000 ft of shale and limestone of Early Cretaceous age. Within this sequence, economic quantities of hydrocarbons have been found only in the stratigraphically high Edwards Limestone. Relatively few wells, locally or regionally, have penetrated the pre-Edwards section.
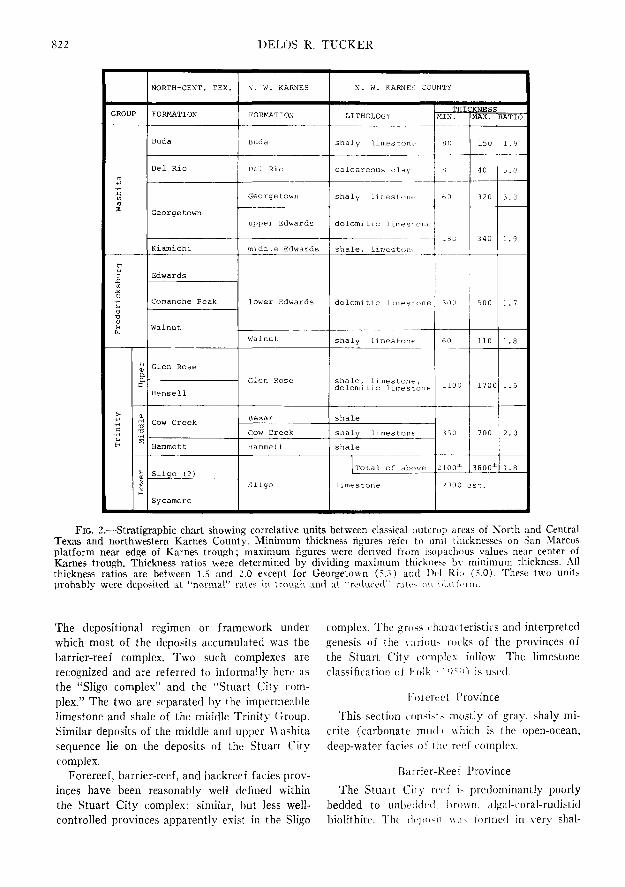
Figure 2 shows the generalized correlative relations between the Early Cretaceous deposits of northwestern Karnes County and their laterally continuous updip equivalents in the classical outcrop area of Central Texas (roughly 75 mi northwest). Numerous nomenclaturally significant stratigraphic facies changes take place between the two widely separated areas. However, none of
these facies changes is within the area covered by this report. All significant facies changes occur elsewhere and all of the many unconformities noted at the surface arc believed to become transitional contacts before reaching northwestern Karnes County. One unconformity probably exists downdip isoutheasi ,i from the central part of the study area.
Recent reports on the reeional subsurface relations of the Lower Cretaceous sequence of most of Central and South Texas have been made by Winter (1962) and Tucker i 1962). Bibliographies in these papers list the numerous excellent contributions by previous authors. The following statements are essentially .i summary of these two studies, and the previous work of others, together with a few thoughts dcxcloped subsequently by the writer.
I IEPOSITIONAI. KKAMEWORK—•
KARIUER-KKKF COMPLEX
Figures 3-5 show the gross stratigraphic and structural relation.- ol (he Lower Cretaceous se-f|uence, and also (crtaiii contiguous older rocks.
822 DELOS R. T U C K E R
GROUP
2
1
1 •g
I
-a -H
0)
3 0
NORTH-CENT. TEX.
FORMATION
Buda
Del Rio
Georgetown
Kiamichi
Edwards
Comanche Peak
Walnut
Glen Rose
Hensell
Cow Creek
Hammett
Sligo (?)
Sycamore
N. W. KARNES
FORMATION
Buda
Del Rio
Georgetown
upper Edwards
middle Edwards
lower Edwards
Walnut
Glen Rose
Bexar
Cow Creek
Hammett
Sligo
N. W. KARNES COUNTY
LITHOLOGY
shaly limestoni.'
calcareous clay
slialy limestone
dolomitic limes t.cnt_'
shale, limeston.;
dolomitic limestone
shaly limestone
shale, limestone, dolomitic limestone
shale
shaly limestont
shale
iim
Total of above
sstone
THICKNESS KIN.
3 0
"
oO
13C
3O0
60
ILOO
3 50
2100^
2 0 0 0 L
MAX.
150
40
320
340
500
110
1700
700
3800^
RATIO
1. 9
3.C
5 . 3
1.9
1.7
1.8
1.5
2.0
1.8
St.
FIG. 2.—Stratigraphic chart showing correlative units between classical nutcnip areas of North and Central Texas and northwestern Karnes County. Minimum thickness figures refer to unit thicknesses on San Marcos platform near edge of Karnes trough; maximum figures were derived from isopachous values near center of Karnes trough. Thickness ratios were determined by dividing maximum thickness b> minimum thickness. All thickness ratios are between 1.5 and 2.0 except for Georgetown (i.S) and Del Rio (5.0). These two units probably were deposited at "normal" rate? in trough and al "reduced" ratc^ mi :il.itf"rm.
The depositional regimen or framework under which most of the deposits accumulated was the barrier-reef complex. Two such comple.xes are recognized and are referred to informally here as the "Sligo complex" and the "Stuart City complex." The two are separated by the impermeable limestone and shale of the middle Trinity Croup. Similar deposits of the middle and upper Washita sequence lie on the deposits of the Stuari City complex.
Forereef, barrier-reef, and backreef facies provinces have been reasonably well defined within the Stuart City complex; similar, but less well-controlled provinces apparently exist in the Sligo
complex. The gross i haracteristics and interpreted genesis of the variou- r()( ks of the provinces of the Stuart City comjilex follow. The limestone classiiication of Folk • '.•)'-^''] is used.
borercel Province
This section consists mostly of gray, shaly mi-crite (carbonate mud i which is the open-ocean, deep-water facie.? of the reef complex.
F:iarrier-Reel Province
The Stuart Cily reef i> predominantly poorly bedded to unbeilded, brown, algal-i oral-rudistid biolithite. The deposit wa^ formed in very shal-

LOWER CRETACEOUS GEOLOGY. NORTHWESTERX KARNES COUNTY, TEXAS &2i
RIO GRANDE EAST TEXAS BASIN SAN MARCOS PLATFORM BASIN
BEBHaETSWR
SCHEMATIC
BLOCK DIAGRAM
of the
LOWER CRETACEOUS
REEF COMPLEX
figure 3 .
SOUTHWESTERN HALF AFTER JAN WINTER (1962)
Fic. 3.—Schematic block diagram of Lower Cretaceous reef complex, South Texas. Study area is in backreef province on San Marcos platform
low, highly agitated, clear water at the outer edge consumer. It also acted as an effective barrier to of the backreef shelf. Physical and biological pro- landward-moving waves and currents. This processes operating behind the reef were influenced tection produced comparatively calm water in the strongly by its pre.sence. The reef acted as a de- backreef area. The reef served as an effective sill positional base level, sediment trap, and nutrient which usually prevented hypersaline waters, de-
RIO GRANDE BASIN
SAN MARCOS PLATFORM EAST TEXAS BASIN
SOUTHWEST NORTHEAST
Fro. 4.—Diagrammatic southwesi-northeast section across San Marcos arch at end of (leorgetown deposition.
824 DELOS R. T U C K E R
NORTHWEST
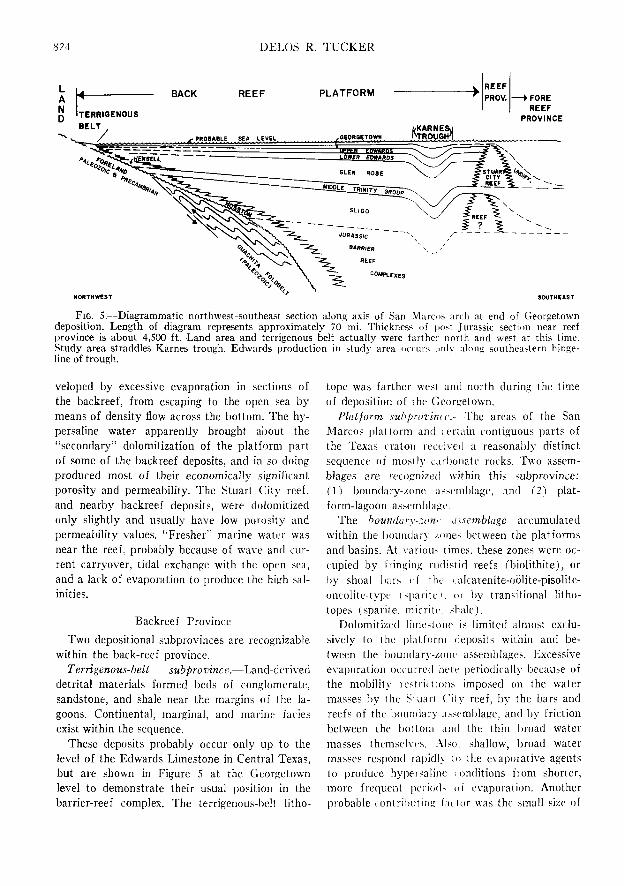
FIG. 5.—Diagrammatic northwest-southeast section along axis of San .Marcos arch at end of Georgetown deposition. Length of diagram represents approximately 70 mi. Thickness of post-Jurassic section near reef province is about 4,500 ft. Land area and terrigenous belt actually were farther north and west at this time. Study area straddles Karnes trough. Edwards production in study area onurs only along southeastern hinge-line of trough.
veloped by excessive evaporation in sections of the backreef, from escaping to the open sea by means of density flow across the bottom. The hy-persaline water apparently brought about the "secondary" dolomitization of the platform part of some of the backreef deposits, and in so doing produced most of their economically significant porosity and permeability. The Stuart City reef, and nearby backreef deposits, were dolomitized only slightly and usually have low porosity and permeability values. "Fresher" marine water was near the reef, probably because of wave and current carryover, tidal exchange with the open sea, and a lack of evaporation to produce the high salinities.
Backreef Province
Two depositional subprovinces are recognizable within the back-reef province.
Terrigenous-belt subprovince.—Land-derived detrital materials formed beds of conglomerate, sandstone, and shale near the margins of the lagoons. Continental, marginal, and marine facies exist within the sequence.
These deposits probably occur only up to the level of the Edwards Limestone in Central Texas, but are shown in Figure 5 at the Georgetown level to demonstrate their usual position in the barrier-reef complex. The terrigenous-belt litho-
tope was farther west and north during the time of deposition of the Georgetown.
Platform suhprorin<:c.- The areas of the San Marcos jijatform and < ertain contiguous parts of the Texas cratoii received a reasonably distinct sequence of mostly carl)onate rocks. Two assemblages are recognized within this subprovince: (1) boundary-zone assemblage, and (2') platform-lagoon assemblage.
The boundary-zonr assemblage accumulated within the boundary zones between the platforms and basins, .^t variou.- times, these zones were occupied by fringing rudistid reefs (biolithite), or by shoal bars of the i alcarenite-oolite-pisohte-<mcolite-type isiiaritei, or by transitional Ktho-topes (sparite. mirrite, shale I.
Dolomitized limestone is limited almost exclusively to the platform deposits within and between the houndary-zonc assemblages. Excessive evaporation occurred here periodically because of the mobility restri( tioiis imposed on the water masses by the Suiart City reef, by the bars and reefs of the boundary assemblage, and by friction between the bottom and the thin broad water masses themselves. ,\lso. shallow, broad water masses respond rapidly lo the evaporative agents to produce hypersaline i iinditions from shorter, more frequent ])eriotls oi evaporation. Another probable contribiitinu factor was the small size of

LOWER CRETACEOUS GEOLOGY. NORTHWESTERN KAKNKS COUNTY, TEXAS 825
the streams which entered this part of the lagoon as inferred from the thin terrigenous sequence.
The study area is in the platform-lagoon assemblage zone of the backreef province. A shallow-water lagoon with a nearly level bottom extended from the Stuart City reef across the area between the boundary zones. Micrite (carbonate mud) and calcarenite were the predominant materials deposited in the lagoon. There are, however, examples of practically every type of carbonate and carbonate-related rock in this sequence.
A partial list of these materials is: algal "mat" and algal "lump" beds; iiat-pebble conglomerate (intrasparite, intramicrite); bioclastics tbiospar-ite, biomicrite); foraminiferal and molluscan calcarenite (biosparite) and mud fmicrite, biomicrite); pellet mud (pelmicrite); rudistid, coral, oyster-reef rock (biolithite) in the form of variously shaped reefs or widespread biostromal beds; thin layers and nodules of gypsum, celes-tite, anhydrite; and very fine-grained "primary" dolomite (in some places as rounded inclusions in overlying beds).
Waves generated within the basin waters broke on the reefs and shoal bars around the platforms. Wave carryover and currents distributed reef detritus into the platform lagoon, but very little of this material was moved toward the basins. Most of the clastic limestone beds therefore are broad bands adjacent to bars, fringing reefs, and the Stuart City barrier reef. The numerous types of micritic (mud) deposits present on the platform are centrally located between the clastic bands and are the low-energy facies equivalent of the elastics. Many of these deposits were dolomitized under the above conditions. The organisms of the reefs behind the Stuart City barrier reef probably received their nutrients from upwelling basin water.
Basin Subprovinces
The Rio Grande and East Texas basins were the sites of large backreef lagoons having somewhat deeper water than that on the platforms. The basin deposits usually are well-bedded, shaly micrite and calcareous shale. A few thick high-rank evaporites were deposited in the basins (Ferry Lake Anhydrite), perhaps because of abnormally low stream influx into the lagoons together with excessive evaporation. The terrige
nous-belt deposits generally are thick near the central landward margins of the basins. The major drainage system? pass through these same areas today.
K.XTENT OF BAKKIER-REEF COMPLEX
The major facies provinces described above appear to ring the Gulf of Mexico from the tip of Florida to near Yucatan or farther. Also, a large part of the section in the Gulf Coast geosyncline between the basement (usually deformed Paleozoic sediment.-, and metasediments) and the Lower Cretaceous se(|uenie contains facies provinces similar in relalive geographic distribution and charackr ID tho-e of the Stuart City complex. It is the writer's opinion that most of these materials originated within the regimen and depo-sitional framework of barrier-reef complexes analogous to the Stuan City comple.x. Many carbonate sequences elsewhere also fit this overall depo-sitional pattern. The study of such deposits should be based on an appreciation of the inherent structural, hiologiral, and stratigraphic properties demanded liy ihc regimen of the barrier-reef complex. The use of a sloping continental platform as a model for analyzing such deposits leads to numerous fallacious conclusions. For example, transgressions and regressions of the sea result in unconformities and facies relations directly related to ihe angle of the slope over which the sea moves. Relaiixeiy large changes in sea level are rei|uireil to expose or inundate significant areas of a sloping continental platform. Slight changes in sea level may, however, rapidly expose or inundate very large areas of barrier-reef complexes because of their flat or nearly flat shape.
FliNDAMEXTAL liAStS OF SuBSUKFACE CoRRELArioN: BEDDING
Nearly all subsurface information given for the Stuart City complex could have been determined without the use of a time framework based on fossils. The writer's subsurface work was done without the use of index, guide, or zone fossils. This is not meant to belittle the great value of these tools, but lo point out a matter of simple truth; i.e., almost all .subsurface geologists use a relative time scale based directly on the law of superposition and not on the evolutionarily deter-

826 DELOS R. TUCKER
mined "scale of life" which is itself based on the law of superposition. Fossils are used mostly when such correlations are not available or are doubtful. The subsurface geologist usually correlates electric log "kicks," "beds," "marker-beds," "horizons," "levels," or "key beds," Solid straight lines on his cross sections usually connect such features. The positions of zone fossils i rarely shown) normally appear as weaker dashed lines and commonly are mentioned only casually in the accompanying text. Comparable physical correlation lines on the surface geologists' diagrams connect such things as "notches" and "lumps" on erosional profiles, "thin .shale bed." "mottled limestone bed," and so on.
The lack of recognition of the "bed approach" in the current system of nomenclature probably can be traced back to the events related to the rejection of the catastrophic philosophies which genetically equated rock units, physical and biological events, and time. With the full emergence of uniformitarianism these phenomena could no longer be equated automatically. With the rejection of the catastrophic philosophies, the concept of using beds as a basis of correlation and nonien-clatural subdivision was undermined but its use had to be continued for practical purposes. Textbooks used in college courses today emphasize the nomenclatural systems of the well-founded time, time-stratigraphic, and rock-stratigraphic units. The "bed approach" of stratigraphic analysis usually is mentioned separately in lonnection with such things as bentonite beds and lavas. With this background the geologic graduate reports to his employer for job assignment; if this assignment is concerned with subsurface sedimentary rocks, electric logs must almost inevitably be correlated. Then, almost by custom alone, the geologist begins matching up the "wiggles" (beds) on the logs. As time passes, he picks up the informal vernacular and philosophy of bed correlation. So begins a philosophic schi.sm which liurdens his work and thoughts from that day on because there is no accepted system of nomenclature, or philosophy related thereto, which recognizes or is founded on the features which are correlated.
Criticisms of subsurface studies in many cases are related directly or indirectly to the common use of physically defined chronostratigraphic units. Because the exploration for, and exploitation of, petroleum deposits proceeds primarily
through the use of this most basic and commonly most misunderstood tool, and because the units mapped in this study are of this nature, the following thoughts are presented. If the philosophy is incorrect, then it ,-hould be rejected and a correct one formulated. Otherwise it should be formally recognized in the current system of strati-graphic nomenclature and further utilized.
The expression "lieddintr plane" refers to the plane (surface! of separation between adjacent beds; "bed" refers lo the material between the bedding planes. Most .-.o-called "Ijeds" are really multi-beds which are recognizable entities. Beds may range in character vertically and laterally between their bounding liedding planes. A sedimentary rock unit lonsisi^ of "beds" with lertain characteristics in lomtnon which permit their total expression t<i l)e labeli'd as a rock-stratigraphic unit ('formation, i-lr ) The geographic boundaries or spatial limits of the roik unit may or may not coincide with the extent of the bedd'ng planes and their enclosed beds. Heddini;, then, should be and is traceable from one rock unit (typel to another in many sedimentary stMjuences.
.\ bed of internally lonstant or gradational rock type, whii h nia\' be traced across a certain area, generally is referred to as a "key bed" or "marker bed." hi the normal usage of these terms, the area is thought of as being large, but philosophically there is ni) compelling reason to place an areal limit in the definition. The subsurface geologist niainlains that his beds or key beds are essentially synchronous throughout their extent. Presumably, the development of a key bed represents a temporally unique event.
Figure 6 shows the preciseness of correlation which is possible with kt->' beds in parts of the Lower Cretaceous se(|uence across the northeastern boundary zone of I he San Marcos platform. It also demonstrates a facies change in which the lower beds of I he Ceorgetown grade into Edwards. The middli' iMlvvards i, Kiamichi) onlaps an irregular erosion surfacr and pinches out near the right side of the diaeram. The length of the section is about 70 mi. .Most of the individual beds within the Buda and Ceorgetown can be traced with ease into UDrthwcstern Karnes County (about 40 mi awayi .itiij through a large part of Central and South Texas. Key beds usually are not recognizable regionally within the Del Rio and Edwards. In the Del Rio the thinness of the

LOWER CRETACEOUS GEOLOGY, N O R T H W E S T E R N KARXES f O U N T Y , TEXAS S2 7
BUDA
UPPER EDWARDS
LOWER f EDWARDS
DEL RIO
GEORGETOWN
FIG. 6.—Detailed south-north correlation section showing lateral continuity of Buda and Georgetown. Beds persist even though their compositions differ considerably from one area Id another. Section begins in San Marcos arch on left and crosses Round Rock syncline to Belton |)osimenl on right. Lower part of Georgetown changes facies southward into upper Edwards. Middle Edwards (Kiamichi equivalent) onlaps northwestward an irregular erosion surface developed across Belton posiment,
beds and the uniform lithologic character prevent sufficient bedding expression on electric logs. The upper Edwards contains many laterally discontinuous beds and commonly has offscale readings on the various log curves.
The four units for which isopachous maps were prepared in this study (Buda, Del Rio, Georgetown, and the upper and middle Edwards; Figs. 7-10) are key-bed bounded in northwestern Karnes County and therefore are regarded as rock-stratigraphic and time-stratigraphic units. Expressions such as "Buda t ime" are then considered valid, but not in good practice, for the area in which such units exist. It is then legitimate to say that "the rate (time component) of deposition of the Buda was greater where the thickness of Buda is greatest."
These thin persistent sedimentary units within and bounding the section for which i-sopach maps were prepared are thought to represent simultaneous, regional, bottom-affecting events which
may have been generated by droughts, "tloods" of wind- or water-born particles (clay, ash, pollen), earthquake^, tsunamis, seasonal and other climatic changes, eustatic sea-level variations, changes in current vek)city, etc. These events resulted in the formation of vertically separable, laterally persistent sedimentary units or beds: such beds may e.v:hil)it lateral variations in lithologic character. The hot torn-affecting e\'enl< need not cause the deposition oi' the same rock tyi)e across all the area affected, but only a simultaneous change or disturbance of the numerous types which had been accumulating at various localities.
Most geologists aci cpl the concept that individual ash beds, (urbidite beds, and lava are physically defined chronostraligraphic features. Each of these beds is developed by a "catastrophic' ' change in the norma! cimlinuum of sedimentation. The writer >uggesi.-, therefore, that such lieds repre-^enl analogou- interruptive changes produced b\- the niinuTdti,-- temporally restricted

828 DELOS R. TUCKER
FIG. 7.—Buda isopachous map. Contours in feet. Dots represent positions of wells. Note thinner sections above Person-Labus posiment and unnamed posiment near upper right corner of map. Axis of Karnes trough extends from northeast to southwest. San Marcos platform is on both flanks of trough. Edwards hydrocarbons have been produced only from trough's southeastern hingeline and Person-Labus posiment. Maximum thickness in trough is 1.9 (thickness ratio) times that on platform.
FIG. 8.—Del Rio isopachous map. Contours in feet. Note large difference in thickness between platform and trough sections. Thickness ratio is 5.0.
FIG. 9.—Upper and middle Edwards isopachous map. Contours in feet. Thickness ratio is 1.9.
FIG. 10.—Georgetown isopachous map. Contours in feet. Thickness ratio is S.3.
LOWER CRETACEOUS GEOLOGY, N O R T H W E S T E R N KARNi:S COUNTY, TEXAS 829
phenomena which obviously individuate themselves on the usual gradually changing scene. This is believed to be a completely uniformitarian viewpoint and one which takes cognizance of the continual but episodic happenings observed so commonly.
The following points are given in support of this thesis:
1. The one unifying characteristic of adjacent depo-sitional realms is the depositional bottom. It is certain that different lithotopes and biotopes may exist, or have existed, on or above the bottom. Some of the many events which occurred in the past should liave resulted in recognizable changes of deposition across the area affected by the event. Bedding [)lanes may thus be the records of such phenomena, .\lmost all agree that the bedding planes seen al an oulcroi) or in a core represent paleobottom positions. No uniformitarian principle in use today prevents some of these paleobottoms from extending laterally beyond a well or an outcrop.
2. The key beds referred to here have lateral variations in composition and thickness such as would be produced simultaneously in adjacent lithotopes and biolopes; i.e., they show internally consistent lilho-logic, biologic, hydrodynamic, and tectonic relations.
3. Depositional phenomena such as facies relations, channels, reef masses, etc. occur with respect to the bedding as their Recent equivalents do on modern bottoms. Thus, the key beds show the same behavioral relations to physical and biological phenomena as do their modern analogs to one another.
4. Structural features such as folds, basins, and platforms usually are depicted by structural contours drawn with key beds as datums. These structural features exist and are verified in most cases by outcrop patterns as well as by paleontological and u'eo-physical information.
5. Excellent, very detailed surface work in Central Texas led Martin (1961, p. SS) to state:
In the Georgetown the individual limestone (bio-micrite) and marl beds have exceptional lateral persistence, are essentially parallel with the ammonite zonation, and are apparently quite close to being isochronous throughout their lateral extent.
Wilbert (1066) and other students of the Lower Cretaceous of Texas make nearly identical statements about comparable rock bodies. The "beds" delimited by these workers can, in most cases, be recognized on well logs and correlated through most of the subsurface of South and Central Texas.
6. To regard each regionally persistent bed in a
vertical sequence of dozens of similar but individual beds as the product of what was a migrating lithotope adjacent to other dozens of migrating lithotopes would require a precision uf migration beyond reasonable uniformitarian heliel.
". If the regiiiTially persistent marker beds are not delimited by paleoboiiom^. then what are their bounding surfaces and how did they originate? In discussions, ()[)p()nl-nl^ uf the use of marker beds repeatedly stale thai ' . rock units are not time units,'' thus implying tlia rock units and beds are tlie same things. Ojjponents conini(.nl\ fail, or do not attempt, to explain tlir ueiiesi> uf the observed features.
Qualification i<>r usi: al key beds.—The use of key beds for a stratigra])hic framework should be based on an apprciiation of the succeeding statements. Cro.^s-bcddcd iitiii-. of the sediment wave type obviously dci rca-( in age in a downcurrent direction and Ihi'ir u-agc as marker beds therefore is not rei (iintni'ndcd. However, the significance of this age difference is debatable. Beds have spatial limits and these should be expected. Consideration ol the dcjjositional environment is of [jrime importantc in this respect; for example, deltaic sediments normally have beds of restricted geographic distribution. The more individual beds in a vertical seijiiem c i sample) which can be reliably correlateil. lh( intjrt certain one can be of their isochroneity. Hed.s are not necessarily limited to a particular lithosome. They usually persist beyond the type-section lithology of the formation and therefore are not, nor do they necessarily enclose, only rock units. Type sections represent (mly one sample of an internally variable sedimentary continuum joined by bedding planes. The dominant phenomena within the continuum are usually the 'leds. not a particular lithologic type.
Nomenclatural void.- The Code of Strati-graphic Nomenclature (19611 does not specifically exclude time-stratigraphic units based on physical criteria and it specifically does not include them. .4s the writer interprets the Code, it does not contain a ttrin which can be used for key-bed-liounded setiticnccs such as those described herein.
r>ozo and Stricklin i 1056) suggested the revival of the term 'division'' as a time-stratigraphic unit limited liy unconformities and, or other physical criteria (key beds?). I'orL'otson (1957), in an excellent discussion if ihi^ overall nomenclatural

830 DEI.OS R. T U C K E R
problem, proposed the use of the term "format" for "marker-defined units." Certainly, some sort of formal term should specifically recognize these much used stratigraphic units. Greater understanding, utilization, and ease of communication would be the result. The term would not necessarily require the acceptance of a particular philosophic viewpoint as to their genesis but merely the recognition of the sort of units being used.
The Buda may serve as an example of the no-menclatural void. In its type area, the Buda Limestone consists of a sec|uence of various light-colored limestone beds. In other areas, the Buda (note the absence of the term "limestone") is different lithologically from its type lithology. For example, in northwestern Karnes County, the Buda is a sequence of dark-gray to black, shaly limestone and calcareous shale. Elsewhere its lithologic character is significantly different from either of the two mentioned. To call this complex the "Buda Limestone" is a misnomer because formations, by definition, require litholodc unity. The suggested, formally acceptable and much-used solutions to such problems are either to formulate separate rock-stratigraphic names for the various lithotypes or to designate, by name, litho-facies provinces within the "formation." Both solutions are workable and satisfy well-known requirements of stratigraphic nomenclature. Either of these solutions ends with a nomenclalural sul)-division of a mappable section. The further the subdivision process goes, the more the correlata-ble unit is obscured, or perhaps entirely eliminated, nomenclaturally. Is not the mappable unit the most important unit of all? Obviously, it is physically correlatable throughout the various areas where the subcategories are jiresent because they could not be delimited without such correction.
Requirements, such as a name for the mappable unit, should be satisfied by mutational nomen-clatural changes demanded by the most rigorous masters of all—practicality and utility. The sul)-surface geologist has accomplished this goal, despite all the contrary "legal dicta," simply liy referring to the mappable unit as, in this case, the "Buda," or "Buda equivalent," etc. This practice leads to confusion because of its ambiguous relationship with rock-stratigraphic and lime-strati-graphic nomenclature and concepts. The writer recommends the use of the term formnt a- pro
posed by Forgotson (1057) for such units. Format is preferred over "division" (Lozo and Stricklin, 1956), because format is defined precisely on the basis of marker-bed boundaries.
Steno's laws of original horizontality and superposition are recognized by all as the major tools in stratigraphic studies. Steno's law of original continuity (of Ijcds) is used almost as much, but, in the writer's opinion, geologists seem to do Iheir best to reject it (ieoloL'is!s cannot, howe\er, do without it.
DEPOSI iHi.NAL STRUCTURES
During Early Cretaceous time, the area described in this pajier was on the southeastern part of the San Marcos platform, one of the major structural features and depositional provinces within the Texas part of the Gulf Coast geosyn-cline. The Karnes trough (new name), an elongate area of greater than normal subsidence, extended across the platform and through the middle of the study area. Se\eral subsidiary depositional structures may be delineated within the Karnes County part of the trough.
K/\K-\KS 1 kOUC.ir
The name "Karnes trough" is herein proposed for the synclinal feature which existed during Early Cretaceou.s time (probably earlier and later, also) in northwestern Karnes County and adjacent regions. The Karnes trough extends northeastward through Gonzales County into central Fayette Count\- where it merges with the East Texas basin ( FIK^. 11, 12). I t continues southwest of Karne> County through southeastern Atascosa County and then pas.ses into the irregular margin of the Kio (Irande basin.
Description of Irouvh. - T h e Karnes trough ranges in width from l.i to M) mi, l i s a.xial region is sinuous and i.s interru[)lc<i in places by posi-ments (Person-Labus posiment) and negaments (Hysaw trouL'hi. Murra\ ' i 961, p. 4) stated:
The terms posiment (contraction of positive element, post -j- ment) and negament (contraction of negative element, nega -(- ment) are here introduced as general terms for geologic elements of local to subregional or even regional nature which, re.spectively, have been relatively positive or negative during any part of geologic time, They hav<; no particular form (pr shape and there i> no im|)lication as lo subcrustal form and shape, as, Im example, in the case of massif. The terms are innsidered es|)eciall>- applicahle in situations where ilu' ''lasemenl appears lo liaxe

LOWER CRETACEOUS GEOLOCrY, N O R T H W E S T E R N KARXF.S COUNTY, TEXAS 8.51
„.,.„IIU " " ' . " " 'Uy,„__ __„„»' " " " " ' " "1 . , , „J ' " ' ""••(•••.Af.f'OX EO^E t"" TROUGH
^ / ^ ' ' ' ^ / i , . «HES T.OOOH . > ; f ^ ^
, r I ' ^ . ^ f 1 /<-PERSON-LABUS POSIMENT / ^ ^ W -
'X ^^Bwfci iSi f / "*** "v.... t t ^ " * ^ ? .", t A
0 ' S S » r r r _ . "• •*• .T.. APPROX. EDGE OF TROUGH ^ P P R O X . EDGE OF TROUGH
^°'"°^°»""'^ DEPOSITIONAI t^TRiiCTliRPy^ FIG. 11.—Depositional structures. Compare position of southeastern edge ot Karnes and Hysaw troughs with areas of Edwards production shown on P'igures \^ and 26. Directions of depositional dip are shown by arrows. Post-Early Cretaceous regional lilting toward southeast increased southeasterly depositional dips on northwestern flank of trough. Tilting decreased norlhwesterlv depositional dips, and finally reversed their direction. Today all dips are southeastward but rale of dip is lower along southeasti'ni llatik of trough
been positive or negative and to have affected the area. The Hysaw trough ; iieganient) appears to
branch from the .txis of the main trough. It may. form and shape of the overlying sedimentaries.
The sides of the trough present a wavy appearance on the isopachous maps (Figs. 7-10) and in very few places show persistent enchjscd posi-ments or negaments. However, one persistent po-siment is near the northern corner of the study
however, extend larthir northeast and southwest than is indicated on I'isiurr 11. H so, more production from the iJlwatd- may be expected along its southeastern tlank « heie I hi- small Hysaw-Edwards field now is locatcil.
FAULT SYSTEMS
I. BALCONES
2-LULING
3.CHARLOTTE
4. SAMPLE
5. MEXIA - T A L O O
FIG. 12.—Major structures and Early Cretaceous depositional provinces. Position of platform-basin facies boundaries is shown for part of I ime of deposition of Fredericksburi; (Iroup.
832 DELOS R. TUCKER
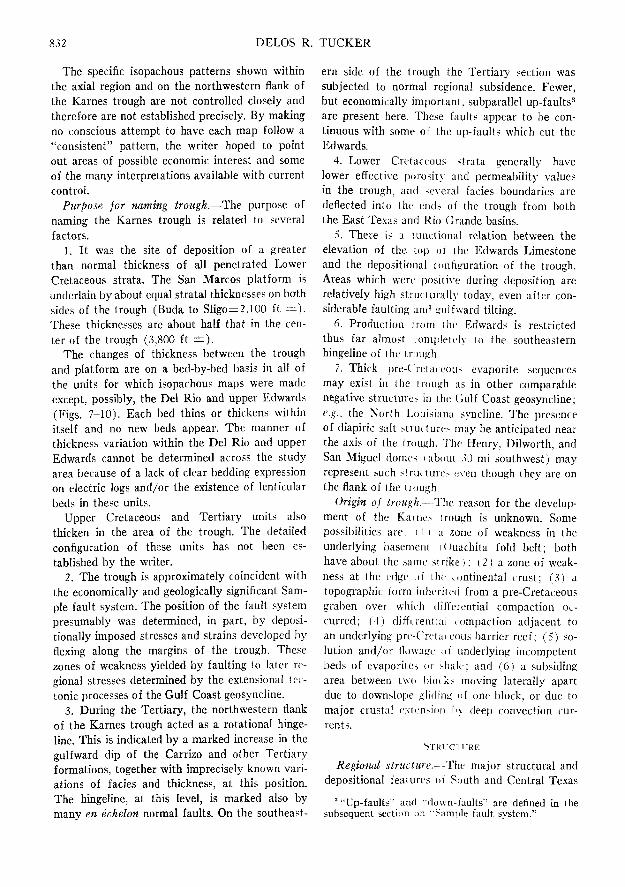
The specific isopachous patterns shown within the axial region and on the northwestern flank of the Karnes trough are not controlled closely and therefore are not established precisely. By making no conscious attempt to have each map follow a "consistent" pattern, the writer hoped to point out areas of possible economic interest and some of the many interpretations available with current control.
Purpose for naming trough.—The purpose of naming the Karnes trough is related to several factors.
1. It was the site of deposition of a greater than normal thickness of all penetrated Lower Cretaceous strata. The San Marcos platform is underlain by about equal stratal thicknesses on both sides of the trough (Buda to Sligo=2.100 ft = ) . These thicknesses are about half that in the center of the trough (3,800 ft ± ) .
The changes of thickness between the trough and platform are on a bed-by-bed basis in all of the units for which isopachous maps were made except, possibly, the Del Rio and upper Edwards (Figs. 7-10). Each bed thins or thickens within itself and no new beds appear. The manner of thickness variation within the Del Rio and upper Edwards cannot be determined across the study area because of a lack of clear bedding expression on electric logs and/or the existence of lenticular beds in these units.
Upper Cretaceous and Tertiary units also thicken in the area of the trough. The detailed configuration of these units has not l;)een established by the writer.
2. The trough is approximately coincident with the economically and geologically significant Sample fault system. The position of the fault system presumably was determined, in part, by deposi-tionally imposed stresses and strains developed liy flexing along the margins of the trough. These zones of weakness yielded by faulting to later regional stresses determined by the extensional tectonic processes of the Gulf Coast geosyncline.
3. During the Tertiary, the northwestern flank of the Karnes trough acted as a rotational hinge-line. This is indicated by a marked increase in the gulfward dip of the Carrizo and other Tertiary formations, together with imprecisely known variations of facies and thickness, at this position. The hingeline, at this level, is marked also by many en echelon normal faults. On the southeast
ern side of the trough the Tertiary section was subjected to normal regional subsidence. Fewer, but economically important, subparallel up-faults^ are present here. These faults appear to he continuous with some of the iip-faults which cut the Edwards.
4. r.,ower Cretaceous strata generally have lower effective porosity and permeability values in the trough, and >e\eral facies boundaries arc deflected into the end.- of the trough from both the East Te.xas and Rio Grande basins.
5. There is a functional relation between the elevation of the top of the Edwards Limestone and the depositional configuration of the trough. Areas which weri' positive during deposition are relatively high .stru( turally today, even after considerable faulting and gulfward tilting.
6. Production from ihe Edwards is restricted thus far almost .ompletiK' to the southeastern hingehne of I he trough.
7. Thick |:)re-Crctace()us evaporite sequences may exist in Ihe irough as in other comparable negative structures in the Gulf Coast geosyncline; e.g., the North Louisiana syncline. The presence of diapiric salt structure may be anticipated near the axis of the trough. The Henry, Dilworth, and San Miguel domes (about 30 mi southwest) may represent such structures even though they are on the flank of the trough.
Origin of trough.- The reason for the development of the Karnes trough is unknown. Some possibilities are. ( 1 i ;i zone of weakness in the underlying basement iOuachita fold belt; both have about the same strike ): (2 ) a zone of weakness at the edge of the rontinental crust; (3) a topographic form inherited from a pre-Cretaceous gralien over which differential compaction occurred: (4) differential compaction adjacent to an underlying pre-("retai eous barrier reef; (S) solution and/or flowage of underlying incompetent beds of evaporites or shale; and (()) a subsiding area between two blocks moving laterally apart due to downslope gliding of one block, or due to major crustal evicnsion In dee|) convection currents.
.STKICTI-RE
Regional structure.—The major structural and depositional features of South and Central Texas
' "Up-faults" and •(iown-faults'' are defined in the subsequent section cm "Sarni)le fault system."
LOWER CRETACEOUS GEOLOGY, NORTHWESTERN KARNES COUNTY, TEXAS 83.3
relevant to this paper are shown on Figure 12. The platform and basin areas are shown in their approximate positions for part of the time of deposition of the Fredericksburg sediments.
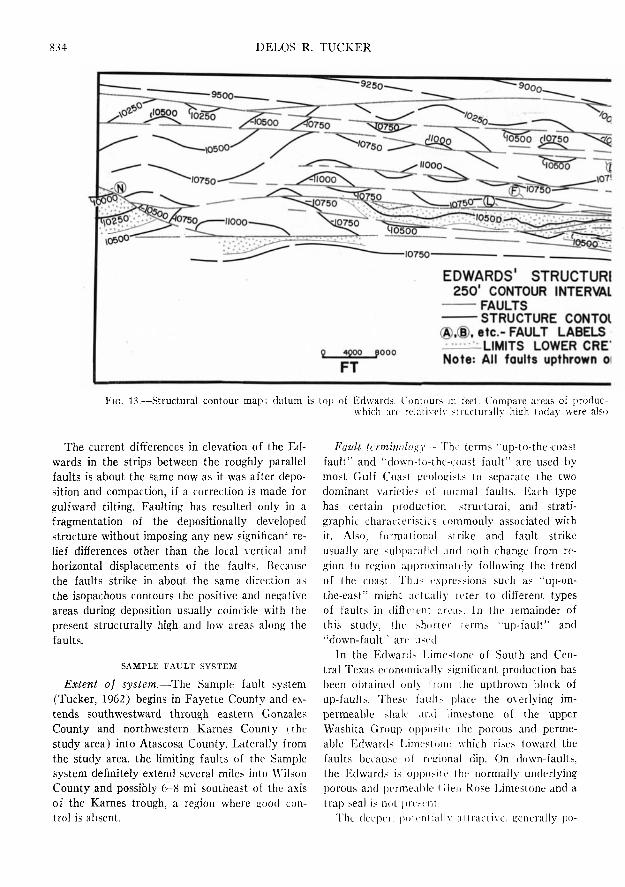
Local structure.—Figures 1.3 and 14 show the interpreted structure with datum at the top of the Edwards Limestone. The contour interval is 250 ft, a necessity for clarity of presentation. The original work map was contoured on a .SO-ft interval.
General statement.—The regional strike of all formations, isopachous contours, and faults is northeast; regional structural dip is southeast. The elevation of the top of the Edwards Limestone in the report area ranges roughly between
— 8,000 and —11,700 ft. In the western segment (northeast of fault A), the top of the Edwards ranges between —8,000 and -10 ,250 ft. In the larger eastern segment, the elevation of the top of the Edwards ranges between —9,500 and
— 11,700 ft. Overall, there is little change in elevation across this segment because of upfaulting and original depositional structure. In fact, some of the structurally highest areas arc farthest "downdip" (southeast) in the eastern part of this area.
Genesis of structure.—The structure of the Edwards was produced by three processes: (1) differential depositional subsidence: (2) displacement by the faults of the Sample fault system; and (.3) regional tilting toward the axial region of the Gulf Coast geosyncline.
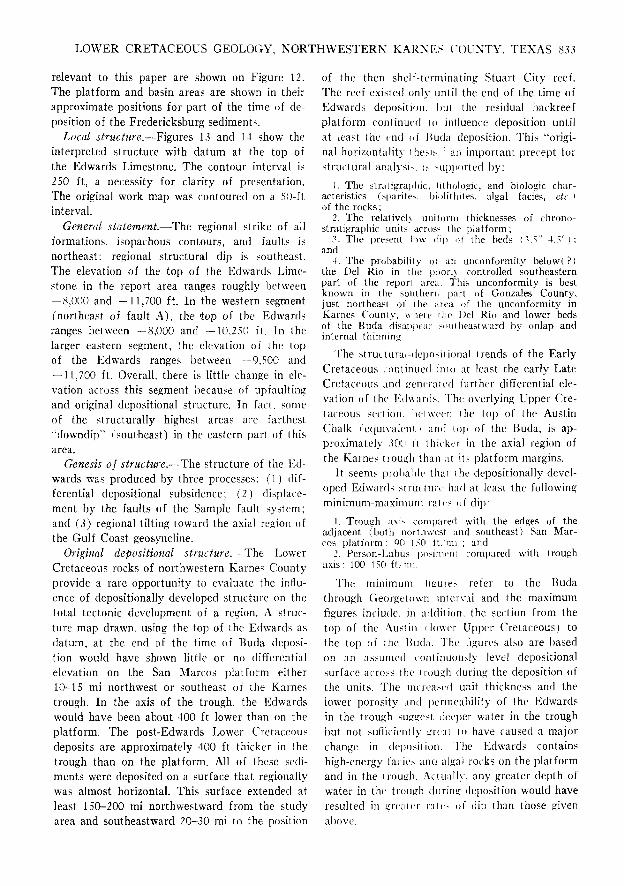
Original depositional structure.—The Lower Cretaceous rocks of northwestern Karnes County provide a rare opportunity to evaluate the influence of depositionally developed structure on the total tectonic development of a region. .\ structure map drawn, using the top of the Edwards as datum, at the end of the time of Buda deposition would have shown little or no differential elevation on the San Marcos platform either 10-15 mi northwest or southeast of the Karnes trough. In the axis of the trough, the Edwards would have been about 400 ft lower than on the platform. The post-Edwards I^ower Cretaceous deposits are approximately 400 ft thicker in the trough than on the platform. All of these sediments were deposited on a surface that regionally was almost horizontal. This surface extended at least 150-200 mi northwestward from the study area and southeastward 20-30 mi to the position
of the then shelf-terminating Stuart City reef. The reef existed only until the end of the time of Edwards deposition, liut the residual backreef platform continued lo inlluence deposition until at least I he end of Buda deposition. This "original horiiiontality ihesis. an important precept for structural analysis, is >upported by:
1. The 3tratigra[ihic, iltholoRic, and biologic characteristics (>|)arite<, Ijiolithites, algal fades, etc-} of the rocks;
2. The relativel\ uniform thicknesses of chrono-straligraphic units across the platform;
,''. The present low fli|! of the beds Cv. ;' 4..=!° J; and
4. The probabilily ot an unconformity belowt ?,) the Del Rio in tlie poorly controlled southeastern part of the report area. This unconformity is best known in the southern part of Gonzales County, just northeast of the area of the unconformity in Karnes County, w liere ihe Del Rio and lower beds of the Buda disappear ^(Hilheastward by onlap and internal thinning
The structural-depositional trends of the Early Cretaceous continued into at least the early Late Cretaceous and generated further differential elevation of the l^Kvards. The overlying Upper Cretaceous section, jclwcen ihe top of the Austin Chalk (eciui\alent I and top of the Buda, is approximately ,50(1 ft thicker in the axial region of the Karnes trough than at its platform margins.
It seems jjrohalile thai the depositionally developed Edwards structtiic had at least the following minimum-maximum lalcs of dip;
1. Trough axis conipareil with the edges of the adjacent (both northwest and southeast) San Marcos platform: 00 I .=:0 ft, mi ; and
1. Person-Labtis po^inien; compared with trough axis: 100 150 ft, mi
The miniinum liKure> refer to the Buda through Georgetown interval and the maximum figures include, in addition, the section from the top of the .-Austin i lower Upper Cretaceous) to the top of the Huda. The figures also are based on an assumed continuously level depositional surface across the trough during the deposition of the units. The increased unit thickness and the lower porosity and jjcnneability of the Edwards in the trough suggest deejjcr water in the trough hut not sufficiently great lo have caused a major change in deposition. The Edwards contains high-energy facies and algal rocks <m the platform and in the trough. .-Xctually, any greater depth of water in the trough during deposition would have resulted in great IT rale- of dip than those given abo\'c.
834 DELOS R. T U C K E R
.^r ,%0-
•9500
,10580 c - g ^ -
- 9250 9000-
d^°9.. »2^7'50 ' s ^ ^ ^ ' *°-" ^ ' ; ,Q~ -~__-_ . (ii£Qp \ ''OSOO CJOZSO
-"000.^^^ ^ ^lO^BCo
''Or.
Q 4Q00 gOOO
FT
EDWARDS' STRUCTURI 250' CONTOUR INTERVAL
FAULTS STRUCTURE CONTOl
K.®. etc.- FAULT LABELS LIMITS LOWER CRE'
Note: All faults upthrown o
FIG. 1. .- -Structural contour map; datum is top of Edwards. I'ontours in feel. Compare areas of ])roduc-which are relativelv >;ructuraliv hisih toda\' were al?o
The current differences in elevation of the Edwards in the strips between the roughly parallel faults is about the same now as it was after deposition and compaction, if a correction is made for gulfward tilting. Faulting has resulted only in a fragmentation of the depositionally developed structure without imposing any new significant relief differences other than the local vertical and horizontal displacements of the faults. Because the faults strike in about the same direction as the isopachous contours the positive and negative areas during deposition usually coincide with the present structurally high and low areas along the faults.
SAMPLE FAULT SYSTEM
Extent of system.—The Sample fault system (Tucker, 1962) begins in Fayette County and e.x-tends southwestward through eastern Gonzales County and northwestern Karnes County (the study area) into Atascosa County. Laterally from the study area, the limiting faults of the Sample system definitely extend several miles into Wilson County and possibly 6-S mi southeast of the axis of the Karnes trough, a region where Kood control is absent.
Fault tcrminoldiiy. ~ The terms "up-to-the-coast fault'' and '•down-to-lhe-coast fault" are used by most Gulf Coast geolosi-^ts to separate the two dominant varieties nf normal faults, liach type has certain production, structural, and strati-graphic characteristics commonly associated with it. .'Mso, formational strike and fault strike usually are sul)])arallel and l)oth change from region to region ai)))roxiniat(iy following the trend of the coast. Thu- expressions such as "up-on-the-east" might actually icfer to different types of faults in diffcictit arca>. In the remainder of this study, the shorter terms "up-fault" and "down-fault" are use(J.
In the Kdwar<].-~ Limestone of South and Central Texas e(onomically significant production has been obtained (jnly from the upthrown block of up-faults. These fault.- jilace the overlying impermeable shale and limestone of the upper Washita Grou]) op|)osiie the porous and permeable Edwards Liniesloiie which rises toward the faults because of regional dip. On down-faults, Ihe Edwards is ojijiosiie the normally underlying porous and permeable (Wen Rose Limestone and a tra]5 seal is not pre.-cnt
The (leejier, potenlialK- attractive, generally po-
LOWER CRETACEOUS GEOLOGY, N O R T H W E S T E R N KARNKS COUNTY, TEXAS .s35
JRS (see text) T. PRODUCTION n s.e. except ® »(§
lion with position of Person-Labus posiment and hingelines of Karnes and Hysaw trouj^hs (VVii. 11). .Areas relatively positive during time of deposition of sediments.
rous and permeable limestone of the Sligo Formation and the overlying impermeable shaly middle Trinity Group present a situation comparable with that of the Edwards-upper Washita which should result in traps on up-faults; howe\'er, significant production has not been olitained from the Sligo on such features in South and Central Texas.
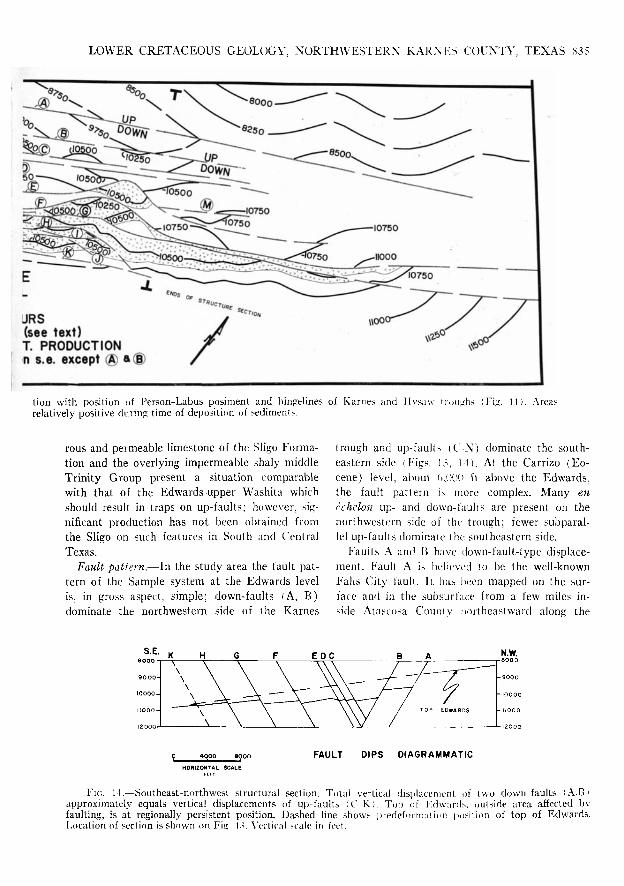
Fault pattern.—In the study area the fault pattern of the Sample system at the Edwards level is, in gross aspect, simple; down-faults (A, B) dominate the northwestern .side of the Karnes
trough and up-faults (C-N) dominate the southeastern side I Figs. I,\ 14). At the Carrizo (Eocene) level, aliout ti.OOti ft above the Edwards, the fault pattern is more complex. Many en
echelon up- and down-faults are present on the northwestern side of the trough; fewer subparal-lel up-faults dominate the southeastern side.
Faults A and B have down-fault-type displacement. Fault A is believed to be the well-known Falls City fault. It has been mapped on the surface and in the subsurface from a few miles inside .4tascosa County northeastward along the
FAULT DIPS DIAGRAMMATIC HORIZONTAL SCALE
Fic. 14.—Soutlieast-northwesl structural section. Total vertical displacement of two down-faults (A.Bl approximately equals vertical displacements of up-faults (C-K). Top of I';dvvar(l>. outside area affected by faulting, is at regionally persistent position. Dashed line shovv> predefoinialinn posiiion of top of Edwards. Location of section is shown on Fi.L', 1,v \'ertical scale in foci.

836 DELOS R. TUCKER
Wilson-Karnes county line almost to Gonzales County. Fault B is indicated by large differences in the elevation of the Edwards between closely spaced wells. Part of these elevation differences may be caused by comparatively high dips rather than by faulting. Faults C to N have up-fault-type displacement. Of these, only C, I), and M have had no production from the Edwards developed along them.
More faults apparently are present across the southern end of the Person-Labus posiment. Their positions may be the result of greater ex-tensional stresses or zones of weakness over the posiment. The lack of sufficient well control along strike, however, prevents the determination of their full lateral extent.
Fault E, which controls production in the Labus field, may be a down-fault situated south of the producing area into which the top of the Edwards rises in a southward direction. If so, this is the first production from the I'dwards on a structure of this type known to the writer. Several workers pointed out this possibility and supported their thesis with seismic control and unre-leased well logs.
Strike of faults.'—Regionally, the structure contours, isopachous contours, and faults have sub-parallel northeast strikes. In the areas of Fashing, Person, and Labus lields, however, the strike of several of the up-faults deviates northward from their regional trend. In each of these areas the isopachous contours also swing north of their regionally consistent positions. This similarity of fault and isopachous strike, both locally and regionally, is thought to exist partly because the sides of the trough were stressed (stretched or flexed) by unequal depositional subsidence (which also largely controlled the relative stratal thicknesses). This extensional stress was oriented at right angles to the isopachous contours and generated zones of weakness, perhaps in the form of elastically preserved stresses or strains (tension cracks or joints), which were approximately parallel with the sinuous edges of the trough. (Near-vertical fractures, usually filled with sparry cal-cite, commonly occur in cores of the Edwards.) Theoretically, the zones of weakness developed most prominently where the flexing was greatest; i.e., where the increase in thickness of the formations is greatest.
The zones of weakness were faulted and frac
tured during later regional stresses whose genesis was related to the extensional mechanisms involved in the complex grand tectonics of the Gulf Coast geosyncline. Two types of extensional mechanisms are thought to have been active in northwestern Karnes County: (I) differential rotational downwarping along the northwestern flank of Karnes trough i jirobably controlled origin of en echelon faults prominent in Tertiarj' rocks), and (2) gravitational sliding (generated subparal-lel faults seen at i he Edwards), The latter appears to have aft'ecied the trough from one side to the other. The liino o' activity of these mechanisms are not cleai.
Speculatively, one might say that the earUest fault displacements, from either or both of the mechanisms, occurred in the zones of weakness where the formation,- have their maximum increase in thickness i hange. Hydrocarbon accumulation in the Edwards Limestone may have occurred along some oi Lhese earliest fault-generated traps. Production from the Edwards in the study area occurs only where the up-faults and the hinge area of t he t rough exist together.
Dip of jauUs.- -Vht dip figures are derived from the writer's mathematical analysis of several of the faults and fr(jm cross sections through oil fields by Knebel ( l'.i5!i, Fisj;. S) and Knapp (1962, Fig. 4). Cursory (il).servalions of the other faults indicate the preseru e of >imilar dips. Well control is sparse below ihc I'Mwards Limestone and nonexistent from ajiproximately 1, ,000 ft downward. I-'ault correlation and calculated dip values below the Edwards are ihirefore not firmly established. The dip of the up-iaults (C-N) is .TO -TO" in the Tertiary i sandstone, shale i, .S, ' -45° in the (mostly 1 Upper Cretaceous (predominantly shale), and 4S''^(>'^ \n the Lower Cretaceous (mostly limestone I. Fault dips and rock competence apparently are related in that the higher dips exist in the more competent deposits.
The down-faults \ and B, for which data are scarce, have an average dip of about 60° from the surface to the tofi of the Edwards. Far below the Edwards, perhaps in (he middle Trinity shale or deeper, the down-faults may flatten, probably into bedding-plane faults. The maximum depth at which the theorized flattening occurs may be estimated by projecting the limiting up- and down-faults K. and A downward to their intersection, on the assumption 'liai tlie up-fault K was re-
LOWER CRETACEOUS GEOLOGY, NORTHWESTERN KARNES COUN'n', TEXAS 837
sponsive to the lowest part of the "potential void"* generated at the head of the slide block (Fig. 16, 3B). This maximum depth, depending on fault dips used, occurs 10,000-15,000 ft below the top of the Edwards. This depth may be considerably less if the fault dips decrease downward rather than maintain the dips obserx'ed near the Pvdwards level.
The existence and displacements of the bedding-plane faults would be nearly impossible to determine with electric logs or seismic tools because no beds would be cut out or missing. The writer believes that the down-faults may l)ecome low-angle faults or bedding-plane faults because the down-faults, the up-faults, and the structural configuration of the strata fit a conceptual, theoretical model of a gravitational sUde block, which is much like a mega-landslide (Fig. 16, 3A, 3B). At the Edwards level, the total vertical disjjlacement of the up-faults is approximately equal to the total vertical displacement of the down-faults, a relation which suggests that the two arc related responsively. Rollover (anticlinal structure on the down-thrown block of down-faults because of reverse drag) and reverse drag are comparable with backward rotation on the upper part of landslides. Rollover and reverse drag are known to exist on fault A within the relatively incompetent Tertiary section in the Falls City field. Reverse drag may occur in the downthrown beds of the up-faults as well, but is not determinable with certainty from current well control. Dipmeter surveys of the critical wells might demonstrate its existence. Assuming that bedding-plane faults exist, the economically significant southeastern margin of the Karnes trough below the slip plane would be offset at least 1,500 ft from its position above the fault. This distance should be taken into account if a well is ever drilled for that objective.
It should be noted also that a well penetrating a low-angle normal fault will show only part (because of missing section) of the actual net slip on the fault plane. This situation is believed to cause many geologists to assume that such faults are dying out downward. Fault dip, in relation to bedding dip, must be considered in such situations.
Displacement of faults.—In the best-controlled
* Defined in subsequent section entitled "Potential-void concept of normal faulting."
central part of the study area, the total vertical displacement 11.200-1,.500 ft) of the top of the Edwards by the down-faults is approximately equal to the total vertical displacement tl,100-1,400 ft'i of the up-fault.-. The existence of undiscovered major up-faults in this area is considered unlikely unless: I ' ) ihere is a corresponding increase in the displacement of the down-faults; or (2) unknown down-faults exist; and/or (3) one of the known up-faults dies out (or several de-crca.se in displarcmttu Kigether) and is replaced by an unknown up-lauit. The nearly equal vertical displacement,^ of ihc up-faults and down-faults are l>elieved to rellci t their mutual dependency genetically within a i ommon stress regimen (explained in seition on Potential-void concept of normal faulting"). The net result of the equal but opposing displacements is that, in the area of the fault zone, the top of the Edwards is lowered by faulting below it> regional surface of curvature. The maximum amount of fault lowering is in the fault block bet ween ihe southernmost down-fault (B) and the nurlhcrnmost up-fault (C) (Fig. 141.
The total horizontal displacement (extension of the area) is approximately 2,000 ft at the Edwards level. The displacement is shared nearly equally in this ruse between the two fault types because of their similar angles of dip. According to the potential-void concept, the total horizontal values for each fault i}-pc may differ with differences in fault dips, l)ut their vertical values must approximately balance i scc' Fig. 16, 3A, 3B). The vertical and jiei-slip values of all analyzable faults decrease upward from the Edwards in ihe relatively incompetent . hale and argillaceous limestone section. In the LOOO-ft interval just above the Edwards. clis|)lacements usually decrease 1,5-40 pcicent. and at higher levels may pass upward into a monocline. This abrupt decrease may l)e altribuled to (1) greater flexing caused by frictional drag in the incompetent section near the faults; ihis flexing decreases the amount of cut-out section ^hown in a well log but not the actual amount cjf bed offset outside the drag zone; i 2 i extension by fracturing and jointing rather than by fauhinn; and (3) inter- and in-tragranular adjustments lo achieve extension. The upward disappearance c)f the entire fault-producing stress regime is not considered likely except pos.sibly where the temporal relations between the

83 S DELOS R. TUCKER
deposition of the sediments and the existence of the stress system indicate that the stress regime had disappeared. Part, or all, of the stresses may have been relieved before some of the younger strata were laid down.
Below the Edwards (at least to the Sligo). sparse control suggests that fault displacement remains about the same as at the Edwards level. This presumably reflects comparable stress fields and the apparent similar competence of I he post-Sligo to Edwards rocks.
The variation of the displacement along the length of the faults is difficult to evaluate Ijecause control usually ceases or becomes too scattered before the faults die out. The best-controlled faults, F and G (Fig. 14), have a total vertical displacement which ranges along strike from ^50 to 600 ft. Xo decrease is apparent within the area of definite control. How much farther they continue is unknown. These same characteristics seem to fit the other faults. The theory of the potential-void concept requires that the down-faults and up-faults be of similar geographic distribution and similar vertical displacement becau.se of their mutual dependence.
Where two faults intersect, the displacement of the remaining fault increases to ec}ual (approximately) the amount of the displacements of the individual faults, thus indicating their response to a common eciual stress. Two such intersections probably occur, one at the northeast end of Fashing field I faults L and X) and the other just southwest of the center of Person field (faults 1'' and L) (Fig. 13).
Age. of faulting.—The latest activity on the Sample system faults was after early Miocene time and probably terminated before the Pleistocene, because Miocene beds are cros.sed by some of the faults, and river-terrace deposits apparently are not (Anders, 1962, PI. 1).
The time of the earliest period of fault activity is difficult to establish and is the subject of considerable debate among South Texas geologists. The writer believes that fault displacements probably did not begin until after the Early Cretaceous for ihe following reasons.
I. Isopachous maps of Lower Cretaceous units reveal few abnormal thickness changes at the faults (Figs. 7-10). Estal)lished thickness irends continue across the faults. Figure 10 shows fault traces and isopachs together.
2. Local thickness anomalies, such as the 130-ft-thick Kuda area in the Panna Maria field (just above the litle word "Isopach," Fig. 7), probably are apparent and not real, because of the penetration of sleeply dipping beds adjacent to faults. Surfa(e and subsurface information commonly shows steeji dips in the beds of the down-dropped Ijlock near normal faults. This is thought to represent I he effect of normal frit-lional drag and/(ji revcrse-drag-type rotation into the potential void. \\'ithout close dip control the possibility remain-, however, that Ihe anomalous thickness of the Buda is real and that it developed in a fault-general I'd low.
3. Individual lliin l)eds in the liuda, Del Rio, and Georgetown < (jntinue across the faults with no recognizal)le change in composition or amount of thickening. Small sca-tloor fault scarps formed by continuous small displacements conceivabK' could have existed without having changed the depositional conditions sufficiently to permit local thickness anomalies to be recognized. Cumulatively, however, -uch changes should have resulted in anomalous forma)ional thicknesses at the faults. These were not recognized.
4. .If faulting took plai e during the lime of deposition of the Lowci (.^retaceous formations, the thickness anomalies which would result should be at different lateral positions along the fault as the depth changes. This |)henomenon was not observed.
Regional iiltim:,. -The dips of the Edwards across the Te.xas craton (principal area of Edwards outcro])) usualK- are very close to their initial depositional values. In the subsurface, the original near-horizonlal upjDcr boundary of the platform pan of ihe Ivlwards Limestone has been deformed into a very gentle, unevenly curved, surface, usually convex' upward. At the edge of the Texas craton, where the elevation of the top of the Edwards is approximately -f-1,000 ft, slight downward curvature begins. This is near the inner limit of the orogeniially deformed Paleozoic Ouachita "facies"' and lh( hiiigeline associated with the younger Balcone,-- .uid Luling fault systems. The Edwards >urface continues southeastward from this hingeliiic Mi (he edge of the Karnes trough (lop of l''.dward> elevation about ~'),0()0 ft). In the poorly loiilrolled area between the eastern edge of liie iroiii;!; and the Smart City reef (lop cf I'jiwird- I'lc'iilioii l.v. iHl 11 ':" ).
LOWER CRETACEOUS GEOLOGY. NORTHWESTERN' KAKXKS CtJUXTY. TEXAS S,59
the amount of curvature appears to decrease and may become concave upward before returning to its previous downward trend. This suggests that part of this area behaved in a relatively positive manner after, as well as during, the Early Cretaceous. In this area an unconformity is belowi?) the Del Rio.
The top of the Edwards is signihcantly below its regional surface of curvature in the area between the externally limiting faults of the Bal-cones and Luling fault systems (Fig. 16, interpretation, pt. 2) and in the area within the bounds of the Karnes trough. Faulting accounts for most of the lowering in the Balcones-Luling area and for part of it in the Karnes trough; dilTerential depositional subsidence accounts for the rest. Quantitatively, in the Balcones-I^uling area, the total vertical displacement approximately equals the amount necessary to fill a wedge-shaped potential void generated by the relative downward flexing of the flank of the Gulf Coast geosyncline at the edge of the Texas craton.
In the area of the Karnes trough, the potential void probably originated by rotational lilting or flexing, gulfward gravitaticmal sliding, and differential subsidence ot the trough in relation to the surrounding San Marcos platform.
The strike of the surface of regional curvature of the Edwards is about the same as the strike of the isopachous contours in the Karnes trough; thus, regional tilting has reduced the deposition-ally produced northwestward dips on the southeast side of the trough and has increased dii)s on the northwestern side. As previously noted and qualified, regional tihing has had little effect on the initial elevation differences developed locally along the regional strike.
In the Karnes trough area, the regional tilting of the Edwards ranges from 37,5 to 425 ft mi. De-positionally produced Edwards slopes dipped from between 90 and ISO ft/mi toward the axis of the trough. On the western flank of the trough the directions of inclination are about the same and are therefore additive, producing slopes of about 500 ft /per mi southeastward. If this calculation had been made before the Edwards structure inap was constructed, fault B (Fig. 1,3) would have been drawn with about half the indicated displacement. This fault was placed on the map mostly on the basis of an abnormally steep southeast dip indicated between several wells. Decreasing the dis-
I)lacement on this t'ault would increase the indicated dip of the Edwards and result in almost equal total \ertical fault displacements on the two sides of the Karnc.- trough.
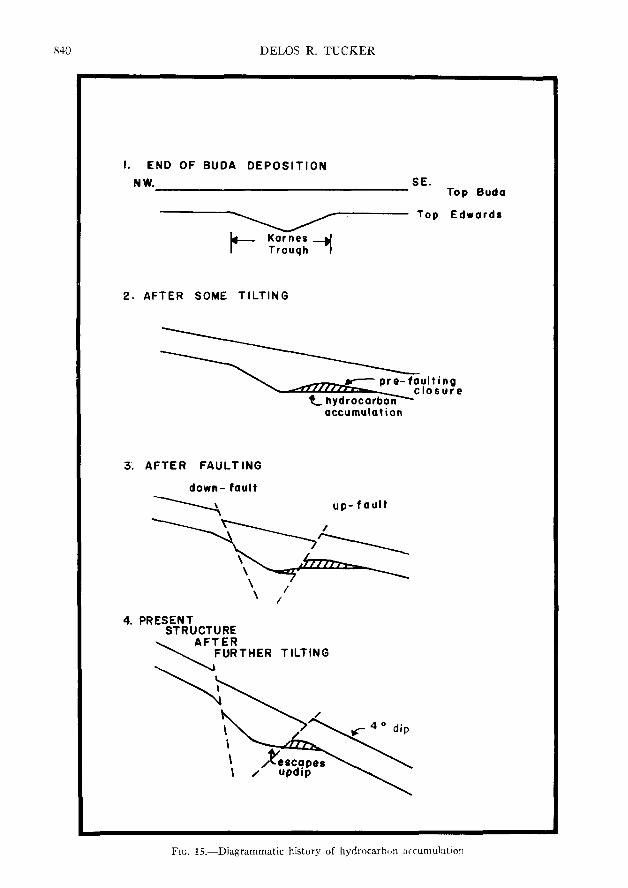
On the southeaslcni -ide of the trough, the above-mentioned (lirection> of slope were opjiosite and are therefore (ompensating (subtractive). The present 250-,i2.^ ft,, mi southeast dip of the Edwards in this area rii> this computation nicely. It is significant that, for a i onsiderable time during regional tilting, the ninge area of the southeastern flank of the Karne< trough had structural I losure without faultinL; bcinf required, Thi.-. closure existed from the lime of the first regional tilting until roughly a third of the present regional tilting had luc urred, undoubtedly a considerable length of time i Fit;. 15). The present oil fields might be faull-pre-erved remnants of once larger accumulation> vvhii h existed along the southeastern Injundary D 'he trough. The hydrocarbons in the western pari of these later fault-segmented a( cumulation- might have migrated updip after further liltin-;.
More important lould <iich a trap exist today in the same area ai he level of the Sligo or deeper? The writi'r's rough calculations and total philosophic \iewpoint >u«gest that such is ])()ssi-ble. L'sing the thii knc•.-.• e listed on Figure 2, the section from the lop of I he Buda to the toj) of the Sligo is about 2,lii( ti thick at the trough margin and i.-- about ,vsliO ft thick in the i enter of the trough. The different e is 1,700 ft. The differential thickness of I lie Imver Upper Cretaceous sequence probably is a! least 300 ft but is not considered in the iomjuitations which follow. The horizontal distaiuc from t!it center of the trough t;o the margin is roughly 15,01)0 ft or .i mi. These figures yield a pre-iegional tilting slope of 500-600 ft /mi for the Sligo from the edges of the trough towani the o'liter. Regional tilting of ,575-425 ft,mi southeastward could ha\'e overcome only part of Ihe norlhvvesterly slope of the Sligo on the southeastern side of the trough. The Sligo should current 1\ >lo]ie northwesterly at a rate of about K'vi ft_ mi toward the center of the trough. Structural (losiin-, without faulting, could exist now along he souihea-lern hinge area of the trough.
Several as,^um!)lioir- are made in order to reach this c(mclusion. The platform dips of the lid-wards and Sligo are lonsidered to be about eriual
840 DELOS R. TUCKER
I. END OF BUDA DEPOSIT ION
NW.
U _ K o r n e 8 _ J I Trough I
2 . AFTER SOME TILTING
SE. Top Buda
Top Edwards
•t_ hydrocarbon accumulation
ult ing c losure
3. AFTER FAULTING
down- fault
u p - f ault
4. PRESENT STRUCTURE
AFTER FURTHER TILTING
/^escapes updip
FIG. IS.—Diagrammatic history of hydrocarbon arcumulation
LOWER CRETACEOUS GEOLOGY, N O R T H W E S T E R N KAKXKS COUNTY, TEXAS 841
in the study area. Well penetration is not sufficient, however, to prove this point. The thickness figures used are based on isopachous extrapolations beyond known values and on sparse control below the Edwards. Also, the Person-Labus posi-ment, having a lower elevation differential to the platform than the normal axis of the trough, could have acted as a route of updip escape for the hydrocarbons. Most test wells of the Sligo have been drilled northwest of the hinge area, near the center of the trough, attempting to reach the Sligo along up-faults known at the Edwards level. Such tests were to penetrate the Sligo on the upthrown fault block with the impermeable middle Trinity Group as a seal on the oj^posing side of the downthrown block,
POTENTIAL-VOID CONCEPT OF NORMAL FAULTINC,
In almost every work project important basic questions arise involving normal faults. Usually, these questions remain unanswered. Even when answers are presented they usually are not based on an encompassing concept of normal faulting. The writer believes that an understanding can be established with or, if one prefers, against normal faults. The potential-void concept was formulated with this goal in mind.
Nearly every part of the potential-void concept has been discussed or shown in diagrams by many workers. None, to the writer's knowledge, has attempted to develop a general theory of normal faulting. The expression "potential void" itself was used in about the same sense by Russell (19.57, p. 69) in his discussion of normal faults in east-central Te.xas,
Recently, Hamblin (1965) presented an analysis of ' 'reverse drag" which is almost identical with that herein. Hamblin's and the writer's explanations were developed and presented independently and nearly synchronously, Hamblin worked on the surface in the area of the Grand Canyon, Quarles (1953) previously had e.xplained the reverse-drag structure in about the same manner as Hamblin and the writer.
The "potential void" is an hypothetical void whose size and shape equal the amount of extension that a segment of the earth's crust has undergone. Rarely, a void actually may exist. The potential void may be pictured as a geometrical representation of a three-dimensional energy regimen which must be compensated for by exten-
sional processes responding mostly to gravitational body forces. The potential-void concept therefore permits ihe employment of a quantitative approach to ihe solution of extensional tectonics problems in the zotu: of fracture.
Areas of extensional teutonics may be separated froin areas oi compressional tectonics by noting the position cjf two points, one on each side of the area of principal deformation, before and aftef tectonii aciixiiy In areas of extensional tectonics, the horizontal distance between the points eithei- remains ihe same or increases. Compressional te( t on io results in a shortening of the horizontal disiance lietween the points. Normal faults c(jminonl\- oii ur in regions of both types of tectonism. The study of the normal faults occurring a,- [lan of i he compressional regimen may be approached with the ideas of the potential-void concept. The concept as presented, however, is neither CIIN isioned nor constructed for this purpose.
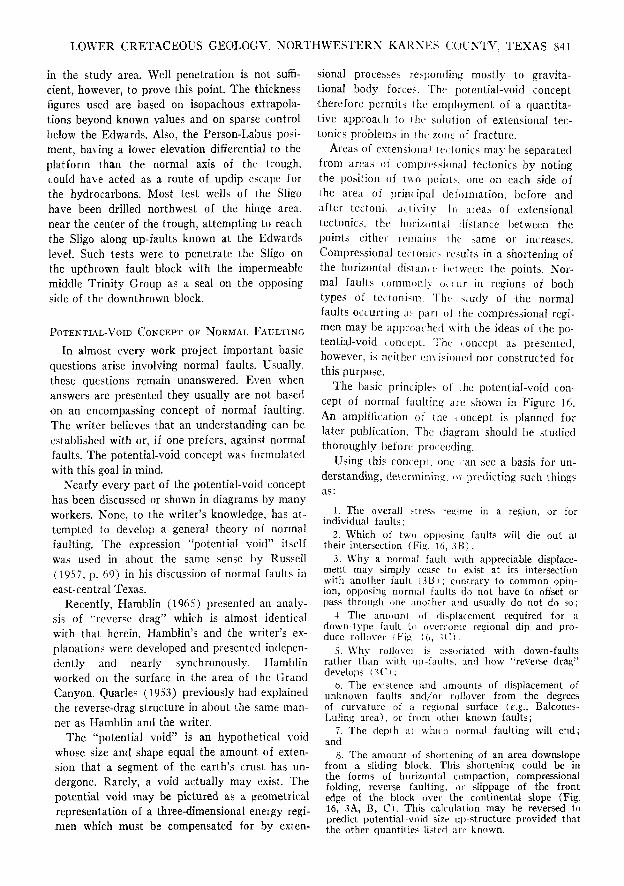
The basic principles of the potential-void concept of normal faulting are shown in Figure 16, An amplification of the concept is planned for later publication. The diagram should be studied thoroughly l)efore proceeding.
Using this concept, one can see a basis for understanding, determining, or predicting such things as:
1. The overall stress regime in a region, or for individual faults;
2. Which of two opposing faults will die out al their intersection (Fig. 16, .iB);
i. Why a normal fault with appreciable displacement may simply cease to exist at its intersection with another fauli i.SBi; contrary to common opinion, opposing normal faults do not have to offset or pass through one another and usually do not do so;
4. The amount of cMs|)Iacement required for a down-type fault to overcome regional dip and produce rollover (Fig 16, ' ( ' I ,
.S. Why rollover is associated with down-faults rather than with up-faulis, and how "reverse drag" develops (.T C i;
0. The existence and amounts of displacement of unknown faults and/or rollover from the degrees of curvature of a regional surface (e.g., Balcones-Luling area), or from other known faults;
7. The depth at whi( li normal faulting will end; and
8. The amount of shortening of an area downslope from a sliding block. This shortening could be in the forms of horizontal compaction, compressional folding, reverse faulting, or slippage of the front edge of the block over the continental slope (Fig. 16, .lA, B, C). This calculation may be reversed to predict potential-void size u|)-structure provided that the other quantities listed are known.
84 2 DELOS R. T U C K E R
INDIVIDUAL NORMAL FAULT
Block before faulting
n. 9. = net slip h = horlz, comp. V - vertical comp.
CONCLUBIONS:
Normal f a u l t i n g r e p r e s e n t s
of c
I c£ b l o c k s
• b l o c k .
.f the ei
id hy I
N«t s l i p may r e H a l n c o n s t a n t , bu t t he amounts DI h o r l x o n t a l (H) and v e r t i c a l (V) components may v w i t h changes i n the d i p of t he f a u l t ; i . e . a ch« i n (V) from one d e p t h on g f a u l t to a n o t h e r doet p rove a change i n n e t s l i p u n l e s s t he d i p of Che f a u l t IB the same; w i t h cona tanc ne t s l i p , t he E of <V} dec rea scB w i t h d e c r e a s i n g f a u l t d i p and i v e n a . T h e r e f o r e , t h e deroons t rac ion of a smallE ( t h e amount measured in f a u l t e d w e l l s ) does n o t ,
MECHANISMS FOR FILLING THE "POTENTIAL VOID":
I n t e r g r a n u l a r adjustm< r e l a t i v e to one anoth . f low, e t c . )
2. Intragranular adjustnents (recrystal lUation, ElLppage on cleavage planes, smearing)
3. Breakage (pointing and/or faulting)
ii. Bending by some ccmt ina t lon of the above t h r e e rnechanlsms. Intergranolat, Incragranular and Jointing
adjuatnenta are not measurable by curreiit subsurface Eechnlques and are henceforth not considered; this should not, however, d^Lraci from their poisible importarLCp.
Lo = original length Lt z length after deformatloi
If elastic
Extenslonal flexing
K Lo «l
Each of the above examples Is a special case In Mhlch a line or block Is extended beyond Its original length.
POTENTIAL VOIDS
'SI
!i) resiiUins from
, Potential Void (H)
4 Potential Void ;H)
- Potential Void (H)
^
BASIC ELEMENTS OF
THE POTENTIAL VOID CONCEPT
OF NORMAL FAULTING
by
D. R. T U C K E R
FIG. 16.—Basic elements of potential-void concept of normal faulting. Tan ' -B" corresponds most closely to Edwards structure in study nrca

LOWER CRETACEOUS GEOLOGY, NORTHWESTERN KARNES COUXTY. TEXAS S4o
Some Common Patterna For rilling the Potential Void.
h2
SA.
"reverse drag"
C^
INTERPRETATION .1ND EXAMPLE.-;
H = hi + h2+hn; total (v) of the "left" faults must - total (v) of the "right" faults because the "left" and "right" unfaulted segments remain at essentially the same relative structural position. The total amount of (V) will vary with the dips of the faultSj but, in toto, must be auffloient to achieve (H). Faults generally dip toward the potential void. If inverted to a basin shape, opposing faults usually dip toward the axis of the structure. Faulting is temporally limited by the period of vertical deformation; "left ' and "right" faulting are roughly synchronous. During faulting all blocks move up but the "wedge" moves up leas. All faults end at the surface of the 'punch" (which is itself a sort of fault). Faults may also be radial and concentlc but all are limited areally to the area of the "punch". Examples: Above salt domes or salt ridges, above Igneous intrusions, or due to differential subsidence over less compactable masses.
H = hi + h2 + hn; "left" (v) - "right" fv). Activities of "left" and "right" are approximately synchronous and both are determined by the time of flexing. During faulting the "wedge" moves downward; the "right" unfaulted segment moves relatively down with respect to the "left" unfaulted segment. Faults often In en Echelon pattern. The downwarped section is usually arc-shaped and the potential void is wedge-shaped. The amounts of (V) and (H) necessary to fill a wedge-shaped potential void decrease with increasing depth .". total faulting decreases downward to zero at the base of the "wedge"; below thla depth com-presaional tectonics begin. Example: The flat-lying section is comparable with the Texas craton; the hlngeline coincides roughly with the inner edge of deformed "Ouachita fades"; the "left" faults are correlative Mith'the Balcones fault system and the "right" faults with Luling fault system.
3A. H = h; + h2 + hn; "left" (v) « "right" (v); "left" and "right' faulting are approximately synchronous. Rei^lonal tilting of the entire block is common. The mechanism of lateral compensation at depth is unknown but is probably as shown below. Actual downward movement occurs only in the downthrown blocks while one of the unfaulted segments moves laterally downhill.
H ^ hi + hg + hn; "left" (v) " right (v). Known (v) displacement values for one side permit prediction of similar values for the opposite aide; this compensating dlSDlacement may occur through faulting (in competent rocks or under rapid deformation) andj or as "reverse drag" (in Incompetent rock dnd, or under slow deformation). "Left" and "right" faulting are about contemporaneous. The older of the "right" faults is the one nearest the "left" fault: its "wedge" is structurally lowest because Its part of the potential void has the greatest width. During faulting, the "left" unfaulted segment is stationary and the "right" unfaulted segment slides laterally away amount ( H ) ; vertical movement occurs only In the down thrown blocks. The maximum depth at which the "left" fault passes Into a flattened or bedding plane fault may be approximated by projecting the most right of the "right" faults downward to its intersection with the "left" fault; the "right" faults must end at the "left" fault because the potential void ends there. Example: The Sample fault system most closely simulates this model .t the level of th« 3dwards Limestone.
The potential void Is "filled" by a downward rotation or sagging-ln of the rocks in the downthrown blo'ck; the resulting curvature la opposite to that produced by frlctional drag and is commonly called "reverse drag". If the whole block has a regional tilt to the right, sufficient " reverse drag" may overcome and reverse regional dip producing fold-type closure or "rollover"; "reverse drag" complements regional dip if the fault dips oppositely to the regional dip. The amount of vertical displacement required to reverse regional dip and produce "rollover" can be calculated for a region. "Rollover" and "ri^t" type faults often complement one another to fill the potential void. Examples: The Falls City Tertiary field is on a "rollover" structure on the Palls City fault; the "rollover" is probably replaced by up-faults at the level of the Edwards, "Rollover" structures are common on many of the large down-faults present in the thick Tertiary sequence of the Oulf geosyncllne.
D Multiple "rollovers" result in formatlonal dips opposite to regional dip in the upthrown blocks of some of the faults; this Is a common development In complexly-faulted areas of the Gulf geosyncllne. Age of faulting probably decreases to the right.

844 DELOS R. TUCKER
o z
40
36
30
25
20
15
10
MM Mv m im
• i C i ^
wt im *N w*
Dry hole Q
Producer ^
- wn m Nw nw m
:^Mi w m wi M M T i rn »n T* i ^ ww »¥* jrn
tw o 0 O n e looioC' ioo«> t~ cB a » a o o — — McMion
BUDA THICKNESS
FIG. 17.—Histogram. Buda thickness (in feet) versus frequency of producing wells. Most producing wells occur where formation is thin but not thinnest. Optimum thicknesses occur along both hingelines of Karnes trough. Thickness of strata in dry holes is mostly very thick as in central parts of Karnes trough or very thin as on San Marcos platform. Those dry holes with optimum thickness values are mostly along sparsely drilled northwestern hingeline of Karnes trough.
"CLOUDY BAKS" OR A STATISTICAL GLANCE
The writer thought that application of standard statistical techniques to some of the data accumulated during this study might reveal rela
tions not established by the usual geological procedures. Five histograms and four scatter (cloud) diagram.s were plotted and the thickness ratios of the various units investigated.
In statistical studies of this sort, a geographically random, significantly large number of wells (control points, stations) is desired. In this study, the distribution of wells is not geographically random. Most of the wells arc in a narrow strip along the southeastern side of the Karnes trough. The remaining wi-lls are "randomly'' scattered across the study area. Because of this particular situation, the unequal areal distribution exaggerates the significant \alues. without great distortion, as is shown, \umerically. the sample (number of wells) is significant only in ihe field areas and is less significant elsewhere.
Northwestern Karnes County is only a small part of the Lower Cretaceous province and relations indicated here do not necessarily apply elsewhere. In this lase, however, the relations probably are valid within ihe same structural-deposi-tional province, i.i , wilhin comparable parts of the Karnes Iroutrh
I C J S T O ' . H A M S
Unit Ihiiknvss versus frequency.—Three (Figs. 17-19) of the five histograms constructed show formati<mal thickness versus frecjuency of occurrence. Whether the well has production from the Edwards is also shown. In each diagram, there is an obvious "peak" area (optimum value range) in which most of the ])ro(luctive wells are concentrated. This shows that jiroduction has been obtained from some, but not all, of the areas in which the formations have a particular thickness range. In each ctise thi> range is where the formations are thin, but mil thinnest. Geographically, the areas of optimum thickness are on both sides of the Karnes trough; [)roduction from the Edwards, however, is limited to part of the southeastern side. The isopachous and structural contour maps reveal the>e -ame relations with the added great aihanlagc i-f showing eeographical distribution.
One might arirue that the "peak"' area is meaningless because trian\' wells might be drilled in a small area (field) and would result in an apparent, but false, functional relation between thickness and productivity. Figure 20 was constructed to refute this argument. For the study area, well distribution is sufi'uirnlly random to reveal mean-

LOWER CRETACEOUS GEOLOCiY, NORTHWESTERN KAKNKS COUNTY. TEXAS 845
FIG. 18.—Histogram. Del Rio thickness (in feet) versus frequency of producing wells. Analysis same as for Figure 17. Broader optimum range reflects higher rate of change of thickness of Del Rio and smaller thickness subdivisions (.S ft).
ingful relations. The diagram was constructed by placing a grid of squares (each with 4.000-ft sides) over the Buda isopachous map (any of the units could have been used). The Buda thickness at the center of each square, rounded lo the numerically nearest isopachous value, and the status of production from the Edwards were noted and plotted. This procedure assumes, probably incorrectly, that all areas of production from the Edwards are known. The resulting "optimum thickness" range is about the same as in Figures 17-19, but is not peaked so prominently.
From all of the diagrams it can be predicted that, if additional Edwards production is found, it probably will come from areas where the "optimum thickness" values exist; i.e., from areas properly located with respect to depositional structure. The fact that all areas with the optimum thickness ranges are not productive indicates that factors other than thickness must he considered.
HISTOGRAM
Dry hole
Producer
II 14 17 20 23 26 29 32 3S 3 8
DEL RIO THICKNESS
15.
10 _i UJ
VA VA AM M^
( W W i r W r n W i W i W i A V ,
HISTOGRAM
GEORGETOWN THICKNESS
VS.
FREQUENCY
• Dry hole
[ ^ P r o d u c e r
to OJ
O O 0> =:
O O O - - ^ ?1 ^ o o fO lO
o in cvi
o
C4
GEORGETOWN THICKNESS
FIG. 19.- -Histogram. Georgetown thickness (in feet) versus frequenc\ Analysis same as for Figures 17 and 18.
producing wells.
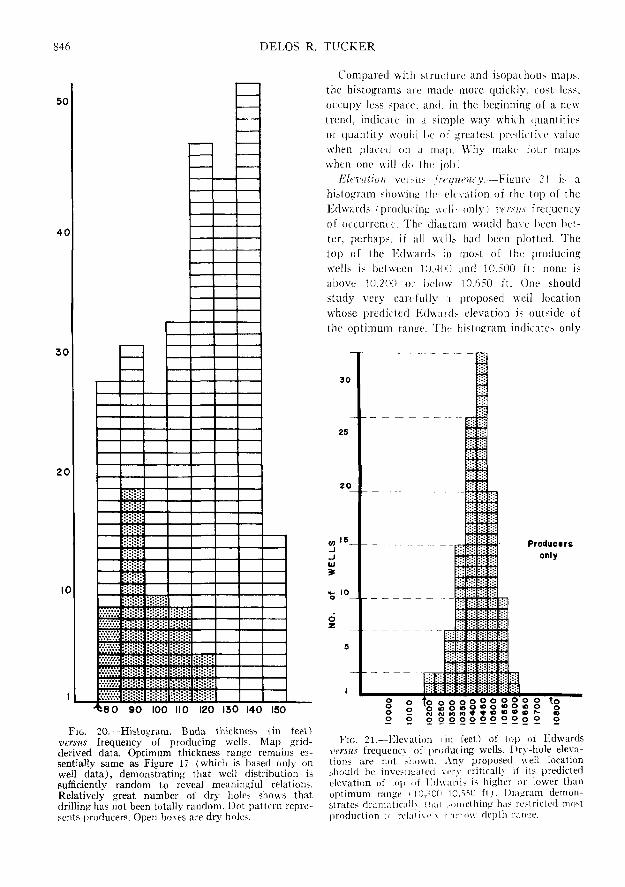
846 DELOS R. T U C K E R
50
4 0
3 0
2 0
10
'. '.O'.O
j.i.i.i.
feeo 90 100 110 120 130 140 150
FIG. 20.—Histogram. Buda thickness (in feet) versus frequency of producing wells. Map grid-derived data. Optimum thickness range remains essentially same as Figure 17 (which is based only on well data), demonstrating that well distribution is sufficiently random to reveal meaningful relations. Relatively great number of dry lioles shows that drilling has not been totally random. Dot patlcrn represents producers. Open bo.xes are dry holes.
Compared with structure and isopaihous maps, the histograms are made more C[uickly. cost less, occupy less space, and, in the beginning of a new trend, indicate in a simph; way which quantities or quantity would lie of greatest predictive value when placed on a map. Why make four maps when one will do the job?
Elcviiiion versus /rc(//((';jfy.—Figure 21 is a histogram sliowing ihi i-le\ation of the \i.)\i of the Edwards (iiroduiing welN onlyl versus frequency of occurren(e. Thi> diagram would ha \e been better, perhaps, if all wells had been plotted. The tO]) of the Edwards in most of the producing wells is helween l{i,40() and 10.500 ft; none is alwve 10,200 o.- below 10.650 ft. One should study very carefully ;i proposed well location whose predicted lulward.-. elevation is outside of the optimum range. The histogram indicates only
Producars only
O O O O O O O O O O o O
to o o o
Fro. 21.—Elevation liii feet) of top of Edwards versus frequenc.\ of producing wells. Dry-hole elevations are not ^hown. Any proposed well location should be invesiigatcd \-cr\' critically if its [iredicted elevation of lop of F.dwanls is higher or lower than optimum range ill),,HXi lO.x O ft). Diagram demonstrates dramaticall\- iliai ...oinelhing has restricted most production lo relaMvcl\ nannu depth raniie.
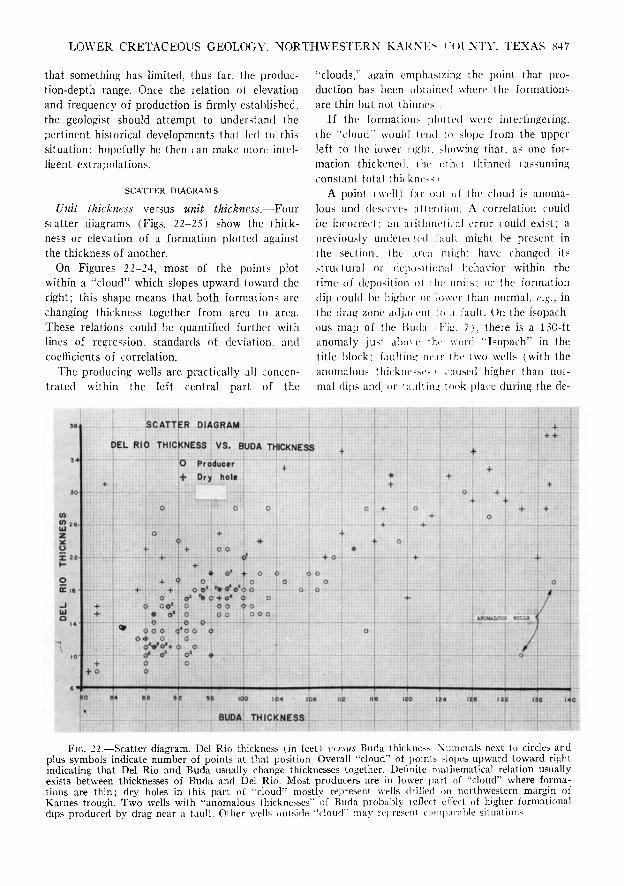
LOWER CRETACEOUS GEOLOGY. N O R T H W E S T E R N KAKNK< fOL'XTY, TEXAS 847
that something has limited, thus far, the production-depth range. Once the relation of elevation and frequency of production is firmly established, the geologist .should attempt to understand the pertinent historical developments that led to this situation; hopefully he then can make more intelligent extrapolations.
SCATTER DIAGRAMS
Unit thickness versus unit thickness.—Four scatter diagrams (Figs. 22-25) show the thickness or elevation of a formation plotted against the thickness of another.
On Figures 22-24, most of the points plot within a "cloud" which slopes upward toward the right; this shape means that both formations are changing thickness together from area to area. These relati(ms could be quantified further with lines of regression, standards of deviation, and coefficients of correlation.
The producing wells are practically all concentrated within the left central part of the
'clouds, ' ' again emphasizing the point that production has been obtained where the formations are thin but not thinnest.
If the formations phitted were interfingering. the ''cloud " would tend to slojie from the upper left to the lower righl. >h(jwing that, as one formation thickened, the othir thinned (assuming constant total thickne-s i
A point I well) lar out of the cloud is anomalous and deserve.^ attention, A correlation (ould be incorrect: an arithmeliial error could exist; a previously uiuieteiied iault might lie present in the section; the .uea niit;ht have changed its structural or depositional behavior within the time of dei)osili(Hi of the units; or the formation dip could be higher or lower than normal, c.t;., in the drag zone adjai etit in a fault. On the isopach-ous map of the 15uda i Fig. 7), there is a 1,30-ft anomaly just al)o\ e the word 'Tsopach" in the title block: faulting near the two wells (with the anomalous thicknesses) caused higher than normal dips and or faultinir took |)lace during the de-
z u X <•-K
O : I t • -
^ g
*«
+ +
+
SCATTER DIAGRAM
DEL RIO THICKNESS VS. BWA T J W N C S S
0 Prdlucir + Dry holi
+• + CO + if
+ * ° , J . o -I- + -• o * * «»V»'0 6
i o^f . p • a i> 0 o
' o - * »
o4 o o
' ! I 'I I I'li'iii' • "1
0 + ! O
. t
1 ' - > - [ ! • • •> loe If* • i i» 1* 1*
SUDA T H l C $ l « a & : - - ; -. - 4-
lMli• •KniprMa HTC(n«HI I
if> i « n^ t«it
+ +
t '
+
A
FIG. 22.—Scatter diagram. Del Rio thickness un feel) virsus Buda thickness. Numerals next to circles and plus symbols indicate number of points at that position. Overah "cloud" of points .-lopes upward toward right indicating that Del Rio and Buda usually change thicknesses together. Definite mathematical relation usually exists between thicknesses of Buda and Del Rio. Most producers are in lower [tart of ''cloud" where formations are thin; dry holes in this part of "cloud" mostly represent wells drilled on northwestern margin of Karnes trough. Two wells with "anomalous thicknesses" of Buda probably reflect effect of higher formalional dips produced by drag near a fault. Other w-ells outside "cloud" may represent i(ini|:iar;ihle situation*.

848 DELOS R. TUCKER
SCATTER DIAGRAM
DEL RIO THICKNESS VS. GEORGETOWN THICKNESS
^ Produc«r
-|- Dry holt
+
o-t- +
+ -I-o o
+ 0 0
o o o o , + °,2 <
o o ofeo oo oo ) O O + O O O CD O
, oo o o ^ + Q + O o o •*•
+ +
0
+ o +
Q 0
e 4-
+
o o o o -f-
o o o oo o o , o 4o o o
0 O + 0 O O O o o o -f- o o o
-I- o
o\o o o
0 +
SEORSETOWN THICKNESS
FIG. 23.—Scatter diagram. Del Rio thickness (in feet) versus (jeoriiftown thickness. Analysis same as for Figure 22.
position of the Buda. Figure 22 shows these two wells definitely to be outside the "normal" distribution cloud and they therefore demanded reexamination. A well with a fault in the upper plus middle Edwards section is shown on Figure 24 as another example of a thickness anomaly; the probable thickness of upper plus middle Edwards near that well may be established l)y using the measured thickness of the Georgetown and the "cloud" established by the other wells. The Georgetown thickness in this well is 1,S7 ft and the thickness of the upper plus middle Edwards should be between 20S ft and 260 ft (edges of cloud along 187 vertical) and will probably be near 230 ft (appro.ximate center of the cloud along the 187 vertical).
The isopachous maps of these units show all of the phenomena mentioned above. Subparallel isopachous contours of different units with similar directional slope and comparable spacing indicate that thickening and thinning occur in the same area in comparable amounts. Anomalies of any origin show up as different isopachous patterns on the different maps. Thickness predictions are made by position or trend extrapolation of < on-trolled isopachs.
Figure 25 is a plot of the thickness of the middle plus upper Edwards versus the elevation of the top of the Edwards. It should be noted that the thickness decreases upward. The "tight" little "producers cloud" makes this an especially in
triguing diagram; also interesting is the apparent almost complete isolation of the dry holes from the "producers cloud."
The "producers cloud" has a poorly developed overall slope downward toward the left; this shape indicates that, as depth increases, thickness decreases. Geographically, on the productive part of the southeast hingeline of the Karnes trough, the middle plus upper Edwards thins southeastward whereas the lo]i of the Edwards generally is deeper.
Looking at the whole diagram, it is obvious that elevation alone does not limit production for there are many dry holes which have the same elevations as the producing wells. Likewise, the thickness of the middle plus upper Edwards alone does not limit production as there are many dry holes within the thickness range of the "producers cloud." Producing wells e.xist only where certain ranges of elevation and thickness exist together. This is certainly useful but not really new or totally reliable information. On the structural contour and isopachou.- maps, there is a fairly large area on the northwestern side of the Karnes trough where the "right" thickness-elevation relations exist, but where there is no Edwards production. There are but a few dry-hole symbols in the "producers cloud" representing the unproductive area because few wells have been drilled in the area. This laik of wells retiects primarily the absence of up-fault,- .it I he Edwards level in this
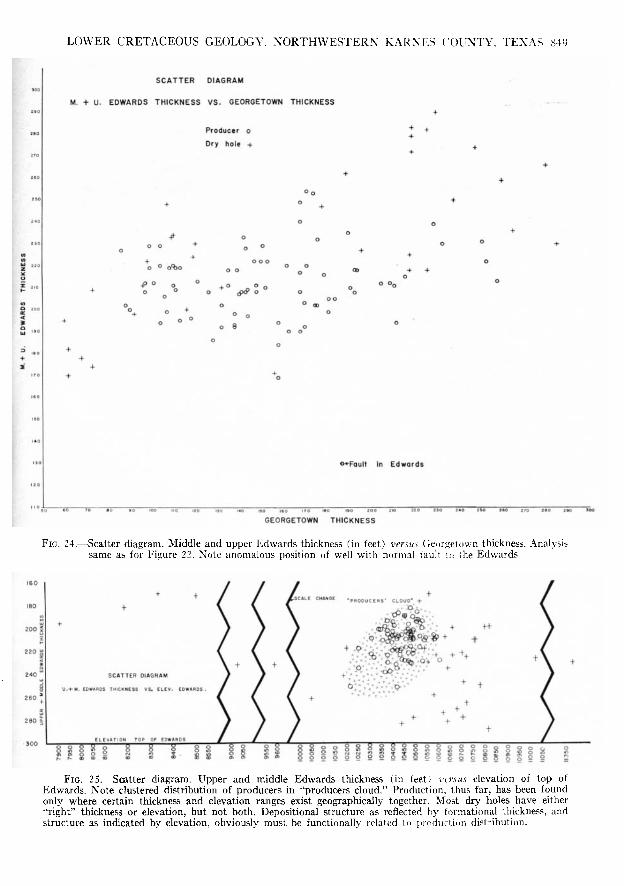
LOWER CRETACEOUS GEOLOGY, N O R T H W E S T E R N KARXKS COUNTY, TEXAS S49
SCATTER DIAGRAM
M. + U. EDWARDS THICKNESS VS. GEORGETOWN THICKNESS +
Producer o ^ ^
Dry hole +
o 0 oR)o
o<-Fault in Edwards
GEORGETOWN THICKNESS
Fin. 24.—^Scatter diagram. Middle and upper Edwards thickness (in feet) versus CJe()r<ielown thickness. Analysis same as for Figure 22. Note anomalous position of well with normal fauli in (he Edwards.
SCATTER DIAGRAM
. EDWARDS T h I C K N E S S V S, F L E V . EDWARDS
E L E V A T I O N T O P OF EDWARDS
• S C 6 L E CHANGE O D J I T E R ? . C L O J D "
•& a J
% Q
TJJT O O o o g c -
FIG. 25.—Scatter diagram. Upper and middle Edwards thickness (in feet) vtrsus elevation of top of Edwards. Note clustered distribution of producers in "producers cloud." Production, thus far, has been found only where certain thickness and elevation ranges exist geographically together. Most dr>' holes have either ''right" thickness or elevation, but not both. Depositional structure as reflected tiy formational thickness, and structure as indicated by elevation, obviously must be functionally related in iirndiictinn distribution.

8.S0 DELOS R. T U C K E R
region. If well distribution were et|ual across the entire area of study, there would be about the same number of producers and dry holes within the "producers cloud"; However—and this is an important point—the producing wells would still be confined to the same "cloud" area on the diagram.
Thickness ratio.—The thickness ratio (maximum unit thickness in the trough divided l)y the minimum thickness on the platform) for the post-Sligo Lower Cretaceous section is 1.8, meaning that the trough section is 1.S times the thickness of the platform section (right column. Fig. 2). For individual units the ratios range from 1.5 (Clen Rose) to 5.3 (Georgetown); all ratios are within the 1.5 to 2.0 range except those for the Del Rio (5.0) and the Georgetown (5.,i).
This bimodal distribution requires an explanation. The 1.5 to 2.0 range is considered to l)e normal. The higher ratios may be the result of (1 ) a higher rate of relative subsidence between the trough and platform, and/or (2) slower deposition on the platform with a normal or nearly normal rate of relative subsidence and deposition in the trough. The latter possibility is favored because the unconformity below(?) the Del Rio suggests that the depositional interface may have been a]5-proaching depositional base level on the jilatform for some time. Also, the fine-grained nature of the Del Rio and Georgetown suggests a slower "settling" type of deposition. Other reasons could be given for the variations in the thickness ratios but these are considered most likely to be correct for the study area. Thickness ratios indicate in a vivid way the major historical changes in the tectonic and/or depositional behavior of an area.
The.se few very shallow statistical efforts suggest that standard statistical endeavors may be of great value in pointing out in a simple, rapid way
relations which might otherwise be overlooked. Computerization should produce even greater predictability. Developing the underlying reasons for the relations is then the problem, and this requires standard geolosricai ccmcepts, tools, and procedures.
t)lL Fll'.LDS
The Falls City, flysaw-Tertiary (now abandoned) , and Hobson-Tertiary fields produce from Tertiary sandstones m northwestern Karnes County (Fig. 26 i. The Falls City field produces from a rollover structure on the Falls City fault (.•\). The other ivvo fields produce from the up-thrown blocks 1)1 u|>-faults. The .southeastern ffank of the Karnes trough should, in the writer's opinion, have more tn-ld.s of this type along the shallower sections of -unit of the up-faults present at the Edwards le\(^.
There are four known, definitely separate, areas of Edwards ])ro(]uili(jn I Fig. 26): Fa.5hing, Hysaw, the group including Hobson-Big John-Panna Maria-Person-Daxy, and Labus. Comparable production probably will be found along some of the known up faults. es|)ecially faults If and K (Fig. l.Si near she present Hobson and Hysaw Edwards fields.
Detailed geologic re])oris on the fields producing from the Edwards have been published by Knapp (1962). Keahcy (1962), Lang (1962), Knebel 11956), and Pinkley i 1958). Their structural interpretations within the field areas are nearly identical with those in this report.
1. The porosit)' and permeability of the Edwards reservoir rock developed under the physical and chemical retrimcn of ,i backreef platform environment.
. " i . ! ; . ' , ! , , ' ; . ITERTlARTr-*
HOfi.§ON
fijFASHING.:~....:;: • X
H Y S A W J P ^ ^ „ , . R , WNNA-TCJARIA 'wniiiflio.,
FAULTS a FIELDS ''-PERSON "'*>»«^...,., ^ * V Y
"WOT,/
FIG. 26.—Faults and fields. Fault traces are shown at level of Edwards Limestone. .All fields produce from upthrown blocks of up-faults except Falls City field which produces from gentle mllover structure on down-thrown block of Falls City fault; fault is beneath the field at Fdwards ie\cl nit is northwest of field at level of producing zones.
LOWER CRETACEOUS GEOLOCiY. NORTHWESTERN K A K N K N COUNTY, TEXAS S.Sl
2. Depositionally produced structure and post-Early Cretaceous regional tilting, probably without faults, localized hydrocarbons along th(! southeastern hingeline of the Karnes trough.
3. Extensional tectonic processes of the Gulf Coast geosyncline generated the Sample fault system along the Karnes trough. Extension at the Edwards level was achieved primarily by gravitational sliding on down-faults; opposing up-faulting responded to the potential void at the head of the slide.
4. The up-faults which crossed the hydrocarbon accumulations acted as updip seals and prevented the updip migration of the hydrocarbons from the southeastern segments. Continued regional tilting emptied the northwestern segments.
5. The potential-void concept demonstrates that both normal-fault systems and individual normal faults have predictable characteristics if they developed from one or more of the three basic extensional stress mechanisms.
6. The term "format" iForgotson, 19.57) should be adopted as a formal name for bed-bounded sequences of sedimentary rocks.
7. Isopachous maps of stratigraphic units show the shape of the depositional structures including the economically significant southeastern hinge-Hne of the Karnes trough. New Edwards fields and extensions of existing fields most likely will occur along the hingeline.
8. Histograms, scatter diagrams, and thickness ratios, though lacking in geographic control, predict and emphasize significant geologic ciuantities. Further development of such procedures should improve and broaden their usefulness.
REFERENCES CITED
.American Commission on Strat igraphic Nomenclature , 1061, Code of stratigraphic nomencla ture : Am. Assoc. Petroleum Geologists Bull., v. 4.'i, no . .5, p . <)4.i-06,S.
Anders, R. G., 1962, Ground-water geologj' of Karnes County, Texas : U.S. Geol. .Survey Water -Supply Caper 1 . I J 9 - G , 40 p .
Folk, R., 19,S0, Practical jietrographic classification of l imestones: Am. Assoc. Petroleum Geologists Bull.. V. 4.^, no. 1, p . 1-38.
Forfzolson, J. M., 1057. Nature , usage, and definition
of marker-defined vertically segregale<l rock uni ts : Am. Assoc. Petroleum Geologists Bull.. \ 41 , no. 9, p . 2108-211.1.
Hambl in , W. K., 106.= . Origin of "reverse drag" on the dovvnthrovvn side uf normal faul t?: Geol. Soc. America Bu l l , v. To. no. !0, |). 114.= - 1163.
Keahey, Rober t , 1962, Fashin'.,' field, ."Vtascosa-Karnes Counties. Texas : Gull ('nasi .\ssoc lleol. Socs. Trans . , \', 12, p. IDS 211
Knapp, R. W., 1002, Pei>on iield: (Julf Goasl .\s>oc. Geol. Socs. Trans. , v 12, p. 190-204.
Knebel, R. M,. lO.^o. Preliminary note on the Fashing ( E d w a r d s limei field, .\iascosa County. Texas : Gulf Coast .\,-.M)c. Geol, Socs. T r a n s , v. 6, p . 117-122.
Lang, C. I) . , 1962. Bic John (Edwards ) field: Gulf Coa-st Assoc. Geof Socs Trans. , v. 12. p. 19.5-199.
Lozo, F . K., and I". 1. S'ricklin, 19.56, Stratigraphic notes on the out<-ro]i ba>al Cretaceous. Central Texas : Gulf Coast .Vsr-oc. Geol. Socs. Trans, , v. 6, p. 67-78.
Mar t in , K. C;., t oo l , Washila (Jroup strat igraphy in south-central Texas anpuh, M. A. thesis. Texas Univ., 82 p
.Vlurray, G. !•".., 1061. (ieoloKv of the Atlantic and Gulf coastal province of Nor th . \nier ica: New York, Harper and Brothers. 692 p .
Pinkley, G. R., 1058, Geolosic studies, surface and subsurface, Fashin;; field area, Atascosa County , Texas, in South Texas Geolosical Society Fall Field Tr ip , Dec. 1058: [>. M} t2,
Quarles, Miller, Jr , , lo; ,v Salt-ridge hypothesis on origin of Texas Gulf Coast type of fault ing: Am. .4ssoc. Petroleum (ii'olouisi? B u l l , v. 2 7. no, ,•?, p. 489-508,
Russell, W. L., 10.^7. Faultuig and superficial structures in east-central Texas : Gulf Coast .\ssoc. Geol. Socs. Trans, , v. 7. p 0= "2,
Sandidge, J, R., 19ol. Comanchean reef t rend astounds (5ulf Coast observers. Just how good is i t? —Here 's a reappraisal : Gi] and Gas Jour . , v. 50, no. ,30, p . 1 l.S n o .
Tucker, D, R,. 1002, Subsurface Lower Cretaceous strat igraphy. Central Texa>. in Contr ibut ions to the geolopv of South Texas- '^^oulh Texas Geol, S o c , p, 177-216.
19(,5, Lower Cretaceous geology, northwestern Karnes County, 4\ 'xas : South Texas (leol. Soc . v, 5, no. 19, p . 2 ,v3.
VVengerd, S. .\., and F., Szalio, 1067. Tmie surfaces, vacuity, and m:ippability in s t ra t i s raphy ( a b s , ) : Am. .'Vssoc Petroleum Geolo;.;ists Bull,, v SI, no. ,i, p. 484-485,
Wilbert , W. P., 1006, Stral igraphy of the Georgetown Formali(m. Bell. Williamson, and Travis Counties, Texas : Gulf Co:i-t , \ - o r Ceol. Soc:;, Trans. , v, lo. p. l . v p s .
Winter, J . .\., 1002. Fredericksburg and Washila s t ra ta (subsurlace L o ^ e r Cretaceous,!, southwest Texas, in Coninbut ions i" the (Geology of South Texas : South Ti'xa> (.eol s,,,. , p. ,s i-- l i5.