lower colorado river park moabi backwater channel ... · park moabi backwater channel restoration...
TRANSCRIPT

Lower Colorado River Park Moabi Backwater Channel Restoration Design
DESIGN REPORT 60% DRAFT
Mojave Valley Conservation Area Ecological Restoration Project
Park Moabi San Bernardino County, California
April 9, 2015
Prepared For: United States Bureau of Reclamation
Lower Colorado Region 500 Fir St.
Boulder City, NV 89005
Prepared By:
Otis Bay, Inc. Ecological Consultants
PO Box 919 Verdi, NV 89439
AND
Tetra Tech, Inc. 4801 E. Broadway, Suite 521
Tucson, Arizona 85711

This Page Intentionally Blank

Executive Summary
The United States Bureau of Reclamation (USBR) contracted with Otis Bay Ecological Consultants and Tetra Tech, Inc., to design approximately 50 acres of connected backwater habitat on the Lower Colorado River near Needles, CA, within the northern portion of Moabi Regional Park. The backwater habitat will consist of open water and marsh land cover types and is being implemented as part of the Lower Colorado Multi-Species Conservation Program (LCR MSCP). The project will provide critical habitat for the flannelmouth sucker (Castotomus latipinnis) and two endangered species of native Colorado River fish, the razorback sucker (Xyrauchen texanus) and the bonytail chub (Gila elegans).
This 60% Draft Design Report has been prepared in conjunction with the preparation of 60% Draft construction plans and specifications for construction of the backwater habitat. The construction plans and specifications include excavation and grading of the backwater channel, installation of two pre-cast concrete-arch culverts with adjustable sills, riprap erosion protection, a maintenance road, and an access point for small boats. The backwater channel and arch-culvert structures were designed to meet the criteria presented in the USBR’s Colorado River Side Channel at Park Moabi, California: Conceptual Design Technical Service Center Sedimentation and River Hydraulics. SRH-2012-26. October 2012.
The vegetative component of the project is not included in this design package and will be implemented by the LCR MSCP at a later date. The proposed land cover types are summarized in Appendix C.

This Page Intentionally Blank

Park Moabi Backwater Channel 60% Draft Design Report
i April 9, 2015
Table of Contents
Table of Contents ........................................................................................................................................... i
List of Tables ................................................................................................................................................ ii
List of Figures ............................................................................................................................................... ii
List of Appendices ........................................................................................................................................ ii
1. Introduction ............................................................................................................................................ 1
2. Location.................................................................................................................................................. 1
3. Design Objective .................................................................................................................................... 2
4. Project Setting ........................................................................................................................................ 2
4.1. Land and Water Requirements ........................................................................................................ 2
Land Ownership ...................................................................................................................... 2
Water ....................................................................................................................................... 2
4.2. Hydrologic & Hydraulic Conditions ............................................................................................... 3
Colorado River Dam Release Patterns .................................................................................... 3
5. Basis of Design....................................................................................................................................... 3
5.1. Studies and Design Documents ....................................................................................................... 3
5.2. Survey and Mapping ....................................................................................................................... 4
Topographic Mapping and Survey .......................................................................................... 4
Horizontal and Vertical Data................................................................................................... 5
5.3. Hydrologic and Hydraulic Design Criteria...................................................................................... 5
6. Design Narrative..................................................................................................................................... 5
6.1. General ............................................................................................................................................ 5
6.2. Backwater Channel Design ............................................................................................................. 5
6.3. Roadway Crossings ......................................................................................................................... 6
6.4. Water Control Structure .................................................................................................................. 6
6.5. Boat Ramps ..................................................................................................................................... 6
6.6. Landscape Restoration .................................................................................................................... 7
7. Soil Mechanics Design ........................................................................................................................... 7
7.1. Geotechnical Data Collection.......................................................................................................... 7
7.2. Slope Stability & Bearing Capacity ................................................................................................ 7
7.3. Foundation Design .......................................................................................................................... 8
Foundation Characteristics and Preparation............................................................................ 8
Limitations .............................................................................................................................. 8
7.4. Riprap Design.................................................................................................................................. 9

Park Moabi Backwater Channel 60% Draft Design Report
ii April 9, 2015
7.5. Road Base and Aggregates .............................................................................................................. 9
7.6. Excavation and Disposal ................................................................................................................. 9
Clearing and Grubbing ............................................................................................................ 9
Earthwork ................................................................................................................................ 9
8. Construction Drawings ......................................................................................................................... 10
9. Construction Specifications.................................................................................................................. 10
10. Surface Water Control .......................................................................................................................... 10
11. Dewatering ........................................................................................................................................... 10
12. Utilities ................................................................................................................................................. 11
13. Traffic Control...................................................................................................................................... 11
List of Tables Table 1. Topographic Data Summary ..................................................................................................... 4
Table 2. Control Point Datum Conversion Summary.............................................................................. 5
Table 3. USBR Test Pits Summary ......................................................................................................... 7
Table 4. Geotechnical Parameters ........................................................................................................... 8
Table 5. Ground Water Approximation during Test Pits ...................................................................... 10
Table 1. Topographic Data Summary ..................................................................................................... 4
Table 2. Control Point Datum Conversion Summary.............................................................................. 5
Table 3. USBR Test Pits Summary ......................................................................................................... 7
Table 4. Geotechnical Parameters ........................................................................................................... 8
Table 5. Ground Water Approximation during Test Pits ...................................................................... 10
List of Figures
Figure 1. Location Map
Figure 2. Site Plan
Hardcopies and digital copies:
List of Appendices
Appendix A – Hydrologic and Hydraulic Analysis Technical Memorandum Appendix B – USBR Subsurface Exploration & Geotechnical Data Appendix C – Landscape/ Land Types Document Appendix D – 30% Design Concept: Water Control Structure Alternatives Analysis

Park Moabi Backwater Channel 60% Draft Design Report
1 April 9, 2015
1. INTRODUCTION
The Lower Colorado River – Park Moabi Backwater Channel Restoration project is designed to provide approximately 50 acres of connected backwater habitat on the Colorado River near Needles, CA, within the northern portion of Moabi Regional Park (Figure 1, Figure 2). The backwater habitat will consist of open water and marsh land cover types and is being implemented as part of the Lower Colorado Multi- Species Conservation Program (LCR MSCP). The project will provide critical habitat for the flannelmouth sucker (Castotomus latipinnis) and two endangered species of native Colorado River fish, the razorback sucker (Xyrauchen texanus) and the bonytail chub (Gila elegans).
The LCR MSCP consists of Federal and non-Federal stakeholders, created to respond to the need to balance the use of Lower Colorado River water resources and the conservation of native species and their habitats in compliance with the Endangered Species Act. .
The Moabi Regional Park (Park Moabi) resides within the historic floodplain of the Colorado River. Park Moabi operates on 1,027 acres and has two land owners: the California State Lands Commission and the USBR The project is located on the northern end of the park where landscape characteristics allow for the development of a connected backwater habitat.
The site is located between two major hydroelectric dams on the Colorado River, Davis Dam upstream and Parker Dam downstream. Flows through this section of the Colorado River are highly regulated and the river stages at Davis Dam can regularly fluctuate up and down 4 feet on a given day, with seasonal stage fluctuations of 7 feet possible.
Following the guidelines of the HCP, the connected backwater channel will flow from the Colorado River through the backwater habitat and will provide accessibility for native fish. The channel will exit into the existing Park Moabi backwater channel. The backwater channel will consist of inlet and outlet control structures, set at equal elevations, with roadway crossings at the upstream and downstream ends. The backwater channel is expected to regularly exchange water with the main river channel during normal conditions, although there will be times when no water enters or exits the channel. Approximately 26 acres of open water, 24 acres of marsh, 15 acres of cottonwood/willow, and 38 acres of upland mesquite habitat will be created.
2. LOCATION
The Mojave Valley Conservation Area (MVCA) is located along the lower Colorado River, approximately 13 miles south of Needles, CA, between river miles 236 and 237 (Figure 1). According to the lease between San Bernardino County and the California State Lands Commission, which came into effect on July 2, 1965, the property of interest commences at the center of Section 6, Township 7 N, and Range 24 E, San Bernardino Meridian (S.B.M.).

Park Moabi Backwater Channel 60% Draft Design Report
2 April 9, 2015
3. DESIGN OBJECTIVE
The primary goal of the project is to prepare a design that will create approximately 50 acres of connected backwater habitat for endangered fishes and a mosaic of marsh, riparian, and upland vegetation types.
The backwater channel was evaluated over a range of flows to estimate the predicted performance of the design relative to the flow depth, velocity and other criteria described in the scope of work and identified through additional discussions with the USBR.
The design includes excavation and grading for a backwater channel that extends from the Colorado River to the existing Park Moabi Channel and two water-crossing structures over the excavated backwater channel. The structures include adjustable sills and are designed to provide hydraulic control for flows in and out of the backwater channel during moderate to high flows in the Colorado River. Water control structures will also limit the amount of Colorado River bed sediment entering the backwater channel.
The design will provide spatially variable topography with an appropriate distribution of depths and velocities for a variety of aquatic habitats. The design has been developed to limit long-term maintenance requirements.
4. PROJECT SETTING
4.1. Land and Water Requirements
Land Ownership
The project is located on property owned by the State of California, which is currently leased to San Bernardino County. California Department of Fish and Wildlife will lease the area where the backwater channel is to be constructed from CSLC. Reclamation, as implementing agency of the LCR MSCP, will enter into an agreement for restoration activities consistent with the Lower Colorado River Mult-Species Conservation Program with CDFW. Under the California Endangered Species Act (CESA) permit, habitat established in the state of California shall be protected in perpetuity. .
Water
As documented in the 2012 Conceptual Design Report, the water for the project is supplied through the LCR MSCP Water Accounting Agreement passed by Congress as part of the Omnibus Public Land Management Act of 2009 (Public Law No. 111-11, Title IX, Subtitle E, 123 Statute 991, 1327-29). The Act permits the USBR to create and manage Conservation Areas, which do not contain any water entitlement from the Secretary of the Interior, by using Colorado River water to meet the performance requirements of the LCR MSCP. Under the Water Accounting Agreement, the USBR shall not consider any resulting increase in evaporation or percolation of Lower Colorado River water to be a diversion or consumptive use.

Park Moabi Backwater Channel 60% Draft Design Report
3 April 9, 2015
4.2. Hydrologic & Hydraulic Conditions
Colorado River Dam Release Patterns
Davis Dam (forming Lake Mohave) on the Colorado River is about 70 miles downstream from Hoover Dam (forming Lake Mead) and spans the border between Arizona and Nevada. Water from Lake Mohave is released through the hydroelectric power plant in response to the varying demand for electricity. Below the dam, Colorado River discharge (flow) and stage fluctuate throughout the day.
Average and maximum days were identified within the 7 years of available hourly data at the USBR below Needles Bridge (BNB) and RS 41 (RS41) gages. The maximum flow in the 7 years of data at the BNB gage was approximately 24,000 cfs, which corresponds to a 5-year event at Davis Dam, and was considered a reasonable representation of a regular high flow event at the project site. One-hour interval, 3-day hydrographs which included the days of interest were developed, and used to represent average and high flow events.
In September of 2013, the USBR installed a temporary stage gage to record water-surface elevations directly upstream of the project site. Due to the relatively short period of record, data for previous years and missing data points at this gage location were supplemented with averages of the RS41 and BNB stage data. Preliminary analyses outlined in the Restoration and Development Plan (RDP) found this to be a reasonably accurate approximation of the water surface elevation at the project site (within ±0.5 feet).
5. BASIS OF DESIGN
The basis of design for the backwater channel at Park Moabi is summarized in the following sections.
5.1. Studies and Design Documents
• USBR. 2012a. Colorado River Side Channel at Park Moabi, California: Conceptual Design
Technical Service Center Sedimentation and River Hydraulics. SRH-2012-26. October 2012. • USBR. 2012b. Park Moabi Regional Park Backwater Project Provo Area Office. September
2012. • USBR. 2014. Colorado River Side Channel at Park Moabi, California: Restoration and
Development Plan (Draft) Technical Service Center Sedimentation and River Hydraulics. Draft. 2014.
• RB&G Engineering, Inc. 2014. Park Moabi Coefficient of Permeability Data Sheets. Project No. 201408.020 September 29, 2014.
• USBR. 2014. Geotechnical Investigation Report. Park Moabi, Regional Park Backwater Project: Mojave Valley Conservation Area, Lower Colorado Region. September 2014.
• Otis Bay and Tetra Tech, 2015. Lower Colorado River Park Moabi Backwater Channel Restoration Design: Hydrologic and Hydraulic Analysis Technical Memorandum. 60% Design Package. April 6, 2015.

4 April 9, 2015
Park Moabi Backwater Channel 60% Draft Design Report
5.2. Survey and Mapping
Topographic Mapping and Survey
The elevations and dimensions of the embankment referenced in this report are based on Field survey, Bathymetric survey and LiDAR sources as combined by the USBR (See Table 1).
Table 1. Topographic Data Summary
File(s)
Type
Date Horizontal Control (1)
Vertical Control(1)
Purpose
HavDav2h, HavDav2i, HavDav2j, HavDav2k, HavDav2l, HavDav2m, HavDav2n, HavDav2o, HavDav3a, HavDav3b
Colorado River
Channel Topography
TINS
12/4/2014 - from data
collected in 2007
NAD 1983 State Plane
Arizona West FIPS 0203 IFeet
NGVD 29
Hydraulic Modeling –
Colorado River
channelcntrs1.zip, channelcntrs2zip, channelcntrs3.zip, channelcntrs4.zip
Colorado River
Contours
12/4/2014
NAD 83,
UTM Zone 11
Meters
NGVD 29
Hydraulic Modeling –
Colorado River
LIDAR2008.shp
LiDAR Points
2008
NAD 83, UTM Zone
11 Meters
NGVD 29
Grading, Hydraulic
Modeling – Backwater Channel
ProvoSurvey052013.shp
Terrain Points
May 2013
PXAOsurvey03072014.shp
Terrain Points
July 2014
SiteTopographyContours.shp, SurveyPts_plus_LIDAR.shp, SurveyDataCombined.shp
Combined Survey - Terrain
Points & Contours
July 2015
ParkMoabi_bathymetry.shp
Park Moabi Bathymetry
April 2013
NAD 83, UTM Zone
11 Meters
NA
Hydraulic Modeling– Backwater Channel
1) As provided by the USBR.
The USBR provided a file with 1-foot interval contours for the project area (SiteTopographyContours.shp) that was previously processed to incorporate the various data sources and was used for the basis of design and earthwork computations.

5 April 9, 2015
Park Moabi Backwater Channel 60% Draft Design Report
Horizontal and Vertical Data
Horizontal control is based on Universal Transverse Mercator, Zone 11 on the NAD83 Datum. All coordinates are presumed to be grid and not ground.
Vertical control is based on the National Geodetic Vertical Datum of 1929 (NGVD29). Unless otherwise noted, all elevations called out in this report are based on NGVD 29. National Geodetic Survey Program VERTCON version 2.1 was used to convert from North American Vertical Datum of 1988 (NAVD88) to NGVD29 for the control points. A summary of the vertical conversion is provided in Table 2.
Table 2. Control Point Datum Conversion Summary
Control Point
Height (NAVD88 -feet)
VERTCON Result (NAVD 88 - NGVD 29 [feet])
Height (NGVD29 -feet)
J1365 626.95 2.14 624.81 K1365 645.03 2.16 642.88
HPGN CA 08 11 620.74 2.14 618.60
National Geodetic Survey (NGS) vertical and horizontal control points are shown on the project plans.
5.3. Hydrologic and Hydraulic Design Criteria
The design of the backwater channel needs to accommodate the daily and seasonal fluctuations in stage on the Colorado River. The backwater channel is expected to regularly exchange water with the main river channel during normal conditions, although there will be times when no water enters or exits the channel. The primary design criterion requires mean velocities through the backwater channel to remain below 0.5 ft/s at mean-high flow conditions, with channel depths ranging between 0 and 15 feet.
6. DESIGN NARRATIVE
6.1. General
The project includes a new backwater channel that extends from an inlet at the Colorado River to an exit at the existing Park Moabi Channel. The channel is contoured and graded to include deeper pools and shallower areas to provide fish habitat and to promote the establishment of healthy vegetation. Inlet and outlet structures provide hydraulic control and roadway crossings at the upstream and downstream ends of the new channel.
6.2. Backwater Channel Design
The 60% backwater channel design is based on the grading that was included in the 30% Draft Design with modifications to reduce the number of disconnected islands. HEC-RAS modeling developed for the 60% design was documented in the Hydrologic and Hydraulic Technical Memorandum (Otis Bay and Tetra Tech 2015) included in Appendix A. The results show that mean velocities through the main section of the channel will remain below 0.5 ft/s under high flow conditions, with velocities through the concrete-arch culvert openings peaking at approximately 4 ft/s. The modeling shows that the backwater channel will

6 April 9, 2015
Park Moabi Backwater Channel 60% Draft Design Report
decrease the water surface elevation in the Colorado River by less than 0.1 feet and will slightly increase the velocities near the outlet of the project site on the Park Moabi channel. Both changes are considered to be insignificant. Overall, the 60% design meets the design criteria for the backwater channel.
6.3. Roadway Crossings
The design includes structural roadway crossings over where the backwater channel intersects existing roadways. The selected structure for each crossing is a concrete-arch culvert equivalent to CONTECH prefabricated O-series arch structure with a concrete base slab foundation. The upstream structure, at the Colorado River inlet is 36 feet wide by 11feet and 7.75 inches high. The downstream structure, at the exit to the Park Moabi Channel is 38 feet wide by 10 feet and 8.25 inches high. The selected dimensions were based on an iterative analyses of the flow capacity using the HEC-RAS model for the 60% channel design.
The concrete-arch culverts are designed with a cast-in-place concrete floor due to the limited bearing capacities of the existing soils (see Section 7.3). CONTECH prefabricated structures are designed to meet AASHTO Standard Specifications for Highway Bridges - Section 16.8 and LRFD Bridge Design Specifications - Section 12.14, and are manufactured in accordance with ASTM C1504. With suitable foundation design and adequate bearing capacities the CONTECH O-series arch can be designed to safely carry HS20 or highway loads.
6.4. Water Control Structure
Water control structures are required at the concrete-arch culverts to regulate the fluctuation of water passing through the backwater channel during moderate to high flows in the Colorado River. The 60% HEC-RAS analysis confirmed that the optimal sill elevation of 453.5 feet that was recommended by the 2012 Conceptual Design Report.
The 60% design includes a stop-log system that will provide an adjustable crest elevation to regulate the water surface in the backwater channel. The stop-log system was selected on the basis of an alternatives analysis that was included in the 30% Draft Design. A copy of this evaluation in letter format is included in Appendix D. Stop logs can either be custom fabricated or specified as one of the available prefabricated options available through a manufacturer. Further structural design of the water control structure will be developed for the 90% submittal.
The intent of the design is to provide a sill elevation with flexibility so that the inflow and outflow from the new backwater channel can be adjusted for adaptive management. Therefore the adjustable sill elevation is design to vary between 452.5 and 454.5 feet. This elevation brackets the elevation (453.5) in the 2012 Conceptual Design by ± 1 foot.
6.5. Backwater Access point
The 60% draft design includes a boat ramp facility that is intended for use by the LCR MSCP in maintaining the project. The new boat ramp will be accessed from the existing road along the west side of the project and will be obscured by disposal areas to be inconspicuous to the public. The new boat ramp is 30 feet wide with a slope of 15 percent and intended for lightweight and non-motorized boat launching. The ramp

7 April 9, 2015
Park Moabi Backwater Channel 60% Draft Design Report
includes 2-foot diameter boulder breakwaters and gravel fill placed within a Presto Geoweb system. The low-impact design will blend well with the surrounding features.
6.6. Landscape Restoration
The project area and constructed wetlands will be tilled along contours and will be planted to establish four classifications of land type cover including; backwater, marsh, cottonwood/willow, and other riparian areas. Tillage and planting will be performed by the LCR MSCP and is not specifically addressed in this report. Additional information regarding the land type covers is included for reference in Appendix C.
7. SOIL MECHANICS DESIGN
Geotechnical considerations for the 60% design including slope stability, foundation design, riprap requirements, and disposal of material are summarized below.
7.1. Geotechnical Data Collection
Geotechnical investigations and data collection were performed by the USBR in 2014. Eight test pits were excavated to depths of 14 to 23 feet within the project area. Selected samples taken from the test pits were tested to evaluate moisture content, gradation, and plasticity. Direct shear tests and permeability tests were also performed on selected remolded samples. Test pit logs and testing data are documented in Appendix B. Geotechnical characteristics for collected samples are summarized in Table 3.
Table 3. USBR Test Pits Summary
Soil Type
Test Pit(s) Sample
Density (pcf)
Moisture Content
(%)
Coefficient of Permeability
(cm/s)
Friction Angle (degrees)
Cohesion (psi)
Sands
TP-14-1 @ 4 ft
101.5
11
2.98x10⁻⁴
28.1
0
Sands
TP-14-2 @ 3 ft
100.9
11
3.27x10⁻⁴
29.3
0
Clay
Combined TP-14-8 (@2ft),
10 (@13ft), 12 (@14ft), &
14 (@14ft)
91.06
21.1
2.30x10⁻⁷
22.7
4
7.2. Slope Stability & Bearing Capacity
Field or laboratory testing of the in-situ density and strength of the on-site material is presently unavailable, therefore, geotechnical design parameters for this project will require a conservative assessment. Based on the shear strength testing done by USBR, as noted by the Friction Angle and Cohesion shown in Table 3, graded slopes for the backwater channel should be kept to 3(H):1(V) or flatter.

8 April 9, 2015
Park Moabi Backwater Channel 60% Draft Design Report
Based on existing geotechnical data the project structural components will be designed using nominal values provided by the California Building Code (CBC) for material types encountered the in the test pits. The assumed values for geotechnical parameters are summarized in Table 4.
Table 4. Geotechnical Parameters
Parameter Recommendation Allowable Vertical Bearing Capacity 1,500 psf
Allowable Lateral Bearing Capacity 100 psf/ foot of depth
Allowable Lateral Sliding Resistance 130 psf
7.3. Foundation Design
Foundation Characteristics and Preparation
Based on subsurface conditions encountered in the exploratory test pits, groundwater could be encountered in the excavation for the invert of the new arch culverts. Based on nominal CBC allowable bearing capacities an invert base slab foundation should be used for the arch culvert design.
Additionally, either loose to medium dense sand or soft to medium stiff clay could be encountered at the invert elevation. It is expected that these conditions will produce a relatively soft or loose bearing surface and difficult working conditions. Therefore, it is recommended that an engineered fill mat be constructed within the area below the new culvert and any appurtenant wing wall footings. The engineered fill should be constructed as follows:
• Over-excavate at least 2 feet below the base of the culvert slab or wall footing elevation
• Stabilize the soft subgrade by working open-graded aggregate material (typically ¾-inch or 1.5- inch crushed rock, coarser for softer subgrade) at least 4 to 6 inches into the soil.
• Place non-woven geotextile, Mirafi 180N or approved equivalent, over the stabilized subgrade.
• Place and compact well-graded select aggregate base fill over the geotextile.
Limitations
The existing data does not allow for detailed evaluation of a number of factors that may be pertinent to the project. The factors are discussed below:
• Foundation Design: If structural design requires higher than the nominal CBC code values, exploratory borings with laboratory strength testing or Cone Penetrometer Test (CPT) should be performed at the structure locations.
• Seismic Evaluation: If structural design requires evaluation of soil liquefaction and seismic deformation potential, exploratory borings or CPT would be required to depths of at least 50 feet below grade.

9 April 9, 2015
Park Moabi Backwater Channel 60% Draft Design Report
• Corrosion: Assessment of corrosion potential of the on-site soils would require retrieval of bulk
samples and testing of material. Samples from previous exploration could be used if they have not been removed from the sample bag.
• Seepage Analysis: Detailed evaluation/modeling of seepage below the concrete-arch culverts would require exploratory borings or CPT at each structure to evaluate the site-specific soil stratigraphy.
• Steeper Slopes: Construction of slopes steeper than 3H:1V would require knowledge of in-situ strength of the material. This would require exploratory borings or CPT.
7.4. Riprap Design
Riprap bank protection is required at both the Colorado River and Moabi Channel connections to the new backwater channel. Riprap is also required to prevent scour on the downstream ends of the concrete-arch culverts. The material intended for the riprap application will be similar to that present on the bank of the Colorado River and will be obtained from existing USBR stockpiles along the river. Riprap will be constructed over a suitable drainage layer including a sand and gravel backfill filter. Design of the riprap slope revetment will continue to be developed for the 90% design submittal.
7.5. Road Base and Aggregates
Compacted base materials for unpaved roadways will consist of untreated aggregate base as shown on the 60% project plans. Roadways and subgrade for structures and the boat ramp will need to be compacted to 95% of the maximum dry density. Boat ramp materials, aggregates and subgrade preparation will additionally be required to comply with the Geoweb manufacturer’s (Presto Geosystems) requirements for this applications.
7.6. Excavation and Disposal
Clearing and Grubbing
The site is currently vegetated and includes dense stands of salt cedar (tamarisk trees). The backwater channel site will be cleared and grubbed in its entirety to accommodate excavation, grading, fill, and disposal. Vegetative waste will be buried under the fill at the on-site disposal area (see Figure 2).
Earthwork
The grading plan in the 60% design results in approximately 1.2 million cubic yards of excavation and placement of approximately 1.2 million cubic yards of compacted fill in designated disposal areas shown on the drawings. A currently unaccounted for volume of vegetative waste will also be buried in the onsite disposal areas.

Park Moabi Backwater Channel 60% Draft Design Report
10 April 9, 2015
8. CONSTRUCTION DRAWINGS
The 60% construction drawings have been prepared using computer assisted drafting software. They do not contain any special or unusual features and have been organized and presented in a manner to facilitate construction. Design plans will continue to be developed for the 90% design submittal.
9. CONSTRUCTION SPECIFICATIONS
Specifications for the project are based on the Caltrans and USBR Standard. Project specifications and project notes are shown on the 60% plans and will continue to be refined for the 90% design submittal.
10. SURFACE WATER CONTROL
A Stormwater Pollution Prevention Plan will be established prior to start and be maintained at all times during construction. Construction will be phased such that the backwater channel is excavated and the concrete-arch culverts are constructed prior to connecting to the Moabi Channel and the Colorado River. The connection to the Colorado River to fill the backwater channel should occur first and should allow enough time to allow any silts disturbed during the connection to settle out prior to connection with the Moabi Channel.
11. DEWATERING
Construction of the concrete-arch culvert foundations may require localized dewatering efforts based on the information provided in the USBR test pit logs. A summary of groundwater elevations based on interpretation of the test pit logs is included in Table 5. Surface elevations were not provided on the test pit logs so the groundwater elevations shown in the table were interpreted from test pit depths and existing condition contour data. Groundwater elevations are expected to fluctuate with the rise and fall of the Colorado River due to the high presence of sandy soils.
Table 5. Ground Water Approximation during Test Pits
Test Pit Ground
Elevation Depth to
Groundwater Groundwater
Elevation
Total Depth Bottom
Elevation
TP-14-1 463 13 450 16 447
TP-14-2 470 DRY DRY 16 454
TP-14-5 476 DRY DRY 22 454
TP-14-8 458 3.5 454.5 23 435
TP-14-10 458 8 450 15 443
TP-14-12 458 6 452 17 441
TP-14-14 458 5 453 15 443
TP-14-15 460 7 453 14 446

Park Moabi Backwater Channel 60% Draft Design Report
11 April 9, 2015
Groundwater could be encountered in the excavation for the new concrete-arch culvert structures, especially at the downstream end. It should be expected that local well points to dewater near the culvert foundations may be a suitable means of groundwater control. For the primary excavation of the backwater channel, it is expected that this excavation will occur in the wet and dewatering such a large area would not be practical.
12. UTILITIES
Power poles, electric boxes, and sewer dump stations at existing recreational vehicle campsites were observed during a site visit in December 2014. Utility confirmations are pending, but it is likely that existing underground utilities will be encountered during construction of the backwater channel. Underground utilities servicing existing campsites are expected near the northern concrete-arch culvert and inlet channel from the Colorado River. Potential utility conflicts may include but are not limited to sewer, gas and underground electrical. For this reason the constructor will be required to contact California DigAlert (USA/SC directly by telephone at 8-1-1) at least two (2) full working days, excluding weekends and holidays, prior to construction.
13. TRAFFIC CONTROL
The USBR will be able to access the construction from the Park Moabi Road Exit from Interstate 40. The two concrete-arch culvert locations in the project are located on unpaved portions of roads which connects the Pirate Cove area to the beachfront RV campsites. A construction traffic control plan will need to be developed and implemented prior to construction.

Park Moabi Backwater Channel 60% Draft Design Report
April 9, 2015
This Page Intentionally Blank

Park Moabi Backwater Channel 60% Draft Design Report
April 9, 2015
FIGURES

Park Moabi Backwater Channel 60% Draft Design Report
April 9, 2015
This Page Intentionally Blank

Park Moabi Backwater Channel 60% Draft Design Report
\I
. ·-.__1..'"- ·--·
\ )
"\
zona Location Map
Park Moabi Proposed Backwater Channel
Figure 1. Location Map
Otis Cf April9, 2015

Park Moabi Backwater Channel 60% Draft Design Report
This Page Intentionally Blank
April 9, 2015

Park Moabi Backwater Channel 60% Draft Design Report
Site Plan Overview
Park Moabi Proposed Backwater Channel
Figure 2. Site Plan
(.._) Otis ·Cl April 9, 2015

Park Moabi Backwater Channel 60% Draft Design Report
This Page Intentionally Blank
April 9, 2015
Park Moabi Backwater Channel 60% Draft Design Report
April 9, 2015
APPENDIX A Hydrologic and Hydraulic Analysis Technical
Memorandum

Park Moabi Backwater Channel 60% Draft Design Report
April 9, 2015
This Page Intentionally Blank


1
Project Overview Otis Bay and Tetra Tech were hired by the Bureau of Reclamation to design approximately 50 acres of connected backwater habitat on the Lower Colorado River near Needles, CA, within the northern portion of Moabi Regional Park. The restored backwater habitat will consist of open water, marsh, and riparian landcover types, and is being implemented as part of the Lower Colorado Multi-Species Conservation Program (LCR MSCP) in order to provide critical habitat for the flannelmouth sucker (Catostomus latipinnis). Two endangered species of native Colorado River fish, razorback sucker (Xyrauchen texanus) and bonytail chub (Gila elegans), as well as numerous migratory bird species will also benefit from the increase in habitat.
In order to adequately satisfy design criteria, detailed hydrologic and hydraulic analyses are needed, as the flow regime near the project site is extremely complex. The site is located between two major dams on the Colorado River, Davis Dam upstream and Parker Dam downstream. Flows through this section of river are highly regulated and the river stage regularly fluctuates up to 4 feet on a given day below Davis Dam. Seasonal stage fluctuations may vary by as much as 7 feet.
The desired configuration of the backwater channel will consist of inlet and outlet control structures, set at equal elevations, with roadway crossings at the upstream and downstream ends. Although there will be times when no water enters or exits the channel, the backwater channel is expected to regularly exchange water with the main river channel during normal conditions. Mean velocities through the channel will ideally remain below 0.5 ft/s at high flow conditions, with channel depths ranging between 0 and 15 feet. The channel will exit into the existing Park Moabi backwater channel, which is controlled at the inlet only, and is occupied by Pirate Cove Resort and Marina. These detailed hydrologic and hydraulic analyses will allow the project to function as desired, without adversely impacting existing infrastructure and hydraulic conditions in surrounding areas.
Data Collection
Topography/Bathymetry Topographic and bathymetric data were obtained from the US Bureau of Reclamation (USBR). Otis Bay and Tetra Tech received 2-foot interval contours derived from LiDAR points (flown in 2008) and merged with bathymetric data of the main Colorado River channel. These contours were converted to a TIN surface using AutoCAD Civil3D 2015, and were used to represent the existing topography for the purpose of hydraulic modeling. Bathymetric data for the Park Moabi channel (where available) were received as a separate file and merged with the topography in HEC-RAS. Similarly, a TIN surface of the 60% restoration design grading plan was developed in Civil3D 2015 and added to the model, in order to represent proposed conditions. No bathymetric data was available for a small portion of the Park Moabi channel, therefore the channel bottom upstream of the large sediment plug was represented by interpolated contours that were included in the original LiDAR data.

2
Hydrologic Data The closest USGS gage to the project site is Below Davis Dam (Davis Dam), which recorded data as early as 1905; however, the dam and powerplant were not completed until 1953. As such, discharge data collected prior to 1953 were not used in the hydrologic analyses. In order to analyze the magnitude and frequency of extreme, post-dam events on the section of river adjacent to the project site, peak flows and corresponding recurrence intervals were estimated for the Davis Dam gage. A Log Pearson-III frequency analysis for water years 1953-2014 resulted in a 100-year flow of almost 42,000 cfs, which was selected as the 100-year design flow (Table 1).
Table 1. Recurrence intervals of post-dam peak events obtained from a Log Pearson-III regression analysis on the Davis Dam gage.
USGS Below Davis Dam (Gage #09423000) Flood Frequency Calculations Log-
Pearson Type III WY 1953-2014
Frequency
(years)
Skew Coefficient
K(1.862)
Discharge Q (cfs) 2 -0.29 20,600 5 0.60 24,400
10 1.30 27,600 25 2.23 32,500 50 2.93 36,700
100 3.64 41,400 200 4.35 46,700
In order to perform unsteady flow simulations in HEC RAS, representative hydrographs were needed for the Colorado River near the project site. Average and maximum days were identified within the 7 years of hourly data at the USBR Below Needles Bridge (BNB) and RS 41 (RS41) gages. The locations of these gages relative to the project site are depicted in Figure 1. The maximum observed flow in the 7 years of data at the BNB gage was approximately 24,000 cfs, which corresponds to a 5-year event at Davis Dam, and was considered a reasonable representation of a regular high flow event at the project site. One- hour interval, 3-day hydrographs, which included the average and maximum days, were developed and used to represent average and high flow events, respectively.

3
I
Colorado River Side Channel at Park Moabi, CA
.£ Gage Locations
--Project Area TETRA TE H N
0
10wu !'\ Figure1. Locations of USGS and USB R gages relative to the project site.

4
In September of 2013, the USBR installed a temporary gage (Temporary) directly upstream of the project site, which records stage (water surface elevation) only. Due to the relatively short period of record, data for previous years and missing data points at this gage location were supplemented with averages of the RS41 and BNB stage data, as preliminary analyses outlined in the Restoration and Development Plan (RDP) found this to be a reasonably accurate approximation of the water surface elevation at the project site (± 0.5 feet). Otis Bay and Tetra Tech further verified that this approximation would not significantly impact the accuracy of the hydraulic calculations by confirming that the accuracy was within 0.5 feet.
HEC RAS Model Development HEC-RAS is a widely used 1-dimensional step backwater hydraulic model developed by the Hydrologic Engineering Center in Davis, CA. The software predicts water surface elevations and computes hydraulic properties based on channel geometry, using various forms of the energy, momentum, and Manning’s equations. Computations were performed for both steady state and unsteady state flow conditions, where steady state equations are based on the assumption that the flow is independent of time while unsteady state equations consider a time component.
Calibration In order to calibrate the model to observed conditions and verify the accuracy of results, rating curves (stage vs discharge) were developed for the RS41 and Temporary gages. A large amount of variability exists within the data for both gages (± 1-2 feet in stage measurements), which is likely due to the numerous factors regularly affecting flow in the Colorado River. Simplified stage vs discharge curves that could be extrapolated and used for calibration purposes and model boundary conditions were developed by conducting regression analyses on each gage over the complete data sets.
Because the Temporary gage only records stage, an initial stage discharge relationship was developed using averaged flows from the BNB and RS41 gages and the recorded stage data (Figure 2). A regression of this relationship was used as a basis for initial calibration of channel roughness factors during steady flow simulations. In order to predict flows corresponding to stage measurements at the Temporary gage, unsteady flow simulations were performed using fixed stage measurements as upstream and downstream boundary conditions. The results were subsequently used to further refine roughness factors and calibrate downstream boundary conditions to observed conditions.

5
USB
R Te
mpo
rary
Gag
e St
age
Mea
sure
men
ts (f
t)
464
462
460
458
456
454
452
Regression
Data Points
450
448
446 0 5,000 10,000 15,000 20,000 25,000 30,000 35,000 40,000 45,000
Averaged Flows BNB and RS41 (cfs)
Figure 2. Initial stage discharge relationship for the temporary gage that was used for model calibration.
The model was calibrated by iteratively adjusting the “Manning’s n” variable at various cross sections until the modeled and observed water surface elevations were reasonably close. Over the period of record for the temporary gage (approximately 1 year), the simulated water surfaces were within approximately 0.5 feet of the observed water surfaces up to 25,000 cfs (Figure 3), which was deemed to be sufficiently accurate, considering variability in the data. The extrapolated water surfaces begin to diverge from the modeled water surface as flows increase to greater than 30,000 cfs, which is likely due to uncertainties in the overall dataset and lack of data points near the project site for flows exceeding 25,000 cfs. At higher flows the simulated water surface elevations are greater than the values extrapolated from the regression, which provides a more conservative estimate of expected water surface elevations during high flow events. Results of the finalized calibration are displayed in Figure 3, where the modeled water surfaces at the Temporary gage location are represented by blue lines and the stage discharge regression for the temporary gage is represented by the black line.

6
W.S
. Ele
v (f
t) 464
Legend
462
W.S. Elev
Obs RC Temp Gage
460
458
456
454
452
450
448
446
0 10000 20000 30000 40000
Q Total (cfs)
Figure 3. Unsteady flow simulated water surfaces (blue lines) compared to water surfaces obtained through regression analysis of gage data (black line), demonstrating the accuracy of model results.
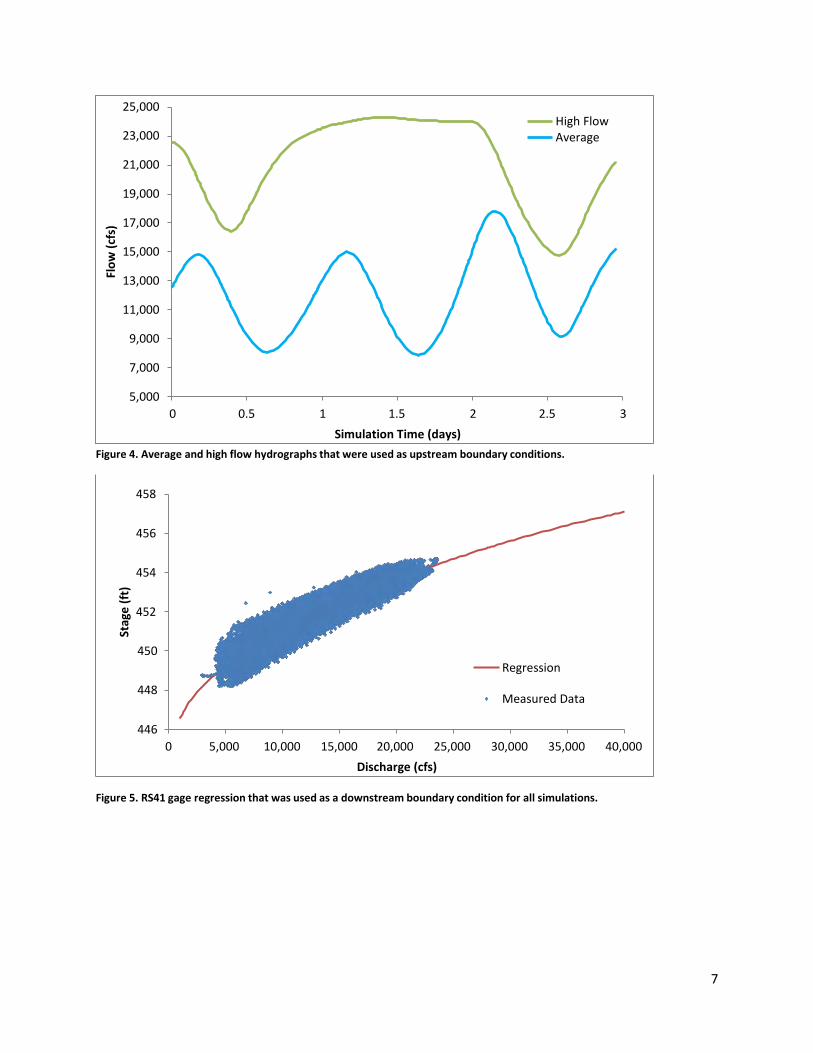
Model Extents and Boundary Conditions The locations of the Temporary and RS41 gages were set as the upstream and downstream boundaries of the model during the calibration process. After the model was calibrated, flow hydrographs obtained from the BNB gage were used as an upstream boundary condition (Figure 4), and the downstream boundary condition was set as the RS41 rating curve (Figure 5). In order to assess peak flow events, steady flow computations were performed for flows ranging between 24,000 and 42,000 cfs, with the same RS41 rating curve set as the downstream boundary condition.
7
Flow
(cfs
) St
age
(ft)
25,000
23,000
High Flow Average
21,000
19,000
17,000
15,000
13,000
11,000
9,000
7,000
5,000 0 0.5 1 1.5 2 2.5 3
Simulation Time (days) Figure 4. Average and high flow hydrographs that were used as upstream boundary conditions.
458
456
454
452
450
448
Regression Measured Data
446
0 5,000 10,000 15,000 20,000 25,000 30,000 35,000 40,000 Discharge (cfs)
Figure 5. RS41 gage regression that was used as a downstream boundary condition for all simulations.

8
Cross Sections and Hydraulic Structures Representative cross sections were developed for the main Colorado River channel and existing Park Moabi channel. Throughout the main channel of the Colorado River, various overbank channels and pools were set as ineffective flow areas, where water is stored but not actively conveyed downstream. This process was done iteratively to ensure that model results reflected reality. In order to address the large sediment plug at the upstream end of the Moabi channel, estimates of the elevation of the plug surface were made during a field survey. The channel bottom on the three cross sections that represent the plug was adjusted to the estimated elevations, and a high roughness factor was used to represent the thick marsh vegetation and corresponding amount of expected flow resistance. A comparison of simulations with and without the plug suggested that the backwater effects are relatively insignificant; however, the cross sections that were used to represent the plug were incorporated into the model geometry to provide more conservative results.
The Interstate 40 and BNSF railroad bridges (Figure 6) are the only significant structures that could potentially impact hydraulics in the main Colorado River channel near the project area. Data for both bridges were obtained from design drawings, and the backwater effects of the bridges were considered during all simulations using appropriate bridge routines. The upstream entrance to the existing Moabi channel contains three 42” culverts in parallel; however, the exact configuration of these culverts is unknown. A configuration of three 42” circular concrete culverts with blocked obstructions and high friction coefficients was assumed to provide a reasonably accurate representation of the poor condition of the Park Moabi channel inlet structure (Figure 7).

9
Figure 6. Interstate 40 and BNSF railroad bridges spanning the Colorado River downstream of the project site.
Figure 7. The failing inlet structure at the existing Park Moabi channel.
Results
Existing Conditions The model of existing conditions consists of the main stem of the Colorado River and the Moabi backwater channel as separate reaches. After performing simulations, the model predicted very little flow entering the Moabi Channel from the upstream end (approximately 5-10 cfs during average conditions), while a majority of the water entered as backwater from the downstream end (Figure 8). This result was consistent with field observations, suggesting that the overall configuration of the model provided an accurate representation of existing conditions.

Q T
o tal
(cfs
)
30 0
LCRParkM oabi 60% Fi nal Pl an: 1) A nnual Avg Ex Colorado Moabi Upper
Legend
Q T otal 12JUL2013 0900
Q T otal 12JUL2013 1200
Q T otal 11JUL2013 0900
20 0
Q T otal 11JUL2013 1200 Q T otal 10JUL2013 0900
Q T otal 10JUL2013 1200
Q T otal 11JUL2013 1500
Q T otal 12JUL2013 0600
10 0
Q T otal 10JUL2013 1500 Q T otal 12JUL2013 1500
Q T otal 11JUL2013 0600
Q T otal 10JUL2013 0600
Q T otal 10JUL2013 1800
Q T otal 11JUL2013 1800
0 Q T otal 10JUL2013 2100
Q T otal 12JUL2013 1800
Q T otal 11JUL2013 0300
Q T otal 10JUL2013 0300
-1 00
Q T otal 09JUL2013 2400 Q T otal 12JUL2013 2100
Q T otal 10JUL2013 2400
Q T otal 11JUL2013 2100
Q T otal 12JUL2013 0300
-2 00
Q T otal 11JUL2013 2400
0 20 00 40 00 60 00 80 00
Main Chan nel Dis tance (ft)
Figure 8. Computed discharge in the Park Moabi channel during the average event, where negative discharges represent upstream flow and the downstream end of the channel begins 0 feet on the x-axis.
10

11
Based on the analysis of existing conditions near the project site and guidelines outlined in the RDP, a sill elevation of 453.5 feet (NGVD29) was selected. Fixing the water surface elevation at the project site to this elevation will allow hydraulic conditions in the backwater slough to be consistent with the desired effects, including frequent exchange with the Colorado River during summer months and a period of no exchange during winter. The location of the proposed project site, relative to the USBR gages and other important design features, is provided in Figure 9. Hourly water surface elevations for the average event at the main channel cross section just upstream of the proposed site are displayed in Figure 10. The sill will be designed with flexibility so that the water surface can be adjusted between 452.5-454.5 feet using stop logs if desired. These sill elevations, in relation to simulated stage elevations averaged over the 5 complete water years (WY) of record at the BNB and RS41 gages, are displayed in Figure 11.

12
Mojave Valley Conservation Area Backwater
Project Design (5 ft Contours) QtiS --HEC-R AS Cross Sections ,
Project Area -.c: Gage Locations 1'1l;lTETRA TECH
N 0 0.25 0.5 J.. •••..:====-••••••- Miles f\
Figure 9. Overview of the project area with USBR gage locations and HEC-RAS cross section lines.

13
Elev
atio
n (ft
)
470
465
460
455
450
445
440
WS 09JUL2013 2400 WS 10JUL2013 0100 WS 10JUL2013 0200 WS 10JUL2013 0300 WS 10JUL2013 0400 WS 10JUL2013 0500 WS 10JUL2013 0600 WS 10JUL2013 0700 WS 10JUL2013 0800 WS 10JUL2013 0900 WS 10JUL2013 1000 WS 10JUL2013 1100 WS 10JUL2013 1200 WS 10JUL2013 1300 WS 10JUL2013 1400 WS 10JUL2013 1500 WS 10JUL2013 1600 WS 10JUL2013 1700 WS 10JUL2013 1800 WS 10JUL2013 1900 WS 10JUL2013 2000 WS 10JUL2013 2100 WS 10JUL2013 2200 WS 10JUL2013 2300 WS 10JUL2013 2400 WS 11JUL2013 0100 WS 11JUL2013 0200 WS 11JUL2013 0200 WS 11JUL2013 0300 WS 11JUL2013 0400 WS 11JUL2013 0500 WS 11JUL2013 0600 WS 11JUL2013 0700 WS 11JUL2013 0800 WS 11JUL2013 0900 WS 11JUL2013 1000 WS 11JUL2013 1200 WS 11JUL2013 1100 WS 11JUL2013 1300 WS 11JUL2013 1400 WS 11JUL2013 1500 WS 11JUL2013 1600 WS 11JUL2013 1700 WS 11JUL2013 1800 WS 11JUL2013 1900 WS 11JUL2013 2000 WS 11JUL2013 2100 WS 11JUL2013 2200 WS 11JUL2013 2300 WS 11JUL2013 2400 WS 12JUL2013 0100 WS 12JUL2013 0200 WS 12JUL2013 0300 WS 12JUL2013 0400 WS 12JUL2013 0500 WS 12JUL2013 0600 WS 12JUL2013 0700 WS 12JUL2013 0800 WS 12JUL2013 0900 WS 12JUL2013 1000 WS 12JUL2013 1100 WS 12JUL2013 1200 WS 12JUL2013 1300 WS 12JUL2013 1400 WS 12JUL2013 1500 WS 12JUL2013 1600 WS 12JUL2013 1700 WS 12JUL2013 1800 WS 12JUL2013 1900 WS 12JUL2013 2000 WS 12JUL2013 2100 WS 12JUL2013 2200 WS 12JUL2013 2300 Ground Bank Station
0 200 400 600 800 1000 1200 1400
Station (ft)
Figure 10. Hourly water surface elevations (blue lines) for the average event in the main Colorado River channel just upstream of the proposed project site.

14
Elev
atio
n (ft
)
458 Mean Hourly Stage Data Elevation 453.5 ft
Mean Hourly Stage (WY2009-WY2013)
457 Elevation 452.5 ft
Elevation 454.5 ft
456
455
454
453
452
451
450 Oct Nov Jan Mar May Jul Sep
Figure 11. Mean hourly stage data from the RS41 and BNB gages, averaged over WY2009-WY2013, in relation to sill elevations

15
Proposed Conditions Using the same hydrographs and rating curves as boundary conditions, the proposed geometry (60% design) was analyzed for the same average, high flow, and peak events as existing conditions. Once the sill elevation was determined, the 60% design grading plan was incorporated into the existing model as an additional reach. In order to establish an effective and efficient design, configurations of hydraulic structures and channel geometry were iteratively adjusted to achieve the desired hydraulic properties within the project area. CONTECH pre-cast CON/SPAN arch bridges were selected as the entrance and outlet control structures. The inverts for the bridge openings were set at an elevation of 452.5 feet so that stop logs or some similar structure can be used to adjust the sill elevation. The stop logs were modeled as in-line weirs with overflow gates, set at the design sill elevation of 453.5 feet. Hydraulic properties were also evaluated for sill elevations of 452.5 and 454.5 feet. Figure 12 depicts the expected flow entering, flowing through, and leaving the project site during average, high flow, and peak conditions with the sill set at the design elevation of 453.5 feet.

16
Q T
o tal
(cfs
) Q
To t
al (c
fs)
Q T
o tal
(cfs
)
60 0
LCRParkM oabi 60% Fi nal Pl an: 1) P rp Avg 453.5 Colorado Proposed Channel
Le gend
Q T otal 12J UL 201 3 060 0
Q T otal 12J UL 201 3 080 0
50 0
Q T otal 12J UL 201 3 040 0
Q T otal 10J UL 201 3 060 0
Q T otal 11J UL 201 3 060 0
Q T otal 12J UL 201 3 100 0
Q T otal 10J UL 201 3 040 0
Q T otal 11J UL 201 3 080 0
40 0
Q T otal 10J UL 201 3 080 0
Q T otal 09J UL 201 3 240 0
Q T otal 10J UL 201 3 020 0
Q T otal 11J UL 201 3 040 0
Q T otal 12J UL 201 3 020 0
30 0
Q T otal 11J UL 201 3 100 0
Q T otal 10J UL 201 3 100 0
Q T otal 12J UL 201 3 120 0
Q T otal 12J UL 201 3 220 0
Q T otal 11J UL 201 3 120 0
20 0
Q T otal 10J UL 201 3 120 0
Q T otal 12J UL 201 3 140 0
Q T otal 11J UL 201 3 020 0
Q T otal 12J UL 201 3 200 0
10 0
Q T otal 11J UL 201 3 140 0
Q T otal 10J UL 201 3 140 0
Q T otal 12J UL 201 3 160 0
Q T otal 11J UL 201 3 240 0
Q T otal 12J UL 201 3 180 0
Q T otal 10J UL 201 3 240 0
Q T otal 11J UL 201 3 160 0
Q T otal 10J UL 201 3 160 0
0 Q T otal 11J UL 201 3 220 0
Q T otal 11J UL 201 3 180 0
Q T otal 10J UL 201 3 180 0
Q T otal 10J UL 201 3 220 0
-1 00
0 10 00 20 00 30 00 40 00 50 00 60 00
Q T otal 10J UL 201 3 200 0
Q T otal 11J UL 201 3 200 0
Main Chan nel Dis tance (ft)
12 00
LCRParkM oabi 60% Fi nal Pl an: P roposed Hi gh Fl ow 453.5 Colorado Proposed Channel
Le gend
11 00
Q T otal 24A P R2 009 1 200
Q T otal 24A P R2 009 1 000
Q T otal 24A P R2 009 1 400
Q T otal 24A P R2 009 1 600
10 00 Q T otal 24A P R2 009 0 800
Q T otal 24A P R2 009 1 800
90 0
80 0
Q T otal 22A P R2 009 2 400
Q T otal 24A P R2 009 2 000
Q T otal 24A P R2 009 2 200
Q T otal 24A P R2 009 2 400
Q T otal 24A P R2 009 0 600
Q T otal 24A P R2 009 0 400
Q T otal 25A P R2 009 0 200
70 0
60 0
50 0
Q T otal 24A P R2 009 0 200
Q T otal 23A P R2 009 2 400
Q T otal 25A P R2 009 0 400
Q T otal 23A P R2 009 2 200
Q T otal 23A P R2 009 0 200
Q T otal 23A P R2 009 2 000
Q T otal 23A P R2 009 0 400
Q T otal 25A P R2 009 0 600
Q T otal 23A P R2 009 1 800
40 0
Q T otal 23A P R2 009 0 600
Q T otal 23A P R2 009 1 600
Q T otal 25A P R2 009 2 200
30 0
20 0
Q T otal 25A P R2 009 0 800
Q T otal 23A P R2 009 1 400
Q T otal 23A P R2 009 0 800
Q T otal 25A P R2 009 2 000
Q T otal 25A P R2 009 1 000
Q T otal 23A P R2 009 1 200
Q T otal 23A P R2 009 1 000
10 0 Q T otal 25A P R2 009 1 200
Q T otal 25A P R2 009 1 800
0
0 10 00 20 00 30 00 40 00 50 00 60 00
Q T otal 25A P R2 009 1 400
Q T otal 25A P R2 009 1 600
Main Chan nel Dis tance (ft)
24 00
LCRParkM oabi 60% Fi nal Pl an: 1) P K Fl w P rop Colorado Proposed Channel
Le gend
Q To tal 42 K cfs 100 YR
22 00
Q To tal 37 K cfs 50 YR
Q To tal 32 K cfs 25 YR
Q To tal 27 K cfs 10 YR
20 00 Q To tal 24 K cfs 5 YR
18 00
16 00
14 00
12 00
10 00 0 10 00 20 00 30 00 40 00 50 00 60 00
Main Chan nel Dis tance (ft)
Figure 12. Discharge through the proposed channel during average (top), high flow (middle), and peak (bottom) conditions.
17
Results suggest that flow through the inlet structure can be expected to occur in both directions under normal conditions, which is consistent with expectations, as the water surface typically recedes below the design sill elevation. Figure 13 is a velocity profile through the proposed channel that demonstrates the variation throughout the project site during average and high flow events. Negative velocities signify upstream flow, and a channel distance of 0 feet represents the downstream end of the channel. These results further show that mean velocities through the main section of the proposed channel will remain below 0.5 ft/s during the regular high flow event, with velocities through the bridge openings peaking at approximately 4 ft/s.

Vel
Ch
n l
(ft/s
) LCRParkM oabi 60% Fi nal Pl an: 1) P rp Avg 453.5 2) Hi gh Fl ow P rop
Colorado Proposed Channel 5
Legend Vel Chnl 22APR2009 2400 - High Flow Prop
Vel Chnl 24APR2009 1200 - High Flow Prop
Vel Chnl 24APR2009 1500 - High Flow Prop
Vel Chnl 24APR2009 0900 - High Flow Prop
Vel Chnl 24APR2009 1800 - High Flow Prop
Vel Chnl 24APR2009 2400 - High Flow Prop
4 Vel Chnl 24APR2009 2100 - High Flow Prop
Vel Chnl 24APR2009 0600 - High Flow Prop
Vel Chnl 24APR2009 0300 - High Flow Prop
Vel Chnl 25APR2009 0300 - High Flow Prop
Vel Chnl 23APR2009 2400 - High Flow Prop
Vel Chnl 23APR2009 2100 - High Flow Prop
Vel Chnl 23APR2009 0300 - High Flow Prop
3 Vel Chnl 25APR2009 0600 - High Flow Prop
Vel Chnl 23APR2009 1800 - High Flow Prop
Vel Chnl 23APR2009 0600 - High Flow Prop
Vel Chnl 23APR2009 1500 - High Flow Prop
Vel Chnl 25APR2009 2100 - High Flow Prop
Vel Chnl 25APR2009 0900 - High Flow Prop
Vel Chnl 23APR2009 0900 - High Flow Prop
2 Vel Chnl 23APR2009 1200 - High Flow Prop
Vel Chnl 12JUL2013 0600 - Prp Avg 453.5
Vel Chnl 25APR2009 1200 - High Flow Prop
Vel Chnl 25APR2009 1800 - High Flow Prop
Vel Chnl 25APR2009 1500 - High Flow Prop
Vel Chnl 12JUL2013 0900 - Prp Avg 453.5
Vel Chnl 10JUL2013 0600 - Prp Avg 453.5
1 Vel Chnl 11JUL2013 0600 - Prp Avg 453.5
Vel Chnl 09JUL2013 2400 - Prp Avg 453.5
Vel Chnl 12JUL2013 0300 - Prp Avg 453.5
Vel Chnl 10JUL2013 0300 - Prp Avg 453.5
Vel Chnl 11JUL2013 0900 - Prp Avg 453.5
Vel Chnl 10JUL2013 0900 - Prp Avg 453.5
Vel Chnl 12JUL2013 1200 - Prp Avg 453.5
0 Vel Chnl 11JUL2013 1200 - Prp Avg 453.5
Vel Chnl 10JUL2013 1200 - Prp Avg 453.5
Vel Chnl 11JUL2013 0300 - Prp Avg 453.5
Vel Chnl 12JUL2013 1500 - Prp Avg 453.5
Vel Chnl 11JUL2013 1500 - Prp Avg 453.5
Vel Chnl 10JUL2013 1500 - Prp Avg 453.5
Vel Chnl 12JUL2013 2100 - Prp Avg 453.5
-1 Vel Chnl 11JUL2013 1800 - Prp Avg 453.5
Vel Chnl 10JUL2013 1800 - Prp Avg 453.5
Vel Chnl 12JUL2013 1800 - Prp Avg 453.5
Vel Chnl 10JUL2013 2400 - Prp Avg 453.5
Vel Chnl 11JUL2013 2400 - Prp Avg 453.5
Vel Chnl 10JUL2013 2100 - Prp Avg 453.5
Vel Chnl 11JUL2013 2100 - Prp Avg 453.5
-2 0 1000 2000 3000 4000 5000 6000 7000
Main Channel Dis tance (ft)
Figure 13. Velocity profiles through the project site during average and high flow conditions.
18

The impacts on stage in the main Colorado River channel caused by the proposed channel were considered negligible, as the water surface elevation is expected to decrease by less than 0.1 feet near the project site. Impacts on velocities, stage, and flows in the Park Moabi channel were also considered, and a slight increase in the velocities near the outlet of the project site is expected. However, these changes are considered to be insignificant, as velocities will remain below approximately 1 ft/s, even during the high flow (5-year) event (Figure 14 A&B).
19

20
Vel
Chn
l (ft
/s)
0.3
LCRParkM oabi 60% Fi nal Pl an: 1) Hi gh Fl ow Ex Colorado Moabi Upper
Legend
Vel Chnl 25APR2009 0600
Vel Chnl 25APR2009 0900
Vel Chnl 23APR2009 0600
0.2
Vel Chnl 25APR2009 1200 Vel Chnl 23APR2009 0900
Vel Chnl 23APR2009 0300
Vel Chnl 25APR2009 0300
Vel Chnl 22APR2009 2400
0.1
Vel Chnl 25APR2009 1500 Vel Chnl 24APR2009 1500
Vel Chnl 24APR2009 2400
Vel Chnl 24APR2009 1200
Vel Chnl 24APR2009 1800
0.0
Vel Chnl 24APR2009 2100 Vel Chnl 24APR2009 0900
Vel Chnl 24APR2009 0600
Vel Chnl 24APR2009 0300
Vel Chnl 23APR2009 2400
-0.1
Vel Chnl 23APR2009 2100 Vel Chnl 23APR2009 1200
Vel Chnl 23APR2009 1800
Vel Chnl 23APR2009 1500
Vel Chnl 25APR2009 1800
-0.2
Vel Chnl 25APR2009 2100
0 2000 4000 6000 8000
Main Channel Dis tance (ft)
Figure 14-A. Velocity profiles through the existing Moabi channel for existing conditions during average and high flow events.

21
Vel
Chn
l (ft
/s)
1.2
LCRParkM oabi 60% Fi nal Pl an: P roposed Hi gh Fl ow 453.5 Colorado Moabi Lower Colorado Moabi Upper
Legend
1.0
Vel Chnl 25APR2009 0300 Vel Chnl 25APR2009 0600 Vel Chnl 24APR2009 1500 Vel Chnl 24APR2009 1200
Vel Chnl 24APR2009 1800
0.8
Vel Chnl 24APR2009 2400 Vel Chnl 24APR2009 0900
Vel Chnl 24APR2009 2100
0.6
Vel Chnl 23APR2009 0300 Vel Chnl 24APR2009 0600 Vel Chnl 24APR2009 0300 Vel Chnl 23APR2009 0600
0.4
Vel Chnl 22APR2009 2400 Vel Chnl 23APR2009 2400
Vel Chnl 25APR2009 0900
0.2
Vel Chnl 23APR2009 2100 Vel Chnl 23APR2009 0900 Vel Chnl 23APR2009 1800
Vel Chnl 25APR2009 1200
0.0
Vel Chnl 23APR2009 1500 Vel Chnl 23APR2009 1200 Vel Chnl 25APR2009 2100
Vel Chnl 25APR2009 1500
-0.2
Vel Chnl 25APR2009 1800
0 2000 4000 6000 8000
Main Channel Dis tance (ft)
Figure 14-B. Velocity profiles through the existing Moabi channel for proposed conditions during average and high flow events. (Note: the gap in the profiles is an artifact of a model requirement for displaying multiple reaches and does not represent an actual gap in the data)

The effects of these various scenarios on the hydraulics of the proposed channel and surrounding area will be analyzed in more detail as the channel design is revised further. Adjustments to the design will be made as necessary, to ensure that the design will adequately and effectively achieve desired results.
22

Park Moabi Backwater Channel 60% Draft Design Report
April 9, 2015
This Page Intentionally Blank

Park Moabi Backwater Channel 60% Draft Design Report
April 9, 2015
APPENDIX B
USBR Subsurface Exploration & Geotechnical Data

Park Moabi Backwater Channel 60% Draft Design Report
April 9, 2015
This Page Intentionally Blank

Park Moabi Regional Park Backwater Project
Mojave Valley Conservation Area Lower Colorado Region
U.S. Department of the Interior Bureau of Reclamation Provo Area Office Provo, UT September 2014

Mission Statements
The mission of the Department of the Interior is to protect and provide access to our Nation’s natural and cultural heritage and honor our trust responsibilities to Indian Tribes and our commitments to island communities.
The mission of the Bureau of Reclamation is to manage, develop, and protect water and related resources in an environmentally and economically sound manner in the interest of the American public.

Park Moabi Regional Park Backwater Project
Mojave Valley Conservation Area Lower Colorado Region
prepared by David Nielsen
Geologist Provo Area Office Provo, UT
U.S. Department of the Interior Bureau of Reclamation Provo, Utah September 2014


Contents
Page
1.0 Introduction.................................................................................................... 1 1.1 Purpose and Scope ...................................................................................... 1 1.2 Location ..................................................................................................... 1
2.0 Investigation ................................................................................................... 1 2.1 Test Pits....................................................................................................... 3
Test Pit TP-14-1 .......................................................................................... 3 Test Pit TP-14-2 .......................................................................................... 3 Test Pit TP-14-5 .......................................................................................... 4 Test Pit TP-14-8 .......................................................................................... 5 Test Pit TP-14-10 ........................................................................................ 6 Test Pit TP-14-12 ........................................................................................ 7 Test Pit TP-14-14 ........................................................................................ 8 Test Pit TP-14-15 ........................................................................................ 8
2.2 Groundwater ............................................................................................... 9 2.3 Laboratory Analysis .................................................................................... 9
3.0 Summary....................................................................................................... 10
Figures Figure 1 Image of the Study Area with Test Pit Locations Figure 2 Photograph of the Sand Spoil Pie of Test Pit TP-14-2 L
Looking East Figure 3 Photograph of Side Wall of Test Pit TP-14-15 Figure 4 Photograph Looking into Test Pit TP-14-8 Figure 5 Photograph of Excavator Digging Test Pits TP-14-10 with
Spoil Pile Figure 6 Photograph of Test Pit TP-14-12 with Groundwater
Seeping into the Excavation at about 6 feet.
Table Depths Below Ground Surface to the Water
Appendices Appendix A Test Pit Logs Appendix B Laboratory Results


1
1.0 Introduction
1.1 Purpose and Scope
The purpose of this study was to survey the subsurface soil profiles and collect soil samples to characterize subsurface soil materials and groundwater levels underlying the Park Moabi Regional Park Area along the Colorado River. The Mojave Valley Conservation Area is being investigated for development as a backwater habitat under the Lower Colorado River Multi-Species Conservation Program and is within the Park Moabi Regional Park boundary. Personnel from the Provo Area Office of the Bureau of Reclamation, Upper Colorado Region under the guidance of staff from the Lower Colorado Region, excavated test pits to survey and collect the subsurface soils at the Park Moabi site between June 24 and 26, 2014. Test pit locations were limited due to regulations under the Federal Migratory Bird Act and the California Endangered Species Act.
1.2 Location
Park Moabi Regional Park is located about 9.5 miles southeast of Needles, California, upstream of the entrance to Topock Gorge, about 2 miles northwest of where Interstate 40 crosses the Colorado River. The site lies on the west side (California side) of the Colorado River.

1
2.0 Investigation
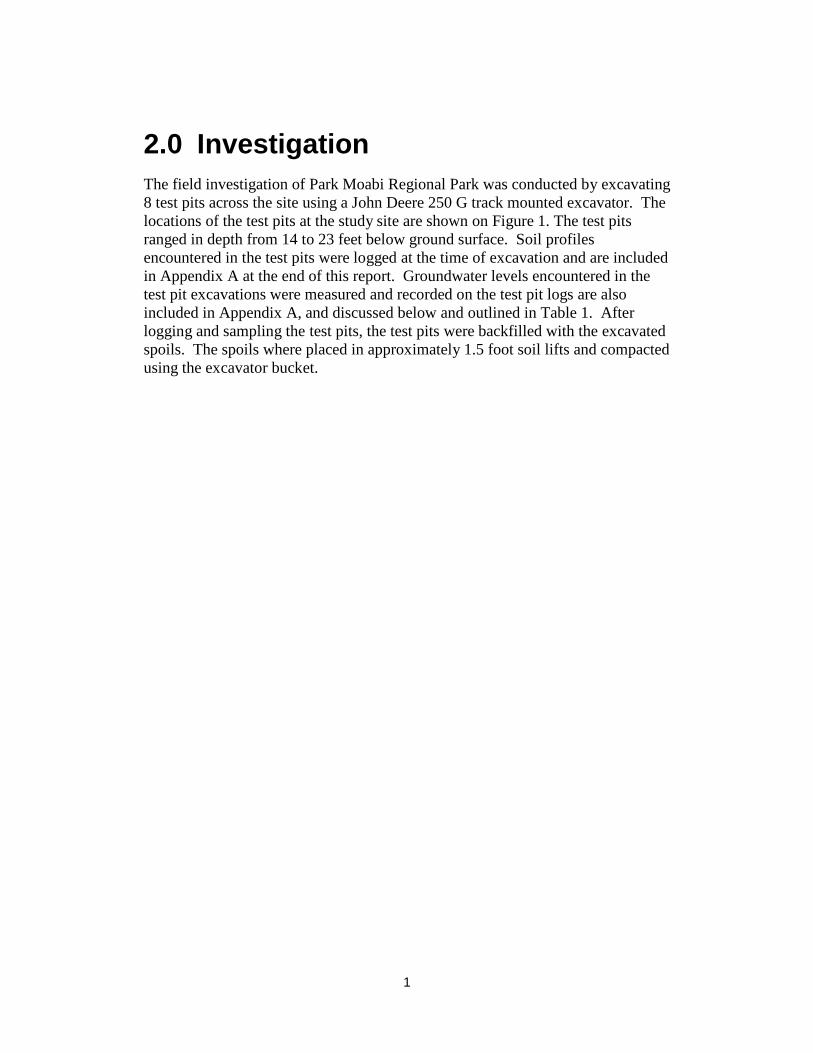
The field investigation of Park Moabi Regional Park was conducted by excavating 8 test pits across the site using a John Deere 250 G track mounted excavator. The locations of the test pits at the study site are shown on Figure 1. The test pits ranged in depth from 14 to 23 feet below ground surface. Soil profiles encountered in the test pits were logged at the time of excavation and are included in Appendix A at the end of this report. Groundwater levels encountered in the test pit excavations were measured and recorded on the test pit logs are also included in Appendix A, and discussed below and outlined in Table 1. After logging and sampling the test pits, the test pits were backfilled with the excavated spoils. The spoils where placed in approximately 1.5 foot soil lifts and compacted using the excavator bucket.

2
Figure 1 - The image shows the Park Moabi study area with the locations of the test pits indicated. The Colorado River is shown along the northeastern portion of the study area in the image. Test pit locations were limited due to regulations under the Federal Migratory Bird Act and the California Endangered Species Act.

3
2.1 Test Pits
The 8 test pits excavated for the study consisted of TP-14-1, TP-14-2, TP-14-5, TP-14-8, TP-14-10, TP-14-12, TP-14-14, and TP-14-15. The majority of the soil encountered on the surface and in the test pits consisted of sands. Along the central western portion of the study area medium and highly plastic clays were encountered in pockets on the surface, and in the subsurface profile. The test pits excavated in sand soils typically experienced caving of the side walls from the surface to the bottom. Caving of sand soils hampered the excavator’s progress of digging some of the test pits deeper. The following describes soils encountered and groundwater levels observed during test pit excavation. Logs of the test pits are included in Appendix A.
Test Pit TP-14-1 Test pit TP-14-1, was excavated in the northern portion of the study area, approximately 150 feet from the western edge of the Colorado River. Soils encountered in the test pit consisted of light brown Poorly Graded Sand (SP) from the ground surface down to about 13 feet below the ground surface. The sand was in a loose state at the surface, transitioning with depth to a loose to medium dense state. Underlying the sand was dark grayish brown Silty Clay (CL-ML) from 13 feet down to the bottom of the test pit at 16 feet. The clay had a soft to medium stiff consistency. The soil profile was dry at the surface with increasing moisture content with depth. At about 11 feet the soil appeared to be very moist, groundwater was encountered at about 13 feet.
Test Pit TP-14-2 Test pit TP-14-2, was excavated in the northern portion of the study area. The soil encountered consisted of light brown Poorly Graded Sand (SP) from the surface to 16 feet, the bottom of the test pit. The sand was loose at the surface, transitioning with depth to a loose to medium dense state. The soil profile was dry at the surface with increasing moisture content with depth. Figure 2 shows the spoil pile excavated from the test pit with the John Deere Excavator alongside.

4
Figure 1 - View looking east of the sand spoil pile of test pit TP-14-2. Photograph by David Nielsen.
Test Pit TP-14-5 Test pit TP-14-5, was excavated along the western side of the north-central portion of the study area. The soil encountered consisted of light brown Poorly Graded Sand (SP) from the surface to 22 feet, the bottom of the test pit. The sand was loose at the surface, transitioning with depth to a loose to medium dense state. The soil profile was dry at the surface with increasing moisture content with depth. At about 19 feet the soil was very moist. Figure 3 shows the test pit with bedding planes exposed in the side wall. Caving of the side wall in sandy soils was common during the test pit study.

5
Figure 2 - Side wall of test pit TP-14-5. Photograph by David Nielsen.
Test Pit TP-14-8 Test pit TP-14-8, was excavated along the western side of the central portion of the study area. Soils encountered consisted of grayish brown Lean Clay (CL) from the surface to about 3.5 feet. The clay was soft to medium stiff and slightly moist at the surface with moisture increasing to very moist at about 3 feet. Underlying the lean clay was dark gray Clayey Sand (SC) from 3.5 feet down to about 6.5 feet. Less than 10 percent fine subangular to subrounded gravel was present. The clayey sand was loose and very moist to wet with groundwater perched within the unit at about 3.5 feet. At 6.5 feet a brown Fat Clay with Sand (CH)s was encountered and continued to 23 feet, the bottom of the test pit. The clay soil was moist, and in a stiff state. Figure 4 shows test pit TP-14-8 with clay exposed in the bottom portion of the test pit. The perched groundwater in the clayey sand layer has caused sloughing of the test pit side wall above the lower clay unit.

6
Figure 3 - View looking into test pit TP-14-8, Fat Clay with Sand (CH)s overlying a wet Silty Clay (CL-ML) unit, followed by a stiff Lean Clay (CL). Groundwater was perched in the sandy clay unit. Photograph by David Nielsen.
Test Pit TP-14-10 Test pit TP-14-10 was excavated along the western side of the central portion of the study area. Figure 5 shows the test pit being excavated. Soils encountered in the test pit consisted of light brown Silty Sand (SM) from the surface to about 0.5

7
foot, followed by Poorly Graded Sand (SP) from 0.5 foot down to about 10 feet below the ground surface. The color of the sand changed at about 7 feet to grayish brown. The sand was loose at the surface, transitioning with depth to a loose to medium dense state. The sand soil profile was dry at the surface with increasing moisture content with depth. At about 6.5 feet the moisture content appeared to be very moist. Groundwater was encountered at about 8 feet below surface in the sand layer. Underlying the sand was dark gray Lean Clay (CL) from 10 feet down to the bottom of the test pit at 15 feet. The clay had a medium stiff consistency and was moist.
Figure 5 - Excavator digging test pit TP-14-10 with spoil pile. Photograph by David Nielsen.
Test Pit TP-14-12 Test pit TP-14-12 was excavated along the western side of the south-central portion of the study area. Soils encountered in the test pit consisted of light brown Poorly Graded Sand with Silt (SP-SM) from the surface to about 8 feet, followed by Poorly Graded Sand (SP) down to about 14 feet. The color of the sand changed to brown at about 1.5 feet, and at about 8 feet to grayish brown. The sand was loose at the surface, transitioning with depth to a loose to medium dense state. The sand soil profile was dry at the surface with increasing moisture content with depth. At about 5 feet the moisture content appeared to be very moist. Groundwater was encountered at about 6 feet below surface in the sand layer. Figure 6 shows groundwater seeping into the test pit during excavation. Underlying the sand was Lean Clay (CL) from 14 feet down to the bottom of the

8
test pit at 17 feet. The clay was dark gray mottled with olive green and brown. The clay had a medium stiff consistency and was moist.
Figure 6 - Test pit TP-14-12 with groundwater seeping into the excavation at about 6 feet. Photograph by David Nielsen.
Test Pit TP-14-14 Test pit TP-14-14 was excavated along the western side of the southern portion of the study area. Soils encountered in the test pit consisted of light brown Poorly Graded Sand (SP) from the surface to about 11.5 feet below the ground surface. The color of the sand changed at about 5 feet to grayish brown. The sand was loose at the surface, transitioning with depth to a loose to medium dense state. The sand soil profile was dry at the surface with increasing moisture content with depth. At about 4 feet the moisture content appeared to be very wet. Groundwater was encountered at about 5 feet below surface in the sand layer. Underlying the sand was Lean Clay (CL) from 11.5 feet down to the bottom of the test pit at 15 feet. The color of the clay soil was black; the soil had a medium stiff consistency and was moist.
Test Pit TP-14-15 Test pit TP-14-15 was excavated in the southern portion of the study area. The soil encountered consisted of brown Poorly Graded Sand (SP) from the surface to 14 feet, the bottom of the test pit. The sand was in a loose at the surface, transitioning with depth to a loose to medium dense state. The soil profile was dry at the surface with increasing moisture content with depth. At about 4.5 feet the soil was moist and about 6 feet very moist. Groundwater was encountered at about 7 feet during excavation.

9
2.2 Groundwater
Groundwater was encountered in 6 of the 8 test pits excavated for the study. The following Table 1 outlines where groundwater was encountered in the test pits excavated for the study.
Depths Below Ground Surface to the Water Table
Test Pits TP-14-1 TP-14-8 TP-14-10 TP-14-12 TP-14-14 TP-14-15
Groundwater depth below
surface
13 feet 3.5 feet
perched
8 feet
6 feet
5 feet
7 feet
In the northern portion of the study area groundwater was typically out of reach for the excavator, and caving of the side walls hampered digging and observations. Test pit TP-14-1, excavated in the northern portion of the site near the river, had groundwater at about 13 feet below the ground surface. Along the western and southern portions of the site groundwater depths varied from 5 to 8 feet. Groundwater encountered in test pit TP-14-8 at 3.5 feet appeared to be perched in the Clayey Sand soil unit above the Fat Clay unit observed at 6.5 feet. The underlying clay at 6.5 feet was in a moist state.
2.3 Laboratory Analysis
Soils collected in the test pits were delivered to the soils laboratory at Reclamatiuon’s Provo Area Office in Utah. The samples were analyzed in the laboratory and classified by the Unified Soil Classification System. Laboratory testing of the soil samples included gradation analysis, Atterberg Limit characterization, hydrometer analysis, and moisture evaluations. Results of the laboratory analysis are included in Appendix B of this report.
The laboratory analysis of the soil samples indicated that the sand soils present across the site were primarily Poorly Graded Sand (SP) with little fines content and exhibiting no plastic characteristics. Low to medium plasticity clays were encountered underlying the sand soils in the western and southern portions of the study area with a few exposures of the clay at the surface.

10
3.0 Summary
The Mojave Valley Conservation Area is being investigated for development as a backwater habitat under the Lower Colorado Multi-Species Conservation Program and is within the Park Moabi Regional Park boundary. Personnel from Reclamation’s Provo Area Office under the guidance of staff from the Lower Colorado Region, excavated test pits to survey and collect the subsurface soils at the Park Moabi site
The field investigation of Park Moabi Regional Park was conducted by excavating 8 test pits across the site. The test pits ranged in depth from 14 to 23 feet below ground surface. The 8 test pits excavated for the study consisted of TP-14-1, TP-14-2, TP-14-5, TP-14-8, TP-14-10, TP-14-12, TP-14-14, and TP-14- 15. The majority of the soil encountered on the surface and in the test pits consisted of sands. Along the central western portion of the study area low to medium plasticity clays were encountered in pockets on the surface, and in the subsurface profile. The test pits excavated in sand soils typically experienced caving of the side walls from the surface to the bottom. Caving of sand soils hampered the excavator’s progress of digging some of the test pits deeper.
Groundwater was encountered in 6 of the 8 test pits excavated for the study. In the northern portion of the study area groundwater was typically out of reach for the excavator, and caving of the side walls hampered observations. However, test pit TP-14-1, excavated in the northern portion of the site near the river, had groundwater at about 13 feet below the ground surface. Along the western and southern portions of the site groundwater depths varied from 5 to 8 feet.
Soil samples collected in the field were analyzed in the Provo Area Office’s soils laboratory and were classified by the Unified Soil Classification System. Laboratory testing of the soil samples included gradation analysis, Atterberg Limit characterization, hydrometer analysis, and moisture evaluations. Soils encountered across the majority of the site consisted of Poorly Graded Sand (SP) with low to medium plastic Lean Clay (CL) and Fat Clay (CH) encountered underlying the sand soils in the western and southern portions of the study area.

Geotec hRepo
Appendix A
Tes tP i tLog

Bureau of Reclamation LOG OF TEST PIT Hole No. TP-14-1
FEATURE: Park Moabi Regional Park, California PROJECT: Mojave Valley Conservation Area AREA DESIGNATION: GROUND ELEVATION: El. COORDINATES: Lat. 34º44’39.3”, Long. -114º31’29.4” STATION AND OFFSET: none APPROX. DIMENSIONS: 18.0 ft. long x 18 ft. wide, METHOD OF EXPLORATION: John Deer 250 G Excavator.
16 ft. deep. LOGGED BY: David Nielsen DEPTH TO WATER: 13 ft., DATE: 6-24-2014 DATE(S) LOGGED: 6-24-2014
CLASSIFICATION GROUP SYMBOL
CLASSIFICATION AND DESCRIPTION OF MATERIAL (SEE USBR 5000, 5005)
% PLUS 3-INCH BY WEIGHT
3-5 inch
5–12 inch
Plus 12
inch (SP)
(laboratory classification)
13.0 ft.
0.0 to 13.0 ft. Poorly Graded Sand, (SP): Laboratory classified as 100% sand; 0.3% fines; non-plastic; total moisture content = 9.9%.
IN-PLACE CONDITION: Light brown 7.5 YR 6/3; homogeneous; fine to medium, subangular to subrounded sand; about 5% fine subangular to subrounded gravel observed on the surface; thin bedding laminations and cross-bedding present, occasional interbedded thin clayey sand seams; maximum particle size about 15 mm; no reaction with HCl; some roots present maximum diameter about 20 mm; caving of sidewalls from surface to bottom (16 ft).
Dry 0.0 to 1.5 ft, dry to slightly moist 1.5 to 7.0 ft, moist 7 to 13.0 ft; loose 0.0 to 1.5 ft, loose to medium dense 1.5 to 13.0 ft.
Sample collected at 4 ft.
0
0
0
(CL-ML) (laboratory
classification)
16.0 ft.
13.0 to 16.0 ft. Silty Clay, (CL-ML): Laboratory classified as 2% sand; 98% fines; LL = 28.5%; PI = 6.2%; total moisture content = 32.9%.
IN-PLACE CONDITION: Dark grayish brown 10 YR 4/2,homogeneous; no reaction with HCl; some organic and small roots present.
Very moist 13.0 to 16.0 ft; soft to medium stiff 13.0 to 16.0 ft.
Sample collected at 14 ft.
0
0
0
REMARKS: - Refer to attached figure. Approx. = approximate; ds = downstream; ft. = foot; lb(s) = pound; mm = millimeter; HCl = hydrochloric acid; tr = trace; El. = elevation; LL = liquid limit; PI = Plastic Index; FM = Field Moisture. - Excavated with a John Deer 250 G Excavator with a 42-inch-wide toothed bucket.

Bureau of Reclamation LOG OF TEST PIT Hole No. TP-14-2
FEATURE: Park Moabi Regional Park, California PROJECT: Mojave Valley Conservation Area AREA DESIGNATION: GROUND ELEVATION: El. COORDINATES: Lat. 34º44’34.4”, Long. -114º31’29.9” STATION AND OFFSET: none APPROX. DIMENSIONS: 18.0 ft. long x 18 ft. wide, METHOD OF EXPLORATION: John Deer 250 G Excavator.
16 ft. deep. LOGGED BY: David Nielsen DEPTH TO WATER: None Observed, DATE: 6-24-2014 DATE(S) LOGGED: 6-24-2014
CLASSIFICATION GROUP SYMBOL
CLASSIFICATION AND DESCRIPTION OF MATERIAL (SEE USBR 5000, 5005)
% PLUS 3-INCH BY WEIGHT
3-5 inch
5–12 inch
Plus 12
inch (SP)
(laboratory classification)
16.0 ft.
0.0 to 16.0 ft. Poorly Graded Sand, (SP): Laboratory classified as 99% sand; 1% fines; non-plastic; total moisture content = 1.0%.
IN-PLACE CONDITION: light brown 7.5 YR 6/3; homogeneous; fine to medium, subangular to subrounded sand; about 5% fine subangular to subrounded gravel observed at the surface; thin bedding laminations and cross-bedding present; maximum particle size about 15 mm; no reaction with HCl; some roots present from surface to about 7 ft., maximum root diameter about 15 mm; some bivalve shells observed; caving of sidewalls from surface to bottom (16 ft.).
Dry 0.0 to 2.0 ft, dry to slightly moist 2.0 to 16.0 ft.; loose 0.0 to 2.0 ft, loose to medium dense 2.0 to 16.0 ft.
Sample collected at 2 ft.
Sample collected at 7 ft.
0
0
0
REMARKS: - Refer to attached figure. Approx. = approximate; ds = downstream; ft. = foot; lb(s) = pound; mm = millimeter; HCl = hydrochloric acid; tr = trace; El. = elevation; LL = liquid limit; PI = Plastic Index; FM = Field Moisture. - Excavated with a John Deer 250 G Excavator with a 42-inch-wide toothed bucket.

Bureau of Reclamation LOG OF TEST PIT Hole No. TP-14-5
FEATURE: Park Moabi Regional Park, California PROJECT: Mojave Valley Conservation Area AREA DESIGNATION: GROUND ELEVATION: El. COORDINATES: Lat. 34º44’22.4”, Long. -114º31’28.0” STATION AND OFFSET: none APPROX. DIMENSIONS: 20.0 ft. long x 20 ft. wide, METHOD OF EXPLORATION: John Deer 250 G Excavator.
22 ft. deep. LOGGED BY: David Nielsen DEPTH TO WATER: None Observed, DATE: 6-25-2014 DATE(S) LOGGED: 6-25-2014
CLASSIFICATION GROUP SYMBOL
CLASSIFICATION AND DESCRIPTION OF MATERIAL (SEE USBR 5000, 5005)
% PLUS 3-INCH BY WEIGHT
3-5 inch
5–12 inch
Plus 12
inch (SP)
(laboratory classification)
22.0 ft.
0.0 to 22.0 ft. Poorly Graded Sand, (SP): Laboratory classified as 99% sand; 1% fines; non-plastic; total moisture content = 2.4%.
IN-PLACE CONDITION: light brown 7.5 YR 6/3, and brown 7.5 YR 5/3 from 4 ft. to bottom (22 ft.); homogeneous; fine to medium, subangular to subrounded sand; about 5% fine subangular to rounded gravel observed at the surface; thin bedding laminations and cross- bedding present; maximum particle size about 20 mm; no reaction with HCl; some roots present from surface to about 7 ft., maximum root diameter about 15 mm; trace bivalve shells observed; caving of sidewalls from surface to bottom (22 ft.).
Dry 0.0 to 2.0 ft, dry to slightly moist 2.0 to 14.0 ft. increasing moisture with depth, moist 14.0 to 19.0 ft., very moist from 19.0 to 22.0 ft.; loose 0.0 to 2.0 ft, loose to medium dense 2.0 to 22.0 ft.
Sample collected at 10 ft.
0
0
0
REMARKS: - Refer to attached figure. Approx. = approximate; ds = downstream; ft. = foot; lb(s) = pound; mm = millimeter; HCl = hydrochloric acid; tr = trace; El. = elevation; LL = liquid limit; PI = Plastic Index; FM = Field Moisture. - Excavated with a John Deer 250 G Excavator with a 42-inch-wide toothed bucket.

Bureau of Reclamation LOG OF TEST PIT Hole No. TP-14-8
FEATURE: Park Moabi Regional Park, California PROJECT: Mojave Valley Conservation Area AREA DESIGNATION: GROUND ELEVATION: El. COORDINATES: Lat. 34º44’10.8”, Long. -114º31’29.9” STATION AND OFFSET: none APPROX. DIMENSIONS: 15.0 ft. long x 15 ft. wide, METHOD OF EXPLORATION: John Deer 250 G Excavator.
23 ft. deep. LOGGED BY: David Nielsen DEPTH TO WATER: perched at 3.5 to 6.5 ft., DATE(S) LOGGED: 6-25-2014 WATER LEVEL DATE: 6-25-2014
CLASSIFICATION GROUP SYMBOL
CLASSIFICATION AND DESCRIPTION OF MATERIAL (SEE USBR 5000, 5005)
% PLUS 3-INCH BY WEIGHT
3-5 inch
5–12 inch
Plus 12
inch (CL)
(laboratory classification)
3.5 ft.
0.0 to 3.5 ft. Lean Clay (CL): Laboratory classified as 5% sand; 95% fines; LL = 44.9%; PI = 25.0%; total moisture content = 45.8%.
IN-PLACE CONDITION: Grayish brown 2.5 Y 5/2; homogeneous; trace fine to medium, subangular to subrounded sand; thin bedding laminations; strong reaction with HCl; caving of sidewalls from surface to about 6.5 ft.
Slightly moist 0.0 to 0.5 ft, moist 0.5 to 3.5 ft.; soft to medium stiff. Sample collected at 2 ft.
0
0
0
(SC) (laboratory
classification)
6.5 ft.
3.5 to 6.5 ft. Sandy Clay (SC): Laboratory classified as 60% sand; 6% gravel; 34% fines; LL = 24.5%; PI = 10.4%; total moisture content = 21.5.
IN-PLACE CONDITION: Grayish brown 2.5 Y 5/2; homogeneous; about 10 % fine to medium, subangular to subrounded sand; about 10% fine subangular to subrounded gravel; thin bedding laminations; some roots present from surface to about 4 ft.; strong reaction with HCl.
Wet 3.5 to 5.0 ft., very moist 5.0 to 6.5 ft.; soft. Sample collected at 5 ft.
0
0
0
(CH)s (laboratory
classification)
23.0 ft.
6.5 to 23.0 ft. Fat Clay with Sand (CH)s: Laboratory classified as 25% sand; 75% fines; LL = 55.3%; PI = 39.3%; shrinkage ratio 1.9; total moisture content = 18.2%
IN-PLACE CONDITION: Brown 10 YR 4/3; homogeneous; thin bedding laminations (about 1 in. thick); clay is moderately fractured with some oxidizing; strong reaction with HCl.
Moist 6.5 to 23.0 ft.; stiff. Sample collected at 13 ft.
0
0
0
REMARKS: - Refer to attached figure. Approx. = approximate; ds = downstream; ft. = foot; lb(s) = pound; mm = millimeter; HCl = hydrochloric acid; tr = trace; El. = elevation; LL = liquid limit; PI = Plastic Index; FM = Field Moisture. - Excavated with a John Deer 250 G Excavator with a 42-inch-wide toothed bucket.

Bureau of Reclamation LOG OF TEST PIT Hole No. TP-14-10
FEATURE: Park Moabi Regional Park, California PROJECT: Mojave Valley Conservation Area AREA DESIGNATION: GROUND ELEVATION: El. COORDINATES: Lat. 34º44’06.0”, Long.-114º31’25.8” STATION AND OFFSET: none APPROX. DIMENSIONS: 12 ft. long x 15 ft. wide, METHOD OF EXPLORATION: John Deer 250 G Excavator.
15 ft. deep. LOGGED BY: David Nielsen DEPTH TO WATER: 8 ft., DATE: 6-26-2014 DATE(S) LOGGED: 6-26-2014
CLASSIFICATION GROUP SYMBOL
CLASSIFICATION AND DESCRIPTION OF MATERIAL (SEE USBR 5000, 5005)
% PLUS 3-INCH BY WEIGHT
3-5 inch
5–12 inch
Plus 12
inch (SM)
0.5 ft.
0.0 to 0.5 ft. Silty Sand (SM): IN-PLACE CONDITION: Light brown 7.5 YR 6/3; homogeneous; about 75% fine to medium, subangular to subrounded sand; about 20% non-plastic fines; about 5% fine subangular to rounded gravel; maximum particle size about 15 mm; no reaction with HCl; some roots present; caving of sidewalls from surface to bottom (15 ft.).
Dry; loose.
0
0
0
(SP) (laboratory
classification)
10.0 ft.
0.5 to 10.0 ft. Poorly Graded Sand (SP): Laboratory classified as 97% sand; 3% fines; non-plastic; total moisture content = 19.4%;
IN-PLACE CONDITION: Brown 7.5 YR 5/3 to 7 ft., grayish brown 10 YR 5/2 from 7 to 10 ft.; homogeneous; fine to medium, subangular to subrounded sand; thin bedding laminations present; no reaction with HCl.
Dry to slightly moist 0.5 to 6.5 ft., very moist 6.5 to 8 ft., wet at 8 ft.; loose to medium dense 0.5 to 10 ft. Sample collected at 4 ft.
0
0
0
(CL)
(laboratory classification)
15.0 ft.
10.0 to 15.0 ft. Lean Clay (CL): Laboratory classified as 2% sand; 98% fines; LL = 45.4%; PI = 26.7%; total moisture content = 33.3%.
IN-PLACE CONDITION: Dark gray 5 Y 4/1 with dark gray 2.5 Y 4/1 mottling; homogeneous; about 10% fine to medium, subangular to subrounded sand; strong reaction with HCl.
Moist; soft to medium stiff. Sample collected at 13 ft.
0
0
0
REMARKS: - Refer to attached figure. Approx. = approximate; ds = downstream; ft. = foot; lb(s) = pound; mm = millimeter; HCl = hydrochloric acid; tr = trace; El. = elevation; LL = liquid limit; PI = Plastic Index; FM = Field Moisture. - Excavated with a John Deer 250 G Excavator with a 42-inch-wide toothed bucket.

Bureau of Reclamation LOG OF TEST PIT Hole No. TP-14-12
FEATURE: Park Moabi Regional Park, California PROJECT: Mojave Valley Conservation Area AREA DESIGNATION: GROUND ELEVATION: El. COORDINATES: Lat. 34º44’00.2”, Long. -114º31’21.7” STATION AND OFFSET: none APPROX. DIMENSIONS: 17 ft. long x 15 ft. wide, METHOD OF EXPLORATION: John Deer 250 G Excavator.
17 ft. deep. LOGGED BY: David Nielsen DEPTH TO WATER: 6 ft., DATE: 6-25-2014 DATE(S) LOGGED: 6-25-2014
CLASSIFICATION GROUP SYMBOL
CLASSIFICATION AND DESCRIPTION OF MATERIAL (SEE USBR 5000, 5005)
% PLUS 3-INCH BY WEIGHT
3-5 inch
5–12 inch
Plus 12
inch (SP-SM)
(laboratory classification)
8.0 ft.
0.0 to 8.0 ft. Poorly Graded Sand with Silt (SP-SM): Laboratory classified as 89% sand; 11% fines; non-plastic; total moisture content = 8.6%.
IN-PLACE CONDITION: light brown 7.5 YR 6/3 to 1.5 ft., brown 7.5 YR 5/3 from 1.5 to 8 ft, grayish brown 10 YR 5/2 from 8 to 14 ft.; homogeneous; about 10% non-plastic fines; fine to medium, subangular to subrounded sand; thin bedding laminations present; no reaction with HCl; some roots present; caving of sidewalls from surface to bottom (17 ft.).
Dry 0.0 to 0.5 ft., dry to slightly moist 0.5 to 1.5 ft., moist with increasing moisture 1.5 to 5 ft., very moist 5 to 6 ft., and wet at 6 ft.; loose 0.0 1.5 ft., loose to medium dense 1.5 to 14 ft.
Sample collected at 5 ft.
0
0
0
(SP) (laboratory
classification)
14.0 ft.
8.0 to 14.0 ft. Poorly graded Sand (SP): Laboratory classified as 97% sand; 3% fines; non-plastic; total moisture content = 16.1%.
Sample collected at 10 ft.
0
0
0
(CL) (laboratory
classification)
17.0 ft.
14.0 to 17.0 ft. Lean Clay (CL): Laboratory classified as 3% sand; 97% fines; LL = 45.9%; PI = 28.1%; total moisture content = 31.3%.
IN-PLACE CONDITION: dark gray 10 YR 4/1 with olive and brown mottling; homogeneous; about 10% fine to medium, subangular to subrounded sand; strong reaction with HCl.
Moist; soft to medium stiff. Sample collected at 14 ft.
0
0
0
REMARKS: - Refer to attached figure. Approx. = approximate; ds = downstream; ft. = foot; lb(s) = pound; mm = millimeter; HCl = hydrochloric acid; tr = trace; El. = elevation; LL = liquid limit; PI = Plastic Index; FM = Field Moisture. Excavated with a John Deer 250 G Excavator with a 42-inch-wide toothed bucket.

Bureau of Reclamation LOG OF TEST PIT Hole No. TP-14-14
FEATURE: Park Moabi Regional Park, California PROJECT: Mojave Valley Conservation Area AREA DESIGNATION: GROUND ELEVATION: El. COORDINATES: Lat. 34º43’54.9”, Long. -114º31’18.3” STATION AND OFFSET: none APPROX. DIMENSIONS: 14 ft. long x 15 ft. wide, METHOD OF EXPLORATION: John Deer Excavator 250 G.
15 ft. deep. LOGGED BY: David Nielsen DEPTH TO WATER: 5 ft., DATE: 6-25-2014 DATE(S) LOGGED: 6-25-2014
CLASSIFICATION GROUP SYMBOL
CLASSIFICATION AND DESCRIPTION OF MATERIAL (SEE USBR 5000, 5005)
% PLUS 3-INCH BY WEIGHT
3-5 inch
5–12 inch
Plus 12
inch (SP)
(laboratory classification)
11.5 ft.
0.0 to 11.5 ft. Poorly Graded Sand (SP): Laboratory classified as 96% sand; 4% fines; non-plastic; total moisture content = 14.1%.
IN-PLACE CONDITION: Light brown 7.5 YR 6/3 to 2 ft., brown 7.5 YR 5/3 from 2 to 5 ft, grayish brown 10 YR 5/2 from 5 to 11.5 ft.; homogeneous; about 10% non-plastic fines; fine to medium, subangular to subrounded sand; thin bedding laminations present; no reaction with HCl; some roots present; caving of sidewalls from surface to bottom (15 ft.).
Dry 0.0 to 1.0 ft., dry to slightly moist 1.0 to 2.0 ft., moist with increasing moisture 2.0 to 4.0ft., very wet 4.0 to 5.0 ft., and wet at 5.0 ft.; loose 0.0 2.0 ft., loose to medium dense 2.0 to 5.0 ft.
Sample collected at 4 ft.
0
0
0
(CL)
(laboratory classification)
15.0 ft.
11.5 to 15.0 ft. Lean Clay (CL): Laboratory classified as 4% sand; 96% fines; LL = 39.3%; PI = 22.6%; total moisture content = 37.7%.
IN-PLACE CONDITION: Black 7.5 YR 2.5/1; homogeneous; about 10% fine to medium, subangular to subrounded sand; strong reaction with HCl.
Very moist; soft to medium stiff.
Sample collected at 14 ft.
0
0
0
REMARKS: - Refer to attached figure. Approx. = approximate; ds = downstream; ft. = foot; lb(s) = pound; mm = millimeter; HCl = hydrochloric acid; tr = trace; El. = elevation; LL = liquid limit; PI = Plastic Index; FM = Field Moisture. - Excavated with a John Deer 250 G Excavator with a 42-inch-wide toothed bucket.

Bureau of Reclamation LOG OF TEST PIT Hole No. TP-14-15
FEATURE: Park Moabi Regional Park, California PROJECT: Mojave Valley Conservation Area AREA DESIGNATION: GROUND ELEVATION: El. COORDINATES: N E STATION AND OFFSET: Sta. APPROX. DIMENSIONS: 16.0 ft. long x 16 ft. wide, METHOD OF EXPLORATION: John Deer Excavator.
14 ft. deep. LOGGED BY: David Nielsen DEPTH TO WATER: about 7.0 ft., DATE: 6-25-2014 DATE(S) LOGGED: 6-25-2014
CLASSIFICATION GROUP SYMBOL
CLASSIFICATION AND DESCRIPTION OF MATERIAL (SEE USBR 5000, 5005)
% PLUS 3-INCH BY WEIGHT
3-5 inch
5–12 inch
Plus 12
inch (SP)
(laboratory classification)
14.0 ft.
0.0 to 14.0 ft. Poorly Graded Sand, (SP): Laboratory classified as 96% sand; 4% fines; non-plastic; total moisture content = 20.5%.
IN-PLACE CONDITION: Light brown 7.5 YR 6/3, and brown 7.5 YR 5/3 from 2 to 10 ft., grayish brown 10 YR 5/2 from 10 ft. to bottom (14 ft.); homogeneous; fine to medium, subangular to subrounded sand; about 5% fine subangular to rounded gravel; thin bedding laminations and cross-bedding present; maximum particle size about 15 mm; no reaction with HCl; some roots present from surface to about 10 ft., maximum root diameter about 15 mm; caving of sidewalls from surface to bottom (14 ft.).
Dry 0.0 to 1.5 ft., dry to slightly moist 1.5 to 4.5 ft., moist 4.5 to 6.0 ft., very moist 6.0 to 7.0 ft., wet at 7 ft. Loose 0.0 to 4.5 ft, loose to medium dense 4.5 to 7.0 ft., loose from 7.0 ft. to the bottom (14 ft.).
Sample collected at 5 ft.
0
0
0
REMARKS: - Refer to attached figure. Approx. = approximate; ds = downstream; ft. = foot; lb(s) = pound; mm = millimeter; HCl = hydrochloric acid; tr = trace; El. = elevation; LL = liquid limit; PI = Plastic Index; FM = Field Moisture. - Excavated with a John Deer 250 G Excavator with a 42-inch-wide toothed bucket.


Geotec hRepo
Appendix B
Labora to rRyesu l

Page 1 C:\Users\arudolph\Downloads\Park Moabi 2014 LCRegion (2).xls
Bureau of Reclamation 302 E. 1860 S. Provo Area Office Materials Laboratory Provo, Utah 84606
(801) 379-1000 Summary of Gradation and Hydrometer Analysis
Project: Lower Colorado Region Feature: Park Moabi Description: test pits 2014
Gradation -- Particle Size Fraction in Percent Passing Hydrometer Analysis (min.) Sample Date Group 76.2 38.1 19.0 9.5 4.75 2.36 1.18 0.600 0.300 0.150 0.075 0.037 0.019 0.009 0.005 0.002 0.001
No. source Classification Sym. 3" 1 1/2" 3/4" 3/8" #4 #8 #16 #30 #50 #100 #200 1 4 19 60 435 1545
TP-14-01 @ 4' Poorly graded sand (SP) 100 99.9 89.3 5.2 0.3 TP-14-01 @ 14' Silty clay (CL-ML) 100 98.2 92.0 74.0 46.0 34.0 24.0 20.0 TP-14-02 @ 3' Poorly graded sand (SP) 100 99.9 99.6 98.0 69.5 7.5 1.0 TP-14-02 @ 7' Poorly graded sand (SP) 100 99.7 98.5 65.8 6.6 1.0 TP-14-05 @ 10' Poorly graded sand (SP) 100 99.9 98.7 74.7 14.2 3.0
5.73 lbs. TP-14-08 @ 2' Lean clay (CL) 100 99.8 99.6 97.2 95.2 91.8 79.8 63.9 55.9 39.9 35.9 TP-14-08 @ 5' Clayey sand (SC) 100 97.3 95.7 93.7 90.6 87.7 84.9 79.1 55.8 34.0 29.1 23.6 21.8 20.0 TP-14-08 @ 13' Fat clay with sand (CH)s 100 99.8 98.9 90.6 74.8 69.4 65.5 59.7 54.0 43.4 36.6 TP-14-10 @ 4' Poorly graded sand (SP) 100 99.9 99.7 95.4 37.0 3.4 13.71 lbs. TP-14-10 @ 13' Lean clay (CL) 100 98.0 95.4 90.0 72.0 58.0 41.7 33.8
TP-14-12 @ 5' Poorly graded sand with silt (SP-SM) 100 99.6 67.8 10.5 TP-14-12 @ 10' Poorly graded sand (SP) 100 99.6 25.5 2.7
6.96 lbs. TP-14-12 @ 14' Lean clay (CL) 100 97.4 95.0 93.0 81.0 67.0 53.0 45.0 TP-14-14 @ 4' Poorly graded sand (SP) 100 99.8 98.8 18.9 3.7
8.99 lbs. TP-14-14 @ 14' Lean clay (CL) 100 98.2 95.8 94.0 82.0 66.0 54.0 40.0 32.0 TP-14-15 @ 5' Poorly graded sand (SP) 100 99.9 99.8 97.3 36.5 4.4
NOTE: 1. ASTM D 698 REQUIRES APPROXIMATELY 35 LBS. OF MATERIAL FOR TEST. 2. HIGHLIGHTED SAMPLES WERE COMBINED BEING SIMILAR IN GRADATION TO ACQUIRE SUFFICIENT MATERIAL TO PERFORM ASTM D-698 TEST TO DETERMINE MAXIMUM DENSITY FOR THE FINE GRAINED SOILS 3. LEFT HAND COLUMN UNDER SAMPLES NO. ARE THE DRY WEIGHTS OF SAMPLES INITIALLY DELIVERED TO LAB FOR TESTING. THESE DRY WEIGHTS = 35.25 LBS. 4. PERMEABILITY AND SHEAR TESTS PERFORMED USING 90% OF MAXIMUM DENSITY

Page 2 C:\Users\arudolph\Downloads\Park Moabi 2014 LCRegion (2).xls
Bureau of Reclamation 302 E. 1860 S. Provo Area Office Materials Laboratory Provo, Utah 84606
(801) 379-1000 Summary of Physical Properties
Project: Lower Colorado Region Feature: Park Moabi Description: test pits 2014 Fines Sand Gravel Cobble Cobble Boulder Atterberg Limits Specific Gravity In-place Laboratory
Sample Group Less Than .005 to .075 mm #4 to 3 in. to 5 in. to plus shrinkage Fraction (+) #4 Dry Dens. Water Content Max. Dry
Dens. pcf
Opt
H20 No. Symbol .005 mm .075 mm to #4 3 in. 5 in. 12 in. 12 in. %LL %PI ratio (-) #4 (+) #4 % Abs. in pcf Tot. % (-) #4 %
TP-14-01 @ 4' (SP) 100 np 9.9 TP-14-01 @ 14' (CL-ML) 34 64 2 28.5 6.2 32.9 TP-14-02 @ 3' (SP) 1 99 np 0.0 106.9** TP-14-02 @ 7' (SP) 1 99 np 1.0 TP-14-05 @ 10' (SP) 1 99 np 2.4
5.73 lbs. TP-14-08 @ 2' (CL) 56 39 5 44.9 25.0 45.8 101.2* TP-14-08 @ 5' (SC) 20 14 60 6 24.5 10.4 21.5 TP-14-08 @ 13' (CH)s 54 21 25 55.3 39.3 1.9 18.2 TP-14-10 @ 4' (SP) 3 97 np 19.4 13.71 lbs. TP-14-10 @ 13' (CL) 58 40 2 45.4 26.7 33.3 *
TP-14-12 @ 5' (SP-SM) 11 89 np 8.6 TP-14-12 @ 10' (SP) 3 97 np 16.1
6.96 lbs. TP-14-12 @ 14' (CL) 67 30 3 45.9 28.1 31.3 * TP-14-14 @ 4' (SP) 4 96 np 14.1
8.99 lbs. TP-14-14 @ 14' (CL) 54 42 4 39.3 22.6 37.7 * TP-14-15 @ 5' (SP) 4 96 np 20.5 ** indicates max. den performed by ASTM D 7382 vibratory hammer * indicates max. den performed by ASTM D 698

RB&G ENGINEERING, INC.
RBG No. 201408-020 Report No. 1009148 Sheet 1of 1
BUREAU OF RECLAMATION
Provo,Utah
COEFFICIENT OF PERMEABILITY
Date Location Report By
11-24-14 Park Moabi Test Pits J. Boone
DATE
PERMEABILITY, k
MOISTURE
DENSITY NO. TESTED (em/sec) SAMPLE ID/LOCATION DESCRIPTION OF SOIL (%) (pet)
1 11-24-14 2.98x10⁻⁴ Test Pit#2@ 3' Sand 101.5 11.0
--- -- 2 11-24-14 3.27x10⁻⁴ Test Pit #1 @ 4' Sand 100.9 11.0
Sample placed in permeameter mold at density requested by Steve Corless. Sample saturated using backpressure techniques prior to performance of the test.
Principal (Testing) Bradford Price Lab Manager Jacob Boone Client Bureau of Reclamation/Provo Date Printed 12/3/2014
DISTRIBUTION
143S West 820 North Provo, Utah 84601 801-374-5771Provo 801-521-5771Salt Lake City AASHTO ACCREDITED LABORATORY

Project No.: 201408.020 Report No.: 1009151 100
Test No. or
Symbol
Sample
Size (inches)
Sample Data Degree of Saturation
(%)
Normal Stress a,(psi)
Maximum
Shear Stress r (psi)
Strain Rate
(inches/ minute)
Shear Strength Parameters
Dry Density
(pet)
Moisture Content
(%)
Friction Angle
Cohesion
(psi)
2.35 101.7 11.0 -100 22.0 11.6 0.0014
28.1
0 2.35 102.1 11.1 -100 43.7 23.9 0.0014
.... 2.35 101.8 11.3 I -100 65.2 34.7 0.0014
en
-- 10 I i
I I !--iA" 80
v v I /
.:.!.:. rti
(ij CD
I/ I I I I
1/P1
·u; .:!: 60 rti rJl
Ci5 ffi
40
/
/
1/ vl-" ./ I
/
I I I I I
Horizontal Displacement,
.t::
20
y v
LJFV I vv
0
0 20 40 60 80 100 120 140
Normal Stress, u,(psi)
160 180
(degrees)
• •
MATERIAL: SAND, SP (REMOLDED)
RB&G ENGINEERING, INC.
DIRECT SHEAR TEST Project: United States Bureau of Reclamation
Park Moabi Test Pits
HOLE NO.: TEST PIT #1 DEPTH: 4'

Project No.: 201408.020 Report No.: 1009150 100
/ v
./ /
./ /
v v
/ v
/ v
/ v
/
v V I
/ v
-
L_
Test No. or
Symbol
Sample
Size (inches)
Sample Data Degree of Saturation
(%)
Normal Stress
a,(psi)
Maximum
Shear Stress r (psi)
Strain Rate
(inches/ minute)
Shear Strength Parameters
Dry Density
(pet)
Moisture Content
(%)
Friction Angle
Cohesion
(psi)
2.35 102.2 11.2 -100 20.9 11.2 0.0014
29.3
0 2.35 101.8 11.1
-100 42.7 24.7 0.0014
.& 2.35 101.6 11.2 -100 65.1 36.0 0.0014
I
-- en
I /
,I
I I I /
i*'
"iii ...9..: "' 20
I / - --
I
"iii
60
en /. iii CD
.£:.
10 v ui "' en m Q) 40
.e.rn::
00' 4
8 12 16 20
Horizontal Displacement,&,(in. x 10·') 20
0 0 20 40 60
80 100 120 140
160
180
Normal Stress, u,(psi)
(degrees)
• •
RB&G ENGINEERING, INC.
DIRECT SHEAR TEST Project: United States Bureau of Reclamation
Park Moabi Test Pits
MATERIAL: SAND, SP (REMOLDED)
HOLE NO.: TEST PIT #2
DEPTH: 3'

RB&G ENGINEERING. INC.
Coefficient of Permeability
Project Bureau of Reclamation Project No. 201408.020
Location PDark Moabi Tested By J . Boone
Date 9/29/14
Description of Test Determine the coefficient of permeability, using the constant head method in general accordance with ASTM D5084.
Sample Dimensions: Diameter, D 7.15 em Area, A 40.15 cm2
Height, L 14.20 em
Dry Density
91.06
pcf
Moisture
21.1
%
(100% Saturation)
Test Data
Confining Pressure 10 psi
Head, h 351.74 em Time, t 14400 s
Discharge, Q 3.3 cm3
Temperature, T 22 oc
Coefficient of Permeability, kT 2.30E-07 cm/s kr=QU(Aht)
Lean clay samples combined from TP8, TP10, TP12, and TP14.
C:\Users\jboone\Desktop\Permeability 10.06.14 Page 1 of 1

Test No. or
Symbol
Sample
Size (inches)
Sample Data Degree of Saturation
(%)
Normal Stress cr, (psi)
Maximum
Shear Stress r (psi)
Strain Rate
(inches/ minute)
Shear Strength Parameters
Dry Density
(pet)
Moisture Content
(%)
Friction Angle
Cohesion
(psi)
2.38 I 91.1 21.0 -100 23.6 13.6 0.0006
22.7
4 2.38 92.0 21.1 -100 47.0 23.5 0.0006
• 2.38 91.6 21.1 -100 70.2 33.1 0.0006
40
v v
/
• •
I I I I l I I I I
100
I
Project No.: 201408.020 Report No.: 1009093
.3...: ,;
_,..... I y
I
.. I 80
v
"' 20 ii5
.CrD:
I /v I Jr+-r-- -- _/ _L,...-k-1"
I I .....
·c;; ..3..: 60
,; Ul
/
I ----
en 10w'L I
I ii5 iii vv
1 / v
v 00 7 14 21 28 35 20 v
vv I 0 20 40 60 80 100
Normal Stress, a,(psi)
120 140 160 180
NOTE: Because maximum density required 35 pounds of material, soil samples of the same classification (lean clay) from TP8, TP10, TP12, and TP14 were combined to have enough material to analyze the soil.
(degrees)
MATERIAL: LEAN CLAY, CL
RB&G ENGINEERING, INC. DIRECT SHEAR TEST Project: Bureau of Reclamation

DParkMoabi
HOLE NO.: -N--/-A- lean clay samples combined from
TP8, TP10, TP12, and TP14 DEPTH:-N--/-A--TP8 (2'), TP10 (13'), TP12
(14'), TP14 (14')

Park Moabi Backwater Channel 60% Draft Design Report
April 9, 2015
APPENDIX C
Landscape/ Land Types Document

Park Moabi Backwater Channel 60% Draft Design Report
April 9, 2015
This Page Intentionally Blank

Landcover Type Acreage Calculations (60% Design) Four landcover types will be created through implementation of the Moabi Conservation Area Restoration design: backwater, marsh, cottonwood-willow, and other riparian (honey mesquite & arrowweed) according to the classification used in the Lower Colorado River Multi-Species Conservation Plan (Figure 1). Otis Bay ecologists analyzed existing vegetation along the Park Moabi channel and Beal Slough using aerial imagery paired with LiDAR and a field visit to better understand the environmental characteristics (i.e., elevation, proximity to water) that are suitable for dominant plants at this site. Because honey mesquite and arrowweed occur in the same areas throughout Moabi Park, these landtypes were combined.
Backwater: According to hydraulic analyses, the backwater elevation will range annually from 451 to 458 ft. The high elevation of the backwater was delineated by the maximum stage during an average event which occurs at approximately 456.5 ft. The restored backwater will cover 26.4 acres.
Marsh: Bulrush, cattail, and common reed will grow along the banks of the channel of the restored backwater. The marsh should range in elevation from 452 to 456.5 ft, approximately 1 ft. below and 2 ft. above the sill elevation (453.5 ft). The marsh will cover 23.8 acres.
The combined total area of backwater and marsh is 50.2 acres.
Cottonwood/Willow: Goodding’s willow, coyote willow, and Fremont cottonwood distributions are determined by groundwater elevation. According to test pits excavated by the Bureau in September 2014, groundwater elevations ranged from 449 to 454 ft. throughout the project area. Following restoration, groundwater elevations are expected to rise to the sill elevation. Lite & Stromberg (2005) concluded that Goodding’s willow & Fremont cottonwood maintain dominance over tamarisk in areas with groundwater depths less than 8.5 ft. Based on these data and surveys of existing cottonwoods on the site, the cottonwood/willow landtype is delineated to occur from 456.5 to 464 ft. in elevation and covers 15.1 acres.
Other Riparian (honey mesquite & arrowweed): Honey mesquite and arrowweed occur in areas that are not inundated and do not occur in areas where mounds of sand create exciting ORV terrain. The “other riparian” landtype is delineated to occur from 464 to 480 ft. in elevation and covers 37.8 acres.
These guidelines were used to quantify the acreage of each land type. Other factors (e.g., competition, landuse) influence vegetation distribution which should be considered in the revegetation plan to be prepared by the Bureau of Reclamation.

Mojave Valley Conservation Area Backwater
Otis Ctl
TETRA TECHN
A
Figure 1. Landcover types resulting from 60% backwater restoration design.

Park Moabi Backwater Channel 60% Draft Design Report
April 9, 2015
APPENDIX D
30% Design Concept: Water Control Structure Alternatives Analysis

Park Moabi Backwater Channel 60% Draft Design Report
April 9, 2015
This Page Intentionally Blank
Page 1 February 4, 2015
TECHNICAL MEMORANDUM
Date: February 4, 2015
From: Tetra Tech, Inc. Otis Bay, Inc.
RE: Lower Colorado River; Park Moabi Backwater Channel Restoration Design Water Control Structure Alternatives Analysis (as included within the 30% Design Concept Report)
Water control structures are required at the roadway bridge crossings to regulate the fluctuation of water passing through the proposed backwater channel during moderate to high flows in the Colorado River. The HEC-RAS analysis (30% Design Report - Appendix A) confirmed that the optimal sill elevation of 453.5 feet that was recommended by the 2012 Conceptual Design Report. However, given the uncertainties with the limited hydrologic data, a structure with an adjustable sill would be advantageous. Many different alternatives are available for this purpose with varying levels of cost and flexibility for adaptive management. Three water control structures alternatives were considered: 1) a static concrete sill, 2) an overshot type gate, and 3) Stop-log structure. The cost and function of each alternative are evaluated and compared below.
The alternatives considered for a water control structure are as follows:
Alternative 1. Precast bridge with a fixed sill elevation
Alternative 2. Precast bridge with an overshot gate structure
Alternative 3. Precast bridge with a stop- log structure A summary of the observations made during the alternative design efforts are described in the following sections below:
Alternative 1
Alternative 1 consists of the above described concrete bridges. In each bridge, the concrete floor would serve as the water control sill and would be set at an excavation of 453.5 feet. This alternative requires no additional cost over the construction of the bridges and would require the least amount of maintenance.
Alternative 2
Alternative 2 consists of the concrete bridge structures (Alternative 1) combined with an overshot gate to act as the sill to control the water surface elevation in the backwater channel. An overshot gate is defined as a top down opening gate in which water passes over the top. There are many type of overshot gates including drawbridge style gates, pneumatic crest gates, and scissor style gates. For the purposes of this evaluation this alternative will consist of a drawbridge style gate. Two popular styles of this gate are the Weir Gate and Langemann Gate. These gates can be built with either automated or

Page 2 February 4, 2015
manual hoist assemblies. The mechanized assemblies allow for the raising or lowering of the sill elevation which can be used as an adaptive management tool to regulate the inflow and outflow of Colorado River water through the proposed backwater channel. The capital cost for an overshot gate, over and above the cost of the concrete bridge, is estimated at approximately $390,000 per installation site. Based on the design literature overshot gates require less maintenance than some other mechanized gate systems, however, for this particular application there is a concern with how the mechanized features would weather due to the high temperatures. High temperatures can cause loss of grease required to keep the parts operational thereby causing the equipment to seize.
Alternative 3
Alternative 3 consists of the concrete bridge structures (Alternative 1) combined with a stop-log structure that will act as the sill crest to regulate the water surface in the backwater channel. A stop-log structure consists of a frame and removable logs. The frame is typically made of concrete but can also be made of fabricated metal. The logs themselves can be a variety of designs and materials depending on their application. Materials options include aluminum, steel, wood or synthetic materials such as fiberglass reinforced plastics. Stop logs can either be custom fabricated or specified by a manufacturer. The capital costs for a stop-log style water control structure was estimated approximately $85,000 per installation site. The stop log structure has no mechanized parts and requires less operational and maintenance. In the case of a custom designed fabricated structure replacement stop logs can be easily and inexpensively fabricated onsite. The stop logs can be designed such that the sill elevation can be adjusted by adding or removing a level of stop logs for adaptive management of the backwater channel.
Recommended Alternative
The intent of the design is to provide a sill elevation with flexibility to adjust the inflow to the proposed backwater channel for adaptive management. The 30% design therefore includes a sill with an adjustable elevation that varies from between 452.5 and 454.5 feet. This elevation brackets the elevation (453.5) in the 2012 Conceptual Design by ± 1 foot. Because of the need for flexible adaptive management the static sill (Alternative 1) was not considered a viable option for the proposed backwater channel. The overshot gate (Alternative 2) met all of the criteria needed for the backwater channel, but has high capital coast and a concern of excessive maintenance due to the mechanized design. The stop-log structure (Alternative 3) meets the criteria for the backwater channel at a cost that is much less than the overshot gate. Alternative 3 is the recommended approach and will continue to be developed for the 60% design submittal.