lord howe island hybrid renewable energy project · lord howe island hybrid renewable energy...
TRANSCRIPT
Lord Howe Island Hybrid Renewable Energy Project
Lord Howe Island Board
Technical Feasibility Study
RT019500-0000-GN-RPT-0003 | Rev 2
23 December 2015
Technica l Feasib il i ty Study
Lord Howe Is land Board
Lord Howe Island Hybrid Renewable Energy Project Technical Feasibility Study
RT019500-0000-GN-RPT-0003 i
Lord Howe Island Hybrid Renewable Energy Project
Project no: RT019500 Document title: Technical Feasibility Study Document No.: RT019500-0000-GN-RPT-0003 Revision: Rev 2 Date: 23 December 2015 Client name: Lord Howe Island Board Project manager: David Pollington Author: David Pollington, Miquel Orpella and Jessica Sharples File name: C:\users\morpella\appdata\local\projectwise\jacobs_anz_rp\dms09686\RT019500-0000-
GN-RPT-0003.docx
Jacobs Group (Australia) Pty Limited ABN 37 001 024 095 100 Melville St, Hobart 7000 GPO Box 1725 Hobart TAS 7001 Australia T +61 3 6221 3711 F +61 3 6221 3766 www.jacobs.com
© Copyright 2015 Jacobs Group (Australia) Pty Limited. The concepts and information contained in this document are the property of Jacobs. Use or copying of this document in whole or in part without the written permission of Jacobs constitutes an infringement of copyright.
Limitation: This report has been prepared on behalf of, and for the exclusive use of Jacobs’ Client, and is subject to, and issued in accordance with, the
provisions of the contract between Jacobs and the Client. Jacobs accepts no liability or responsibility whatsoever for, or in respect of, any use of, or reliance
upon, this report by any third party.
Document history and status
Revision Date Description By Review Approved
A 17/03/2015 Draft for client comment
J. Sharples
M. Orpella
D. Pollington
D. Pollington D. Pollington
0 27/03/2015 Original Issue
J. Sharples
M. Orpella
D. Pollington
D. Pollington
R. Dudley D. Pollington
1 30/03/2015 Minor Amendments to the Exec Summary D. Pollington
J. Sharples D. Pollington D. Pollington
2 23/12/15 Updates to the document including analysis and results from 12 months of site data plus additional items requested by ARENA.
J. Sharples
M. Orpella
D. Pollington
D. Pollington D. Pollington

Lord Howe Island Hybrid Renewable Energy Project Technical Feasibility Study
RT019500-0000-GN-RPT-0003 ii
Acknowledgements
Jacobs would like to acknowledge the assistance provided by the Board in the preparation of this study, in particular Andrew Logan and Greg Higgins for their assistance with the provision of information and providing the site specific knowledge when it was required.
Jacobs would like to thank ABB for their assistance in understanding aspects of their earlier work on the HREP and their assistance with their DIgSILENT models of their battery system. Jacobs would also like to thank Vergnet for their assistance with a range of technical enquiries.

Lord Howe Island Hybrid Renewable Energy Project Technical Feasibility Study
RT019500-0000-GN-RPT-0003 iii
Contents Executive Summary .........................................................................................................................................7 1. Introduction ........................................................................................................................................12 2. Scope of this Study ............................................................................................................................15 3. Study Methodology ............................................................................................................................16 4. Previous Work ....................................................................................................................................18 4.1 Energy Supply Road-Map (2011) .........................................................................................................18 4.2 Technical Design Specifications (2013) ................................................................................................18 4.3 ABB Business Case (2013) ..................................................................................................................19 4.4 AECOM Business Case (2014) ............................................................................................................19 5. Existing LHI Electricity and Fuel Consumption ................................................................................20 5.1 Current Load Profile .............................................................................................................................20 5.1.1 Diurnal and Seasonal Load Profile .......................................................................................................21 5.1.2 Weekly Load Profile .............................................................................................................................23 5.1.3 Monthly Energy Production and Maximum Power .................................................................................24 5.1.4 System Load Variability ........................................................................................................................26 5.2 Future Load Profile – Loads and Generation ........................................................................................27 6. Project Approvals ..............................................................................................................................29 6.1 Solar Battery and Control System .........................................................................................................29 6.2 Wind ....................................................................................................................................................31 7. Preliminary Design .............................................................................................................................32 7.1 HREP RMU and Battery Transformer ...................................................................................................32 7.2 Battery System .....................................................................................................................................33 7.3 Road ....................................................................................................................................................33 7.4 Solar ....................................................................................................................................................34 7.5 Wind ....................................................................................................................................................36 8. Wind Resource ...................................................................................................................................37 8.1 Introduction ..........................................................................................................................................37 8.2 Wind Resource Analysis.......................................................................................................................37 8.2.1 Summary .............................................................................................................................................37 8.2.2 Site Monitoring Mast Measurement Equipment .....................................................................................39 8.2.3 Onsite Wind Measurements .................................................................................................................40 8.2.4 Reference Data Selection .....................................................................................................................44 8.2.5 Reference Data Wind Measurements ...................................................................................................45 8.2.6 Cross Correlation and Data Synthesis ..................................................................................................46 8.2.7 WAsP Wind Flow Modelling..................................................................................................................48 8.2.8 Site Air Density ....................................................................................................................................52 8.2.9 Wind Speed Variability .........................................................................................................................52 8.3 Wind Energy Yield Analysis ..................................................................................................................54 8.3.1 Summary .............................................................................................................................................54 8.3.2 Turbine Data ........................................................................................................................................55
Lord Howe Island Hybrid Renewable Energy Project Technical Feasibility Study
RT019500-0000-GN-RPT-0003 iv
8.3.3 Gross and Net-of-Wake-Losses AEP Calculations ................................................................................59 8.3.4 Net AEP Calculations ...........................................................................................................................59 8.3.5 Uncertainty Analysis .............................................................................................................................60 8.3.6 Wind Energy Curtailment......................................................................................................................62 9. Solar Resource ...................................................................................................................................64 9.1 Introduction ..........................................................................................................................................64 9.2 Solar Resource Analysis ......................................................................................................................64 9.2.1 Site Solar Measurement Equipment .....................................................................................................64 9.2.2 Onsite Solar Measurements .................................................................................................................65 9.2.3 Reference Solar Measurements ...........................................................................................................69 9.2.4 Cross Correlation and Data Synthesis ..................................................................................................71 9.3 Solar Energy Yield Analysis..................................................................................................................73 9.3.1 Solar PV System Configuration ............................................................................................................73 9.3.2 Estimated Energy Yield ........................................................................................................................76 9.3.3 Uncertainty Analysis .............................................................................................................................79 9.3.4 Solar Generation Variability ..................................................................................................................79 10. HREP System Modelling ....................................................................................................................82 10.1 Introduction ..........................................................................................................................................82 10.2 Modelling Specifics ..............................................................................................................................82 10.2.1 Control Strategy ...................................................................................................................................82 10.2.2 Load Data ............................................................................................................................................84 10.2.3 Wind ....................................................................................................................................................84 10.2.4 Solar ....................................................................................................................................................84 10.2.5 Ambient Temperature...........................................................................................................................84 10.2.6 275kW Vergnet WTG ...........................................................................................................................84 10.2.7 400kW/400kWh Battery ........................................................................................................................85 10.2.8 450kWpAC and 550kWpAC LHIB Solar PV ...............................................................................................85 10.2.9 Current 83kWpAC and Future 120kWpAC Private Solar PV ......................................................................85 10.2.10 300kW Detroit Series 60 14l Diesel Genset ..........................................................................................86 10.2.11 One Minute Data Comparison with 10 Minute Data...............................................................................88 10.3 Comparison with the Business Case ....................................................................................................89 10.3.1 Wind Annual Generation ......................................................................................................................92 10.3.2 LHIB Solar PV Annual Generation ........................................................................................................92 10.3.3 Private Solar PV Annual Generation .....................................................................................................92 10.3.4 Diesel Fuel Consumption .....................................................................................................................92 10.3.5 Renewable Penetration ........................................................................................................................92 10.3.6 WTG Curtailment due to Birds and Noise .............................................................................................93 10.4 Fuel Consumption ................................................................................................................................94 10.5 Diesel Genset Run Hours .....................................................................................................................95 10.6 Diesel Genset Daily Operation .............................................................................................................95 10.7 Optimisation of the HREP .....................................................................................................................96
Lord Howe Island Hybrid Renewable Energy Project Technical Feasibility Study
RT019500-0000-GN-RPT-0003 v
10.7.1 Economic Optimisation Parameters ......................................................................................................97 10.7.2 Sensitivity Variables .............................................................................................................................98 10.7.3 Results of Optimisation and Sensitivity Analysis ...................................................................................98 10.7.4 Conclusions ....................................................................................................................................... 100 11. Potential Contractors/Equipment Suppliers ................................................................................... 101 11.1 Wind Turbines .................................................................................................................................... 101 11.2 Batteries ............................................................................................................................................ 102 11.3 Solar Panels....................................................................................................................................... 102 11.4 Control System .................................................................................................................................. 103 12. CAPEX and OPEX ............................................................................................................................ 104 12.1 Capital Cost Estimate Review ............................................................................................................ 104 12.2 Operational Cost Estimate Review ..................................................................................................... 105 13. Schedule ........................................................................................................................................... 107 14. Power System Studies ..................................................................................................................... 108 14.1 Steady State Studies .......................................................................................................................... 108 14.2 Dynamic Studies ................................................................................................................................ 109 15. Protection Study .............................................................................................................................. 112 16. Communications Study ................................................................................................................... 113 16.1 Demand Management and Customer Metering................................................................................... 113 16.2 HREP Control Concepts ..................................................................................................................... 114 16.2.1 LHIB Powerhouse Distributed Controller Requirements ...................................................................... 116 16.2.2 LHIB Powerhouse Communication Network Requirements ................................................................. 116 16.2.3 LHIB Powerhouse SCADA Server and Client Requirements ............................................................... 117 17. Geotechnical Investigations ............................................................................................................ 118 17.1 Basis of Recommendations ................................................................................................................ 118 17.2 Earthworks ......................................................................................................................................... 118 17.2.1 Excavation Conditions ........................................................................................................................ 118 17.2.2 Access Road ...................................................................................................................................... 118 17.2.3 Wind Turbines .................................................................................................................................... 119 17.2.4 Solar Panel Arrays ............................................................................................................................. 119 17.3 Further Assessment ........................................................................................................................... 120 18. Noise ................................................................................................................................................. 121 18.1 Wind Farm noise guidelines ............................................................................................................... 121 18.2 Background Noise Measurement and WTG Noise modelling .............................................................. 122 18.3 Wind Farm Findings ........................................................................................................................... 122 18.4 Solar Inverter Findings ....................................................................................................................... 123 19. Recommendations ........................................................................................................................... 124 20. Conclusions ..................................................................................................................................... 128 21. Bibliography ..................................................................................................................................... 129

Lord Howe Island Hybrid Renewable Energy Project Technical Feasibility Study
RT019500-0000-GN-RPT-0003 vi
Appendix A. Drawings Appendix B. Project Schedule Appendix C. Glossary Appendix D. Revision 2 Scope of Work Appendix E. Homer Optimisation Results

Lord Howe Island Hybrid Renewable Energy Project Technical Feasibility Study
RT019500-0000-GN-RPT-0003 7
Executive Summary The Lord Howe Island Board (the Board) has engaged Jacobs as the Owner’s Engineer (OE) for the implementation of its Hybrid Renewable Energy Project (HREP) on the Island. The projects aims are to:
Reduce diesel consumption, which will help reduce future electricity tariff increases caused by fuel cost increases.
Reduce the cost of generation which will reduce the recurrent funding requirements from the NSW government.
The Board has obtained Australian Renewable Energy Agency (ARENA) and NSW Treasury funding to cover the project capital expenditure (CAPEX). The Board considered two options for the HREP. Option 11 encompasses installing wind turbines and solar PV while Option 22 involves installing only solar PV. Both options include the installation of a battery and control system. Option 1 provides the greatest diesel reduction and is preferred as it maximises the benefits of the project.
The location proposed for the installation of the wind turbines and solar PV is on the northern half of the island, north of the airport. The site, on a cleared section of Transit Hill, is elevated with north facing slopes which provides favourable characteristics for solar and wind. The site is also in close proximity to the island’s powerhouse.
Jacobs has undertaken this Technical Feasibility Study on behalf of the Board to review the technical feasibility of the two options before proceeding to the tender phase of the project. The study examines the optimal configuration, and sizing of the WTG’s, Solar PV and Battery based on potential variations in the capital cost and generation outputs of the WTG’s and Solar PV. The study does not consider alternative sources of generation such as options for wave power, etc as these have been previously examined by the Board and discounted (Powercorp, 2011).
To determine whether the options were technically feasible, Jacobs followed a systematic process:
1 Option 1 = 2 x Vergnet WTG’s, 450kW of Solar PV and 400kW/400kWhr of battery 2 Option 2 = 550kW of Solar PV and 400kW/400kWhr of battery
Review previous work Gather and analyse site data
Assess the current physical and electrical
design
Review potential equipment suppliers
Calculate wind and solar energy yields
Prepare preliminary designs
Model the power system and determine
diesel savings
Compare the results to the original
Business Case
Lord Howe Island Hybrid Renewable Energy Project Technical Feasibility Study
RT019500-0000-GN-RPT-0003 8
Review of previous work
Previous work was performed by Powercorp, ABB and AECOM. The outcome of the work was the development of the two options that are being considered in this body of work.
Gather and analyse site data
The forecast electrical demand is an important aspect of the technical feasibility. The historic electrical demand shows that over the last 10 years, the load has been reducing. Advice from the Board confirmed no planned new load growth is expected and the current demand is expected to remain static for the next 5 years. After this period, depending on the success of the HREP, the Board may look to increase the load by removing the ban on certain loads and introducing electric cars. The results of the analysis found there was little seasonal difference in the load with slightly higher demand in summer due to the larger number of tourists. There is no significant difference in the load profile for the days of the week and there was a strong diurnal pattern with peak loads in the early evening.
Review of potential equipment suppliers
A brief review was undertaken of potential suppliers to assess whether there were likely to be any issues with the supply of plant and equipment. It was clear that the project has attracted a lot of market interest and there is a strong desire from suppliers and engineering organisations to be involved. As a consequence, obtaining suitable plant and equipment and conducting competitive tender processes is not expected to be an issue.
Calculation of wind and solar energy yields
The wind and solar resource assessments were completed using data recorded at the site for a full year and correlated against long term data sets.
The wind data was correlated with long term data from the nearby Lord Howe Island Aerodrome met station. The results of the analysis indicate that the site has a good wind resource with average wind speeds at the proposed hub height in the order of 7.7m/s. This represents in the order of 140kW of generation on average or half the average load on the island.
The solar data was correlated with long term data from SolarGIS, which is based on satellite information and weather models, to obtain a long term solar dataset for the site monitoring mast location. The correlation between the site data and the SolarGIS data was strong.
Prepare preliminary designs
The previous work carried out by the Board and ABB identified the major components of the system and the general areas in which these would likely be installed. This has been taken a step further with this Technical Feasibility Study and a feasible preliminary design for the physical and electrical arrangements has been determined. The preliminary design was developed with the input of the Board and the practicalities of the arrangements assessed during the site visits. It is expected that some elements of the design may change to suit the specifics of the successful tenderer’s equipment.
The previous work by the Board and ABB used the Vergnet 275kW 32m rotor as a WTG that was potentially suitable for the site. Jacobs calculated the wind shear and turbulence for the site and found them to be high and as a result, mechanical loads on the turbine could be elevated. Jacobs provided the site data to Vergnet for review and comment and, Vergnet advised that their 200kW 30m rotor WTG would be more suitable for the site. Vergnet did flag the possibility to increase the power output to 225kW or 250kW once the WTG’s were installed on site. These changes to increase power output are relatively simple as they only require changes to the control software in the WTG.
Lord Howe Island Hybrid Renewable Energy Project Technical Feasibility Study
RT019500-0000-GN-RPT-0003 9
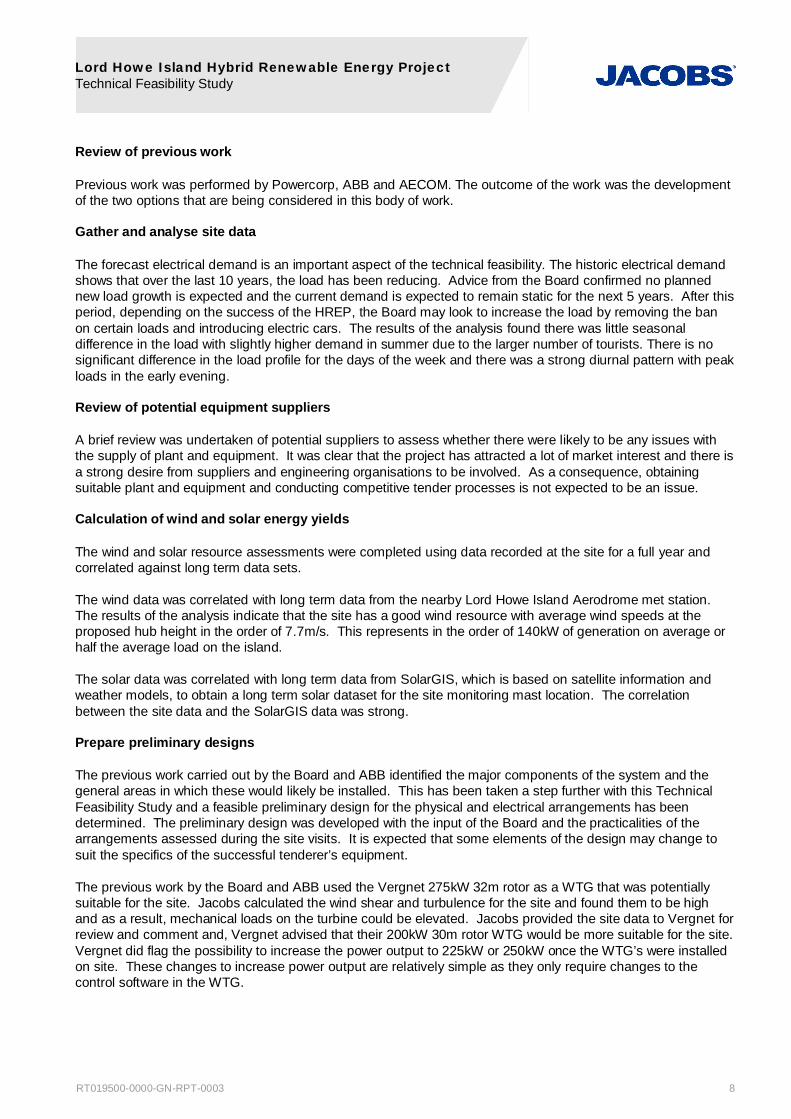
Model the power system and determine diesel savings
The two options were modelled using the Homer software with inputs from the specific wind and solar investigations. A generic Solar PV panel and Li-Ion battery3 were selected for use in the model along with the Vergnet WTG(s) and diesel gensets with performance parameters matching the existing LHI units. Inputs into the model included annual time series datasets of load data, wind speed, solar irradiance and ambient temperature.
The key results of the system modelling of the two proposed HREP systems are provided in the table below, along with the results from the Business Case for comparison.
HREP System Modelling Key Results
Scenario AECOM
Business Case
Jacobs
Technical Feasibility
Percentage Difference from Business Case
(%)
Option 1*
Diesel Fuel Consumption (litres) 173,937 180,375 4
Reduction in Fuel Consumption (%) 70.0 66.7 -5
Renewable Penetration (%) 84.0 67.1 -20
Option 2
Diesel Fuel Consumption (litres) 369,549 349,307 -5
Reduction in Fuel Consumption (%) 30.0 35.5 18
Renewable Penetration (%) 50.0 35.3 -29
* The AECOM Business Case Option 1 results are based on 550kW of wind capacity whereas the Jacobs Option 1 results are based on 400kW of wind
capacity. Jacobs has modelled the original Option 1 case using 275kW WTG’s for comparison. The results of this modelling are included in section 8.
Compare the results to the original Business Case
It can be seen from the table above that Option 1 in this study predicts a lower reduction in fuel consumption than the Business Case and also a lower Renewable Penetration percentage. However this is to be expected as Jacobs has considered installation of 400kW of wind capacity as opposed to AECOM’s 550kWThe difference between the Business Case and Option 2 is likely to be the choice of Solar PV panel and the expected losses. Jacobs has selected a high efficiency panel to minimise the physical foot print of the system.
It is clear from the above that Option 1 offers a significantly larger reduction in fuel consumption than Option 2 highlighting the benefits of installing WTGs. This does not mean that solar PV shouldn’t be installed as the diversity of generation sources makes it possible to install high penetration systems. The work carried out to optimise the system indicated that a modified Option 1 system was the optimal economic solution, which was:
1 x 200kW WTG
450kW Solar PV and an
800kWh of battery.
The optimisation will need to be repeated at tender stage by the EPC contract tenderers for the Solar Battery and Control system package when project costing can be locked in.
A review of costings including the provision of updated budget costing information showed that the BC allocations may not be sufficient; however, until the tender process is completed, and firm costings are obtained 3 The BC did not define a solar panel or battery type.
Lord Howe Island Hybrid Renewable Energy Project Technical Feasibility Study
RT019500-0000-GN-RPT-0003 10
this will not be certain. The practical completion date of the 30 September 2017 (system is fully operational) is achievable in the allocated time with the current project schedule indicating completion in late August 2017.
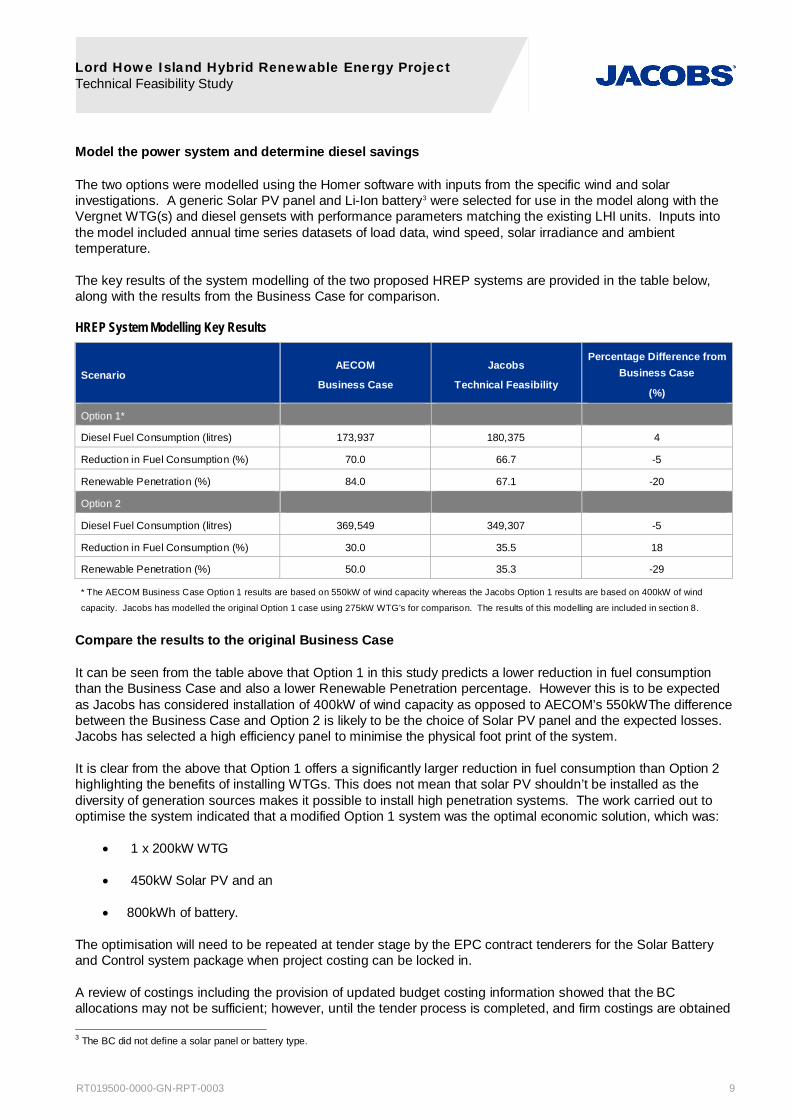
Recommendations
A number of recommendations have been raised throughout this study. A summary of the recommendations resulting from this study are provided below:
Number Recommendation Responsible Party Date for Completion
1
It is recommended in the future that some optimisation studies are carried out as part of the tender process to balance CAPEX, OPEX, Sustaining CAPEX and potential site constraints that may arise as part of the approvals process.
Jacobs and Tenderers
Tender stages
2 It is recommended that further detailed optimisation analysis is carried out at tender stage and that this analysis includes consideration of the entire life cycle, including disposal.
Jacobs and LHIB Tender stages
3 A requirement of the control system tender should include optionality for predictive control strategies which enable the opportunity to run the HREP system more efficiently.
Control System Tenderer
Tender stages
4
The value of reduced diesel consumption beyond its basic cost per litre needs to be determined so that a choice between options that have a lower COE and options that have a lower total fuel consumption can be made.
Jacobs and LHIB Tender stages

Lord Howe Island Hybrid Renewable Energy Project Technical Feasibility Study
RT019500-0000-GN-RPT-0003 11
Important note about your report
The sole purpose of this report and the associated services performed by Jacobs is to assess the feasibility of the proposed Hybrid Renewable Energy scheme on Lord Howe Island in accordance with the scope of services set out in the contract between Jacobs and the Lord Howe Island Board (the Board). That scope of services, as described in this report, was developed with the Board.
In preparing this report, Jacobs has relied upon, and presumed accurate, any information (or confirmation of the absence thereof) provided by the Board and/or from other sources. Except as otherwise stated in the report, Jacobs has not attempted to verify the accuracy or completeness of any such information. If the information is subsequently determined to be false, inaccurate or incomplete then it is possible that our observations and conclusions as expressed in this report may change.
Jacobs derived the data in this report from information sourced from the Board (if any) and/or available in the public domain at the time or times outlined in this report. The passage of time, manifestation of latent conditions or impacts of future events may require further examination of the project and subsequent data analysis, and re-evaluation of the data, findings, observations and conclusions expressed in this report. Jacobs has prepared this report in accordance with the usual care and thoroughness of the consulting profession, for the sole purpose described above and by reference to applicable standards, guidelines, procedures and practices at the date of issue of this report. For the reasons outlined above, however, no other warranty or guarantee, whether expressed or implied, is made as to the data, observations and findings expressed in this report, to the extent permitted by law.
This report should be read in full and no excerpts are to be taken as representative of the findings. No responsibility is accepted by Jacobs for use of any part of this report in any other context.
This study was conducted on Board supplied information along with data from potential suppliers of equipment. Aspects of the study were impacted by the length of onsite wind and solar data available for analysis. As a result those parts of the study using this data will need to be revisited at a later date when a longer dataset is available to verify the initial findings.
This report has been prepared on behalf of, and for the exclusive use of, the Board, and is subject to, and issued in accordance with, the provisions of the contract between Jacobs and the Board. Jacobs accepts no liability or responsibility whatsoever for, or in respect of, any use of, or reliance upon, this report by any third party.

Lord Howe Island Hybrid Renewable Energy Project Technical Feasibility Study
RT019500-0000-GN-RPT-0003 12
1. Introduction This Technical Feasibility Study has been prepared at the request of the Lord Howe Island Board (the Board) to assess the technical feasibility of the proposed Hybrid Renewable Energy Project (HREP). This revision of the study has been undertaken to address the recommendations from the March 2015 report, which was to update the results using a longer period of site data which has now been recorded, and to address additional items requested by the Australian Renewable Energy Agency (ARENA).
There are two options for the HREP which are currently under consideration, the details of which are shown in Table 1-1 below, along with the Business as usual case which represents the current scenario installed at LHI. The preferred option is Option 1 although it is possible that the final installation sizing may vary as a result of ongoing work.
Table 1-1 : LHI HREP Options
Scenario
Wind LHIB Solar Private Solar Battery System Diesel Genset
Number of WTGs
Total Capacity
(kW)
Total Capacity
(kWpAC)
Total Capacity
(kWpAC)
Total Capacity
(kW/kWh)
Total Capacity
(kW)
Business as usual 0 0 0 120 0/0 900
Option 1 2 4004 450 120 400/400 900
Option 2 0 0 550 120 400/400 900
Figure 1-1 below shows the location of the proposed development area in the context of the northern region of Lord Howe Island (Land and Property Information, 2011).
Figure 1-1 : LHI HREP Development Area
4 The Business Case proposal was for 2 x 275kW Vergnet turbines has had to be revised as these have been determined by the supplier as
unsuitable for the site and have been replaced with Vergnet 200kW turbines. This is discussed in great detail in section 8.2.3.3.
Development area

Lord Howe Island Hybrid Renewable Energy Project Technical Feasibility Study
RT019500-0000-GN-RPT-0003 13
Figure 1-2 shows the proposed LHI wind site layout and its surroundings. Table 1-2 provides additional data including the site monitoring mast and turbine coordinates. The turbine locations in this study are different to those used in earlier work carried out by ABB and AECOM due to physical layout constraints at the site.
Figure 1-2 : Lord Howe Island Wind Turbine Layout and Environs
Table 1-2 : Site Coordinates5, Elevation, and Height
Item Easting
(m)
Northing
(m)
Elevation
(mASL)
Height
(mAGL)
Site monitoring mast 507253 6511612 80.1 47.7
Turbine T01 507064 6511667 57.3
55.0 T02 507157 6511661 68.3
The LHI proposed wind farm site is located on the northern half of the island, north of the airport. The site, on a cleared section of Transit Hill, is elevated compared to the surrounding area and slopes downhill from the site monitoring mast location towards the west-northwest. There are mountains located towards the south of the island including Mount Gower, the highest point on the island.
The wind turbine site is within a clearing of woodland and the trees which immediately surround the site are approximately 10 to 12m in height. The WTGs are located on a spur so the base of the trees are below the base of the WTGs by approximately 5m.
Initially three possible areas for solar development in the vicinity of the powerhouse were proposed by the Board, however Airservices Australia (ASA) advised that the location of Solar Area B was problematic and hence it has been removed from the investigation. The remaining Solar Area A and Solar Area C are displayed
5 Coordinate system GDA 1994 MGA Zone 57.
T01
T02
Site monitoring mast
Powerhouse

Lord Howe Island Hybrid Renewable Energy Project Technical Feasibility Study
RT019500-0000-GN-RPT-0003 14
in Figure 1.3. Generally speaking, these areas are ideal for solar generation as they are located on a north facing hill.
Figure 1-3 : LHIB Solar Development Areas
Solar Area A is approximately 5519m2 in area. This area is constrained by the ASA earth grid and underground radio antenna site, the new access road to the WTGs, the woodland to the south and also the steepness of the northeast area.
Solar Area C is approximately 2921m2 in area. This area is constrained by the northern bush land, the new access road to the WTGs and also the footprint of the wind turbines when these are lowered down.
The battery and control equipment are planned to be located adjacent to and within the power house respectively.
Solar Area A
Powerhouse
Solar Area C

Lord Howe Island Hybrid Renewable Energy Project Technical Feasibility Study
RT019500-0000-GN-RPT-0003 15
2. Scope of this Study Jacobs’ scope of work on the Lord Howe Island HREP consists of three progressive phases. Phase 1, a Technical Feasibility Study, assesses the feasibility of Options 1 and 2 as proposed in the 2014 LHI HREP Business Case (BC) prepared by AECOM (AECOM, 2014). Phase 2 assesses procurement strategies and includes further studies necessary to implement the project and Phase 3 involves management of the construction project. This study is intended to satisfy the requirements of Phase 1.
The scope of the Technical Feasibility Study was to review the system arrangement proposed in the pre-feasibility study (conducted by others) in order to determine whether it provided a stable network. It is understood that the proposed arrangement was selected following an assessment of a wide range of renewable energy generation, energy storage and power system control technologies, by Powercorp (and later ABB), and documented in the Lord Howe Island Renewable Operations – Energy Supply Road Map (Aug 2011) (Powercorp, 2011).
Consequently, the scope of the Technical Feasibility Study was to consider only one proposed network structure. Accordingly, it is not an options study and does not assess alternative power generation options or alternative network options. The key elements of the proposed HREP consist of the following equipment to be owned by the Board:
450kWpAC of fixed solar PV
400kW/400kWh battery installation
2 x 275kW Vergnet wind turbines
Demand control system and associated communications network proposed by ABB
Up to 120kWpAC of private roof top solar (to be owned by others)
In carrying out the study, potential areas for improvements in the proposed system were identified and recorded where it was felt that a better outcome could be achieved.
This study provides a summary of a set of studies that were prepared to address specific aspects of Phase 1. These supporting studies are:
Steady State and Dynamic Study – undertaken using DIgSILENT
Protection Study
Communications Study – including details of a proposed small scale trial
In carrying out this study, preliminary design activities were undertaken which are captured in a series of electrical and physical drawings attached in Appendix A along with text in Section 7 on Preliminary Design.
This Technical Feasibility Study also includes a revised high level capital cost budget estimate and schedule estimate which is based on vendor supplied information and recent Jacobs experience.
During the course of the study, a site geotechnical investigation was carried out. A summary of the geotechnical investigation findings is included in this Technical Feasibility Study.
The study is purely a technical study so does not include an assessment of the project’s economics, risk assessment or discussion on procurement methodologies.
Revision 2 of this Report
The scope of revision 2 is to update this report to address a number of the recommendations made in revision 1 now that a full 12 months of data is available for review, and to plus address a number of comments made by ARENA. Refer Appendix D.
Lord Howe Island Hybrid Renewable Energy Project Technical Feasibility Study
RT019500-0000-GN-RPT-0003 16
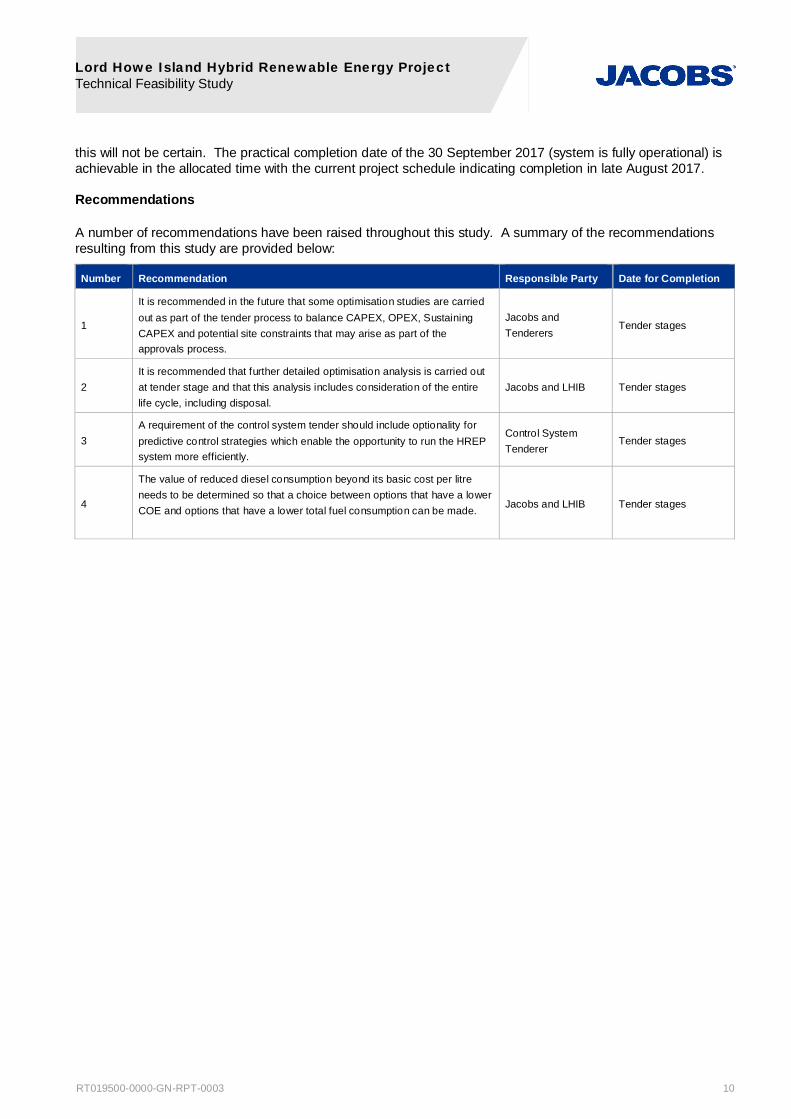
3. Study Methodology To determine whether the options were technically feasible, Jacobs followed a systematic process as shown in Figure 3-1 below.
Figure 3-1 : Technical Feasibility Review Process
The specific tasks that Jacobs undertook in this review process are listed below:
Review of initial documentation supplied by the Board
Requests for Information (RFIs)
- RFIs on the existing electrical system structure from the Board which is used to:
Build a DIgSILENT model of the existing LHI electricity network
Understand the nature of the grid for the Communication Study Work
Determine appropriate connection arrangements for the HREP elements
- RFIs for data on the existing system performance
- RFIs for detailed performance specifications on the diesel gensets and transformers etc.
- RFIs for data from ABB6 (battery and solar) and Vergnet (WTG) for specific technical details of equipment that has been proposed for the HREP
Physical layout considerations to assess practicalities of proposal
- WTG location to assess if it can be installed and operated
- Area for LHIB Solar PV
- Location and space requirements for the Battery System
6 Whilst ABB has not been selected to supply this equipment their past history with this project and stated intention to bid in the future has meant they
were both well informed on the project requirements and willing to provide the DIgSILENT model information. The same information could potentially have been obtained from other suppliers but would likely have been a much slower process whilst they came up to speed with the project.
Review previous work Gather and analyse site data
Assess the current physical and electrical
design
Review potential equipment suppliers
Calculate wind and solar energy yields
Prepare preliminary designs
Model the power system and determine
diesel savings
Compare the results to the original
Business Case
Lord Howe Island Hybrid Renewable Energy Project Technical Feasibility Study
RT019500-0000-GN-RPT-0003 17
- Preliminary Road design to assess accessibility issues
Preliminary Design of Electrical arrangements
- Preparation of a Single Line Diagram (SLD)
- Preparation of Protection SLD
System, Communications and Protection Studies
- Complete Steady State System Studies and Communication Studies
- Build the Dynamic DIgSILENT Models for the major components
- Carry out Dynamic Model Simulations
- Complete Protection and System Studies
Geotechnical Investigations
- Undertake Site inspections
- Selected soil samples tested and reporting completed
Wind and Solar Site Data
- Review of site monitoring mast arrangement and site wind and solar site data as it was supplied fortnightly
- Correlate the site data (approximately 12 month’s) with long term data sources for wind and solar
- Build WAsP terrain model for wind turbine modelling
- Carry out wind annual energy production assessment for the Vergnet WTGs
- Carry out solar annual energy production assessment for proposed LHIB Solar PV and installed Private Solar PV
- Verify Private Solar PV calculations against actual site data from private installations
HREP Integrated System Review
- Build Homer Model of the existing LHI network and Option 1 and Option 2 scenarios
- Verify the model against existing data on diesel fuel consumption and solar PV production
- Confirm the model against the results obtained from the detailed wind and solar analysis
- Undertake review of HREP Option 1 and 2 to assess % Renewable Penetration and potential fuel Savings
- Run some Homer simulations to test the size selection of the components in Option 1 and 2.
Review of potential suppliers, project costs and project program
Recommendations and Conclusions

Lord Howe Island Hybrid Renewable Energy Project Technical Feasibility Study
RT019500-0000-GN-RPT-0003 18
4. Previous Work To understand the basis of the HREP proposal, the review of previous work performed focused on four documents in terms of understanding the basis of the current HREP proposal:
Lord Howe Island Renewable Operations, Energy Supply Road-Map by Powercorp (Powercorp, 2011)
Lord Howe Island Energy Roadmap Implementation, Technical Design Specifications by ABB (ABB, 2013)
LHI Consult – Business Cases – Plan B by ABB (ABB, 2012)
Lord Howe Island, Renewable Energy Project, Business Case by AECOM (AECOM, 2014)
The following sections provide a brief summary of the documents listed above.
4.1 Energy Supply Road-Map (2011)
The Road-Map report prepared in 2011 provides an overview of the different renewable technologies available on the market at the time which may be suitable for installation at LHI along with the various energy management technologies which could be used.
Powercorp (now ABB) has modelled a number of different hybrid renewable options using the Homer software and ranked these according to generation costs. The inputs for the Homer model included:
1) LHI demand data from 2010
2) Wind data from 2000
3) Fuel consumption from 2010
4) Existing powerhouse specifications
The resulting conclusion from the Homer modelling was that two Vergnet wind turbines in conjunction with 200kW of community based solar PV and 200kW of Private Solar PV would be able to produce close to 70% Renewable Penetration.
No site specific solar data had been used as an input to the Homer model for the Road-Map.
Based on the most favourable option, Powercorp went on to outline the cost per kWh of generation of the scheme over future years.
4.2 Technical Design Specifications (2013)
The Technical Design Specifications document prepared by ABB in 2013 (Powercorp team was purchased by ABB) aimed to provide “technical equipment specifications and system design considerations that should be evaluated”.
The specification sets out the requirements of the following:
1) Detailed System Design
2) Solar Power Plant
3) Wind Power Plant
4) Communications System
5) Demand Response System
6) Control Integration System
7) Tariff Structure & Metering System
8) Service and Maintenance Obligations

Lord Howe Island Hybrid Renewable Energy Project Technical Feasibility Study
RT019500-0000-GN-RPT-0003 19
4.3 ABB Business Case (2013)
Following on from the Technical Design Specifications document, ABB prepared a Business Case report for the project in 2013. The Business Case report focussed on “Plan B” which refers to modifications from the original proposed system recommendation, particularly focusing on the possible constraints that could affect the operation of the wind turbines.
ABB reported that no new site data had been used in the preparation of their Business Case report, however the document goes on to mention the data that has been modified for their analysis.
ABB recalculated the Base Case as specified in the Road-Map and the other Plan B scenarios based on the updated cost information. The results of these calculations were provided and the conclusions of the document state that the each of the cases considered in the analysis were legitimate Plan B options for the system. The ultimate choice in determining the option to implement was dependent on whether the wind turbines will obtain approval, if capital funding is available and the outcome of the financial modelling.
4.4 AECOM Business Case (2014)
AECOM prepared a separate Business Case (BC) in 2014 which focussed on two specific options. The purpose of the BC was to assess the economic and financial worth of the proposed options for the purposes of obtaining funding from the NSW Government. The two options analysed by AECOM are the Option 1 and Option 2 defined and investigated later on in this study. These options are different to those assessed by ABB in the Technical Design specifications and the Business Case, reflecting a change in approach by the Board.
It was noted in the document that the assessment relied upon inputs from the earlier technical assessments completed by ABB. AECOM did not perform their own energy modelling and instead used the results calculated by ABB in preparation of the document. As the exact BC options are not explicitly covered in the earlier works by ABB there must have been additional work carried out by ABB to enable AECOM to complete their model. This is consistent with the notes in the AECOM spreadsheet referring to an updated ABB spreadsheet.
AECOM provided indicative capital and operational costs based on the two options along with the cost savings expected as a result of using less diesel fuel at the powerhouse.
The key values from the AECOM BC are compared with the equivalent results from this Technical Feasibility Study in Section 10.2.11.

Lord Howe Island Hybrid Renewable Energy Project Technical Feasibility Study
RT019500-0000-GN-RPT-0003 20
5. Existing LHI Electricity and Fuel Consumption The Board provided a selection of historical energy, maximum and minimum demands and diesel fuel consumption data. The data was a mixture of annual, monthly and 1 minute datasets which did not completely cover the same time periods for the different datasets. The data was not complete in some cases; however there was sufficient data available to enable the interpolation of missing data for the purposes of this study if necessary.
The contribution to energy production and use of fuel by the back-up diesel generator was not included in this review as it was deemed to be a minor contribution.
The data was reviewed to get an understanding of the annual, seasonal and daily trends and hence if the HREP is likely to be impacted by any of these.
The data was also used to derive an annual load profile for the island, suitable for use in the Homer modelling software.
5.1 Current Load Profile
The powerhouse data was provided by the Board in 1 minute time series samples covering the period from April 2005 to October 2012 (inclusive).
Since the previous revision of this report, Citect data has also been retrieved from the powerhouse in a 5 second time series dataset covering the period from February 2015 to November 2015.
The time series datasets were averaged into 10 minute intervals, corrected to Lord Howe Island Standard Time and screened for valid samples. A number of months of data were missing from the dataset or contained “zero” readings -, this data was excluded from the analysis.
The monthly energy production, fuel usage and maximum power figures from the powerhouse were provided in addition to the time series data. This monthly data, along with the time series data, is summarised in Table 5-1.
Table 5-1 : Annual Powerhouse Energy, Mean Power, Fuel Usage and Maximum Power Demand
Year Energy Production
(MWh)
Mean Power7
(kW)
Fuel Usage
(litres)
Maximum Powerhouse Demand
(kW)
2005 2426 249.4 743150 -
2006 2469 253.5 754450 -
2007 2250 249.8 733400 -
2008 2301 264.6 697000 -
2009 2290 269.3 583450 -
2010 2311 262.6 585150 490
2011 2326 267.6 585350 467
20128 2277 260.0 576250 468
2013 2087 - 533200 447
2014 2082 - 514500 442
20159 2044 - 518650 489
7 The annual mean power has been calculated using the valid time series data. This data covered the period from April 2005 to October 2012 hence
no values were calculated for 2013 and 2014. 8 Monthly data for December 2012 was not available due to the new powerhouse being commissioned; arbitrary values were determined for the
month in order to assess the annual trend of energy production.
Lord Howe Island Hybrid Renewable Energy Project Technical Feasibility Study
RT019500-0000-GN-RPT-0003 21
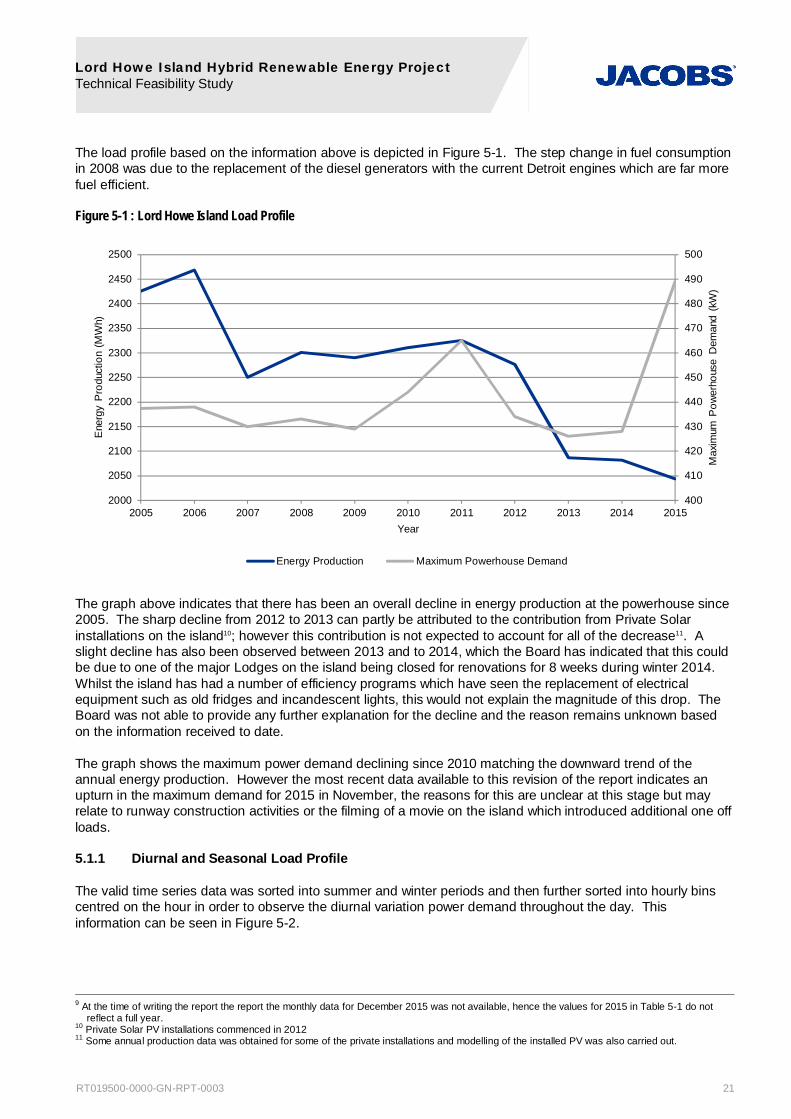
The load profile based on the information above is depicted in Figure 5-1. The step change in fuel consumption in 2008 was due to the replacement of the diesel generators with the current Detroit engines which are far more fuel efficient.
Figure 5-1 : Lord Howe Island Load Profile
The graph above indicates that there has been an overall decline in energy production at the powerhouse since 2005. The sharp decline from 2012 to 2013 can partly be attributed to the contribution from Private Solar installations on the island10; however this contribution is not expected to account for all of the decrease11. A slight decline has also been observed between 2013 and to 2014, which the Board has indicated that this could be due to one of the major Lodges on the island being closed for renovations for 8 weeks during winter 2014. Whilst the island has had a number of efficiency programs which have seen the replacement of electrical equipment such as old fridges and incandescent lights, this would not explain the magnitude of this drop. The Board was not able to provide any further explanation for the decline and the reason remains unknown based on the information received to date.
The graph shows the maximum power demand declining since 2010 matching the downward trend of the annual energy production. However the most recent data available to this revision of the report indicates an upturn in the maximum demand for 2015 in November, the reasons for this are unclear at this stage but may relate to runway construction activities or the filming of a movie on the island which introduced additional one off loads.
5.1.1 Diurnal and Seasonal Load Profile
The valid time series data was sorted into summer and winter periods and then further sorted into hourly bins centred on the hour in order to observe the diurnal variation power demand throughout the day. This information can be seen in Figure 5-2.
9 At the time of writing the report the report the monthly data for December 2015 was not available, hence the values for 2015 in Table 5-1 do not
reflect a full year. 10 Private Solar PV installations commenced in 2012 11 Some annual production data was obtained for some of the private installations and modelling of the installed PV was also carried out.
400
410
420
430
440
450
460
470
480
490
500
2000
2050
2100
2150
2200
2250
2300
2350
2400
2450
2500
2005 2006 2007 2008 2009 2010 2011 2012 2013 2014 2015
Max
imum
Pow
erho
use
Dem
and
(kW
)
Ene
rgy
Pro
duct
ion
(MW
h)
Year
Energy Production Maximum Powerhouse Demand

Lord Howe Island Hybrid Renewable Energy Project Technical Feasibility Study
RT019500-0000-GN-RPT-0003 22
Figure 5-2 : Diurnal and Seasonal Load Profile
The graph above shows that the power demand is lowest overnight, as expected. The demand increases in the morning at around breakfast time and remains fairly constant throughout the daytime until late afternoon. As expected again, the demand is at its peak during the evening with a maximum occurring between 18:00 and 20:00 hours.
The separate profiles for the winter and summer diurnal variations do follow the same trend of low demands overnight and high demands early evening, however the demand in winter is consistently lower than the summer demand, with the exception of the evening period.
The monthly variation in temperature at LHI was also assessed. The temperature data used in the assessment was recorded by the Lord Howe Island Aerodrome met station data and covered the period from January 2004 to December 2014. The mean monthly temperature and temperature range, is displayed in Figure 5-3 below.
150
170
190
210
230
250
270
290
310
330
350
00:00 02:00 04:00 06:00 08:00 10:00 12:00 14:00 16:00 18:00 20:00 22:00 00:00
Pow
er (k
W)
Hour
Winter Summer

Lord Howe Island Hybrid Renewable Energy Project Technical Feasibility Study
RT019500-0000-GN-RPT-0003 23
Figure 5-3 : Monthly Mean Temperature Variation
Figure 5-3 shows that there is only a small variation in monthly temperatures throughout the year indicating a mild climate. As little no electric heating and only a very small amount of or air conditioning is directly connected to the Board electricity network, the small difference between the winter and summer diurnal curves can possibly be attributed to a greater number of tourists visiting LHI during the summer period and the closure of some accommodation lodges during winter each year.
5.1.2 Weekly Load Profile
Again using the valid time series data, the data was sorted according to the day of the week in order to obtain an understanding of the variation of the load over weekdays and weekends. This can be observed in Figure 5-4 below.
0
5
10
15
20
25
30
35
Tem
pera
ture
(°C
)
Month

Lord Howe Island Hybrid Renewable Energy Project Technical Feasibility Study
RT019500-0000-GN-RPT-0003 24
Figure 5-4 : Weekly Load Profile
The weekly load profile shows that there is no significant variation of load between each day at Lord Howe Island.
5.1.3 Monthly Energy Production and Maximum Power
Figure 5-5 shows the monthly energy production figures provided by the Board.
Figure 5-5 : Monthly Energy Production
240
245
250
255
260
265
270
275
280
Sunday Monday Tuesday Wednesday Thursday Friday Saturday
Pow
er (k
W)
Day
140
150
160
170
180
190
200
210
220
230
240
Ene
rgy
Pro
duct
ion
(MW
h)
Month
Average 2005 2006 2007 2008 2009
2010 2011 2012 2013 2014 2015
Lord Howe Island Hybrid Renewable Energy Project Technical Feasibility Study
RT019500-0000-GN-RPT-0003 25
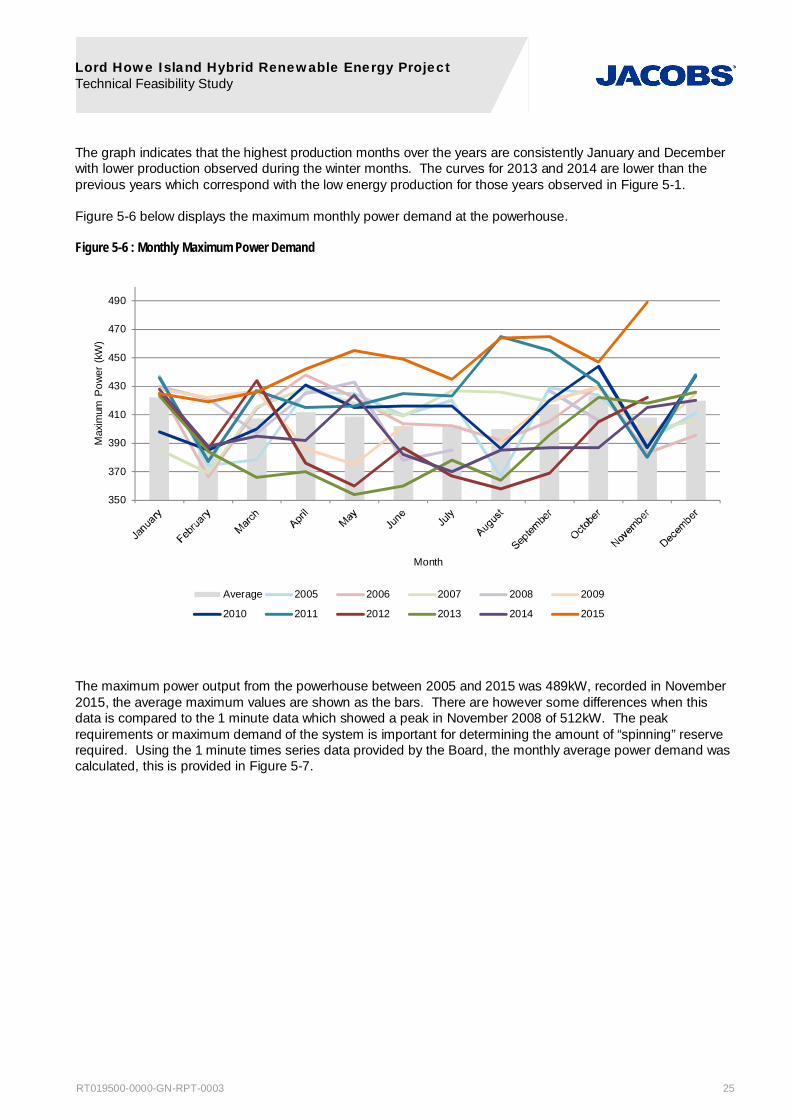
The graph indicates that the highest production months over the years are consistently January and December with lower production observed during the winter months. The curves for 2013 and 2014 are lower than the previous years which correspond with the low energy production for those years observed in Figure 5-1.
Figure 5-6 below displays the maximum monthly power demand at the powerhouse.
Figure 5-6 : Monthly Maximum Power Demand
The maximum power output from the powerhouse between 2005 and 2015 was 489kW, recorded in November 2015, the average maximum values are shown as the bars. There are however some differences when this data is compared to the 1 minute data which showed a peak in November 2008 of 512kW. The peak requirements or maximum demand of the system is important for determining the amount of “spinning” reserve required. Using the 1 minute times series data provided by the Board, the monthly average power demand was calculated, this is provided in Figure 5-7.
350
370
390
410
430
450
470
490
Max
imum
Pow
er (
kW)
Month
Average 2005 2006 2007 2008 2009
2010 2011 2012 2013 2014 2015

Lord Howe Island Hybrid Renewable Energy Project Technical Feasibility Study
RT019500-0000-GN-RPT-0003 26
Figure 5-7 : Monthly Average Power Demand
The monthly averages in the graph above indicate a lower power demand period over the winter months compared to summer, this corresponds with the difference observed in the diurnal variation provided in Figure 5-2 and also fits with the assumption that the summer demand is larger due to the higher number of tourists visiting the island.
5.1.4 System Load Variability
An assessment of the variability of the system load on Lord Howe Island was performed using 5 second load data recorded at the powerhouse. The 5 second load data used for the assessment covered the period from 3 February 2015 10:00:15 to the 30 September 2015 10:22:05 providing 4,104,649 valid samples. The step changes in contiguous load samples were calculated.
Some caution should be exercised with this data as no calibration checks have been performed to validate the accuracy of the data that Citect records in terms of magnitude and timing. As such the data should be treated as a guide when the detailed design of the HREP is carried out by the Solar, Battery and Control System Contractor.
The dataset was sorted into 1kW bins based on the system load variation, with Figure 5-8 showing the number of occurrences in each bin.
200
210
220
230
240
250
260
270
280
290
300
Ave
rage
Pow
er (k
W)
Month
Average 2005 2006 2007 2008 2009
2010 2011 2012 2013 2014 2015

Lord Howe Island Hybrid Renewable Energy Project Technical Feasibility Study
RT019500-0000-GN-RPT-0003 27
Figure 5-8 : System Load Step Variations
What would be characterised as normal steady state operation, with load variations less than 15kW, occurred 99.7% of the time indicating a system with slowly changing loads. Given the lack of industry and large air-conditioning loads, this steady state profile is to be expected. The Board advised that the largest single 3 phase load on the island was an 18kW DOL motor at the Waste Management Facility. The maximum 5 second variation recorded was an 180kW rise which would represent the reconnection of a feeder during the day, possibly when the load is transferred from the backup genset to the power house.
The 5 second step changes in system load were sorted into 4 bands and the number of occurrences in each band presented in Table 5-2 to illustrate the frequency of step changes.
Table 5-2 : System Load Rise and Fall
System Load Step Change (kW) Number of Occurrences
From To Rise Fall
20 40 1975 1637
40 60 477 491
60 100 272 245
Above 100 55 61
The table above shows that there have been some instances where the system load has changed over 100kW in 5 seconds, these are likely to relate to the removal or return of one of the feeders during normal switching operations associated with transfer to and from the back-up generator and or faults, although these are considered rare events on the island. The HREP system will need to be designed to accommodate these step changes and further analysis will be required to be undertaken by the Solar Battery and Control System contractor.
5.2 Future Load Profile – Loads and Generation
Up until 2015 the trend for power generation by the Board has clearly been reducing over the period examined. The Board’s business as usual scenario expects this decline in energy production to have bottomed out as LHI residents complete the installation of energy saving measures and the approved Private Solar installations.
0
100000
200000
300000
400000
500000
600000
700000
800000
900000
Num
ber
of O
ccur
renc
es
System Load Step Variation (kW)

Lord Howe Island Hybrid Renewable Energy Project Technical Feasibility Study
RT019500-0000-GN-RPT-0003 28
The Board advised that depending on the success of the HREP, it may be possible that loads which are currently met either by gas or private diesel gensets may be allowed to be connected to the Board electrical system. Loads such as electric stoves and ovens and heat pump systems for cooling and heating are likely to be the main items. There is also the possibility of other connected loads such electric cars which would be ideal given the terrain and distances travelled, as well as offering the potential for emergency battery storage when the cars are connected to the electricity grid in the event of an immediate shortfall in the Board generation capacity.
Notwithstanding the possibilities flagged above, the Board advise that the position for business as usual will see at most a 0.5% growth in electrical load over the foreseeable future.

Lord Howe Island Hybrid Renewable Energy Project Technical Feasibility Study
RT019500-0000-GN-RPT-0003 29
6. Project Approvals 6.1 Solar Battery and Control System
Project approval for the solar PV, battery and control system work was received on 24 November 2015 (RPS, 2015).
The project approval states that the development application was distributed to the relevant internal specialists who raised no objections to the proposal.
The project approval included 20 planning conditions, these are summarised in the table below.
Table 6-1 : Solar Planning Conditions
Condition Number Title Description
1 Approved Plans and Supporting Documentation
The development is to be carried out in accordance with the plans and documentation provided with DA 2016-02 and endorsed with the Lord Howe Island Board’s stamp, except where amended by other conditions of consent.
2 Solar Area & Road Options The approval is for the construction of solar panels across only two of the three Solar Areas identified on the approved drawing and one of the two road options.
3 Final Solar Array and Road Design Prior to the commencement of construction, Airservices Australia must be consulted by the Board and provide written agreement on the final design.
4 Detailed Design and Reflectivity
Solar panel design and finishes must not give rise to any glare that causes the panels to be visually prominent in the context of the LHI landscape or which has an impact on aviation.
A reflectivity specialist is to be engaged by the applicant to make a detailed assessment of the detailed design considering key viewpoints and impacts on aviation.
5 New building
Details of the new building containing the batteries, inverter system and 415V switchgear located to the west of the Powerhouse and access road are to be provided to the Board for design endorsement prior to the commencement of construction. The building height is to be less than 7.5m from natural ground level. It is to be located as shown on the drawing and not be within 10m of the northern boundary to Anderson Road.
6 Acoustic The recommendations of the approved Acoustic report are to be adopted, including the use of 25 kW inverters rather than larger units.
7 Disturbance of Land Surface
Silt and sediment controls must be established prior to any disturbance of the land surface. Controls must be in accordance with edition 4 of ‘Managing Urban Stormwater, Soils and Construction’ (NSW Government, 2004).
8 Ecology
It is recommended that the establishment and maintenance of a rodent baiting grid within the subject sites is recommended to retain and improve habitat for the LHI Placostylus. Should any live animals be detected during the construction phase they should be moved away from the work site into adjacent bush land and placed under dense leaf litter.
The proposed permanent fencing surrounding the subject sites be designed to not include any barbed wire and to have a gap at ground level with a minimum clearance of 150mm.

Lord Howe Island Hybrid Renewable Energy Project Technical Feasibility Study
RT019500-0000-GN-RPT-0003 30
Condition Number Title Description
9 Significant Native Vegetation
There shall be no removal of Significant Native Vegetation (SNV). Prior to commencement of construction the Board is to be satisfied that the construction methodology for underground cable installation would not damage SNV.
10 Construction Hours All construction work shall be restricted to the hours of 7.00am to 6.00pm Monday to Friday and 8.00am to 1.00pm Saturdays. No construction work shall take place on Sundays or Public Holidays.
11 Temporary Construction and Permanent Vehicle Speed Zones
A temporary construction vehicle speed limit zone of maximum 15km/hr is to be established, through the construction management plan, from the intersection of Middle Beach Road with Anderson Road extending to the solar array site.
12 Notice of Commencement Notice must be given to the Lord Howe Island Board at least 2 days prior to the commencement of building work.
13 Building Code of Australia All building work must be carried out in accordance with the requirements of the Building Code of Australia.
14 Construction Management Plan A Construction Management Plan is to be submitted and approved by the Board prior to the issuing of a Construction Certificate.
15 Erection of construction signs A sign must be erected in a prominent position on any site on which building work, is being carried out.
16 Site Landscaping Existing site landscaping and all major areas of native plantings on site are to be maintained.
17 Identification of Relics If, during the course of development works, suspected non-Aboriginal cultural heritage material are discovered, work will cease in that area immediately.
18 Plumbing and Electrical Work
Any plumbing and electrical work must be carried out by licensed contractors.
Any new installations cannot be connected to full supply until all compliance forms have been submitted and the installation has been inspected by the LHIB Senior Electrical Officer.
19 Subdivision
The proposed solar array and powerhouse allotment is to be surveyed by a registered surveyor and a linen plan of subdivision prepared.
The linen plan of subdivision is to include a road reserve or right of way benefitting the Board and Airservices Australia over the final approved access. The easement must be registered prior to the operation of the solar array.
20 Decommissioning and removal of structures
Should operation of the solar photovoltaic system cease in the future or be replaced with new technologies, all structures no longer required are to be decommissioned and removed and the land returned to its former natural state where possible.
The planning conditions listed above are all considered achievable and will not impact the progress of the solar development.
Airservices Australia
Airservices Australia has advised that “This proposal has the potential to impact on Airservices facilities, however provided the following conditions are put in place, Airservices can support the solar installation and access road”
1) As a condition of installation, Airservices requires good (and compliant) earthing practice given its close proximity to Operational Services.
Lord Howe Island Hybrid Renewable Energy Project Technical Feasibility Study
RT019500-0000-GN-RPT-0003 31
2) Provided an ADS-B repeater station / antenna pole was installed at either Intermediate Hill or Malabar Hill, Airservices could support the development in Area C. There will be no impact to Airservices ADS-B antenna if solar installations were to be located in Area A.
3) Impact to Cabling:
Airservices has a large amount of cabling in the proposed area. If any ground works are required for this installation, the following conditions MUST be implemented:
A service audit to confirm cable routes/depth using non-destructive digging will be required e.g.: Hydro excavate and/or Ground Penetrating Radar (GPR);
All excavation works MUST be no closer than 2 meters to Airservices operational control cables;
Any drainage works crossing over our cables will require a cable protection method using a design previously approved by Airservices;
Local Airservices staff MUST be on site during the works otherwise works are not to be undertaken or progressed; and
Advisory Works plan to notify users.
6.2 Wind
NGH Environmental (NGH) has been engaged by the Board to prepare the wind Environmental Report and the development application supporting documentation for the wind turbine generators. NGH’s work on the Environmental Report is due to commence in December 2015 and is expected to be completed in May 2016.
The current expected submission date of the Environmental Report and development application documentation is scheduled for mid-April 2016.
Some of the key inputs to the Environmental Report have been completed:
Bird and bat monitoring and respective reports have been completed for the site
Background summer and winter noise has been measured and modelling of the wind turbine noise contribution at residences has been completed
Photomontages of the wind turbines from a number of locations have been prepared
Airservices Australia has raised concerns about the potential impact the wind turbines will have on their nearby assets and requested that specific studies be undertaken. LHIB is currently seeking proposals from specialists to undertake this work. The impact of the wind turbines on the Airservices Australia assets are currently being investigated to determine what, if any, mitigation will be necessary.
The aviation impact statement (TAG173 Pty Ltd, a Licensee of The Airport Group, 2015) will be referred to CASA in early 2016. The AIS suggests that the proposed WTGs do not represent a significant aviation hazard, and are likely to require a red light to be erected on each for night time visibility. The LHI Airport is not certified to accept night time flights, however, in a medical emergency, the RAAF will bring in a Hercules at night if required. In this case, the WTGs would be lit via a remote control system, in the same way Transit & Intermediate Hills are currently lit.
Lord Howe Island Hybrid Renewable Energy Project Technical Feasibility Study
RT019500-0000-GN-RPT-0003 32
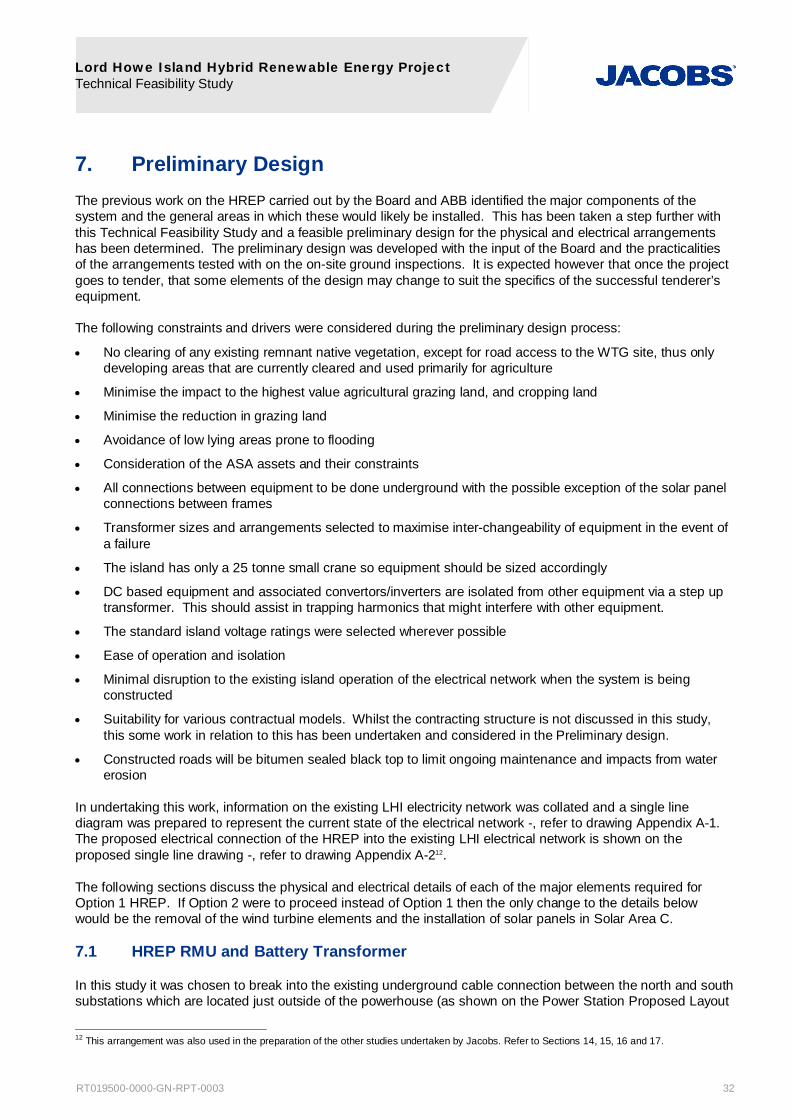
7. Preliminary Design The previous work on the HREP carried out by the Board and ABB identified the major components of the system and the general areas in which these would likely be installed. This has been taken a step further with this Technical Feasibility Study and a feasible preliminary design for the physical and electrical arrangements has been determined. The preliminary design was developed with the input of the Board and the practicalities of the arrangements tested with on the on-site ground inspections. It is expected however that once the project goes to tender, that some elements of the design may change to suit the specifics of the successful tenderer’s equipment.
The following constraints and drivers were considered during the preliminary design process:
No clearing of any existing remnant native vegetation, except for road access to the WTG site, thus only developing areas that are currently cleared and used primarily for agriculture
Minimise the impact to the highest value agricultural grazing land, and cropping land
Minimise the reduction in grazing land
Avoidance of low lying areas prone to flooding
Consideration of the ASA assets and their constraints
All connections between equipment to be done underground with the possible exception of the solar panel connections between frames
Transformer sizes and arrangements selected to maximise inter-changeability of equipment in the event of a failure
The island has only a 25 tonne small crane so equipment should be sized accordingly
DC based equipment and associated convertors/inverters are isolated from other equipment via a step up transformer. This should assist in trapping harmonics that might interfere with other equipment.
The standard island voltage ratings were selected wherever possible
Ease of operation and isolation
Minimal disruption to the existing island operation of the electrical network when the system is being constructed
Suitability for various contractual models. Whilst the contracting structure is not discussed in this study, this some work in relation to this has been undertaken and considered in the Preliminary design.
Constructed roads will be bitumen sealed black top to limit ongoing maintenance and impacts from water erosion
In undertaking this work, information on the existing LHI electricity network was collated and a single line diagram was prepared to represent the current state of the electrical network -, refer to drawing Appendix A-1. The proposed electrical connection of the HREP into the existing LHI electrical network is shown on the proposed single line drawing -, refer to drawing Appendix A-212.
The following sections discuss the physical and electrical details of each of the major elements required for Option 1 HREP. If Option 2 were to proceed instead of Option 1 then the only change to the details below would be the removal of the wind turbine elements and the installation of solar panels in Solar Area C.
7.1 HREP RMU and Battery Transformer
In this study it was chosen to break into the existing underground cable connection between the north and south substations which are located just outside of the powerhouse (as shown on the Power Station Proposed Layout
12 This arrangement was also used in the preparation of the other studies undertaken by Jacobs. Refer to Sections 14, 15, 16 and 17.
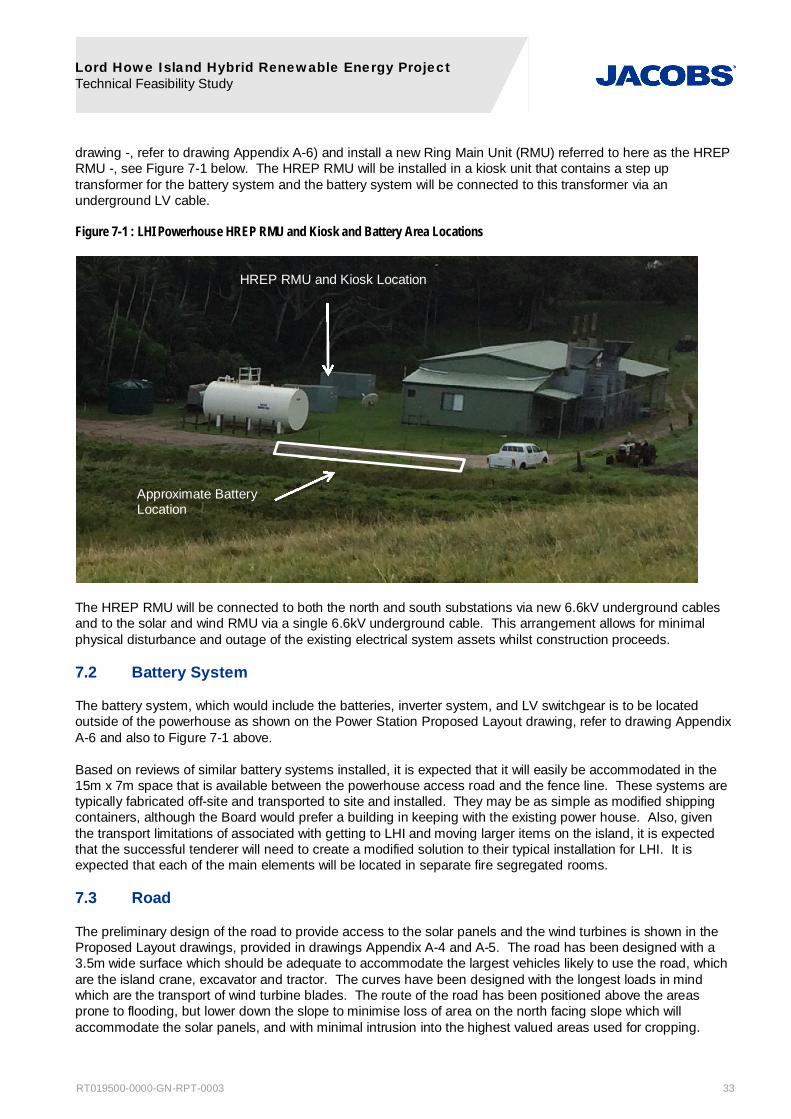
Lord Howe Island Hybrid Renewable Energy Project Technical Feasibility Study
RT019500-0000-GN-RPT-0003 33
drawing -, refer to drawing Appendix A-6) and install a new Ring Main Unit (RMU) referred to here as the HREP RMU -, see Figure 7-1 below. The HREP RMU will be installed in a kiosk unit that contains a step up transformer for the battery system and the battery system will be connected to this transformer via an underground LV cable.
Figure 7-1 : LHI Powerhouse HREP RMU and Kiosk and Battery Area Locations
The HREP RMU will be connected to both the north and south substations via new 6.6kV underground cables and to the solar and wind RMU via a single 6.6kV underground cable. This arrangement allows for minimal physical disturbance and outage of the existing electrical system assets whilst construction proceeds.
7.2 Battery System
The battery system, which would include the batteries, inverter system, and LV switchgear is to be located outside of the powerhouse as shown on the Power Station Proposed Layout drawing, refer to drawing Appendix A-6 and also to Figure 7-1 above.
Based on reviews of similar battery systems installed, it is expected that it will easily be accommodated in the 15m x 7m space that is available between the powerhouse access road and the fence line. These systems are typically fabricated off-site and transported to site and installed. They may be as simple as modified shipping containers, although the Board would prefer a building in keeping with the existing power house. Also, given the transport limitations of associated with getting to LHI and moving larger items on the island, it is expected that the successful tenderer will need to create a modified solution to their typical installation for LHI. It is expected that each of the main elements will be located in separate fire segregated rooms.
7.3 Road
The preliminary design of the road to provide access to the solar panels and the wind turbines is shown in the Proposed Layout drawings, provided in drawings Appendix A-4 and A-5. The road has been designed with a 3.5m wide surface which should be adequate to accommodate the largest vehicles likely to use the road, which are the island crane, excavator and tractor. The curves have been designed with the longest loads in mind which are the transport of wind turbine blades. The route of the road has been positioned above the areas prone to flooding, but lower down the slope to minimise loss of area on the north facing slope which will accommodate the solar panels, and with minimal intrusion into the highest valued areas used for cropping.
HREP RMU and Kiosk Location
Approximate Battery Location

Lord Howe Island Hybrid Renewable Energy Project Technical Feasibility Study
RT019500-0000-GN-RPT-0003 34
The slope of the road can be seen in the longitudinal section drawing, refer to drawing Appendix A-5, and in two areas is quite steep with 18% and 16% gradients. While roads this steep are not ideal, it is a function of the terrain that the road is being built in and the surface will be sealed. Alternative designs were investigated that reduced the first steep section by cutting across the slope earlier, however this severely impacted on the prime solar panel space and so was dismissed given the space for solar panels is at a premium.
7.4 Solar
The proposed overall layout drawings (Appendix A-4) shows two areas that have been identified for the potential placement of solar PV panels. The preference is to locate all of the solar panels in the area marked Solar Area A. Initial designs carried out using typical panel arrangements showed this is possible for the BC Option 1 450kWpAC, but may not be possible for Option 2 550 kWpAC, which would require panels to be installed in Area C.
Based on the panel selected for this preliminary design, the following is required:
- Option 1 - 1495 panels with 3 units stacked horizontally on a frame
- Option 2 - 1820 panels with 3 units stacked horizontally on a frame
Refer to section 9.3.1.1 for details of the array sizing. Based on the panel selected for the preliminary design it is possible that the full capacity of Solar Area A and C could accommodate approximately 750kW. The two pictures below, Figure 7-2 and Figure 7-3, show the north facing aspect of Solar Area A.
Figure 7-2 : Looking at Solar Area A from the Powerhouse
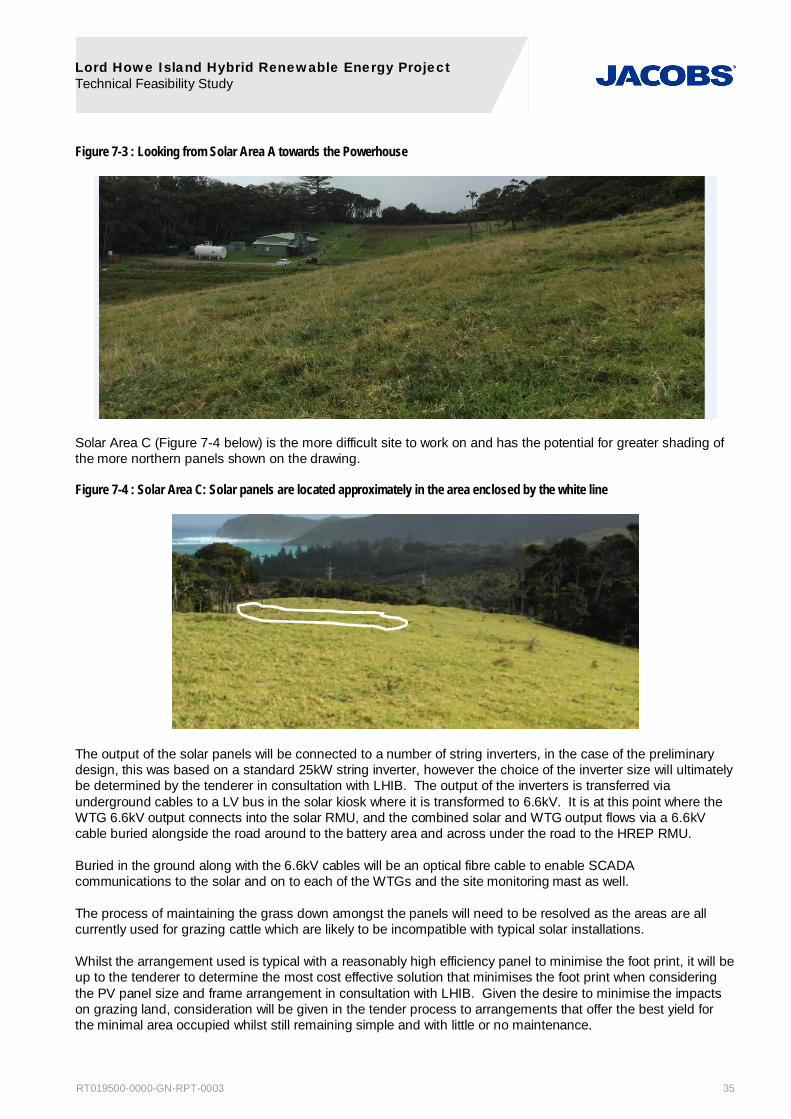
Lord Howe Island Hybrid Renewable Energy Project Technical Feasibility Study
RT019500-0000-GN-RPT-0003 35
Figure 7-3 : Looking from Solar Area A towards the Powerhouse
Solar Area C (Figure 7-4 below) is the more difficult site to work on and has the potential for greater shading of the more northern panels shown on the drawing.
Figure 7-4 : Solar Area C: Solar panels are located approximately in the area enclosed by the white line
The output of the solar panels will be connected to a number of string inverters, in the case of the preliminary design, this was based on a standard 25kW string inverter, however the choice of the inverter size will ultimately be determined by the tenderer in consultation with LHIB. The output of the inverters is transferred via underground cables to a LV bus in the solar kiosk where it is transformed to 6.6kV. It is at this point where the WTG 6.6kV output connects into the solar RMU, and the combined solar and WTG output flows via a 6.6kV cable buried alongside the road around to the battery area and across under the road to the HREP RMU.
Buried in the ground along with the 6.6kV cables will be an optical fibre cable to enable SCADA communications to the solar and on to each of the WTGs and the site monitoring mast as well.
The process of maintaining the grass down amongst the panels will need to be resolved as the areas are all currently used for grazing cattle which are likely to be incompatible with typical solar installations.
Whilst the arrangement used is typical with a reasonably high efficiency panel to minimise the foot print, it will be up to the tenderer to determine the most cost effective solution that minimises the foot print when considering the PV panel size and frame arrangement in consultation with LHIB. Given the desire to minimise the impacts on grazing land, consideration will be given in the tender process to arrangements that offer the best yield for the minimal area occupied whilst still remaining simple and with little or no maintenance.

Lord Howe Island Hybrid Renewable Energy Project Technical Feasibility Study
RT019500-0000-GN-RPT-0003 36
7.5 Wind
The physical installation of the WTG’s covered in this preliminary design has been based on the wind turbine (Vergnet 275kW 32 metre rotor) used in the BC. Since revision 1 of this report was issued, sufficient data has been obtained to enable Vergnet to assess the suitability of the 275kW WTG for this site. As a result of this assessment Vergnet has advised that the 275kW WTG is not suitable and that the 200kW 30m rotor WTG should be used instead. Section 8.2.3.3 of this report covers the detail of the site specific assessment. This change of WTG does not affect the preliminary design as the only difference between the two WTG’s is the size of the rotor and software changes. Another WTG, the XANT 21 100kW machine with a 31.8m hub height, has also been considered in this revision of the report. Its physical installation requirements fit within the envelope of the Vergnet turbine.
The location of the wind turbines as shown on the overall layout drawing (refer to drawing Appendix A-4) is lower down the cleared area than was previously envisaged in the earlier work conducted by ABB and AECOM. The space required for each Vergnet WTG in a laid down position is shown on the drawing in outline (the shape that looks a bit like a vase) and cannot be physically accommodated higher up the slope. This is based on the requirements specified by Vergnet in their set out documents (Vergnet, 2010) and (Vergnet, 2006). The photograph in Figure 7-5 is a view taken from the approximate location of the site monitoring mast looking down towards the location of T02 and T01 further below that.
Normal practice is to pivot the WTGs in the same direction as the prevailing wind which in this case would mean that the wind turbines would pivot roughly facing downhill. However this would mean that the nacelles would be a considerable distance off the ground and would require scaffolding to be built to reach them for service work to be carried out. This would then negate one of the key differentiators of the Vergnet WTG, hence why the WTGs have been located so that they lay down on the ground facing up slope.
Figure 7-5 : WTG Installation Area
The WTG access road has been positioned to pass between the tower of T01 and its guy wires and there should be sufficient height for the Lord Howe Island crane to pass through this space. However the width of the area available will mean that when T01 is lowered down, the blades of T01 will block vehicle access to T02. This is not expected to be a major issue.
Each WTG will be accompanied by a small kiosk transformer raising the output of the WTG from 400V to 6.6kV. The output of T02 will flow along a buried HV cable to T01 kiosk where it will connect into the T01 RMU. The combined output of T01 and T02 will then flow via a 6.6kV cable buried off the side of the road or if necessary in the road with suitable protection, down to the solar RMU.
As reported in Section 9, the SCADA communication requirements will be achieved via an optical fibre link from the WTGs and site monitoring mast to the powerhouse via Solar Area A.

Lord Howe Island Hybrid Renewable Energy Project Technical Feasibility Study
RT019500-0000-GN-RPT-0003 37
8. Wind Resource 8.1 Introduction
This section describes the wind resource assessment steps that were undertaken as part of this study and results that were obtained. Table 8-1 provides key results from the study.
Table 8-1 : Key Results
Turbines
Hub Height Wind Resource Annual Energy Production (MWh/year)13 Net P50 Capacity Factor
(%)
Speed
(m/s)
Weibull k
(-) Prevailing Direction
Gross P50
Net P50
Net P90
(1 Year)
Net P90
(10 Year)
2 x GEVMP 32 275kW 7.4 2.0 Southeast 1691.0 1535.8 1253.8 1321.2 31.9
2 x GEVMP 30 200kW 7.4 2.0 Southeast 1326.0 1209.9 1000.4 1050.3 34.5
2 x XANT M-21 100kW 6.9 1.9 Southeast 627.7 572.2 472.4 489.8 32.7
The Annual Energy Production (AEP) and net Capacity Factor results above were calculated assuming that operation of the WTGs was unconstrained. Wind turbine curtailment due to potential noise restrictions and sea bird movements has been considered in further detail in Section 8.3.6
The long term wind resource at the site monitoring mast was calculated using a Measure-Correlate-Predict (MCP) analysis based on site and reference wind speed and directional distributions for 12 direction sectors.
The short term site data used was recorded during a 12 month period from 14 November 2014 to 13 November 2015. Eleven years of consistent wind data recorded by the Lord Howe Island Aerodrome met station was procured. This data was correlated with the concurrent reference and site data, and then the sector-specific correlative relationships were applied to the long term (11 year) reference data to obtain synthesised long term wind data at the site monitoring mast.
This synthesised long term wind resource data was extrapolated from the site monitoring mast to the turbine locations at hub height using WAsP wind flow modelling software. WAsP modelling is considered the industry-standard modelling software for wind resource assessments across the world. Jacobs has significant experience of using WAsP wind flow modelling software to perform wind resource assessments. WAsP was used to calculate the gross AEP of the proposed wind turbine layout. The product of the wake loss factor and other wind farm loss factors was calculated to obtain the overall wind farm loss factor, and hence the net P50 AEP and Capacity Factor.
An uncertainty analysis was performed to assess how the AEP changed with the probability of exceedance (PoE) for different time periods to obtain the net P90 AEP.
8.2 Wind Resource Analysis
8.2.1 Summary
Table 8-2 summarises key results from the wind resource analysis. The values are all annual means taken from WAsP tab files. Values at the turbines have been extrapolated from the site monitoring mast using WAsP wind flow modelling. Short term refers to the concurrent period where data was recorded by both the site monitoring mast and the met station, from 14 November 2014 to 13 November 2015.
13 P50 AEP represents the energy that is expected to be achieved or exceeded with a likelihood of 50% in an average year. P90 AEP represents the energy that is expected to be achieved or exceeded with a likelihood of 90% in an average year.

Lord Howe Island Hybrid Renewable Energy Project Technical Feasibility Study
RT019500-0000-GN-RPT-0003 38
Table 8-2 : Key Results from the Wind Resource Analysis
Item Short term Measured
Short term Synthesised14
Long term Measured
Long term Synthesised
Vergnet Turbines
55.0mAGL
Wind speed (m/s) - - - 7.4
Weibull k (-) - - - 2.0
Prevailing direction - - - Southeast
XANT Turbines
31.8mAGL
Wind speed (m/s) - - - 6.9
Weibull k (-) - - - 1.9
Prevailing direction - - - Southeast
Site monitoring mast
47.7mAGL
Wind speed (m/s) 7.0 7.3 - 7.7
Weibull k (-) 2.0 2.2 - 2.0
Prevailing direction Southeast Southeast - Southeast
Reference data
10.0mAGL
Wind speed (m/s) 5.4 - 5.7 -
Weibull k (-) 2.0 - 1.9 -
Prevailing direction East - East -
Note: The average WTG base elevation is 62.8mASL, the Site Monitoring Mast base elevation is 80.1mASL and the Reference mast is 3mASL.
These values were calculated using a Measure-Correlate-Predict (MCP) analysis together with WAsP wind flow modelling. This process essentially involved:
Measure site wind data: This data included the mean and standard deviation of wind speed and direction measured by anemometers and wind vanes installed at different heights on the 47.7m tall onsite monitoring mast for the period 14 November 2014 to 13 November 2015.
Correlate site data with reference data: This step established relationships between concurrent wind data recorded by the site monitoring mast and that recorded by the nearby Lord Howe Island Aerodrome met station for 12 wind direction sectors (Australian Bureau of Meteorology, 2015).
Predict the long term site monitoring mast wind data: This step used the correlative relationships between the site monitoring mast and reference wind data. These relationships were combined with long term historical reference data to predict the wind resource experienced at the site monitoring mast over that same period. Assuming the wind resource over the next such period is statistically similar to that over the historical period provides the predicted long term future wind resource at the site monitoring mast.
Extrapolate long term wind data to the turbines: WAsP wind flow modelling software was used to extrapolate the long term site monitoring mast wind data (as calculated above) across the site to the proposed turbine locations at hub height.
Separately, the short term measured site wind data was used to calculate the short term wind shear and turbulence intensity (TI) at the site monitoring mast. This gave a wind shear alpha value of = 0.42, and a TI value at 47.7mAGL for a 15m/s 10 minute mean wind speed of TI15 = 10.6%. The short term wind data was shared with Vergnet who commented that the TI value was high when considering Edition 2 of the IEC 61400-1 Standard. However they did confirm that the 30m rotor diameter Vergnet turbine model rated at 200kW would be suitable for the site conditions.
The following sections describe this work in more detail.
14 The synthesised data has been obtained by applying the calculated correlation parameters determined in the MCP analysis to the corresponding
short term or long term reference data.

Lord Howe Island Hybrid Renewable Energy Project Technical Feasibility Study
RT019500-0000-GN-RPT-0003 39
8.2.2 Site Monitoring Mast Measurement Equipment
The site is equipped with a 47.7m tall wind monitoring mast. The Board supplied data recorded by this monitoring mast and with data on the mast installation and set-up.
The onsite monitoring mast is located at GDA 1994 MGA Zone 57 grid reference (507253, 6511612). The mast location is close to the proposed turbine locations and in similar terrain so appears as representative as possible, without obstructing the future WTGs.
Figure 8-1 : Site Monitoring Mast Directional Photographs
The monitoring mast configuration data showed that the mast broadly complies with IEC recommendations (International Electrotechnical Commission, 2005) which will keep the uncertainty associated with the wind speed measurements to a low level.
The site monitoring mast was equipped with the wind sensors specified in Table 8-3. This table assigns an identifying tag to each sensor which is used (where appropriate) for the remainder of this study.
N
W E
S
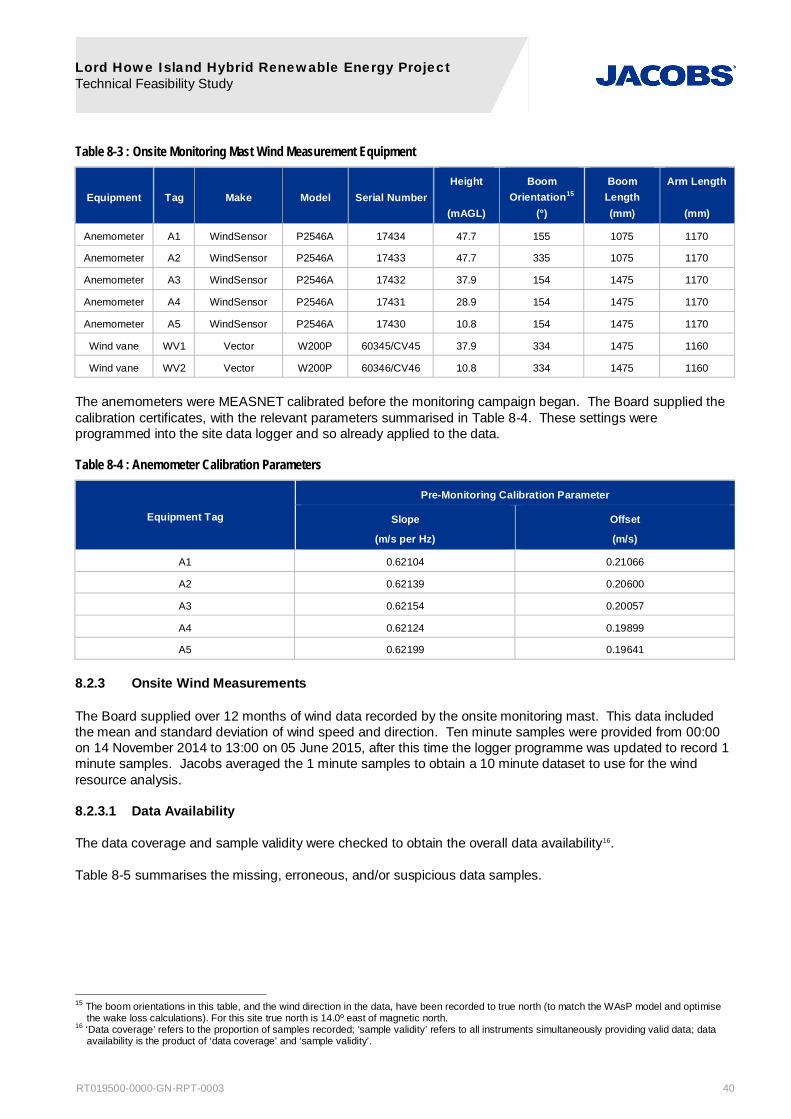
Lord Howe Island Hybrid Renewable Energy Project Technical Feasibility Study
RT019500-0000-GN-RPT-0003 40
Table 8-3 : Onsite Monitoring Mast Wind Measurement Equipment
Equipment Tag Make Model Serial Number Height
(mAGL)
Boom Orientation15
(°)
Boom Length (mm)
Arm Length
(mm)
Anemometer A1 WindSensor P2546A 17434 47.7 155 1075 1170
Anemometer A2 WindSensor P2546A 17433 47.7 335 1075 1170
Anemometer A3 WindSensor P2546A 17432 37.9 154 1475 1170
Anemometer A4 WindSensor P2546A 17431 28.9 154 1475 1170
Anemometer A5 WindSensor P2546A 17430 10.8 154 1475 1170
Wind vane WV1 Vector W200P 60345/CV45 37.9 334 1475 1160
Wind vane WV2 Vector W200P 60346/CV46 10.8 334 1475 1160
The anemometers were MEASNET calibrated before the monitoring campaign began. The Board supplied the calibration certificates, with the relevant parameters summarised in Table 8-4. These settings were programmed into the site data logger and so already applied to the data.
Table 8-4 : Anemometer Calibration Parameters
Equipment Tag
Pre-Monitoring Calibration Parameter
Slope
(m/s per Hz)
Offset
(m/s)
A1 0.62104 0.21066
A2 0.62139 0.20600
A3 0.62154 0.20057
A4 0.62124 0.19899
A5 0.62199 0.19641
8.2.3 Onsite Wind Measurements
The Board supplied over 12 months of wind data recorded by the onsite monitoring mast. This data included the mean and standard deviation of wind speed and direction. Ten minute samples were provided from 00:00 on 14 November 2014 to 13:00 on 05 June 2015, after this time the logger programme was updated to record 1 minute samples. Jacobs averaged the 1 minute samples to obtain a 10 minute dataset to use for the wind resource analysis.
8.2.3.1 Data Availability
The data coverage and sample validity were checked to obtain the overall data availability16.
Table 8-5 summarises the missing, erroneous, and/or suspicious data samples.
15 The boom orientations in this table, and the wind direction in the data, have been recorded to true north (to match the WAsP model and optimise
the wake loss calculations). For this site true north is 14.0º east of magnetic north. 16 ‘Data coverage’ refers to the proportion of samples recorded; ‘sample validity’ refers to all instruments simultaneously providing valid data; data
availability is the product of ‘data coverage’ and ‘sample validity’.
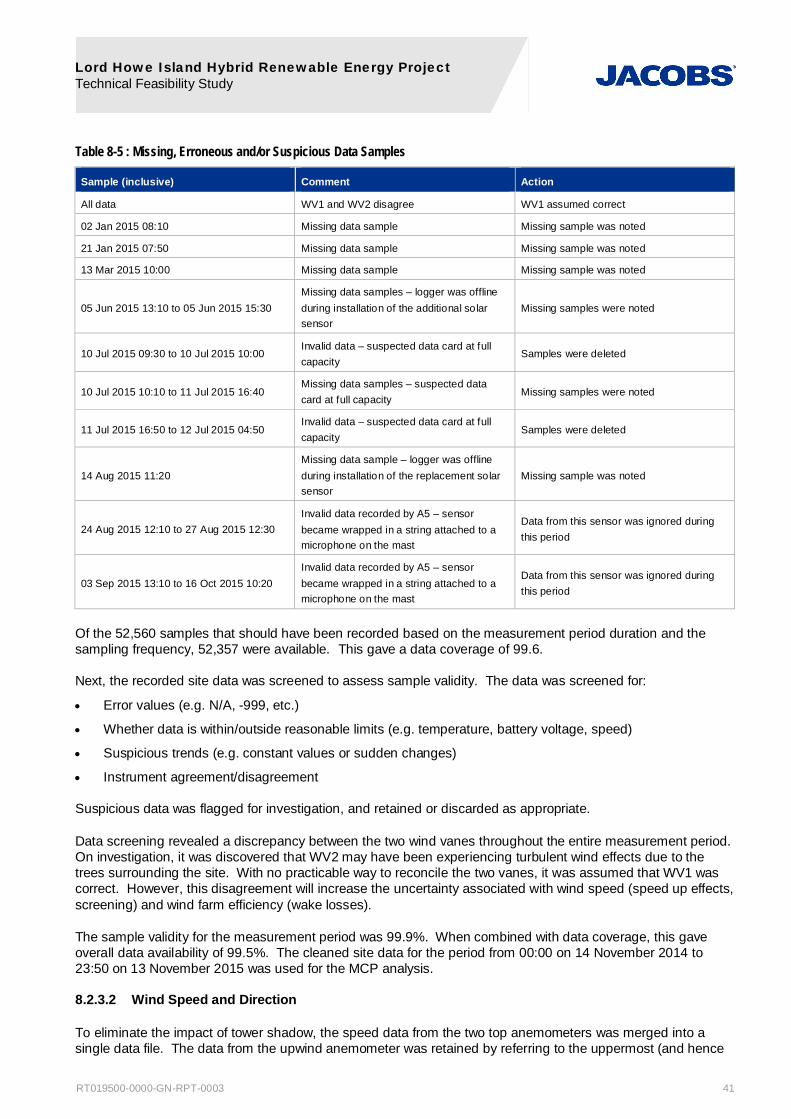
Lord Howe Island Hybrid Renewable Energy Project Technical Feasibility Study
RT019500-0000-GN-RPT-0003 41
Table 8-5 : Missing, Erroneous and/or Suspicious Data Samples
Sample (inclusive) Comment Action
All data WV1 and WV2 disagree WV1 assumed correct
02 Jan 2015 08:10 Missing data sample Missing sample was noted
21 Jan 2015 07:50 Missing data sample Missing sample was noted
13 Mar 2015 10:00 Missing data sample Missing sample was noted
05 Jun 2015 13:10 to 05 Jun 2015 15:30 Missing data samples – logger was offline during installation of the additional solar sensor
Missing samples were noted
10 Jul 2015 09:30 to 10 Jul 2015 10:00 Invalid data – suspected data card at full capacity
Samples were deleted
10 Jul 2015 10:10 to 11 Jul 2015 16:40 Missing data samples – suspected data card at full capacity
Missing samples were noted
11 Jul 2015 16:50 to 12 Jul 2015 04:50 Invalid data – suspected data card at full capacity
Samples were deleted
14 Aug 2015 11:20 Missing data sample – logger was offline during installation of the replacement solar sensor
Missing sample was noted
24 Aug 2015 12:10 to 27 Aug 2015 12:30 Invalid data recorded by A5 – sensor became wrapped in a string attached to a microphone on the mast
Data from this sensor was ignored during this period
03 Sep 2015 13:10 to 16 Oct 2015 10:20 Invalid data recorded by A5 – sensor became wrapped in a string attached to a microphone on the mast
Data from this sensor was ignored during this period
Of the 52,560 samples that should have been recorded based on the measurement period duration and the sampling frequency, 52,357 were available. This gave a data coverage of 99.6.
Next, the recorded site data was screened to assess sample validity. The data was screened for:
Error values (e.g. N/A, -999, etc.)
Whether data is within/outside reasonable limits (e.g. temperature, battery voltage, speed)
Suspicious trends (e.g. constant values or sudden changes)
Instrument agreement/disagreement
Suspicious data was flagged for investigation, and retained or discarded as appropriate.
Data screening revealed a discrepancy between the two wind vanes throughout the entire measurement period. On investigation, it was discovered that WV2 may have been experiencing turbulent wind effects due to the trees surrounding the site. With no practicable way to reconcile the two vanes, it was assumed that WV1 was correct. However, this disagreement will increase the uncertainty associated with wind speed (speed up effects, screening) and wind farm efficiency (wake losses).
The sample validity for the measurement period was 99.9%. When combined with data coverage, this gave overall data availability of 99.5%. The cleaned site data for the period from 00:00 on 14 November 2014 to 23:50 on 13 November 2015 was used for the MCP analysis.
8.2.3.2 Wind Speed and Direction
To eliminate the impact of tower shadow, the speed data from the two top anemometers was merged into a single data file. The data from the upwind anemometer was retained by referring to the uppermost (and hence

Lord Howe Island Hybrid Renewable Energy Project Technical Feasibility Study
RT019500-0000-GN-RPT-0003 42
primary) WV1 wind vane; A1 data was used when 65° WV1 direction < 245° and A2 data otherwise. This gave the site data sample used in the MCP analysis.
For the short term period from 14 November 2014 to 13 November 2015, the mean wind speed at 47.7mAGL was 7.0m/s.
Figure 8-2 provides the site wind speed and directional distributions.
Figure 8-2 : Measured Short Term Site Monitoring Mast Wind Speed and Directional Distributions (A1/A2, WV1)
8.2.3.3 Wind Turbine Site Suitability
An indicative assessment of the wind turbine suitability for the site was performed based on the measured dataset and the IEC 61400-1 Standard (International Electrotechnical Commission, 2005). The basic parameters for wind turbine classes from the IEC Standard are provided in Table 8-6.
Table 8-6 : Wind Turbine Classes
Wind Turbine Class I II III
Vref (m/s) 50.0 42.5 37.5
A Iref (-) 0.16
B Iref (-) 0.14
C Iref (-) 0.12
In the table above, Vref is the reference wind speed average over 10 min and Iref is the expected value of the turbulence intensity (TI) at 15m/s.
The indicative site classification was calculated as Class IIIC.
The potential turbine suppliers have also performed their own initial calculations using the site wind data and provided comments on their turbine’s suitability for site.
Table 8-7 : Proposed Wind Turbine Classifications
Turbine Type Class Suitability for Site
Vergnet GEVMP 32 III Not suitable
Vergnet GEVMP 30 II Suitable
XANT M-21 IA Suitable

Lord Howe Island Hybrid Renewable Energy Project Technical Feasibility Study
RT019500-0000-GN-RPT-0003 43
The Vergnet turbines are classified against Edition 2 of the IEC 61400-1 Standard. Vergnet has indicated that Vergnet GEVMP 32 model is not suitable for installation of the site based on their assessment however Vergnet has confirmed that the GEVMP 30 model rated at a capacity of 200kW is suitable.
XANT did not perform a full site classification assessment but has indicated that the M-21 will be suitable for the Lord Howe Island site.
The site TI, extreme wind speeds and site wind shear have been calculated with results provided in the following sections.
8.2.3.3.1 Turbulence Intensity
The measured short term site data was used to calculate the mean turbulence intensity (TI) at the site monitoring mast at 47.7mAGL. Figure 8-3 shows the results using data for all wind directions. The Class limits shown in Figure 8-3 are based on the IEC 61400-1 Standard (International Electrotechnical Commission, 2005).
Figure 8-3 : Turbulence Intensity at Measurement Height (A1/A2)
The 10 minute mean all-direction TI for 15m/s wind speeds was TI15 = 10.6% which is below the Class C limit as defined in the IEC Standard.
Vergnet also assessed the measured site wind data and calculated a TI of 14.7% when Edition 2 of the IEC61400-1 Standard is applied to the data. Based on this TI, Vergnet has provided confirmation of suitability for site of their GEV MP-C 30m rotor diameter wind turbine with a rated capacity of 200kW. This turbine model has a smaller diameter and capacity than the model used in Revision 1 of the Technical Feasibility Study. The predicted energy yield of both models is provided in Section 8.3.3, to allow a comparison of the results.
Vergnet added that if the actual TI at the site is lower than the calculated TI then there is scope to increase the nominal power of the wind turbines once they are in operation.
8.2.3.3.2 Extreme Wind Speed
Extreme wind speeds were calculated using the long-term Weibull distribution curve for the wind turbines. Based on this, the 50 year extreme wind speed was calculated as 34.8m/s which is below the Class III limit.
0
5
10
15
20
25
30
35
40
45
50
0 5 10 15 20 25
Turb
ulen
ce I
nten
sity
(%
)
Wind Speed (m/s)
Class A Class B Class C Lord Howe Island
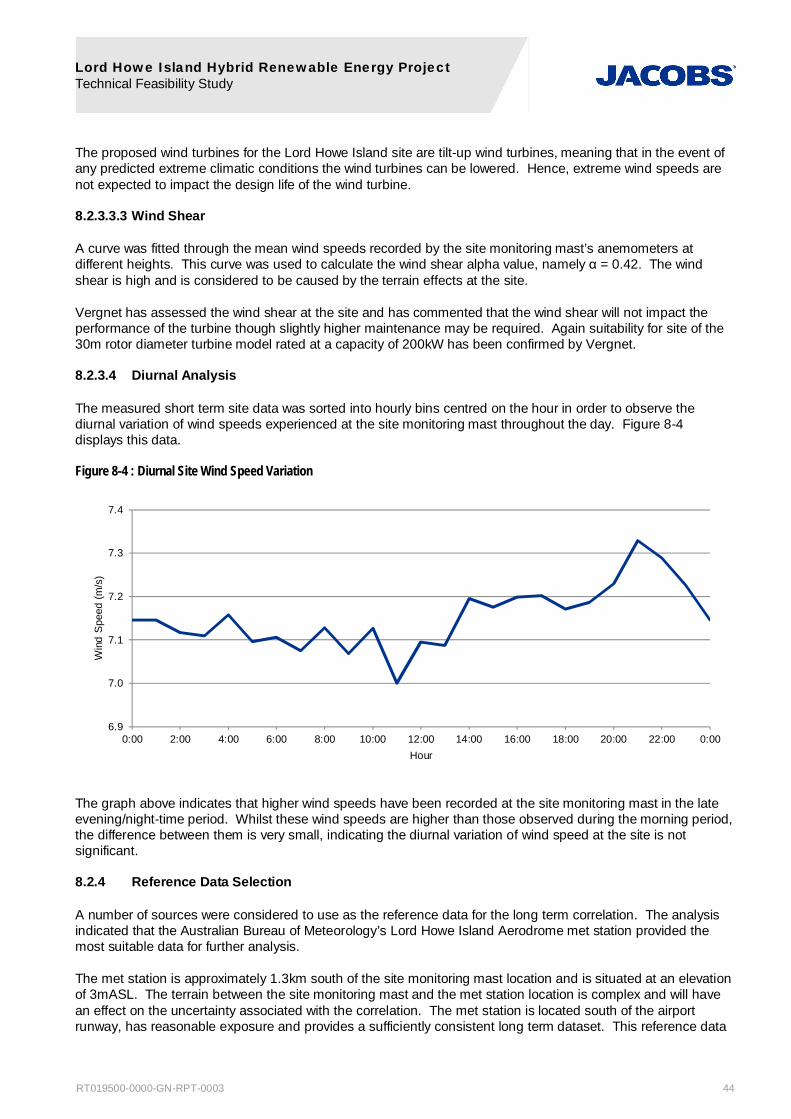
Lord Howe Island Hybrid Renewable Energy Project Technical Feasibility Study
RT019500-0000-GN-RPT-0003 44
The proposed wind turbines for the Lord Howe Island site are tilt-up wind turbines, meaning that in the event of any predicted extreme climatic conditions the wind turbines can be lowered. Hence, extreme wind speeds are not expected to impact the design life of the wind turbine.
8.2.3.3.3 Wind Shear
A curve was fitted through the mean wind speeds recorded by the site monitoring mast’s anemometers at different heights. This curve was used to calculate the wind shear alpha value, namely = 0.42. The wind shear is high and is considered to be caused by the terrain effects at the site.
Vergnet has assessed the wind shear at the site and has commented that the wind shear will not impact the performance of the turbine though slightly higher maintenance may be required. Again suitability for site of the 30m rotor diameter turbine model rated at a capacity of 200kW has been confirmed by Vergnet.
8.2.3.4 Diurnal Analysis
The measured short term site data was sorted into hourly bins centred on the hour in order to observe the diurnal variation of wind speeds experienced at the site monitoring mast throughout the day. Figure 8-4 displays this data.
Figure 8-4 : Diurnal Site Wind Speed Variation
The graph above indicates that higher wind speeds have been recorded at the site monitoring mast in the late evening/night-time period. Whilst these wind speeds are higher than those observed during the morning period, the difference between them is very small, indicating the diurnal variation of wind speed at the site is not significant.
8.2.4 Reference Data Selection
A number of sources were considered to use as the reference data for the long term correlation. The analysis indicated that the Australian Bureau of Meteorology’s Lord Howe Island Aerodrome met station provided the most suitable data for further analysis.
The met station is approximately 1.3km south of the site monitoring mast location and is situated at an elevation of 3mASL. The terrain between the site monitoring mast and the met station location is complex and will have an effect on the uncertainty associated with the correlation. The met station is located south of the airport runway, has reasonable exposure and provides a sufficiently consistent long term dataset. This reference data
6.9
7.0
7.1
7.2
7.3
7.4
0:00 2:00 4:00 6:00 8:00 10:00 12:00 14:00 16:00 18:00 20:00 22:00 0:00
Win
d S
peed
(m/s
)
Hour

Lord Howe Island Hybrid Renewable Energy Project Technical Feasibility Study
RT019500-0000-GN-RPT-0003 45
was also available up to the time of analysis so provided the largest amount of concurrent data required for correlation with the site monitoring mast.
8.2.5 Reference Data Wind Measurements
Lord Howe Island Aerodrome met station data was purchased from the Australian Bureau of Meteorology (BOM) in the form of time series wind speed and direction data. Data from 20 July 1994 to 24 November 2015 was provided, though only data from January 2004 to December 2014 inclusive was used as the long term data for the MCP analysis, as prior to 2004 only hourly data was available. In order to maximise the number of samples available for the MCP analysis, it was decided to correlate half hourly data samples, hence why the data prior to 2004 was not used as part of the long term dataset. This provided 11 years of data without seasonal bias (Australian Bureau of Meteorology, 2015).
The time series wind speed and direction data for the Lord Howe Island Aero met station comprised of 10 minute mean samples taken once per half hour. The reference wind speeds were rounded to the nearest km/hour and wind direction to the nearest 10°. This data was screened and the errors in wind speed and direction were removed.
The mean reference wind speed at 10mAGL for this long term (11 year) period was 5.7m/s and the corresponding data availability was 94.4%.
The short term time series wind speed and direction data for the Lord Howe Island Aerodrome met station was also analysed. This comprised of the period from 14 November 2014 to 13 November 2015 during which site data was also available (the ‘concurrent period’).
The BOM data availability for the short term period from 14 November 2014 to 13 November 2015 was 97.5% and the corresponding mean wind speed was 5.4m/s. This cleaned short term reference data was used in the MCP analysis.
Figure 8-5 and Figure 8-6 show the measured wind distributions at the Lord Howe Island Aerodrome met station for the short term concurrent and long term periods respectively.
Figure 8-5 : Measured Short Term Reference Wind Speed and Directional Distributions (10mAGL)

Lord Howe Island Hybrid Renewable Energy Project Technical Feasibility Study
RT019500-0000-GN-RPT-0003 46
Figure 8-6 : Measured Long Term Reference Wind Speed and Directional Distributions (10mAGL)
8.2.5.1 Reference Data Diurnal Analysis
The long term reference data was sorted into hourly bins centred on the hour in order to observe the diurnal variation of wind speeds experienced at the met station throughout the day. Figure 8-7 displays this data.
Figure 8-7 : Diurnal Reference Wind Speed Variation
The diurnal pattern from the reference wind data shows that the highest wind speeds are experienced in the middle of the daytime, with the peak occurring at 13:00. Overnight the wind speeds are lower with a minimum at 06:00 in the morning. Again the magnitude of the variation in the diurnal trace of the reference wind speeds is small. The difference in the diurnal effects experienced at the reference met station and the site monitoring mast locations could be due to the different terrain in which each mast is located.
8.2.6 Cross Correlation and Data Synthesis
The reference and site data recorded between 14 November 2014 and 13 November 2015 was time matched. This provided a total of 16,974 time-matched samples comprising of one 10 minute mean once per half hour to establish the correlative relationships.
The short term measured site data used in the cross correlation had a mean wind speed of 7.3m/s at 47.7mAGL. The equivalent reference data gave a mean speed of 5.4m/s at 10mAGL at the met station location.
5.3
5.4
5.5
5.6
5.7
5.8
5.9
6.0
6.1
6.2
0:00 2:00 4:00 6:00 8:00 10:00 12:00 14:00 16:00 18:00 20:00 22:00 0:00
Win
d S
peed
(m/s
)
Hour

Lord Howe Island Hybrid Renewable Energy Project Technical Feasibility Study
RT019500-0000-GN-RPT-0003 47
A 12-sector Weibull curve correlation methodology was used to establish relationships between the site and reference wind speed distributions. Unlike traditional linear regression analyses which establish relationships based solely on instantaneous wind speed, the Weibull curve correlation methodology is based on the wind speed distribution as per the set of IEC61400 Standards. This yields more representative results that better reflect the relationship between the site and reference environments.
The Weibull parameters for the reference and site monitoring mast locations were determined for each direction sector. This was done using a specially developed optimisation process that minimises the differences in energy production, mean wind speed cubed, and mean wind speed associated with the synthesised and measured site data.
The wind roses for the concurrent period show that the prevailing winds at the site came from the southeast and at the reference location from the east. To address this, a directional correlation between the site and reference wind data was performed to obtain a relationship between the two. The reference wind direction was used as the ‘reference direction’, thereby allowing synthesis of the site direction from the long term reference data.
Table 8-8 shows the parameters used and the results in the form of the corresponding bin directions, number of samples, mean wind speeds (U), and Weibull scale (A) and shape (k) parameters. The size and limits of the site directional bins have been optimised to match the fixed bin widths used for the reference data. Bin directions are based on true north.
Table 8-8 : Weibull Correlation Results
Reference Data Bins Site Data Bins Reference Data Site Data
Sta
rt (°
)
Mid
(°)
End
(°)
Sam
ples
Sta
rt (°
)
Mid
(°)
End
(°)
Sam
ples
U (m
/s)
A (m
/s)
k (-)
U (m
/s)
A (m
/s)
k (-)
345 0 15 888 337 347 357 993 3.5 4.0 3.3 7.8 8.5 3.0
15 30 45 1688 357 14 32 1663 5.6 6.2 2.7 8.4 9.4 2.7
45 60 75 2470 32 56 81 2543 6.7 7.4 2.6 7.8 8.6 2.1
75 90 105 3312 81 104 128 3452 6.6 7.4 3.0 6.2 6.8 2.2
105 120 135 1388 128 129 129 125 3.3 3.6 2.7 7.2 8.1 2.7
135 150 165 759 129 144 158 1483 2.5 2.8 2.7 5.7 6.3 2.1
165 180 195 515 158 170 182 957 2.8 3.1 2.0 5.8 6.2 1.7
195 210 225 1851 182 195 209 1672 5.0 5.6 2.7 8.0 8.9 2.1
225 240 255 1699 209 229 249 1663 6.8 7.6 2.3 9.0 10.2 2.2
255 270 285 1009 249 269 290 1092 6.2 6.9 2.1 7.1 7.8 2.1
285 300 315 688 290 301 312 655 3.7 4.1 3.1 7.2 7.9 2.8
315 330 345 707 312 325 337 676 3.6 4.0 3.4 7.3 8.0 3.5
The correlative relationships were applied to the long term reference data to predict the long term wind resource at the site monitoring mast, yielding the results shown in Figure 8-8. The long term synthesised wind speed at the site monitoring mast was 7.7m/s at 47.7mAGL and the wind had a prevailing south-easterly direction.
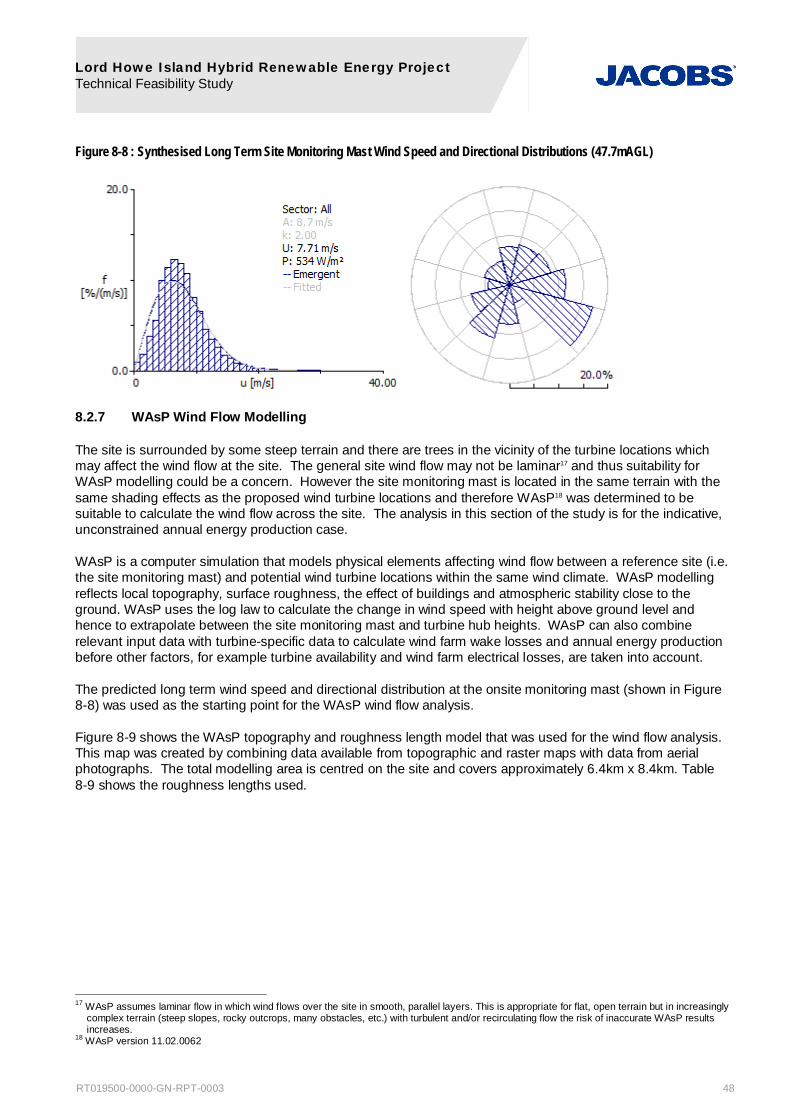
Lord Howe Island Hybrid Renewable Energy Project Technical Feasibility Study
RT019500-0000-GN-RPT-0003 48
Figure 8-8 : Synthesised Long Term Site Monitoring Mast Wind Speed and Directional Distributions (47.7mAGL)
8.2.7 WAsP Wind Flow Modelling
The site is surrounded by some steep terrain and there are trees in the vicinity of the turbine locations which may affect the wind flow at the site. The general site wind flow may not be laminar17 and thus suitability for WAsP modelling could be a concern. However the site monitoring mast is located in the same terrain with the same shading effects as the proposed wind turbine locations and therefore WAsP18 was determined to be suitable to calculate the wind flow across the site. The analysis in this section of the study is for the indicative, unconstrained annual energy production case.
WAsP is a computer simulation that models physical elements affecting wind flow between a reference site (i.e. the site monitoring mast) and potential wind turbine locations within the same wind climate. WAsP modelling reflects local topography, surface roughness, the effect of buildings and atmospheric stability close to the ground. WAsP uses the log law to calculate the change in wind speed with height above ground level and hence to extrapolate between the site monitoring mast and turbine hub heights. WAsP can also combine relevant input data with turbine-specific data to calculate wind farm wake losses and annual energy production before other factors, for example turbine availability and wind farm electrical losses, are taken into account.
The predicted long term wind speed and directional distribution at the onsite monitoring mast (shown in Figure 8-8) was used as the starting point for the WAsP wind flow analysis.
Figure 8-9 shows the WAsP topography and roughness length model that was used for the wind flow analysis. This map was created by combining data available from topographic and raster maps with data from aerial photographs. The total modelling area is centred on the site and covers approximately 6.4km x 8.4km. Table 8-9 shows the roughness lengths used.
17 WAsP assumes laminar flow in which wind flows over the site in smooth, parallel layers. This is appropriate for flat, open terrain but in increasingly
complex terrain (steep slopes, rocky outcrops, many obstacles, etc.) with turbulent and/or recirculating flow the risk of inaccurate WAsP results increases.
18 WAsP version 11.02.0062

Lord Howe Island Hybrid Renewable Energy Project Technical Feasibility Study
RT019500-0000-GN-RPT-0003 49
Figure 8-9 : WAsP Topography and Roughness Length Models
Table 8-9 : Roughness Lengths Used in WAsP
Terrain Surface Characteristics Roughness Length
(m)
Forest 0.80
Suburbs 0.50
Many trees and/or bushes 0.20
Water (required value) 0.00
Table 8-10 and Table 8-11 give the WAsP calculated wind resource parameters at the proposed turbine locations. These values, and the energy yield data calculated from them in Section 8.3, are a function of the turbine positions and their surroundings. These values could change if turbines are micro-sited and/or if surroundings alter.
Table 8-10 : WAsP Wind Resource Results – GEVMP 32 275kW and GEVMP 30 200kW Layouts
Turbine Easting
(m)
Northing
(m)
Height
(mAGL)
Wind Speed
(m/s)
A
(m/s)
k
(-)
T01 507064 6511667 55.0 7.3 8.2 2.0
T02 507157 6511661 55.0 7.5 8.5 2.0
MEAN 507110 6511664 55.0 7.4 8.4 2.0
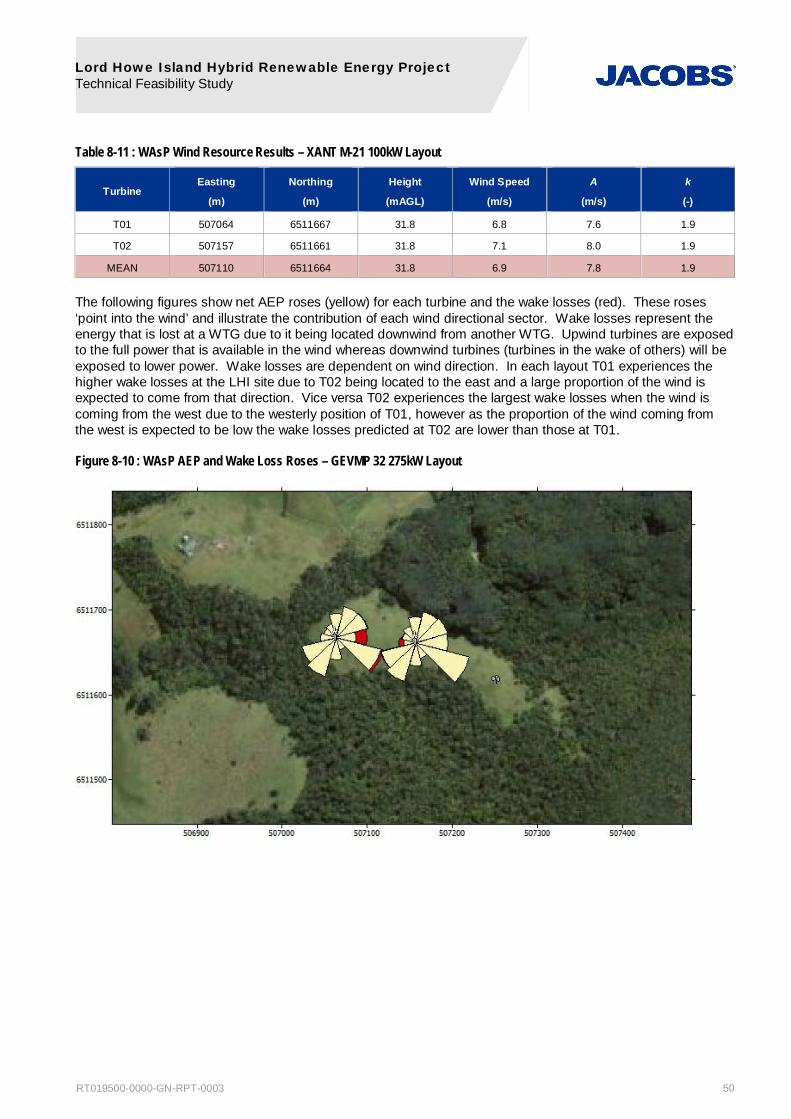
Lord Howe Island Hybrid Renewable Energy Project Technical Feasibility Study
RT019500-0000-GN-RPT-0003 50
Table 8-11 : WAsP Wind Resource Results – XANT M-21 100kW Layout
Turbine Easting
(m)
Northing
(m)
Height
(mAGL)
Wind Speed
(m/s)
A
(m/s)
k
(-)
T01 507064 6511667 31.8 6.8 7.6 1.9
T02 507157 6511661 31.8 7.1 8.0 1.9
MEAN 507110 6511664 31.8 6.9 7.8 1.9
The following figures show net AEP roses (yellow) for each turbine and the wake losses (red). These roses ‘point into the wind’ and illustrate the contribution of each wind directional sector. Wake losses represent the energy that is lost at a WTG due to it being located downwind from another WTG. Upwind turbines are exposed to the full power that is available in the wind whereas downwind turbines (turbines in the wake of others) will be exposed to lower power. Wake losses are dependent on wind direction. In each layout T01 experiences the higher wake losses at the LHI site due to T02 being located to the east and a large proportion of the wind is expected to come from that direction. Vice versa T02 experiences the largest wake losses when the wind is coming from the west due to the westerly position of T01, however as the proportion of the wind coming from the west is expected to be low the wake losses predicted at T02 are lower than those at T01.
Figure 8-10 : WAsP AEP and Wake Loss Roses – GEVMP 32 275kW Layout

Lord Howe Island Hybrid Renewable Energy Project Technical Feasibility Study
RT019500-0000-GN-RPT-0003 51
Figure 8-11 : WAsP AEP and Wake Loss Roses – GEVMP 30 200kW Layout
Figure 8-12 : WAsP AEP and Wake Loss Roses – XANT M-21 100kW Layout

Lord Howe Island Hybrid Renewable Energy Project Technical Feasibility Study
RT019500-0000-GN-RPT-0003 52
8.2.8 Site Air Density
The local site air density at hub height was calculated using elevation data, long term temperature data from the Lord Howe Island Aerodrome met station from January 2004 to December 2014, and standard lapse rate assumptions19. Using a mean elevation of 62.8mASL plus the 55.0mAGL and 31.0mAGL hub heights for the different turbines, and an estimated mean annual temperature of 19.9°C, site-specific mean annual hub height air densities of = 1.189kg/m3 and = 1.192kg/m3 were obtained for the Vergnet and XANT turbine layouts respectively. These are 2.9% and 2.7% lower than the standard reference air density of 1.225kg/m3 and hence, for a given wind speed, will result in less wind energy. This is not considered to be significant in the scheme of the project and adjustments to the power curves to account for the lower air densities are discussed in Section 8.3.2.
8.2.9 Wind Speed Variability
An investigation into the short term wind speed variation was performed in order to understand the potential required spinning reserve of the system.
The cleaned 1 minute dataset recorded at the site mast from 05 June 2015 15:37 to 04 December 2015 10:13 was used to perform the analysis. This unadjusted wind dataset was used providing 259,132 valid samples to assess. Note the wind resource at the turbines is lower than the measured data due to the topographical variations between the met mast and wind turbine locations and hence the variability may be reduced.
The maximum and minimum step changes in contiguous wind speed samples are indicated in Table 8-12.
Table 8-12 : Wind Speed Maximum and Minimum Variation
Extreme Timestamp Wind Speed (m/s) Wind Speed Variation
(m/s) From To
Minimum 12 August 2015 19:33 24.4 15.0 -9.4
Maximum 12 August 2015 19:31 10.6 24.5 13.9
The samples provided in the table above occurred within two minutes of each other indicating a large step-up in wind speed which then dropped off again quickly. This particular period is not expected to impact the operating reserve as although large variations had been observed, the wind speeds at which they occurred are generally at or close to when the turbine would be operating at rated power and hence the power variation would not be significant. The potential turbine models are also not expected to react quickly enough to a sharp peak in wind speed such as experienced in this period, and again this would not have a strong implication on the operating reserve.
These samples were sorted into 0.1m/s bins based on the wind speed variation, and this data has been plotted in Figure 8-13.
19 Air density decreases as temperature increases (air expands) and/or as elevation increases (atmospheric pressure falls). Standard lapse rate
assumptions relate to how pressure falls with elevation.

Lord Howe Island Hybrid Renewable Energy Project Technical Feasibility Study
RT019500-0000-GN-RPT-0003 53
Figure 8-13 : Wind Speed Step Variations
The majority (99.7%) of the wind speed step variations lie within the -4.0m/s to 4.0m/s range.
The wind speed variations of most significance occur in the mid-range when the wind speed steps up to rated wind speed or vice versa. These wind speed variations will have the largest impact on the power output variation of the wind turbines and were focussed on in the analysis. This analysis ignored the inertia of the WTG which will slow the rate of change of the power output.
Initially wind speeds between 6m/s and 9m/s were investigated with wind speed step-up variations of 4m/s and above. This range would occur when the power output of the wind turbine would increase suddenly. There were 163 samples that satisfied this range, only 0.06% of the valid dataset. Figure 8-14 shows the number of occurrences in the range investigated.
Figure 8-14 : Wind Speed Step Up Variations Above 4m/s – 6m/s to 9m/s Range
0
2000
4000
6000
8000
10000
12000
14000
16000
18000
20000
Num
ber
of O
ccur
renc
es
Wind Speed Step Variation (m/s)
0
2
4
6
8
10
12
14
16
18
20
Num
ber
of O
ccur
renc
es
Wind Speed Step Variation (m/s)

Lord Howe Island Hybrid Renewable Energy Project Technical Feasibility Study
RT019500-0000-GN-RPT-0003 54
The graph above shows that there are not a large amount of instances where a step up of 4m/s is observed from wind speeds in the range from 6m/s to 9m/s.
An alternative range was also investigated which considered instances where wind turbine power could drop rapidly from rated power output. A wind speed range between 11m/s to 15m/s was assessed looking at wind speed drops of 3m/s and above. A total of 522 samples satisfied these criteria representing 0.22% of the valid dataset, and these samples are presented in Figure 8-15.
Figure 8-15 : Wind Speed Step Down Variations Above 3m/s – 11m/s to 15m/s Range
Similarly to the step up wind speed variations, the wind speed step down variations do not occur frequently, making the design of the battery system and spinning reserve requirements quite feasible.
8.3 Wind Energy Yield Analysis
8.3.1 Summary
Table 8-13 summarises the key results from the unconstrained wind energy yield analysis for the Lord Howe Island site.
Table 8-13 : Key Energy Yield Results
Layout P50 AEP (MWh/year) Net P90 AEP (MWh/year) Net P50 Capacity
Factor
(%) Gross Net 1 Year 10 Year
2 x GEVMP 32 275kW 1691.0 1535.8 1253.8 1321.2 31.9
2 x GEVMP 30 200kW 1326.0 1209.9 1000.4 1050.3 34.5
2 x XANT M-21 100kW 627.7 572.2 472.4 489.8 32.7
These results are derived from the site wind resource data and WAsP model described in Section 8.2. WAsP was used together with the proposed turbine locations, turbine power and thrust curves, and wind farm losses to calculate the gross AEP and the AEP net of all losses. An uncertainty analysis was then performed to calculate how the AEP changes with the Probability of Exceedance (PoE).
0
10
20
30
40
50
60
70
80
Num
ber
of O
ccur
renc
es
Wind Speed Step Variation (m/s)

Lord Howe Island Hybrid Renewable Energy Project Technical Feasibility Study
RT019500-0000-GN-RPT-0003 55
8.3.2 Turbine Data
The AEP was calculated using Vergnet ( (Vergnet, 2009), (Vergnet, 2012), (Vergnet, 2014), (Vergnet, 2012)) and XANT ( (XANT, 2015)) supplied turbine power and thrust (Ct) curves as per the turbine locations provided in Table 1-2. Table 8-14 provides key turbine parameters. The site-specific power curves in Figure 8-16 to Figure 8-18 were obtained by correcting the unadjusted reference power curves to the calculated mean site air densities at hub height.
Table 8-14 : Key Turbine Parameters
Turbine Type Capacity
(kW)
Hub Height
(mAGL)
Rotor Diameter
(m)
Vergnet GEVMP 32 275.0 55.0 32.0
Vergnet GEVMP 30 200.0 55.0 30.0
XANT M-21 100.0 31.8 21.0
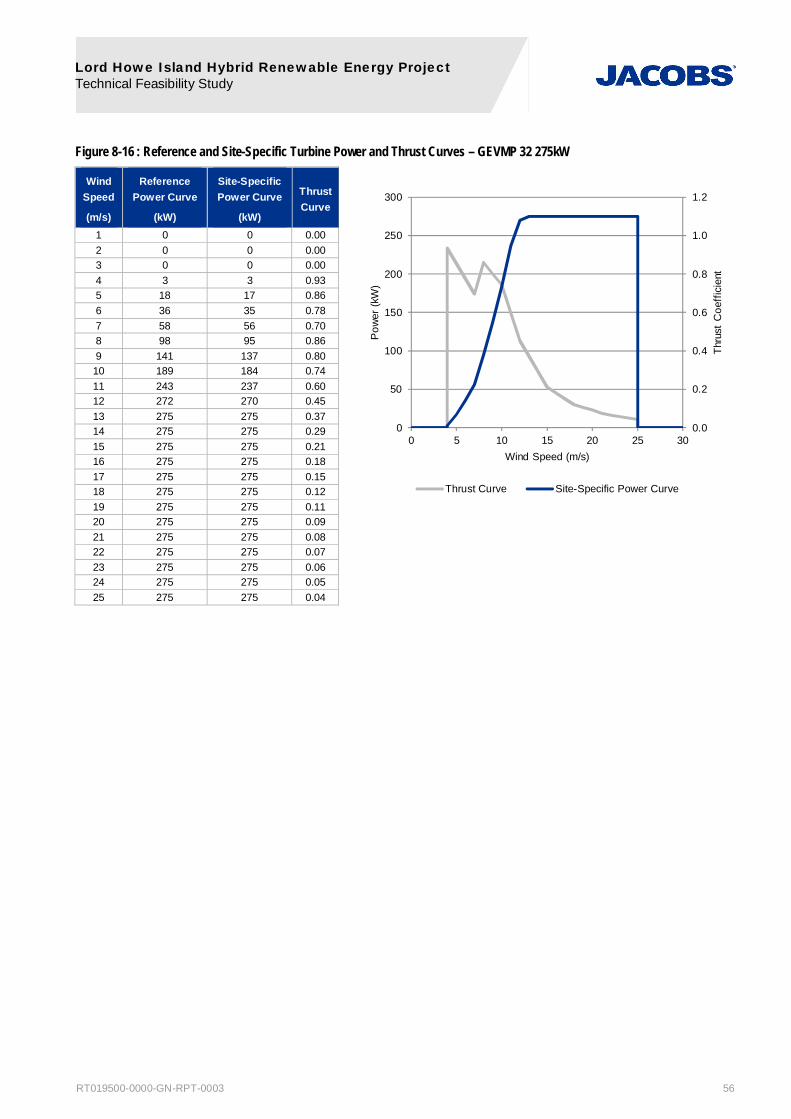
Lord Howe Island Hybrid Renewable Energy Project Technical Feasibility Study
RT019500-0000-GN-RPT-0003 56
Figure 8-16 : Reference and Site-Specific Turbine Power and Thrust Curves – GEVMP 32 275kW
0
50
100
150
200
250
300
0.0
0.2
0.4
0.6
0.8
1.0
1.2
0 5 10 15 20 25 30
Thru
st C
oeffi
cien
t
Pow
er (k
W)
Wind Speed (m/s)
Thrust Curve Site-Specific Power Curve
Wind Speed
(m/s)
Reference Power Curve
(kW)
Site-Specific Power Curve
(kW)
Thrust Curve
1 0 0 0.00 2 0 0 0.00 3 0 0 0.00 4 3 3 0.93 5 18 17 0.86 6 36 35 0.78 7 58 56 0.70 8 98 95 0.86 9 141 137 0.80 10 189 184 0.74 11 243 237 0.60 12 272 270 0.45 13 275 275 0.37 14 275 275 0.29 15 275 275 0.21 16 275 275 0.18 17 275 275 0.15 18 275 275 0.12 19 275 275 0.11 20 275 275 0.09 21 275 275 0.08 22 275 275 0.07 23 275 275 0.06 24 275 275 0.05 25 275 275 0.04

Lord Howe Island Hybrid Renewable Energy Project Technical Feasibility Study
RT019500-0000-GN-RPT-0003 57
Figure 8-17 : Reference and Site-Specific Turbine Power and Thrust Curves – GEVMP 30 200kW
0
50
100
150
200
250
300
0.0
0.2
0.4
0.6
0.8
1.0
1.2
0 5 10 15 20 25 30
Thru
st C
oeffi
cien
t
Pow
er (k
W)
Wind Speed (m/s)
Thrust Curve Site-Specific Power Curve
Wind Speed
(m/s)
Reference Power Curve
(kW)
Site-Specific Power Curve
(kW)
Thrust Curve
1 0 0 0.00 2 0 0 0.00 3 0 0 0.00 4 3 3 0.92 5 14 13 0.80 6 29 28 0.69 7 53 51 0.57 8 82 80 0.82 9 116 113 0.75 10 154 150 0.68 11 190 187 0.58 12 200 200 0.47 13 200 200 0.37 14 200 200 0.27 15 200 200 0.18 16 200 200 0.15 17 200 200 0.13 18 200 200 0.10 19 200 200 0.09 20 200 200 0.08 21 200 200 0.06 22 200 200 0.05 23 200 200 0.05 24 200 200 0.04 25 200 200 0.04

Lord Howe Island Hybrid Renewable Energy Project Technical Feasibility Study
RT019500-0000-GN-RPT-0003 58
Figure 8-18 : Reference and Site-Specific Turbine Power and Thrust Curves – XANT M-21 100kW
0
20
40
60
80
100
120
140
0.0
0.5
1.0
1.5
2.0
2.5
3.0
3.5
0 5 10 15 20 25 30
Thru
st C
oeffi
cien
t
Pow
er (k
W)
Wind Speed (m/s)
Thrust Curve Site-Specific Power Curve
Wind Speed
(m/s)
Reference Power Curve
(kW)
Site-Specific Power Curve
(kW)
Thrust Curve
1 0 0 0.00 2 0 0 0.00 3 2 2 3.12 4 6 5 2.85 5 11 11 2.58 6 20 19 2.15 7 30 29 1.72 8 45 44 1.38 9 63 61 1.04 10 83 81 0.89 11 100 97 0.74 12 100 97 0.67 13 100 97 0.59 14 100 97 0.55 15 100 97 0.50 16 96 93 0.48 17 86 84 0.46 18 75 73 0.41 19 67 65 0.36 20 60 58 0.34 21 0 0 0.00 22 0 0 0.00 23 0 0 0.00 24 0 0 0.00 25 0 0 0.00
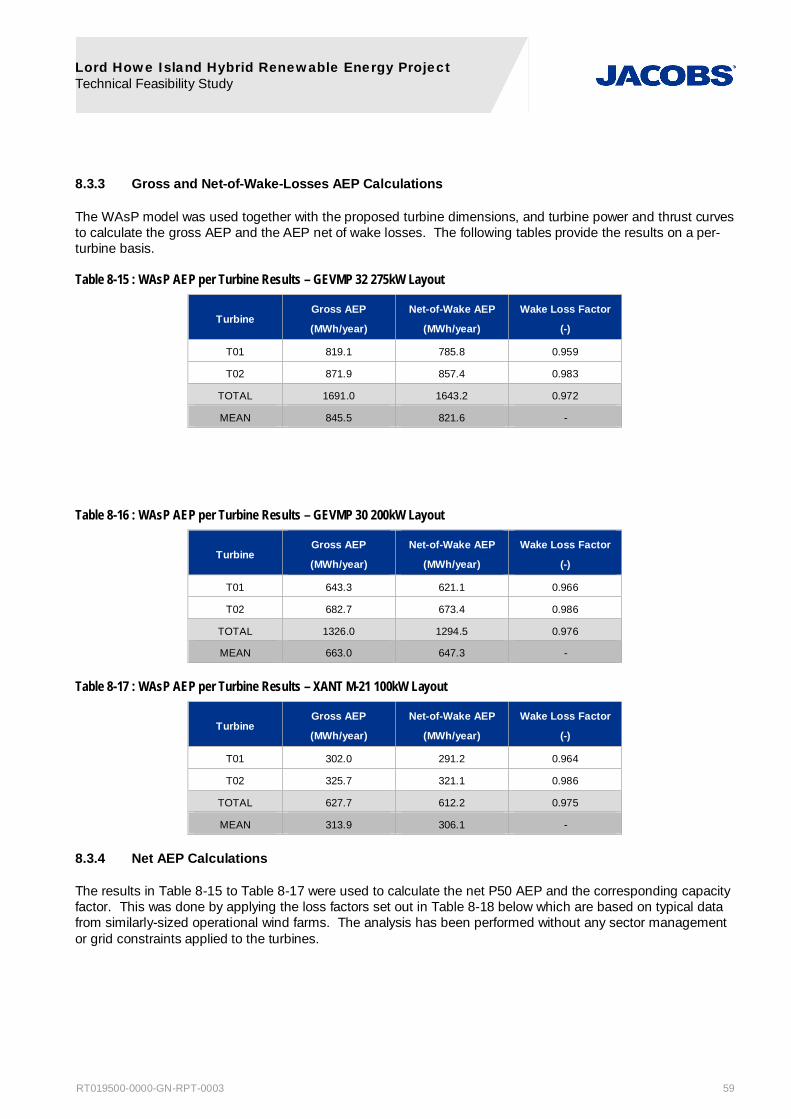
Lord Howe Island Hybrid Renewable Energy Project Technical Feasibility Study
RT019500-0000-GN-RPT-0003 59
8.3.3 Gross and Net-of-Wake-Losses AEP Calculations
The WAsP model was used together with the proposed turbine dimensions, and turbine power and thrust curves to calculate the gross AEP and the AEP net of wake losses. The following tables provide the results on a per-turbine basis.
Table 8-15 : WAsP AEP per Turbine Results – GEVMP 32 275kW Layout
Turbine Gross AEP
(MWh/year)
Net-of-Wake AEP
(MWh/year)
Wake Loss Factor
(-)
T01 819.1 785.8 0.959
T02 871.9 857.4 0.983
TOTAL 1691.0 1643.2 0.972
MEAN 845.5 821.6 -
Table 8-16 : WAsP AEP per Turbine Results – GEVMP 30 200kW Layout
Turbine Gross AEP
(MWh/year)
Net-of-Wake AEP
(MWh/year)
Wake Loss Factor
(-)
T01 643.3 621.1 0.966
T02 682.7 673.4 0.986
TOTAL 1326.0 1294.5 0.976
MEAN 663.0 647.3 -
Table 8-17 : WAsP AEP per Turbine Results – XANT M-21 100kW Layout
Turbine Gross AEP
(MWh/year)
Net-of-Wake AEP
(MWh/year)
Wake Loss Factor
(-)
T01 302.0 291.2 0.964
T02 325.7 321.1 0.986
TOTAL 627.7 612.2 0.975
MEAN 313.9 306.1 -
8.3.4 Net AEP Calculations
The results in Table 8-15 to Table 8-17 were used to calculate the net P50 AEP and the corresponding capacity factor. This was done by applying the loss factors set out in Table 8-18 below which are based on typical data from similarly-sized operational wind farms. The analysis has been performed without any sector management or grid constraints applied to the turbines.
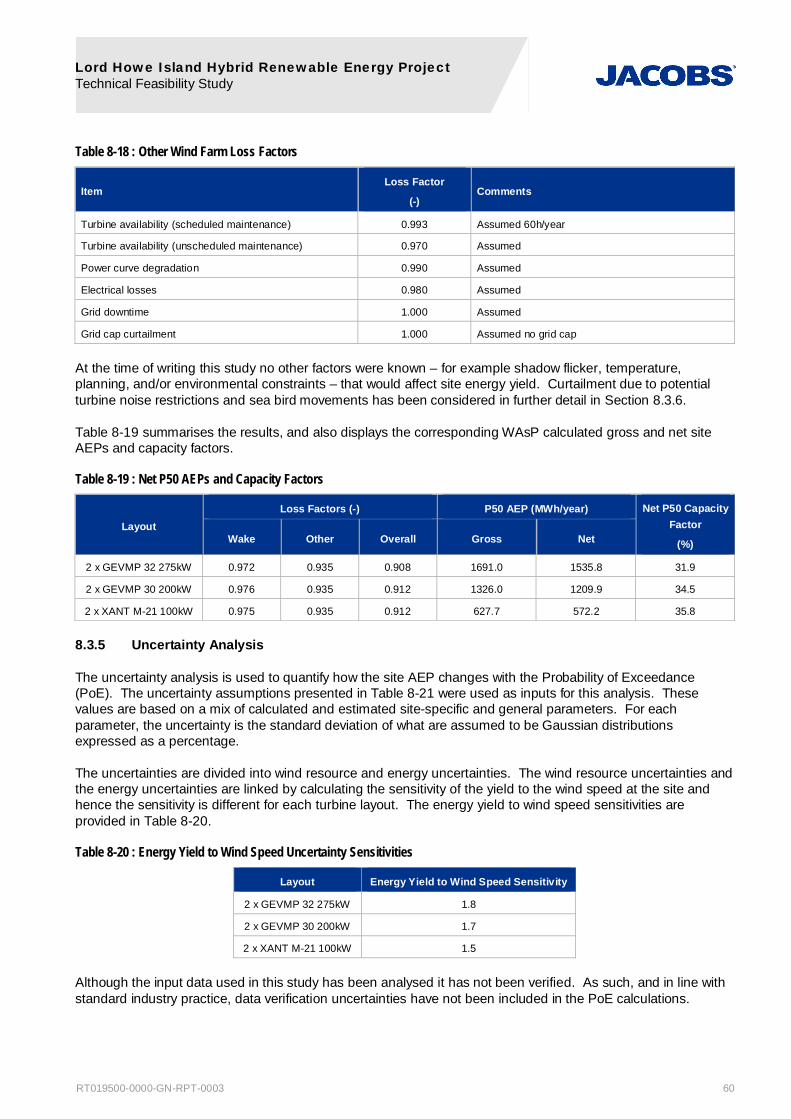
Lord Howe Island Hybrid Renewable Energy Project Technical Feasibility Study
RT019500-0000-GN-RPT-0003 60
Table 8-18 : Other Wind Farm Loss Factors
Item Loss Factor
(-) Comments
Turbine availability (scheduled maintenance) 0.993 Assumed 60h/year
Turbine availability (unscheduled maintenance) 0.970 Assumed
Power curve degradation 0.990 Assumed
Electrical losses 0.980 Assumed
Grid downtime 1.000 Assumed
Grid cap curtailment 1.000 Assumed no grid cap
At the time of writing this study no other factors were known – for example shadow flicker, temperature, planning, and/or environmental constraints – that would affect site energy yield. Curtailment due to potential turbine noise restrictions and sea bird movements has been considered in further detail in Section 8.3.6.
Table 8-19 summarises the results, and also displays the corresponding WAsP calculated gross and net site AEPs and capacity factors.
Table 8-19 : Net P50 AEPs and Capacity Factors
Layout Loss Factors (-) P50 AEP (MWh/year) Net P50 Capacity
Factor
(%) Wake Other Overall Gross Net
2 x GEVMP 32 275kW 0.972 0.935 0.908 1691.0 1535.8 31.9
2 x GEVMP 30 200kW 0.976 0.935 0.912 1326.0 1209.9 34.5
2 x XANT M-21 100kW 0.975 0.935 0.912 627.7 572.2 35.8
8.3.5 Uncertainty Analysis
The uncertainty analysis is used to quantify how the site AEP changes with the Probability of Exceedance (PoE). The uncertainty assumptions presented in Table 8-21 were used as inputs for this analysis. These values are based on a mix of calculated and estimated site-specific and general parameters. For each parameter, the uncertainty is the standard deviation of what are assumed to be Gaussian distributions expressed as a percentage.
The uncertainties are divided into wind resource and energy uncertainties. The wind resource uncertainties and the energy uncertainties are linked by calculating the sensitivity of the yield to the wind speed at the site and hence the sensitivity is different for each turbine layout. The energy yield to wind speed sensitivities are provided in Table 8-20.
Table 8-20 : Energy Yield to Wind Speed Uncertainty Sensitivities
Layout Energy Yield to Wind Speed Sensitivity
2 x GEVMP 32 275kW 1.8
2 x GEVMP 30 200kW 1.7
2 x XANT M-21 100kW 1.5
Although the input data used in this study has been analysed it has not been verified. As such, and in line with standard industry practice, data verification uncertainties have not been included in the PoE calculations.

Lord Howe Island Hybrid Renewable Energy Project Technical Feasibility Study
RT019500-0000-GN-RPT-0003 61
Table 8-21 : Uncertainty Assumptions
Item Value
(%) Comment
Wind Resource Uncertainties
Inter-annual wind speed variability 5.4 / n Based on 5.4% inter-annual variability for 1-year period Used to calculate the uncertainty over n-year time periods (here n = 1, 5, 10, 15 and 20 years)
Long term wind speed uncertainty 1.6 Based on 5.4% inter-annual variability for 1-year period
5.4%/ 11 years (reference data length)
Site monitoring mast measurement uncertainty
2.5
Estimate
MEASNET calibrated anemometers
Wind vane disagreement imposes wind speed uncertainty (speed up effects, screening)
Site extrapolation uncertainty 4.8 for 55.0mAGL
6.5 for 31.8mAGL
Estimate based on calculations in WAsP
Horizontal extrapolation across the site (dRIX = -0.4%)
Vertical extrapolation from 47.7mAGL to hub height
Energy Uncertainties
Correlation uncertainty 1.3
Calculated using concurrent site and reference data. Short term correlative relationship assumed to be similar to long term correlative relationship, e.g. no change in obstacles or roughness at the site and met station.
Power curve uncertainty 1.0 Standard Jacobs assumption
Wind farm efficiency uncertainty 1.2 Standard Jacobs assumption is 1.0%. However, wind vane disagreement imposes extra wake loss uncertainty.
Table 8-22 shows the resulting total standard energy yield uncertainties for different time periods.
Table 8-22 : Total Standard Energy Uncertainty for Different Periods
Period GEVMP 32 275kW
Uncertainty
(%)
GEVMP 30 200kW Uncertainty
(%)
XANT M-21 100kW Uncertainty
(%)
1 Year 14.3 13.5 13.6
5 Year 11.3 10.7 11.5
10 Year 10.9 10.3 11.2
15 Year 10.8 10.2 11.1
20 Year 10.7 10.1 11.1
The following tables provide the specific net AEPs for key PoEs.
Table 8-23 : Net AEP PoE Results for Different Periods – GEVMP 32 275kW Layout
PoE Net AEP (GWh/year)
1 Year 5 Year 10 Year 15 Year 20 Year
50% 1535.8 1535.8 1535.8 1535.8 1535.8
75% 1387.4 1418.3 1422.8 1424.3 1425.1
90% 1253.8 1312.7 1321.2 1324.1 1325.5
99% 1023.9 1130.8 1146.2 1151.5 1154.1

Lord Howe Island Hybrid Renewable Energy Project Technical Feasibility Study
RT019500-0000-GN-RPT-0003 62
Table 8-24 : Net AEP PoE Results for Different Periods – GEVMP 30 200kW Layout
PoE Net AEP (GWh/year)
1 Year 5 Year 10 Year 15 Year 20 Year
50% 1209.9 1209.9 1209.9 1209.9 1209.9
75% 1099.6 1122.6 1125.9 1127.0 1127.6
90% 1000.4 1044.0 1050.3 1052.4 1053.5
99% 829.6 908.7 920.1 924.0 926.0
Table 8-25 : Net AEP PoE Results for Different Periods – XANT M-21 100kW Layout
PoE Net AEP (GWh/year)
1 Year 5 Year 10 Year 15 Year 20 Year
50% 572.2 572.2 572.2 572.2 572.2
75% 519.7 527.7 528.9 529.2 529.4
90% 472.4 487.7 489.8 490.6 490.9
99% 391.0 418.8 422.7 424.0 424.7
8.3.6 Wind Energy Curtailment
Impacts of curtailment options which may be applied to the wind turbines at Lord Howe Island were investigated to assess the impact on the AEP. Three curtailment scenarios were considered, these were:
9) Bird curtailment
10) Noise curtailment
11) Noise and bird curtailment applied simultaneously
The representative annual wind 30 minute time series dataset and the Vergnet GEVMP 30 200kW power curve provided in Figure 8-17 were used to perform the curtailment analysis.
Based on information provided by the Board, turbine curtailment due to birds followed the following parameters:
Applied between 15 September and 15 May every year
Turbine shutdown from 15 minutes prior to sunset to 60 minutes after sunset
Noise curtailment was applied based on the following parameters:
Applied between 20:00 to 07:00, all year round
Turbine shutdown when the wind comes from the northeast through to the south. This large sector has been conservatively selected based on the locations of the nearest residences and accommodation providers. More detailed modelling and/or site measurements would likely enable the reduction in the size of this affected sector.
Turbine shutdown for all wind speeds
The total losses based on the scenarios described above were calculated and are presented in Table 8-26. These results are indicative only and wind turbine curtailment may not be required at Lord Howe Island.

Lord Howe Island Hybrid Renewable Energy Project Technical Feasibility Study
RT019500-0000-GN-RPT-0003 63
Table 8-26 : Curtailment Losses – GEVMP 30 200kW Layout
Curtailment Curtailment Loss (%) from the
uncurtailed Net AEP of 1209.9MWh/year
Net AEP Including Curtailment
(MWh/year)
Bird 4.1 1160.5
Noise 19.1 978.6
Bird and noise 23.2 929.3
The results indicate that the curtailment configurations assessed will impact the energy production of the wind turbines, with the noise curtailment significantly reducing the production. The noise curtailment parameters applied in this analysis are however considered worst-case. It is likely that any noise curtailment that was to be implemented at the site would have less stringent constraints such as only being;
Applied for part(s) of the year – Pine Trees resort which is the most likely affected receiver for easterly weather is shut in winter;
Applied for certain wind speeds; and
Based on actual site noise measurements. It is possible that due to the local terrain and vegetation that curtailment is not required.
Further refined curtailment configurations which satisfy bird and noise restrictions but do not impact the turbine operation as significantly as those applied as part of this assessment, can be considered as community consultation continues, additional site wind data is obtained and a wind turbine model is chosen.

Lord Howe Island Hybrid Renewable Energy Project Technical Feasibility Study
RT019500-0000-GN-RPT-0003 64
9. Solar Resource 9.1 Introduction
This section describes the solar assessment steps that were undertaken in this study.
It describes the onsite solar monitoring equipment and provides details on the site data recorded during the last 12 months between November 2014 and November 2015. The on-site data has been correlated with a long term solar irradiance data from SolarGIS in order to account for inter annual variations. SolarGIS data is based on satellite information and weather models. The resulting correlated data is expected to be representative of the long term solar irradiance at Lord Howe Island.
The synthesised long term solar irradiance data was used to calculate the expected solar energy production using PVsyst for the two options of Board proposed 450kWpAC and 550kWpAC solar PV installations (LHIB Solar), as well as for the existing 83kWpAC and approved total of 120kWpAC of Private Solar PV.
9.2 Solar Resource Analysis
9.2.1 Site Solar Measurement Equipment
Solar Global Horizontal Irradiance20 (GHI) was originally recorded using a Hukseflux SR12 pyranometer installed on a horizontal boom at 2m above ground level on the same met mast that is used to record wind, temperature, humidity and pressure data. This sensor was installed and commissioned by Measurement Engineering Australia (MEA) on 13 November 2014.
After analysing the first 3 months of irradiance data, a significant difference between the site and satellite based measurements was observed. A review of the pyranometer’s installation and calibration records did not reveal any abnormalities that would explain the difference in the measured values. It was considered possible that local site effects may be causing the discrepancy, although more likely it was due to a faulty instrument. To resolve the issue, a duplicate additional identical pyranometer was installed alongside the original instrument. Table 9-1 below lists the pyranometers that were installed and their respective measurement periods.
The measured data from the new pyranometer aligned with satellite data, which pointed to a defect with the original instrument. After a review of the concurrent data from the old and new instruments, Hukseflux, the pyranometer manufacturer, sent a replacement instrument and the original instrument was sent back to the manufacturer for further testing.
Hukseflux confirmed that the original instrument was functioning perfectly but the wrong product certificate and calibration parameters had been provided which resulted in the offset and hence lower measured values. Hukseflux advised through MEA that this was a human error which resulted in the sensor being shipped with an incorrectly completed product certificate. Hukseflux advised that their processes had been changed as a result and such an error should not occur again. More importantly Hukseflux advised that the data from the original instrument could still be used after applying a correction factor.
The Board downloaded data files from the data logger on a fortnightly then weekly basis when the frequency of measurement sampling was changed from 10 minute to 1 minute. The site monitoring mast (which includes the wind instrumentation) is located on an elevated area approximately 200m to 300m away from the prospective solar sites. Figure 9-1 shows the base of mast and two pyranometers installed side by side on the north pointing boom. The shading from mast and vegetation surroundings is expected to be minimal.
20 GHI is comprised of the direct and diffused components and represents the sum of the incident irradiance. With this parameter it is possible to
recalculate on an arbitrary oriented plane and it provides a direct relation with the energy production in PV systems.
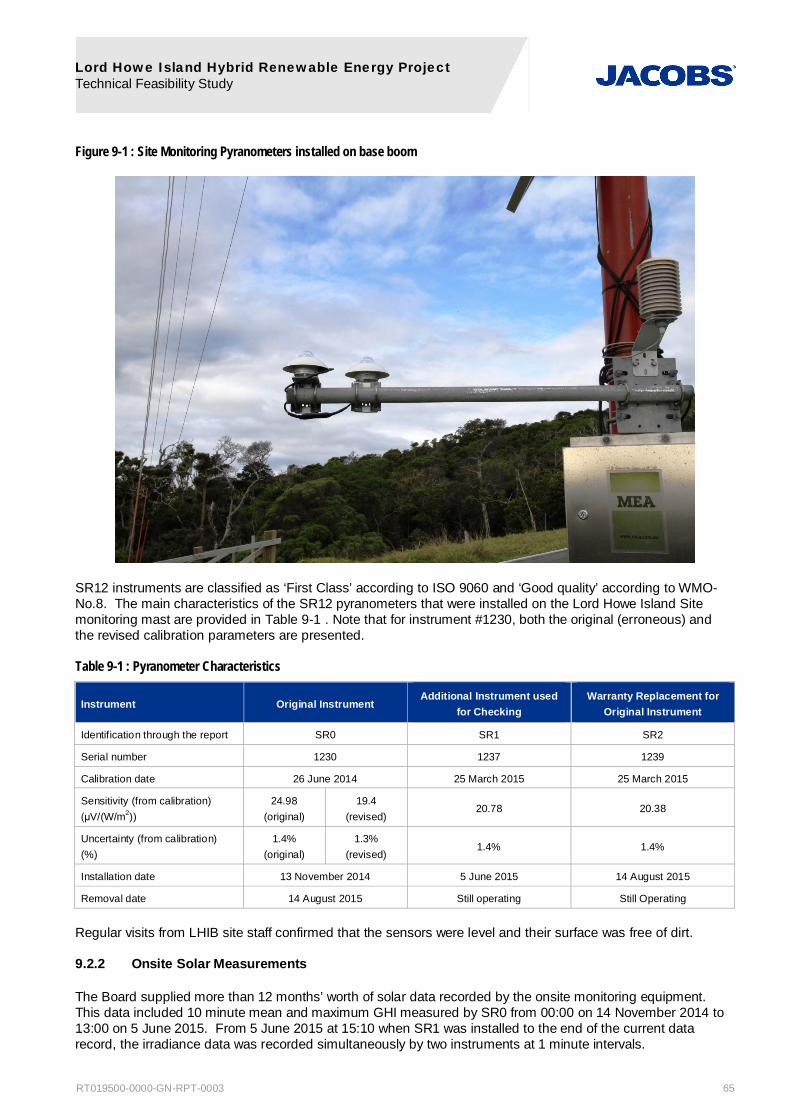
Lord Howe Island Hybrid Renewable Energy Project Technical Feasibility Study
RT019500-0000-GN-RPT-0003 65
Figure 9-1 : Site Monitoring Pyranometers installed on base boom
SR12 instruments are classified as ‘First Class’ according to ISO 9060 and ‘Good quality’ according to WMO-No.8. The main characteristics of the SR12 pyranometers that were installed on the Lord Howe Island Site monitoring mast are provided in Table 9-1 . Note that for instrument #1230, both the original (erroneous) and the revised calibration parameters are presented.
Table 9-1 : Pyranometer Characteristics
Instrument Original Instrument Additional Instrument used
for Checking Warranty Replacement for
Original Instrument
Identification through the report SR0 SR1 SR2
Serial number 1230 1237 1239
Calibration date 26 June 2014 25 March 2015 25 March 2015
Sensitivity (from calibration) V/(W/m2))
24.98 (original)
19.4 (revised)
20.78 20.38
Uncertainty (from calibration) (%)
1.4% (original)
1.3% (revised)
1.4% 1.4%
Installation date 13 November 2014 5 June 2015 14 August 2015
Removal date 14 August 2015 Still operating Still Operating
Regular visits from LHIB site staff confirmed that the sensors were level and their surface was free of dirt.
9.2.2 Onsite Solar Measurements
The Board supplied more than 12 months’ worth of solar data recorded by the onsite monitoring equipment. This data included 10 minute mean and maximum GHI measured by SR0 from 00:00 on 14 November 2014 to 13:00 on 5 June 2015. From 5 June 2015 at 15:10 when SR1 was installed to the end of the current data record, the irradiance data was recorded simultaneously by two instruments at 1 minute intervals.

Lord Howe Island Hybrid Renewable Energy Project Technical Feasibility Study
RT019500-0000-GN-RPT-0003 66
The 1 minute data was averaged across 10-minute periods to undertake the energy analysis.
9.2.2.1 Data Availability
The data coverage and sample validity was checked to obtain the overall data availability21.
Table 9-2 summarises the missing, erroneous, and/or suspicious data samples.
Table 9-2 : Missing, Erroneous and/or Suspicious Data Samples
Sample (inclusive) Comment Action
05 Jun 2015 13:10 to 05 Jun 2015 15:30 No data available. Logger switched off during installation of SR1.
Data period not considered in the analysis
10 Jul 2015 10:00 to 11 Jul 2015 17:20 No data available. Suspected data card at full capacity
Data period not considered in the analysis
14 Aug 2015 11:20 No data available. Logger switched off during installation of SR2.
Data period not considered in the analysis
14 Aug 2015 11:30 to 14 Aug 2015 11:40 Disagreement between SR1 and SR2 data during installation of SR2.
Data period not considered in the analysis
Of the 54,505 10-minute samples that should have been recorded based on the measurement period duration and the sampling frequency, 54,300 were available. This gave a data coverage of 99.6%.
There were only 2 suspicions data samples where the readings from both sensors do not agree. These two samples were recorded on 14 August 2015 during the installation of SR2.
The sample validity for the measurement period was 100.0%. When combined with data coverage this gave overall data availability of 99.6%. This cleaned site data for the period 00:10 on 14 November 2014 to 12:30 on 27 November 2015 was used for the MCP analysis.
9.2.2.2 Pyranometer SR0 Data correction
The manufacturer confirmed that SR0 was fully functional but the gain parameter from the calibration was not correct.
The correction of the SR0 data has been tested through two different methods:
12) Reapplying the instrument calibration parameters
13) Performing a correlation between SR0 / SR1 for the time that both instruments were recording concurrently
Both methods gave comparable results, however the correlation method gave a more accurate and conservative result – for that reason Jacobs choose this method to correct the data of SR0. Further detail on both data correction methods follows with the results summarised in Table 9-3.
Method 1 – Calibration parameters factor
After the SR0 instrument was sent back to Hukseflux, they confirmed that the originally quoted gain of 24.98 V/(W/m2) should be in fact 19.40 V/(W/m2). However, no revised product certificate was provided by the manufacturer.
As there are no offsets in the data processing, the correction factor was found to be 24.98/19.40 = 1.2876.
21 ‘Data coverage’ refers to the proportion of samples recorded; ‘sample validity’ refers to all instruments simultaneously providing valid data; data
availability is the product of ‘data coverage’ and ‘sample validity’.

Lord Howe Island Hybrid Renewable Energy Project Technical Feasibility Study
RT019500-0000-GN-RPT-0003 67
Method 2 – Correlation factor
SR0 and SR1 were both recording data from 05 June 2015 to 14 August 2015 when SR0 was removed to be sent back to the manufacturer.
During the 68 days that both instruments were recording, the 9870 time-matched data samples provided a correlation coefficient (R2) of 99.9% which denotes a very strong relationship between both instruments. The gradient of the linear fit through the data was found to be 1.2546 which is the factor that was applied to SR0 to correct its data.
The length of the concurrent period is quite short; however the number of samples, sample range and strong relationship between the datasets provides confidence on the resulting correlation factor. The scatter plot and linear fit are presented in Figure 9-2.
Figure 9-2 : SR0 and SR1 Irradiance Correlation
Results
The results from both methods together with the readings from SR1 are presented in the following table.
Table 9-3 : SR0 Correction Results
Sensor Correction Factor Insolation from 05 June 2015 to 14 August 2015
(kWh/m2) Difference with SR1
(%)
SR0 N/A 870 -20.4
SR0 (Method 1) 1.2876 1120 2.5
SR0 (Method 2) 1.2546 1092 -0.1
SR1 N/A 1093 -
The data from SR0 was corrected using the factor from Method 2 which is 1.2546. Details of monthly irradiation for each pyranometer (SR0, SR1 and SR2) are discussed on the following section.
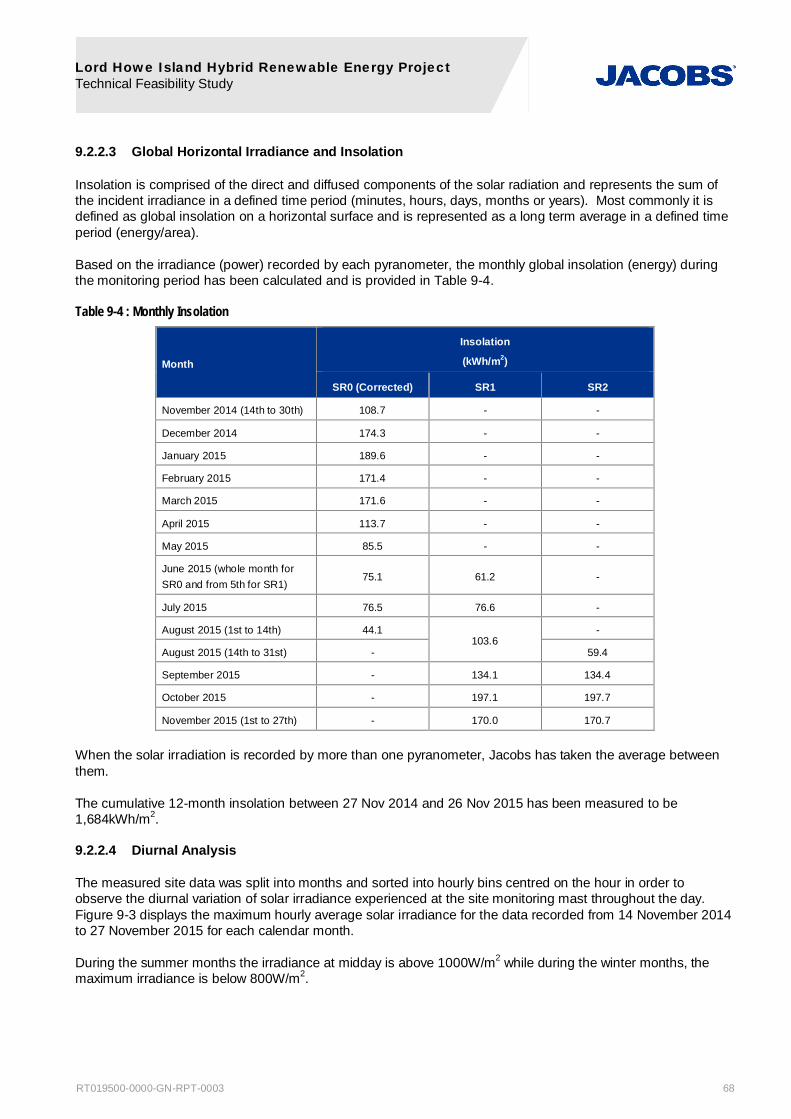
Lord Howe Island Hybrid Renewable Energy Project Technical Feasibility Study
RT019500-0000-GN-RPT-0003 68
9.2.2.3 Global Horizontal Irradiance and Insolation
Insolation is comprised of the direct and diffused components of the solar radiation and represents the sum of the incident irradiance in a defined time period (minutes, hours, days, months or years). Most commonly it is defined as global insolation on a horizontal surface and is represented as a long term average in a defined time period (energy/area).
Based on the irradiance (power) recorded by each pyranometer, the monthly global insolation (energy) during the monitoring period has been calculated and is provided in Table 9-4.
Table 9-4 : Monthly Insolation
Month
Insolation
(kWh/m2)
SR0 (Corrected) SR1 SR2
November 2014 (14th to 30th) 108.7 - -
December 2014 174.3 - -
January 2015 189.6 - -
February 2015 171.4 - -
March 2015 171.6 - -
April 2015 113.7 - -
May 2015 85.5 - -
June 2015 (whole month for SR0 and from 5th for SR1)
75.1 61.2 -
July 2015 76.5 76.6 -
August 2015 (1st to 14th) 44.1 103.6
-
August 2015 (14th to 31st) - 59.4
September 2015 - 134.1 134.4
October 2015 - 197.1 197.7
November 2015 (1st to 27th) - 170.0 170.7
When the solar irradiation is recorded by more than one pyranometer, Jacobs has taken the average between them.
The cumulative 12-month insolation between 27 Nov 2014 and 26 Nov 2015 has been measured to be 1,684kWh/m2.
9.2.2.4 Diurnal Analysis
The measured site data was split into months and sorted into hourly bins centred on the hour in order to observe the diurnal variation of solar irradiance experienced at the site monitoring mast throughout the day. Figure 9-3 displays the maximum hourly average solar irradiance for the data recorded from 14 November 2014 to 27 November 2015 for each calendar month.
During the summer months the irradiance at midday is above 1000W/m2 while during the winter months, the maximum irradiance is below 800W/m2.

Lord Howe Island Hybrid Renewable Energy Project Technical Feasibility Study
RT019500-0000-GN-RPT-0003 69
Figure 9-3 : Diurnal Maximum Site Solar Irradiance Variation per Calendar Month
9.2.3 Reference Solar Measurements
A number of sources of reference data for the long term solar correlation were considered as there are no long term ground solar measurements on LHI. The closest long term ground solar measurements available have been recorded by an Australian Bureau of Meteorology met station at Port Macquarie. While the solar data from the Port Macquarie met station was in good order, the correlation between it and the LHI site data was very weak and therefore not suitable for use as the reference solar data.
The only remaining option was to use long term solar data derived from satellite images and weather models. While this data provides a good indication of the solar resource, it carries an inherent error and also may not account for localised factors.
There are several sources of satellite data, some available on the public domain and some available for purchase. Several resources were analysed and SolarGIS22 was selected as it was regarded as one of the most accurate databases and produced hourly data up to the end of November 2015.
The spatial resolution of the SolarGIS data is based on several input data resolutions:
Aerosols (atmosphere): approximately 85 and 125km
Water vapour (atmosphere): approximately 22 and 35km
Satellite data (clouds): approximately 3.5km
Digital terrain model: approximately 250km
The end resolution of the SolarGIS data is close to 3.5km in terms of cloudiness and the uncertainty is reported to be 4.0% on an annual basis.
22 The SolarGIS database is a high resolution database recognised as one of the most reliable and accurate source of solar resource information.
The database resides on about 100 terabytes of data and it is updated on daily basis. The data is calculated using in-house developed algorithms that process satellite imagery and atmospheric and geographical inputs (http://solargis.info/).
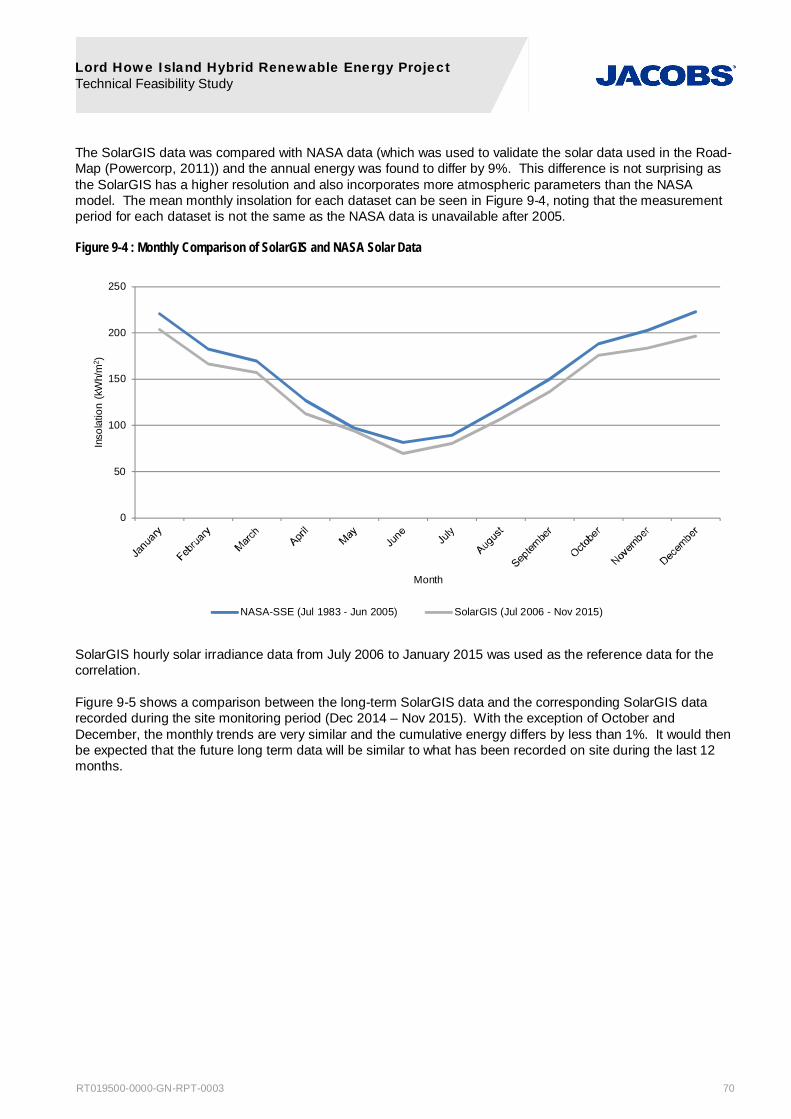
Lord Howe Island Hybrid Renewable Energy Project Technical Feasibility Study
RT019500-0000-GN-RPT-0003 70
The SolarGIS data was compared with NASA data (which was used to validate the solar data used in the Road-Map (Powercorp, 2011)) and the annual energy was found to differ by 9%. This difference is not surprising as the SolarGIS has a higher resolution and also incorporates more atmospheric parameters than the NASA model. The mean monthly insolation for each dataset can be seen in Figure 9-4, noting that the measurement period for each dataset is not the same as the NASA data is unavailable after 2005.
Figure 9-4 : Monthly Comparison of SolarGIS and NASA Solar Data
SolarGIS hourly solar irradiance data from July 2006 to January 2015 was used as the reference data for the correlation.
Figure 9-5 shows a comparison between the long-term SolarGIS data and the corresponding SolarGIS data recorded during the site monitoring period (Dec 2014 – Nov 2015). With the exception of October and December, the monthly trends are very similar and the cumulative energy differs by less than 1%. It would then be expected that the future long term data will be similar to what has been recorded on site during the last 12 months.
0
50
100
150
200
250
Inso
latio
n (k
Wh/
m2 )
Month
NASA-SSE (Jul 1983 - Jun 2005) SolarGIS (Jul 2006 - Nov 2015)

Lord Howe Island Hybrid Renewable Energy Project Technical Feasibility Study
RT019500-0000-GN-RPT-0003 71
Figure 9-5: Comparison of Long Term and Short Term SolarGIS Insolation Data
9.2.4 Cross Correlation and Data Synthesis
In order to establish the relationship between the site and the reference data, a correlation between the time-matched measured site irradiance values and the SolarGIS data was performed.
The data used for the correlation covered the period from 14 November 2014 to 27 November 2015. The site data was averaged on an hourly basis in order to compare it with the SolarGIS data. Figure 9-6 provides a visual representation of the time-matched data for the first two weeks in January 2015 (as an example).
Figure 9-6 : Hourly Site and SolarGIS Time Series Irradiance Data
0
50
100
150
200
250
Mon
thly
Ins
olat
ion
(kW
/m2 )
Month
SolarGIS Long Term (Jul 2006 - Nov 2015) SolarGIS Short Term (Dec 2014 - Nov 2015)

Lord Howe Island Hybrid Renewable Energy Project Technical Feasibility Study
RT019500-0000-GN-RPT-0003 72
In the graph above it can be seen that SolarGIS data represents the site data very well and therefore a strong relationship is expected.
Based on 9,038 time-matched data samples, a correlation coefficient (R2) of 95.4% was obtained which denotes a very strong relationship. The correlation is based on over 12 months of data and thus covers all seasons.
The gradient of the linear fit through the data is found to be 0.9739 which indicates that the site data is approximately 2.6% lower than what SolarGIS is estimating, which is well within the uncertainty associated with satellite measurements. The scatter plot and linear fit are presented in Figure 9-7.
Figure 9-7 : Site and SolarGIS Irradiance Correlation
The correlative relationship (Site = SolarGIS x 0.9739) was applied to the long term reference data to predict the long term site irradiance values. The monthly mean insolation figures for the long term synthesised site data, together with the input SolarGIS data, are presented in Table 9-5.
Table 9-5 : Long term Monthly Insolation Results
Month SolarGIS Insolation
(kWh/m2)
Site Synthesised Insolation
(kWh/m2)
January 203.6 198.2
February 166.4 162.1
March 157.1 153.0
April 112.7 109.8
May 94.1 91.6
June 69.9 68.0
July 80.7 78.6
August 106.9 104.2
September 136.4 132.9
October 175.7 171.1

Lord Howe Island Hybrid Renewable Energy Project Technical Feasibility Study
RT019500-0000-GN-RPT-0003 73
Month SolarGIS Insolation
(kWh/m2)
Site Synthesised Insolation
(kWh/m2)
November 183.4 178.6
December 196.4 191.3
TOTAL 1,683.3 1,639.3
The long-term annual irradiation at LHI is expected to be 1,639kWh/m2 which is 2.6% lower than the site recorded data from 14 November 2014 to 27 November 2015. This is slightly more conservative than the SolarGIS data for which the long term was around 1% lower than the short term average.
9.3 Solar Energy Yield Analysis
9.3.1 Solar PV System Configuration
9.3.1.1 LHIB Solar Configuration
In order to achieve the required power at the output of the inverters, a higher installed DC capacity is needed in order to account for system losses.
PVsyst was used to determine the total number of panels required to obtain the required AC installed capacity based on the panel’s maximum operating power under normal test conditions. Due to the potential space constraints, Jacobs has used a high efficiency panel (approximately 20%) and has used an inter-array separation of approximately 1m. Using this arrangement, 450kWpAC is achieved at the output with approximately 493kWpDC of panels, and to achieve 550kWpAC, at the output approximately 595kWpDC of panels is required.
The proposed system is as follows:
Fixed axis technology – tilt of 30°
Orientation (azimuth) – north
PV module – Canadian Solar CS6X-320P silicon polycrystalline 320Wp
- 1495 panels with 3 units stacked horizontally on a frame to achieve 450kWpAC
- 1820 panels with 3 units stacked horizontally on a frame to achieve 550kWpAC
Inverter – SMA Sunny Tripower 25kWAC
- 18 units for 450kWpAC
- 22 units for 550kWpAC
Stringing:
- 13 Modules in series with 115 strings for 450kWpAC
- 13 Modules in series with 140 strings for 550kWpAC
Spacing between rows of approximately 1m for both configurations
Based on the layout and panel separation shown in the General Arrangement drawing refer A-4, the 450kWpAC solar option will fit in Solar Area A whereas the 550kWpAC option will require the whole of Solar Area A and a third of Solar Area C
The panel and inverter selection (both size and manufacturer) is typical only, tenderers for the Solar Battery and Control System contract will be free to choose the type of panel and inverter. The proposed system is intended only to give a preliminary view of the arrangement and the resultant generation.

Lord Howe Island Hybrid Renewable Energy Project Technical Feasibility Study
RT019500-0000-GN-RPT-0003 74
The alternative of using single axis tracking systems for the LHIB solar PV installation has been evaluated. For a single axis tracking system configuration, the arrays would be tilted 30° but tracking the sun east to west from sunrise to sunset. The advantage is that when panels track the sun, the irradiance capture can be 30% higher compared to a fixed system. However higher separation distances, in excess of 5m between rows of panels, is required in order to avoid excessive inter-shading losses, especially during early morning and late afternoon.
Option 1, with single axis tracking system has been modelled in PVsyst. Results suggest that with this system, the energy yield could increase by 15 to 20% compared to a fixed system; however the footprint of the installation would need to increase by 50 to 70% making it impossible to fit all panels for Option 1 (450kW) within Solar Area A. In addition tracking systems require much flatter sites than fixed structures, generally < 5°, to make them feasible which makes them unsuitable for this project site.
9.3.1.2 Private Solar Configuration
The energy contribution from the Private Solar installations on LHI was also modelled and compared to the actual metered data. Currently 83kWpAC of Private Solar is installed and operational on LHI, and this is planned to increase to a total of 120kWpAC of Private Solar in the near future. The efficiency of the Private Solar, however, is expected to be significantly lower than the LHIB installation. Typically the Private Solar installations on LHI are installed on the roofs’ of the dwellings and as a result, the tilt and orientation are unlikely to be optimal. In addition, many of the roofs are partially shaded during times of the day. For that reason, the expected energy from the Private Solar has been based on the actual readings but corrected for long term resource expectations.
The Board supplied the solar energy production readings from the 25 February 2015 to the 01 December 2015 as well as the installed capacity, commissioning date, panel orientation and panel tilt (at some installations only) for 20 operational Private PV installations. The installations range from 2kWp to 10kWp and have a combined installed capacity of 83kWpAC. Two readings were not available so Jacobs estimated them based on the contribution from previous production or other solar installations.
Jacobs modelled each system in PVsyst using the March 2015 to December 2015 measured site data. The actual orientation of each installation was used, however the tilt was not available at all installations and as such 15° tilt was assumed.
Each site was modelled using a REC silicon polycrystalline 245Wp panel and a SMA inverter sized for each installation. Standard losses have been assumed and with no shading.
The actual energy generated at each installation, together with the theoretical using the measured solar data are presented in Figure 9-8.

Lord Howe Island Hybrid Renewable Energy Project Technical Feasibility Study
RT019500-0000-GN-RPT-0003 75
Figure 9-8 : Private PV Installations Measured Generation and Predicted Generation March 2015 to December 2015
Figure 9-9 below illustrates the actual energy production deviation from the modelled energy production.
Figure 9-9 : Private PV Installations Generation Deviation
The majority of the installations show an underperformance with regards to the possible theoretical energy, which Jacobs attributes to the shading losses and the orientation. The three systems where the actual is above the theoretical energy is likely to be due to a larger number of panels for the rating and/or use of higher efficiency panels. Specific advice from LHIB in relation to PV10 and PV14 indicates that they are installed at

Lord Howe Island Hybrid Renewable Energy Project Technical Feasibility Study
RT019500-0000-GN-RPT-0003 76
near optimum angles with no shading, and in fact the owner of one of the installations manually adjusts the angle of their panels every 3 months in an effort to optimise the output. In summary, the average deviation between theoretical and actual energy across all installations has been found to be -22%.
Jacobs has modelled the whole 83kWAC of Private solar as a single installation with a 15° tilt and north orientation. The energy results are within 1% of the sum of the individual systems. Therefore, for simplicity of modelling the Private Solar, Jacobs has modelled this as a single system applying a correction based on the ratio of actual to theoretical.
The proposed private system was configured with the following parameters:
Fixed axis technology – tilt of 15°
Orientation (azimuth) – north
PV module – REC 245PEI silicon polycrystalline 245Wp
- 390 panels to achieve 83kWpAC
- 530 panels to achieve 120kWpAC
Inverter – SMA SunnyBoy 4.0kWAC
- 21 units for 83kWpAC
- 30 units for 120kWpAC
9.3.2 Estimated Energy Yield
Based on the synthesised data and the system configurations presented in the previous sections, the expected energy yield was calculated using the PVsyst software, version 6.39.
The following assumptions were used in the energy evaluation process for the LHIB solar installation:
The albedo (energy yield from reflected light) of surrounding areas used for calculation of yield from reflections from surrounding areas has been assumed to be 20% (reflected from grass)
The system has been modelled without shading by obstacles in the surrounds and clear horizon
Inter-shading between panels in the LHIB configuration has been modelled as 1.2% using the proposed configuration with spacing of approximately 1m between rows
Soiling loss (soiling of modules due to dirt or salt accumulation) is assumed to be 1%. The area is low on dust levels but may accumulate some salt from sea spray during periods of low rainfall.
Thermal loss factor 29W/m2K (assumed for free mounted modules with air circulation)
Module quality loss has been assumed to be -0.4% based on expected panel performance
Light Induced Degradation loss has been assumed to be 2% as it is unknown if the manufacturer has already accounted for in the Standard Test Conditions specifications
Mismatch loss (these losses are related to the fact that the real modules in the array do not rigorously present the same I/V characteristics) is assumed to be 1% (standard assumption of PVsyst)
DC cabling ohmic loss (cabling between the panels) is assumed to be 2%
Inverter loss is calculated as 2.5% by the model based on the module specifications
Grid connection transformer losses have been modelled to be 1.1% based on general specifications for a 6.6kV transformer
AC cabling losses have been determined to be 0.5% based on an average of 20m of 240mm2 cable to the Solar Kiosk and RMU
Availability of the plant: 100% based on maintenance being performed during non-daylight hours

Lord Howe Island Hybrid Renewable Energy Project Technical Feasibility Study
RT019500-0000-GN-RPT-0003 77
The above assumptions were also used to model the Private Solar performance with the following exceptions:
Thermal loss factor 15W/m2K (integration with fully insulated back)
DC cabling ohmic loss (cabling between the panels) is assumed to be 3%
No AC or transformer losses have been included
In addition, Jacobs has applied a 22% reduction in energy based on the ratio between the modelled energy and the current readings on site from March 2015 to December 2015
The proposed system and assumptions described above were used to calculate the expected AEP for the various solar PV options. A summary of the AEPs based on the long term expected site conditions is provided in Table 9-6. Note that these AEPs do not include losses due to PV panel degradation over time.
Table 9-6 : Solar Energy Yield Results
Layout Capacity
(kWpAC)
Long Term Solar Energy Yield
(MWh/year)
LHIB Solar Option 1 450 744.9
LHIB Solar Option 2 550 901.3
Current Private Solar 83 100.3*
Planned Private Solar 120 137.5*
* Private Solar figures includes a 22% reduction in output from the PVsyst theoretical result
The monthly average energy breakdown for the LHIB Solar is presented in Table 9-7.
Table 9-7 : Monthly LHIB Solar Energy Production
Month
Long Term Solar Energy Yield
Insolation
(kWh/m2)
Option 1 Energy
450kWpAC
(MWh)
Option 2 Energy
550kWpAC
(MWh)
January 197.0 73.5 88.9
February 157.8 63.6 77.1
March 152.0 69.4 84.0
April 109.4 56.5 68.3
May 92.1 54.4 65.7
June 68.9 41.7 50.3
July 79.7 47.4 57.2
August 104.5 57.6 69.6
September 134.0 64.8 78.5
October 174.9 74.7 90.5
November 176.5 67.5 81.7
December 201.0 73.9 89.4
TOTAL 1647.9 744.9 901.3
The monthly average energy breakdown for the Private Solar is provided in Table 9-8 below.

Lord Howe Island Hybrid Renewable Energy Project Technical Feasibility Study
RT019500-0000-GN-RPT-0003 78
Table 9-8 : Monthly Private Solar Energy Production
Month
Long Term Solar Energy Yield*
Insolation
(kWh/m2)
Current Installed
83kWpAC
(MWh)
Planned Total of Installations
120kWpAC
(MWh)
January 197.0 10.6 14.6
February 157.8 8.9 12.2
March 152.0 9.3 12.7
April 109.4 7.3 9.9
May 92.1 6.7 9.2
June 68.9 5.2 7.0
July 79.7 5.9 8.1
August 104.5 7.3 9.9
September 134.0 8.6 11.8
October 174.9 10.2 14.1
November 176.5 9.7 13.3
December 201.0 10.8 14.8
TOTAL 1647.9 100.3 137.5
*Note that a 22% reduction on the Private Solar output has been applied on each month equally
The rated power output of solar panels typically degrades at about 0.5% per year. In an analytical review by NREL23, some more specific degrading factors are presented for different panel compositions. As a conservative approach, 0.5% was used as a degradation percentage of power output which was then applied to individual years and presented as an average in 5 year intervals. The expected energy for the lifetime of the solar installation is shown in Table 9-9.
Table 9-9 : Future Annual Solar Energy Production of the LHIB Installation
Years Efficiency Due to PV
Degradation
(%)
Per-Annum Solar Yield
Option 1
450kWpAC
(MWh)
Option 2
550kWpAC
(MWh)
1 to 5 98.5 733.7 887.7
6 to 10 96.0 715.1 865.2
10 to 15 93.5 696.5 842.7
16 to 20 91.0 677.8 820.2
21 to 25 88.5 659.2 797.6
The degradation of the Private Solar has not been modelled, however the degradation is expected to follow a similar trend to the LHIB Solar as described above.
23 http://www.nrel.gov/docs/fy12osti/51664.pdf
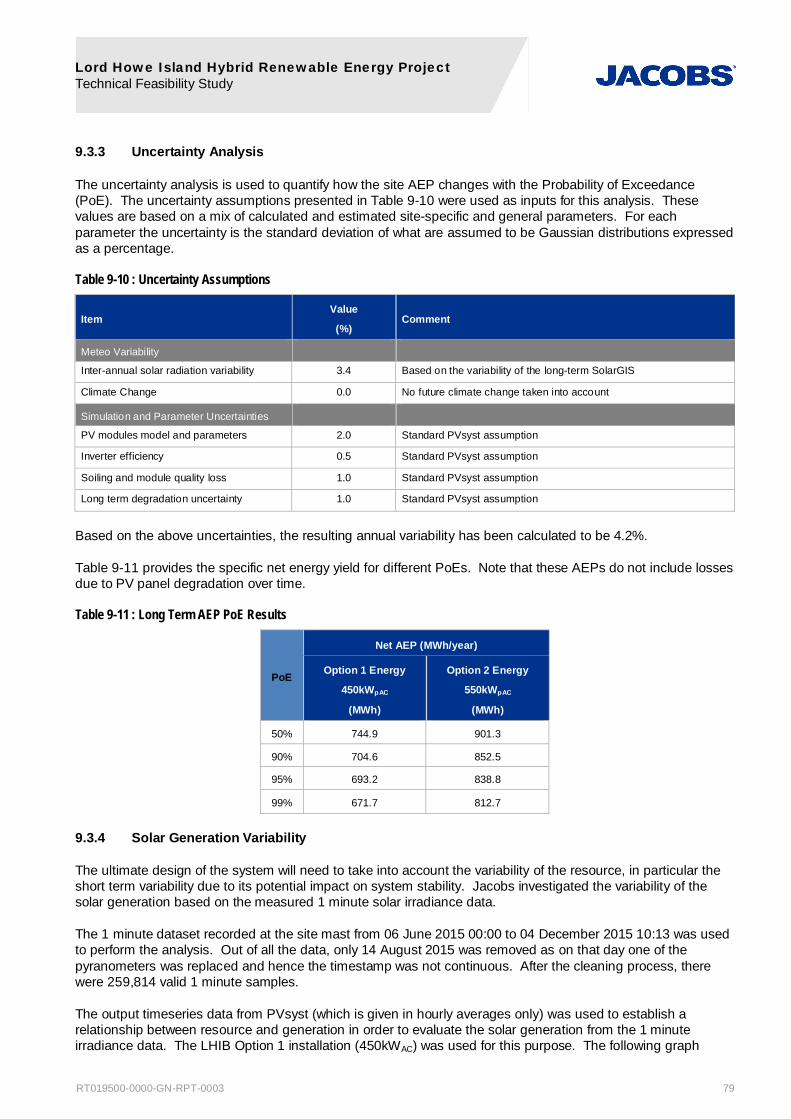
Lord Howe Island Hybrid Renewable Energy Project Technical Feasibility Study
RT019500-0000-GN-RPT-0003 79
9.3.3 Uncertainty Analysis
The uncertainty analysis is used to quantify how the site AEP changes with the Probability of Exceedance (PoE). The uncertainty assumptions presented in Table 9-10 were used as inputs for this analysis. These values are based on a mix of calculated and estimated site-specific and general parameters. For each parameter the uncertainty is the standard deviation of what are assumed to be Gaussian distributions expressed as a percentage.
Table 9-10 : Uncertainty Assumptions
Item Value
(%) Comment
Meteo Variability
Inter-annual solar radiation variability 3.4 Based on the variability of the long-term SolarGIS
Climate Change 0.0 No future climate change taken into account
Simulation and Parameter Uncertainties
PV modules model and parameters 2.0 Standard PVsyst assumption
Inverter efficiency 0.5 Standard PVsyst assumption
Soiling and module quality loss 1.0 Standard PVsyst assumption
Long term degradation uncertainty 1.0 Standard PVsyst assumption
Based on the above uncertainties, the resulting annual variability has been calculated to be 4.2%.
Table 9-11 provides the specific net energy yield for different PoEs. Note that these AEPs do not include losses due to PV panel degradation over time.
Table 9-11 : Long Term AEP PoE Results
PoE
Net AEP (MWh/year)
Option 1 Energy
450kWpAC
(MWh)
Option 2 Energy
550kWpAC
(MWh)
50% 744.9 901.3
90% 704.6 852.5
95% 693.2 838.8
99% 671.7 812.7
9.3.4 Solar Generation Variability
The ultimate design of the system will need to take into account the variability of the resource, in particular the short term variability due to its potential impact on system stability. Jacobs investigated the variability of the solar generation based on the measured 1 minute solar irradiance data.
The 1 minute dataset recorded at the site mast from 06 June 2015 00:00 to 04 December 2015 10:13 was used to perform the analysis. Out of all the data, only 14 August 2015 was removed as on that day one of the pyranometers was replaced and hence the timestamp was not continuous. After the cleaning process, there were 259,814 valid 1 minute samples.
The output timeseries data from PVsyst (which is given in hourly averages only) was used to establish a relationship between resource and generation in order to evaluate the solar generation from the 1 minute irradiance data. The LHIB Option 1 installation (450kWAC) was used for this purpose. The following graph
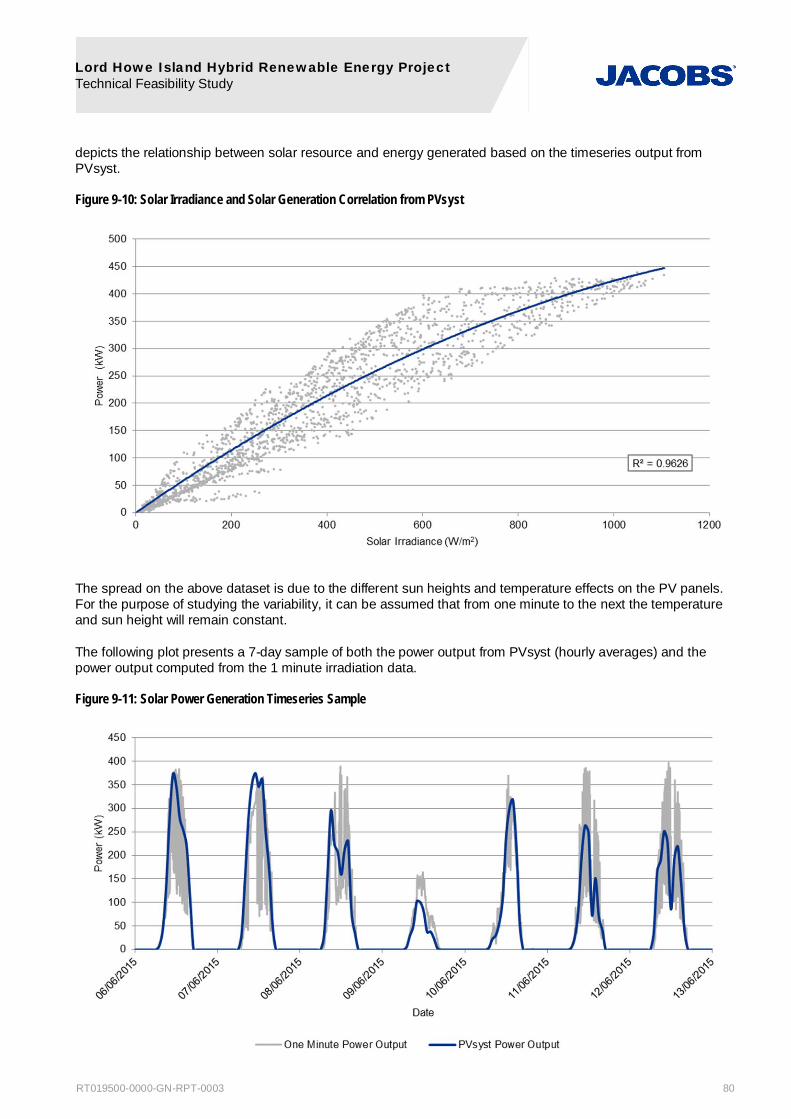
Lord Howe Island Hybrid Renewable Energy Project Technical Feasibility Study
RT019500-0000-GN-RPT-0003 80
depicts the relationship between solar resource and energy generated based on the timeseries output from PVsyst.
Figure 9-10: Solar Irradiance and Solar Generation Correlation from PVsyst
The spread on the above dataset is due to the different sun heights and temperature effects on the PV panels. For the purpose of studying the variability, it can be assumed that from one minute to the next the temperature and sun height will remain constant.
The following plot presents a 7-day sample of both the power output from PVsyst (hourly averages) and the power output computed from the 1 minute irradiation data.
Figure 9-11: Solar Power Generation Timeseries Sample

Lord Howe Island Hybrid Renewable Energy Project Technical Feasibility Study
RT019500-0000-GN-RPT-0003 81
The difference between samples was evaluated for 1, 2, 5 and 60 minutes to assess the solar generation variability. The results (number of occurrences and percentage of samples) are presented in Table 9-12.
Table 9-12: Solar Generation Fluctuations for Different Time Intervals
Red
uctio
n in
Pow
er
Out
put
(kW
)
Incr
ease
in P
ower
O
utpu
t
(kW
)
1-minute Step Change 2-minute Step Change 5-minute Step Change 60-minute Step Change N
umbe
r of
O
ccur
renc
es
Perc
enta
ge
Num
ber
of
Occ
urre
nces
Perc
enta
ge
Num
ber
of
Occ
urre
nces
Perc
enta
ge
Num
ber
of
Occ
urre
nces
Perc
enta
ge
225 to 275 - 10 0.0% 14 0.0% 5 0.0% 1 0.0%
175 to 225 - 173 0.1% 95 0.1% 40 0.2% 5 0.2%
125 to 175 - 629 0.5% 441 0.7% 213 0.8% 33 1.2%
75 to 125 - 2045 1.7% 1281 2.0% 624 2.4% 287 10.6%
25 to 75 - 6816 5.6% 4497 7.0% 2501 9.4% 473 17.5%
25 to 0 - 50488 41.7% 25871 40.1% 9910 37.4% 553 20.5%
- 0 to 25 51521 42.5% 26006 40.3% 9773 36.8% 532 19.7%
- 25 to 75 6663 5.5% 4530 7.0% 2560 9.7% 488 18.1%
- 75 to 125 1963 1.6% 1237 1.9% 659 2.5% 273 10.1%
- 125 to 175 654 0.5% 418 0.6% 185 0.7% 43 1.6%
- 175 to 225 171 0.1% 117 0.2% 50 0.2% 8 0.3%
- 225 to 275 19 0.0% 15 0.0% 5 0.0% 0 0.0%
Note: This table only looks at day time data where there is a difference from one sample to the next sample hence why the total data count is less than the number of samples recorded.
The table above shows that 95.3% of the 1 minute fluctuations will result in a change in power output of less than ±75MW with only 0.3% of the 1 minute fluctuations resulting in a generation change in excess of ±175MW. As a result the swings in PV production that the HREP will have to be designed to cope with are modest and well within the capabilities of the systems proposed.

Lord Howe Island Hybrid Renewable Energy Project Technical Feasibility Study
RT019500-0000-GN-RPT-0003 82
10. HREP System Modelling 10.1 Introduction
It is understood that values used in the Business Case (BC) for diesel fuel use and renewable energy contribution were calculated by ABB using the Homer software package. Jacobs has used the same Homer software, version 3.4.3, to estimate the renewable energy contribution and the diesel fuel consumption for the two options considered in the BC. In addition, Homer was used to run multiple scenarios to look at various different sizes of the components proposed in the BC.
The Homer software can carry out its simulations in a number of ways. For the purposes of this work, the minimisation of diesel fuel consumption was selected to be the main driver unless it is stated otherwise. The results presented in this section represent the likely performance in the first few years of operation once the operational control has been optimised.
It is recommended that optimisation studies are carried out as part of the tender process to balance CAPEX, OPEX, Sustaining CAPEX disposal costs and potential site constraints that may arise as part of the approvals process. It is likely that the optimisation would end up recommending some changes to the sizes of some of the main components.
10.2 Modelling Specifics
A model of each of the two BC options was built in Homer which included the following elements as applicable:
2 x 275kW Vergnet WTGs
1 x 400kW/400kWhAC Li-Ion battery and convertor
450kWpAC LHIB Solar PV installation complete with inverter
550kWpAC LHIB Solar PV installation complete with inverter
120kWpAC Private Solar PV – this is to represent the various smaller systems installed or approved to be installed throughout the grid
3 x 300kW Detroit Series 60 14l Diesel Genset
Annual Load, wind, solar radiation and temperature profiles
No attempt was made to model the current or proposed ripple control system as there was insufficient data on its actual kWh profile and the annual load data used already includes its effect. Thus introducing a deferrable load would require the contribution to be removed from the existing load data which was not possible given the lack of data. It is considered that this will only have a minor effect on the accuracy of the values calculated.
In addition, the losses from the WTG, solar and battery transformers and the 415V and 6.6kV cable losses were not include in the model. These were considered to be second order and would not impact the outcomes.
10.2.1 Control Strategy
The control philosophy of the HREP is driven by three equally important principals:
The reduction in diesel fuel consumption,
Maintaining current levels of system security and
Operating the system to lower OPEX.
A focus solely on one of these principals will potential compromise the other two. Hence the control system that is ultimately designed must integrate all three to determine the correct course of action.
Lord Howe Island Hybrid Renewable Energy Project Technical Feasibility Study
RT019500-0000-GN-RPT-0003 83
10.2.1.1 Reduction of Diesel Fuel Consumption
It is expected that on LHI, the reduction in diesel fuel consumption will be achieved through reduced operation of the diesel gensets (reduced run hours) and as far as is practical, limiting their operation to the more efficient band of operation.
One of the key aspects of the HREP operation will be to charge the battery from the gensets that are running to ensure they operate in the efficient range. Once a certain state of charge is achieved with the battery, then the gensets will be switched off. This ensures that the kWhrs produced by the gensets is carried out done so using the least amount of fuel per kWh.
10.2.1.2 System Security
LHI currently enjoys a very high level of system security with very few unplanned outages, and any reduction in the quality of supply is unacceptable. The island is principally supported by tourism with a high proportion of tourists repeat visitors. Tourism operators rely on the high quality of supply to assist them with delivering their guests the best possible experience.
At a practical level the power quality of the HREP will be monitored using power quality meters installed on the 6.6kV bus at the power house. The intention will be to install these meters as early as possible to record data ahead of the solar, battery and wind turbine installations. Following installation of the HREP, the data will be reviewed regularly to determine if the introduction of the HREP and subsequent optimising is impacting this quality.
The battery/inverter element of the HREP is effectively the No.1 genset on the system and hence is always on except during periods of maintenance when the system would revert to a diesel genset controlling frequency and voltage. The battery/inverter through the control system will control frequency and voltage within the specified ranges, whilst wind, solar, diesel gensets and loads are scheduled on and off by the control system.
The variability of loads and solar and wind generation is a key consideration in the design of the HREP and the level of “spinning reserve” (battery charge and discharge capacity both in terms of kW and kWh) that is available to the system to accommodate these fluctuations. A brief review of each of these, based on 5 second data for loads and 1 minute data for solar and wind, has been carried out in earlier sections of this report. The results indicate that the loads and potential solar and wind generation is relatively stable and fluctuations occur slowly in most cases.
The contractor for the Solar, Battery and Control system will need to analyse this fluctuation data in detail and determine the requirements of the battery system to ensure continuity of supply. The contractor will be required to provide a control system where the adjustment of the battery charge and discharge levels is carried out through the SCADA system, which then enables the progressive optimisation of the system.
10.2.1.3 Reduced OPEX
The OPEX will largely be driven by the needs of the components that are selected as part of the HREP. One of the selection criteria for any tendered system will be the minimisation of the amount of maintenance required in terms of labour and consumables. Beyond this, the control system design will be required to minimise the run hours on the diesel gensets which is currently one of the Board’s main OPEX costs in terms of the electricity systems.
10.2.1.4 Homer Modelling of Control System
Homer allows the customisation of a number of parameters which relate to the three key philosophies above. Note that the modelling of system security and the actual system performance on a cycle by cycle basis is well outside of the capabilities of Homer. Homer is designed to model long term system performance only.
The following settings have been made in Homer for both the review of fuel savings and the potential optimisation of the system. If more aggressive settings are selected then Homer will calculate increased fuel
Lord Howe Island Hybrid Renewable Energy Project Technical Feasibility Study
RT019500-0000-GN-RPT-0003 84
savings and higher renewable energy penetration. Jacobs position has been to take a conservative position in relation to these settings.
Genset minimum runtime
- set for 30 minutes which is the current LHIB practice for the gensets
Genset minimum load set to 44%
- This is based on the current LHIB control settings and also coincides with the higher efficiency operation of the gensets, refer Figure 10-2. Note that this is based on generic Detroit information, and it is expected that this data will be extracted from the actual gensets in early 2016 shortly and will be configurable information in the control system.
Operating Reserve
- Load - 10% coverage of load step
- Solar power output coverage of 25% based on a conservative view of the resource variability
- Wind power output coverage of 50% based on a conservative view of the resource variability
10.2.2 Load Data
Homer has the facility to import an annual load profile. A typical annual load profile was created from the data that was received from the Board (refer to Section 5.1). The 1 minute data from the 2011 year was converted to 10 minute data and uploaded to Homer. The choice of the 2011 dataset to approximate the current state of the grid was driven by the following:
The data is the most recent and largely complete detailed dataset received which approximates the current load profile. As reported in Section 5.1, the island load has reduced in recent years so this may slightly overstate the loads but much less than earlier datasets would.
This data is prior to the installation of Private Solar PV so is a true representation of the loads on the system.
For revision 2 of this report, some 2015 data was available although this was an incomplete set as discussed in Section 5. Unless explicitly stated otherwise, the Homer modelling in this section was done using the 2011 dataset for the reasons stated above.
10.2.3 Wind
A representative annual wind 30 minute time series dataset was created and uploaded to Homer. For revision 2 of the report, the time series was generated from the correlation of the site measurements and the Lord Howe Aerodrome met station data. Refer to Section 8.2 for details on this.
10.2.4 Solar
A representative annual solar 60 minute time series dataset was created and uploaded to Homer. This time series was generated from the time series created from the correlation of the site measurements and the SolarGIS data. Refer Section 9.2.4 for details on this.
10.2.5 Ambient Temperature
A representative annual ambient temperature 30 minute time series dataset was created and uploaded to Homer. For revision 2 of the report the time series was generated from the correlation of the met station site measurements and the Lord Howe Aerodrome met station data. This dataset was used predominantly for the PV output where the efficiency varies with ambient temperature significantly.
10.2.6 275kW Vergnet WTG
The Homer software includes a standard 275kW Vergnet WTG, however customisation was required to obtain a 200kW model. The input power curve was the same as was used in Section 8.3.2 and the same estimated

Lord Howe Island Hybrid Renewable Energy Project Technical Feasibility Study
RT019500-0000-GN-RPT-0003 85
losses were used as used in Section 8.3.4. Homer’s estimated annual unconstrained WTG energy production was then checked against the value calculated in Section 8.3.4. Whilst the values were not identical, they were within 2%, which was more than sufficient for the purposes of the study. The following parameters were applied in the Homer model:
2011 10 minute load data
Long-term 30 minute wind data
Homer system timestep 10 minute
Table 10-1 : Wind Energy Comparison
Layout WAsP Calculated AEP
(MWh/year)
Homer Calculated AEP
(MWh/year)
2 x GEVMP 32 275kW 1535.8 1556.1
2 x GEVMP 30 200kW 1209.9 1232.2
10.2.7 400kW/400kWh Battery
No specific battery type has been proposed in the in previous studies for this project, although it is understood from discussions with ABB that they had modelled a generic Li-Ion battery. As a result, a generic Li-Ion battery from the Homer database was selected and the convertor was sized so that it imposes no limitation on the operation of the battery.
10.2.8 450kWpAC and 550kWpAC LHIB Solar PV
A generic flat plate solar panel was selected from the Homer library and then modified. The losses and performance characteristics, including temperature performance, were modelled as closely as possible to those carried out in Section 9 using PVsyst. Whilst the values were not identical, they were within 6% which was considered acceptable for the purposes of this study review. The following parameters were applied in the Homer model:
2011 10 minute load data
Long-term 60 minute solar data
Homer system timestep 10 minute
Table 10-2 : LHIB Solar Energy Comparison
Layout PVsyst Calculated AEP
(MWh/year)
Homer Calculated AEP
(MWh/year)
450kWpAC Solar 744.9 700.7
550kWpAC Solar 901.3 856.4
10.2.9 Current 83kWpAC and Future 120kWpAC Private Solar PV
The current private solar production was provided by the Board for the period 25 February 2015 to the 01 December 2015. A Homer model was built using the actual solar resource data for this period and applied to a solar PV installation representing the private solar installations collectively. A generic flat plate solar panel was selected from the Homer library, and sized to represent all of the private installations as one 83kWpAC installation. The losses and performance characteristics including temperature performance were based on the actual details of one of the current 4kW installations and assumed to be the same for all of the other installations.
Lord Howe Island Hybrid Renewable Energy Project Technical Feasibility Study
RT019500-0000-GN-RPT-0003 86
Thus a single 83kWpAC installation was modelled in Homer rather than attempting to model every individual installation and this was used to adjust the single de-rating factor in Homer. The following parameters were applied in the Homer model:
2015 10 minute load data
2015 10 minute solar data for 25 February 2015 to 01 December 2015
Homer system timestep 10 minute
Homer includes a generic de-rating factor for solar PV to account for soiling, shading and degradation, the value for this was determined by comparing the results from Homer and the actuals. As result a value of 70% was selected to represent the average de-rating figure for the 83kW system. Whilst 70% might seem like a significant de-rating it is clear from the installation information and analysis of the individual performance that most of the installations are installed in less than ideal arrangements. The resultant values are shown in Table 10-3.
Table 10-3 : Private Solar Energy Comparison
Layout Actual production
(MWh/25Feb2015 to 01Dec2015)
Homer Calculated
(MWh/25Feb2015 to 01Dec2015)
83kWpAC Solar 74 71.4
The size of the system was increased in Homer to 120kWpAC to represent the future full installed capacity whilst retaining all of the values applied to the 83kWpAC system. This same arrangement was modelled in Section 9 using PVsyst and whilst the values were not identical, they were within 1% which was considered acceptable for the purposes of this study review, refer Table 10-4 below. The following parameters were applied in the Homer model:
2011 10 minute load data
Long-term 60 minute solar data
Homer system timestep 10 minute
Table 10-4 : Future Private Solar Energy Comparison
Layout PVsyst Calculated AEP
(MWh/year)
Homer Calculated AEP
(MWh/year)
120kWpAC Solar 137.5 136.6
10.2.10 300kW Detroit Series 60 14l Diesel Genset
A generic 100kW diesel genset was selected from the Homer library and then modified to represent the 300kW Detroit Series 60’s that are installed. The main modifications were to upload the specific fuel curve as defined by Detroit and adjust the rating. The fuel curve was provided by Detroit Diesel (Detroit Diesel, 2007) and is depicted in Figure 10-1 below.

Lord Howe Island Hybrid Renewable Energy Project Technical Feasibility Study
RT019500-0000-GN-RPT-0003 87
Figure 10-1 : Detroit Diesel Genset Fuel Curve
Power values up to 75% of brake horse power (308kW) were considered in the Homer model, providing a fuel curve with a slope of 0.2052litres/kWh. The actual fuel curve from each of the gensets on Lord Howe Island would have been preferable, however due to technical difficulties, it has not been possible to obtain this at the time of writing this report.
The performance of the Homer model in terms of fuel consumption was checked against the data supplied by the Board. The following parameters were applied in the Homer model:
2011 10 minute load data
2015 10 minute load data – no private solar included in this calculation
Homer system timestep 10 minute
Table 10-5 : Fuel Consumption Comparison
Year Lord Howe Island Board
Measured Fuel Consumption
(litres)
Homer Calculated Fuel Consumption
(litres)
2011 585,350 541,823
2015 567,750 526,266
The measured fuel consumption was found to be within 7.5% of the calculated consumption which is sufficient for the purposes of this study review. It is expected that when the actual genset fuel curves are down loaded, they will be steeper than that depicted in Figure 10-1 and hence explain the difference in the measured and calculated values.
The fuel efficiency curve is displayed in Figure 10-2. It shows that at lower loads, these Detroit gensets are significantly less efficient than at higher loads. The Homer model has been set with a minimum operation of 44% of the rated output to keep the gensets operating in the more efficient band. The actual onsite fuel efficiency curves will need to be incorporated into the control system to enable efficient charging of the battery when system loads are low.
0
20
40
60
80
100
120
0 50 100 150 200 250 300 350 400 450 500
Fuel
Cos
umpt
ion
(litre
s/ho
ur)
Power (kW)
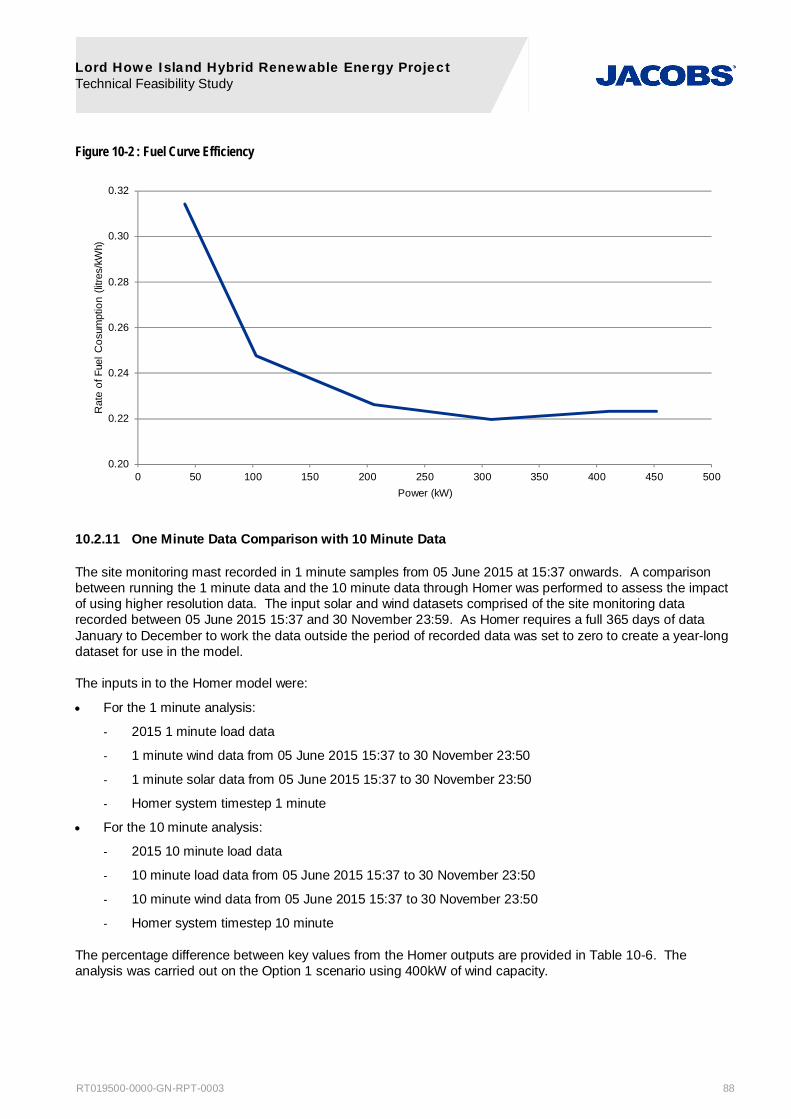
Lord Howe Island Hybrid Renewable Energy Project Technical Feasibility Study
RT019500-0000-GN-RPT-0003 88
Figure 10-2 : Fuel Curve Efficiency
10.2.11 One Minute Data Comparison with 10 Minute Data
The site monitoring mast recorded in 1 minute samples from 05 June 2015 at 15:37 onwards. A comparison between running the 1 minute data and the 10 minute data through Homer was performed to assess the impact of using higher resolution data. The input solar and wind datasets comprised of the site monitoring data recorded between 05 June 2015 15:37 and 30 November 23:59. As Homer requires a full 365 days of data January to December to work the data outside the period of recorded data was set to zero to create a year-long dataset for use in the model.
The inputs in to the Homer model were:
For the 1 minute analysis:
- 2015 1 minute load data
- 1 minute wind data from 05 June 2015 15:37 to 30 November 23:50
- 1 minute solar data from 05 June 2015 15:37 to 30 November 23:50
- Homer system timestep 1 minute
For the 10 minute analysis:
- 2015 10 minute load data
- 10 minute load data from 05 June 2015 15:37 to 30 November 23:50
- 10 minute wind data from 05 June 2015 15:37 to 30 November 23:50
- Homer system timestep 10 minute
The percentage difference between key values from the Homer outputs are provided in Table 10-6. The analysis was carried out on the Option 1 scenario using 400kW of wind capacity.
0.20
0.22
0.24
0.26
0.28
0.30
0.32
0 50 100 150 200 250 300 350 400 450 500
Rat
e of
Fue
l Cos
umpt
ion
(litre
s/kW
h)
Power (kW)

Lord Howe Island Hybrid Renewable Energy Project Technical Feasibility Study
RT019500-0000-GN-RPT-0003 89
Table 10-6 : 1 Minute and 10 Minute Data Comparison
Dataset 1 Minute 10 Minute Comparison
(%)
Renewable Penetration (%) 31.8 31.6 -0.7
Diesel Fuel Consumption (litres) 361,077 361,427 0.1
Genset 1 Run Hours 5989 6187 3.3
Genset 2 Run Hours 3414 3031 -11.2
Genset 1 Production (MWh/year) 1107.6 1174.9 6.1
Genset 2 Production (MWh/year) 450.9 388.8 -13.8
Wind (MWh/year) 450.1 444.9 -1.1
LHIB Solar (MWh/year) 533.2 532.4 -0.2
Private Solar (MWh/year) 96.5 96.4 -0.1
The results in the table above show that there are only very small differences between the Homer outputs when 1 minute and 10 minute datasets are used. The 1 and 10 minute dataset outputs of renewable penetration are similar. The largest differences are observed in the diesel generator outputs which is to be expected due to the diesel generator input parameters which would mean that there would be more frequent switching on and off of the second genset with the 1 minute analysis.
As a result of this analysis it was deemed suitable to use the 10 minute timesteps for the Homer modelling.
Unless stated otherwise in this report, 10 minute timesteps were used in the Homer modelling as this allowed for faster computing time compared to using 1 minute timesteps and still yields similar results to a 1 minute timestep model.
If Homer is asked to use time steps that are less than the data that it has then it will simply carry out a straight line interpolation between the data set values. Given the findings above, uncertainties with many of the elements of the Homer model and that the time steps of the long term data sets (load 10 minute steps, wind and temperature 30 minute and solar 60 minute steps) the decision was made to undertake the modelling for comparison with the BC and optimisation with 10 minute steps.
10.3 Comparison with the Business Case
The key values from the BC for each of the two options and the equivalent calculated in this study using Homer are presented in Table 10-7 and Table 10-8 with a % difference value where relevant. The BC numbers are either from the main BC document or the spreadsheet from Appendix C of the BC.
The Option 1 and Option 2 key values are shown in Table 10-7 and Table 10-8 respectively. Option 1 includes the results based on the previous configuration which consisted of 2 x 275kW wind turbines and also the updated Option 1 scenario consisting of 2 x 200kW wind turbines. The percentage difference in Table 10-7 is based on the 2 x 200kW wind turbine configuration given that the 275kW option is not considered feasible by Vergnet.

Lord Howe Island Hybrid Renewable Energy Project Technical Feasibility Study
RT019500-0000-GN-RPT-0003 90
Table 10-7 : Option 1 Key Values for Comparison
Option 1
550kW or 400kW Wind
450kWpAC LHIB Solar
120kWpAC Private Solar
Business Case AEP
(MWh)
Jacobs AEP
2 x 275kW Wind
(MWh)
Jacobs AEP
2 x 200kW Wind
(MWh)
Percentage Difference from Business Case
(%)
Wind 1366.9 1556.1 1232.2 -10
LHIB Solar 965.8 700.7 700.7 -27
Private Solar 135.8 136.6 136.6 1
Total Solar 1101.6 837.3 837.3 -24
Total Renewable 2468.5 2393.3 2069.5 -16
Excess Renewable Energy 707.7 702.9 453.6 -36
Diesel Genset 1 - 578.1 636.2 -
Diesel Genset 2 - 122.6 136.4 -
Total Diesel Genset Production - 700.6 772.7 -
Total Load (2011) Jacobs Homer Model 1906.5* 2345.0 2345.0 -
Diesel Fuel Consumption (litres) 173,937 163,568 180,375 4
Reduction in Fuel Consumption (%) 70.0 69.8 66.7 -5
Renewable Penetration (%) 84.0 70.1 67.1 -20
Note:
- Includes a 400kW/400kWhAC battery
* The BC spreadsheet noted that the total load was for the period 01 April 2013 to 01 April 2014. However the data supplied by the Board showed the total load for 01 April 2013 to 01 April 2014 to be 2097MWh.
The expected monthly production from each generation source based on Option 1, the long term solar, wind and temperature predictions and the 2011 load profile is provided in Figure 10-3 below.
Figure 10-3 : Option 1 Monthly Energy Production

Lord Howe Island Hybrid Renewable Energy Project Technical Feasibility Study
RT019500-0000-GN-RPT-0003 91
Table 10-8 : Option 2 Key Values for Comparison
Option 2
550kWpAC LHIB Solar
120kWpAC Private Solar
Business Case AEP
(MWh)
Jacobs AEP
(MWh)
Percentage Difference from Business Case
(%)
Wind 0.0 0.0 -
LHIB Solar 1180.4 856.4 -27
Private Solar 135.8 136.6 1
Total Solar 1316.2 993.0 -25
Total Renewable 1316.2 993.0 -25
Excess Renewable Energy 118.0 137.7 17
Diesel Genset 1 - 1229.8 -
Diesel Genset 2 - 286.6 -
Total Diesel Genset Production - 1516.4 -
Total Load (2011) Jacobs Homer Model 1906.5* 2345.0 -
Diesel Fuel Consumption (litres) 369,549 349,307 -5
Reduction in Fuel Consumption (%) 30.0 35.5 18
Renewable Penetration (%) 50.0 35.3 -29
Note:
- Includes a 400kW/400kWhAC battery
* The BC spreadsheet noted that the total load was for the period 01 April 2013 to 01 April 2014. However the data supplied by the Board showed the total load for 01 April 2013 to 01 April 2014 to be 2097MWh.
The expected monthly production from each generation source based on Option 2 and the long term solar, wind and temperature predictions and the 2011 load profile is provided in Figure 10-4 below.
Figure 10-4 : Option 2 Monthly Energy Production

Lord Howe Island Hybrid Renewable Energy Project Technical Feasibility Study
RT019500-0000-GN-RPT-0003 92
10.3.1 Wind Annual Generation
Table 10-7 above shows reasonable agreement between the BC and the numbers calculated in this study using Homer for the AEP from the WTGs. Homer is predicting a greater output which is probably due to the long term average wind speed being slightly higher than was previously thought. As mentioned previously, the Homer calculated number also compares well with the values calculated using WAsP in Section 8.
10.3.2 LHIB Solar PV Annual Generation
The LHIB Solar annual generation calculated in this study is significantly less than the figure used in the BC for either Option 1 or Option 2. The reason for this is the BC LHIB Solar generation figures are based on the NASA insolation data which has been shown to be more optimistic than the more recent and more detailed SolarGIS data (refer to Section 9.2.3) and more optimistic when the site synthesised data is taken into account (refer to Section 9.2.4).
10.3.3 Private Solar PV Annual Generation
The Private Solar annual generation values are relatively similar to the BC in contrast to the LHIB Solar numbers. The Homer values were calculated using the site synthesised solar insolation data, however it is not known how the BC values were derived.
10.3.4 Diesel Fuel Consumption
The diesel fuel consumption values derived in this study for Option 1 are 4% greater than those presented in the BC which will impact the financial and economic models negatively, but are considered to be within the uncertainties for this modelling. The difference in diesel fuel consumption for Option 2 is 5% lower than the BC. As the BC does not include details of how the calculations were undertaken, it is not clear why this difference occurs. Possible explanations could be related to the parameters used in Homer to schedule gensets and/or the genset fuel curve that was used.
The monthly fuel consumption values have been plotted in Section 10.4 for each of the scenarios considered.
10.3.5 Renewable Penetration
For both options much lower Renewable Penetration values were calculated than those quoted in the BC. Renewable Penetration is typically calculated as follows.
Renewable Penetration = 1Diesel Generation
Total Load
Or
Renewable Penetration =Total Reneable Generation Excess Renewable Generation
Total Load
The two reasons for the much lower Renewable Penetration values than those in the BC were determined, these are:
Significantly lower solar PV annual yields for the LHIB Solar PV which affects the numerator
Relatively higher Total Load which affects the denominator
With regards to Total Load, the value used in the BC is 1906.5MWh. This does not match the value derived from the data supplied by the Board for the same period which equalled 2097MWh. The BC spreadsheet does not include the Private Solar in the Renewable Penetration calculation, which makes sense as the load is metered after the contribution by the Private Solar for the dataset they are using. This was not the case for the Homer model used in this study as mentioned above.

Lord Howe Island Hybrid Renewable Energy Project Technical Feasibility Study
RT019500-0000-GN-RPT-0003 93
10.3.6 WTG Curtailment due to Birds and Noise
The potential impact of bird and noise curtailment on the wind energy production discussed in Section 8.3.6 was also investigated in the Homer modelling. The following parameters were applied in the Homer model:
2011 10 minute load data
Long-term 30 minute curtailed wind data – modified to constrain wind turbine operation as per the parameter described in Section 8.3.6 for:
- Noise
- Birds
- Birds and noise
Long-term 60 minute solar data
Homer system timestep 10 minute
The results are provided in Table 10-9.
Table 10-9 : Option 1 Curtailed Key Values for Comparison
Option 1 Curtailed
400kW Wind
450kWpAC LHIB Solar
120kWpAC Private Solar
Jacobs AEP
2 x 200kW Wind
(MWh)
Jacobs AEP
Bird Curtailment
(MWh)
Jacobs AEP
Noise Curtailment
(MWh)
Jacobs AEP
Bird and Noise Curtailment
(MWh)
Wind 1232.2 1164.4 962.2 905.9
Diesel Fuel Consumption (litres) 180,375 201,483 234,219 246,749
Reduction in Fuel Consumption from business as usual (%)
66.7 62.8 56.8 54.5
Renewable Penetration (%) 67.1 62.3 55.9 53.5
Note:
- Includes a 400kW/400kWhAC battery
The results indicate that applying bird and noise curtailment could increase the amount of fuel consumption by approximately 66,000 litres. As discussed in Section 8.3.6, the lost wind generation is largely due to the noise curtailment, and consequently any reduction in the sectors to which this is applied and or wind speeds this is applied to will improve the situation significantly.

Lord Howe Island Hybrid Renewable Energy Project Technical Feasibility Study
RT019500-0000-GN-RPT-0003 94
10.4 Fuel Consumption
The monthly and annual diesel fuel consumption was assessed based on the scenario where no renewables were connected to the system (from the 2011 monthly data provided by the Board and also the business as usual output from Homer) and the options described earlier in this section. Figure 10-5 shows the monthly energy fuel consumption based on these scenarios.
Figure 10-5 : Monthly Fuel Consumption
The graph above shows that Option 1 provides the largest reduction in fuel consumption over the year as expected and is close to the 70% noted in the BC. The annual fuel consumption values are provided in Table 10-10 below.
Table 10-10 : Annual Fuel Consumption based on Homer Modelling
Scenario Annual Fuel Consumption
(litres)
Reduction in Fuel Consumption
(%)
No Renewables 541,823 -
Option 1 180,375 66.7
Option 2 349,307 35.5
Option 2 offers a reduction of just over one third of the no renewables scenario.

Lord Howe Island Hybrid Renewable Energy Project Technical Feasibility Study
RT019500-0000-GN-RPT-0003 95
10.5 Diesel Genset Run Hours
The run hours for the diesel generators are provided in Table 10-11. This shows the number of hours each generator at the powerhouse was producing power based on the Homer system modelling for each option (Option 1 includes the 200kW Vergnet wind turbines). This data will need to be used in any future modelling given diesel genset O&M costs are typically driven by run hours.
Table 10-11 : Diesel Genset Annual Run Hours
Scenario Genset 1 Run Hours
(hours)
Genset 2 Run Hours
(hours)
No Renewables 8703 5077
Option 1 3907 1051
Option 2 6441 2229
As expected, the scenario with the lowest number of run hours is Option 1.
10.6 Diesel Genset Daily Operation
The daily operation of the diesel gensets was also briefly investigated in terms of whether they were generating or not. For this, the 21 June and 21 December data was assessed in order to capture the seasonal variation between the shortest day and the longest day, and hence the typical impact of PV contribution. The diurnal plots are displayed in the following Figures for each option (where Option 1 is plotted this is based on the 200kW Vergnet wind turbine configuration). For these graphs the wind speeds on these days were quite low with an average of 5.4m/s for 21 June and 5.5m/s for 21 December which means very little energy generated from the wind.
Figure 10-6 : Option 1 Diesel Genset Diurnal Variation
The graphs above show that during the day, after about 11:00 in winter and 10:00 in summer, the solar PV generation plus a small amount of wind generation provides sufficient generation to enable the gensets to be switched off. With the evening peak and loss of PV generation, the gensets come back on around 18:00 hours. The Homer model is structured so that the engines run in the upper end of the their efficiency curve so when the second engine is starting to help with the peak demand, it is also used to charge the battery. Although the power demand is low overnight, at least one of the gensets spends most of its time generating which is as a result of the very low wind speed. As mentioned above, both of these days selected for investigation are low wind speed days so the energy contribution from the wind turbines is small.
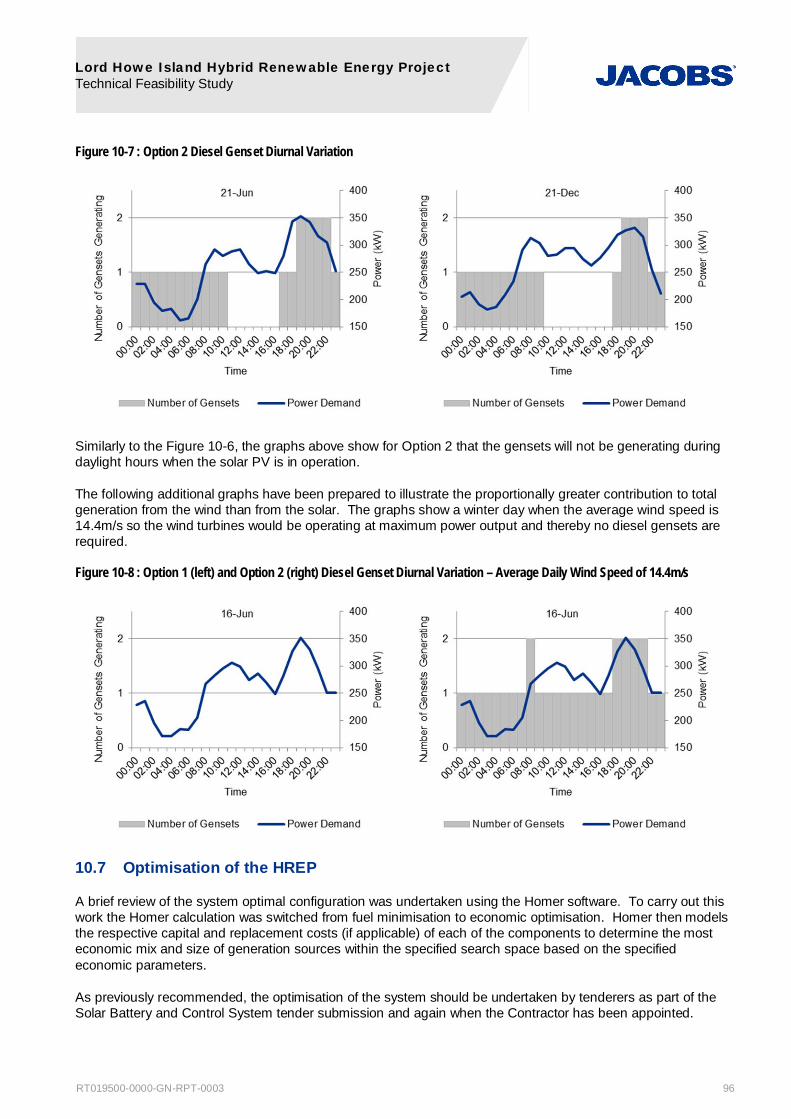
Lord Howe Island Hybrid Renewable Energy Project Technical Feasibility Study
RT019500-0000-GN-RPT-0003 96
Figure 10-7 : Option 2 Diesel Genset Diurnal Variation
Similarly to the Figure 10-6, the graphs above show for Option 2 that the gensets will not be generating during daylight hours when the solar PV is in operation.
The following additional graphs have been prepared to illustrate the proportionally greater contribution to total generation from the wind than from the solar. The graphs show a winter day when the average wind speed is 14.4m/s so the wind turbines would be operating at maximum power output and thereby no diesel gensets are required.
Figure 10-8 : Option 1 (left) and Option 2 (right) Diesel Genset Diurnal Variation – Average Daily Wind Speed of 14.4m/s
10.7 Optimisation of the HREP
A brief review of the system optimal configuration was undertaken using the Homer software. To carry out this work the Homer calculation was switched from fuel minimisation to economic optimisation. Homer then models the respective capital and replacement costs (if applicable) of each of the components to determine the most economic mix and size of generation sources within the specified search space based on the specified economic parameters.
As previously recommended, the optimisation of the system should be undertaken by tenderers as part of the Solar Battery and Control System tender submission and again when the Contractor has been appointed.
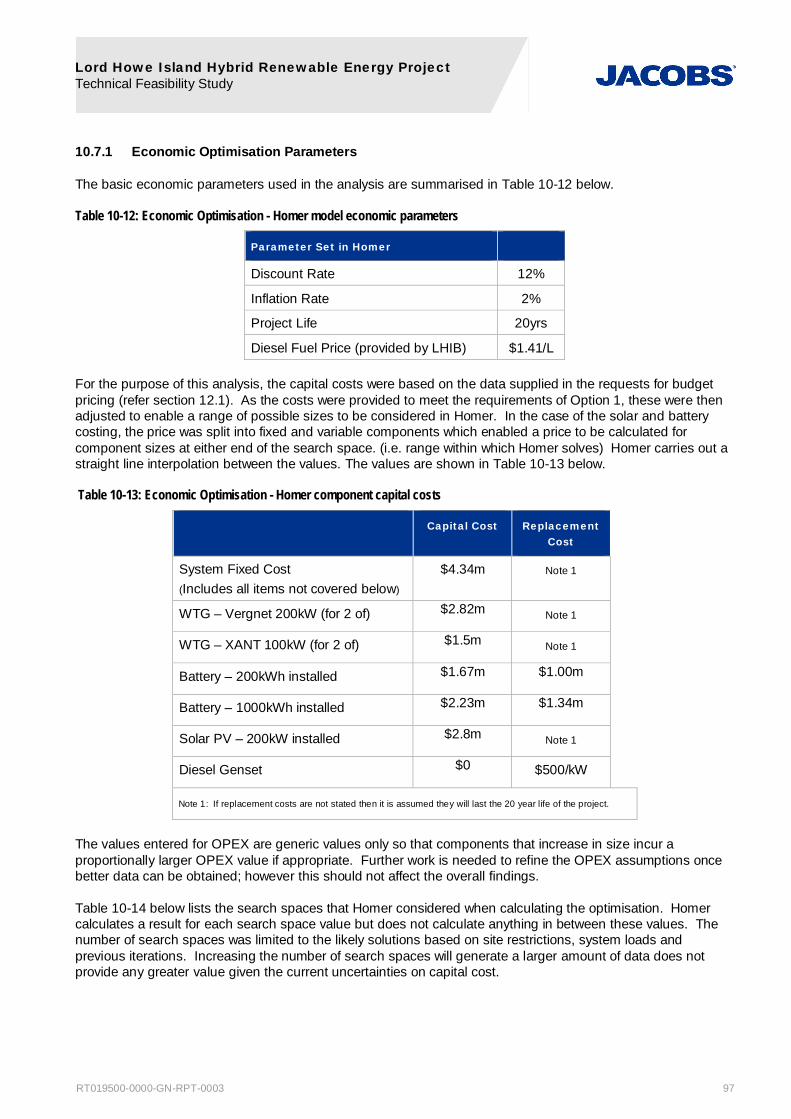
Lord Howe Island Hybrid Renewable Energy Project Technical Feasibility Study
RT019500-0000-GN-RPT-0003 97
10.7.1 Economic Optimisation Parameters
The basic economic parameters used in the analysis are summarised in Table 10-12 below.
Table 10-12: Economic Optimisation - Homer model economic parameters
Parameter Set in Homer
Discount Rate 12%
Inflation Rate 2%
Project Life 20yrs
Diesel Fuel Price (provided by LHIB) $1.41/L
For the purpose of this analysis, the capital costs were based on the data supplied in the requests for budget pricing (refer section 12.1). As the costs were provided to meet the requirements of Option 1, these were then adjusted to enable a range of possible sizes to be considered in Homer. In the case of the solar and battery costing, the price was split into fixed and variable components which enabled a price to be calculated for component sizes at either end of the search space. (i.e. range within which Homer solves) Homer carries out a straight line interpolation between the values. The values are shown in Table 10-13 below.
Table 10-13: Economic Optimisation - Homer component capital costs
Capital Cost Replacement Cost
System Fixed Cost (Includes all items not covered below)
$4.34m Note 1
WTG – Vergnet 200kW (for 2 of) $2.82m Note 1
WTG – XANT 100kW (for 2 of) $1.5m Note 1
Battery – 200kWh installed $1.67m $1.00m
Battery – 1000kWh installed $2.23m $1.34m
Solar PV – 200kW installed $2.8m Note 1
Diesel Genset $0 $500/kW
Note 1: If replacement costs are not stated then it is assumed they will last the 20 year life of the project.
The values entered for OPEX are generic values only so that components that increase in size incur a proportionally larger OPEX value if appropriate. Further work is needed to refine the OPEX assumptions once better data can be obtained; however this should not affect the overall findings.
Table 10-14 below lists the search spaces that Homer considered when calculating the optimisation. Homer calculates a result for each search space value but does not calculate anything in between these values. The number of search spaces was limited to the likely solutions based on site restrictions, system loads and previous iterations. Increasing the number of search spaces will generate a larger amount of data does not provide any greater value given the current uncertainties on capital cost.
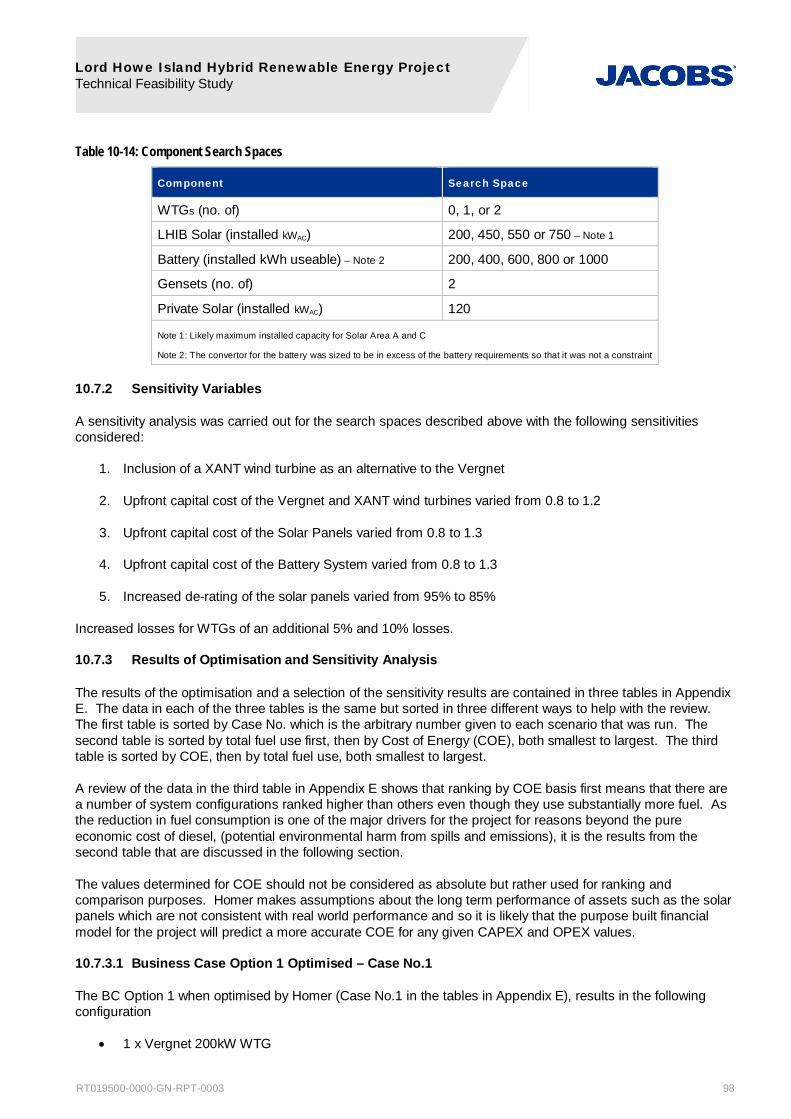
Lord Howe Island Hybrid Renewable Energy Project Technical Feasibility Study
RT019500-0000-GN-RPT-0003 98
Table 10-14: Component Search Spaces
Component Search Space
WTGs (no. of) 0, 1, or 2
LHIB Solar (installed kWAC) 200, 450, 550 or 750 – Note 1
Battery (installed kWh useable) – Note 2 200, 400, 600, 800 or 1000
Gensets (no. of) 2
Private Solar (installed kWAC) 120
Note 1: Likely maximum installed capacity for Solar Area A and C
Note 2: The convertor for the battery was sized to be in excess of the battery requirements so that it was not a constraint
10.7.2 Sensitivity Variables
A sensitivity analysis was carried out for the search spaces described above with the following sensitivities considered:
1. Inclusion of a XANT wind turbine as an alternative to the Vergnet
2. Upfront capital cost of the Vergnet and XANT wind turbines varied from 0.8 to 1.2
3. Upfront capital cost of the Solar Panels varied from 0.8 to 1.3
4. Upfront capital cost of the Battery System varied from 0.8 to 1.3
5. Increased de-rating of the solar panels varied from 95% to 85%
Increased losses for WTGs of an additional 5% and 10% losses.
10.7.3 Results of Optimisation and Sensitivity Analysis
The results of the optimisation and a selection of the sensitivity results are contained in three tables in Appendix E. The data in each of the three tables is the same but sorted in three different ways to help with the review. The first table is sorted by Case No. which is the arbitrary number given to each scenario that was run. The second table is sorted by total fuel use first, then by Cost of Energy (COE), both smallest to largest. The third table is sorted by COE, then by total fuel use, both smallest to largest.
A review of the data in the third table in Appendix E shows that ranking by COE basis first means that there are a number of system configurations ranked higher than others even though they use substantially more fuel. As the reduction in fuel consumption is one of the major drivers for the project for reasons beyond the pure economic cost of diesel, (potential environmental harm from spills and emissions), it is the results from the second table that are discussed in the following section.
The values determined for COE should not be considered as absolute but rather used for ranking and comparison purposes. Homer makes assumptions about the long term performance of assets such as the solar panels which are not consistent with real world performance and so it is likely that the purpose built financial model for the project will predict a more accurate COE for any given CAPEX and OPEX values.
10.7.3.1 Business Case Option 1 Optimised – Case No.1
The BC Option 1 when optimised by Homer (Case No.1 in the tables in Appendix E), results in the following configuration
1 x Vergnet 200kW WTG

Lord Howe Island Hybrid Renewable Energy Project Technical Feasibility Study
RT019500-0000-GN-RPT-0003 99
450kW of solar PV for LHIB; and
800kWh battery
Homer predicts this to have a fuel consumption and COE based on the Homer inputs of 242,876lL and $0.702 in comparison to Homers’ calculation of 200,979lL and $0.728 for the BC Option 1. This illustrates the point made above that greater value should be placed on fuel reduction above and beyond the cost of diesel. Cases 27 and 28 look at increased diesel fuel price, with the results indicating that a 10% increase in fuel makes no difference and a 20% increase, increases the battery size to capture more spilt energy.
Reducing the WTG cost by 10% and increasing the PV costs by 30% drives the optimisation to recommend the BC Option 1 Configuration with a 600kWh battery. Below a 30% PV cost increase the configuration remains the same as Case 1 but, with a higher COE. According to the models, this scenario offers the greatest fuel savings and hence will warrant further investigation at tender stage.
10.7.3.2 Cost increases from the CAPEX Estimate
The tables in Appendix E list the results of sensitivities for a decrease and increase in the capital cost of each of the components in isolation.
Single Component CAPEX Decrease
The reduction in costs of 0.8 and 0.9 to the solar PV or the battery capex cost (refer cases 8, 9, 13 and 14) do not change the proposed configuration and sizing, as shown in 10.7.3.1. The result is a decreasing COE with decreased capex cost.
A reduction in the WTG cost (cases 18 and 19) yields similar but not identical results to the solar PC and battery cases.
Single Component CAPEX Increase
The results of increasing the cost of one of either the WTGs, Solar PV or battery by 1.1, 1.2 and 1.3 results in more significant changes to the component configuration and sizing.
Case 21 is a 20% increase in the WTG capex cost which results in a system with no wind turbines and significantly increased fuel consumption even though the COE is unchanged from the 10% CAPEX case, Case 20. This again highlights the value of the WTG in reducing fuel consumption.
Cases 15, 16 and 17 show the results of solar PV capex increases of 10 to 30% which Homer sizes as 1 WTG, 200kW solar PV and 400kWh of battery.
Cases 10, 11, and 12 show the results of battery capex increases of 10% to 30%, which results in a configuration of 1 WTG, 450kW of solar PV and 600kWh of battery for the 10% and 20% cases but the 30% case reduces the battery to 400kWh and the solar to 200kW. The reduction in solar for the 30% battery capex increase case is a function of spilt energy, i.e. there is not capacity to store the solar PV energy. The smaller battery favours the WTGs in this scenario.
CAPEX Cost Increases across the Components
The three cases modelled with cost increases across the board, case no. 24 with 10%, case no. 25 with 20% and case no. 26 with 30% are interesting. Note these cost increases are only on the components and not on the fixed system amount.
A 10% increase results in 1 WTG, 200kW Solar PV and 400kWh of battery giving a COE of $0.728 and total fuel consumption of 304,728lL. In contrast the 20% rise results in 0 WTGs and an increase to 450kW of solar PV and 800kWh of battery with a COE of $0.752 and 360,296lL of fuel used. The 30% case is identical except the battery reduces to 600kWh and the COE increases to $0.774.

Lord Howe Island Hybrid Renewable Energy Project Technical Feasibility Study
RT019500-0000-GN-RPT-0003 100
10.7.3.3 Under Performance of Wind and Solar
Solar
Case 5 describes the results from a reduction in the performance of the solar panels by 10%. For this case Homer selected 450kW of solar but only 600kWh of battery and 1 Vergnet WTG. The reduced battery size is driven by the lower output from the solar. For this case the COE and total fuel used are only slightly increased from Case 1.
As a result it appears that a substantial reduction in performance is required before there is significant change to the total fuel saved and the COE.
Wind
An additional 5% and 10% of losses was added to the Vergnet WTGs to assess how losses affect the configuration. An additional 5% loss made very little difference (refer Case No.6). However, Case No. 7, a further 10% loss, made a significant increase to total fuel used.
The results from this sensitivity are as expected and line up with the earlier work on curtailment in section 10.3.6 which also showed the impact on increased fuel consumption with reduced WTG output.
10.7.3.4 Alternative WTG
Three sensitivities (0.9, 1.0 and 1.1) were run on the budget pricing received from XANT - refer Case No.s 2, 3 and 4. At current pricing, the XANT returns very similar fuel consumption and COE figures to the Vergnet in the following configuration.
2 x XANT 100kW WTG
450kW of solar PV for LHIB
800kWh battery
This gives an annual fuel consumption of 249,895lL and a COE of $0.696 which is around the amount predicted. If the XANT is 10% cheaper, then it is a clear winner on COE, but if it is 10% more expensive, then the 1 Vergnet WTG comes out better on COE and total fuel consumed basis.
These results highlight the value of a tender process for the WTGs to ensure that a competitive price is obtained and the need to place a value on the total reduction in fuel achieved.
10.7.4 Conclusions
The results of the optimisation, review, suggest that the work carried out by ABB previously in sizing Option 1 used in the BC is reasonable. With the benefit of 12 months of monitoring data confirming the wind and solar resources that are available and some recent pricing updates, it is possible that a more cost effective solution can be obtained. This solution is likely to look very similar to the BC Option 1 with the possible exception that the battery is larger and only 1 WTG may be required.
Two recommendations come out of this work
1. As previously recommended, the optimisation of the system should be undertaken by tenderers as part of the Solar Battery and Control System tender submission and again when the Contractor has been appointed.
2. The value of reduced diesel consumption beyond its basic cost per litre needs to be determined so that a choice between options that have lower COE and options that have lower total fuel consumption can be made.

Lord Howe Island Hybrid Renewable Energy Project Technical Feasibility Study
RT019500-0000-GN-RPT-0003 101
11. Potential Contractors/Equipment Suppliers A brief review was undertaken of the various suppliers in the market who could provide the main items of plant equipment to assess whether there is likely to be any issues with the supply of equipment. It was clear that this project has attracted a lot of interest and there is a strong desire from of suppliers and engineering organisations to be involved. As a consequence, obtaining some competitive tension in a tender process is not expected to be an issue.
The contracting strategy is for an EPC contract which includes the Solar, Battery, Control systems and LV/HV augmentation and a supply, install and commission contract for the WTG(s). The WTG footing design and construction and road design and construction will be a series of minor contracts with some of the physical delivery works being carried out by the LHIB.
11.1 Wind Turbines
Whilst the project has so far been developed using a Vergnet 275kW and more recently the Vergnet 200kW WTG24, a brief investigation of other possible wind turbine suppliers suitable for remote island applications was done. Table 11-1 displays the suppliers and models that were considered.
Table 11-1 : Wind Turbine Supplier Options
Supplier Model Capacity
(kW)
Survival Wind Speed
(m/s) Tower Type
ACSA A27/225 225.0 - Tubular or lattice
Atlantic Orient Canada AOC 15/50 50.0 59.5 Tubular or lattice
Enercon
(no longer produced by Enercon) E33/330 330.0 - Tubular
Energie PGE PGE 20/50 50.0 52.0 Tubular or lattice, tilt up version
available
Energie PGE PGE 20/35 35.0 52.0 Tubular or lattice, tilt up version
available
Fuhrlander FL 250 250.0 67.0 Tubular
Fuhrlander FL 100 100.0 67.0 Tubular
Fuhrlander FL 30 30.0 55.0 Lattice
Proven Proven 15 15.0 70.0 Steel tower
Turbowinds T400-34 400.0 60.0 Welded steel cylindrical tapered
Turbowinds T300-28 300.0 62.0 Welded Steel soft tower
Vergnet GEVMP 275 275.0 83.0 Steel tilt down tower
Windflow Windflow 500 500.0 - Tubular
WTIC Jacob 31-20 20.0 53.6 Lattice
WTIC Jacob 26-17.5 17.5 53.6 Lattice
WTIC Jacob 26-15 15.0 53.6 Lattice
WTIC Jacob 23-12.5 12.5 53.6 Lattice
There are a significant number of wind turbines in the market, as evidenced by the list above, and many of these have been used in remote locations, but there are very few that match the specific desirable 24 The Vergnet 275kW WTG has a 32m rotor, the 200kW machine has a 30m rotor. The rotor diameter is the only physical difference between the
two machines.

Lord Howe Island Hybrid Renewable Energy Project Technical Feasibility Study
RT019500-0000-GN-RPT-0003 102
characteristics of the Vergnet WTG. The use of a WTG other than the Vergnet WTG is feasible, and the tender process will require tenderers to address the specific LHI issues which have so far driven the selection of the Vergnet WTG.
11.2 Batteries There are a number of battery manufacturers, and engineering firms that have alignments with battery manufacturers, covering a range of battery technologies that are currently active in the Australian market. It is not considered that there will be any issue in gaining traction with tenderers in relation to the supply of batteries for this project, despite some of the logistical issues associated with delivering a large battery to site.
Companies such as ABB and Siemens have already both expressed a desire to undertake this project and both can point to similar projects that they have undertaken elsewhere in the world recently, typically with Li-Ion batteries. Other businesses, such as Ecoult, who offer energy storage solutions using a hybrid lead acid battery, have also expressed a desire to provide the energy storage solution for this project.
11.3 Solar Panels
There is a large variety of PV panel and inverters on the market that would be suitable to be installed at Lord Howe Island.
Table 11-2 provides manufacturer details from PV projects above 150kW that have been constructed in Australia in the last 5 years. The table covers installations in a large variety of environments including installations undertaken on rooftops.
Contractor and panel manufacturer information was readily available, but the inverter manufacturer was not listed in all cases.
Table 11-2 : Australian Solar Project Equipment Manufacturers
Project State Capacity
(kW) Main Contractor Panel Inverter Status
Nyngan NSW 102000 First Solar First Solar Central SMA Under construction
Broken Hill NSW 53000 First Solar First Solar Central SMA Under construction
Royalla ACT 20000 Acciona Jinko N/A Operational
Greenough River WA 10000 First Solar First Solar Central SMA Operational
University of Queensland (St Lucia campus)
QLD 1220 Ingenero Trina Solar N/A Operational
NextDC M1 Data Centre VIC 400 Energy Matters REC N/A Operational
Fraser Coast QLD 400 Ingenero Suntech N/A Operational
Toyota Altona North VIC 500 Autonomous Energy Kyocera ABB Operational
Solar Farm Carnarvon WA 290 EMC / Carnarvon Electrics SunPower Fronius Central Operational
Queensland University of Technology
QLD 202 Ingenero SunPower N/A Operational
Johnson & Johnson NSW 200 Apolo Energy Sanyo HIT SMA Operational
Araluen Arts Centre NT 162 Ingenero Q.CELLS SMA Operational
The table above shows a variety of contractors, panel manufacturers and inverters, although it is clear that SMA has a strong position. In addition, Jacobs has been involved with obtaining quotes for PV projects for islands in the Pacific with quotes received from suppliers such as Solartech and RFI, proposing panel manufacturers such as CEEG, Suntech and Bosch, connected to SMA and Samil inverters.

Lord Howe Island Hybrid Renewable Energy Project Technical Feasibility Study
RT019500-0000-GN-RPT-0003 103
11.4 Control System
It is considered that the control system, which successfully controls the HREP and seamlessly operates this in the LHI grid whilst minimising the diesel fuel usage and run hours of the diesel gensets, will be the most challenging engineering task of this project. There are a number of examples within Australia and internationally where systems have been successfully implemented and run for considerable periods of time, demonstrating that it can be done.
The BC for the LHI HREP sets very high renewable energy penetrations25, and significant diesel fuel consumption reduction targets. To achieve the fuel reductions in the order of what is proposed will require the efforts of a control system provider with significant proven track record to ensure that there is no loss of continuity of supply whilst commissioning and tuning the system and meeting these targets.
ABB (formerly Powercorp) has significant experience and a proven track record in this space within Australia, but are not the only possibility. It is considered that a tender process for supply of the control system of the project will elicit a number of responses from different providers and will hence maintain competitive tension in the process.
As a final comment in relation to the control system, Jacobs is aware of work that is being carried out by some providers to include predictive elements to the control system, such as sky measurements to assess cloud movement and the impact on output from the solar systems. Whilst not necessarily a requirement for the HREP as currently proposed, predictive control strategies offer the opportunity to minimise the use of diesel gensets further and hence increase the fuel savings. As such this should be part of the assessment of any service provider.
25 As shown in Section 10.3.5 it is considered that the % penetrations as proposed in the BC case are unachievable with the system proposed,
however the % penetrations calculated in this study are still considered to be high.
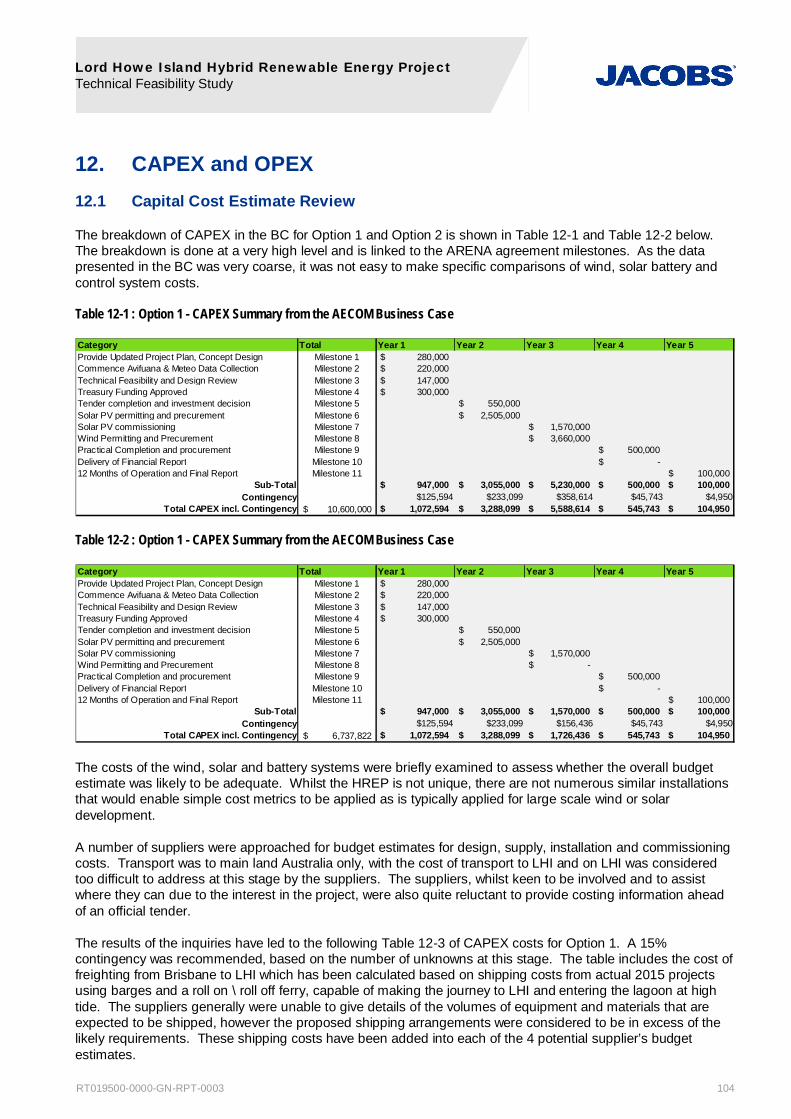
Lord Howe Island Hybrid Renewable Energy Project Technical Feasibility Study
RT019500-0000-GN-RPT-0003 104
12. CAPEX and OPEX 12.1 Capital Cost Estimate Review
The breakdown of CAPEX in the BC for Option 1 and Option 2 is shown in Table 12-1 and Table 12-2 below. The breakdown is done at a very high level and is linked to the ARENA agreement milestones. As the data presented in the BC was very coarse, it was not easy to make specific comparisons of wind, solar battery and control system costs.
Table 12-1 : Option 1 - CAPEX Summary from the AECOM Business Case
Table 12-2 : Option 1 - CAPEX Summary from the AECOM Business Case
The costs of the wind, solar and battery systems were briefly examined to assess whether the overall budget estimate was likely to be adequate. Whilst the HREP is not unique, there are not numerous similar installations that would enable simple cost metrics to be applied as is typically applied for large scale wind or solar development.
A number of suppliers were approached for budget estimates for design, supply, installation and commissioning costs. Transport was to main land Australia only, with the cost of transport to LHI and on LHI was considered too difficult to address at this stage by the suppliers. The suppliers, whilst keen to be involved and to assist where they can due to the interest in the project, were also quite reluctant to provide costing information ahead of an official tender.
The results of the inquiries have led to the following Table 12-3 of CAPEX costs for Option 1. A 15% contingency was recommended, based on the number of unknowns at this stage. The table includes the cost of freighting from Brisbane to LHI which has been calculated based on shipping costs from actual 2015 projects using barges and a roll on \ roll off ferry, capable of making the journey to LHI and entering the lagoon at high tide. The suppliers generally were unable to give details of the volumes of equipment and materials that are expected to be shipped, however the proposed shipping arrangements were considered to be in excess of the likely requirements. These shipping costs have been added into each of the 4 potential supplier’s budget estimates.
Category Total Year 1 Year 2 Year 3 Year 4 Year 5Provide Updated Project Plan, Concept Design Milestone 1 $ 280,000 Commence Avifuana & Meteo Data Collection Milestone 2 $ 220,000 Technical Feasibility and Design Review Milestone 3 $ 147,000 Treasury Funding Approved Milestone 4 $ 300,000 Tender completion and investment decision Milestone 5 $ 550,000 Solar PV permitting and precurement Milestone 6 $ 2,505,000 Solar PV commissioning Milestone 7 $ 1,570,000 Wind Permitting and Precurement Milestone 8 $ 3,660,000 Practical Completion and procurement Milestone 9 $ 500,000 Delivery of Financial Report Milestone 10 $ - 12 Months of Operation and Final Report Milestone 11 $ 100,000
Sub-Total $ 947,000 $ 3,055,000 $ 5,230,000 $ 500,000 $ 100,000 Contingency $125,594 $233,099 $358,614 $45,743 $4,950
Total CAPEX incl. Contingency 10,600,000$ $ 1,072,594 $ 3,288,099 $ 5,588,614 $ 545,743 $ 104,950
Category Total Year 1 Year 2 Year 3 Year 4 Year 5Provide Updated Project Plan, Concept Design Milestone 1 $ 280,000 Commence Avifuana & Meteo Data Collection Milestone 2 $ 220,000 Technical Feasibility and Design Review Milestone 3 $ 147,000 Treasury Funding Approved Milestone 4 $ 300,000 Tender completion and investment decision Milestone 5 $ 550,000 Solar PV permitting and precurement Milestone 6 $ 2,505,000 Solar PV commissioning Milestone 7 $ 1,570,000 Wind Permitting and Precurement Milestone 8 $ - Practical Completion and procurement Milestone 9 $ 500,000 Delivery of Financial Report Milestone 10 $ - 12 Months of Operation and Final Report Milestone 11 $ 100,000
Sub-Total $ 947,000 $ 3,055,000 $ 1,570,000 $ 500,000 $ 100,000 Contingency $125,594 $233,099 $156,436 $45,743 $4,950
Total CAPEX incl. Contingency 6,737,822$ $ 1,072,594 $ 3,288,099 $ 1,726,436 $ 545,743 $ 104,950
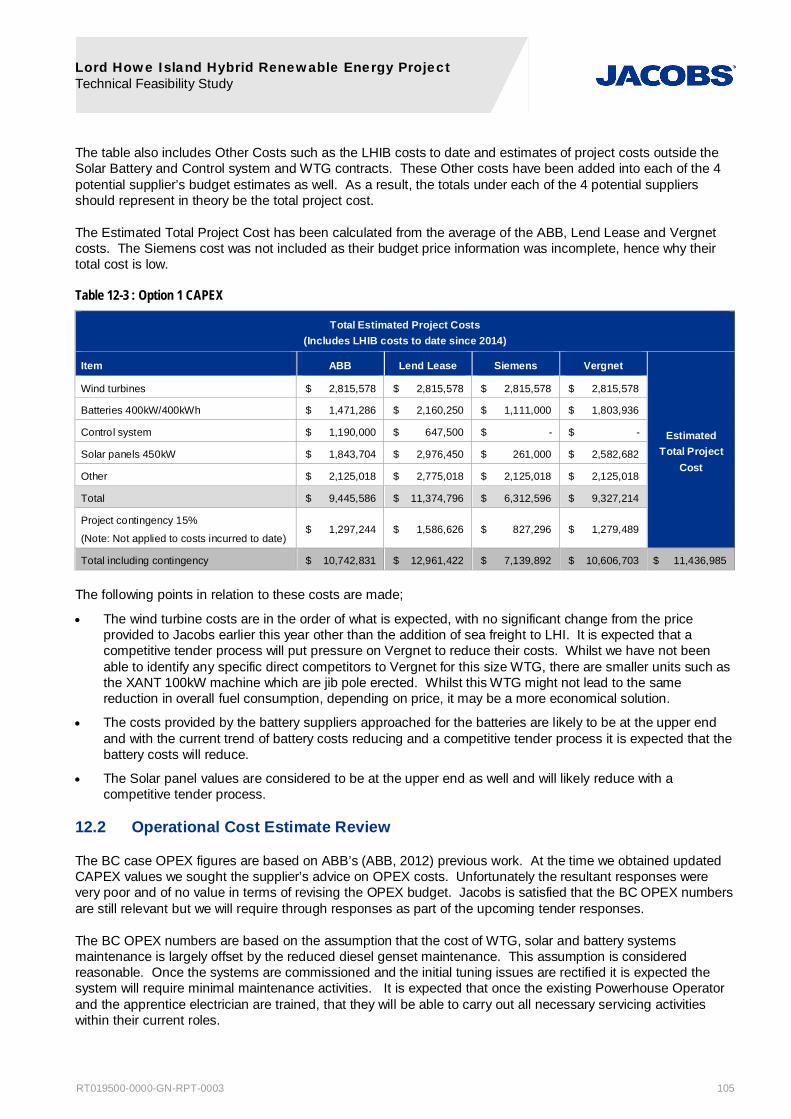
Lord Howe Island Hybrid Renewable Energy Project Technical Feasibility Study
RT019500-0000-GN-RPT-0003 105
The table also includes Other Costs such as the LHIB costs to date and estimates of project costs outside the Solar Battery and Control system and WTG contracts. These Other costs have been added into each of the 4 potential supplier’s budget estimates as well. As a result, the totals under each of the 4 potential suppliers should represent in theory be the total project cost.
The Estimated Total Project Cost has been calculated from the average of the ABB, Lend Lease and Vergnet costs. The Siemens cost was not included as their budget price information was incomplete, hence why their total cost is low.
Table 12-3 : Option 1 CAPEX
Total Estimated Project Costs (Includes LHIB costs to date since 2014)
Item ABB Lend Lease Siemens Vergnet
Estimated Total Project
Cost
Wind turbines $ 2,815,578 $ 2,815,578 $ 2,815,578 $ 2,815,578
Batteries 400kW/400kWh $ 1,471,286 $ 2,160,250 $ 1,111,000 $ 1,803,936
Control system $ 1,190,000 $ 647,500 $ - $ -
Solar panels 450kW $ 1,843,704 $ 2,976,450 $ 261,000 $ 2,582,682
Other $ 2,125,018 $ 2,775,018 $ 2,125,018 $ 2,125,018
Total $ 9,445,586 $ 11,374,796 $ 6,312,596 $ 9,327,214
Project contingency 15%
(Note: Not applied to costs incurred to date) $ 1,297,244 $ 1,586,626 $ 827,296 $ 1,279,489
Total including contingency $ 10,742,831 $ 12,961,422 $ 7,139,892 $ 10,606,703 $ 11,436,985
The following points in relation to these costs are made;
The wind turbine costs are in the order of what is expected, with no significant change from the price provided to Jacobs earlier this year other than the addition of sea freight to LHI. It is expected that a competitive tender process will put pressure on Vergnet to reduce their costs. Whilst we have not been able to identify any specific direct competitors to Vergnet for this size WTG, there are smaller units such as the XANT 100kW machine which are jib pole erected. Whilst this WTG might not lead to the same reduction in overall fuel consumption, depending on price, it may be a more economical solution.
The costs provided by the battery suppliers approached for the batteries are likely to be at the upper end and with the current trend of battery costs reducing and a competitive tender process it is expected that the battery costs will reduce.
The Solar panel values are considered to be at the upper end as well and will likely reduce with a competitive tender process.
12.2 Operational Cost Estimate Review
The BC case OPEX figures are based on ABB’s (ABB, 2012) previous work. At the time we obtained updated CAPEX values we sought the supplier’s advice on OPEX costs. Unfortunately the resultant responses were very poor and of no value in terms of revising the OPEX budget. Jacobs is satisfied that the BC OPEX numbers are still relevant but we will require through responses as part of the upcoming tender responses.
The BC OPEX numbers are based on the assumption that the cost of WTG, solar and battery systems maintenance is largely offset by the reduced diesel genset maintenance. This assumption is considered reasonable. Once the systems are commissioned and the initial tuning issues are rectified it is expected the system will require minimal maintenance activities. It is expected that once the existing Powerhouse Operator and the apprentice electrician are trained, that they will be able to carry out all necessary servicing activities within their current roles.

Lord Howe Island Hybrid Renewable Energy Project Technical Feasibility Study
RT019500-0000-GN-RPT-0003 106
The WTG’s will require annual servicing, but this is no more onerous than a major service on the diesel gensets. The solar PV and battery systems will only require regular checks and occasional breakdown maintenance requiring replacement of parts. The solar panel area will also require some treatment of the grass/weeds around and under the solar panels.
There is an allowance in year 11 of operation for Sustaining Capital or replacement of major components at the end of their life. This is driven by the replacement of battery cells which have typically had a 10 year typical life. The number allowed for here appears reasonable but should be reviewed once the size and type of battery system is settled on and firm pricing is obtained.

Lord Howe Island Hybrid Renewable Energy Project Technical Feasibility Study
RT019500-0000-GN-RPT-0003 107
13. Schedule Revision 1 of this document contained a review of the schedule contained within the BC. The Business Case schedule has been superseded by a more detailed project schedule -, refer Appendix B. The current project schedule has been prepared as a tracking schedule so it includes completion information for work carried out over the past 12 months. The timing of procurement and construction activities has been updated with feedback from suppliers and contractors.
The schedule has been prepared so that the tasks necessary to achieve the ARENA Funding Agreement are linked. Each of the ARENA milestone completion dates are set to finish as soon as possible but also have a designated deadline date, which are the dates proposed in the variation to ARENA in November 2015, amending those from the original Funding Agreement. If the completion date of the ARENA milestone is the same as the deadline date or later, then the predecessor tasks will be on the critical path.
The key risks to this schedule are:
The time taken with the Commonwealth referrals for the WTG approvals.
Shipping delays to LHI for the main items of plant.
Solar Battery and Control system procurement and construction time greater than currently estimated.
Solar Battery and Control system contract signed.
The schedule includes some contingency for each of these items but is insufficient to cover prolonged delays.
The project schedule shows a current practical completion date for the wind solar battery and control system in August 2017, a little over one month ahead of the Milestone 9 requirement of 30 September 2017.

Lord Howe Island Hybrid Renewable Energy Project Technical Feasibility Study
RT019500-0000-GN-RPT-0003 108
14. Power System Studies Jacobs has carried out a Power Systems Study for the HREP, the following text is an extract from the report for this study (Jacobs, 2015).
The purpose of the Power System studies is to confirm that the proposed wind, solar and battery system integration to the Lord Howe Island electricity grid provides a stable network, capable of supplying power with levels of quality and reliability compliant with Australian Standards and LHI users’ expectations.
Power on the island is currently provided by 3 x 300kW diesel generators supplying peak loads from 400kW to 470kW and average loads ranging from 250kW to 280kW depending on the season. The Board also has one 424kW backup generator for emergency situations which was not included in any of the studies as it is never synchronised with the main 3 x 300kW generators. The island currently has load management of the solar water heater boosters.
The Board provided the monthly maximum demand (in Amps) for each substation over the past five years (2010 to 2014). The assessment of the historical load on LHI shows a very minimal or no load growth over the last five years. Therefore, the assessment has been based on 2014 LHI loading levels assuming no growth from 2014 to 2018. The total load at each substation was set to the maximum substation demand across 2014 based on information supplied by the Board. A diversity factor was then applied to scale network loads to equal the total diversified LHI load. The total diversified load has been based on the loading levels provided by the Board for 2014 as following:
Minimum demand (overnight time with no private rooftop solar): 148kW
Minimum demand (daytime with full private rooftop solar): 170kW
Maximum demand: 428kW
This assessment has been based on the power system proposed in the AECOM 2014 Business Case (AECOM, 2014) and with reference to the earlier documents, the Lord Howe Island Renewable Operations Energy Supply Road-Map (Powercorp, 2011) and the Roadmap Implementation Technical Design Specifications (ABB, 2013). Option 1 of the proposed HREP includes 450kWpAC of centralised solar PV and 550kW (2 x 275kW) of wind generation. Option 2 of the HREP replaces the WTGs with an additional 100kWpAC of solar PV installation increasing the centralised solar PV to 550kWpAC. This generation is supported by a 400kWAC/400kWhAC Battery Energy Storage System (BESS) combined with a demand management system to ensure stable operation despite the high level of renewable penetration. The modelling was carried out taking account of including the existing installed private and approved but not installed solar installations totalling 120kWpAC.
In order to undertake the power system studies, a model has been developed of the LHI power network in DIgSILENT software. This model represents the existing LHI network and proposed systems. As the Business Case defined the choice of WTG as the Vergnet 275kW machine, the DIgSILENT WTG model was developed using specific information provided by Vergnet, and as such should closely replicate the real world performance of the WTG as opposed to using a generic model. The solar and battery energy storage system (BESS) models were developed using information and models from ABB. Whilst ABB has not been selected to supply this equipment, their past history with this project and stated intention to bid in the future has meant they were both well informed on the project requirements and willing to provide the DIgSILENT model information. The same information could potentially have been obtained from other suppliers but would likely have been a much slower process whilst they came up to speed with the project.
Power system studies were undertaken for both steady state and dynamic stability conditions.
14.1 Steady State Studies
The LHI network steady state operation has been assessed under various network load and Private Solar roof top output scenarios, refer Table 14-1, mainly to assess the impact on the network voltage and network thermal loading.

Lord Howe Island Hybrid Renewable Energy Project Technical Feasibility Study
RT019500-0000-GN-RPT-0003 109
Table 14-1 : Steady State Studies Scenarios
Scenario No. Operating Conditions LHI Load26
(kW) Private Solar Status
Scenario 1 2018 daily light load during night – assuming no solar generation 148 No solar
Scenario 2 2018 daily light load during daytime – assuming maximum private rooftop solar generation
287 Maximum solar
Scenario 3 2018 daily peak load – assuming no solar generation 545 No solar
Scenario 4 2018 daily peak load - assuming maximum private rooftop solar generation 545 Maximum solar
The following conclusions have been made from the study results.
14) Network steady state voltages remain between 0.96 – 1.01p.u and are satisfactory.
15) The network voltage unbalance varies by only 2% across all three phases across the network and is satisfactory.
16) The network observes the lowest voltages when the private roof top solar PV is not in operation under a high load conditions as the entire load will be supplied from the powerhouse (i.e. mixture of all the energy plants except the Private Solar PV).
17) The voltage variation across the daily load cycle (including variation with roof-top solar) is around 1%. This is a satisfactory result.
18) The network thermal loading across the network remains within the equipment thermal ratings for all the scenarios.
19) Thermal loading will be the highest under a high load conditions with no roof top Private Solar PV generation.
14.2 Dynamic Studies
The dynamic behaviour of all the existing and proposed generating plants and, the LHI network has been assessed for various contingencies (such as loss of load, loss of generation and network faults) under various network load and generator dispatch conditions (Table 14-2).
26 This load represents the actual network loading before being offset by the rooftop solar generation.

Lord Howe Island Hybrid Renewable Energy Project Technical Feasibility Study
RT019500-0000-GN-RPT-0003 110
Table 14-2 : Dynamic Studies Scenarios
Scenario No. Operating Conditions Contingency
1 2018 daily peak load – assuming all solar generating to the maximum capacity
Sudden loss of the central Solar PV plant
2 2018 daily peak load – assuming wind generating to the maximum capacity
Sudden loss of one wind turbine
3 2018 daily low load scenario – night, limited loads, assuming maximum wind power generation
Wind gust (step change from 11m/s to 16m/s)
4 2018 daily peak load – assuming a mix of solar, wind and Diesel in service – to assess how all different generation sources with their control systems interact
1) Sudden change in system load (loss of one feeder supplying either north or south regions zone subs)
2) Sudden loss of Diesel generator
5 2018 daily peak load – assuming one diesel generator in service 1) Fault on 6.6kV network for 200ms
2) Fault on 415V network for 50ms
6 2018 daily low load scenario – night, limited loads 1) Fault on 6.6kV network for 200ms
2) Fault on 415V network for 50ms
The following conclusions have been made from the study results:
1) The BESS will be primarily managing the network frequency and voltages as per the droop settings under all the contingency conditions assessed.
2) The diesel generators will assist in frequency and voltage control when operating as per their droop settings (which will be set higher than the BESS).
3) In order for BESS to manage the load balance, either by supplying or absorbing the power into or from the network respectively, the battery system will need to be charged between 20-80% of its rated capacity. The optimal battery system capacity and charge level needs to be determined at the detailed design stage based on the optimal generator dispatch and scheduling.
4) In fast transient events such as wind gusts, the BESS needs to have enough capacity to absorb high power generation almost instantaneously. If this is not possible then the HREP will need to operate other forms of generation (i.e. Wind, Solar or Diesel) at appropriate levels along with the BESS to manage this instantaneous power increase by quickly reducing their power output levels. The appropriate level of other generation would be determined based on the optimal generator dispatch and scheduling.
5) Under various contingencies such as loss of load or generation or network faults, over or under frequency events with very large frequency deviations were observed. This situation mainly occurs when the network operates with low system inertia (i.e. no conventional generator in service or no wind turbines). This situation can lead to network instability or tripping of various plants due to over or under frequency. This situation can be alleviated by providing some additional inertia into the system by introducing some rotating machine such as diesel generators, a rotating flywheel system or wind turbines.
6) Appropriate solutions to increase the system inertia will need to be evaluated considering their technical and commercial feasibility and considered in the detailed design carried out by the Solar, Battery and Control system contractor.
7) Option 2 of the HREP which replaces the wind turbines with an additional 100kWpAC of solar PV, as proposed by the AECOM Business Case, may increase the risk of reducing the system inertia further and hence compounding the frequency excursion issues.
8) The dynamic models of the plants do not include the protection settings and do not trip the plant for the under and over frequency events mentioned in (5) above. It is recommended that the detailed protection settings for all of the plants are reviewed during the detailed design stage. The frequency settings need to be set to avoid any nuisance tripping of plant.
9) The network voltages due to a 3ph-Short Circuit (SC) fault on the network will drop to close to the zero volts. It is recommended that the zero Fault Ride Through (FRT) capability of all the generating plants is

Lord Howe Island Hybrid Renewable Energy Project Technical Feasibility Study
RT019500-0000-GN-RPT-0003 111
confirmed by the Solar, Battery and Control system contractor as part of their detailed design work. It is important that all the items of plant can ride through such faults on the network.
10) A 3ph-SC fault on the LV network during the low load condition where the entire load was supplied by the BESS resulted in the network being unstable as the required active and reactive power exceeded the BESS rating. This situation can be alleviated by:
a) Additional generation along with the BESS
b) Increasing the size of the BESS
c) Operating one of the diesel generators at low or optimal loading conditions
These solutions will need to be evaluated further technically and commercially to optimise the generation mix to avoid such conditions by the Solar, Battery and Control system contractor as part of their detailed design work.
11) A detailed design for the protection coordination and assessment of the optimal generator dispatch and operating strategy needs to be undertaken as part of the process of settling on the final specifications for all the proposed plant. Further studies will be required to achieve the optimisation and coordination in the LHI network which will need to be carried out by the Solar, Battery and Control system contractor as part of their detailed design work.

Lord Howe Island Hybrid Renewable Energy Project Technical Feasibility Study
RT019500-0000-GN-RPT-0003 112
15. Protection Study A Protection Study for the HREP has been carried out (Jacobs, 2015), a summary of which is provided in the text below.
The electrical protection philosophy and systems needed to integrate the new Hybrid Renewable Energy Project (HREP) power plant into the Lord Howe Island Network were analysed.
Existing protection systems in use in the network are very simple, being based on:
6.6kV over current and earth fault relays
6.6kV transformer fuses
OEM provided protection for the diesel generators
Small network embedded 415V PV plant protection that trips the PV plant when voltage/frequency is out of limits
The existing systems will continue to be fit for purpose after the HREP power plant is placed in service, except in the diesel generator powerhouse where two new 415V protection relays, (with both a reverse power protection function and a check synchronising permissive), should be added to the existing 500kVA generator transformer protections.
The two 275kW wind turbines, 450kWpAC solar PV generator, and 400kW battery that are the generation sources in the HREP power plant, will each require OEM proprietary protection and automatic synchronising systems.
The HREP power plant causes:
A reduction in Lord Howe Island network 6.6kV fault levels
Bidirectional power flows via the new 6.6kV battery and solar switchboard located between the existing 6.6kV network and the various hybrid renewable generation sources
Hence some sophistication is needed for the protection systems used at the 6.6kV battery and solar switchboard. The protection that is used on each of the four 6.6kV feeders emanating from this particular switchboard needs to be an “interconnector” relay specifically designed for connecting wind farms and PV plants into distribution networks. Specific protection and check synchronising functions have been nominated that will need to be armed on each particular 6.6kV feeder “interconnector” relay.
Finally, the potentially low 6.6kV fault levels and bidirectional power flows warrant the use of a busbar protection scheme at the 6.6kV battery and solar bus switchboard to provide sensitive quick acting protection of the switchboard itself.
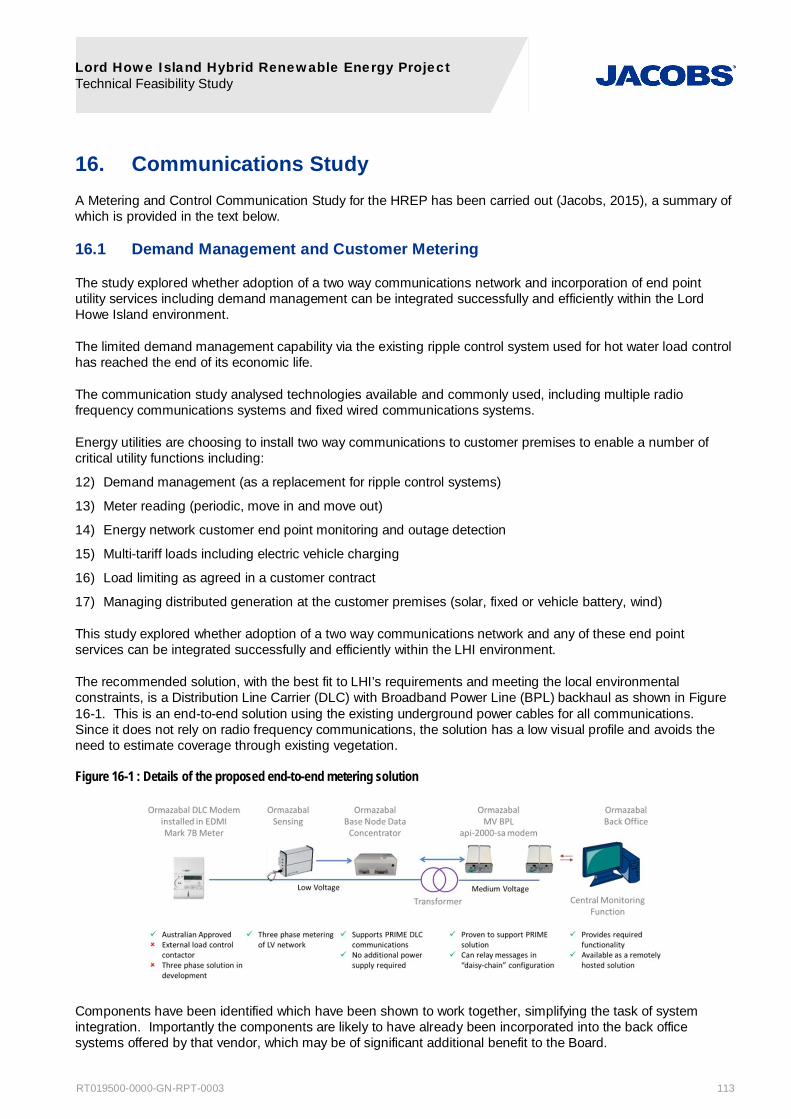
Lord Howe Island Hybrid Renewable Energy Project Technical Feasibility Study
RT019500-0000-GN-RPT-0003 113
16. Communications Study A Metering and Control Communication Study for the HREP has been carried out (Jacobs, 2015), a summary of which is provided in the text below.
16.1 Demand Management and Customer Metering
The study explored whether adoption of a two way communications network and incorporation of end point utility services including demand management can be integrated successfully and efficiently within the Lord Howe Island environment.
The limited demand management capability via the existing ripple control system used for hot water load control has reached the end of its economic life.
The communication study analysed technologies available and commonly used, including multiple radio frequency communications systems and fixed wired communications systems.
Energy utilities are choosing to install two way communications to customer premises to enable a number of critical utility functions including:
12) Demand management (as a replacement for ripple control systems)
13) Meter reading (periodic, move in and move out)
14) Energy network customer end point monitoring and outage detection
15) Multi-tariff loads including electric vehicle charging
16) Load limiting as agreed in a customer contract
17) Managing distributed generation at the customer premises (solar, fixed or vehicle battery, wind)
This study explored whether adoption of a two way communications network and any of these end point services can be integrated successfully and efficiently within the LHI environment.
The recommended solution, with the best fit to LHI’s requirements and meeting the local environmental constraints, is a Distribution Line Carrier (DLC) with Broadband Power Line (BPL) backhaul as shown in Figure 16-1. This is an end-to-end solution using the existing underground power cables for all communications. Since it does not rely on radio frequency communications, the solution has a low visual profile and avoids the need to estimate coverage through existing vegetation.
Figure 16-1 : Details of the proposed end-to-end metering solution
Components have been identified which have been shown to work together, simplifying the task of system integration. Importantly the components are likely to have already been incorporated into the back office systems offered by that vendor, which may be of significant additional benefit to the Board.

Lord Howe Island Hybrid Renewable Energy Project Technical Feasibility Study
RT019500-0000-GN-RPT-0003 114
This communication technology which is available now, is currently being used to support several large meter deployments in international markets. The solution is currently being implemented following successfully trialling at a large Australian distribution utility.
The communications recommendations made in the ABB Technical Design Specifications (ABB, 2013) were reviewed as part of this study. The solution proposed in this Technical Feasibility Study differs significantly from that proposed by ABB which is not considered to address the Boards’ needs.
16.2 HREP Control Concepts
Control and monitoring of a range of different energy sources is required. LHIB envisage that the ‘control and monitoring’ functionality will be delivered with the following interconnected systems:
1) Network of distributed controllers or a single controller with a set of interconnected remote I/O units, the exact nature of this will be determined by the control system contractor;
2) A LHIB Powerhouse communication network utilising Fibre optic cable and supporting routing equipment; and
3) A single LHIB Powerhouse SCADA server, SCADA client (known as the CMF) and an associated SCADA historian server, also providing a link to the web for data sharing.
A general arrangement of these interconnected systems is outlined in Figure 16-2 below.

Lord Howe Island Hybrid Renewable Energy Project Technical Feasibility Study
RT019500-0000-GN-RPT-0003 115
Figure 16-2 Proposed Control System Arrangement for Integrating Energy Sources

Lord Howe Island Hybrid Renewable Energy Project Technical Feasibility Study
RT019500-0000-GN-RPT-0003 116
16.2.1 LHIB Powerhouse Distributed Controller Requirements
The LHIB Powerhouse distributed controller unit configuration will be carried out in such a way that the configuration is standardised across all LHIB Powerhouse distributed controller units and configuration data sourced from a single dataset.
The LHIB Powerhouse distributed controller unit functionality can be summarised as:-
1) Receiving and processing of control messages from the CMF;
2) Collecting, processing and transmitting of signals and measurements;
3) Providing local automation functions as required including but not limited to remote disconnection of the generation asset from the grid in the event of a fault;
4) Self-monitoring and reporting to the CMF on its internal health and data security;
5) Supports an interface to a fibre optic TCP/IP network; and
6) Operates at 24VDC and is capable of energising clean contacts and powering 4-20mA signal loops as required.
The LHIB Powerhouse distributed controller units will operate continuously in a rugged environment without air conditioning or cooling. Each LHIB Powerhouse distributed controller unit will be capable of seamlessly interfacing to electrical plant with varying interoperability and communication limitations.
16.2.2 LHIB Powerhouse Communication Network Requirements
The LHIB Powerhouse communications network as described in Figure 16-2 will allow connection of:-
Energy source interface equipment, intelligent meters and other smart devices; TCP/IP Router device for connection to network devices outside the LHIB Powerhouse. TCP/IP Router device for connection to a LAN comprising a SCADA server, SCADA client and Historian
server.
The LHIB Powerhouse communications network will utilise fibre-optic cable technology. The fibre optic cable will be single mode and graded index glass fibre. All materials in the cable are to be dielectric and no joints will be permitted.
The LHIB Powerhouse communications network will support a range of industry communications protocols standards including but not limited to:-
1) IEC61850; 2) DNP3 over TCP/IP; 3) MODBUS over TCP/IP; 4) EtherNet/IP; or 5) Other industry standard protocols as required.
All devices include routers, switches and communication interfaces shall operate at 24VDC as required.

Lord Howe Island Hybrid Renewable Energy Project Technical Feasibility Study
RT019500-0000-GN-RPT-0003 117
16.2.3 LHIB Powerhouse SCADA Server and Client Requirements
The main SCADA Server and HMI will be located in the Powerhouse office building. The SCADA Server will include all necessary hardware, software, software licenses to support 24/7 operation.
The SCADA HMI, known as the CMF, will allow full viewing, analysis, reporting, fault diagnosis, resetting of faults and control of the wind turbine, diesel generators, battery systems, solar systems, ripple control system and provision to interface to other systems such as electric vehicle charging stations.
The SCADA server will be accessible remotely using a portable PC HMI client, giving full access to the system for operators through appropriate security measures and read only access to a wider group of users who may wish to access the historical data.

Lord Howe Island Hybrid Renewable Energy Project Technical Feasibility Study
RT019500-0000-GN-RPT-0003 118
17. Geotechnical Investigations A Geotechnical Investigation for the HREP has been carried out (Jacobs, 2015), a summary of which is provided in the text below.
17.1 Basis of Recommendations
A geotechnical investigation of the area proposed for WTGs and solar panels was carried out. This section provides a brief overview of the work undertaken and general recommendations for excavations and foundations. The intent of this section is to provide a geotechnical summary only, for design purposes this summary should be read in conjunction with the full Geotechnical Investigation Report including bore logs and laboratory results.
At the time of preparing the Geotechnical Investigation Report, no specific information on foundation loads, excavation depths or final surface levels was available. In addition the locations of the infrastructure and generation equipment are still being developed and could be subject to change. Thus, the information provided in this study and the full Geotechnical Investigation Report is a guide only to provide factual information and design parameters for excavation conditions, access road construction and foundation types. It may be necessary during the detailed design and construction phase to seek further geotechnical advice to confirm assumptions made.
In summary, the geotechnical investigations comprised eighteen (18) test pits excavated to depths of 0.3 to 2.3m with an excavator. Six test pits were located in lot 101, the proposed wind turbines area, and 12 test pits were located in lot 230, around the proposed solar panel array area and along the access road alignment. A select number of laboratory tests were undertaken on soil samples obtained from site for subgrade and durability property assessment.
The following provides a summary of the recommendations made in the Geotechnical Investigation Report during the test pitting programme.
17.2 Earthworks
17.2.1 Excavation Conditions
Trench excavation will be required for power distribution purposes, with trenching invert levels understood to be in the order of 1000 to 1200mm. Trench excavation is likely to occur in stiff to hard clay soils, with areas of shallow basalt outcrop expected in the higher part of the solar array area and along the ridge line at the turbine area.
Excavation will be achievable with conventional excavation equipment (i.e. excavators/backhoes) in the areas with stiff to hard clays but in the areas of basalt outcrop, the use of hydraulic rock picks/hammers, pre-drilling or blasting may be required.
17.2.2 Access Road
The access track is likely to consist of a bitumen sealed track, primarily used to enable access around the site for construction plant and future light vehicle access for maintenance and monitoring.
In the lower lying areas adjacent to the powerhouse, softened materials (unsuitable) were encountered to a depth of 0.5m. It is understood that this area is in an old drainage line which can become water logged during periods of high rainfall. Soil types with higher silt contents when saturated can be problematic to compact and more susceptible to strength loss.
Based on the above the following subgrade and unsuitable material treatments are recommended under footprints of structures, buildings and the access road:

Lord Howe Island Hybrid Renewable Energy Project Technical Feasibility Study
RT019500-0000-GN-RPT-0003 119
All areas are to be stripped of all topsoil and organic matter (if present) which may prevent subsequent layers of engineered materials achieving the specified level of compaction.
Compact and proof roll all exposed soil surfaces with a minimum of 8 passes of a roller of at least 5 tonnes per metre width static weight capacity to detect any soft or compressible areas (or other suitable site equipment such as loaded dump truck). If any unacceptable materials or excessive heaving is found, then they should be excavated and replaced with a compacted engineered fill. Engineered fill should be placed in layers of no more than 250mm loose thickness and compacted to 98% of the standard maximum dry density (SMDD), within -2% to +2% of the optimum moisture content (OMC).
In the low lying areas, the sub-grade soils may need to be treated by over excavation of 500mm and replacement with a bridging layer of material comprising crushed rock wrapped in geotextile to assist in all-weather access and trafficability. It is understood that there is the opportunity for the use of a recycled glass product from the island, which can be crushed to form a product with a size range of 3 to 8mm. Provided the geotextile is specified with a higher grade (i.e. Bidum A64) to reduce potential for tear and puncture, the use of these materials should be feasible subject to assessment on site to determine appropriate layer thicknesses.
Provided the subgrade preparation and treatments recommended above are undertaken, and adequate road cross fall and drainage is provided to prevent subgrade saturation, a design subgrade CBR of 3.5% can be adopted for pavement design.
17.2.3 Wind Turbines
The wind turbines are proposed to be located along the ridge line where shallow bedrock is expected. Foundations options include pad footings and mass concrete supports or anchor bars for cable stays.
For high level pad footings, it is recommended that foundations are extended onto the top of bedrock and designed for an allowable vertical bearing pressure of 1000kPa. For lateral capacity calculations of mass concrete supports and footings, the following soil parameters in Table 17-1 can be adopted for clay soils, (stiff or better) to estimate lateral capacity (assuming level ground, less than 15% grade/cross fall).
Table 17-1 : Anchor Footings
Unit No. Unit name Soil Bulk Density27
(kN/m3)
C’ (Drained)
(kPa)
Phi (Drained)
(degrees)
Cu (Undrained)
(kPa)
Modulus
(Mpa)
Unit 3 Residual soil 12 5 30 75 20
For guy rope supports attached to grouted dowels/bars into bedrock, an ultimate bond adhesion of 500kPa could be adopted. Higher capacities and bond adhesions may be feasible, but subject to proof testing or further investigation at the time of installation.
17.2.4 Solar Panel Arrays
For the design of solar panel array pole supports, it is expected that shallow rock is likely at the current solar panel site. As such, supports will likely need to be socketed into hard rock to provide lateral support by drilling/coring methods. In other areas, where deeper soil is expected > 1.0m, there is considered a risk of lateral slope creep movement of the upper clay soils in steeper areas. Solar array foundations may need to be socketed a minimum of 500mm into bedrock and designed for an allowable lateral and vertical bearing capacity in bedrock of 500kPa. Lateral support of the upper soils should be ignored for calculation purposes.
27 A lower bulk density for the clay soils had been adopted based on results of testing.

Lord Howe Island Hybrid Renewable Energy Project Technical Feasibility Study
RT019500-0000-GN-RPT-0003 120
17.3 Further Assessment
Based on the results of the geotechnical investigations, the key issues and risks identified that need to be considered or further assessed include:
For wind turbine foundations, foundation loads are not expected to be high, with lower bound ultimate bond stresses adopted based on level of testing undertaken (test pits only). If higher capacities are warranted, borehole drilling and coring or proof testing at time of installation could be undertaken.
Creep movement on clay slopes for solar panel array post footings. It is currently recommended that all posts and footings be socketed into underlying rock. If shorter posts in clay soils are being considered for constructability purposes, further geotechnical advice should be sought.
As discussed above, depending on the alignment of trenches and depth of footings, rock excavation in hard rock is likely. Allowances should be made for rock breaking and potentially blasting to achieve levels for excavation and methods for drilling posts to achieve required embedment.
Once site locations and structure details have been determined, further geotechnical input may need to be sought to confirm assumptions and recommendations made above.

Lord Howe Island Hybrid Renewable Energy Project Technical Feasibility Study
RT019500-0000-GN-RPT-0003 121
18. Noise Jacobs was engaged by the Lord Howe Island Board to measure background noise levels and complete an assessment of wind turbine generator (WTG) noise impacts on the Lord Howe Island community, the findings were reported in (Jacobs, 2015). The initial background noise was measured in summer by Jacobs and to address concerns about seasonal variations, the background noise was measured in winter by HutchisonWeller, refer (HutchisonWeller, 2015).
Additional modelling was carried out by HutchisonWeller on the predicted sound power levels due to the string inverters at the nearest dwelling to the solar installations. The results of the modelling are detailed in (HutchisonWeller, 2015)
The WTG noise modelling was undertaken done using the proposed Vergnet 275kW WTGs which are to be installed as shown on drawing A-4 near Transit Hill, at a relative height of approximately 60 - 70m above sea level. Geographical coordinates of the WTGs are proposed to be:
WTG1 – Easting 507064 m, Northing 6511667 m
WTG2 – Easting 507157 m, Northing 6511661 m
The WTG site overlooks the Pinetrees Lodge to the east, which is at a relative height of around 5m, and closest to residences to the north, at a relative height of around 35m above sea level.
18.1 Wind Farm noise guidelines
The assessment work was undertaken with reference to the NSW Department of Planning and Infrastructure (DP&I) released the Draft NSW Planning Guidelines for Wind Farms for consultation in December 2011. The document contains noise guidelines intended to provide guidance on how to measure and assess environmental impacts from wind farms under the Environmental Planning and Assessment Act 1997. The draft guideline was developed with consideration of other guidelines used widely around Australia, including New Zealand; however methodologies and practices in the document most closely follow the South Australian EPA (2009) Wind farms environmental noise guidelines and Australian Standard AS4959 – 2010 Acoustics – Measurement, prediction and assessment of noise from wind turbine generators. Therefore, even though the NSW guideline is in draft form, noise criteria from this document will be used in this assessment since it adopts other recognised and widely used guidelines and is suitably stringent.
A characteristic of wind farms is that the noise level from each WTG rises as the wind speed at the site increases. This increase is generally complemented by an equal or greater increase in the background noise level, which may substantially or even completely mask the WTG noise.
Noise guidelines have been developed to account for fundamental characteristics of wind turbine noise, as described above, and have been established for sensitive receivers located in quiet rural areas. Considering the wind speed at the site, the predicted equivalent noise level (Leq, 10 minute), adjusted for any excessive levels of tonality, amplitude modulation or low frequency, and should not exceed the greater of:
35 dB(A)
OR
The background (L90) noise level by more than 5 dB(A)
This goal:
applies at all relevant receivers not associated with the wind farm,
applies for wind speeds from cut-in to rated power of the WTG and each integer wind speed in between.

Lord Howe Island Hybrid Renewable Energy Project Technical Feasibility Study
RT019500-0000-GN-RPT-0003 122
18.2 Background Noise Measurement and WTG Noise modelling
For the purpose of the assessment, the Island was divided into four receiver catchments, accommodating all relevant receivers. Summer background noise levels were measured at a single location within each receiver catchment concurrently with wind speed and direction over a period of approximately four weeks in January and February 2015. Winter background noise levels were measured at the same locations used in summer over a 4 week period in August. The data was used to establish the correlation between the LA90 10 minute background noise levels and wind speed on the island during the entire 24-hour period as well as separate night and day periods.
Based on this correlation, which is influenced by wind in the trees, ocean and insect noise, LAeq, 10 minute noise assessment criteria were derived for each relevant receiver at 1 m/s wind speed intervals over the range at which the WTGs cut in (4 m/s) and reach rated power (13 m/s)..
Noise levels from the proposed WTGs were predicted at relevant receivers using an acoustic model, Soundplan. Model results incorporated noise emission data provided by the equipment manufacturer (Vergnet, 29/7/2010) as well as island topography and wind blowing from source to receiver (worst-case meteorological conditions).
18.3 Wind Farm Findings
The results of the summer and winter background noise measurement, demonstrated a minor difference between summer and winter background noise levels for the central, western and southern receivers at lower wind speeds. Eastern coastal receivers were found to experience a more substantial difference with lower background noise levels during the winter.
The predicted noise levels, show that the assessment criteria are not likely to be exceeded in either the summer or winter months, with the possible exception of Eastern coastal receivers where wind speeds at hub height of 12 m/s or above may result in a minor exceedance during winter nights. A summary of results is presented in Table 18-1.
Table 18-1 Predicted noise levels compared with assessment criteria for summer and winter nights
Receiver catchment
Period Wind speed at hub-height, m/s
4 5 6 8 9 10 11 12 13
Eastern coastal
Predicted noise LAeq level 31 31 31 38 40 41 48 49 50
Criteria at night winter 44 45 46 47 48 48 48 48 48
Criteria at night summer 49 50 51 52 52 53 54 55 57
Central / Joy’s shop area
Predicted noise LAeq level 25 25 25 32 34 35 42 43 44
Criteria at night winter 41 41 42 43 44 45 46 47 48
Criteria at night summer 40 43 44 45 44 44 45 46 48
Western coastal
Predicted noise LAeq level 37 27 27 34 36 37 44 45 45
Criteria at night winter 39 41 42 43 45 46 47 47 48
Criteria at night summer 41 42 42 43 43 44 45 46 48
Southern Predicted noise LAeq level 16 16 16 24 26 26 34 35 35
Criteria at night winter 42 42 43 44 45 46 47 48 48
Criteria at night summer 40 43 44 45 44 44 45 46 48
During the completion of the report Vergnet indicated that there was a newer model of the proposed 275kW with superior noise insulation however they did not have any official data to support this claim.

Lord Howe Island Hybrid Renewable Energy Project Technical Feasibility Study
RT019500-0000-GN-RPT-0003 123
Post Factum
The recent work that has identified that the 275kW machine is not suitable for the site and that a 200kW machine would need to be used instead should reduce the predicted noise levels. In addition Vergnet have advised that they have a noise insulation package that should also reduce the noise emission from the nacelle.
18.4 Solar Inverter Findings
Based on previous background noise monitoring at nearby sensitive receivers, noise assessment criteria were established in accordance with the Industrial Noise Policy (EPA 2000). Noise levels at the nearest receivers were predicted using SoundPlan, a computer based acoustic software package, using noise emission data for 25 kW string inverters, as provided in manufacturers’ specifications.
Predicted noise levels indicated that inverter noise would not exceed the most stringent noise assessment criteria and would not likely be audible at the nearest receivers for either the proposed 450kW solar farm or a much larger 750kW solar farm.

Lord Howe Island Hybrid Renewable Energy Project Technical Feasibility Study
RT019500-0000-GN-RPT-0003 124
19. Recommendations A number of recommendations have been raised through this Technical Feasibility Study, a summary of the recommendations is provided below:
Table 19-1 : Recommendations
Number Recommendation Responsible Party Date for Completion
1
It is recommended in the future that some optimisation studies are carried out as part of the tender process to balance CAPEX, OPEX, Sustaining CAPEX and potential site constraints that may arise as part of the approvals process.
Jacobs and Tenderers
Tender stages
2 It is recommended that further detailed optimisation analysis is carried out at tender stage and that this analysis includes consideration of the entire life cycle, including disposal.
Jacobs and LHIB Tender stages
3 A requirement of the control system tender should include optionality for predictive control strategies which enable the opportunity to run the HREP system more efficiently.
Control System Tenderer
Tender stages
4
The value of reduced diesel consumption beyond its basic cost per litre needs to be determined so that a choice between options that have a lower COE and options that have a lower total fuel consumption can be made.
Jacobs and LHIB Tender stages
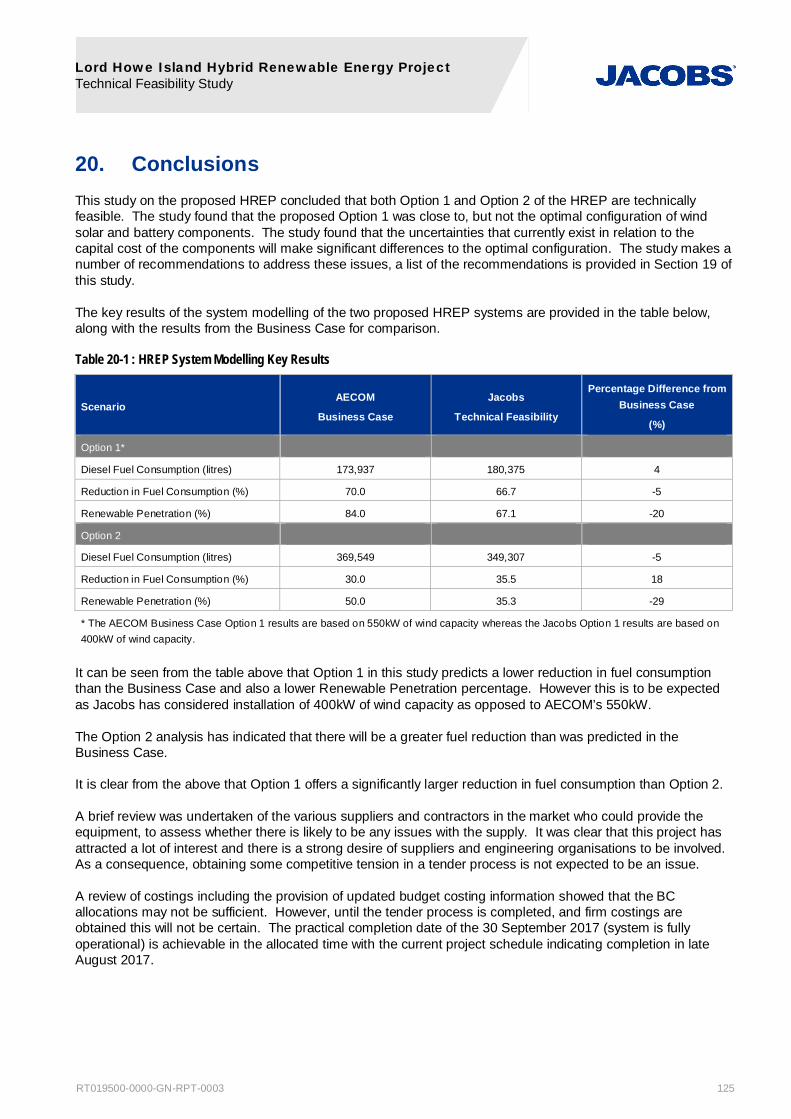
Lord Howe Island Hybrid Renewable Energy Project Technical Feasibility Study
RT019500-0000-GN-RPT-0003 125
20. Conclusions This study on the proposed HREP concluded that both Option 1 and Option 2 of the HREP are technically feasible. The study found that the proposed Option 1 was close to, but not the optimal configuration of wind solar and battery components. The study found that the uncertainties that currently exist in relation to the capital cost of the components will make significant differences to the optimal configuration. The study makes a number of recommendations to address these issues, a list of the recommendations is provided in Section 19 of this study.
The key results of the system modelling of the two proposed HREP systems are provided in the table below, along with the results from the Business Case for comparison.
Table 20-1 : HREP System Modelling Key Results
Scenario AECOM
Business Case
Jacobs
Technical Feasibility
Percentage Difference from Business Case
(%)
Option 1*
Diesel Fuel Consumption (litres) 173,937 180,375 4
Reduction in Fuel Consumption (%) 70.0 66.7 -5
Renewable Penetration (%) 84.0 67.1 -20
Option 2
Diesel Fuel Consumption (litres) 369,549 349,307 -5
Reduction in Fuel Consumption (%) 30.0 35.5 18
Renewable Penetration (%) 50.0 35.3 -29
* The AECOM Business Case Option 1 results are based on 550kW of wind capacity whereas the Jacobs Option 1 results are based on 400kW of wind capacity.
It can be seen from the table above that Option 1 in this study predicts a lower reduction in fuel consumption than the Business Case and also a lower Renewable Penetration percentage. However this is to be expected as Jacobs has considered installation of 400kW of wind capacity as opposed to AECOM’s 550kW.
The Option 2 analysis has indicated that there will be a greater fuel reduction than was predicted in the Business Case.
It is clear from the above that Option 1 offers a significantly larger reduction in fuel consumption than Option 2.
A brief review was undertaken of the various suppliers and contractors in the market who could provide the equipment, to assess whether there is likely to be any issues with the supply. It was clear that this project has attracted a lot of interest and there is a strong desire of suppliers and engineering organisations to be involved. As a consequence, obtaining some competitive tension in a tender process is not expected to be an issue.
A review of costings including the provision of updated budget costing information showed that the BC allocations may not be sufficient. However, until the tender process is completed, and firm costings are obtained this will not be certain. The practical completion date of the 30 September 2017 (system is fully operational) is achievable in the allocated time with the current project schedule indicating completion in late August 2017.

Lord Howe Island Hybrid Renewable Energy Project Technical Feasibility Study
RT019500-0000-GN-RPT-0003 126
21. Bibliography ABB. 2013. Lord Howe Island Energy, Roadmap Implementation, Technical Design Specifications. 2013. Version RB, 9/09/2013.
—. 2012. Stage2: Plan B Business Cases. 2012. Revsion RB, 11/12/2013.
AECOM. 2014. Lord Howe Island Hybrid Renewable Energy Project, Business Case. 2014. Version Final, 22/08/2014.
Australian Bureau of Meteorology. 2015. Lord Howe Island Aero met station data. 2015. 12 February 2015.
Detroit Diesel. 2007. Genst Series 60 Performance Specification. 2007. 20 December 2007.
HutchisonWeller. 2015. Solar power inverter noise assessment . 2015.
—. 2015. Winter background noise monitoring. 2015.
International Electrotechnical Commission. 2005. IEC 61400-1 Ed. 3 Wind turbines: Design requirements. 2005. August 2005.
—. 2005. IEC 61400-12-1 Ed. 1 Wind Turbines: Power performance measurements of electricity producing wind turbines. 2005. December 2005.
Jacobs. 2015. Hybrid Renewable Energy Project, Metering and Control Communications Study. 2015. Revision R01, 19/01/2015.
—. 2015. Hybrid Renewable Energy Project, Power Systems Study. 2015. Revision 0, 27/03/2015.
—. 2015. Hybrid Renewable Energy Project, Protection Study. 2015. Revision 0, 13/03/2015.
—. 2015. LHIB Hybrid Renewable Energy Project, Geotechnical Investigation Report. 2015. Revision 2, 19/01/2015.
—. 2015. Lord Howe Island Solar Photovoltaic Project - Enviromental Report (incorporating a Statement of Enviromental Effects). 2015.
—. 2015. Win Turbine Generator Noise IMapct Assessment. 2015.
Land and Property Information. 2011. Lord Howe Island Satellite Imagery. 2011. lord_howe_islad_2011_09_10cm.ecw. 10 September 2011.
Powercorp. 2011. Lord Howe Island Renwable Operations Energy Supply Road-Map. 2011. Version RF, 30/08/2011.
RPS. 2015. Solar Planning Approval, DA 2016-02. 2015.
TAG173 Pty Ltd, a Licensee of The Airport Group. 2015. AVIATION IMPACT STATEMENT Lord Howe Island Wind Turbines. 2015.
Vergnet. 29/7/2010. Appendix A Manufacturer sound power data. 29/7/2010.
—. 2012. GEVMP 30 Thrust Coefficient Curve. 2012.
—. 2014. GEVMP 30/200 Power Curve. 2014.
—. 2012. GEVMP 32 Thrust Coefficient Curve. 2012. 20 March 2012.

Lord Howe Island Hybrid Renewable Energy Project Technical Feasibility Study
RT019500-0000-GN-RPT-0003 127
—. 2009. GEVMP 32/275L Power Curve. 2009. 21 January 2009.
—. 2010. GEVMP-C Civil Works description. 2010. 12 January 2010.
—. 2006. TUB55 Turbine Setting Out. 2006. 20 July 2006.
XANT. 2015. XANT M-21 - General Specifications. 2015.
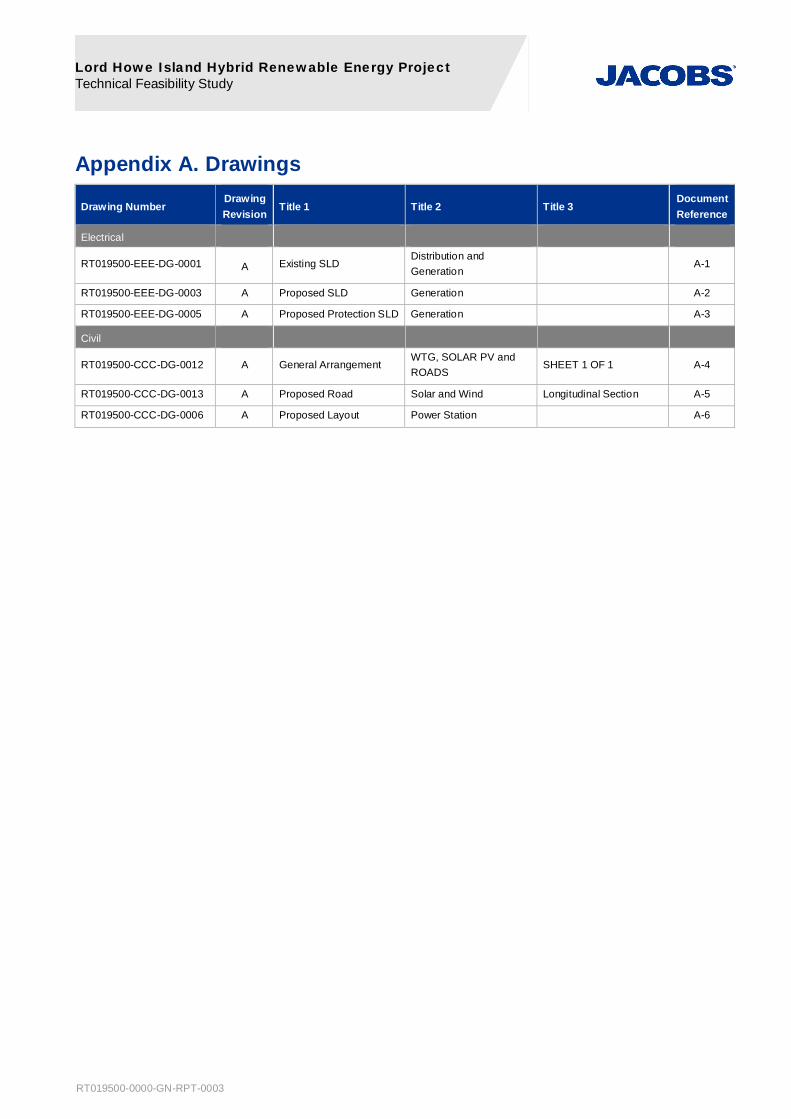
Lord Howe Island Hybrid Renewable Energy Project Technical Feasibility Study
RT019500-0000-GN-RPT-0003
Appendix A. Drawings
Drawing Number Drawing Revision
Title 1 Title 2 Title 3 Document Reference
Electrical
RT019500-EEE-DG-0001 A Existing SLD Distribution and Generation
A-1
RT019500-EEE-DG-0003 A Proposed SLD Generation A-2
RT019500-EEE-DG-0005 A Proposed Protection SLD Generation A-3
Civil
RT019500-CCC-DG-0012 A General Arrangement WTG, SOLAR PV and ROADS
SHEET 1 OF 1 A-4
RT019500-CCC-DG-0013 A Proposed Road Solar and Wind Longitudinal Section A-5
RT019500-CCC-DG-0006 A Proposed Layout Power Station A-6
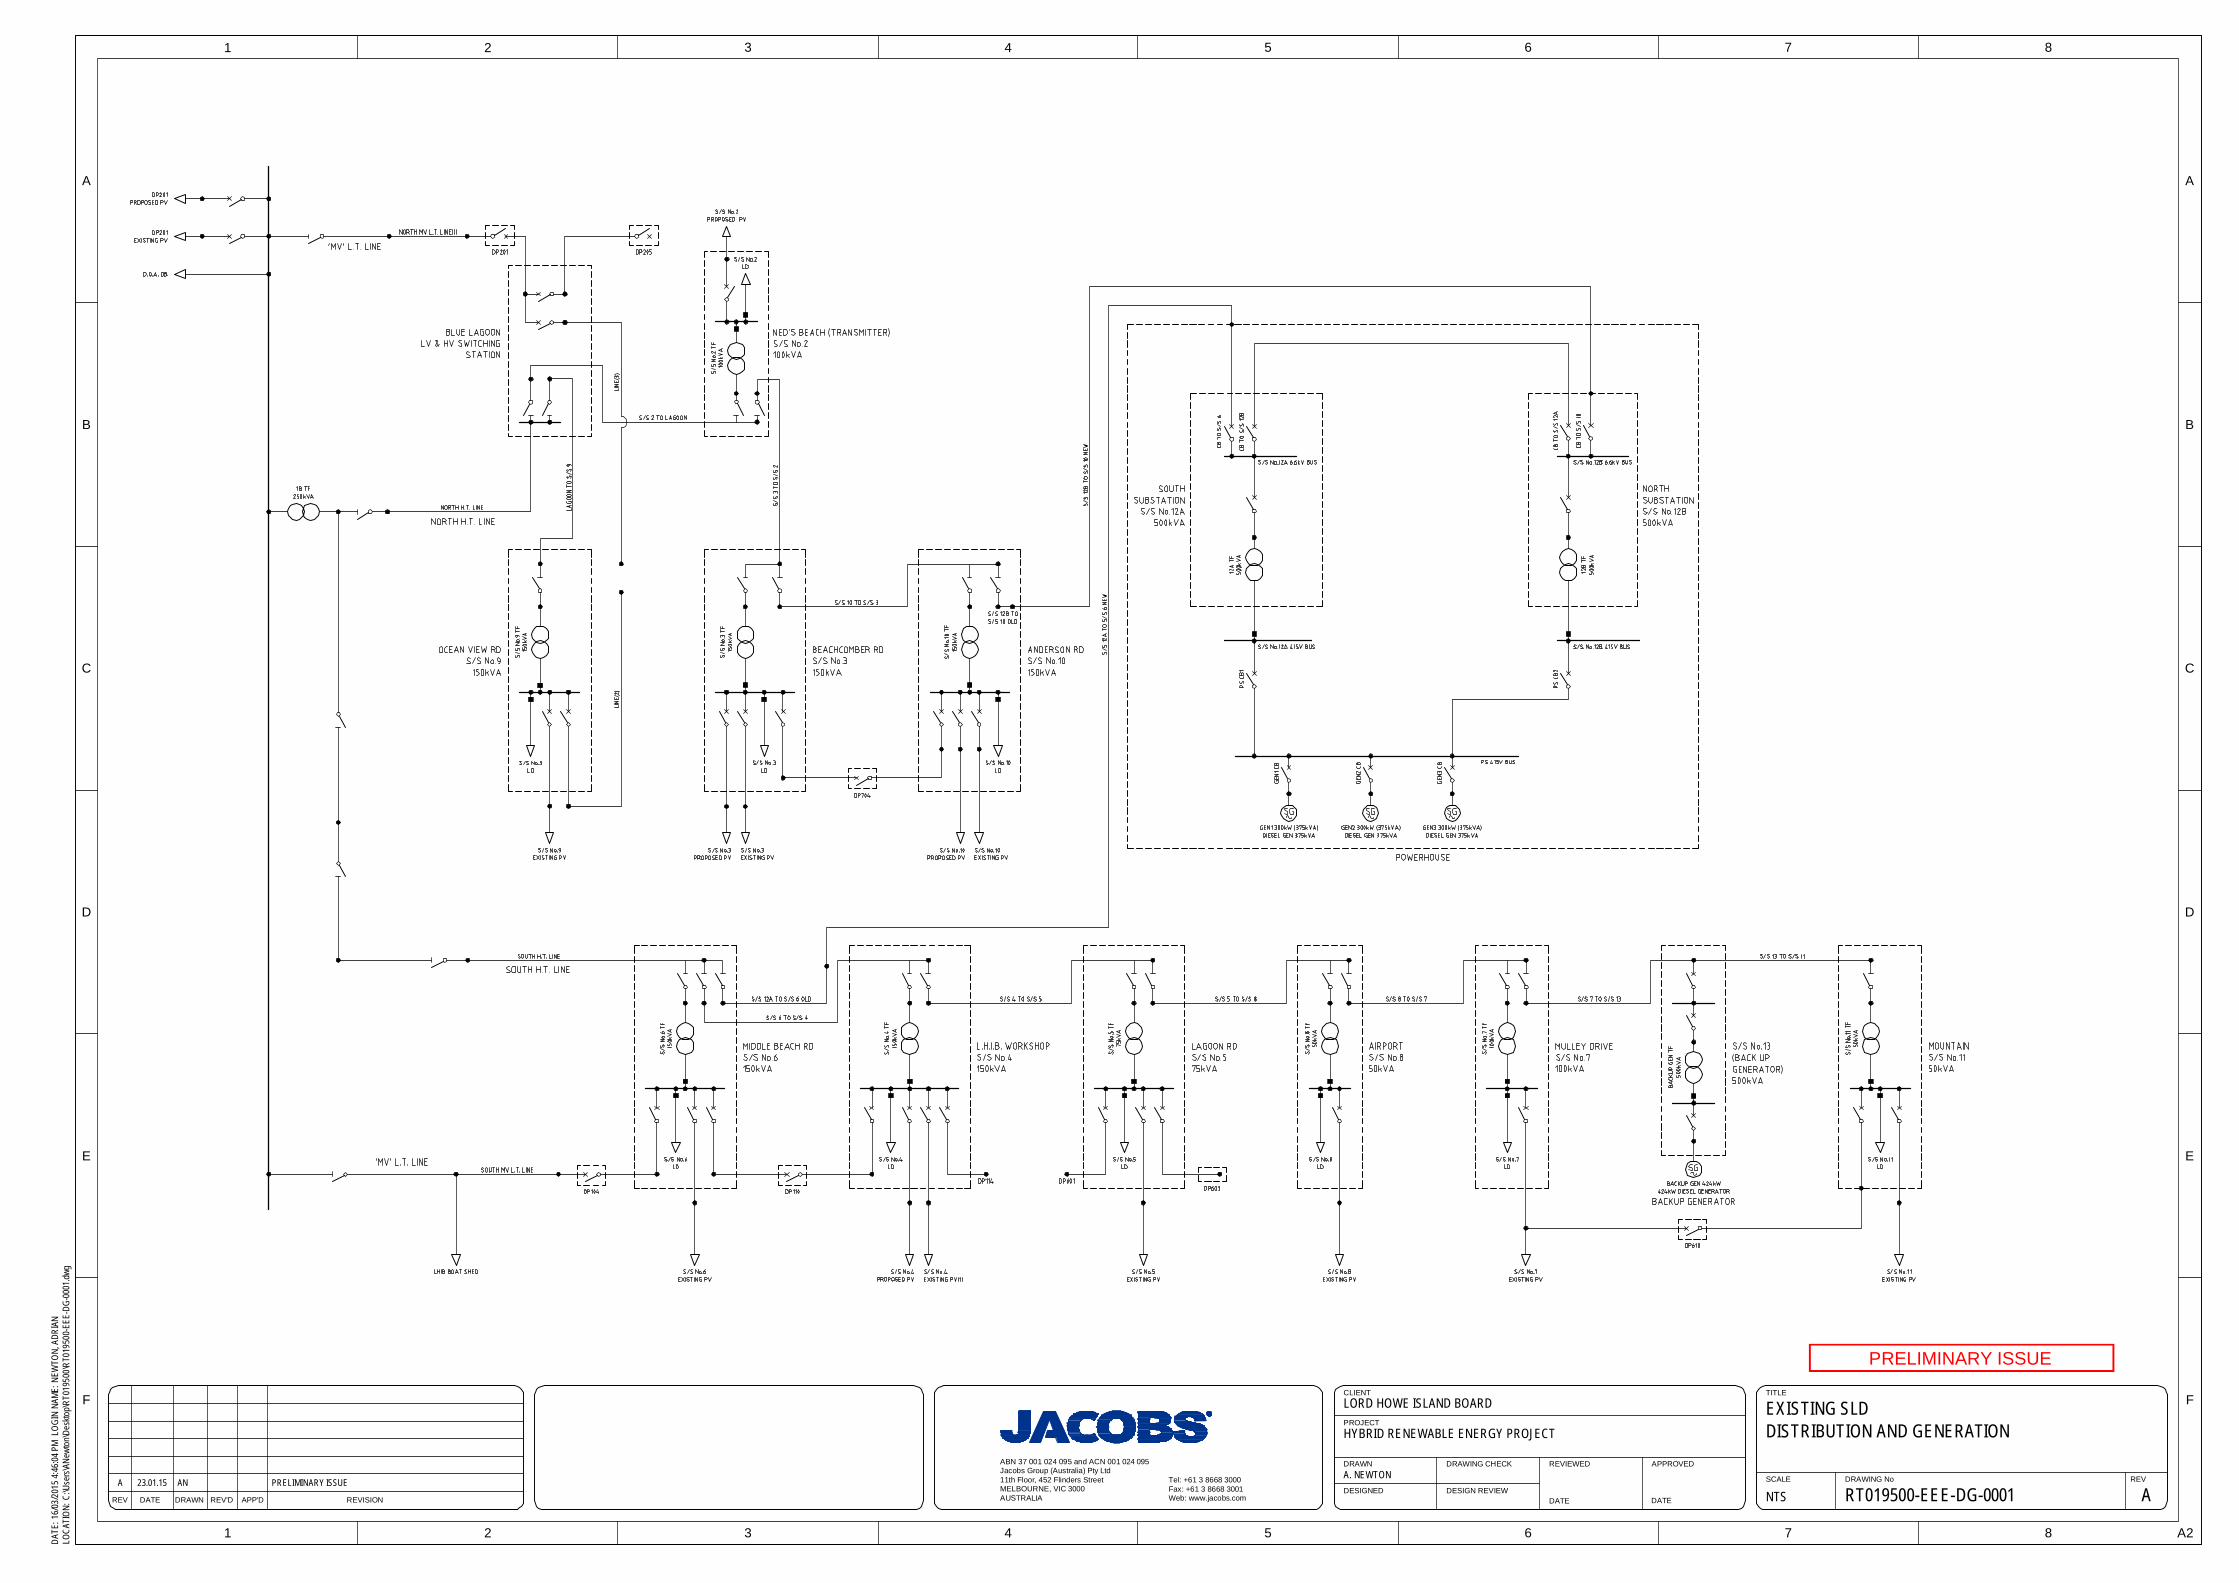
EXISTING SLDDISTRIBUTION AND GENERATION
NTS RT019500-EEE-DG-0001
LORD HOWE ISLAND BOARD
A
HYBRID RENEWABLE ENERGY PROJECT
A. NEWTONA 23.01.15 AN PRELIMINARY ISSUE
A
B
C
D
E
F
A
B
C
D
E
F
1 2 3 4 5 6 7 8
1 2 3 4 5 6 7 8 A2
DRAWING NoSCALE
TITLE
REV
REV DATE REVISIONDRAWN REV'D APP'D
DATE
: 16/0
3/201
5 4:46
:04 P
MLO
GIN
NAME
: NEW
TON,
ADR
IAN
LOCA
TION
: C:\U
sers\
ANew
ton\D
eskto
p\RT0
1950
0\RT0
1950
0-EE
E-DG
-0001
.dwg
DRAWING CHECK
DESIGN REVIEWDESIGNED
DRAWN
CLIENT
REVIEWED APPROVED
PROJECT
DATE DATE
ABN 37 001 024 095 and ACN 001 024 095Jacobs Group (Australia) Pty Ltd11th Floor, 452 Flinders StreetMELBOURNE, VIC 3000AUSTRALIA
Tel: +61 3 8668 3000Fax: +61 3 8668 3001Web: www.jacobs.com
PRELIMINARY ISSUE

PROPOSED SLDGENERATION
NTS RT019500-EEE-DG-0003 A
LORD HOWE ISLAND BOARD
HYBRID RENEWABLE ENERGY PROJECT
A. NEWTONA 25.02.15 AN PRELIMINARY ISSUE
1 2 3 4 5 6
1 2 3 4 5 6
A
B
C
D
A
B
C
D
A3
DRAWING No
DATE
DRAWING CHECK
DESIGN REVIEWDESIGNED
DRAWN
CLIENT
REVIEWED
DATE
APPROVED
SCALE
TITLE
REV
REV DATE REVISIONDRAWN REV'D APP'D
PROJECT
DATE
: 16/0
3/201
5 4:46
:10 P
MLO
GIN
NAME
: NEW
TON,
ADR
IAN
LOCA
TION
: C:\U
sers\
ANew
ton\D
eskto
p\RT0
1950
0\RT0
1950
0-EE
E-DG
-0003
.dwg
ABN 37 001 024 095 and ACN 001 024 095Jacobs Group (Australia) Pty Ltd11th Floor, 452 Flinders StreetMELBOURNE, VIC 3000AUSTRALIA
Tel: +61 3 8668 3000Fax: +61 3 8668 3001Web: www.jacobs.com
PRELIMINARY ISSUE

PROPOSED PROTECTION SLDGENERATION
NTS RT019500-EEE-DG-0005 A
LORD HOWE ISLAND BOARD
HYBRID RENEWABLE ENERGY PROJECT
A. NEWTONA 25.02.15 AN PRELIMINARY ISSUE
1 2 3 4 5 6
1 2 3 4 5 6
A
B
C
D
A
B
C
D
A3
DRAWING No
DATE
DRAWING CHECK
DESIGN REVIEWDESIGNED
DRAWN
CLIENT
REVIEWED
DATE
APPROVED
SCALE
TITLE
REV
REV DATE REVISIONDRAWN REV'D APP'D
PROJECT
DATE
: 16/0
3/201
5 4:46
:17 P
MLO
GIN
NAME
: NEW
TON,
ADR
IAN
LOCA
TION
: C:\U
sers\
ANew
ton\D
eskto
p\RT0
1950
0\RT0
1950
0-EE
E-DG
-0005
.dwg
ABN 37 001 024 095 and ACN 001 024 095Jacobs Group (Australia) Pty Ltd11th Floor, 452 Flinders StreetMELBOURNE, VIC 3000AUSTRALIA
Tel: +61 3 8668 3000Fax: +61 3 8668 3001Web: www.jacobs.com
PRELIMINARY ISSUE
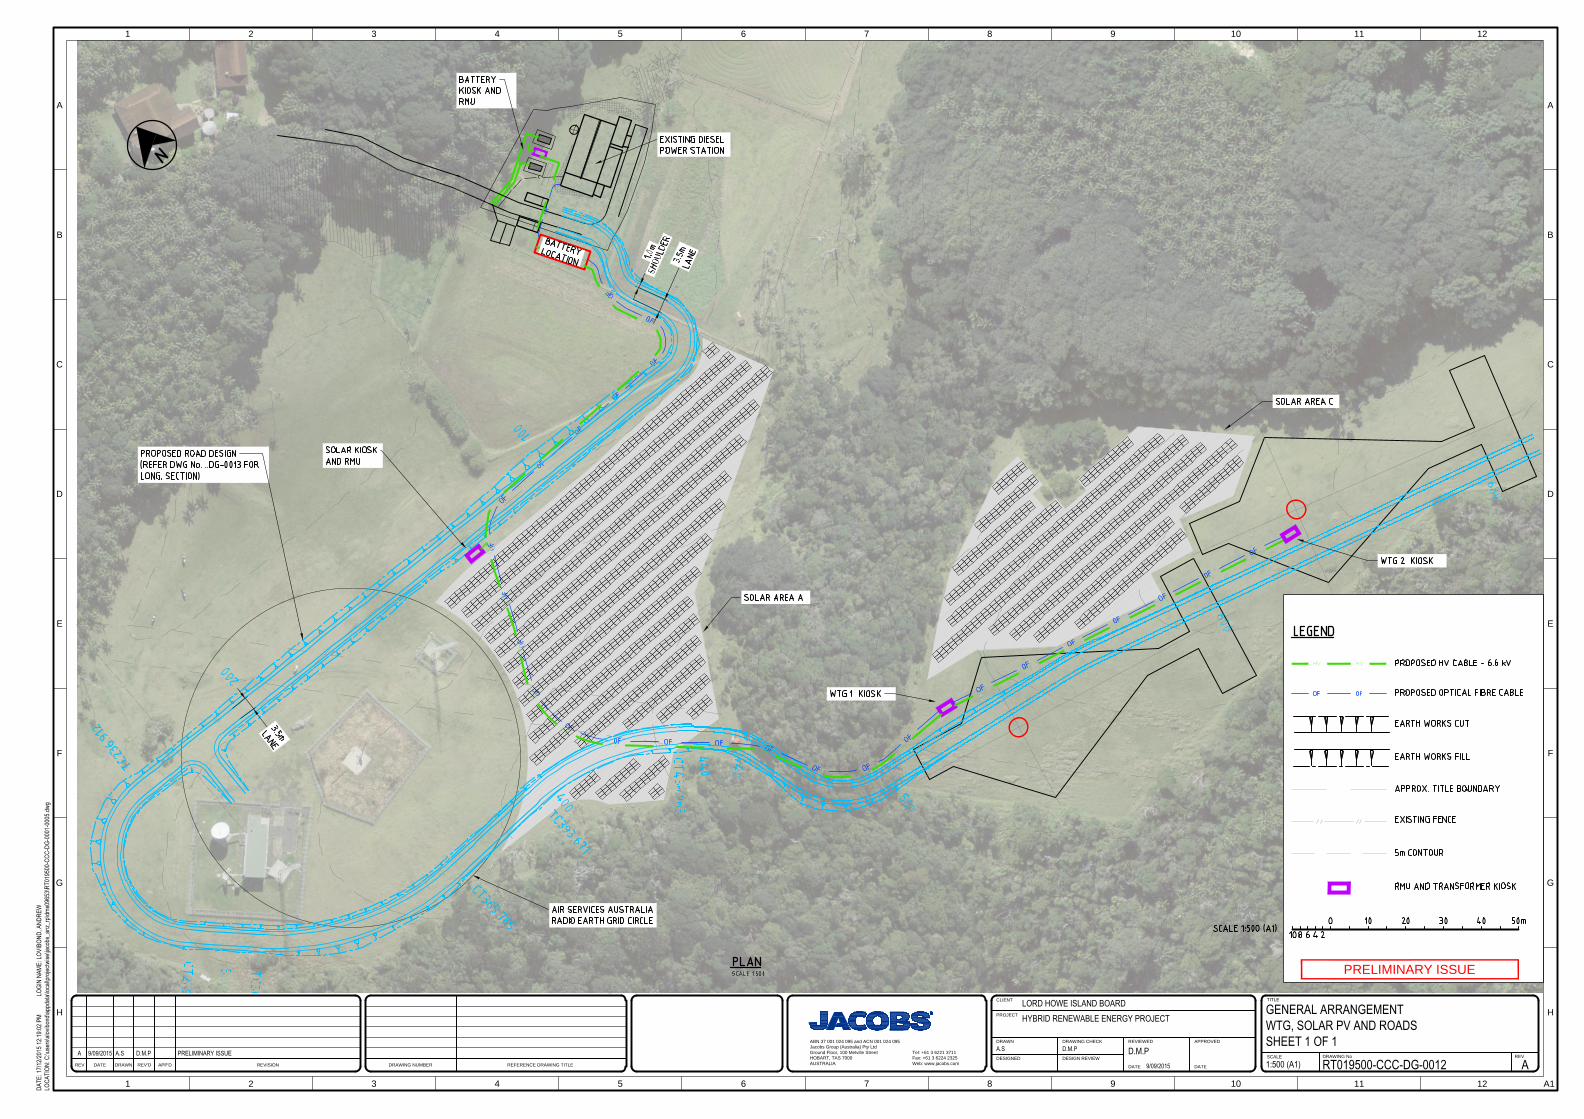
GENERAL ARRANGEMENTWTG, SOLAR PV AND ROADSSHEET 1 OF 11:500 (A1) RT019500-CCC-DG-0012 A
LORD HOWE ISLAND BOARDHYBRID RENEWABLE ENERGY PROJECT
A.S D.M.P D.M.P9/09/2015
A 9/09/2015 A.S D.M.P PRELIMINARY ISSUE
1 2 3 4 5 6 7 8 9 10 11 12
1 2 3 4 5 6 7 8 9 10 11 12
A
B
C
D
E
F
G
H
A
B
C
D
E
F
G
H
DATEREV DRAWN REVISION DRAWING NUMBER REFERENCE DRAWING TITLE
CLIENT
DRAWN DRAWING CHECK REVIEWED APPROVED
SCALE
TITLE
DRAWING No REV
A1
PROJECT
DESIGNED DESIGN REVIEW
DATE DATE
REV'D APP'D
DATE
: 17/1
2/201
5 12:1
9:02 P
MLO
GIN
NAME
: LOV
IBON
D, A
NDRE
WLO
CATI
ON: C
:\use
rs\alo
vibon
d\app
data\
local\
proje
ctwise
\jaco
bs_a
nz_r
p\dms
0965
3\RT0
1950
0-CC
C-DG
-000
1-00
05.dw
g
ABN 37 001 024 095 and ACN 001 024 095
Jacobs Group (Australia) Pty Ltd
Ground Floor, 100 Melville Street
HOBART, TAS 7000
AUSTRALIA
Tel: +61 3 6221 3711
Fax: +61 3 6224 2325
Web: www.jacobs.com
PRELIMINARY ISSUE

PROPOSED ROADSOLAR AND WINDLONGITUDINAL SECTION1:1000 (A1) RT019500-CCC-DG-0013 A
LORD HOWE ISLAND BOARDHYBRID RENEWABLE ENERGY PROJECT
M.Y D.M.P D.M.P17/03/2015
A 17/03/2015 M.Y D.M.P PRELIMINARY ISSUE
1 2 3 4 5 6 7 8 9 10 11 12
1 2 3 4 5 6 7 8 9 10 11 12
A
B
C
D
E
F
G
H
A
B
C
D
E
F
G
H
DATEREV DRAWN REVISION DRAWING NUMBER REFERENCE DRAWING TITLE
CLIENT
DRAWN DRAWING CHECK REVIEWED APPROVED
SCALE
TITLE
DRAWING No REV
A1
PROJECT
DESIGNED DESIGN REVIEW
DATE DATE
REV'D APP'D
DATE
: 16/1
2/201
5 5:08
:50 P
MLO
GIN
NAME
: LOV
IBON
D, A
NDRE
WLO
CATI
ON: C
:\use
rs\alo
vibon
d\app
data\
local\
proje
ctwise
\jaco
bs_a
nz_r
p\dms
0965
3\RT0
1950
0-CC
C-DG
-000
1-00
05.dw
g
ABN 37 001 024 095 and ACN 001 024 095
Jacobs Group (Australia) Pty Ltd
Ground Floor, 100 Melville Street
HOBART, TAS 7000
AUSTRALIA
Tel: +61 3 6221 3711
Fax: +61 3 6224 2325
Web: www.jacobs.com
PRELIMINARY ISSUE

PROPOSED LAYOUTPOWER STATION
1:200 (A1) RT019500-CCC-DG-0006 A
LORD HOWE ISLAND BOARDHYBRID RENEWABLE ENERGY PROJECT
M.Y D.M.P D.M.P17/03/2015
A 17/03/2015 M.Y D.M.P PRELIMINARY ISSUE
1 2 3 4 5 6 7 8 9 10 11 12
1 2 3 4 5 6 7 8 9 10 11 12
A
B
C
D
E
F
G
H
A
B
C
D
E
F
G
H
DATEREV DRAWN REVISION DRAWING NUMBER REFERENCE DRAWING TITLE
CLIENT
DRAWN DRAWING CHECK REVIEWED APPROVED
SCALE
TITLE
DRAWING No REV
A1
PROJECT
DESIGNED DESIGN REVIEW
DATE DATE
REV'D APP'D
DATE
: 17/0
3/201
5 2:22
:02 P
MLO
GIN
NAME
: YOS
HIDA
, MAR
ILO
CATI
ON: C
:\Use
rs\MY
oshid
a\Des
ktop\L
HI\D
RAW
ING\
RT01
9500
-CCC
-DG-
0006
.dwg
ABN 37 001 024 095 and ACN 001 024 095
Jacobs Group (Australia) Pty Ltd
Ground Floor, 100 Melville Street
HOBART, TAS 7000
AUSTRALIA
Tel: +61 3 6221 3711
Fax: +61 3 6224 2325
Web: www.jacobs.com
PRELIMINARY ISSUE

Lord Howe Island Hybrid Renewable Energy Project Technical Feasibility Study
RT019500-0000-GN-RPT-0003
Appendix B. Project Schedule LHIB HREP Overall Project Schedule 151215 Update.mpp
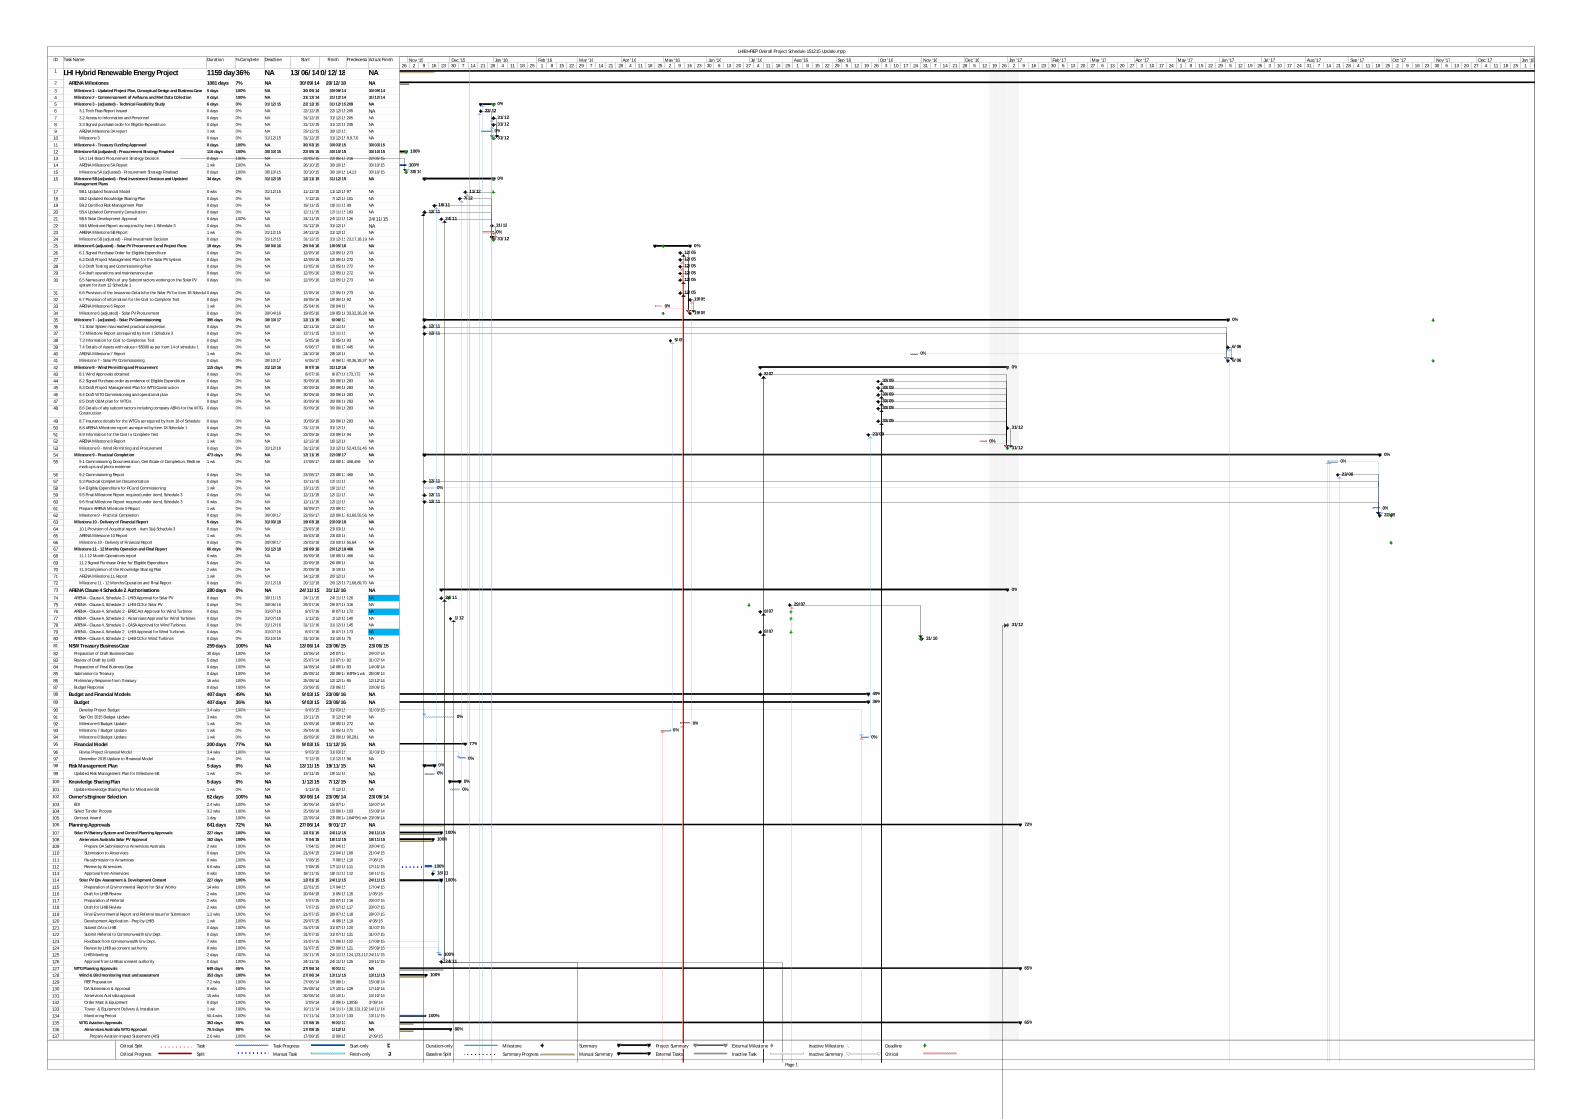
ID Task Name Duration % Complete Deadline Start Finish PredecessorsActual Finish
1 LHI Hybrid Renewable Energy Project 1159 days?36% NA 13/06/1420/12/18 NA2 ARENA Milestones 1081 days 7% NA 30/09/14 20/12/18 NA3 Milestone 1 - Updated Project Plan, Conceptual Design and Business Case 0 days 100% NA 30/09/14 30/09/14 30/09/14
4 Milestone 2 - Commencement of Avifauna and Met Data Collection 0 days 100% NA 31/12/14 31/12/14 31/12/14
5 Milestone 3 - (adjusted) - Technical Feasibility Study 6 days 0% 31/12/15 22/12/15 31/12/15 209 NA
6 3.1 Tech Feas Report Issued 0 days 0% NA 22/12/15 22/12/15 205 NA7 3.2 Access to Information and Personnel 0 days 0% NA 31/12/15 31/12/15 205 NA
8 3.3 Signed purchase order for Eligible Expenditure 0 days 0% NA 31/12/15 31/12/15 205 NA
9 ARENA Milestone 3A report 1 wk 0% NA 23/12/15 30/12/15 NA
10 Milestone 3 0 days 0% 31/12/15 31/12/15 31/12/15 8,9,7,6 NA
11 Milestone 4 - Treasury Funding Approved 0 days 100% NA 30/03/15 30/03/15 30/03/15
12 Milestone 5A (adjusted) - Procurement Strategy Finalised 116 days 100% 30/10/15 22/05/15 30/10/15 30/10/15
13 5A.1 LHI Board Procurement Strategy Decision 0 days 100% NA 22/05/15 22/05/15 216 22/05/15
14 ARENA Milestone 5A Report 1 wk 100% NA 26/10/15 30/10/15 30/10/15
15 Milestone 5A (adjusted) - Procurement Strategy Finalised 0 days 100% 30/10/15 30/10/15 30/10/15 14,13 30/10/15
16 Milestone 5B (adjusted) - Final Investment Decision and Updated Management Plans
34 days 0% 31/12/15 12/11/15 31/12/15 NA
17 5B.1 Updated financial Model 0 wks 0% 31/12/15 11/12/15 11/12/15 97 NA
18 5B.2 Updated Knowledge Sharing Plan 0 days 0% NA 7/12/15 7/12/15 101 NA
19 5B.3 Certified Risk Management Plan 0 days 0% NA 19/11/15 19/11/15 99 NA
20 5B.4 Updated Community Consultation 0 days 0% NA 12/11/15 12/11/15 183 NA
21 5B.5 Solar Development Approval 0 days 100% NA 24/11/15 24/11/15 126 24/11/1522 5B.6 Milestone Report as required by Item 1 Schedule 3 0 days 0% NA 31/12/15 31/12/15 NA23 ARENA Milestone 5B Report 1 wk 0% 31/12/15 24/12/15 31/12/15 NA
24 Milestone 5B (adjusted) - Final Investment Decision 0 days 0% 31/12/15 31/12/15 31/12/15 23,17,18,19,20,21,22NA
25 Milestone 6 (adjusted) - Solar PV Procurement and Project Plans 19 days 0% 30/04/16 25/04/16 19/05/16 NA
26 6.1 Signed Purchase Order for Eligible Expenditure 0 days 0% NA 12/05/16 12/05/16 273 NA
27 6.2 Draft Project Management Plan for the Solar PV system 0 days 0% NA 12/05/16 12/05/16 272 NA
28 6.3 Draft Testing and Commissioning Plan 0 days 0% NA 12/05/16 12/05/16 272 NA
29 6.4 draft operations and maintenance plan 0 days 0% NA 12/05/16 12/05/16 272 NA
30 6.5 Names and ABN's of any Subcontractors working on the Solar PV system for item 12 Schedule 1
0 days 0% NA 12/05/16 12/05/16 273 NA
31 6.6 Provision of the Insurance Details for the Solar PV for item 18 Schedule 10 days 0% NA 12/05/16 12/05/16 273 NA
32 6.7 Provision of information for the Cost to Complete Test 0 days 0% NA 19/05/16 19/05/16 92 NA
33 ARENA Milestone 6 Report 1 wk 0% NA 25/04/16 29/04/16 NA
34 Milestone 6 (adjusted) - Solar PV Procurement 0 days 0% 30/04/16 19/05/16 19/05/16 33,32,26,28,31,30,29,27NA
35 Milestone 7 - (adjusted) - Solar PV Commissioning 395 days 0% 30/10/17 12/11/15 6/06/17 NA
36 7.1 Solar System has reached practical completion 0 days 0% NA 12/11/15 12/11/15 NA
37 7.2 Milestone Report as required by Item 1 Schedule 3 0 days 0% NA 12/11/15 12/11/15 NA
38 7.3 Information for Cost to Completion Test 0 days 0% NA 5/05/16 5/05/16 93 NA
39 7.4 Details of Assets with values > $5000 as per item 14 of schedule 1 0 days 0% NA 6/06/17 6/06/17 445 NA
40 ARENA Milestone 7 Report 1 wk 0% NA 24/10/16 28/10/16 NA
41 Milestone 7 - Solar PV Commissioning 0 days 0% 30/10/17 6/06/17 6/06/17 40,36,39,37 NA
42 Milestone 8 - Wind Permitting and Procurement 115 days 0% 31/12/16 8/07/16 31/12/16 NA
43 8.1 Wind Approvals obtained 0 days 0% NA 8/07/16 8/07/16 173,172 NA
44 8.2 Signed Purchase order as evidence of Eligible Expenditure 0 days 0% NA 30/09/16 30/09/16 283 NA
45 8.3 Draft Project Management Plan for WTG Construction 0 days 0% NA 30/09/16 30/09/16 283 NA
46 8.4 Draft WTG Commissioning and operational plan 0 days 0% NA 30/09/16 30/09/16 283 NA
47 8.5 Draft O&M plan for WTG's 0 days 0% NA 30/09/16 30/09/16 283 NA
48 8.6 Details of aby subcontractors including company ABN's for the WTG Construction
0 days 0% NA 30/09/16 30/09/16 283 NA
49 8.7 Insurance details for the WTG's as required by item 18 of Schedule 0 days 0% NA 30/09/16 30/09/16 283 NA
50 8.8 ARENA Milestone report as required by item 18 Schedule 1 0 days 0% NA 31/12/16 31/12/16 NA
51 8.9 Information for the Cost to Complete Test 0 days 0% NA 23/09/16 23/09/16 94 NA
52 ARENA Milestone 8 Report 1 wk 0% NA 12/12/16 16/12/16 NA
53 Milestone 8 - Wind Permitting and Procurement 0 days 0% 31/12/16 31/12/16 31/12/16 52,43,51,46,47,44,45,48,49,50NA
54 Milestone 9 - Practical Completion 473 days 0% NA 12/11/15 22/09/17 NA
55 9.1 Commissioning Documentation, Certificate of Completion, Redline mark-ups and photo evidence
1 wk 0% NA 17/08/17 23/08/17 458,459 NA
56 9.2 Commissioning Report 0 days 0% NA 23/08/17 23/08/17 460 NA
57 9.3 Practical Completion Documentation 0 days 0% NA 12/11/15 12/11/15 NA
58 9.4 Eligible Expenditure for PC and Commissioning 1 wk 0% NA 13/11/15 19/11/15 NA
59 9.5 Final Milestone Report required under item1 Schedule 3 0 days 0% NA 12/11/15 12/11/15 NA
60 9.6 Final Milestone Report required under item1 Schedule 3 0 wks 0% NA 12/11/15 12/11/15 NA
61 Prepare ARENA Milestone 9 Report 1 wk 0% NA 18/09/17 22/09/17 NA
62 Milestone 9 - Practical Completion 0 days 0% 30/09/17 22/09/17 22/09/17 61,60,55,56,57,58NA
63 Milestone 10 - Delivery of Financial Report 5 days 0% 31/03/18 19/03/18 23/03/18 NA
64 10.1 Provision of Acquittal report - item 3(a) Schedule 3 0 days 0% NA 23/03/18 23/03/18 NA
65 ARENA Milestone 10 Report 1 wk 0% NA 19/03/18 23/03/18 NA
66 Milestone 10 - Delivery of Financial Report 0 days 0% 30/09/17 23/03/18 23/03/18 65,64 NA
67 Milestone 11 - 12 Months Operation and Final Report 66 days 0% 31/12/18 19/09/18 20/12/18 466 NA
68 11.1 12 Month Operations report 0 wks 0% NA 19/09/18 19/09/18 466 NA
69 11.2 Signed Purchase Order for Eligible Expenditure 5 days 0% NA 20/09/18 26/09/18 NA
70 11.3 Completion of the Knowledge Sharing Plan 2 wks 0% NA 20/09/18 3/10/18 NA
71 ARENA Milestone 11 Report 1 wk 0% NA 14/12/18 20/12/18 NA
72 Milestone 11 - 12 Months Operation and Final Report 0 days 0% 31/12/18 20/12/18 20/12/18 71,68,69,70 NA
73 ARENA Clause 4 Schedule 2 Authorisations 280 days 0% NA 24/11/15 31/12/16 NA74 ARENA - Clause 4, Schedule 2 - LHIB Approval for Solar PV 0 days 0% 30/11/15 24/11/15 24/11/15 126 NA
75 ARENA - Clause 4, Schedule 2 - LHIB CC for Solar PV 0 days 0% 30/06/16 29/07/16 29/07/16 316 NA
76 ARENA - Clause 4, Schedule 2 - EPBC Act Approval for Wind Turbines 0 days 0% 31/07/16 8/07/16 8/07/16 172 NA
77 ARENA - Clause 4, Schedule 2 - Airservices Approval for Wind Turbines 0 days 0% 31/07/16 1/12/15 1/12/15 140 NA
78 ARENA - Clause 4, Schedule 2 - CASA Approval for Wind Turbines 0 days 0% 31/12/16 31/12/16 31/12/16 145 NA
79 ARENA - Clause 4, Schedule 2 - LHIB Approval for Wind Turbines 0 days 0% 31/07/16 8/07/16 8/07/16 173 NA
80 ARENA - Clause 4, Schedule 2 - LHIB CC for Wind Turbines 0 days 0% 31/10/16 31/10/16 31/10/16 75 NA
81 NSW Treasury Business Case 259 days 100% NA 13/06/14 23/06/15 23/06/1582 Preparation of Draft Business Case 30 days 100% NA 13/06/14 24/07/14 24/07/14
83 Review of Draft by LHIB 5 days 100% NA 25/07/14 31/07/14 82 31/07/14
84 Preparation of Final Business Case 0 days 100% NA 14/08/14 14/08/14 83 14/08/14
85 Submission to Treasury 0 days 100% NA 25/08/14 25/08/14 84FS+1 wk 25/08/14
86 Preliminary Response from Treasury 16 wks 100% NA 25/08/14 12/12/14 85 12/12/14
87 Budget Response 0 days 100% NA 23/06/15 23/06/15 23/06/15
88 Budget and Financial Models 407 days 49% NA 9/03/15 23/09/16 NA89 Budget 407 days 36% NA 9/03/15 23/09/16 NA90 Develop Project Budget 3.4 wks 100% NA 9/03/15 31/03/15 31/03/15
91 Sep/Oct 2015 Budget Update 3 wks 0% NA 13/11/15 3/12/15 90 NA
92 Milestone 6 Budget Update 1 wk 0% NA 13/05/16 19/05/16 272 NA
93 Milestone 7 Budget Update 1 wk 0% NA 29/04/16 5/05/16 271 NA
94 Milestone 8 Budget Update 1 wk 0% NA 19/09/16 23/09/16 90,281 NA
95 Financial Model 200 days 77% NA 9/03/15 11/12/15 NA96 Revise Project Financial Model 3.4 wks 100% NA 9/03/15 31/03/15 31/03/15
97 December 2015 Update to Financial Model 1 wk 0% NA 7/12/15 11/12/15 96 NA
98 Risk Management Plan 5 days 0% NA 13/11/15 19/11/15 NA99 Updated Risk Management Plan for Milestone 5B 1 wk 0% NA 13/11/15 19/11/15 NA
100 Knowledge Sharing Plan 5 days 0% NA 1/12/15 7/12/15 NA101 Update Knowledge Sharing Plan for Milestone 5B 1 wk 0% NA 1/12/15 7/12/15 NA
102 Owner's Engineer Selection 62 days 100% NA 30/06/14 23/09/14 23/09/14103 EOI 2.4 wks 100% NA 30/06/14 15/07/14 15/07/14
104 Select Tender Process 3.2 wks 100% NA 25/08/14 15/09/14 103 15/09/14
105 Contract Award 1 day 100% NA 22/09/14 23/09/14 104FS+1 wk 23/09/14
106 Planning Approvals 641 days 72% NA 27/06/14 9/01/17 NA107 Solar PV Battery System and Control Planning Approvals 227 days 100% NA 12/01/15 24/11/15 24/11/15
108 Airservices Australia Solar PV Approval 162 days 100% NA 7/04/15 18/11/15 18/11/15
109 Prepare DA Submission to Airservices Australia 2 wks 100% NA 7/04/15 20/04/15 20/04/15
110 Submission to Airservices 0 days 100% NA 21/04/15 21/04/15 109 21/04/15
111 Re-submission to Airservices 0 wks 100% NA 7/08/15 7/08/15 110 7/08/15
112 Review by Airservices 6.6 wks 100% NA 7/08/15 17/11/15 111 17/11/15
113 Approval from Airservices 0 wks 100% NA 18/11/15 18/11/15 112 18/11/15
114 Solar PV Env Assessment & Development Consent 227 days 100% NA 12/01/15 24/11/15 24/11/15
115 Preparation of Environmental Report for Solar Works 14 wks 100% NA 12/01/15 17/04/15 17/04/15
116 Draft for LHIB Review 2 wks 100% NA 20/04/15 1/05/15 115 1/05/15
117 Preparation of Referral 2 wks 100% NA 7/07/15 20/07/15 116 20/07/15
118 Draft for LHIB Review 2 wks 100% NA 7/07/15 20/07/15 117 20/07/15
119 Final Environmental Report and Referral Issue for Submission 1.2 wks 100% NA 21/07/15 28/07/15 118 28/07/15
120 Development Application - Prep by LHIB 1 wk 100% NA 29/07/15 4/08/15 119 4/08/15
121 Submit DA to LHIB 0 days 100% NA 31/07/15 31/07/15 120 31/07/15
122 Submit Referral to Commonwealth Env Dept. 0 days 100% NA 31/07/15 31/07/15 121 31/07/15
123 Feedback from Commonwealth Env Dept. 7 wks 100% NA 31/07/15 17/09/15 122 17/09/15
124 Review by LHIB as consent authority 8 wks 100% NA 31/07/15 25/09/15 121 25/09/15
125 LHIB Meeting 2 days 100% NA 23/11/15 24/11/15 124,123,112 24/11/15
126 Approval from LHIB as consent authority 0 days 100% NA 24/11/15 24/11/15 125 24/11/15
127 WTG Planning Approvals 649 days 65% NA 27/06/14 9/01/17 NA
128 Wind & Bird monitoring mast and assessment 353 days 100% NA 27/06/14 13/11/15 13/11/15
129 REF Preparation 7.2 wks 100% NA 27/06/14 15/08/14 15/08/14
130 DA Submission & Approval 8 wks 100% NA 25/08/14 17/10/14 129 17/10/14
131 Airservices Australia approval 15 wks 100% NA 30/06/14 10/10/14 10/10/14
132 Order Mast & Equipment 0 days 100% NA 3/09/14 3/09/14 130SS 3/09/14
133 Tower & Equipment Delivery & Installation 1 wk 100% NA 10/11/14 14/11/14 130,131,132 14/11/14
134 Monitoring Period 50.4 wks 100% NA 17/11/14 13/11/15 133 13/11/15
135 WTG Aviation Approvals 353 days 65% NA 17/08/15 9/01/17 NA
136 Airservices Australia WTG Approval 76.5 days 80% NA 17/08/15 1/12/15 NA
137 Prepare Aviation Impact Statement (AIS) 2.6 wks 100% NA 17/08/15 2/09/15 2/09/15
0%22/12
31/1231/12
0%31/12
100%
100%30/10
0%
11/127/12
19/1112/11
24/1131/120%31/12
0%12/0512/0512/0512/0512/05
12/0519/05
0%19/05
0%12/1112/11
5/056/06
0%6/06
0%8/07
30/0930/0930/0930/0930/09
30/0931/12
23/090%
31/120%
0%
23/0812/11
0%12/1112/11
0%22/09
0%
24/1129/07
8/071/12
31/128/07
31/10
49%
36%
0%0%
0%0%
77%
0%0%
0%
0%
0%
72%
100%100%
100%18/11
100%
100%24/11
65%100%
100%65%
80%
26 2 9 16 23 30 7 14 21 28 4 11 18 25 1 8 15 22 29 7 14 21 28 4 11 18 25 2 9 16 23 30 6 13 20 27 4 11 18 25 1 8 15 22 29 5 12 19 26 3 10 17 24 31 7 14 21 28 5 12 19 26 2 9 16 23 30 6 13 20 27 6 13 20 27 3 10 17 24 1 8 15 22 29 5 12 19 26 3 10 17 24 31 7 14 21 28 4 11 18 25 2 9 16 23 30 6 13 20 27 4 11 18 25 1 8Nov '15 Dec '15 Jan '16 Feb '16 Mar '16 Apr '16 May '16 Jun '16 Jul '16 Aug '16 Sep '16 Oct '16 Nov '16 Dec '16 Jan '17 Feb '17 Mar '17 Apr '17 May '17 Jun '17 Jul '17 Aug '17 Sep '17 Oct '17 Nov '17 Dec '17 Jan '18
Critical Split
Critical Progress
Task
Split
Task Progress
Manual Task
Start-only
Finish-only
Duration-only
Baseline Split
Milestone
Summary Progress
Summary
Manual Summary
Project Summary
External Tasks
External Milestone
Inactive Task
Inactive Milestone
Inactive Summary
Deadline
Critical
LHIB HREP Overall Project Schedule 151215 Update.mpp
Page 1

ID Task Name Duration % Complete Deadline Start Finish PredecessorsActual Finish
138 Submit AIS to Airservices 0 days 100% NA 7/09/15 7/09/15 137 7/09/15
139 Review of AIS by Airservices 10 wks 75% NA 7/09/15 1/12/15 138 NA
140 Receipt of Decision from Airservices 0 days 0% NA 1/12/15 1/12/15 139 NA
141 Civil Aviation Safety Authority (CASA) WTG Notification 15 days 0% NA 29/11/16 9/01/17 NA
142 Prepare Draft Notice to CASA 1 wk 0% NA 29/11/16 5/12/16 317SS NA
143 Submission to CASA 0 wks 0% NA 5/12/16 5/12/16 142 NA
144 Review by CASA 2 wks 0% NA 6/12/16 9/01/17 143 NA
145 Acknowledgment from CASA 0 wks 0% NA 9/01/17 9/01/17 144 NA
146 Environmental Report and Referral 217 days 29% NA 14/09/15 8/07/16 NA
147 Seabird Monitoring Report 70 days 85% NA 14/09/15 18/12/15 NA
148 Seabird Monitoring Report Preparation 8 wks 100% NA 14/09/15 6/11/15 6/11/15
149 Draft Report Submitted 0 days 100% NA 6/11/15 6/11/15 148 6/11/15
150 Review by LHIB 18.5 days 100% NA 9/11/15 4/12/15 149 4/12/15
151 Monitoring Report Finalisation 10 days 0% NA 7/12/15 18/12/15 150 NA
152 Seabird Monitoring Report Submitted 0 days 0% NA 18/12/15 18/12/15 151 NA
153 Bat Monitoring Report 69 days 55% NA 14/09/15 17/12/15 NA
154 Bat Monitoring Report Preparation 8 wks 75% 30/11/15 14/09/15 26/11/15 NA
155 Draft Report Submitted 0 days 0% NA 26/11/15 26/11/15 154 NA
156 Review by LHIB 10 days 0% NA 27/11/15 10/12/15 155 NA
157 Monitoring Report Finalisation 5 days 0% NA 11/12/15 17/12/15 156 NA
158 Bat Monitoring Report Submitted 0 days 0% NA 17/12/15 17/12/15 157 NA
159 Prepare RFP for Consultants 2.3 wks 100% NA 2/11/15 18/11/15 18/11/15
160 Select Consultant 3.7 wks 100% NA 17/11/15 11/12/15 159 11/12/15
161 Review and Collation of Field Work Data 8 wks 0% NA 21/12/15 14/02/16 160,233,158,152NA
162 Preparation of Environmental Report for WTG Works 6 wks 0% NA 15/02/16 25/03/16 161 NA
163 Draft Enviro Report for LHIB Review 2 wks 0% NA 28/03/16 8/04/16 162 NA
164 Preparation of Commonwealth Env Dept. Referral 2 wks 0% NA 14/03/16 25/03/16 162SS+4 wksNA
165 Draft Commonwealth Referral for LHIB Review 1 wk 0% NA 28/03/16 1/04/16 164 NA
166 Final Environmental Report and Referral Issued to LHIB 1 wk 0% NA 11/04/16 15/04/16 163,165,140 NA
167 Submission to LHIB as consent authority 0 wks 0% NA 15/04/16 15/04/16 166 NA
168 Independent Review of Noise & Visual Aspects of Project - If Required 6 wks 0% NA 18/04/16 27/05/16 167 NA
169 Submission to Commonwealth Env Dept. 0 wks 0% NA 15/04/16 15/04/16 166 NA
170 Review by LHIB as consent authority 12 wks 0% NA 18/04/16 8/07/16 167,168FF-2 wksNA
171 Review by Commonwealth Env Dept. 12 wks 0% NA 18/04/16 8/07/16 169,168FF-2 wksNA
172 Approvals from Commonwealth Env Dept. 0 days 0% NA 8/07/16 8/07/16 171 NA
173 Approvals from LHIB as consent authority 0 days 0% NA 8/07/16 8/07/16 170,168,140 NA
174 Community Engagement Plan Implementation 592 days? 93% NA 25/08/14 8/12/16 NA175 Consultant Appointed 132 days 100% NA 25/08/14 9/03/15 130SS+1 day 9/03/15
176 Project Initiation 0.2 wks 100% NA 14/11/14 14/11/14 14/11/14
177 Stakeholder and Target Comms Database 4 days? 100% NA 21/11/14 26/11/14 176 26/11/14
178 Infographic Postcard 1 wk 100% NA 24/11/14 28/11/14 177 28/11/14
179 Q&A 1.4 wks 100% NA 1/12/14 9/12/14 178 9/12/14
180 Consultation Visit 2 days 100% NA 13/12/14 15/12/14 178,179 15/12/14
181 Update Community Engagement Plan 4.2 wks 100% NA 16/12/14 2/02/15 180 2/02/15
182 LHIB comment on Update to Community Engagement Plan 0.2 wks 100% NA 2/02/15 2/02/15 181 2/02/15
183 Final Community Engagement Plan Issued 0 wks 100% NA 3/02/15 3/02/15 180,182 3/02/15
184 Consultation Visit 3 days 0% NA 12/02/16 15/02/16 NA
185 Consultation Visit - Stall at Community Market 5 days 0% NA 9/04/16 13/04/16 NA
186 Sustainable Energy Working Group Mtgs 217 days 0% NA 14/02/16 8/12/16 NA
187 Working group Meeting 1 day 0% NA 14/02/16 14/02/16 NA
188 Working group Meeting 1 day 0% NA 7/04/16 7/04/16 NA
189 Working group Meeting 1 day 0% NA 2/06/16 2/06/16 NA
190 Working group Meeting 1 day 0% NA 4/08/16 4/08/16 NA
191 Working group Meeting 1 day 0% NA 6/10/16 6/10/16 NA
192 Working group Meeting 1 day 0% NA 8/12/16 8/12/16 NA
193 Technical Feasibility Review of Business Case Options 284 days 92% NA 3/11/14 22/12/15 NA194 Initial RFI from LHIB and Suppliers 7.2 wks 100% NA 3/11/14 19/12/14 105 19/12/14
195 Draft of Power System Studies Report 8 wks 100% NA 14/11/14 27/01/15 194FF 27/01/15
196 Review of Draft Power System Studies Report by LHIB 2 wks 100% NA 28/01/15 10/02/15 195 10/02/15
197 Final Power System Studies Report 1 wk 100% NA 11/02/15 17/02/15 196 17/02/15
198 Draft of Protection System Report 8 wks 100% NA 14/11/14 27/01/15 194FF 27/01/15
199 Review of Draft Protection System Report by LHIB 2 wks 100% NA 28/01/15 10/02/15 198 10/02/15
200 Final Protection System Report 1 wk 100% NA 11/02/15 17/02/15 199 17/02/15
201 Draft of Load Control Report 8 wks 100% NA 14/11/14 27/01/15 194FF 27/01/15
202 Review of Draft Load Control Report by LHIB 2 wks 100% NA 28/01/15 10/02/15 201 10/02/15
203 Final Load Control Report 1 wk 100% NA 11/02/15 17/02/15 202 17/02/15
204 Draft of Tech Feas Report 8 wks 100% NA 14/11/14 27/01/15 27/01/15
205 Review of Draft Tech Feas Report by LHIB 2 wks 100% NA 2/03/15 13/03/15 204 13/03/15
206 Final Tech Feas Report 1 wk 100% NA 23/03/15 27/03/15 205 27/03/15
207 Draft of Tech Feas Report Update with 12 months of site data 4 wks 15% NA 9/11/15 8/12/15 206 NA
208 Review of Draft Tech Feas Report Update by LHIB 1 wk 0% NA 14/12/15 18/12/15 207 NA
209 Final Tech Feas Report Update 2 days 0% NA 21/12/15 22/12/15 208 NA
210 Contracting Strategy 90 days 100% NA 27/01/15 1/06/15 1/06/15211 Develop Draft Contracting Strategy Options for Workshop 10.8 wks 100% NA 27/01/15 10/04/15 10/04/15
212 Contract Strategy Workshop with LHIB 1 day 100% NA 27/04/15 27/04/15 27/04/15
213 Contract Strategy Draft 2 wks 100% NA 28/04/15 11/05/15 212 11/05/15
214 LHIB Review and Comment on Contracting Strategy 2 wks 100% NA 12/05/15 25/05/15 213 25/05/15
215 Final Contract Strategy Document 1 wk 100% NA 26/05/15 1/06/15 214 1/06/15
216 Contracting Strategy decision 0 days 100% NA 22/05/15 22/05/15 215 22/05/15
217 Geotechnical Investigations 144 days 100% NA 13/06/14 19/01/15 19/01/15218 Desktop review of information and plan site works 2 days 100% NA 13/06/14 16/06/14 16/06/14
219 mobilise to site 1 day 100% NA 17/06/14 17/06/14 218 17/06/14
220 Site Works 3 days 100% NA 12/11/14 14/11/14 219 14/11/14
221 Draft Report 0 wks 100% NA 17/11/14 17/11/14 220 17/11/14
222 LHIB Comment 5.4 wks 100% NA 17/11/14 5/01/15 221 5/01/15
223 Laboratory Testing 4.4 wks 100% NA 21/11/14 19/12/14 221 19/12/14
224 Final Report 1.2 wks 100% NA 12/01/15 19/01/15 222,223 19/01/15
225 WTG Noise - Background Noise and Noise Modelling 213 days 100% NA 15/12/14 27/10/15 27/10/15226 Preliminary Desktop Modelling 1 wk 100% NA 15/12/14 19/12/14 19/12/14
227 Background Noise measurement 6 wks 100% NA 5/01/15 19/02/15 226 19/02/15
228 Noise Modelling 1 wk 100% NA 5/03/15 11/03/15 227 11/03/15
229 Draft Report 1.4 wks 100% NA 6/03/15 16/03/15 228 16/03/15
230 LHIB Comment 0.2 wks 100% NA 17/03/15 17/03/15 229 17/03/15
231 Final Report 0 wks 100% NA 25/03/15 25/03/15 230 25/03/15
232 Winter background Noise Measurement 5.6 wks 100% NA 3/08/15 9/09/15 9/09/15
233 Noise Report Update 6.8 wks 100% NA 10/09/15 27/10/15 232 27/10/15
234 Smart Metering, Communications and Ripple Control 560 days 0% NA 23/12/15 2/03/18 NA235 Small Scale Trial 295 days 0% NA 23/12/15 24/02/17 NA
236 RFP for Small Scale Smart Meter, Comms System and Ripple Control Trial 4 wks 0% NA 23/12/15 20/01/16 203,209 NA
237 Review of Proposals 1 wk 0% NA 21/01/16 27/01/16 236 NA
238 Contract Award 2 wks 0% NA 28/01/16 10/02/16 237 NA
239 Design Documentation and Equipment Specification Details 4 wks 0% NA 11/02/16 8/03/16 238 NA
240 Review of Design Doc and Equipment Spec 2 wks 0% NA 9/03/16 22/03/16 239 NA
241 Procurement of Equipment 24 wks 0% NA 23/03/16 2/09/16 240 NA
242 Shipping of Equipment to LHI 2 wks 0% NA 5/09/16 16/09/16 241 NA
243 Installation of Selected Meters 2 wks 0% NA 19/09/16 30/09/16 237,242 NA
244 Installation of Kiosk HV and LV Equipment 2 wks 0% NA 3/10/16 14/10/16 243 NA
245 Commissioning of Equipment 1 wk 0% NA 17/10/16 21/10/16 244 NA
246 Trial Period Data Capture 12 wks 0% NA 24/10/16 3/02/17 245 NA
247 Small Scale Comms role out report 2 wks 0% NA 6/02/17 17/02/17 243,246 NA
248 LHIB Review of Small Scale comms 1 wk 0% NA 20/02/17 24/02/17 247 NA
249 Full Roll Out 265 days 0% NA 27/02/17 2/03/18 NA
250 Proposal for Full Roll Out 2 wks 0% NA 27/02/17 10/03/17 248 NA
251 Review of Proposals 1 wk 0% NA 13/03/17 17/03/17 250 NA
252 Contract Award 2 wks 0% NA 20/03/17 31/03/17 251 NA
253 Design Documentation and Equipment Specification Details 4 wks 0% NA 3/04/17 28/04/17 252 NA
254 Review of Design Doc and Equipment Spec 2 wks 0% NA 1/05/17 12/05/17 253 NA
255 Procurement of Equipment 24 wks 0% NA 15/05/17 27/10/17 254 NA
256 Shipping of Equipment to LHI 2 wks 0% NA 30/10/17 10/11/17 255 NA
257 Installation of Meters 8 wks 0% NA 13/11/17 5/01/18 251,256 NA
258 Installation of Kiosk HV and LV Equipment 2 wks 0% NA 8/01/18 19/01/18 257 NA
259 Commissioning of Equipment 1 wk 0% NA 22/01/18 26/01/18 258 NA
260 LHI Staff Training 4 wks 0% NA 29/01/18 23/02/18 259 NA
261 As Installed Documentation 1 wk 0% NA 26/02/18 2/03/18 260 NA
262 Main Tenders and Contract Award 314 days 0% NA 4/01/16 3/04/17 NA263 Solar Battery & Control System 97 days 0% NA 4/01/16 12/05/16 NA
264 LHIB Approval to prepare SBC tender documents 0 days 0% NA 4/01/16 4/01/16 NA
265 Preparation of draft Tender Documents 4 wks 0% NA 4/01/16 29/01/16 264 NA
266 LHIB Review of draft tender documents 1 wk 0% NA 1/02/16 5/02/16 265 NA
267 Finalised Tender Documents 3 wks 0% NA 8/02/16 25/02/16 266 NA
268 Tender Request 4 wks 0% NA 1/03/16 28/03/16 267,126 NA
269 Tenderers Site Visist 1 day 0% NA 11/03/16 11/03/16 268SS+8 daysNA
270 Tender Assessment 3 wks 0% NA 29/03/16 14/04/16 268 NA
271 Negotiate Terms and Agreement 2 wks 0% NA 15/04/16 28/04/16 270 NA
272 LHIB CEO and Ministerial Review and Approval of SBC Works 2 wks 0% NA 29/04/16 12/05/16 271 NA
273 Contract Award 0 wks 0% NA 12/05/16 12/05/16 272 NA
274 Wind Turbine 156 days 0% NA 1/03/16 30/09/16 NA
275 LHIB Approval to prepare WTG tender documents 0 days 0% NA 1/03/16 1/03/16 NA
276 Preparation of draft Tender Documents 4 wks 0% NA 1/03/16 28/03/16 275 NA
277 LHIB Review of draft tender documents 2 wks 0% NA 29/03/16 9/04/16 276 NA
278 Finalised Tender Documents 1 wk 0% NA 10/04/16 14/04/16 277 NA
279 Tender Request 4 wks 0% NA 11/07/16 5/08/16 278,173 NA
75%1/12
0%0%5/12
0%9/01
29%85%
100%6/11
100%0%18/12
55%75%26/11
0%0%17/12
100%100%
0%0%
0%0%
0%0%15/04
0%15/04
0%0%8/078/07
93%
0%0%
0% 0% 0% 0% 0% 0%0%
0%0%
0%0%
0%92%
15%0%
0%
100%
100%
0%0%
0%0%
0%0%
0%0%
0%0%
0%0%
0%0%
0%0%
0%0%
0%0%
0%0%
0%
0%4/01
0%0%
0%0%
0%0%
0%0%12/05
0%1/03
0%0%
0%0%
26 2 9 16 23 30 7 14 21 28 4 11 18 25 1 8 15 22 29 7 14 21 28 4 11 18 25 2 9 16 23 30 6 13 20 27 4 11 18 25 1 8 15 22 29 5 12 19 26 3 10 17 24 31 7 14 21 28 5 12 19 26 2 9 16 23 30 6 13 20 27 6 13 20 27 3 10 17 24 1 8 15 22 29 5 12 19 26 3 10 17 24 31 7 14 21 28 4 11 18 25 2 9 16 23 30 6 13 20 27 4 11 18 25 1 8Nov '15 Dec '15 Jan '16 Feb '16 Mar '16 Apr '16 May '16 Jun '16 Jul '16 Aug '16 Sep '16 Oct '16 Nov '16 Dec '16 Jan '17 Feb '17 Mar '17 Apr '17 May '17 Jun '17 Jul '17 Aug '17 Sep '17 Oct '17 Nov '17 Dec '17 Jan '18
Critical Split
Critical Progress
Task
Split
Task Progress
Manual Task
Start-only
Finish-only
Duration-only
Baseline Split
Milestone
Summary Progress
Summary
Manual Summary
Project Summary
External Tasks
External Milestone
Inactive Task
Inactive Milestone
Inactive Summary
Deadline
Critical
LHIB HREP Overall Project Schedule 151215 Update.mpp
Page 2
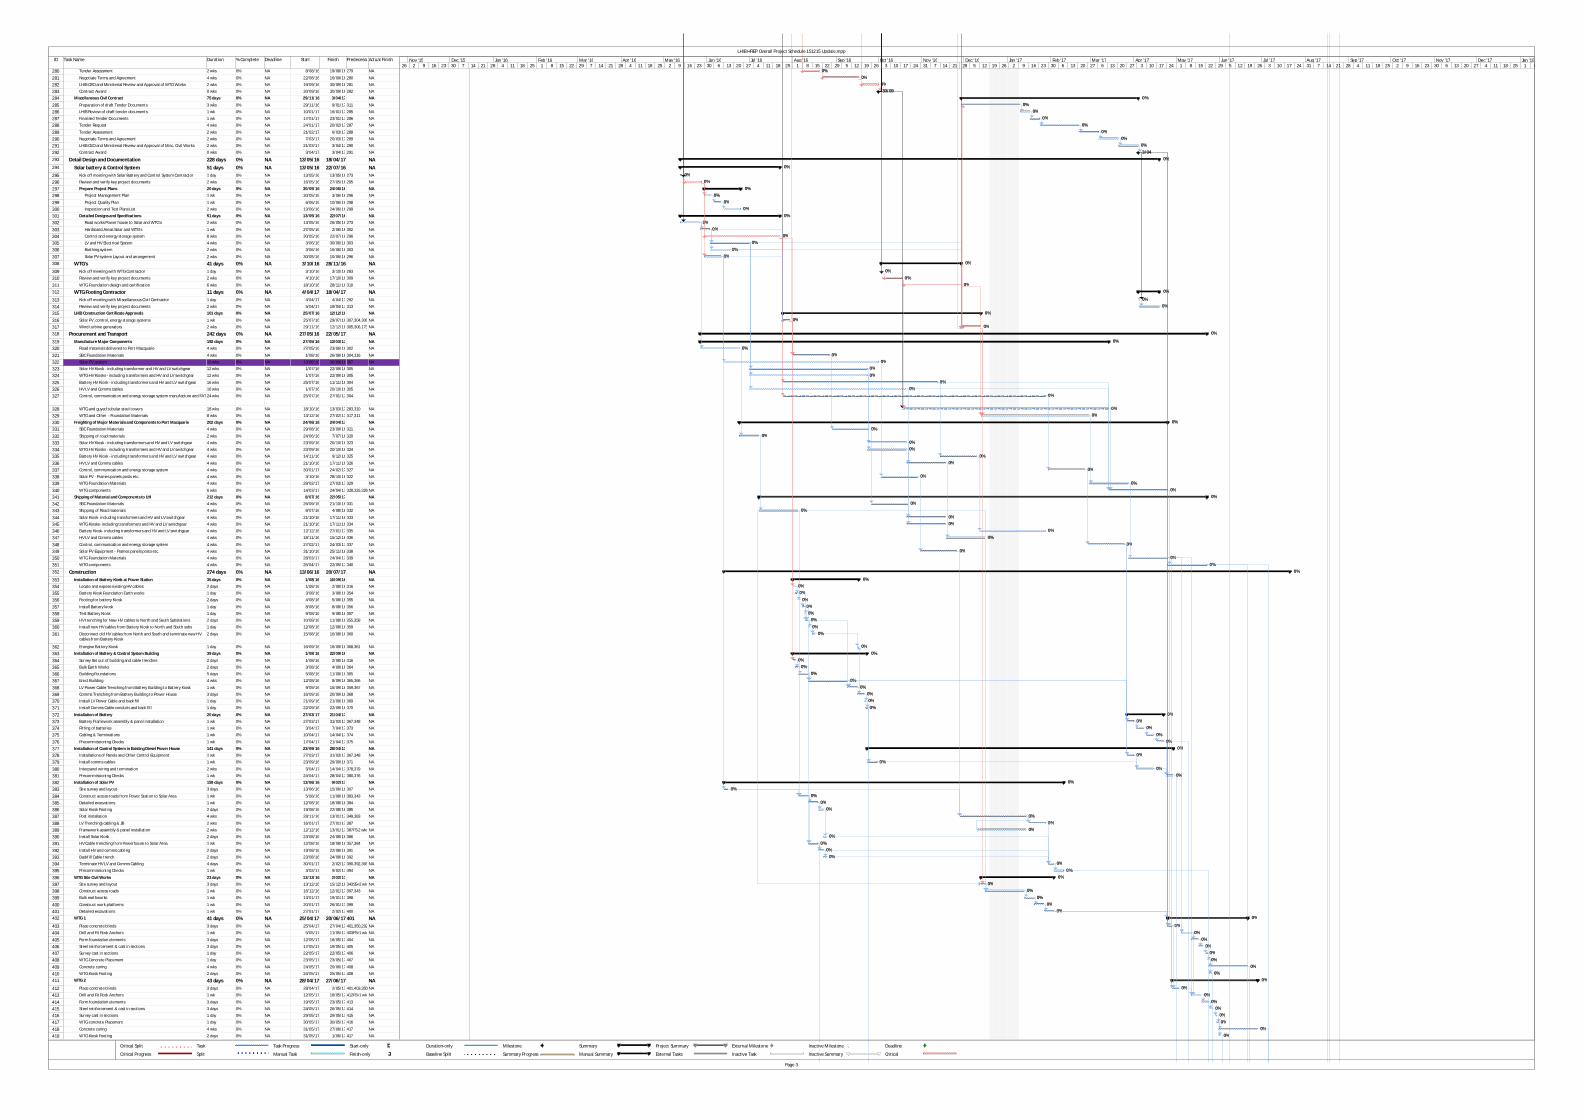
ID Task Name Duration % Complete Deadline Start Finish PredecessorsActual Finish
280 Tender Assessment 2 wks 0% NA 8/08/16 19/08/16 279 NA
281 Negotiate Terms and Agreement 4 wks 0% NA 22/08/16 16/09/16 280 NA
282 LHIB CEO and Ministerial Review and Approval of WTG Works 2 wks 0% NA 19/09/16 30/09/16 281 NA
283 Contract Award 0 wks 0% NA 30/09/16 30/09/16 282 NA
284 Miscellaneous Civil Contract 75 days 0% NA 29/11/16 3/04/17 NA
285 Preparation of draft Tender Documents 3 wks 0% NA 29/11/16 9/01/17 311 NA
286 LHIB Review of draft tender documents 1 wk 0% NA 10/01/17 16/01/17 285 NA
287 Finalised Tender Documents 1 wk 0% NA 17/01/17 23/01/17 286 NA
288 Tender Request 4 wks 0% NA 24/01/17 20/02/17 287 NA
289 Tender Assessment 2 wks 0% NA 21/02/17 6/03/17 288 NA
290 Negotiate Terms and Agreement 2 wks 0% NA 7/03/17 20/03/17 289 NA
291 LHIB CEO and Ministerial Review and Approval of Misc. Civil Works 2 wks 0% NA 21/03/17 3/04/17 290 NA
292 Contract Award 0 wks 0% NA 3/04/17 3/04/17 291 NA
293 Detail Design and Documentation 228 days 0% NA 13/05/16 18/04/17 NA294 Solar battery & Control System 51 days 0% NA 13/05/16 22/07/16 NA295 Kick off meeting with Solar Battery and Control System Contractor 1 day 0% NA 13/05/16 13/05/16 273 NA
296 Review and verify key project documents 2 wks 0% NA 16/05/16 27/05/16 295 NA
297 Prepare Project Plans 20 days 0% NA 30/05/16 24/06/16 NA
298 Project Management Plan 1 wk 0% NA 30/05/16 3/06/16 296 NA
299 Project Quality Plan 1 wk 0% NA 6/06/16 10/06/16 298 NA
300 Inspection and Test Plans List 2 wks 0% NA 13/06/16 24/06/16 299 NA
301 Detailed Designs and Specifications 51 days 0% NA 13/05/16 22/07/16 NA
302 Road works Power house to Solar and WTG's 2 wks 0% NA 13/05/16 26/05/16 273 NA
303 Hardstand Areas Solar and WTG's 1 wk 0% NA 27/05/16 2/06/16 302 NA
304 Control and energy storage system 8 wks 0% NA 30/05/16 22/07/16 296 NA
305 LV and HV Electrical System 4 wks 0% NA 3/06/16 30/06/16 303 NA
306 Earthing system 2 wks 0% NA 3/06/16 16/06/16 303 NA
307 Solar PV system Layout and arrangement 2 wks 0% NA 30/05/16 10/06/16 296 NA
308 WTG's 41 days 0% NA 3/10/16 28/11/16 NA309 Kick off meeting with WTG Contractor 1 day 0% NA 3/10/16 3/10/16 283 NA
310 Review and verify key project documents 2 wks 0% NA 4/10/16 17/10/16 309 NA
311 WTG Foundation design and certification 6 wks 0% NA 18/10/16 28/11/16 310 NA
312 WTG Footing Contractor 11 days 0% NA 4/04/17 18/04/17 NA313 Kick off meeting with Miscellaneous Civil Contractor 1 day 0% NA 4/04/17 4/04/17 292 NA
314 Review and verify key project documents 2 wks 0% NA 5/04/17 18/04/17 313 NA
315 LHIB Construction Certificate Approvals 101 days 0% NA 25/07/16 12/12/16 NA
316 Solar PV, control, energy storage systems 1 wk 0% NA 25/07/16 29/07/16 307,304,306,303,126NA
317 Wind turbine generators 2 wks 0% NA 29/11/16 12/12/16 305,306,173,311NA
318 Procurement and Transport 242 days 0% NA 27/05/16 22/05/17 NA319 Manufacture Major Components 192 days 0% NA 27/05/16 13/03/17 NA
320 Road materials delivered to Port Macquarie 4 wks 0% NA 27/05/16 23/06/16 302 NA
321 SBC Foundation Materials 4 wks 0% NA 1/08/16 26/08/16 304,316 NA
322 Solar PV system 16 wks 0% NA 13/06/16 30/09/16 307 NA
323 Solar HV Kiosk - including transformer and HV and LV switchgear 12 wks 0% NA 1/07/16 22/09/16 305 NA
324 WTG HV Kiosks - including transformers and HV and LV switchgear 12 wks 0% NA 1/07/16 22/09/16 305 NA
325 Battery HV Kiosk - including transformers and HV and LV switchgear 16 wks 0% NA 25/07/16 11/11/16 304 NA
326 HV LV and Comms cables 16 wks 0% NA 1/07/16 20/10/16 305 NA
327 Control, communication and energy storage system manufacture and FAT 24 wks 0% NA 25/07/16 27/01/17 304 NA
328 WTG and guyed tubular steel towers 18 wks 0% NA 18/10/16 13/03/17 283,310 NA
329 WTG and Other - Foundation Materials 8 wks 0% NA 13/12/16 27/02/17 317,311 NA
330 Freighting of Major Materials and Components to Port Macquarie 202 days 0% NA 24/06/16 24/04/17 NA
331 SBC Foundation Materials 4 wks 0% NA 29/08/16 23/09/16 321 NA
332 Shipping of road materials 2 wks 0% NA 24/06/16 7/07/16 320 NA
333 Solar HV Kiosk - including transformers and HV and LV switchgear 4 wks 0% NA 23/09/16 20/10/16 323 NA
334 WTG HV Kiosks - including transformers and HV and LV switchgear 4 wks 0% NA 23/09/16 20/10/16 324 NA
335 Battery HV Kiosk - including transformers and HV and LV switchgear 4 wks 0% NA 14/11/16 9/12/16 325 NA
336 HV LV and Comms cables 4 wks 0% NA 21/10/16 17/11/16 326 NA
337 Control, communication and energy storage system 4 wks 0% NA 30/01/17 24/02/17 327 NA
338 Solar PV - Frames panels posts etc. 4 wks 0% NA 3/10/16 28/10/16 322 NA
339 WTG Foundation Materials 4 wks 0% NA 28/02/17 27/03/17 329 NA
340 WTG components 6 wks 0% NA 14/03/17 24/04/17 328,325,326 NA
341 Shipping of Material and Components to LHI 212 days 0% NA 8/07/16 22/05/17 NA
342 SBC Foundation Materials 4 wks 0% NA 26/09/16 21/10/16 331 NA
343 Shipping of Road materials 4 wks 0% NA 8/07/16 4/08/16 332 NA
344 Solar Kiosk- including transformers and HV and LV switchgear 4 wks 0% NA 21/10/16 17/11/16 333 NA
345 WTG Kiosks- including transformers and HV and LV switchgear 4 wks 0% NA 21/10/16 17/11/16 334 NA
346 Battery Kiosk- including transformers and HV and LV switchgear 4 wks 0% NA 12/12/16 27/01/17 335 NA
347 HV LV and Comms cables 4 wks 0% NA 18/11/16 15/12/16 336 NA
348 Control, communication and energy storage system 4 wks 0% NA 27/02/17 24/03/17 337 NA
349 Solar PV Equipment - Frames panels posts etc. 4 wks 0% NA 31/10/16 25/11/16 338 NA
350 WTG Foundation Materials 4 wks 0% NA 28/03/17 24/04/17 339 NA
351 WTG components 4 wks 0% NA 25/04/17 22/05/17 340 NA
352 Construction 274 days 0% NA 13/06/16 20/07/17 NA353 Installation of Battery Kiosk at Power Station 35 days 0% NA 1/08/16 16/09/16 NA
354 Locate and expose existing HV cables 2 days 0% NA 1/08/16 2/08/16 316 NA
355 Battery Kiosk Foundation Earth works 1 day 0% NA 3/08/16 3/08/16 354 NA
356 Footing for battery Kiosk 2 days 0% NA 4/08/16 5/08/16 355 NA
357 Install Battery kiosk 1 day 0% NA 8/08/16 8/08/16 356 NA
358 Test Battery Kiosk 1 day 0% NA 9/08/16 9/08/16 357 NA
359 HV trenching for New HV cables to North and South Substations 2 days 0% NA 10/08/16 11/08/16 355,358 NA
360 Install new HV cables from Battery Kiosk to North and South subs 1 day 0% NA 12/08/16 12/08/16 359 NA
361 Disconnect old HV cables from North and South and terminate new HV cables from Battery Kiosk
2 days 0% NA 15/08/16 16/08/16 360 NA
362 Energise Battery Kiosk 1 day 0% NA 16/09/16 16/09/16 368,361 NA
363 Installation of Battery & Control System Building 39 days 0% NA 1/08/16 22/09/16 NA
364 Survey Set out of building and cable trenches 2 days 0% NA 1/08/16 2/08/16 316 NA
365 Bulk Earth Works 2 days 0% NA 3/08/16 4/08/16 364 NA
366 Building Foundations 5 days 0% NA 5/08/16 11/08/16 365 NA
367 Erect Building 4 wks 0% NA 12/08/16 8/09/16 365,366 NA
368 LV Power Cable Trenching from Battery Building to Battery Kiosk 1 wk 0% NA 9/09/16 15/09/16 359,367 NA
369 Comms Trenching from Battery Building to Power House 3 days 0% NA 16/09/16 20/09/16 368 NA
370 Install LV Power Cable and back fill 1 day 0% NA 21/09/16 21/09/16 369 NA
371 Install Comms Cable conduits and back fill 1 day 0% NA 22/09/16 22/09/16 370 NA
372 Installation of Battery 20 days 0% NA 27/03/17 21/04/17 NA
373 Battery Framework assembly & panel installation 1 wk 0% NA 27/03/17 31/03/17 367,348 NA
374 Fitting of batteries 1 wk 0% NA 3/04/17 7/04/17 373 NA
375 Cabling & Terminations 1 wk 0% NA 10/04/17 14/04/17 374 NA
376 Precommissioning Checks 1 wk 0% NA 17/04/17 21/04/17 375 NA
377 Installation of Control System in Existing Diesel Power House 141 days 0% NA 23/09/16 28/04/17 NA
378 Installations of Panels and Other Control Equipment 1 wk 0% NA 27/03/17 31/03/17 367,348 NA
379 Install comms cables 1 wk 0% NA 23/09/16 29/09/16 371 NA
380 Interpanel wiring and termination 2 wks 0% NA 3/04/17 14/04/17 378,379 NA
381 Precommissioning Checks 1 wk 0% NA 24/04/17 28/04/17 380,376 NA
382 Installation of Solar PV 159 days 0% NA 13/06/16 9/02/17 NA
383 Site survey and layout 3 days 0% NA 13/06/16 15/06/16 307 NA
384 Construct access roads from Power Station to Solar Area 1 wk 0% NA 5/08/16 11/08/16 383,343 NA
385 Detailed excavations 1 wk 0% NA 12/08/16 18/08/16 384 NA
386 Solar Kiosk Footing 2 days 0% NA 19/08/16 22/08/16 385 NA
387 Post installation 4 wks 0% NA 28/11/16 13/01/17 349,383 NA
388 LV Trenching\cabling & JB 2 wks 0% NA 16/01/17 27/01/17 387 NA
389 Framework assembly & panel installation 2 wks 0% NA 12/12/16 13/01/17 387FS-2 wks NA
390 Install Solar Kiosk 2 days 0% NA 23/08/16 24/08/16 386 NA
391 HV Cable trenching from Powerhouse to Solar Area 1 wk 0% NA 12/08/16 18/08/16 357,384 NA
392 Install HV and comms cabling 2 days 0% NA 19/08/16 22/08/16 391 NA
393 Backfill Cable trench 2 days 0% NA 23/08/16 24/08/16 392 NA
394 Terminate HV LV and Comms Cabling 4 days 0% NA 30/01/17 2/02/17 390,392,393,388NA
395 Precommissioning Checks 1 wk 0% NA 3/02/17 9/02/17 394 NA
396 WTG Site Civil Works 23 days 0% NA 13/12/16 2/02/17 NA
397 Site survey and layout 3 days 0% NA 13/12/16 15/12/16 343SS+2 wks,317NA
398 Construct access roads 1 wk 0% NA 16/12/16 12/01/17 397,343 NA
399 Bulk earthworks 1 wk 0% NA 13/01/17 19/01/17 398 NA
400 Construct work platforms 1 wk 0% NA 20/01/17 26/01/17 399 NA
401 Detailed excavations 1 wk 0% NA 27/01/17 2/02/17 400 NA
402 WTG 1 41 days 0% NA 25/04/17 20/06/17 401 NA403 Place concrete blinds 3 days 0% NA 25/04/17 27/04/17 401,350,292,314NA
404 Drill and Fit Rock Anchors 1 wk 0% NA 5/05/17 11/05/17 403FS+1 wk,350NA
405 Form foundation elements 3 days 0% NA 12/05/17 16/05/17 404 NA
406 Steel reinforcement & cast in sections 3 days 0% NA 17/05/17 19/05/17 405 NA
407 Survey cast in sections 1 day 0% NA 22/05/17 22/05/17 406 NA
408 WTG Concrete Placement 1 day 0% NA 23/05/17 23/05/17 407 NA
409 Concrete curing 4 wks 0% NA 24/05/17 20/06/17 408 NA
410 WTG Kiosk Footing 2 days 0% NA 24/05/17 25/05/17 408 NA
411 WTG 2 43 days 0% NA 28/04/17 27/06/17 NA412 Place concrete blinds 3 days 0% NA 28/04/17 2/05/17 401,403,350 NA
413 Drill and Fit Rock Anchors 1 wk 0% NA 12/05/17 18/05/17 412FS+1 wk,350,404NA
414 Form foundation elements 3 days 0% NA 19/05/17 23/05/17 413 NA
415 Steel reinforcement & cast in sections 3 days 0% NA 24/05/17 26/05/17 414 NA
416 Survey cast in sections 1 day 0% NA 29/05/17 29/05/17 415 NA
417 WTG concrete Placement 1 day 0% NA 30/05/17 30/05/17 416 NA
418 Concrete curing 4 wks 0% NA 31/05/17 27/06/17 417 NA
419 WTG Kiosk Footing 2 days 0% NA 31/05/17 1/06/17 417 NA
0%0%
0%30/09
0%0%
0%0%
0%0%
0%0%3/04
0%
0%
0%0%
0%0%
0%0%
0%0%
0%0%
0%0%
0%0%
0%0%
0%0%
0%0%
0%0%
0%0%
0%0%
0%0%
0%0%
0%0%
0%
0%0%
0%0%
0%0%0%
0%0%
0%0%
0%0%
0%0%
0%0%0%
0%0%
0%0%
0%0%
0%
0%0%0%
0%0%0%
0%0%
0%
0%0%
0%0%
0%0%
0%0%0%0%
0%0%
0%0%
0%0%
0%0%
0%0%
0%0%
0%0%
0%0%
0%0%
0%0%
0%0%
0%0%
0%0%
0%0%
0%0%
0%
0%0%
0%0%
0%0%
0%0%
0%
0%0%
0%0%
0%0%
0%0%
26 2 9 16 23 30 7 14 21 28 4 11 18 25 1 8 15 22 29 7 14 21 28 4 11 18 25 2 9 16 23 30 6 13 20 27 4 11 18 25 1 8 15 22 29 5 12 19 26 3 10 17 24 31 7 14 21 28 5 12 19 26 2 9 16 23 30 6 13 20 27 6 13 20 27 3 10 17 24 1 8 15 22 29 5 12 19 26 3 10 17 24 31 7 14 21 28 4 11 18 25 2 9 16 23 30 6 13 20 27 4 11 18 25 1 8Nov '15 Dec '15 Jan '16 Feb '16 Mar '16 Apr '16 May '16 Jun '16 Jul '16 Aug '16 Sep '16 Oct '16 Nov '16 Dec '16 Jan '17 Feb '17 Mar '17 Apr '17 May '17 Jun '17 Jul '17 Aug '17 Sep '17 Oct '17 Nov '17 Dec '17 Jan '18
Critical Split
Critical Progress
Task
Split
Task Progress
Manual Task
Start-only
Finish-only
Duration-only
Baseline Split
Milestone
Summary Progress
Summary
Manual Summary
Project Summary
External Tasks
External Milestone
Inactive Task
Inactive Milestone
Inactive Summary
Deadline
Critical
LHIB HREP Overall Project Schedule 151215 Update.mpp
Page 3

ID Task Name Duration % Complete Deadline Start Finish PredecessorsActual Finish
420 WTG Kiosk HV, LV and Comms Cable Installation 194 days 0% NA 19/08/16 7/06/17 NA
421 Install WTG 1 Kiosk 2 days 0% NA 26/05/17 29/05/17 410 NA
422 Install WTG 2 Kiosk 2 days 0% NA 2/06/17 5/06/17 419 NA
423 HV Cable trenching from Solar Area to WTG 1 and WTG 2 1 wk 0% NA 19/08/16 25/08/16 391 NA
424 Install HV and comms cabling 2 days 0% NA 26/08/16 29/08/16 423 NA
425 Terminate HV Cabling 2 days 0% NA 6/06/17 7/06/17 424,421,422 NA
426 Installation of WTG 1 11 days 0% NA 21/06/17 5/07/17 NA
427 Preparation and pre-assembly at site 1 wk 0% NA 21/06/17 27/06/17 351,409 NA
428 Tower sections 2 days 0% NA 28/06/17 29/06/17 427 NA
429 Nacelle and blades 2 days 0% NA 30/06/17 3/07/17 428 NA
430 LV Electrical and comms connections 1 day 0% NA 4/07/17 4/07/17 429,425 NA
431 Precommissioning Checks 1 day 0% NA 5/07/17 5/07/17 430 NA
432 Installation of WTG 2 11 days 0% NA 6/07/17 20/07/17 NA
433 Preparation and pre-assembly at site 1 wk 0% NA 6/07/17 12/07/17 431,351,418 NA
434 Tower sections 2 days 0% NA 13/07/17 14/07/17 433 NA
435 Nacelle and blades 2 days 0% NA 17/07/17 18/07/17 434 NA
436 LV Electrical and comms connections 1 day 0% NA 19/07/17 19/07/17 435,425 NA
437 Precommissioning Checks 1 day 0% NA 20/07/17 20/07/17 436 NA
438 Commissioning 68 days 0% NA 1/05/17 2/08/17 NA439 Control System 1 wk 0% NA 1/05/17 5/05/17 381 NA
440 Change over to Diesel Genset Control 1 wk 0% NA 8/05/17 12/05/17 439 NA
441 Integration of Ripple Control 2 days 0% NA 8/05/17 9/05/17 439 NA
442 Battery 1 wk 0% NA 10/05/17 16/05/17 376,441 NA
443 System Control of Battery 1 wk 0% NA 17/05/17 23/05/17 442 NA
444 Solar Panels 1 wk 0% NA 24/05/17 30/05/17 443,395 NA
445 System Control of Solar Panels 1 wk 0% NA 31/05/17 6/06/17 444 NA
446 WTG 1 2 days 0% NA 6/07/17 7/07/17 421,443,431 NA
447 WTG 2 2 days 0% NA 21/07/17 24/07/17 443,422,437 NA
448 System Control of Wind Turbines 2 days 0% NA 25/07/17 26/07/17 447,446 NA
449 Overall System Integration Commissioning 1 wk 0% NA 27/07/17 2/08/17 448 NA
450 Completion Activities 224 days 0% NA 23/09/16 23/08/17 NA451 Training 7 days 0% NA 27/07/17 4/08/17 NA
452 Solar PV , Comm, Control and Energy Storage System 2 days 0% NA 3/08/17 4/08/17 449 NA
453 Wind Turbine Training 3 days 0% NA 27/07/17 31/07/17 448 NA
454 Rehabilitation 204 days 0% NA 23/09/16 26/07/17 NA
455 Solar PV , Comm, Control and Energy Storage System 1 wk 0% NA 23/09/16 29/09/16 371 NA
456 Wind Turbine Generators 1 wk 0% NA 20/07/17 26/07/17 436,430 NA
457 As Installed Documentation 20 days 0% NA 27/07/17 23/08/17 NA
458 Solar PV , Comm, Control and Energy Storage System 2 wks 0% NA 3/08/17 16/08/17 449 NA
459 Wind Turbine Generators 2 wks 0% NA 27/07/17 9/08/17 448 NA
460 Commissioning Report 3 wks 0% NA 3/08/17 23/08/17 449 NA
461 Practical Completion 10 days 0% NA 9/08/17 23/08/17 NA
462 Solar PV , Comm, Control and Energy Storage System - PC 0 days 0% NA 23/08/17 23/08/17 458,455,452,449,460NA
463 WTG - PC 0 days 0% NA 9/08/17 9/08/17 453,459 NA
464 Commercial Operation 0 days 0% NA 23/08/17 23/08/17 454,451,457NA465 12 Months Operation 52 wks 0% NA 24/08/17 22/08/18 464,462,463 NA
466 12 months Operation final Report 4 wks 0% NA 23/08/18 19/09/18 465 NA
0%0%
0%0%
0%0%
0%0%
0%0%0%0%
0%0%
0%0%0%0%
0%
0%0%
0%0%
0%0%
0%0%
0%0%
0%0%
0%0%
0%0%
0%0%
0%0%
0%0%0%23/08
9/0823/08
26 2 9 16 23 30 7 14 21 28 4 11 18 25 1 8 15 22 29 7 14 21 28 4 11 18 25 2 9 16 23 30 6 13 20 27 4 11 18 25 1 8 15 22 29 5 12 19 26 3 10 17 24 31 7 14 21 28 5 12 19 26 2 9 16 23 30 6 13 20 27 6 13 20 27 3 10 17 24 1 8 15 22 29 5 12 19 26 3 10 17 24 31 7 14 21 28 4 11 18 25 2 9 16 23 30 6 13 20 27 4 11 18 25 1 8Nov '15 Dec '15 Jan '16 Feb '16 Mar '16 Apr '16 May '16 Jun '16 Jul '16 Aug '16 Sep '16 Oct '16 Nov '16 Dec '16 Jan '17 Feb '17 Mar '17 Apr '17 May '17 Jun '17 Jul '17 Aug '17 Sep '17 Oct '17 Nov '17 Dec '17 Jan '18
Critical Split
Critical Progress
Task
Split
Task Progress
Manual Task
Start-only
Finish-only
Duration-only
Baseline Split
Milestone
Summary Progress
Summary
Manual Summary
Project Summary
External Tasks
External Milestone
Inactive Task
Inactive Milestone
Inactive Summary
Deadline
Critical
LHIB HREP Overall Project Schedule 151215 Update.mpp
Page 4

Lord Howe Island Hybrid Renewable Energy Project Technical Feasibility Study
RT019500-0000-GN-RPT-0003
Appendix C. Glossary Term Meaning
Wind shear alpha value
A Weibull scale parameter
AEP Annual Energy Production
ASA Airservices Australia
ARENA Australian Renewable Energy Agency
BC AECOM 2014 Business Case (AECOM, 2014)
BESS Battery Energy Storage System
the Board Lord Howe Island Board
BoM Australian Bureau of Meteorology
CAPEX Capital Expenditure
Ct Thrust coefficient
GHI Global Horizontal Irradiance
HREP Hybrid Renewable Energy Project
HV High Voltage
IEC International Electrotechnical Commission
k Weibull shape factor
kVA Kilovolt ampere
kVAr Kilovolt ampere reactive
kW / MW Kilowatt / Megawatt
kWh / MWh Kilowatt-hour / Megawatt-hour
kWpAC Kilowatt peak AC as measured at AC terminal of inverters
LHI Lord Howe Island
LHIB Solar The Lord Howe Island Board owned solar
LV Low Voltage
mAGL Metres Above Ground Level
mASL Metres Above Sea Level
MCP Measure Correlate Predict (wind analysis)
MEA Measurement Engineering Australia
OE Owners Engineer
OPEX Operational Expenditure
Option 1 Defined in Table 1-1
Option 2 Defined in Table 1-1
P50 Mean value or central estimate (statistics)
PoE Probability of Exceedance
Private Solar The Lord Howe Island privately owned solar
PV Photovoltaic
Renewable Penetration Defined in Section 10.3.5
RMU Ring Main Unit

Lord Howe Island Hybrid Renewable Energy Project Technical Feasibility Study
RT019500-0000-GN-RPT-0003
Term Meaning
SCADA Supervisory Control and Data Acquisition
T01, T02 Turbine 01, Turbine 02
TI Turbulence Intensity
TI15 Turbulence Intensity at a 15 m/s 10 minute mean wind speed
U Mean average wind speed
WAsP Wind Atlas Analysis and Application Program
WTG Wind Turbine Generator

Lord Howe Island Hybrid Renewable Energy Project Technical Feasibility Study
RT019500-0000-GN-RPT-0003
Appendix D. Revision 2 Scope of Work The scope of revision 2 is to address as far as practical the following;
Revision 1 Recommendations
Number Recommendation Responsible Party Date for Completion
1 The wind turbine suitability for site will need to be confirmed by the wind turbine supplier
WTG supplier November 2015
2 The calculated wind shear at the site monitoring mast is high and this should be monitored and re-assessed as more data is recorded by the site monitoring mast
Jacobs November 2015
3
The length of the site wind data available is short and has increased uncertainty associated with the calculations. The long term wind speed and AEP should be recalculated later in 2015, once a full year of site data is available.
Jacobs November 2015
4
The synthesised solar site data determined in this study results in a much lower AEP compared to the Business Case and Road-Map. It is recommended to immediately consider installing a second sensor in order to enable a check of the site measurement.
LHI Board April 2015
5
Similarly to the wind resource calculations, the length of the site solar dataset is short. As a result it is recommended to perform the calculations again later in 2015, when a full year of site data is available so that all seasons will have been covered.
Jacobs November 2015
6
The maximum demand of the electrical system is critical for determining the amount of “spinning” reserve required to ensure system stability. There is a discrepancy in relation to the magnitude of the measured peak load at LHI from different data sources. This will need to be investigated further and the actual peak vales determined.
Jacobs November 2015
8 Update the wind and solar input time series datasets used for the Homer modelling when more site data is available for analysis and re-run the Homer models based on the updated datasets.
Jacobs November 2015
ARENA Comments
The ARENA comments are listed below in black italics, LHIB proposed additional work is detailed in the blue text following the comment.
1. Updated project CAPEX estimate including a more detailed breakdown of costs and backed up with supporting evidence such as budgetary prices from equipment suppliers. It is noted that the Funding Agreement requires that the proponent provide “access to ARENA of the Recipient Confidential Information and Specified Personnel to enable an independent review of the technical feasibility study”. LHIB This will be completed as part of the revision to the TFS, with varying levels of supporting documentation to be provided. 2. Extension of the control and communications study scope to include the power station and the proposed wind/solar generation and the integration of these. LHIB This will be completed as part of the revision to the TFS, with the content to be high level as the specifics will be determined by the Solar Battery Control system contractor. 3. A more detailed Power System Study to better describe the existing system’s performance criteria and limitations (e.g. voltage and frequency limits) as well as the response of the power system to different

Lord Howe Island Hybrid Renewable Energy Project Technical Feasibility Study
RT019500-0000-GN-RPT-0003
operating regimes (diesel-off mode in particular). The updated study should consider protection settings that could impact stability of the system, harmonic effects, flicker, and the operational philosophy, which includes spinning reserve requirements, operating modes and the battery charging regime. These should be clearly defined prior to issuing tender documentation. LHIB This will be partially completed as part of the revision to the TFS, through the addition of a section on the proposed operational philosophy. In our opinion, it is a large piece of work that will be duplicating the work that will have to be done by the Solar Battery Control System contractor and then reviewed by Jacobs. We consider it difficult to do this work now as we will have to assume specific equipment to get the necessary details and then do the studies, which may be difficult information to get without a specific contract in place and it would be certainly covered by confidentiality, so can’t be shared. 4. Updated noise study including additional noise data collection to account for seasonal variation in background noise levels. LHIB This was completed in August 2015 and will be updated in the summary in the TFS. 5. Complete a site suitability study for the WTGs. LHIB This will be completed as part of the revision to the TFS. 6. Complete further wind data collection (12 months of data) and reassess wind shear after more data is recorded by the site monitoring mast. LHIB This will be completed as part of the revision to the TFS. 7. The risk register be updated with risks identified in the feasibility study and a risk management plan be developed. LHIB This will be completed as part of the revision to the TFS. 8. Utilise latest version of PVsyst for solar energy yield modelling once a full year of verified irradiance data is available. The updated modelling should include allowance for panel degradation. LHIB Jacobs use the latest PVsyst modelling software which has had a minor version update since the March 2015 TFS was completed. Panel degradation was included as noted in section 8.4.2 of the TFS report. To be updated and clarified in the revised TFS. 9. HOMER hybrid system modelling using one minute data increments. Model should be provided to enable review (refer item 1). LHIB Modelling will be repeated using 1 minute data and a copy of the basic model can be provided on request. It is our intention to provide this with the Solar Battery Control system tender and will require the tenderers to respond using the model to enable an easier comparison of the different offerings. 10. Further degree of rigour in revisiting load and optimal hybrid configuration assumptions to ensure the Technical Feasibility Study is robust and independent. Adopted options and scenarios should be assessed thoroughly and independently to ensure this previous work by others is suitable to be adopted as the basis for the Technical Feasibility Study. LHIB Whilst we consider that wider options assessment work has previously been completed and that the TFS was examining the two business case options, Jacobs have completed some iterations around the sizing which will be expanded upon and included in the revised TFS. In addition, the final sizing of the solar PV farm and battery, will be dependent on the successful contractor’s product and proposal.

Lord Howe Island Hybrid Renewable Energy Project Technical Feasibility Study
RT019500-0000-GN-RPT-0003
11. Incorporate feedback from consenting authorities particularly with respect to restrictions placed on project design/ operation. LHIB With the recent LHIB and Airservices Australia approvals for the Solar Battery Control System phase, these will be considered in the revised TFS. 12. Undertake sensitivity analysis to assess the potential impact of restricted operation (curtailment as a result of bird activity or noise). LHIB This will be completed as part of the revision to the TFS.

Lord Howe Island Hybrid Renewable Energy Project Technical Feasibility Study
RT019500-0000-GN-RPT-0003
Appendix E. Homer Optimisation Results Table E-1 Selected Sensistivity Results – Soted by Case No.
Case No. Fuel Cost multiplier
Vergnet CAPEX multiplier
PV CAPEX multiplier
Battery CAPEX multiplier
XANT CAPEX multiplier
PV De rating %
Additional WTG Losses %
WTG OEM & No.
Solar kW
Battery kWh
COE Total Fuel Used Annually litres
1 1 1 1 1 Nil 95% 1 Vergnet 450 800 $ 0.702 242,876
2 0.9 2 XANT 450 800 $ 0.691 249,895
3 1 2 XANT 450 800 $ 0.696 249,895
4 1.1 1 Vergnet 450 800 $ 0.706 242,876
5 85% 1 Vergnet 450 600 $ 0.706 257,109
6 5% 1 Vergnet 450 800 $ 0.705 247,814
7 10% 0 Vergnet 450 600 $ 0.708 360,296
8 0.8 1 Vergnet 450 800 $ 0.681 242,876
9 0.9 1 Vergnet 450 800 $ 0.699 242,876
10 1.1 1 Vergnet 450 600 $ 0.712 252,195
11 1.2 1 Vergnet 450 600 $ 0.721 252,195
12 1.3 1 Vergnet 200 400 $ 0.730 304,728
13 0.8 1 Vergnet 450 800 $ 0.677 242,876
14 0.9 1 Vergnet 450 800 $ 0.689 242,876
15 1.1 1 Vergnet 200 400 $ 0.712 304,728
16 1.2 1 Vergnet 200 400 $ 0.721 304,728
17 1.3 1 Vergnet 200 400 $ 0.729 304,728
18 0.8 1 Vergnet 200 600 $ 0.684 216,231
19 0.9 1 Vergnet 450 800 $ 0.695 242,876
20 1.1 1 Vergnet 450 800 $ 0.708 242,876
21 1.2 0 Vergnet 450 600 $ 0.708 360,296

Lord Howe Island Hybrid Renewable Energy Project Technical Feasibility Study
RT019500-0000-GN-RPT-0003
Case No. Fuel Cost multiplier
Vergnet CAPEX multiplier
PV CAPEX multiplier
Battery CAPEX multiplier
XANT CAPEX multiplier
PV De rating %
Additional WTG Losses %
WTG OEM & No.
Solar kW
Battery kWh
COE Total Fuel Used Annually
litres
22 0.8 0.8 0.8 1 Vergnet 450 800 $ 0.643 242,876
23 0.9 0.9 0.9 1 Vergnet 450 800 $ 0.672 242,876
24 1.1 1.1 1.1 1 Vergnet 200 400 $ 0.728 304,728
25 1.2 1.2 1.2 0 Vergnet 450 800 $ 0.752 360,296
26 1.3 1.3 1.3 0 Vergnet 450 600 $ 0.774 360,296
27 1.1 1 Vergnet 450 800 $ 0.714 241,006
28 1.2 1 Vergnet 450 1000 $ 0.726 229,326
29 0.9 1.3 1 2 Vergnet 200 600 $ 0.724 216,231
30 0.9 1.3 1.3 2 Vergnet 200 600 $ 0.753 216,231
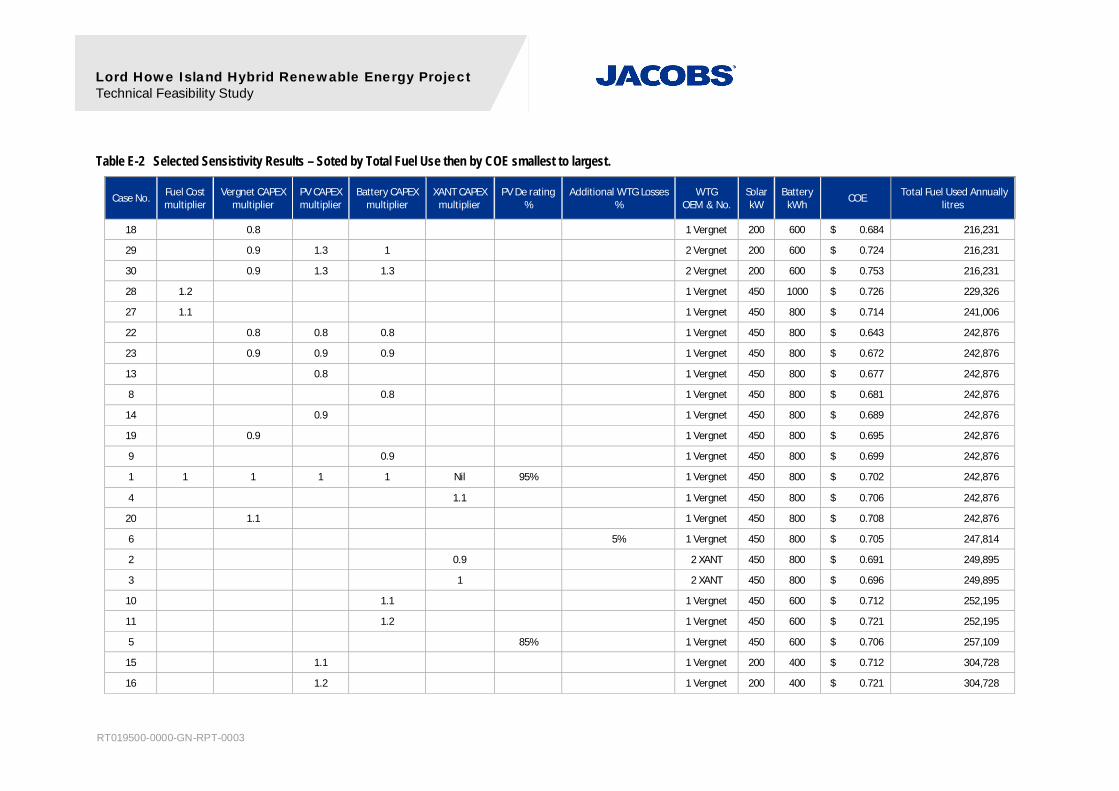
Lord Howe Island Hybrid Renewable Energy Project Technical Feasibility Study
RT019500-0000-GN-RPT-0003
Table E-2 Selected Sensistivity Results – Soted by Total Fuel Use then by COE smallest to largest.
Case No. Fuel Cost multiplier
Vergnet CAPEX multiplier
PV CAPEX multiplier
Battery CAPEX multiplier
XANT CAPEX multiplier
PV De rating %
Additional WTG Losses %
WTG OEM & No.
Solar kW
Battery kWh
COE Total Fuel Used Annually litres
18 0.8 1 Vergnet 200 600 $ 0.684 216,231
29 0.9 1.3 1 2 Vergnet 200 600 $ 0.724 216,231
30 0.9 1.3 1.3 2 Vergnet 200 600 $ 0.753 216,231
28 1.2 1 Vergnet 450 1000 $ 0.726 229,326
27 1.1 1 Vergnet 450 800 $ 0.714 241,006
22 0.8 0.8 0.8 1 Vergnet 450 800 $ 0.643 242,876
23 0.9 0.9 0.9 1 Vergnet 450 800 $ 0.672 242,876
13 0.8 1 Vergnet 450 800 $ 0.677 242,876
8 0.8 1 Vergnet 450 800 $ 0.681 242,876
14 0.9 1 Vergnet 450 800 $ 0.689 242,876
19 0.9 1 Vergnet 450 800 $ 0.695 242,876
9 0.9 1 Vergnet 450 800 $ 0.699 242,876
1 1 1 1 1 Nil 95% 1 Vergnet 450 800 $ 0.702 242,876
4 1.1 1 Vergnet 450 800 $ 0.706 242,876
20 1.1 1 Vergnet 450 800 $ 0.708 242,876
6 5% 1 Vergnet 450 800 $ 0.705 247,814
2 0.9 2 XANT 450 800 $ 0.691 249,895
3 1 2 XANT 450 800 $ 0.696 249,895
10 1.1 1 Vergnet 450 600 $ 0.712 252,195
11 1.2 1 Vergnet 450 600 $ 0.721 252,195
5 85% 1 Vergnet 450 600 $ 0.706 257,109
15 1.1 1 Vergnet 200 400 $ 0.712 304,728
16 1.2 1 Vergnet 200 400 $ 0.721 304,728

Lord Howe Island Hybrid Renewable Energy Project Technical Feasibility Study
RT019500-0000-GN-RPT-0003
Case No. Fuel Cost multiplier
Vergnet CAPEX multiplier
PV CAPEX multiplier
Battery CAPEX multiplier
XANT CAPEX multiplier
PV De rating %
Additional WTG Losses %
WTG OEM & No.
Solar kW
Battery kWh
COE Total Fuel Used Annually
litres
24 1.1 1.1 1.1 1 Vergnet 200 400 $ 0.728 304,728
17 1.3 1 Vergnet 200 400 $ 0.729 304,728
12 1.3 1 Vergnet 200 400 $ 0.730 304,728
7 10% 0 Vergnet 450 600 $ 0.708 360,296
21 1.2 0 Vergnet 450 600 $ 0.708 360,296
25 1.2 1.2 1.2 0 Vergnet 450 800 $ 0.752 360,296
26 1.3 1.3 1.3 0 Vergnet 450 600 $ 0.774 360,296

Lord Howe Island Hybrid Renewable Energy Project Technical Feasibility Study
RT019500-0000-GN-RPT-0003
Table E-3 Selected Sensistivity Results – Soted by COE then by Total Fuel Use smallest to largest.
Case No. Fuel Cost multiplier
Vergnet CAPEX multiplier
PV CAPEX multiplier
Battery CAPEX multiplier
XANT CAPEX multiplier
PV De rating %
Additional WTG Losses %
WTG OEM & No.
Solar kW
Battery kWh
COE Total Fuel Used Annually litres
22 0.8 0.8 0.8 1 Vergnet 450 800 $ 0.643 242,876
23 0.9 0.9 0.9 1 Vergnet 450 800 $ 0.672 242,876
13 0.8 1 Vergnet 450 800 $ 0.677 242,876
8 0.8 1 Vergnet 450 800 $ 0.681 242,876
18 0.8 1 Vergnet 200 600 $ 0.684 216,231
14 0.9 1 Vergnet 450 800 $ 0.689 242,876
2 0.9 2 XANT 450 800 $ 0.691 249,895
19 0.9 1 Vergnet 450 800 $ 0.695 242,876
3 1 2 XANT 450 800 $ 0.696 249,895
9 0.9 1 Vergnet 450 800 $ 0.699 242,876
1 1 1 1 1 Nil 95% 1 Vergnet 450 800 $ 0.702 242,876
6 5% 1 Vergnet 450 800 $ 0.705 247,814
4 1.1 1 Vergnet 450 800 $ 0.706 242,876
5 85% 1 Vergnet 450 600 $ 0.706 257,109
20 1.1 1 Vergnet 450 800 $ 0.708 242,876
7 10% 0 Vergnet 450 600 $ 0.708 360,296
21 1.2 0 Vergnet 450 600 $ 0.708 360,296
10 1.1 1 Vergnet 450 600 $ 0.712 252,195
15 1.1 1 Vergnet 200 400 $ 0.712 304,728
27 1.1 1 Vergnet 450 800 $ 0.714 241,006
11 1.2 1 Vergnet 450 600 $ 0.721 252,195
16 1.2 1 Vergnet 200 400 $ 0.721 304,728
29 0.9 1.3 1 2 Vergnet 200 600 $ 0.724 216,231
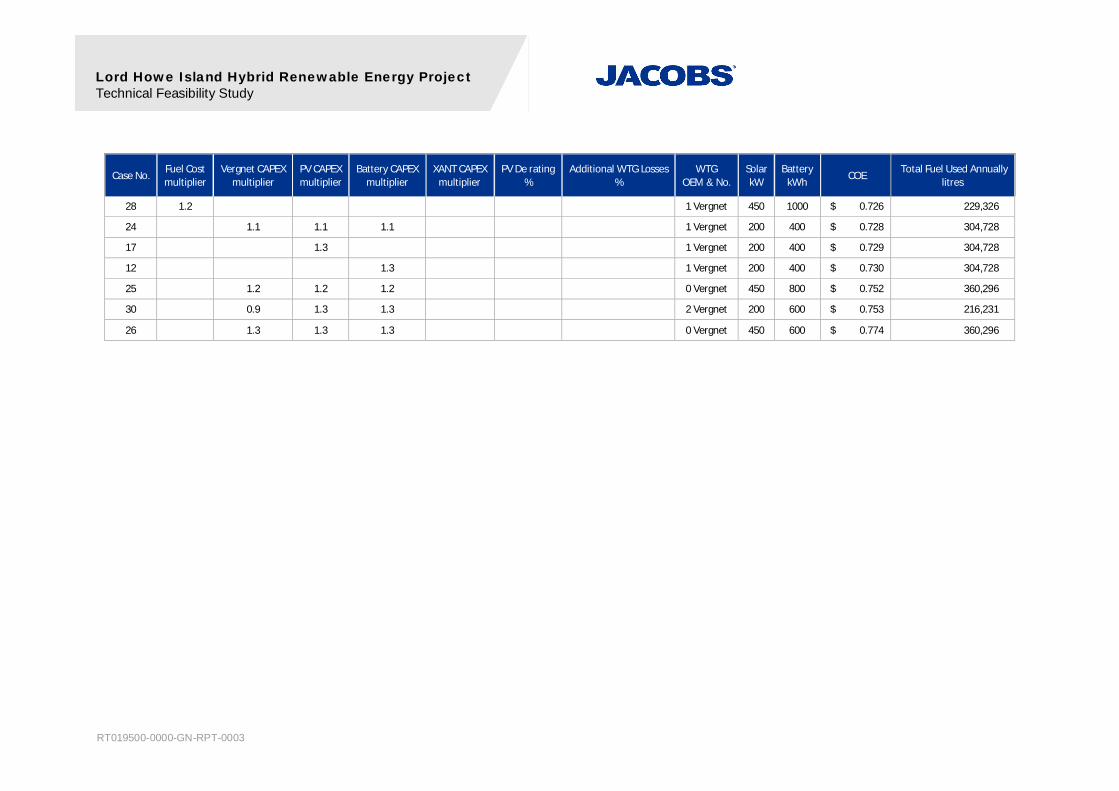
Lord Howe Island Hybrid Renewable Energy Project Technical Feasibility Study
RT019500-0000-GN-RPT-0003
Case No. Fuel Cost multiplier
Vergnet CAPEX multiplier
PV CAPEX multiplier
Battery CAPEX multiplier
XANT CAPEX multiplier
PV De rating %
Additional WTG Losses %
WTG OEM & No.
Solar kW
Battery kWh
COE Total Fuel Used Annually
litres
28 1.2 1 Vergnet 450 1000 $ 0.726 229,326
24 1.1 1.1 1.1 1 Vergnet 200 400 $ 0.728 304,728
17 1.3 1 Vergnet 200 400 $ 0.729 304,728
12 1.3 1 Vergnet 200 400 $ 0.730 304,728
25 1.2 1.2 1.2 0 Vergnet 450 800 $ 0.752 360,296
30 0.9 1.3 1.3 2 Vergnet 200 600 $ 0.753 216,231
26 1.3 1.3 1.3 0 Vergnet 450 600 $ 0.774 360,296