long-term variability in arctic sea surface … variability in arctic sea surface temperatures...
TRANSCRIPT
Available online at www.sciencedirect.com
ScienceDirect
Polar Science 7 (2013) 233e240http://ees.elsevier.com/polar/
Long-term variability in Arctic sea surface temperatures
Rajkumar Kamaljit Singh*, Megha Maheshwari, Sandip R. Oza, Raj Kumar
Oceanic Sciences Division (OSD/AOSG/EPSA), Space Applications Centre (ISRO), Satellite Road, Ahmedabad 380015, India
Received 18 December 2012; revised 1 August 2013; accepted 18 October 2013
Available online 28 October 2013
Abstract
In this study, we used 30 years of an operational sea surface temperature (SST) product, the NOAAOptimum Interpolation (OI)SSTVersion 2 dataset, to examine variations in Arctic SSTs during the period December 1981eOctober 2011.We computed annualSSTanomalies and interannual trends in SST variations for the period 1982e2010; during this period, marginal (though statisticallysignificant) increases in SSTs were observed in oceanic regions poleward of 60�N. A warming trend is evident over most of theArctic region, the Beaufort Sea, the Chuckchi Sea, Hudson Bay, the Labrador Sea, the Iceland Sea, the Norwegian Sea, BeringStrait, etc.; Labrador Sea experienced higher temperature anomalies than those observed in other regions. However, cooling trendswere observed in the central Arctic, some parts of Baffin Bay, the Kara Sea (south of Novaya Zemlya), the Laptev Sea, the SiberianSea, and Fram Strait. The central Arctic region experienced a cooling trend only during 1992e2001; warming trends were observedduring 1982e1991 and 2002e2010. We also examined a 30-yr (1982e2011) record of summer season (JuneeJulyeAugust) SSTvariations and a 29-yr (1982e2010) record of September SST variations, the results of which are discussed.� 2013 Elsevier B.V. and NIPR. All rights reserved.
Keywords: Sea surface temperature; NOAA OI SST; Trend analysis; Arctic; Climate warming
1. Introduction
Warming of Arctic seawater has been reported byComiso (2003), Chepurin and Carton (2012), and manyothers (see references therein). Bengtsson et al. (2004)gave a detailed discussion of the anomalously highArctic warming observed in the early part of the 20thcentury; they suggested that the warming was a resultof natural variations in wind-driven oceanic flow pat-terns, and that it caused a reduction in sea ice cover.
Deser et al. (2002) studied the decadal-scale spatio-temporal evolution of winter sea ice in the Labrador Seaand associated sea surface temperature (SST) variations
* Corresponding author. Tel.: þ91 7926916118.
E-mail address: [email protected] (R.K. Singh).
1873-9652/$ - see front matter � 2013 Elsevier B.V. and NIPR. All rights
http://dx.doi.org/10.1016/j.polar.2013.10.003
in the North Atlantic. They found that periods ofenhanced winter ice cover in the northern Labrador Seatended to precede colder than normal SSTs east ofNewfoundland, and suggested that advection of coldfresh water by the Labrador Current could possibly ac-count for the enhanced winter ice cover. Deser et al.(2002) used an iceeocean mixing layer model toassess the role of atmospheric forcing in the evolution ofanomalous sea ice and SSTs, and found that thermody-namic atmospheric forcing accounted for much of thewinter-to-winter persistence and spatial evolution of iceand concurrent SST anomaly patterns.
Comiso (2003) used thermal infrared data from theAdvanced Very High Resolution Radiometer (AVHRR)onboard National Oceanic and Atmospheric Adminis-tration (NOAA) satellites to study a 20-yr record
reserved.
234 R.K. Singh et al. / Polar Science 7 (2013) 233e240
(1981e2001) of Arctic SSTs, and found a trend ofincreasing SSTs during this time. Chepurin and Carton(2012) used the Pathfinder SST data from the AVHRRand operational SST products from NOAA and the UKMeteorological Office to investigate the connection be-tween SST variations in subpolar gyres (Nordic seas)and those occurring further north in Arctic regions.
Similar to SSTs in the Southern Ocean, which areaffected by the El NinoeSouthern Oscillation (ENSO)(Comiso, 2000), Arctic SSTs are affected by the NorthAtlantic Oscillation (NAO) and the Arctic Oscillation(AO) (Visbeck et al., 2001; Comiso, 2003; Cohen andBarlow, 2005; Chepurin and Carton, 2012; Qu et al.,2012, and others). The fluctuations in SSTs and thestrength of the NAO are related (Bjerknes, 1964).Hurrell and Dickson (2004) found that SSTs signifi-cantly correlated with NAO variability in the Arctic,explaining one-third of the Northern HemisphereInterannual winter SST variability. Qu et al. (2012)found a positive correlation between SSTs and theNAO in their study of the Greenland Sea.
Sea surface temperatures are one of the mostimportant variables affecting the Earth’s climate sys-tem (Lindsay and Rothrock, 1994; Reynolds et al.,2002, 2007; Deser et al., 2010). In atmosphericmodels, SSTs act as an oceanic boundary condition(Reynolds and Smith, 1994). The annual cycle of seaice freeze/thaw and growth/melt, and the energy ex-change between oceans and atmosphere, depend onSSTs (Key et al., 1997). In the present study, long-termvariability in Arctic SSTs is discussed. A warmingtrend in the Arctic as a whole is observed at decadaltime scales. However, on regional scales, we haveidentified some areas of significant cooling trends.These cooling trends, as well as important features ofdecadal and longer SST trends and anomalies, are thesubject of the present research.
Here, we mainly discuss: (i) interannual variabilityin SST trends and anomalies during the 29-yr period of1982e2010; (ii) decadal trends and anomalies duringthree decades: 1982e1991, 1992e2001, and2002e2010 (the 2002e2010 data are for 9 years only);(iii) analysis of summer (JuneeJulyeAugust, JJA)SSTs for the 30-yr period 1982e2011; and (iv) anal-ysis of September SSTs for the period 1982e2010.
2. Data and methodology
The NOAA Optimum Interpolation SST (OISST)Version 2 dataset (Reynolds et al., 2002; henceforthOI.V2) for the period December 1981eOctober 2011was obtained from NOAA/Oceanic and Atmospheric
Research/Earth Science Research Laboratory, PhysicalSciences Division (NOAA/OAR/ESRL PSD), Boulder,Colorado, USA (http://www.esrl.noaa.gov/psd/). TheOI.V2 dataset contains monthly SST fields, derived byaveraging daily fields obtained by linear interpolationof weekly OI fields. The analysis uses in situ andsatellite SSTs as well as simulated SSTs using sea icedata over the marginal ice zone (MIZ) where in situand satellite observations are sparse due to navigationhazards and cloud cover, respectively. The OI.V2dataset represents a modest improvement over theVersion 1 dataset (Reynolds and Smith, 1994), basedon bias corrections performed using in situ data. Theresolution of the SST data in the OI.V2 dataset is1� � 1�. The first grid box is centered on 0.5�E, 89.5�Sand the remaining grid boxes are located eastward to359.5�E and northward to 89.5�N. We reprojected thedata onto a polar stereographic projection at a spatialresolution of 50 � 50 km; this reprojected dataset wasused for all of our analyses.
The analysis of interannual variability, conductedusing data from the period 1982e2010, comparedvariations between annual anomaly maps, generated bysubtracting the climatological mean for the base period1982e2010 from annual averaged SST values. Wethen performed a regression analysis to compute theinterannual trends on a pixel-by-pixel basis, and theregions with statistically significant trends weremarked. An F-test was used to test for statistical sig-nificance. We also analyzed decadal trends, summerseason (JJA) trends, and September trends, all of whichare discussed below.
3. Results and discussion
Fig. 1 presents a temporal sequence of Arctic SSTanomaly maps for the period 1982e2010. The regionwithin the rectangle marked ‘A’, which is in theBarents/Nordic Sea, experienced warming during theperiod 1983e1986 (and low-amplitude warming in1982), cooling during the period 1987e1989, warmingduring the period 1990e1994, small-amplitude coolingduring the period 1995e1997, and then warming from1998 onwards until the last year of our analysis in2010. Thus, as of 2010, the region is experiencing awarming trend. Similar trends were observed byComiso (2003) in his analysis of Arctic SSTs duringthe period 1981e2001. It should be noted that theperiods of warming (1983e1985, 1990e1994, etc.)correspond to episodes of positive NAO indices, andthe NAO may have contributed to the observed tem-perature changes in this region. The high NAO/AO
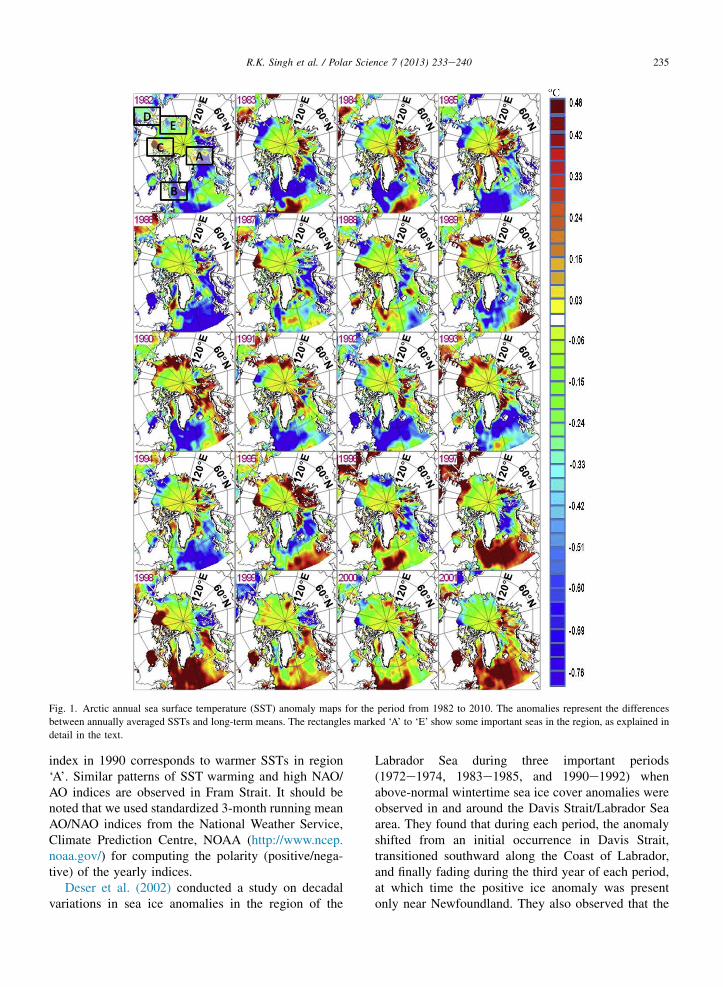
Fig. 1. Arctic annual sea surface temperature (SST) anomaly maps for the period from 1982 to 2010. The anomalies represent the differences
between annually averaged SSTs and long-term means. The rectangles marked ‘A’ to ‘E’ show some important seas in the region, as explained in
detail in the text.
235R.K. Singh et al. / Polar Science 7 (2013) 233e240
index in 1990 corresponds to warmer SSTs in region‘A’. Similar patterns of SST warming and high NAO/AO indices are observed in Fram Strait. It should benoted that we used standardized 3-month running meanAO/NAO indices from the National Weather Service,Climate Prediction Centre, NOAA (http://www.ncep.noaa.gov/) for computing the polarity (positive/nega-tive) of the yearly indices.
Deser et al. (2002) conducted a study on decadalvariations in sea ice anomalies in the region of the
Labrador Sea during three important periods(1972e1974, 1983e1985, and 1990e1992) whenabove-normal wintertime sea ice cover anomalies wereobserved in and around the Davis Strait/Labrador Seaarea. They found that during each period, the anomalyshifted from an initial occurrence in Davis Strait,transitioned southward along the Coast of Labrador,and finally fading during the third year of each period,at which time the positive ice anomaly was presentonly near Newfoundland. They also observed that the
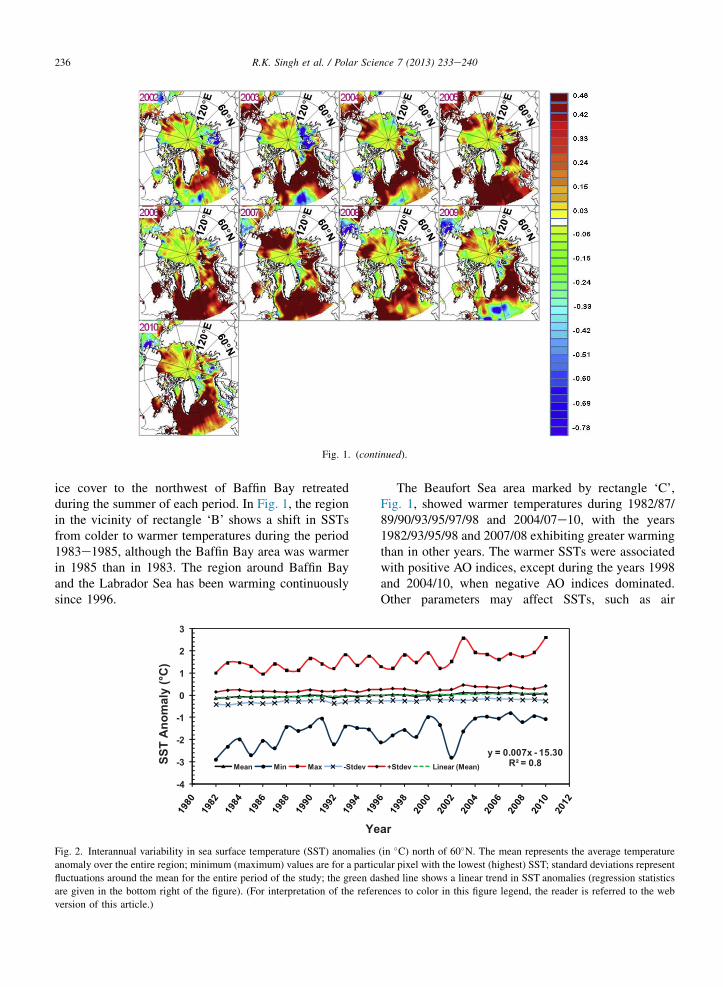
Fig. 1. (continued).
236 R.K. Singh et al. / Polar Science 7 (2013) 233e240
ice cover to the northwest of Baffin Bay retreatedduring the summer of each period. In Fig. 1, the regionin the vicinity of rectangle ‘B’ shows a shift in SSTsfrom colder to warmer temperatures during the period1983e1985, although the Baffin Bay area was warmerin 1985 than in 1983. The region around Baffin Bayand the Labrador Sea has been warming continuouslysince 1996.
-4
-3
-2
-1
0
1
2
3
SS
T A
no
maly (°C
)
Ye
Mean Min Max -Stdev
Fig. 2. Interannual variability in sea surface temperature (SST) anomalies
anomaly over the entire region; minimum (maximum) values are for a partic
fluctuations around the mean for the entire period of the study; the green da
are given in the bottom right of the figure). (For interpretation of the refer
version of this article.)
The Beaufort Sea area marked by rectangle ‘C’,Fig. 1, showed warmer temperatures during 1982/87/89/90/93/95/97/98 and 2004/07e10, with the years1982/93/95/98 and 2007/08 exhibiting greater warmingthan in other years. The warmer SSTs were associatedwith positive AO indices, except during the years 1998and 2004/10, when negative AO indices dominated.Other parameters may affect SSTs, such as air
y = 0.007x - 15.30
R² = 0.8
ar
+Stdev Linear (Mean)
(in �C) north of 60�N. The mean represents the average temperature
ular pixel with the lowest (highest) SST; standard deviations represent
shed line shows a linear trend in SST anomalies (regression statistics
ences to color in this figure legend, the reader is referred to the web
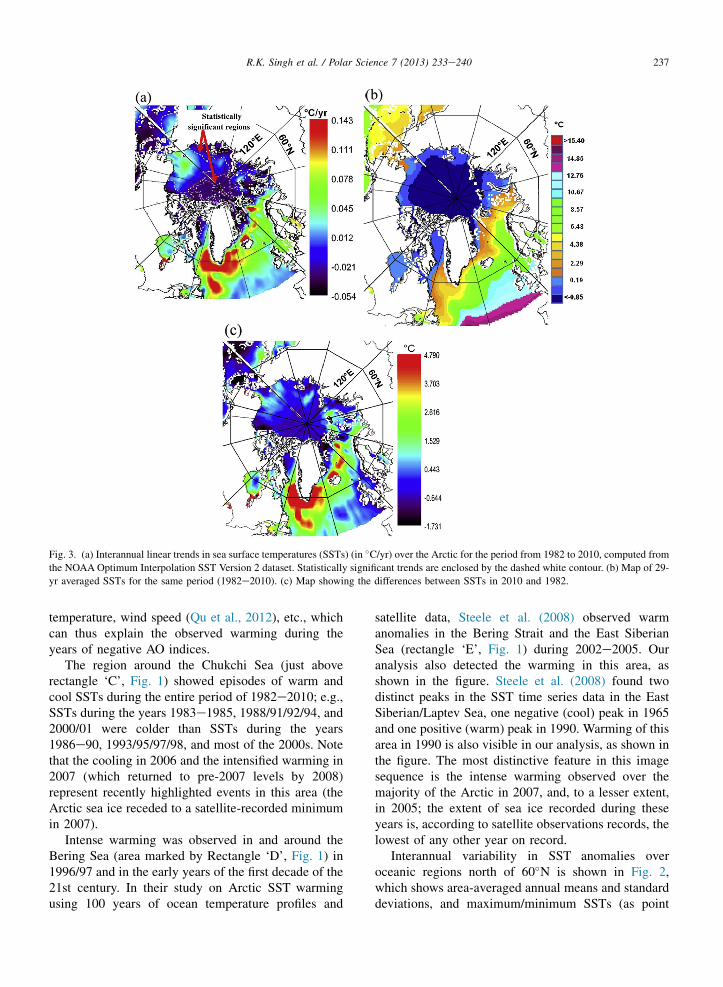
Fig. 3. (a) Interannual linear trends in sea surface temperatures (SSTs) (in �C/yr) over the Arctic for the period from 1982 to 2010, computed from
the NOAAOptimum Interpolation SST Version 2 dataset. Statistically significant trends are enclosed by the dashed white contour. (b) Map of 29-
yr averaged SSTs for the same period (1982e2010). (c) Map showing the differences between SSTs in 2010 and 1982.
237R.K. Singh et al. / Polar Science 7 (2013) 233e240
temperature, wind speed (Qu et al., 2012), etc., whichcan thus explain the observed warming during theyears of negative AO indices.
The region around the Chukchi Sea (just aboverectangle ‘C’, Fig. 1) showed episodes of warm andcool SSTs during the entire period of 1982e2010; e.g.,SSTs during the years 1983e1985, 1988/91/92/94, and2000/01 were colder than SSTs during the years1986e90, 1993/95/97/98, and most of the 2000s. Notethat the cooling in 2006 and the intensified warming in2007 (which returned to pre-2007 levels by 2008)represent recently highlighted events in this area (theArctic sea ice receded to a satellite-recorded minimumin 2007).
Intense warming was observed in and around theBering Sea (area marked by Rectangle ‘D’, Fig. 1) in1996/97 and in the early years of the first decade of the21st century. In their study on Arctic SST warmingusing 100 years of ocean temperature profiles and
satellite data, Steele et al. (2008) observed warmanomalies in the Bering Strait and the East SiberianSea (rectangle ‘E’, Fig. 1) during 2002e2005. Ouranalysis also detected the warming in this area, asshown in the figure. Steele et al. (2008) found twodistinct peaks in the SST time series data in the EastSiberian/Laptev Sea, one negative (cool) peak in 1965and one positive (warm) peak in 1990. Warming of thisarea in 1990 is also visible in our analysis, as shown inthe figure. The most distinctive feature in this imagesequence is the intense warming observed over themajority of the Arctic in 2007, and, to a lesser extent,in 2005; the extent of sea ice recorded during theseyears is, according to satellite observations records, thelowest of any other year on record.
Interannual variability in SST anomalies overoceanic regions north of 60�N is shown in Fig. 2,which shows area-averaged annual means and standarddeviations, and maximum/minimum SSTs (as point
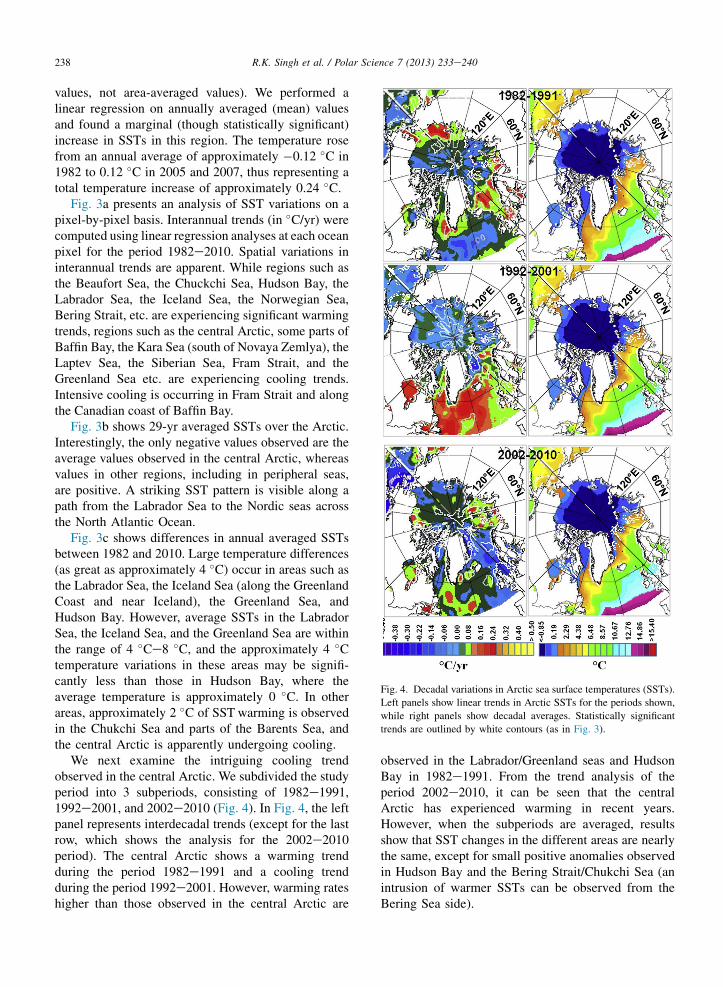
Fig. 4. Decadal variations in Arctic sea surface temperatures (SSTs).
Left panels show linear trends in Arctic SSTs for the periods shown,
while right panels show decadal averages. Statistically significant
trends are outlined by white contours (as in Fig. 3).
238 R.K. Singh et al. / Polar Science 7 (2013) 233e240
values, not area-averaged values). We performed alinear regression on annually averaged (mean) valuesand found a marginal (though statistically significant)increase in SSTs in this region. The temperature rosefrom an annual average of approximately �0.12 �C in1982 to 0.12 �C in 2005 and 2007, thus representing atotal temperature increase of approximately 0.24 �C.
Fig. 3a presents an analysis of SST variations on apixel-by-pixel basis. Interannual trends (in �C/yr) werecomputed using linear regression analyses at each oceanpixel for the period 1982e2010. Spatial variations ininterannual trends are apparent. While regions such asthe Beaufort Sea, the Chuckchi Sea, Hudson Bay, theLabrador Sea, the Iceland Sea, the Norwegian Sea,Bering Strait, etc. are experiencing significant warmingtrends, regions such as the central Arctic, some parts ofBaffin Bay, the Kara Sea (south of Novaya Zemlya), theLaptev Sea, the Siberian Sea, Fram Strait, and theGreenland Sea etc. are experiencing cooling trends.Intensive cooling is occurring in Fram Strait and alongthe Canadian coast of Baffin Bay.
Fig. 3b shows 29-yr averaged SSTs over the Arctic.Interestingly, the only negative values observed are theaverage values observed in the central Arctic, whereasvalues in other regions, including in peripheral seas,are positive. A striking SST pattern is visible along apath from the Labrador Sea to the Nordic seas acrossthe North Atlantic Ocean.
Fig. 3c shows differences in annual averaged SSTsbetween 1982 and 2010. Large temperature differences(as great as approximately 4 �C) occur in areas such asthe Labrador Sea, the Iceland Sea (along the GreenlandCoast and near Iceland), the Greenland Sea, andHudson Bay. However, average SSTs in the LabradorSea, the Iceland Sea, and the Greenland Sea are withinthe range of 4 �Ce8 �C, and the approximately 4 �Ctemperature variations in these areas may be signifi-cantly less than those in Hudson Bay, where theaverage temperature is approximately 0 �C. In otherareas, approximately 2 �C of SST warming is observedin the Chukchi Sea and parts of the Barents Sea, andthe central Arctic is apparently undergoing cooling.
We next examine the intriguing cooling trendobserved in the central Arctic. We subdivided the studyperiod into 3 subperiods, consisting of 1982e1991,1992e2001, and 2002e2010 (Fig. 4). In Fig. 4, the leftpanel represents interdecadal trends (except for the lastrow, which shows the analysis for the 2002e2010period). The central Arctic shows a warming trendduring the period 1982e1991 and a cooling trendduring the period 1992e2001. However, warming rateshigher than those observed in the central Arctic are
observed in the Labrador/Greenland seas and HudsonBay in 1982e1991. From the trend analysis of theperiod 2002e2010, it can be seen that the centralArctic has experienced warming in recent years.However, when the subperiods are averaged, resultsshow that SST changes in the different areas are nearlythe same, except for small positive anomalies observedin Hudson Bay and the Bering Strait/Chukchi Sea (anintrusion of warmer SSTs can be observed from theBering Sea side).
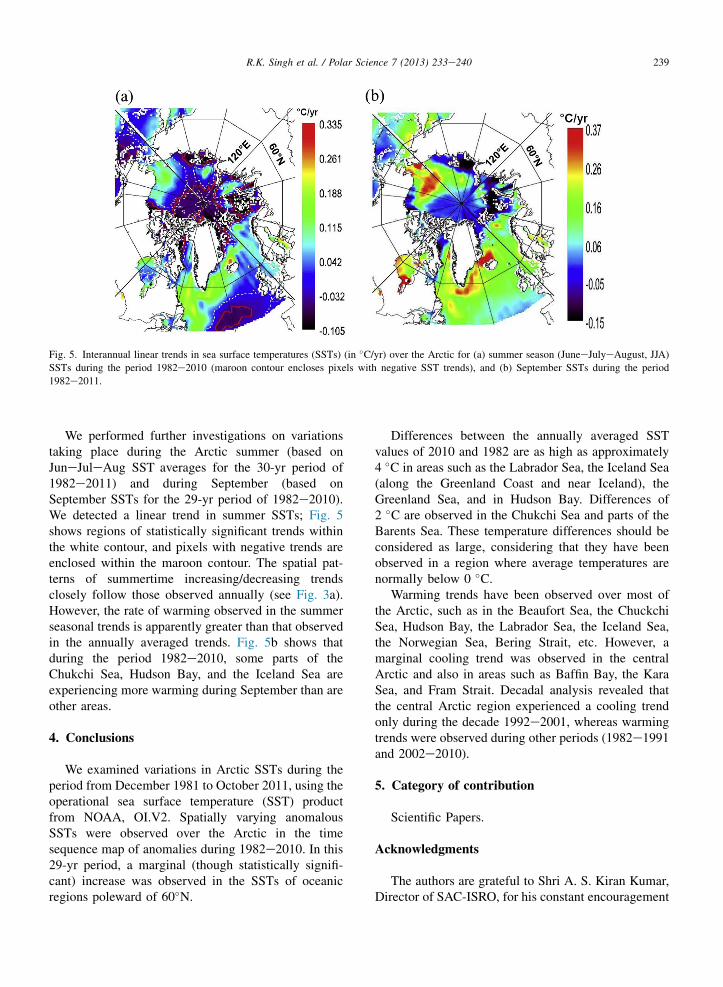
Fig. 5. Interannual linear trends in sea surface temperatures (SSTs) (in �C/yr) over the Arctic for (a) summer season (JuneeJulyeAugust, JJA)SSTs during the period 1982e2010 (maroon contour encloses pixels with negative SST trends), and (b) September SSTs during the period
1982e2011.
239R.K. Singh et al. / Polar Science 7 (2013) 233e240
We performed further investigations on variationstaking place during the Arctic summer (based onJuneJuleAug SST averages for the 30-yr period of1982e2011) and during September (based onSeptember SSTs for the 29-yr period of 1982e2010).We detected a linear trend in summer SSTs; Fig. 5shows regions of statistically significant trends withinthe white contour, and pixels with negative trends areenclosed within the maroon contour. The spatial pat-terns of summertime increasing/decreasing trendsclosely follow those observed annually (see Fig. 3a).However, the rate of warming observed in the summerseasonal trends is apparently greater than that observedin the annually averaged trends. Fig. 5b shows thatduring the period 1982e2010, some parts of theChukchi Sea, Hudson Bay, and the Iceland Sea areexperiencing more warming during September than areother areas.
4. Conclusions
We examined variations in Arctic SSTs during theperiod from December 1981 to October 2011, using theoperational sea surface temperature (SST) productfrom NOAA, OI.V2. Spatially varying anomalousSSTs were observed over the Arctic in the timesequence map of anomalies during 1982e2010. In this29-yr period, a marginal (though statistically signifi-cant) increase was observed in the SSTs of oceanicregions poleward of 60�N.
Differences between the annually averaged SSTvalues of 2010 and 1982 are as high as approximately4 �C in areas such as the Labrador Sea, the Iceland Sea(along the Greenland Coast and near Iceland), theGreenland Sea, and in Hudson Bay. Differences of2 �C are observed in the Chukchi Sea and parts of theBarents Sea. These temperature differences should beconsidered as large, considering that they have beenobserved in a region where average temperatures arenormally below 0 �C.
Warming trends have been observed over most ofthe Arctic, such as in the Beaufort Sea, the ChuckchiSea, Hudson Bay, the Labrador Sea, the Iceland Sea,the Norwegian Sea, Bering Strait, etc. However, amarginal cooling trend was observed in the centralArctic and also in areas such as Baffin Bay, the KaraSea, and Fram Strait. Decadal analysis revealed thatthe central Arctic region experienced a cooling trendonly during the decade 1992e2001, whereas warmingtrends were observed during other periods (1982e1991and 2002e2010).
5. Category of contribution
Scientific Papers.
Acknowledgments
The authors are grateful to Shri A. S. Kiran Kumar,Director of SAC-ISRO, for his constant encouragement
240 R.K. Singh et al. / Polar Science 7 (2013) 233e240
and guidance in the pursuit of activities in the field ofpolar science. We thank Dr. J. S. Parihar, Dr. P. K. Pal,Dr. Abhijit Sarkar, and Dr. N.K. Vyas for valuablecomments. NOAA analyzed the SST data (OI SSTVersion 2), which were obtained from NOAA/OAR/ESRL PSD, Boulder, Colorado, USA (http://www.esrl.noaa.gov/psd/), and their use is gratefullyacknowledged.
References
Bengtsson, L., Semenov, V.A., Johannessen, O.M., 2004. The early
twentieth-century warming in the Arcticda possible mechanism.
J. Clim. 17, 4045e4057.
Bjerknes, J., 1964. Atlantic air-sea interaction. In: Landsberg, H.E.,
van Mieghem (Eds.) 10, pp. 1e82. Adv. Geophys.
Chepurin, G.A., Carton, J.A., 2012. Subarctic and arctic sea surface
temperature and its relation to ocean heat content. J. Geophys.
Res. 117 (C06019). http://dx.doi.org/10.1029/2011JC007770.
Cohen, J., Barlow, M., 2005. The NAO, the AO, and global warming:
how closely related? J. Clim. 18, 4498e4513.
Comiso, J.C., 2000. Variability and trends in Antarctic surface
temperatures from in situ and satellite infrared measurements. J.
Clim. 13, 1674e1696.
Comiso, J.C., 2003. Warming trends in the Arctic from clear sky
satellite observations. J. Clim. 16, 3498e3510.Deser, C., Holland, M., Reverdin, G., Timlin, M., 2002. Decadal
variations in Labrador sea ice cover and North Atlantic sea sur-
face temperatures. J. Geophys. Res. 107 (C5), 3-1e3-12. http://
dx.doi.org/10.1029/2000JC000683.
Deser, C., Phillips, A.S., Alexander, M.A., 2010. Twentieth century
tropical sea surface temperature trends revisited. Geophys. Res.
Letts 37. http://dx.doi.org/10.1029/2010GL043321. L10701.
Hurrell, J.W., Dickson, R.R., 2004. Climate variability over the North
Atlantic. In: Stenseth, N.C., et al. (Eds.), Marine Ecosystem and
Climate Variation: the North Atlantic: a Comparative Perspective.
Oxford University Press, pp. 15e32.
Key, J.R., Collin, J.B., Fowler, C., Stone, R.S., 1997. High-latitude
surface temperature estimates from thermal satellite data. Rem.
Sens. Environ. 61, 302e309.
Lindsay, R.W., Rothrock, D.A., 1994. Arctic sea ice surface tem-
perature from AVHRR. J. Clim. 7, 174e183.
Qu, B., Gabric, A.J., Zhu, J., Lin, D., Qian, F., Zhao, M., 2012.
Correlation between sea surface temperature and wind speed in
Greenland Sea and their relationships with NAO variability.
Water Sci. Eng. 5 (3), 304e315. http://dx.doi.org/10.3882/
j.issn.1674-2370.2012.03.006.
Reynolds, R.W., Smith, T.M., 1994. Improved global sea surface
temperature analyses using optimum interpolation. J. Clim. 7,
929e948.
Reynolds, R.W., Rayner, N.A., Smith, T.M., Stokes, D.C., Wang, W.,
2002. An improved in situ and satellite SST analysis for climate.
J. Clim. 15, 1609e1625.
Reynolds, R.W., Smith, T.M., Liu, C., Chelton, D.B., Casey, K.S.,
Schlax, M.G., 2007. Daily high-resolution-blended analyses for
sea surface temperature. J. Clim. 20, 5473e5496.
Steele, M., Ernold, W., Zhang, J., 2008. Arctic ocean surface
warming trends over the past 100 years. Geophys. Res. Letts 35.
http://dx.doi.org/10.1029/2007GL031651. L02614.
Visbeck, M.H., Hurrell, J.W., Polvan, L., Cullen, H.M., 2001. The
North Atlantic Oscillation: past, present, and future. Proc. Natl.
Acad. Sci. (PNAS) 98 (23), 12876e12877.