long-term performance test of laminated rubber …
TRANSCRIPT
1
LONG-TERM PERFORMANCE TEST OF LAMINATED RUBBER BEARING FOR SEISMIC ISOLATION SYSTEM
Keiko MORITA1, Satoshi YAMAGAMI2 and Mineo TAKAYAMA3
ABSTRACT
The laminated rubber bearing is an important structural member of a seismic isolation system. When considering the durability of the laminated rubber bearing, the review of creep deformation caused by axial compressive force is important. We therefore show the results of creep tests carried out over 15 years using a laminated natural rubber bearing under a constant axial compressive stress of 200 kg/cm2. Also we show the ageing effect on a laminated rubber bearing actually used in a seismic isolated building for about 20 years. We have measured the creep deformation, and conducted a compression test and a compressive shearing test, and also conducted a tensile test and a shearing test of inner rubber to clarify the change of physical property. These results show some conclusions that natural rubber bearings would have considerable durability under long and severe environmental condition.
INTRODUCTION
The basic performance of laminated rubber bearings, which are an important structural member of a seismic isolation system, has been confirmed by full-scale tests such as compression tests and compressive shearing tests, and they are actually being used in buildings. When considering the durability of the laminated rubber bearing, the review of ageing caused by oxidation of the rubber layers and creep deformation caused by axial compressive force over long periods of time becomes important. It has been confirmed from inspections of rubber pads which have been actually used for 100 years and accelerated thermal degradation tests that the structure of the laminated rubber bearing is such that the oxidation of the rubber progressed from the surface of the rubber sheets, and only has an influence to a depth of several mm from the surface. A coating rubber has also been added around to protect the inside of the laminated rubber bearing from external factors such as oxygen and ultraviolet light, and this reduces the influence of oxidation even further. However, the slight changes in the stiffness and deformability of the laminated rubber bearing caused by ageing of the physical properties of rubber should be taken into account in designing. Creep Test With regard to the assessment of the creep properties of the laminated rubber bearing, two year creep tests (under axial compressive stress of 110 kg/cm2 and 150 kg/cm2) have been carried out using two types of the laminated natural rubber bearing. The results of the tests predict that the
1 Dept. of Architecture, Faculty of Engineering, Fukuoka University; Fukuoka, JAPAN 2 Technical Research Institute, Okumura Corporation; Tsukuba, JAPAN 3 Dept. of Architecture, Faculty of Engineering, Fukuoka University; Fukuoka, JAPAN
2
creep deformation in 100 years' time to be within several mm, leading to the observation that the creep deformation of the laminated rubber bearing can be ignored in designing. The compression tests and compressive shearing tests conducted before and after the creep tests. These produced the result that the two year creep tests have negligible influence on the hysteresis of the laminated rubber bearing. In order to realize high-performance seismic-isolated buildings, however, it is also necessary to clarify the creep properties of the laminated rubber bearing under high axial compressive stress. This paper therefore shows the results of creep tests carried out approximately 15 years (131,136 hours) using laminated natural rubber bearing under a constant axial compressive stress of 200 kg/cm2. It also compares these results with past test results carried out under axial stress of 110 kg/cm2 and 150 kg/cm2 and discusses the influence on the creep behavior caused by the differences in axial stress and shape of laminated rubber bearing. Inspection of laminated Rubber Bearing installed in the Building To clarify ageing effect on a laminated rubber bearing, we have investigated it which used in a seismic isolated building for about 20 years. The average axial compressive stress per one laminated rubber bearing is 45kg/cm2. The basic performance of laminated rubber bearings has been confirmed by compression tests and compressive shearing tests every several years. And to study of ageing effect of rubber material, the samples were cut out from used laminated rubber bearing, and carried out a tensile test and a shearing test.
CREEP TEST
Test Specimens
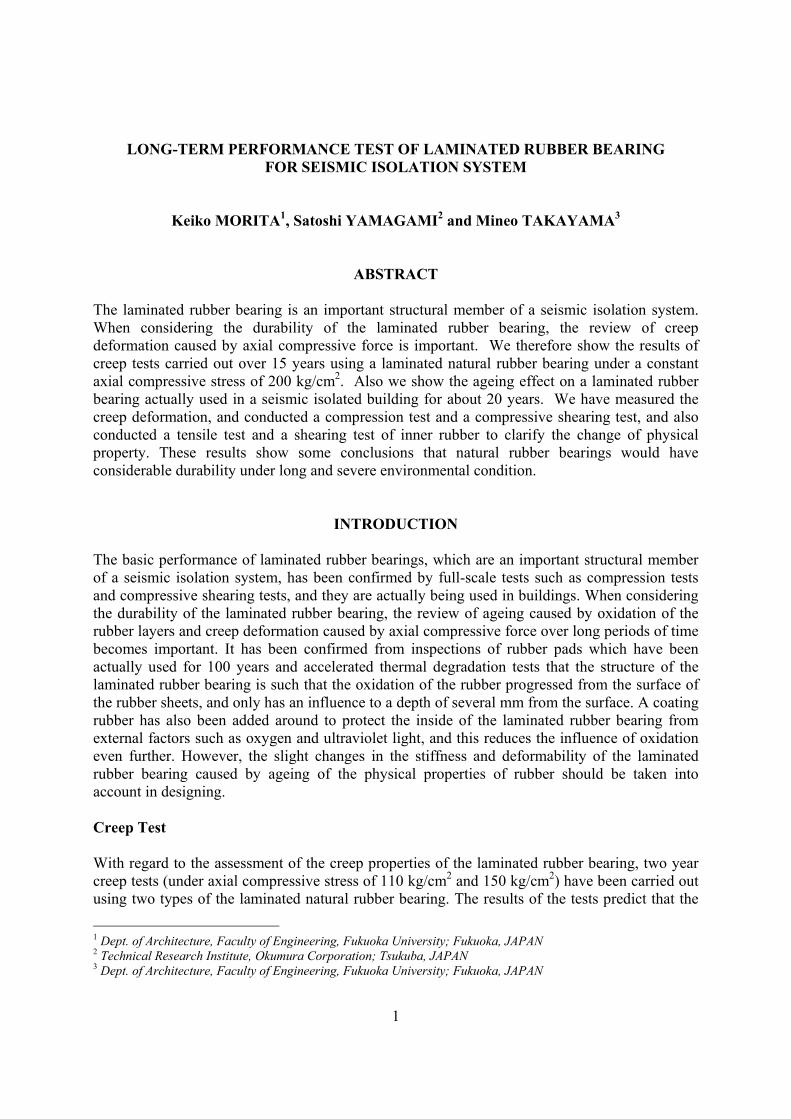
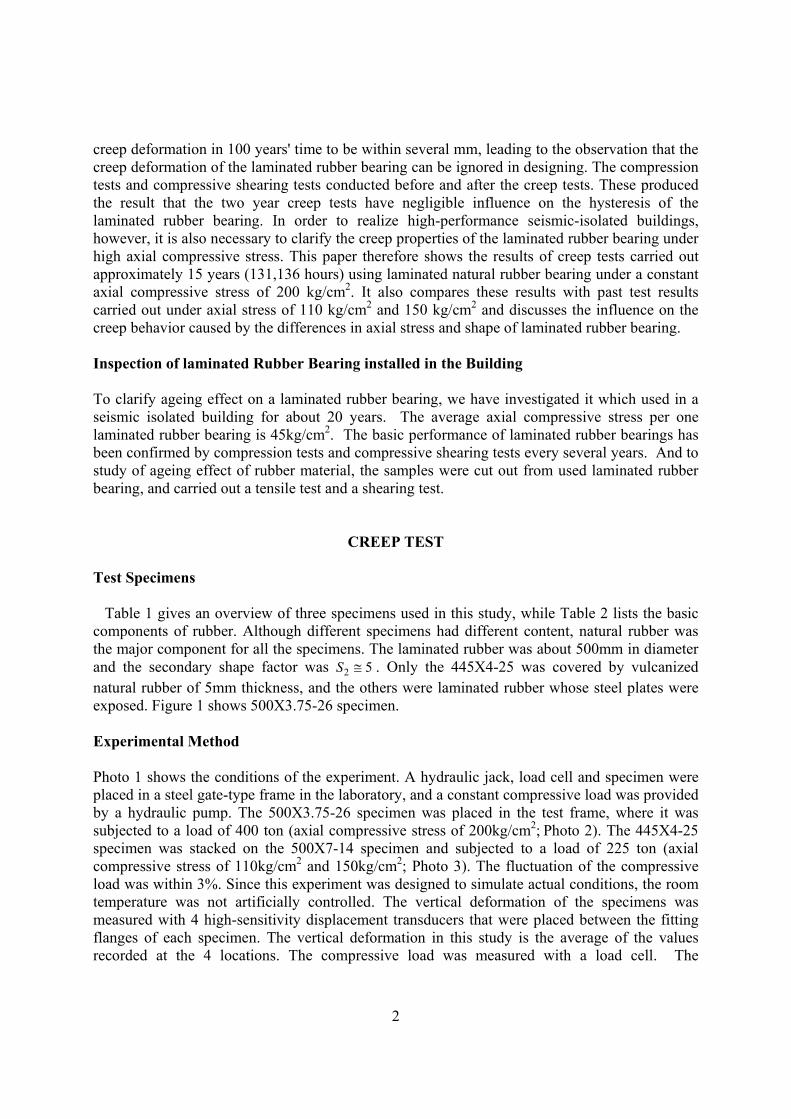
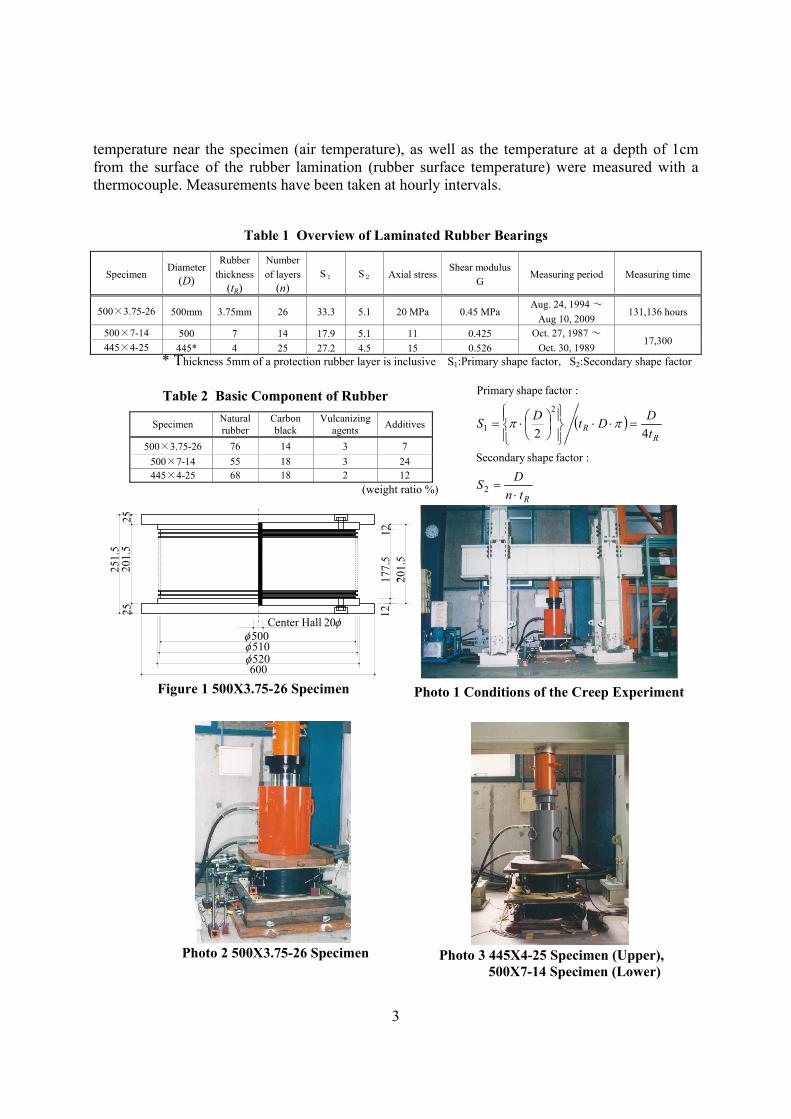
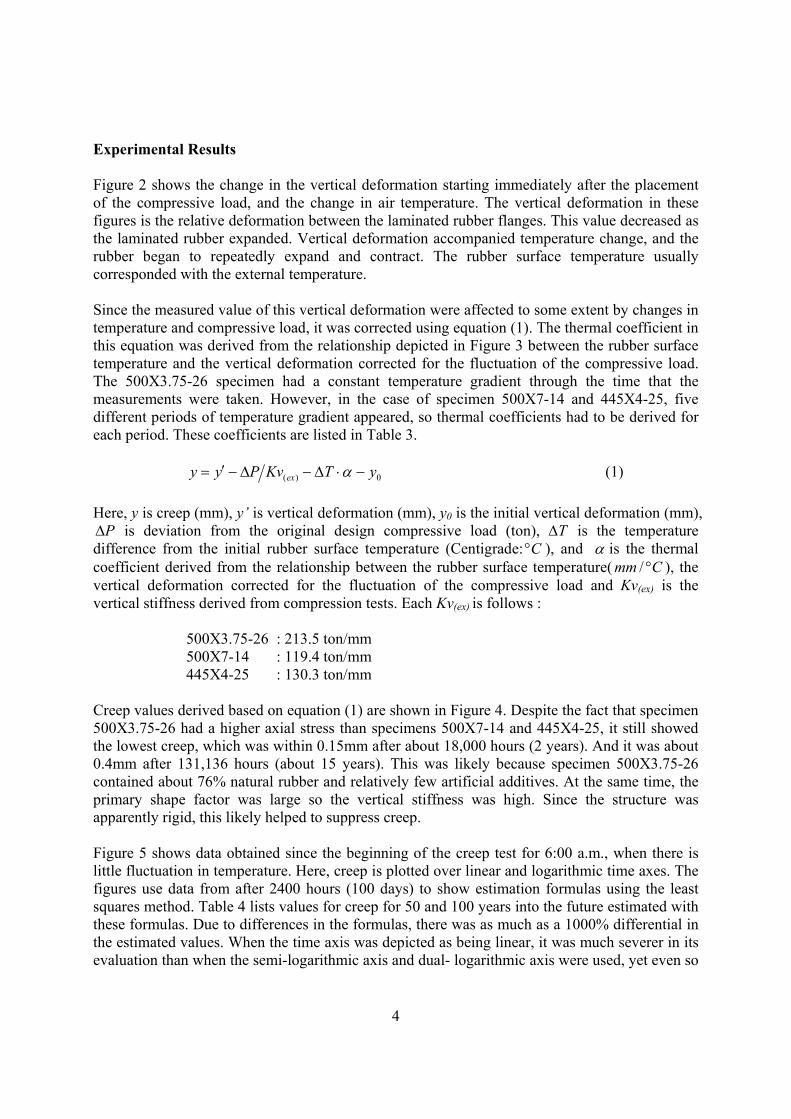
Table 1 gives an overview of three specimens used in this study, while Table 2 lists the basic components of rubber. Although different specimens had different content, natural rubber was the major component for all the specimens. The laminated rubber was about 500mm in diameter and the secondary shape factor was 52 ≅S . Only the 445X4-25 was covered by vulcanized natural rubber of 5mm thickness, and the others were laminated rubber whose steel plates were exposed. Figure 1 shows 500X3.75-26 specimen. Experimental Method Photo 1 shows the conditions of the experiment. A hydraulic jack, load cell and specimen were placed in a steel gate-type frame in the laboratory, and a constant compressive load was provided by a hydraulic pump. The 500X3.75-26 specimen was placed in the test frame, where it was subjected to a load of 400 ton (axial compressive stress of 200kg/cm2; Photo 2). The 445X4-25 specimen was stacked on the 500X7-14 specimen and subjected to a load of 225 ton (axial compressive stress of 110kg/cm2 and 150kg/cm2; Photo 3). The fluctuation of the compressive load was within 3%. Since this experiment was designed to simulate actual conditions, the room temperature was not artificially controlled. The vertical deformation of the specimens was measured with 4 high-sensitivity displacement transducers that were placed between the fitting flanges of each specimen. The vertical deformation in this study is the average of the values recorded at the 4 locations. The compressive load was measured with a load cell. The
3
( )
R
RR
tnDS
tDDtDS
⋅=
=⋅⋅⎪⎭
⎪⎬⎫
⎪⎩
⎪⎨⎧
⎟⎠⎞
⎜⎝⎛⋅=
2
2
1
:factor shapeSecondary
:factor shapePrimary
42ππ
Figure 1 500X3.75-26 Specimen
520φ 510φ 500φ
Center Hall φ20
600
25
251.
5 25
20
1.5
Photo 1 Conditions of the Creep Experiment
temperature near the specimen (air temperature), as well as the temperature at a depth of 1cm from the surface of the rubber lamination (rubber surface temperature) were measured with a thermocouple. Measurements have been taken at hourly intervals.
Table 1 Overview of Laminated Rubber Bearings
Specimen Diameter
(D)
Rubber thickness
(tR)
Number of layers
(n) S1 S2 Axial stress
Shear modulus G
Measuring period Measuring time
500×3.75-26 500mm 3.75mm 26 33.3 5.1 20 MPa 0.45 MPa Aug. 24, 1994 ~
Aug 10, 2009 131,136 hours
500×7-14 500 7 14 17.9 5.1 11 0.425 Oct. 27, 1987 ~ Oct. 30, 1989
17,300 445×4-25 445* 4 25 27.2 4.5 15 0.526 * Thickness 5mm of a protection rubber layer is inclusive S1:Primary shape factor,S2:Secondary shape factor
Table 2 Basic Component of Rubber
Specimen Natural rubber
Carbon black
Vulcanizing agents Additives
500×3.75-26 76 14 3 7 500×7-14 55 18 3 24 445×4-25 68 18 2 12
(weight ratio %)
177.
5 2
12
201.
5 12
Photo 2 500X3.75-26 Specimen Photo 3 445X4-25 Specimen (Upper), 500X7-14 Specimen (Lower),
4
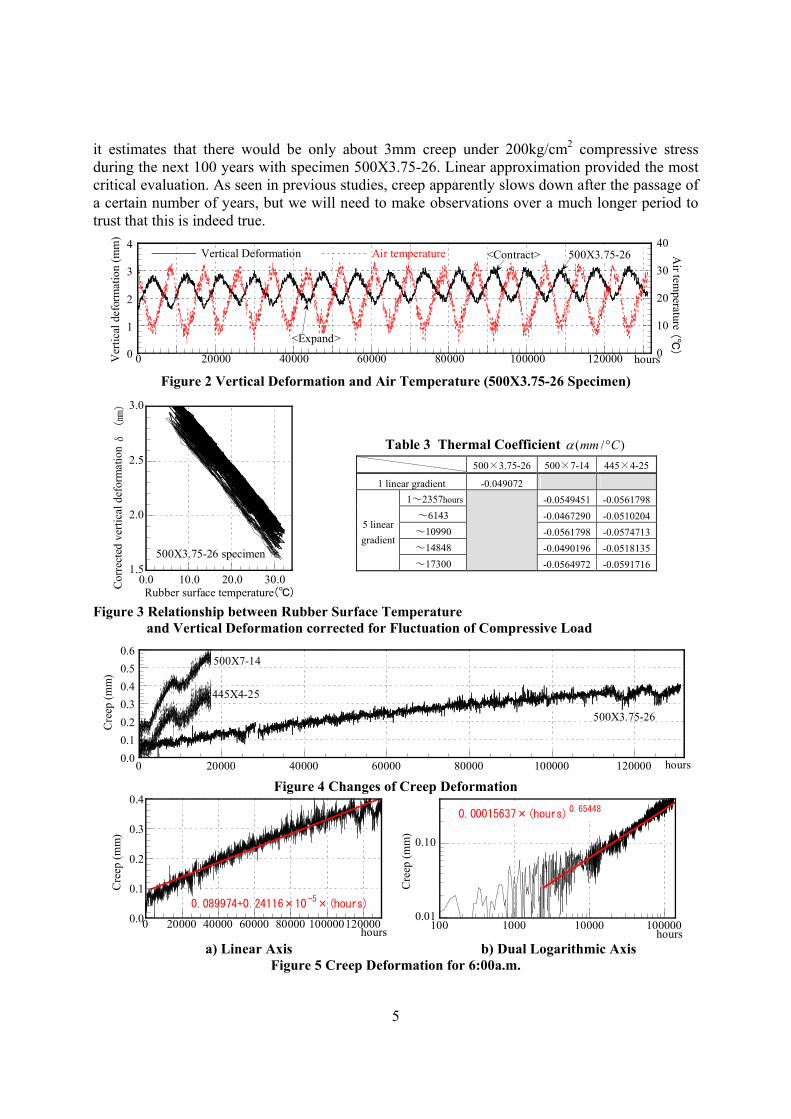
Experimental Results Figure 2 shows the change in the vertical deformation starting immediately after the placement of the compressive load, and the change in air temperature. The vertical deformation in these figures is the relative deformation between the laminated rubber flanges. This value decreased as the laminated rubber expanded. Vertical deformation accompanied temperature change, and the rubber began to repeatedly expand and contract. The rubber surface temperature usually corresponded with the external temperature. Since the measured value of this vertical deformation were affected to some extent by changes in temperature and compressive load, it was corrected using equation (1). The thermal coefficient in this equation was derived from the relationship depicted in Figure 3 between the rubber surface temperature and the vertical deformation corrected for the fluctuation of the compressive load. The 500X3.75-26 specimen had a constant temperature gradient through the time that the measurements were taken. However, in the case of specimen 500X7-14 and 445X4-25, five different periods of temperature gradient appeared, so thermal coefficients had to be derived for each period. These coefficients are listed in Table 3.
0)( yTKvPyy ex −⋅Δ−Δ−′= α (1)
Here, y is creep (mm), y’ is vertical deformation (mm), y0 is the initial vertical deformation (mm), PΔ is deviation from the original design compressive load (ton), TΔ is the temperature
difference from the initial rubber surface temperature (Centigrade: C° ), and α is the thermal coefficient derived from the relationship between the rubber surface temperature( Cmm °/ ), the vertical deformation corrected for the fluctuation of the compressive load and Kv(ex) is the vertical stiffness derived from compression tests. Each Kv(ex) is follows :
500X3.75-26 : 213.5 ton/mm 500X7-14 : 119.4 ton/mm 445X4-25 : 130.3 ton/mm
Creep values derived based on equation (1) are shown in Figure 4. Despite the fact that specimen 500X3.75-26 had a higher axial stress than specimens 500X7-14 and 445X4-25, it still showed the lowest creep, which was within 0.15mm after about 18,000 hours (2 years). And it was about 0.4mm after 131,136 hours (about 15 years). This was likely because specimen 500X3.75-26 contained about 76% natural rubber and relatively few artificial additives. At the same time, the primary shape factor was large so the vertical stiffness was high. Since the structure was apparently rigid, this likely helped to suppress creep. Figure 5 shows data obtained since the beginning of the creep test for 6:00 a.m., when there is little fluctuation in temperature. Here, creep is plotted over linear and logarithmic time axes. The figures use data from after 2400 hours (100 days) to show estimation formulas using the least squares method. Table 4 lists values for creep for 50 and 100 years into the future estimated with these formulas. Due to differences in the formulas, there was as much as a 1000% differential in the estimated values. When the time axis was depicted as being linear, it was much severer in its evaluation than when the semi-logarithmic axis and dual- logarithmic axis were used, yet even so
5
it estimates that there would be only about 3mm creep under 200kg/cm2 compressive stress during the next 100 years with specimen 500X3.75-26. Linear approximation provided the most critical evaluation. As seen in previous studies, creep apparently slows down after the passage of a certain number of years, but we will need to make observations over a much longer period to trust that this is indeed true.
0
1
2
3
4
0 20000 40000 60000 80000 100000 120000
Vertical Deformation Air temperature
0
10
20
30
40
Ver
tical
def
orm
atio
n (m
m)
hours
Air tem
perature
500X3.75-26
<Expand>
<Contract>
(℃)
Figure 2 Vertical Deformation and Air Temperature (500X3.75-26 Specimen)
Figure 3 Relationship between Rubber Surface Temperature and Vertical Deformation corrected for Fluctuation of Compressive Load
0.00.10.20.30.40.50.6
0 20000 40000 60000 80000 100000 120000
Cre
ep (m
m)
hours
500X7-14
445X4-25
500X3.75-26
Figure 4 Changes of Creep Deformation
0.0
0.1
0.2
0.3
0.4
0 20000 40000 60000 80000 100000120000
Cre
ep (m
m)
hours
0.089974+0.24116×10⁻⁵×(hours)
0.01
0.10
100 1000 10000 100000
Cre
ep (m
m)
hours
0.00015637×(hours)0.65448
a) Linear Axis b) Dual Logarithmic Axis
Figure 5 Creep Deformation for 6:00a.m.
1.5
2.0
2.5
3.0
0.0 10.0 20.0 30.0Cor
rect
ed v
ertic
al d
efor
mat
ion δ
(mm)
Rubber surface temperature(℃)
500X3.75-26 specimen
Table 3 Thermal Coefficient )/( Cmm °α 500×3.75-26 500×7-14 445×4-25
1 linear gradient -0.049072
5 linear gradient
1~2357hours -0.0549451 -0.0561798 ~6143 -0.0467290 -0.0510204 ~10990 -0.0561798 -0.0574713 ~14848 -0.0490196 -0.0518135 ~17300 -0.0564972 -0.0591716
6
Table 4 Estimated Creep Value (mm) Time axis Specimen 50 years after 100years after
Linear axis (Linear)
500×3.75-26 1.15 2.20 500×7-14 9.71 19.41 445×4-25 6.89 13.78
Logarithm axis (Semilogarithm)
500×3.75-26 0.32 0.37 500×7-14 1.14 1.27 445×4-25 0.76 0.86
Dual logarithms 500×3.75-26 0.76 1.21
INSPECTION OF LAMINATED RUBBER BEARING INSTALLED IN THE BUILDING
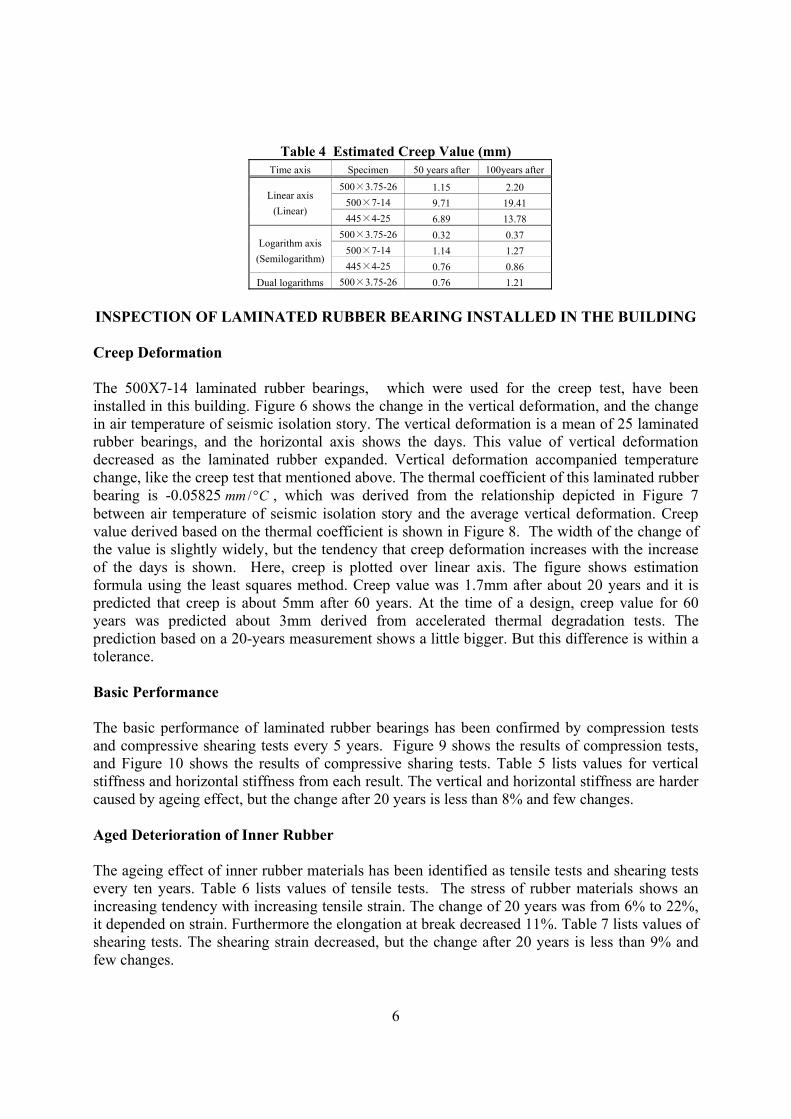
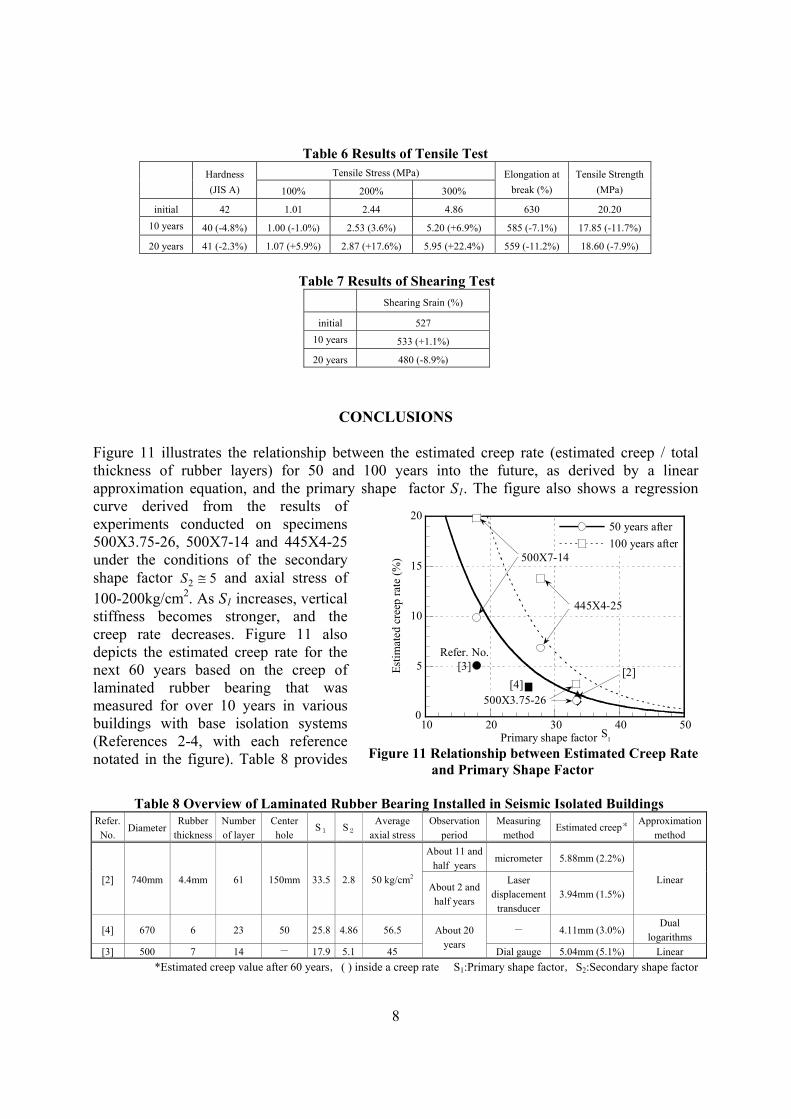
Creep Deformation The 500X7-14 laminated rubber bearings, which were used for the creep test, have been installed in this building. Figure 6 shows the change in the vertical deformation, and the change in air temperature of seismic isolation story. The vertical deformation is a mean of 25 laminated rubber bearings, and the horizontal axis shows the days. This value of vertical deformation decreased as the laminated rubber expanded. Vertical deformation accompanied temperature change, like the creep test that mentioned above. The thermal coefficient of this laminated rubber bearing is -0.05825 Cmm °/ , which was derived from the relationship depicted in Figure 7 between air temperature of seismic isolation story and the average vertical deformation. Creep value derived based on the thermal coefficient is shown in Figure 8. The width of the change of the value is slightly widely, but the tendency that creep deformation increases with the increase of the days is shown. Here, creep is plotted over linear axis. The figure shows estimation formula using the least squares method. Creep value was 1.7mm after about 20 years and it is predicted that creep is about 5mm after 60 years. At the time of a design, creep value for 60 years was predicted about 3mm derived from accelerated thermal degradation tests. The prediction based on a 20-years measurement shows a little bigger. But this difference is within a tolerance. Basic Performance The basic performance of laminated rubber bearings has been confirmed by compression tests and compressive shearing tests every 5 years. Figure 9 shows the results of compression tests, and Figure 10 shows the results of compressive sharing tests. Table 5 lists values for vertical stiffness and horizontal stiffness from each result. The vertical and horizontal stiffness are harder caused by ageing effect, but the change after 20 years is less than 8% and few changes. Aged Deterioration of Inner Rubber The ageing effect of inner rubber materials has been identified as tensile tests and shearing tests every ten years. Table 6 lists values of tensile tests. The stress of rubber materials shows an increasing tendency with increasing tensile strain. The change of 20 years was from 6% to 22%, it depended on strain. Furthermore the elongation at break decreased 11%. Table 7 lists values of shearing tests. The shearing strain decreased, but the change after 20 years is less than 9% and few changes.
7
-1
0
1
2
0 1000 2000 3000 4000 5000 6000 7000 8000
Vertical DeformationAir Tempareture
0
10
20
30
Days
Ver
tical
def
orm
atio
n (m
m)
Air tem
perature(℃
)
-0.5
0.0
0.5
1.0
1.5
2.0
2.5
0 5 10 15 20 25 30
y = 1.8451 - 0.058251x
Air temperature (℃)
Ver
tical
def
orm
atio
n (m
m)
-0.5
0.0
0.5
1.0
1.5
2.0
2.5
0 1000 2000 3000 4000 5000 6000 7000 8000
y = 0.2683 + 0.00026279x
days
Cre
ep d
efor
mat
ion
(mm
)
0
500
1000
1500
2000
2500
3000
3500
Com
pres
sive
Loa
d (k
N)
Vertical Deformation (mm)
5mm
5years 20years15years10yearsinitial
-200 -100 0 100 200
Shea
ring
Load
(kN
)
Deformation (mm)
5years
20years
15years10years
initial
100kN
Figure 6 Vertical Deformation and Air Temperature
Figure 7 Vertical Deformation and Air Temperature
Figure 8 Creep Deformation
Figure 9 Compression Test Figure 10 Compressive Shearing Test
Table 5 Stiffness of Laminated Rubber Bearing
Vertical Stiffness(kN/mm)
Horizontal Stiffness (N/mm)
initial (Feb. 1987) 1058 848 1 year (Jan. 1988) 1080 (+2.1%) 857 (+1.1%) 2 years (Feb. 1989) 1081 (+2.2%) 865 (+2.0%) 4 years (Feb. 1991) 1079 (+2.0%) 879 (+3.7%) 5years (Nov. 1992) 1076 (+1.7%) 886 (+4.5%)
10 years (Mar. 1997) 1096 (+3.6%) 884 (+4.2%) 15 years (Mar. 2002) 1139 (+7.7%) 878 (+3.5%) 20 years (Jan. 2007) 1105 (+4.4%) 915 (+7.9%)
8
CONCLUSIONS
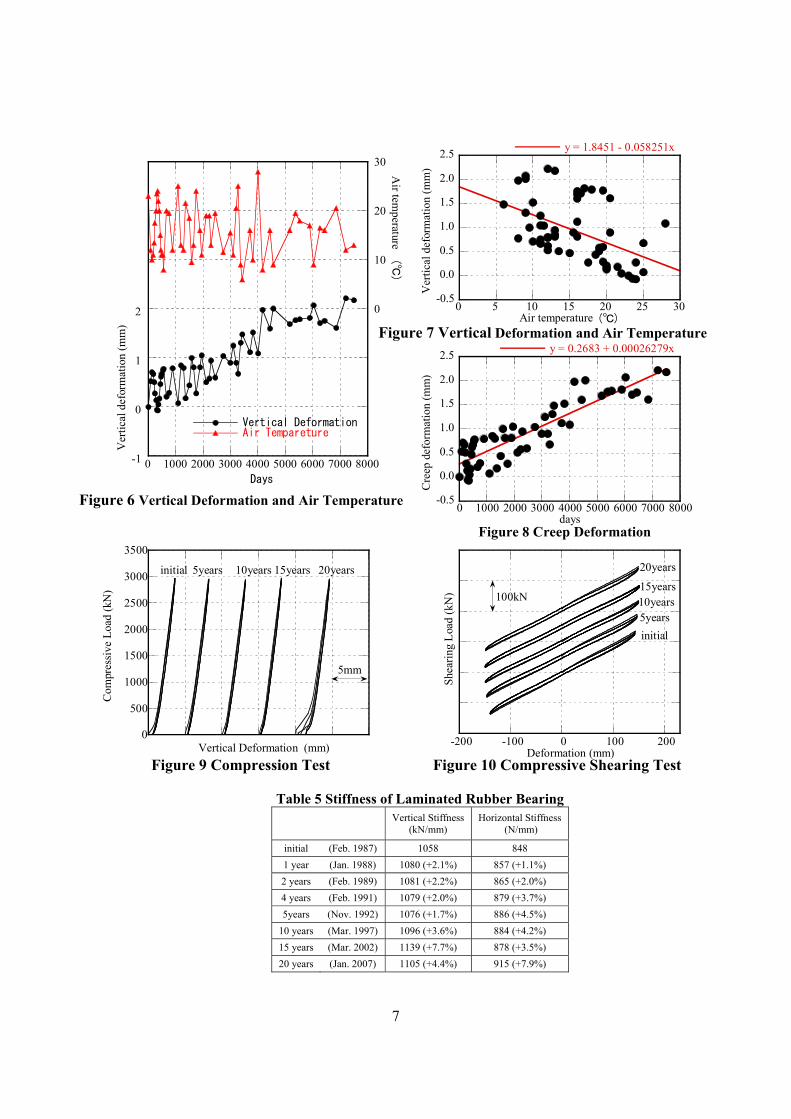
Figure 11 illustrates the relationship between the estimated creep rate (estimated creep / total thickness of rubber layers) for 50 and 100 years into the future, as derived by a linear approximation equation, and the primary shape factor S1. The figure also shows a regression curve derived from the results of experiments conducted on specimens 500X3.75-26, 500X7-14 and 445X4-25 under the conditions of the secondary shape factor 52 ≅S and axial stress of 100-200kg/cm2. As S1 increases, vertical stiffness becomes stronger, and the creep rate decreases. Figure 11 also depicts the estimated creep rate for the next 60 years based on the creep of laminated rubber bearing that was measured for over 10 years in various buildings with base isolation systems (References 2-4, with each reference notated in the figure). Table 8 provides
Table 6 Results of Tensile Test
Hardness (JIS A)
Tensile Stress (MPa) Elongation at break (%)
Tensile Strength (MPa) 100% 200% 300%
initial 42 1.01 2.44 4.86 630 20.20 10 years 40 (-4.8%) 1.00 (-1.0%) 2.53 (3.6%) 5.20 (+6.9%) 585 (-7.1%) 17.85 (-11.7%)
20 years 41 (-2.3%) 1.07 (+5.9%) 2.87 (+17.6%) 5.95 (+22.4%) 559 (-11.2%) 18.60 (-7.9%)
Table 8 Overview of Laminated Rubber Bearing Installed in Seismic Isolated Buildings Refer.
No. Diameter
Rubber thickness
Number of layer
Center hole
S1 S2
Average axial stress
Observation period
Measuring method
Estimated creep* Approximation method
[2] 740mm 4.4mm 61 150mm 33.5 2.8 50 kg/cm2
About 11 and half years
micrometer 5.88mm (2.2%)
Linear About 2 and
half years
Laser displacement
transducer 3.94mm (1.5%)
[4] 670 6 23 50 25.8 4.86 56.5 About 20 years
- 4.11mm (3.0%) Dual
logarithms [3] 500 7 14 - 17.9 5.1 45 Dial gauge 5.04mm (5.1%) Linear
*Estimated creep value after 60 years,( ) inside a creep rate S1:Primary shape factor,S2:Secondary shape factor
Figure 11 Relationship between Estimated Creep Rate and Primary Shape Factor
5
10
15
20
10 20 30 40 50
50 years after100 years after
Estim
ated
cre
ep ra
te (%
)
Primary shape factor
500X7-14
500X3.75-26
445X4-25
0
[4]
Refer. No.[3] [2]
S1
Table 7 Results of Shearing Test Shearing Srain (%)
initial 527 10 years 533 (+1.1%)
20 years 480 (-8.9%)
9
an overview of the types of laminated rubber bearing used in these buildings. Observations of these buildings show values below the regression curve, especially as S1 decreases. This is probably because the average axial stress used in these reports was about 50kg/cm2, somewhat lower than the compressive stress used in the present study; at the same time, there were also differences in the observation periods and accuracy of estimation formulas. Nonetheless, just like the present study, the creep rate was lower in the specimens with higher S1, regardless of the axial stress. This indicates that axial stress, within a certain range, has almost no relation with creep, which can be determined instead by S1. Creep Test
Using 3 types of laminated natural rubber bearings with a secondary shape factor 52 ≅S and a different primary shape factor (S1), creep tests were conducted for about 15 years and provided the following results: 1) It was apparent that creep values decreased as the primary shape factor S1 increased. With
specimen 500X3.75-26 of 331 ≅S , even the maximum estimated value for the creep rate after 100 years of use was only about 3%.
2) When axial stress was within a range of 100-200kg/cm2, it showed almost no relationship with the creep rate, which instead tended to be dependent on S1.
3) The effect of different physical properties of rubber on the state of creep, as well as the methods used for estimating future creep, should be further investigated.
Inspection of laminated Rubber Bearing installed in the Building Little obvious change was recognized for fundamental characteristics of the laminated rubber bearings, mechanical characteristics of inner rubber. Also it was found that creep deformation of the laminated rubber bearing was a little and it could be predicted. We will need to make observations over a much longer period to clarify the ageing effect.
REFERENCES
[1]Morita, K. et al. 2000. Long term tests for creep of laminated rubber bearings. 12th World Conference on Earthquake Engineering:1838/6/A
[2]Nakamura, I. et al. 1998. Ageing characteristics of natural rubber bearings in actual base-isolated building. Journal of architecture and building science. 113(1429), Architectural Institute of Japan:23-26.
[3]Yasui, K. et al. 2007. Aged Deterioration of Natural Rubber Bearing. Okumura Technical Research Report. (33):71-76.
[4]Hamaguchi, H. et al. 2009. A study of ageing effect on a rubber bearing after about 20 years in use. AIJ Journal of Technology and Design. 15(30), Architectural Institute of Japan:393-398.
[5]Architectural Institute of Japan 1993. Recommendation for the Design of Base Isolated Buildings.