long beach unified school district budget update february 6, 2012
TRANSCRIPT

Long Beach UnifiedSchool District
Budget UpdateFebruary 6, 2012

2
Governor’s Proposal – The Good News
• California Economy Shows Signs of Recovery
• More Flexibility Options to Local Schools
• Possibility of Less Cuts to K-12 Education than Rest of State Budget

3
Governor’s Proposal – The Bad News
• Still More Cuts to Schools, Even if November Initiative Passes
• Cash Flow Continues to be a Problem
• Possibility of Steep Cuts to K-12 Education

4
Governor’s Proposal - COLA
•No funded COLA–COLA was budgeted at 3.1%
–Results in $12.8M reduction in budgeted revenue for 2012-13

5
Governor’s Proposal - Transportation
•Elimination of Transportation Funding–50% of transportation funds ($3.3M) were eliminated in 2011-12 “trigger” cuts. SB81 may redirect cut to revenue limits.
–Remainder of transportation funds eliminated in 2012-13.

6
Governor’s Proposal – T.K.
•Funding for Transitional Kindergarten eliminated (Dept of Finance interpretation of Governor’s Proposal)
–Still moves the eligibility date for Kindergarten to November 1.
–Saves the state $223M, since 40,000 fewer students will enter Kindergarten in 2012-13

7
Governor’s Proposal – Funding Model
•Weighted funding model–Provides more funding for districts with higher proportion of EL students and economically disadvantaged students.
–Combines revenue limit and most categoricals into one funding source.
–To be phased in over a 5-year period.

8
Possible Effect of Weighted Formula Funding on LBUSD
24.7% 23.7% 23.1% 23.3%
24.2% 23.7%
16.9%
50.2% 52.6% 55.0% 55.7%
67.0% 68.2% 67.9% 69.7%
24.7%
0%
25%
50%
75%
100%
2007-08 2008-09 2009-10 2010-11
Free and Reduced Lunch Enrollment
English Learners
LBUSD
California
California
LBUSD

9
Governor’s Proposal – Mandates
•Significant Mandate Reform–Eliminates about half of current mandates.
–Remaining mandates would be optional, but funding provided on a block grant basis if districts comply.

10
Governor’s Proposal – Initiative
•Education is hit hard if November initiative Fails–Reduction in revenue limit of approx $370/ADA (about $30M to LBUSD).
–Equates to reduction of 3 weeks of school.
11
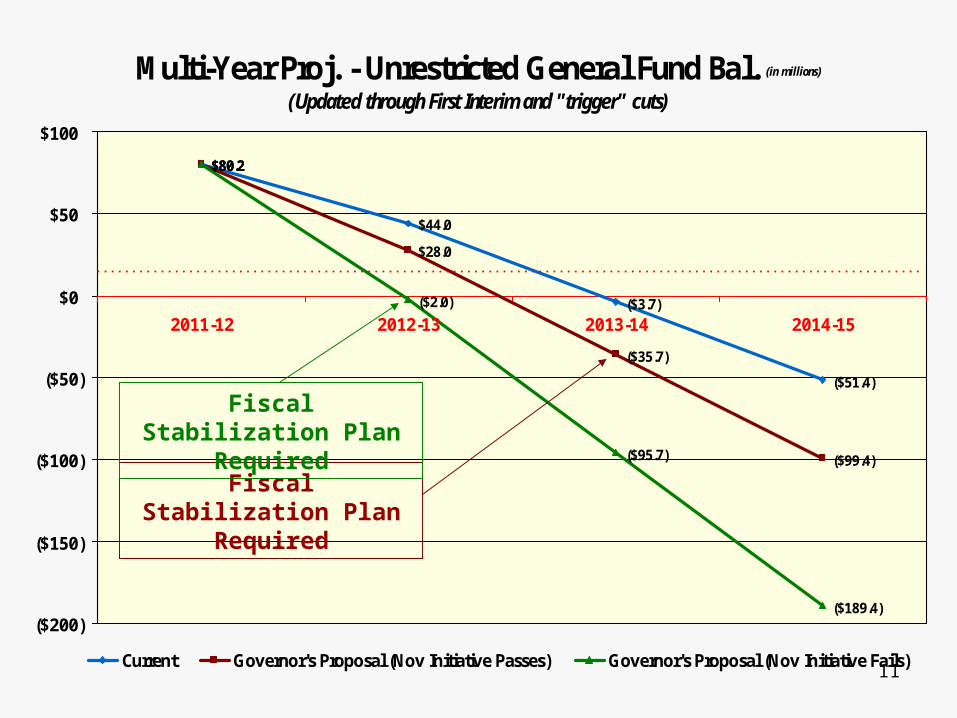
Multi-Year Proj. - Unrestricted General Fund Bal. (in millions)
(Updated through First Interim and "trigger" cuts)
$80.2
$44.0
($3.7)
($51.4)
$28.0
($35.7)
($99.4)
$80.2
($2.0)
($95.7)
($189.4)
$80.2
($200)
($150)
($100)
($50)
$0
$50
$100
2011-12 2012-13 2013-14 2014-15
Current Governor's Proposal (Nov Initiative Passes) Governor's Proposal (Nov Initiative Fails)
Minimum Reserve - 2%
Fiscal Stabilization Plan Required
Fiscal Stabilization Plan Required
12
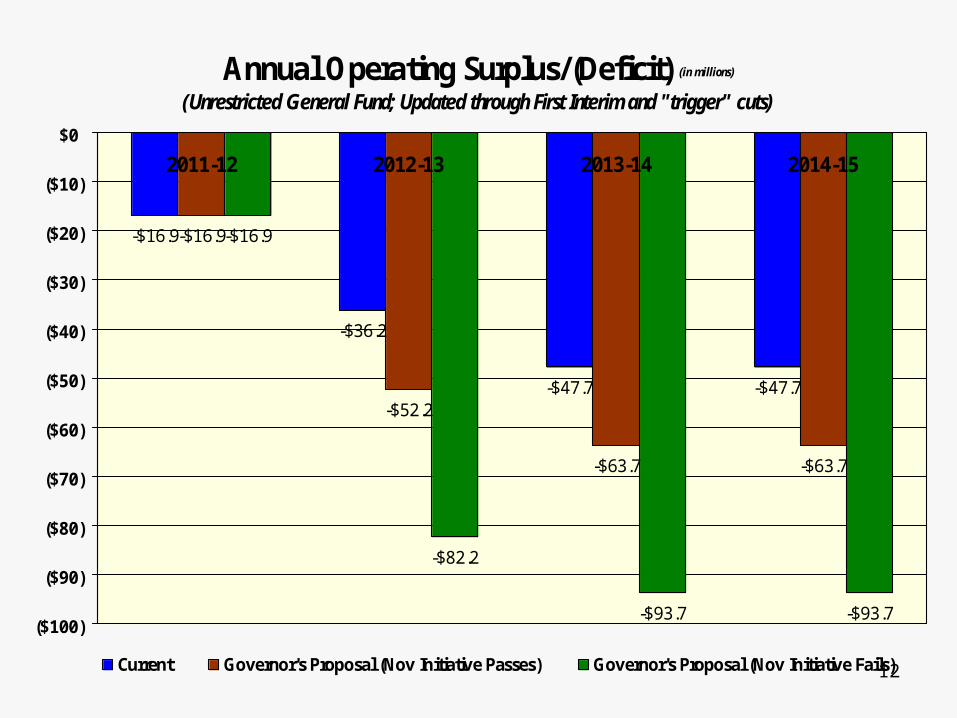
Annual Operating Surplus/(Deficit) (in millions)
(Unrestricted General Fund; Updated through First Interim and "trigger" cuts)
-$16.9
-$36.2
-$47.7 -$47.7
-$16.9
-$52.2
-$63.7 -$63.7
-$16.9
-$82.2
-$93.7 -$93.7($100)
($90)
($80)
($70)
($60)
($50)
($40)
($30)
($20)
($10)
$0
2011-12 2012-13 2013-14 2014-15
Current Governor's Proposal (Nov Initiative Passes) Governor's Proposal (Nov Initiative Fails)

13
Effect of Stimulus Fund on Total General Fund Bal. (in millions)
$90.8
$99.9
$109.9
$93.3
$36.6
$18.4
($15.1)
$59.1
($50)
($25)
$0
$25
$50
$75
$100
$125
$150
2008-09 2009-10 2010-11 2011-12 (Budget)
Fund Balance - with Stimulus Funds Fund Balance - excluding Stimulus Funds
Minimum Reserve - 2%
$108.4
Stimulus Funds Received in Last 4 Years

14
Effect of Stimulus Fund on Total General Fund Operating Budget (in millions)
$776.6
$692.0
$751.1
$708.7
$786.3
$707.3$712.9
$697.3$703.8
$806.9
$600
$650
$700
$750
$800
$850
2007-08 2008-09 2009-10 2010-11 2011-12 (Budget)
Revenues Expenditures, Transfers, Other

15
Effect of Stimulus Fund on Total General Fund Operating Budget (in millions)
$697.3$708.7
$786.3
$679.1 $675.1
$703.8
$751.1
$806.9
$681.3
$744.8
$600
$650
$700
$750
$800
$850
2007-08 2008-09 2009-10 2010-11 2011-12 (Budget)
Revenues Expenditures, Transfers, Other Revenues w/o Stimulus Funds

16
Effect of Stimulus Funds on Annual Operating Surplus/(Deficit) (in millions)
$25.5
$9.1 $10.0
-$14.8
-$6.3
-$22.5
-$18.2
-$31.7
($40)
($30)
($20)
($10)
$0
$10
$20
$30
2008-09 2009-10 2010-11 2011-12
Including Stimulus Funds Excluding Stimulus Funds
$31.7
$31.6
$28.2
$16.9

17
Cash Flow - Deferrals
•State continues to defer a significant portion of our apportionment
•Will require TRAN to meet our cash flow needs late in this fiscal year

18
July Aug Sept Oct Nov Dec Jan Feb Mar April May June July Aug Sept
OWED 5.0% 5.0% 9.0% 9.0% 9.0% 9.0% 9.0% 9.0% 9.0% 9.0% 9.0% 9.0%
PAID
DEFERRED
DEFERRAL PAID
DeferralsCurrent Fiscal Year
Following Fiscal Year

19
July Aug Sept Oct Nov Dec Jan Feb Mar April May June July Aug Sept
OWED 5.0% 5.0% 9.0% 9.0% 9.0% 9.0% 9.0% 9.0% 9.0% 9.0% 9.0% 9.0%
PAID 9.0% 9.0% 9.0% 9.0% 0.5% 1.1% 1.5%
DEFERRED 5.0% 5.0% 9.0% 8.5% 9.0% 7.9% 7.5% 9.0%
DEFERRAL PAID
2.8% 2.2% 3.5% 8.5%
5.0% 5.5%
9.0% 1.8% 6.1%
3.3% 4.2%
9.0%
DeferralsCurrent Fiscal Year
38.4% of State Payments are Deferred Until the Following Fiscal Year

20
July Aug Sept Oct Nov Dec Jan Feb Mar April May June July Aug Sept
OWED 5.0% 5.0% 9.0% 9.0% 9.0% 9.0% 9.0% 9.0% 9.0% 9.0% 9.0% 9.0%
PAID 9.0% 9.0% 9.0% 9.0% 0.5% 1.1% 1.5%
DEFERRED 5.0% 5.0% 9.0% 8.5% 9.0% 7.9% 7.5% 9.0%
DEFERRAL PAID
2.8% 2.2% 3.5% 8.5%
5.0% 5.5%
9.0% 1.8% 6.1%
3.3% 4.2%
9.0%
DeferralsCurrent Fiscal Year
38.4% of State Payments are Deferred Until the Following Fiscal Year

21
OTHER FUNDS
•Head Start
•CDC

22
MAJOR BUDGET ISSUES
• Triggers seem to be a “new way of doing business” with State Budget
• End of One-time Funding
• Structural Deficit Remains