logistics performance index: what do indicators tell us? virginia tanase sr. transport specialist...
TRANSCRIPT
Logistics Performance Index: what do indicators tell us?
Virginia TanaseSr. Transport Specialist
Transport, Water and Information and Communication Technology DepartmentThe World Bank
6th IRU Euro-Asian Road Transport ConferenceTbilisi, Georgia
16-17 June 2011
This presentation
4. Key topics ahead4. Key topics ahead
1. LPI 20101. LPI 2010
2. LPI Data for selected countries2. LPI Data for selected countries
5. Want to learn more?5. Want to learn more?
3. Transport considerations3. Transport considerations
1. LPI 20101. LPI 2010
4 4
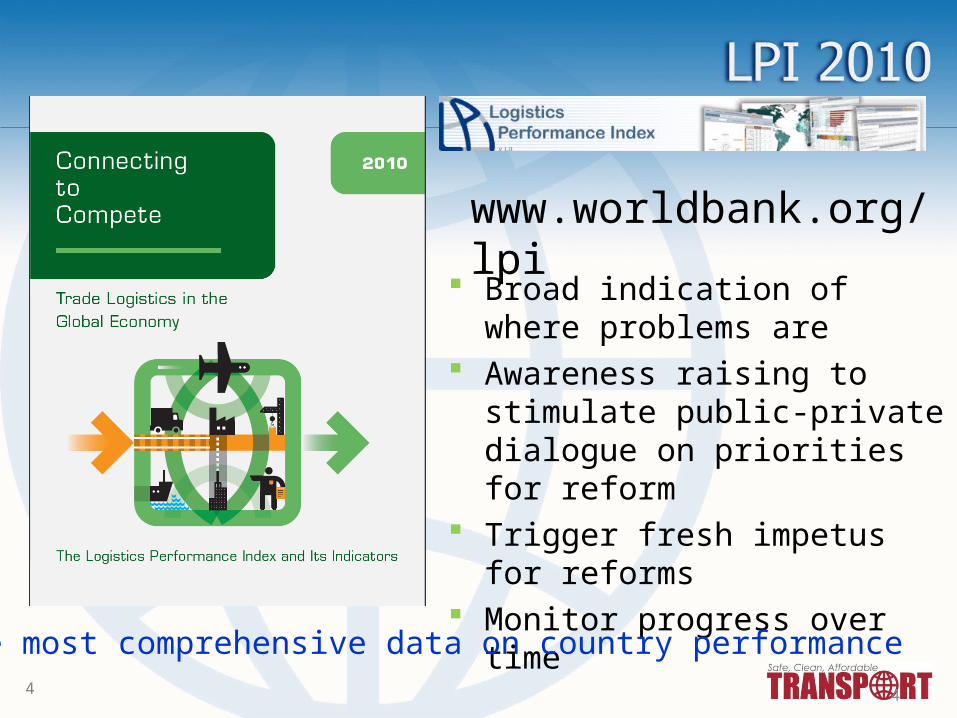
www.worldbank.org/lpi
Broad indication of where problems are
Awareness raising to stimulate public-private dialogue on priorities for reform
Trigger fresh impetus for reforms Monitor progress over time
The most comprehensive data on country performance

5
The six dimensions of country performance measured by the LPI Efficiency of the clearance processQuality of trade and transport infrastructureEase of arranging competitively priced shipmentsLogistics competence and quality of logistics servicesAbility to track and trace consignmentsTimeliness of shipment delivery

Country A
Country 1
Country 2
Country 4
Country 3
Country 5
Country 6
Country 8
Country 7
Where is LPI originating from?
6
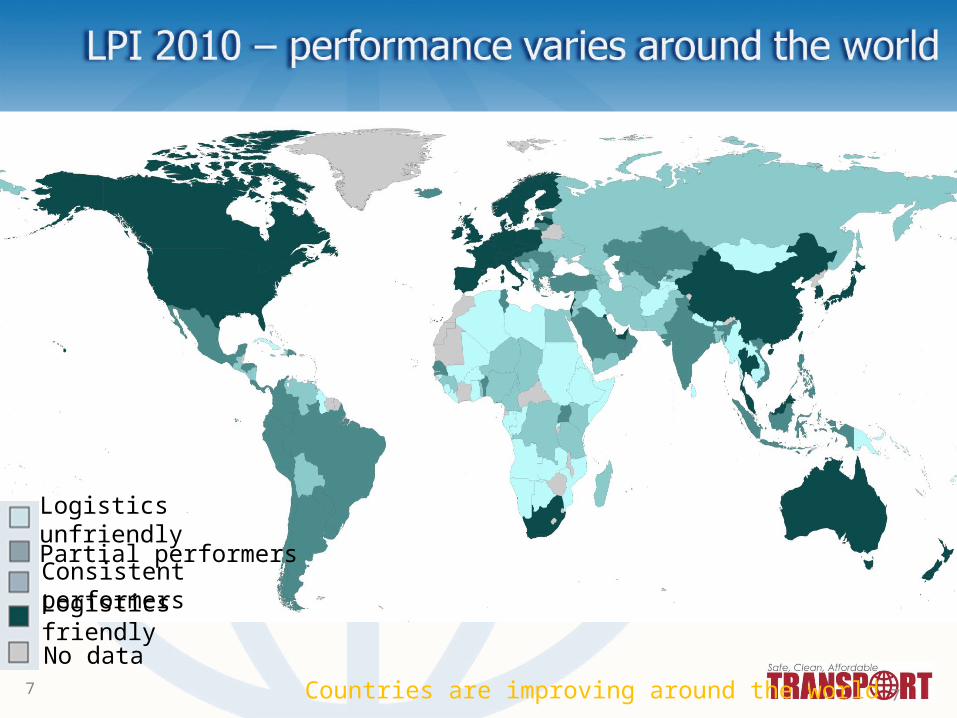
7 Countries are improving around the world
No data
Logistics friendly
Logistics unfriendlyPartial performersConsistent performers
7
Country LPI Rank
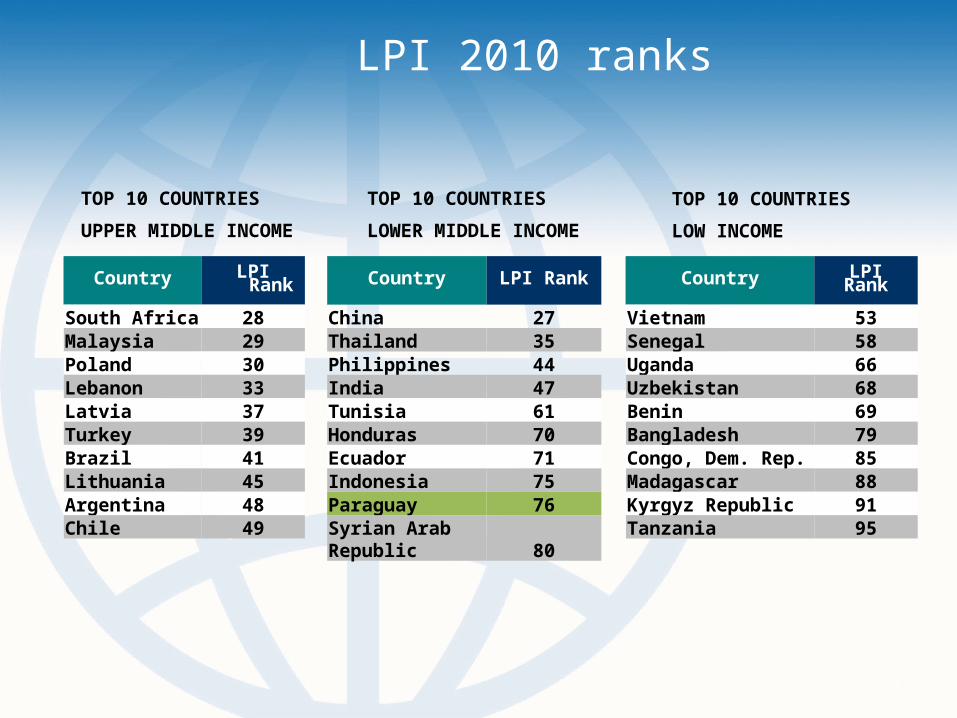
South Africa 28Malaysia 29Poland 30Lebanon 33Latvia 37Turkey 39Brazil 41Lithuania 45Argentina 48Chile 49
TOP 10 COUNTRIES
LOWER MIDDLE INCOME
Country LPI Rank
China 27Thailand 35Philippines 44India 47Tunisia 61Honduras 70Ecuador 71Indonesia 75Paraguay 76Syrian Arab Republic 80
TOP 10 COUNTRIES
LOW INCOME
Country LPI Rank
Vietnam 53Senegal 58Uganda 66Uzbekistan 68Benin 69Bangladesh 79Congo, Dem. Rep. 85Madagascar 88Kyrgyz Republic 91Tanzania 95
TOP 10 COUNTRIES
UPPER MIDDLE INCOME
LPI 2010 ranks
8
9
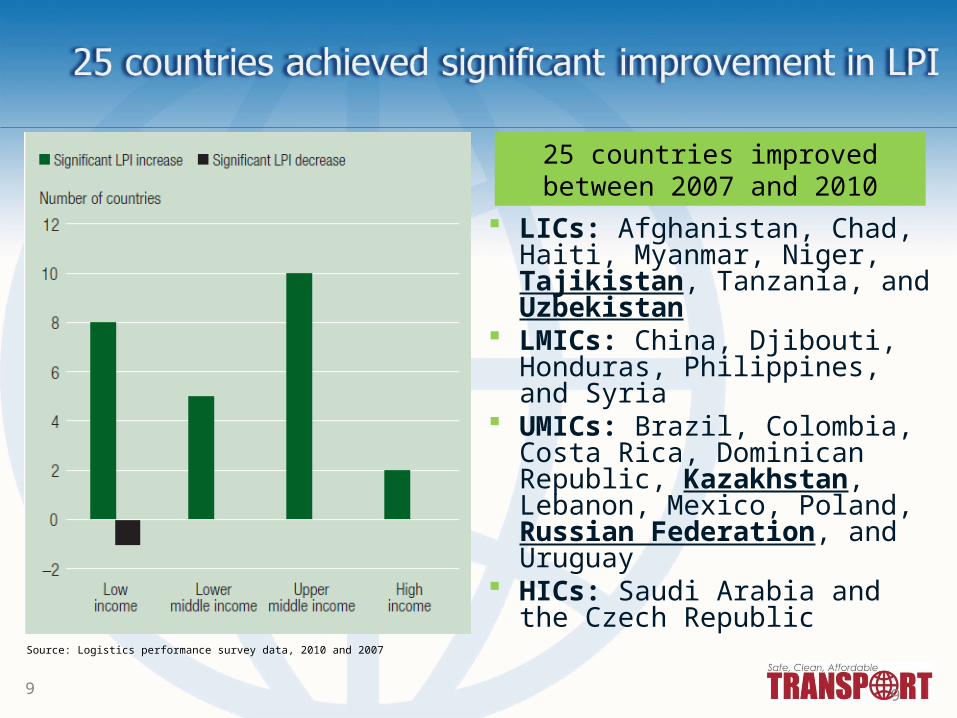
LICs: Afghanistan, Chad, Haiti, Myanmar, Niger, Tajikistan, Tanzania, and Uzbekistan
LMICs: China, Djibouti, Honduras, Philippines, and Syria
UMICs: Brazil, Colombia, Costa Rica, Dominican Republic, Kazakhstan, Lebanon, Mexico, Poland, Russian Federation, and Uruguay
HICs: Saudi Arabia and the Czech Republic
Source: Logistics performance survey data, 2010 and 2007
25 countries improved between 2007 and 2010
9
10
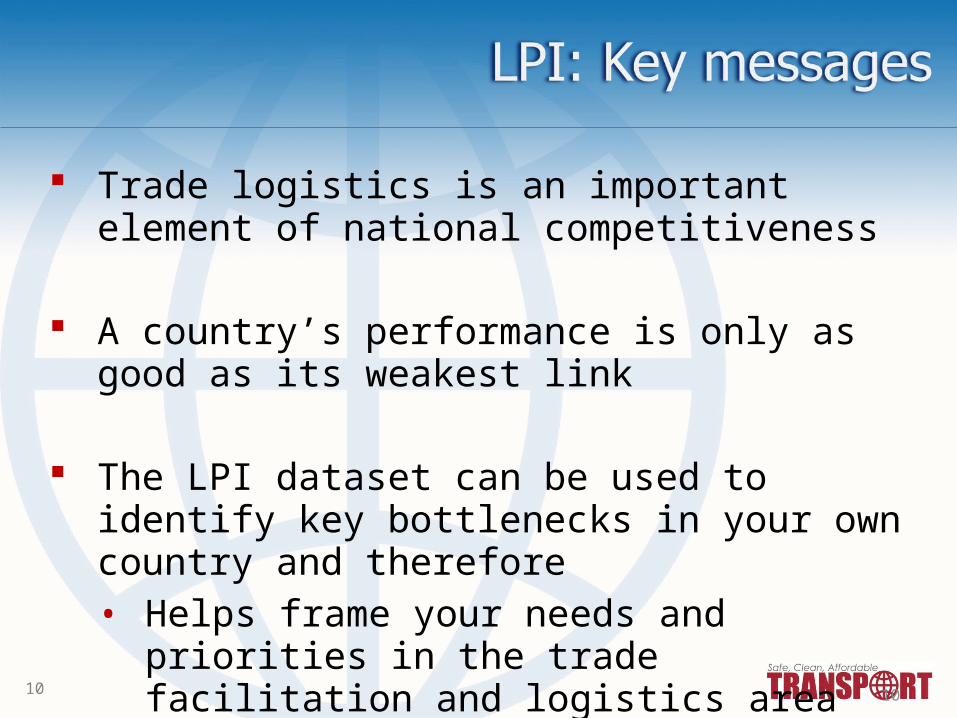
Trade logistics is an important element of national competitiveness
A country’s performance is only as good as its weakest link
The LPI dataset can be used to identify key bottlenecks in your own country and therefore• Helps frame your needs and priorities in the trade
facilitation and logistics area reform
10
11
2. LPI Data – selected countries2. LPI Data – selected countries
14
40
45
50
55
60
65
70
75
Kaza
khst
an (6
2)
Uzb
ekis
tan
(68)
Aze
rbai
jan
(89)
Kyrg
yz R
epub
lic (9
1)
Geo
rgia
* (9
3)
Russ
ian
Fede
ratio
n (9
4)
Ukr
aine
(102
)
Mol
dova
(104
)
Arm
enia
(111
)
Turk
men
ista
n (1
14)
Tajik
ista
n (1
31)
% H
ighe
st P
erfo
rmer
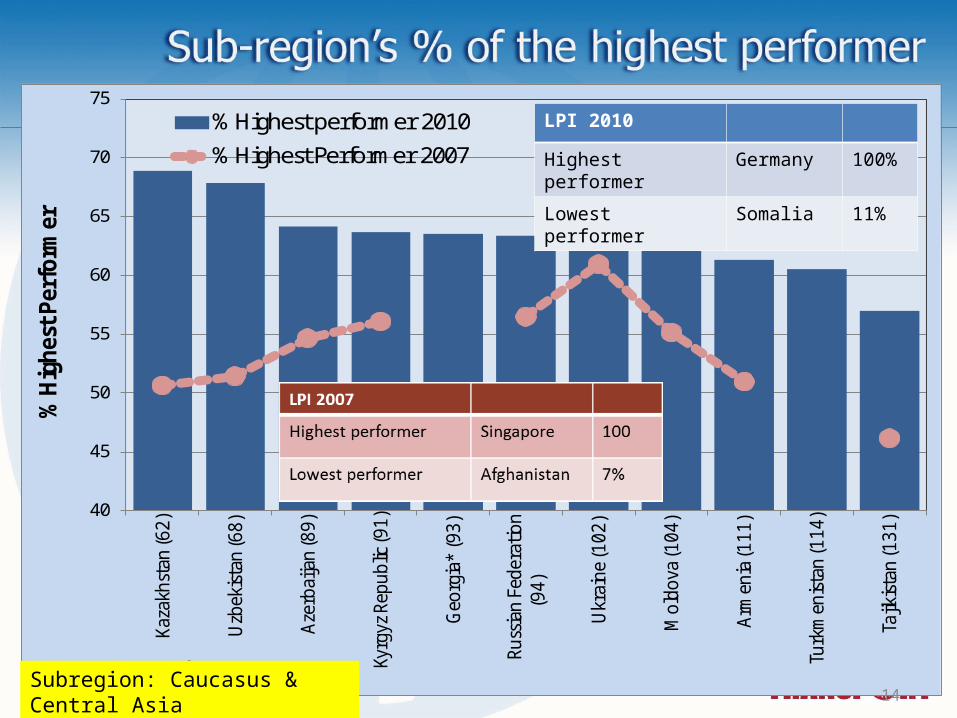
CIS Country (Rank LPI 2010)
% Highest performer 2010% Highest Performer 2007
14
LPI 2010
Highest performer Germany 100%
Lowest performer Somalia 11%
Subregion: Caucasus & Central Asia
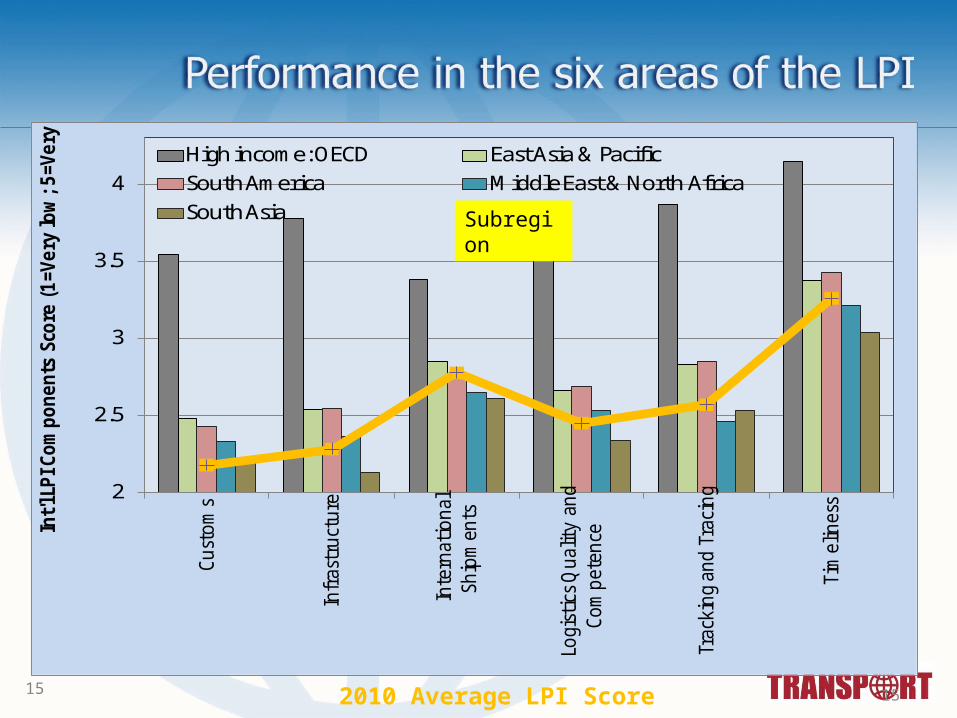
15 152010 Average LPI Score
2
2.5
3
3.5
4C
ust
om
s
Infr
astr
uct
ure
Inte
rnati
on
al
Ship
men
ts
Logi
stics
Qu
alit
y an
d
Co
mp
eten
ce
Trac
king
an
d T
raci
ng
Tim
elin
ess
Int'
l LPI
Com
po
ne
nts
Sco
re (
1=V
ery
low
; 5
=Ve
ry h
igh
)
High income: OECD East Asia & PacificSouth America Middle East & North AfricaSouth Asia CISSubregion
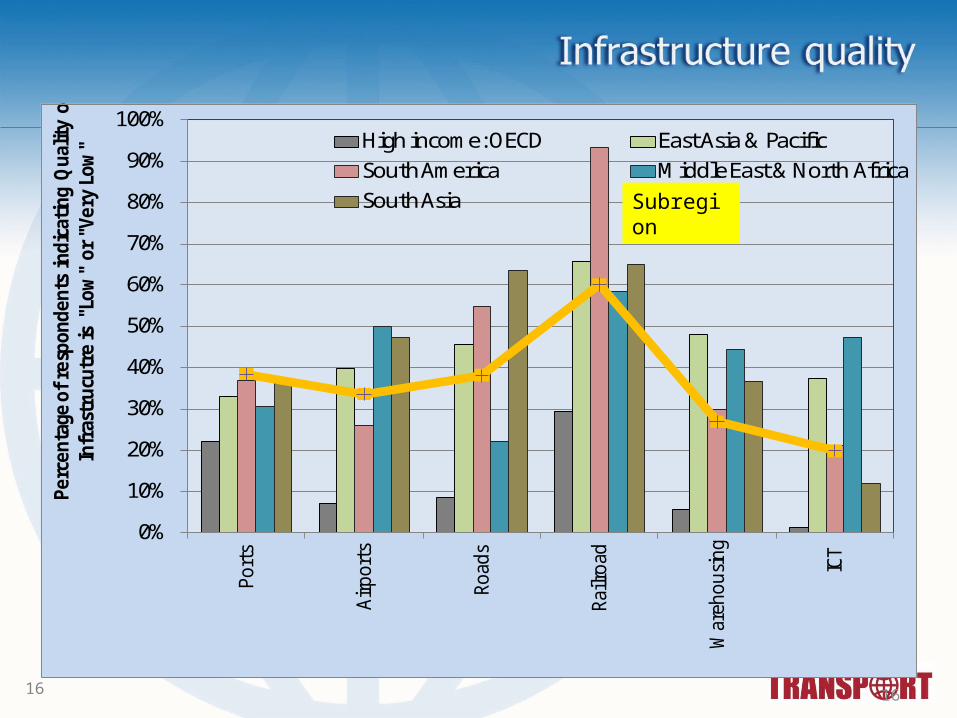
16 16
0%
10%
20%
30%
40%
50%
60%
70%
80%
90%
100%
Port
s
Air
port
s
Road
s
Railr
oad
War
ehou
sing
ICT
Perc
enta
ge o
f re
spon
dent
s in
dica
ting
Qua
lity
of
Infr
astr
ucut
re is
"Lo
w"
or "
Very
Low
" High income: OECD East Asia & PacificSouth America Middle East & North AfricaSouth Asia CISSubregion
17
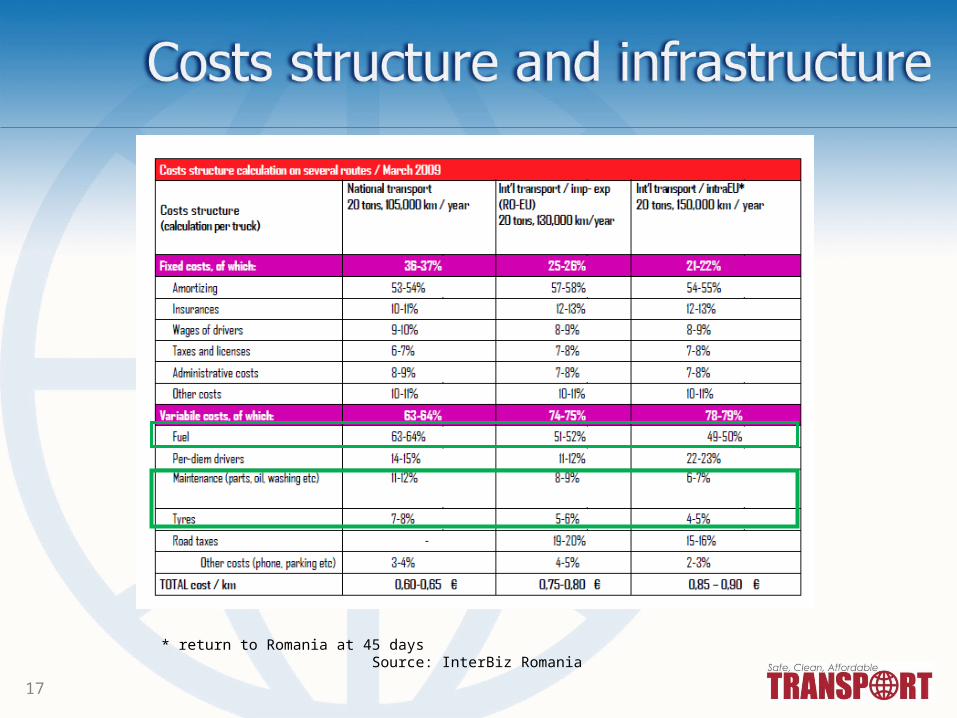
* return to Romania at 45 days Source: InterBiz Romania

18 18
TRANSPORT SERVICES
0%
10%
20%
30%
40%
50%
60%
70%
80%
90%
100%
Wat
er Air
Ro
ad
Rai
lroa
d
Pe
rce
nta
ge o
f re
spo
nd
en
ts i
nd
icati
ng
Qu
alit
y o
f Se
rvic
es
(T
ran
spo
rt)
is "
Low
" o
r "V
ery
Lo
w"
High income: OECD East Asia & PacificSouth America Middle East & North AfricaSouth Asia CISSubregion

19 19
0%
10%
20%
30%
40%
50%
60%
70%
War
ehou
sing
Frei
gh F
wd.
Cust
oms
Stan
dard
s
SPS/
Hea
lth
Cust
oms
Brok
ers
T&T
Ass
ocia
tion
s
Ship
pers
Perc
enta
ge o
f re
spon
dent
s in
dica
ting
Qua
lity
of S
ervi
ces
is "
Low
" or
"Ve
ry L
ow"
High income: OECD East Asia & PacificSouth America Middle East & North AfricaSouth Asia CISSubregion
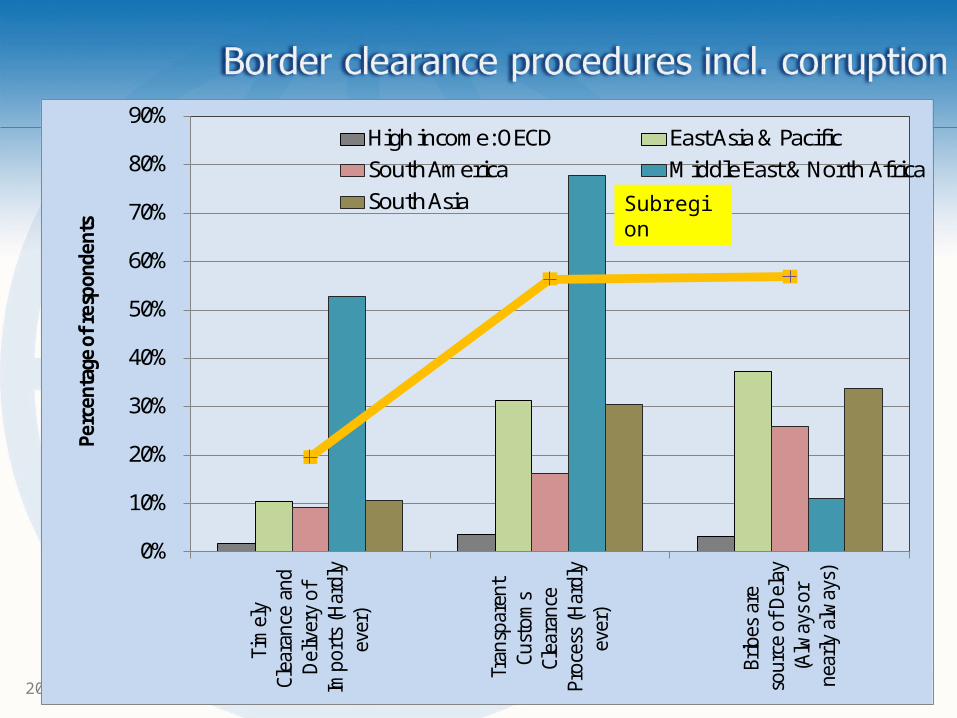
20 20
0%
10%
20%
30%
40%
50%
60%
70%
80%
90%
Tim
ely
Clea
ranc
e an
d D
eliv
ery
of
Impo
rts
(Har
dly
ever
)
Tran
spar
ent
Cust
oms
Clea
ranc
e Pr
oces
s (H
ardl
y ev
er)
Brib
es a
re
sour
ce o
f D
elay
(A
lway
s or
ne
arly
alw
ays)
Perc
enta
ge o
f re
spon
dent
s
High income: OECD East Asia & PacificSouth America Middle East & North AfricaSouth Asia CISSubregion
3. Transport considerations3. Transport considerations
22 22
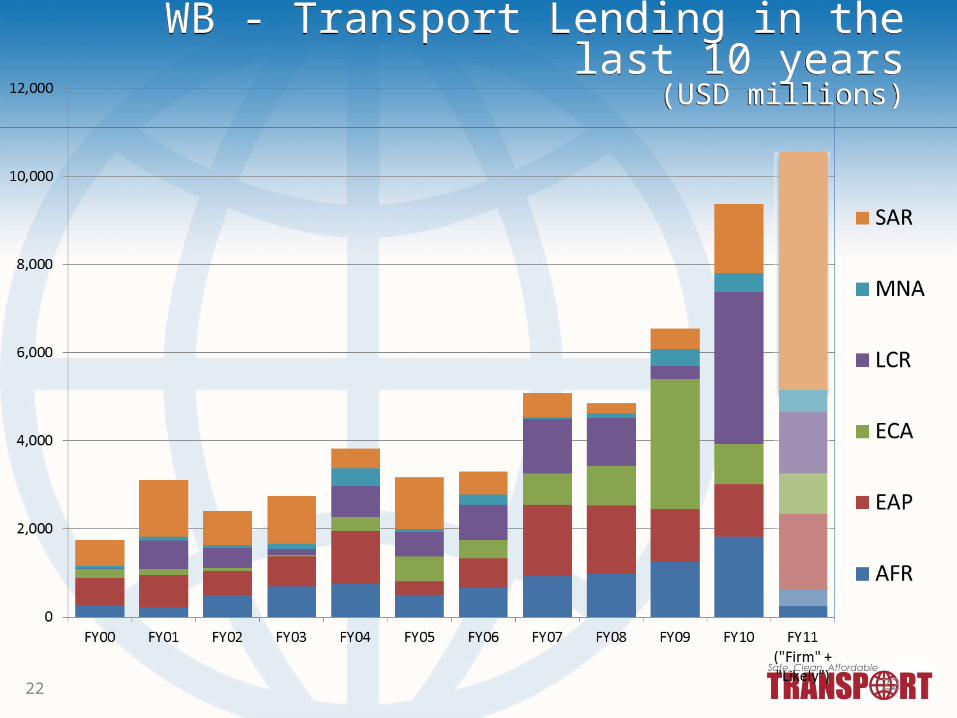
WB - Transport Lending in the last 10 years
(USD millions)
WB - Transport Lending in the last 10 years
(USD millions)
23 23
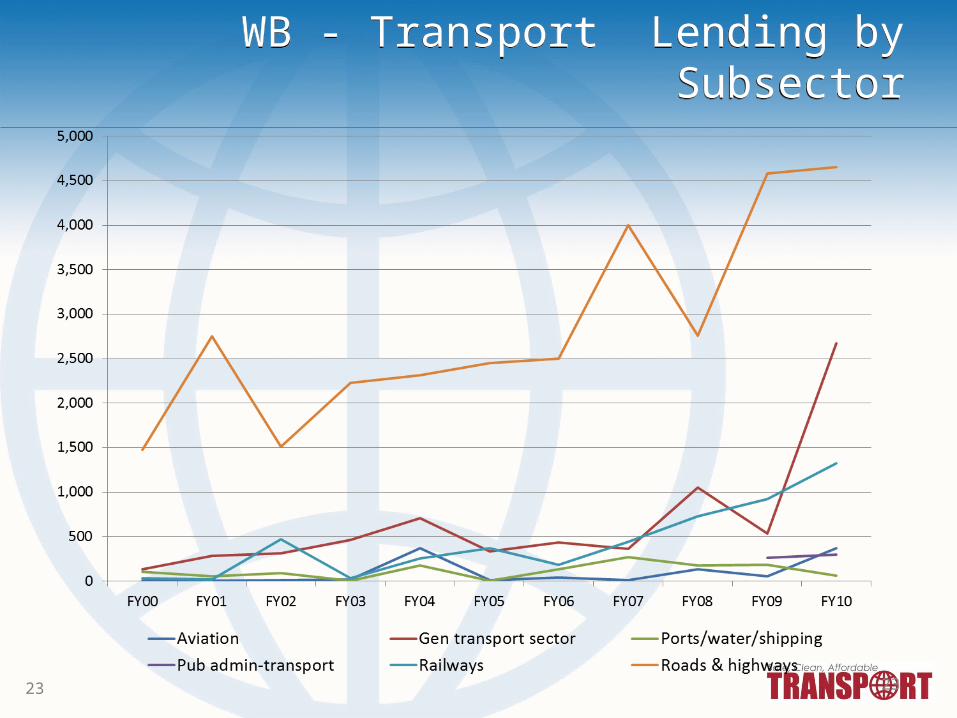
WB - Transport Lending by SubsectorWB - Transport Lending by Subsector
24 24
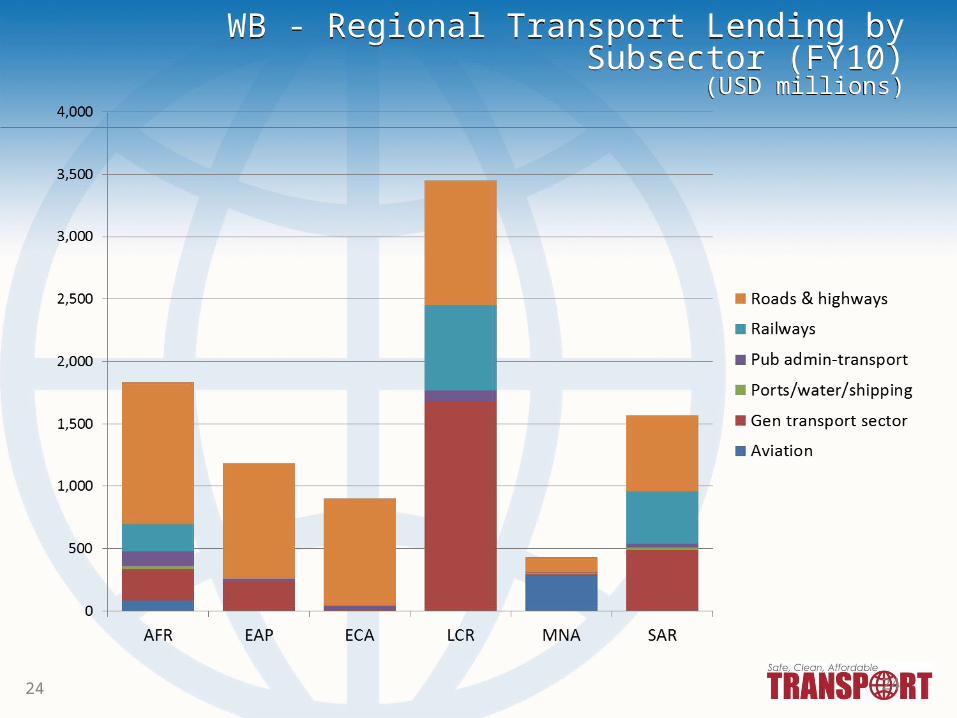
WB - Regional Transport Lending by Subsector (FY10)
(USD millions)
WB - Regional Transport Lending by Subsector (FY10)
(USD millions)
25 25
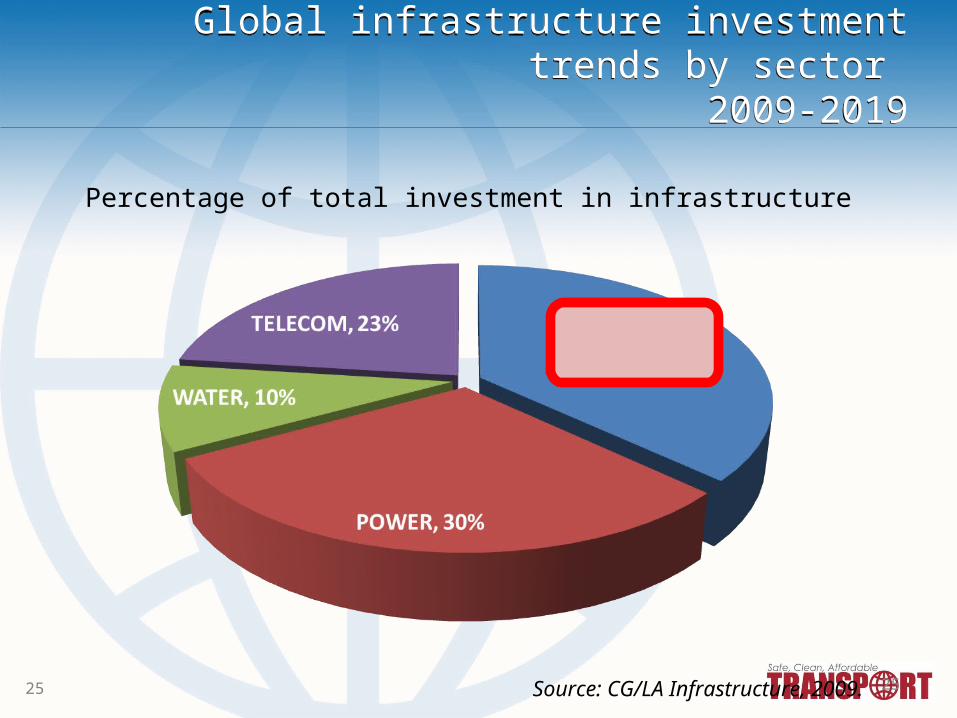
Global infrastructure investment trends by sector
2009-2019
Global infrastructure investment trends by sector
2009-2019
Percentage of total investment in infrastructure
Source: CG/LA Infrastructure, 2009.
26 26
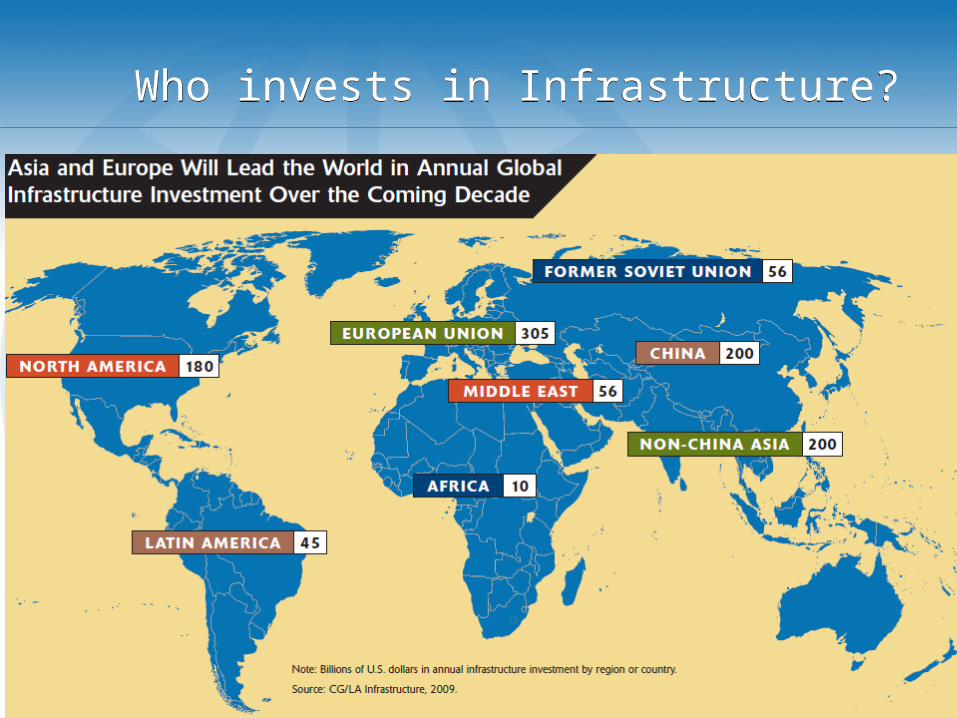
Who invests in Infrastructure?Who invests in Infrastructure?
27
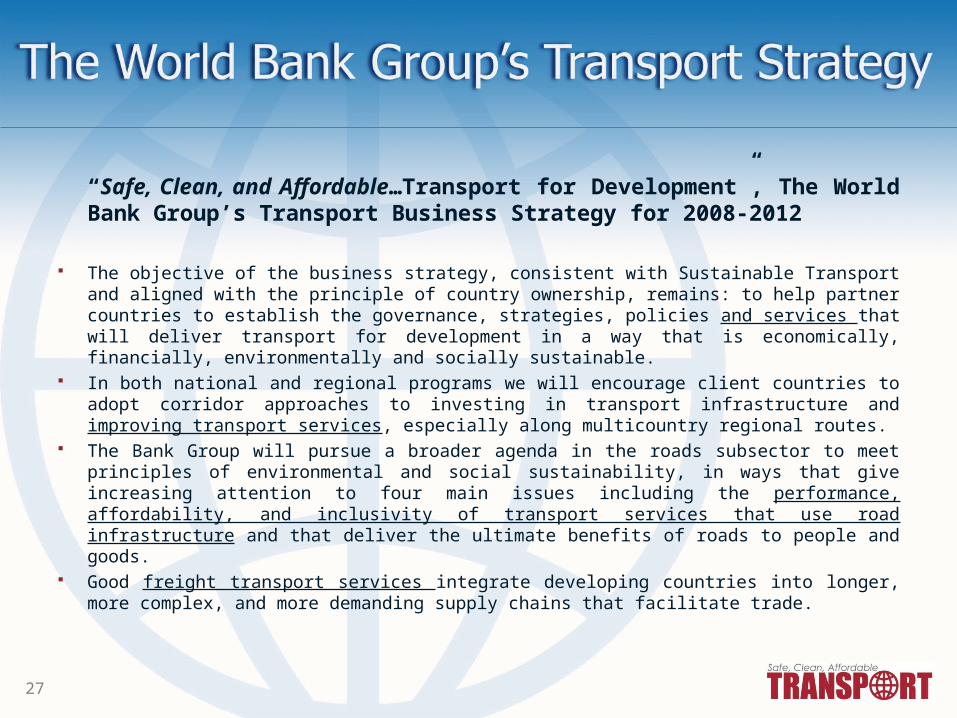
“Safe, Clean, and Affordable…Transport for Development”, The World Bank Group’s Transport Business Strategy for 2008-2012
The objective of the business strategy, consistent with Sustainable Transport and aligned with the principle of country ownership, remains: to help partner countries to establish the governance, strategies, policies and services that will deliver transport for development in a way that is economically, financially, environmentally and socially sustainable.
In both national and regional programs we will encourage client countries to adopt corridor approaches to investing in transport infrastructure and improving transport services, especially along multicountry regional routes.
The Bank Group will pursue a broader agenda in the roads subsector to meet principles of environmental and social sustainability, in ways that give increasing attention to four main issues including the performance, affordability, and inclusivity of transport services that use road infrastructure and that deliver the ultimate benefits of roads to people and goods.
Good freight transport services integrate developing countries into longer, more complex, and more demanding supply chains that facilitate trade.

4. Key topics ahead4. Key topics ahead
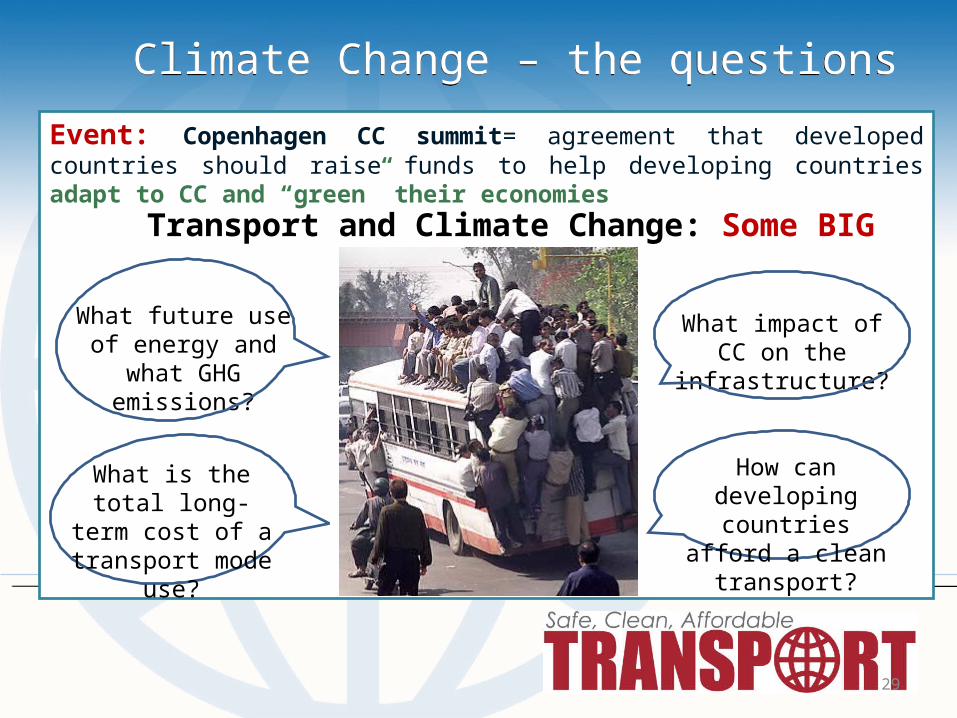
Climate Change – the questions Climate Change – the questions
Event: Copenhagen CC summit= agreement that developed countries should raise funds to help developing countries adapt to CC and “green” their economies
29
What future use of energy and what GHG emissions?
What impact of CC on the
infrastructure?
What is the total long-term cost of a
transport mode use?
How can developing
countries afford a clean transport?
Transport and Climate Change: Some BIG Questions
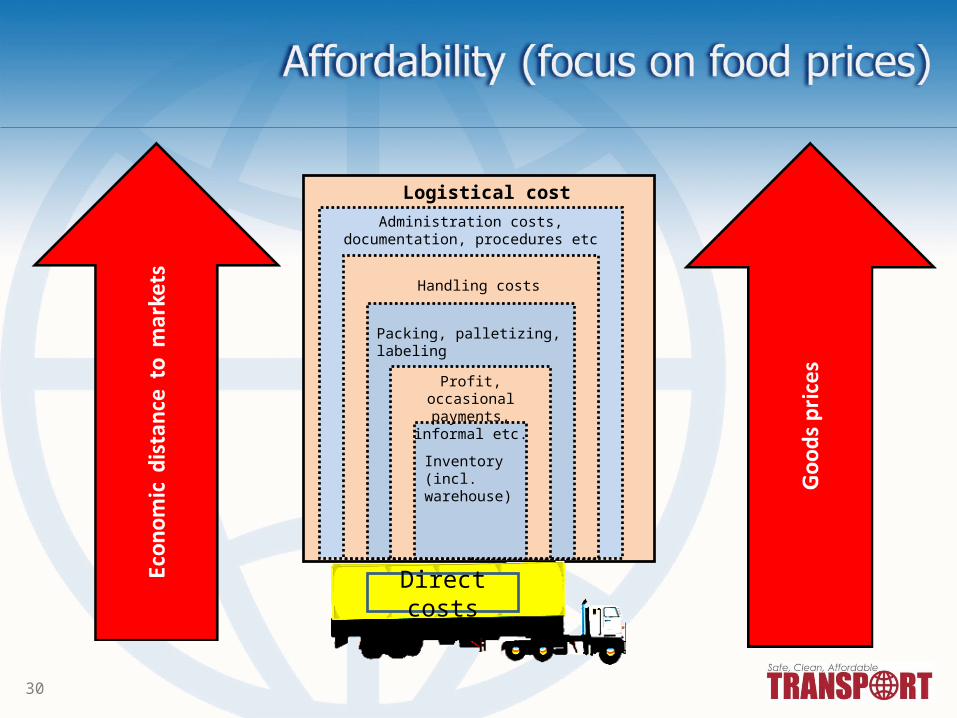
30
Profit, occasional payments, informal
etc.
Packing, palletizing, labeling
Handling costs
Administration costs, documentation, procedures etc
Logistical cost
Inventory (incl. warehouse)
Direct costs
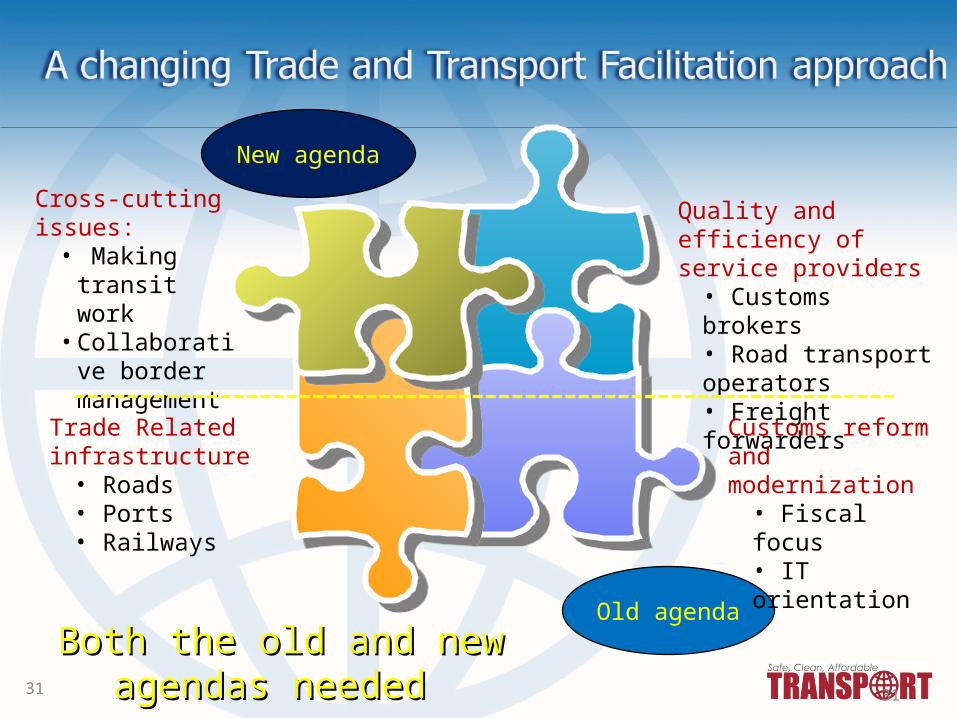
31
Cross-cutting issues:
• Making transit work
• Collaborative border management
Quality and efficiency of service providers
• Customs brokers• Road transport operators• Freight forwarders
Trade Related infrastructure
• Roads• Ports• Railways
Old agenda
New agenda
Customs reform and modernization
• Fiscal focus• IT orientation
Both the old and new agendas Both the old and new agendas needed needed 31
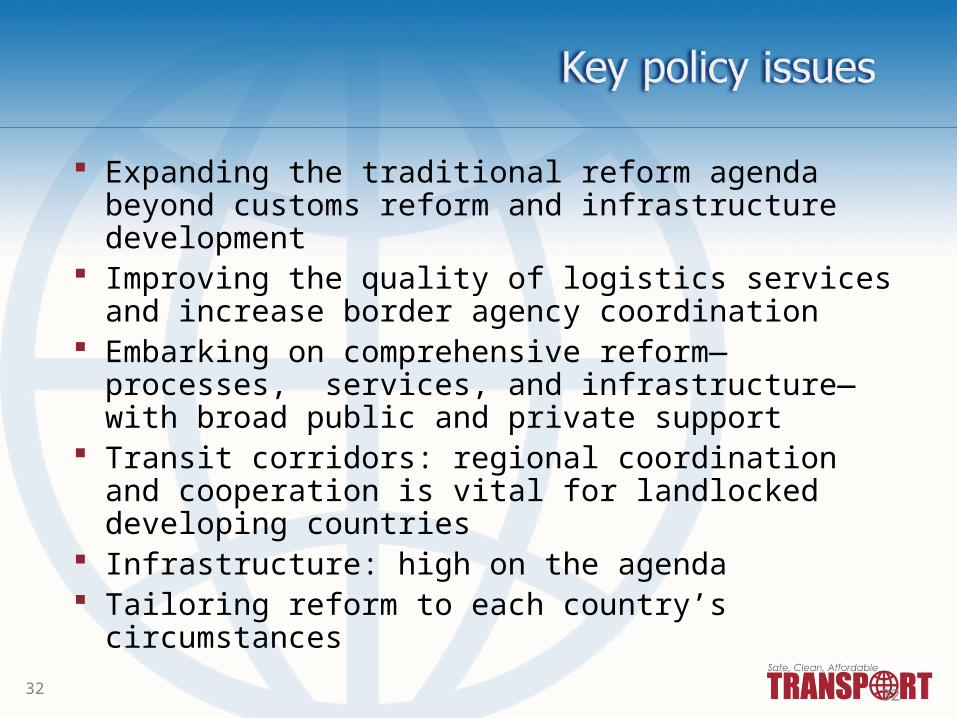
32
Expanding the traditional reform agenda beyond customs reform and infrastructure development
Improving the quality of logistics services and increase border agency coordination
Embarking on comprehensive reform—processes, services, and infrastructure—with broad public and private support
Transit corridors: regional coordination and cooperation is vital for landlocked developing countries
Infrastructure: high on the agenda Tailoring reform to each country’s circumstances
32
5. Want to learn more?5. Want to learn more?

34
Web site with data www.worldbank.org/lpi Availability of Trade Department for regional
presentations, and discussions. For further questions, please contact main
authors: Jean Francois Arvis; [email protected] Monica Alina Mustra; [email protected]
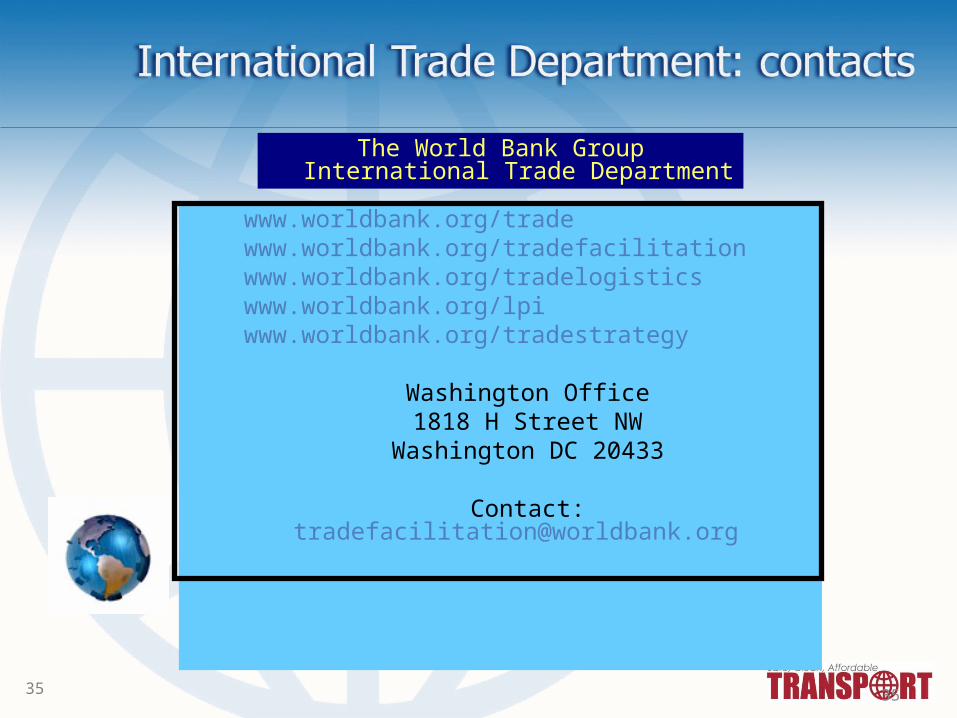
35
www.worldbank.org/tradewww.worldbank.org/tradefacilitationwww.worldbank.org/tradelogisticswww.worldbank.org/lpiwww.worldbank.org/tradestrategy
Washington Office1818 H Street NW
Washington DC 20433
Contact: [email protected]
The World Bank GroupInternational Trade Department
35
36
Web site with resources www.worldbank.org/transport
Availability for support and technical assistance For further questions, you may wish to contact
Marc Juhel-Sector Manager, [email protected]
Virginia Tanase [email protected]