log-normal distributions across the sciences: keys and …stahel/lognormal/bioscience.pdf ·...
TRANSCRIPT

As the need grows for conceptualizationformalization and abstraction in biology so too does math-ematicsrsquo relevance to the field (Fagerstroumlm et al 1996) Math-ematics is particularly important for analyzing and charac-terizing random variation of for example size and weight ofindividuals in populations their sensitivity to chemicals andtime-to-event cases such as the amount of time an individ-ual needs to recover from illness The frequency distributionof such data is a major factor determining the type of statis-tical analysis that can be validly carried out on any data setMany widely used statistical methods such as ANOVA (analy-sis of variance) and regression analysis require that the databe normally distributed but only rarely is the frequency dis-tribution of data tested when these techniques are used
The Gaussian (normal) distribution is most often assumedto describe the random variation that occurs in the data frommany scientific disciplines the well-known bell-shaped curvecan easily be characterized and described by two values thearithmetic mean x and the standard deviation s so that datasets are commonly described by the expression x plusmn s A his-torical example of a normal distribution is that of chest mea-surements of Scottish soldiers made by Quetelet Belgianfounder of modern social statistics (Swoboda 1974) In ad-dition such disparate phenomena as milk production bycows and random deviations from target values in industrialprocesses fit a normal distribution
However many measurements show a more or less skeweddistribution Skewed distributions are particularly commonwhen mean values are low variances large and values cannotbe negative as is the case for example with species abundancelengths of latent periods of infectious diseases and distribu-tion of mineral resources in the Earthrsquos crust Such skewed dis-tributions often closely fit the log-normal distribution (Aitchi-son and Brown 1957 Crow and Shimizu 1988 Lee 1992Johnson et al 1994 Sachs 1997) Examples fitting the normaldistribution which is symmetrical and the log-normal distribution which is skewed are given in Figure 1Note that body height fits both distributions
Often biological mechanisms induce log-normal distrib-utions (Koch 1966) as when for instance exponential growth
is combined with further symmetrical variation With a meanconcentration of say 106 bacteria one cell division moremdashor lessmdashwill lead to 2 times 106mdashor 5 times 105mdashcells Thus the rangewill be asymmetricalmdashto be precise multiplied or divided by2 around the mean The skewed size distribution may bewhy ldquoexceptionallyrdquobig fruit are reported in journals year af-ter year in autumn Such exceptions however may well be therule Inheritance of fruit and flower size has long been knownto fit the log-normal distribution (Groth 1914 Powers 1936Sinnot 1937)
What is the difference between normal and log-normalvariability Both forms of variability are based on a varietyof forces acting independently of one another A major difference however is that the effects can be additive or multiplicative thus leading to normal or log-normal distributions respectively
May 2001 Vol 51 No 5 BioScience 341
Articles
Log-normal Distributionsacross the Sciences Keys and CluesECKHARD LIMPERT WERNER A STAHEL AND MARKUS ABBT
ON THE CHARMS OF STATISTICS AND
HOW MECHANICAL MODELS RESEMBLING
GAMBLING MACHINES OFFER A LINK TO A
HANDY WAY TO CHARACTERIZE LOG-
NORMAL DISTRIBUTIONS WHICH CAN
PROVIDE DEEPER INSIGHT INTO
VARIABILITY AND PROBABILITYmdashNORMAL
OR LOG-NORMAL THAT IS THE QUESTION
Eckhard Limpert (e-mail EckhardLimpertipwagrlethzch) is a
biologist and senior scientist in the Phytopathology Group of the In-
stitute of Plant Sciences in Zurich Switzerland Werner A Stahel (e-
mail stahelstatmathethzch) is a mathematician and head of the
Consulting Service at the Statistics Group Swiss Federal Institute
of Technology (ETH) CH-8092 Zuumlrich Switzerland Markus Abbt is
a mathematician and consultant at FJA Feilmeier amp Junker AG CH-
8008 Zuumlrich Switzerland copy 2001 American Institute of Biological
Sciences
342 BioScience May 2001 Vol 51 No 5
Articles
Some basic principles of additive and multiplicativeeffects can easily be demonstrated with the help of twoordinary dice with sides numbered from 1 to 6 Adding thetwo numbers which is the principle of most games leads tovalues from 2 to 12 with a mean of 7 and a symmetricalfrequency distribution The total range can be described as7 plus or minus 5 (that is 7 plusmn 5) where in this case 5 is notthe standard deviation Multiplying the two numbers how-ever leads to values between 1 and 36 with a highly skeweddistribution The total variability can be described as 6 mul-tiplied or divided by 6 (or 6 times 6) In this case the symme-try has moved to the multiplicative level
Although these examples are neither normal nor log-normal distributions they do clearly indicate that additiveand multiplicative effects give rise to different distributionsThus we cannot describe both types of distribution in thesame way Unfortunately however common belief has itthat quantitative variability is generally bell shaped andsymmetrical The current practice in science is to use sym-metrical bars in graphs to indicate standard deviations orerrors and the sign plusmn to summarize data even though thedata or the underlying principles may suggest skewed dis-tributions (Factor et al 2000 Keesing 2000 Le Naour et al2000 Rhew et al 2000) In a number of cases the variabili-ty is clearly asymmetrical because subtracting three stan-dard deviations from the mean produces negative values asin the example 100 plusmn 50 Moreover the example of the diceshows that the established way to characterize symmetricaladditive variability with the sign plusmn (plus or minus) has itsequivalent in the handy sign times (times or divided by) whichwill be discussed further below
Log-normal distributions are usually characterized interms of the log-transformed variable using as parametersthe expected value or mean of its distribution and thestandard deviation This characterization can be advanta-
geous as by definition log-normal distribu-tions are symmetrical again at the log level
Unfortunately the widespread aversion tostatistics becomes even more pronounced assoon as logarithms are involved This may bethe major reason that log-normal distribu-tions are so little understood in generalwhich leads to frequent misunderstandingsand errors Plotting the data can help butgraphs are difficult to communicate orally Inshort current ways of handling log-normaldistributions are often unwieldy
To get an idea of a sample most peopleprefer to think in terms of the originalrather than the log-transformed data Thisconception is indeed feasible and advisablefor log-normal data too because the famil-iar properties of the normal distributionhave their analogies in the log-normal dis-tribution To improve comprehension oflog-normal distributions to encourage
their proper use and to show their importance in life wepresent a novel physical model for generating log-normaldistributions thus filling a 100-year-old gap We alsodemonstrate the evolution and use of parameters allowingcharacterization of the data at the original scaleMoreover we compare log-normal distributions from avariety of branches of science to elucidate patterns of vari-ability thereby reemphasizing the importance of log-normal distributions in life
A physical model demonstrating thegenesis of log-normal distributionsThere was reason for Galton (1889) to complain about col-leagues who were interested only in averages and ignored ran-dom variability In his thinking variability was even part ofthe ldquocharms of statisticsrdquo Consequently he presented a sim-ple physical model to give a clear visualization of binomial andfinally normal variability and its derivation
Figure 2a shows a further development of this ldquoGaltonboardrdquo in which particles fall down a board and are devi-ated at decision points (the tips of the triangular obstacles)either left or right with equal probability (Galton used sim-ple nails instead of the isosceles triangles shown here so hisinvention resembles a pinball machine or the Japanese gamePachinko) The normal distribution created by the board re-flects the cumulative additive effects of the sequence of de-cision points
A particle leaving the funnel at the top meets the tip of thefirst obstacle and is deviated to the left or right by a distancec with equal probability It then meets the corresponding tri-angle in the second row and is again deviated in the same man-ner and so forth The deviation of the particle from one rowto the next is a realization of a random variable with possiblevalues +c and ndashc and with equal probability for both of themFinally after passing r rows of triangles the particle falls into
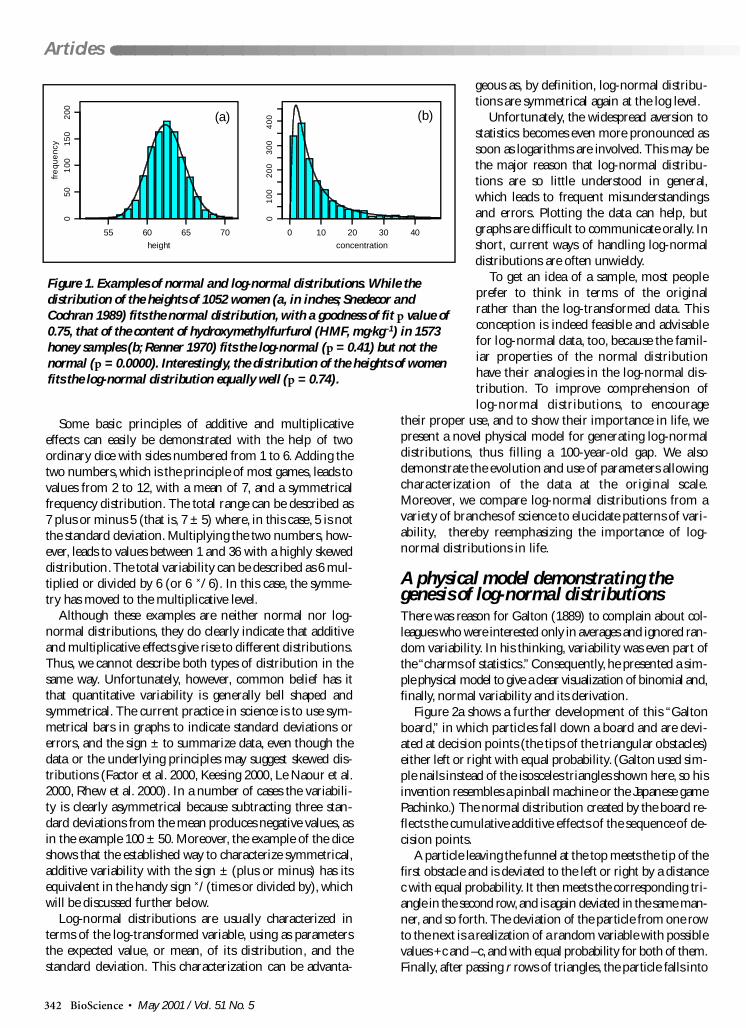
Figure 1 Examples of normal and log-normal distributions While thedistribution of the heights of 1052 women (a in inches Snedecor andCochran 1989) fits the normal distribution with a goodness of fit p value of075 that of the content of hydroxymethylfurfurol (HMF mgmiddotkgndash1) in 1573honey samples (b Renner 1970) fits the log-normal (p = 041) but not thenormal (p = 00000) Interestingly the distribution of the heights of womenfits the log-normal distribution equally well (p = 074)
height
fre
que
ncy
050
100
150
200
55 60 65 70
(a)
concentration
0
0 10 20 30 40
(b)
10
0 2
00 300 4
00
May 2001 Vol 51 No 5 BioScience 343
Articles
one of the r + 1 receptacles at the bottom The probabilitiesof ending up in these receptacles numbered 0 1r followa binomial law with parameters r and p = 05When many par-ticles have made their way through the obstacles the height ofthe particles piled up in the several receptacles will be ap-proximately proportional to the binomial probabilities
For a large number of rows the probabilities approach anormal density function according to the central limit theo-rem In its simplest form this mathematical law states that thesum of many (r) independent identically distributed randomvariables is in the limit as r normally distributed There-fore a Galton board with many rows of obstacles shows nor-mal density as the expected height of particle piles in the re-ceptacles and its mechanism captures the idea of a sum of rindependent random variables
Figure 2b shows how Galtonrsquos construction was modifiedto describe the distribution of a product of such variableswhich ultimately leads to a log-normal distribution To thisaim scalene triangles are needed (although they appear to beisosceles in the figure) with the longer side to the right Letthe distance from the left edge of the board to the tip of thefirst obstacle below the funnel be xm The lower corners of the
first triangle are at xm middot c and xmc (ignoring the gap neces-sary to allow the particles to pass between the obstacles)Therefore the particle meets the tip of a triangle in the nextrow at X = xm middot c or X = xm c with equal probabilities for bothvalues In the second and following rows the triangles withthe tip at distance x from the left edge have lower corners atx middot c and xc (up to the gap width) Thus the horizontal po-sition of a particle is multiplied in each row by a random vari-able with equal probabilities for its two possible values c and1c
Once again the probabilities of particles falling into any re-ceptacle follow the same binomial law as in Galtonrsquos device but because the receptacles on the right are widerthan those on the left the height of accumulated particles isa ldquohistogramrdquo skewed to the left For a large number of rowsthe heights approach a log-normal distribution This followsfrom the multiplicative version of the central limit theoremwhich proves that the product of many independent identi-cally distributed positive random variables has approxi-mately a log-normal distribution Computer implementationsof the models shown in Figure 2 also are available at the Website httpstatethzchvislog-normal (Gut et al 2000)
Figure 2 Physical models demonstrating the genesis of normal and log-normal distributions Particles fall from a funnelonto tips of triangles where they are deviated to the left or to the right with equal probability (05) and finally fall intoreceptacles The medians of the distributions remain below the entry points of the particles If the tip of a triangle is atdistance x from the left edge of the board triangle tips to the right and to the left below it are placed at x + c and x ndash c for the normal distribution (panel a) and x middot c and x c for the log-normal (panel b patent pending) c and c beingconstants The distributions are generated by many small random effects (according to the central limit theorem) that areadditive for the normal distribution and multiplicative for the log-normal We therefore suggest the alternative namemultiplicative normal distribution for the latter
ba
344 BioScience May 2001 Vol 51 No 5
Articles
J C Kapteyn designed the direct predecessor of the log-normal machine (Kapteyn 1903 Aitchison and Brown 1957)For that machine isosceles triangles were used instead of theskewed shape described here Because the trianglesrsquo width isproportional to their horizontal position this model alsoleads to a log-normal distribution However the isoscelestriangles with increasingly wide sides to the right of the en-try point have a hidden logical disadvantage The median ofthe particle flow shifts to the left In contrast there is no suchshift and the median remains below the entry point of the par-ticles in the log-normal board presented here (which wasdesigned by author E L) Moreover the isosceles triangles in
the Kapteyn board create additive effectsat each decision point in contrast to themultiplicative log-normal effects ap-parent in Figure 2b
Consequently the log-normal boardpresented here is a physical representa-tion of the multiplicative central limittheorem in probability theory
Basic properties of log-normal distributionsThe basic properties of log-normal dis-tribution were established long ago(Weber 1834 Fechner 1860 1897 Gal-ton 1879 McAlister 1879 Gibrat 1931Gaddum 1945) and it is not difficult tocharacterize log-normal distributions
mathematicallyA random variable X is said to be log-normallydistributed if log(X) is normally distributed (see the box onthe facing page) Only positive values are possible for thevariable and the distribution is skewed to the left (Figure 3a)
Two parameters are needed to specify a log-normal distri-bution Traditionally the mean micro and the standard deviation
(or the variance 2) of log(X) are used (Figure 3b) How-ever there are clear advantages to using ldquoback-transformedrdquovalues (the values are in terms of x the measured data)(1) micro = e micro = e
We then use X (micro ) as a mathematical expressionmeaning that X is distributed according to the log-normal law
with median micro and multiplicative stan-dard deviation
The median of this log-normal dis-tribution is med(X) = micro = e micro since microis the median of log(X) Thus the prob-ability that the value of X is greaterthan micro is 05 as is the probability thatthe value is less than micro The parame-ter which we call multiplicativestandard deviation determines theshape of the distribution Figure 4shows density curves for some selectedvalues of Note that micro is a scale pa-rameter hence if X is expressed in dif-ferent units (or multiplied by a con-stant for other reasons) then microchanges accordingly but remainsthe same
Distributions are commonly char-acterized by their expected value micro andstandard deviation In applications forwhich the log-normal distribution ad-equately describes the data these pa-rameters are usually less easy to inter-pret than the median micro (McAlister1879) and the shape parameter It isworth noting that is related to the
Figure 3 A log-normal distribution with original scale (a) and with logarithmicscale (b) Areas under the curve from the median to both sides correspond to one andtwo standard deviation ranges of the normal distribution
den
sity
original scalemicro micro times
micro = 100 = 2
(a)
00
005
0 50 100 200 300 400
den
sity
01
10 15 20 25 30log scale
micro= 2 = 0301
micro micro+
(b)
Figure 4 Density functions of selected log-normal distributions compared with anormal distribution Log-normal distributions (micro ) shown for five values ofmultiplicative standard deviation s are compared with the normal distribution (100 plusmn 20 shaded) The values cover most of the range evident in Table 2 Whilethe median micro is the same for all densities the modes approach zero with increasingshape parameters A change in micro affects the scaling in horizontal and verticaldirections but the essential shape remains the same
dens
ity
1215204080
00
01
00
2
0 50 100 150 200 250
(b)(a)
May 2001 Vol 51 No 5 BioScience 345
Articles
coefficient of variation by a monotonic increasing transfor-mation (see the box below eq 2)
For normally distributed data the interval micro plusmn covers aprobability of 683 while micro plusmn 2 covers 955 (Table 1)The corresponding statements for log-normal quantities are
[micro micro ] = micro x (contains 683) and[micro ( )2 micro ( )2] = micro x ( )2 (contains 955)This characterization shows that the operations of multi-
plying and dividing which we denote with the sign times (timesdivide) help to determine useful intervals for log-normal distributions (Figure 3) in the same way that theoperations of adding and subtracting (plusmn or plusminus) dofor normal distributions Table 1 summarizes and comparessome properties of normal and log-normal distributions
The sum of several independent normal variables is itselfa normal random variable For quantities with a log-normaldistribution however multiplication is the relevant operationfor combining them in most applications for example theproduct of concentrations determines the speed of a simple
chemical reaction The product of independent log-normalquantities also follows a log-normal distribution The medianof this product is the product of the medians of its factors Theformula for of the product is given in the box below (eq 3)
For a log-normal distribution the most precise (ieasymptotically most efficient) method for estimating the pa-rameters micro and relies on log transformation The meanand empirical standard deviation of the logarithms of the dataare calculated and then back-transformed as in equation 1These estimators are called x and s where x is the geometric mean of the data (McAlister 1879 eq 4 in the boxbelow) More robust but less efficient estimates can be obtainedfrom the median and the quartiles of the data as describedin the box below
As noted previously it is not uncommon for data with alog-normal distribution to be characterized in the literatureby the arithmetic mean x and the standard deviation s of asample but it is still possible to obtain estimates for micro and
Definition and properties of the log-normal distribution
A random variable X is log-normally distributed if log(X) has a normal distribution Usually natural logarithms are used but other bases would lead to thesame family of distributions with rescaled parameters The probability density function of such a random variable has the form
A shift parameter can be included to define a three-parameter family This may be adequate if the data cannot be smaller than a certain bound differentfrom zero (cf Aitchison and Brown 1957 page 14) The mean and variance are exp(micro + 2) and (exp( 2) ndash 1)exp(2micro+ 2) respectively and thereforethe coefficient of variation is
t
which is a function in only
The product of two independent log-normally distributed random variables has the shape parameter
since the variances at the log-transformed variables add
Estimation The asymptotically most efficient (maximum likelihood) estimators are
cv =
(4)
-
-
The quartiles q1 and q2 lead to a more robust estimate (q1q2)c for s where 1c = 1349 = 2 middot ndash1 (075) ndash1 denoting the inversestandard normal distribution function If the mean x and the standard deviation s of a sample are available ie the data is summa-rized in the form x plusmn s the parameters micro and s can be estimated from them by usingrespectively with cv = coefficient of variation Thus this estimate of s is determined only by the cv (eq 2)
and-
(3)
(2)
346 BioScience May 2001 Vol 51 No 5
Articles
(see the box on page 345) For example Stehmann andDe Waard (1996) describe their data as log-normal with thearithmetic mean x and standard deviation s as 41 plusmn 37Taking the log-normal nature of the distribution into ac-count the probability of the corresponding x plusmn s interval(04 to 78) turns out to be 884 instead of 683 More-over 65 of the population are below the mean and almostexclusively within only one standard deviation In contrastthe proposed characterization which uses the geometricmean x and the multiplicative standard deviation s reads30 x 22 (136 to 66) This interval covers approximately68 of the data and thus is more appropriate than theother interval for the skewed data
Comparing log-normal distributionsacross the sciencesExamples of log-normal distributions from various branch-es of science reveal interesting patterns (Table 2) In gener-al values of s vary between 11 and 33 with most in therange of approximately 14 to 3 The shapes of such distrib-utions are apparent by comparison with selected instancesshown in Figure 4
Geology and mining In the Earthrsquos crust the concen-tration of elements and their radioactivity usually follow a log-normal distribution In geology values of s in 27 examplesvaried from 117 to 56 (Razumovsky 1940 Ahrens 1954Malanca et al 1996) nine other examples are given in Table2 A closer look at extensive data from different reefs (Krige1966) indicates that values of s for gold and uranium increasein concert with the size of the region considered
Human medicine A variety of examples from medicinefit the log-normal distribution Latent periods (time from in-fection to first symptoms) of infectious diseases have often
been shown to be log-normally dis-tributed (Sartwell 1950 1952 1966Kondo 1977) approximately 70 of86 examples reviewed by Kondo (1977)appear to be log-normal Sartwell(1950 1952 1966) documents 37 casesfitting the log-normal distribution Aparticularly impressive one is that of5914 soldiers inoculated on the sameday with the same batch of faulty vac-cine 1005 of whom developed serumhepatitis
Interestingly despite considerabledifferences in the median x of la-tency periods of various diseases (rang-ing from 23 hours to several monthsTable 2) the majority of s values wereclose to 15 It might be worth trying toaccount for the similarities and dis-similarities in s For instance the smalls value of 124 in the example of the
Scottish soldiers may be due to limited variability within thisrather homogeneous group of people Survival time after di-agnosis of four types of cancer is compared with latent pe-riods of infectious diseases much more variable with s val-ues between 25 and 32 (Boag 1949 Feinleib and McMahon1960) It would be interesting to see whether x and s val-ues have changed in accord with the changes in diagnosis andtreatment of cancer in the last half century The age of onsetof Alzheimerrsquos disease can be characterized with the geo-metric mean x of 60 years and s of 116 (Horner 1987)
Environment The distribution of particles chemicalsand organisms in the environment is often log-normal Forexample the amounts of rain falling from seeded and un-seeded clouds differed significantly (Biondini 1976) andagain s values were similar (seeding itself accounts for thegreater variation with seeded clouds) The parameters forthe content of hydroxymethylfurfurol in honey (see Figure 1b)show that the distribution of the chemical in 1573 samples canbe described adequately with just the two values Ott (1978)presented data on the Pollutant Standard Index a measure ofair quality Data were collected for eight US cities the extremesof x and s were found in Los Angeles Houston and Seat-tle allowing interesting comparisons
Atmospheric sciences and aerobiology Another com-ponent of air quality is its content of microorganisms whichwasmdashnot surprisinglymdashmuch higher and less variable inthe air of Marseille than in that of an island (Di Giorgio et al1996) The atmosphere is a major part of life support systemsand many atmospheric physical and chemical properties follow a log-normal distribution law Among other examplesare size distributions of aerosols and clouds and parametersof turbulent processes In the context of turbulence the
Table 1 A bridge between normal and log-normal distributions
Normal distribution Log-normal distribution(Gaussian or additive (Multiplicative
Property normal distribution) normal distribution)
Effects (central limit theorem) Additive MultiplicativeShape of distribution Symmetrical SkewedModels
Triangle shape Isosceles ScaleneEffects at each decision point x x plusmn c x x c
CharacterizationMean x Arithmetic macrx GeometricStandard deviation s Additive s MultiplicativeMeasure of dispersion cv = sx sInterval of confidence
683 x plusmn s x x s955 x plusmn 2s x x (s)2
997 x plusmn 3s x x (s)3
Notes cv = coefficient of variation x = timesdivide corresponding to plusminus for the established sign plusmn
May 2001 Vol 51 No 5 BioScience 347
Articles
Table 2 Comparing log-normal distributions across the sciences in terms of the original data x is an estimator of themedian of the distribution usually the geometric mean of the observed data and s estimates the multiplicative standarddeviation the shape parameter of the distribution 68 of the data are within the range of x x s and 95 withinx x (s)2 In general values of s and some of x were obtained by transformation from the parameters given in theliterature (cf Table 3) The goodness of fit was tested either by the original authors or by us
Discipline and type of measurement Example n x s Reference
Geology and miningConcentration of elements Ga in diabase 56 17 mg middot kgndash1 117 Ahrens 1954
Co in diabase 57 35 mg middot kgndash1 148 Ahrens 1954Cu 688 037 267 Razumovsky 1940Cr in diabase 53 93 mg middot kgndash1 560 Ahrens 1954226Ra 52 254 Bq middot kgndash1 170 Malanca et al 1996Au small sections 100 (20 inch-dwt)a 139 Krige 1966
large sections 75000 na 242 Krige 1966U small sections 100 (25 inch-lb)a 135 Krige 1966
large sections 75000 na 235 Krige 1966Human medicineLatency periods of diseases Chicken pox 127 14 days 114 Sartwell 1950
Serum hepatitis 1005 100 days 124 Sartwell 1950Bacterial food poisoning 144 23 hours 148 Sartwell 1950Salmonellosis 227 24 days 147 Sartwell 1950Poliomyelitis 8 studies 258 126 days 150 Sartwell 1952Amoebic dysentery 215 214 days 211 Sartwell 1950
Survival times after cancer Mouth and throat cancer 338 96 months 250 Boag 1949diagnosis Leukemia myelocytic (female) 128 159 months 280 Feinleib and McMahon 1960
Leukemia lymphocytic (female) 125 172 months 321 Feinleib and McMahon 1960Cervix uteri 939 145 months 302 Boag 1949
Age of onset of a disease Alzheimer 90 60 years 116 Horner 1987
EnvironmentRainfall Seeded 26 211600 m3 490 Biondini 1976
Unseeded 25 78470 m3 429 Biondini 1976HMF in honey Content of hydroxymethylfurfurol 1573 556 g kgndash1 277 Renner 1970Air pollution (PSI) Los Angeles CA 364 1099 PSI 150 Ott 1978
Houston TX 363 491 PSI 185 Ott 1978Seattle WA 357 396 PSI 158 Ott 1978
AerobiologyAirborne contamination by Bacteria in Marseilles na 630 cfu mndash3 196 Di Giorgio et al 1996
bacteria and fungi Fungi in Marseilles na 65 cfu mndash3 230 Di Giorgio et al 1996Bacteria on Porquerolles Island na 22 cfu mndash3 317 Di Giorgio et al 1996Fungi on Porquerolles Island na 30 cfu mndash3 257 Di Giorgio et al 1996
PhytomedicineFungicide sensitivity EC50 Untreated area 100 00078 microg middot mlndash1 ai 185 Romero and Sutton 1997Banana leaf spot Treated area 100 0063 microg middot mlndash1 ai 242 Romero and Sutton 1997
After additional treatment 94 027 microg middot mlndash1 ai gt358 Romero and Sutton 1997Powdery mildew on barley Spain (untreated area) 20 00153 microg middot mlndash1 ai 129 Limpert and Koller 1990
England (treated area) 21 685 microg middot mlndash1 ai 168 Limpert and Koller 1990
Plant physiologyPermeability and Citrus aurantiumH2OLeaf 73 158 10ndash10 m sndash1 118 Baur 1997
solute mobility (rate of Capsicum annuumH2OCM 149 269 10ndash10 m sndash1 130 Baur 1997constant desorption) Citrus aurantium24ndashDCM 750 741 10ndash7 1 sndash1 140 Baur 1997
Citrus aurantiumWL110547CM 46 26310ndash7 1 sndash1 164 Baur 1997Citrus aurantium24ndashDCM 16 na 138 Baur 1997Citrus aurantium24ndashDCM + acc1 16 na 117 Baur 1997Citrus aurantium24ndashDCM 19 na 156 Baur 1997Citrus aurantium24ndashDCM + acc2 19 na 103 Baur 1997
EcologySpecies abundance Diatoms (150 species) na 121 isp 568 May 1981
Plants (coverage per species) na 04 739 Magurran 1988Fish (87 species) na 293 1182 Magurran 1988Birds (142 species) na na 3315 Preston 1962Moths in England (223 species) 15609 175 isp 866 Preston 1948Moths in Maine (330 species) 56131 195 isp 1067 Preston 1948Moths in Saskatchewan (277 species) 87110 na 2514 Preston 1948
Food technologySize of unit Crystals in ice cream na 15 microm 15 Limpert et al 2000b
(mean diameter) Oil drops in mayonnaise na 20 microm 2 Limpert et al 2000bPores in cocoa press cake na 10 microm 15ndash2 Limpert et al 2000b
348 BioScience May 2001 Vol 51 No 5
Articles
size of which is distributed log-normally (Limpert et al2000b)
Phytomedicine and microbiology Examples frommicrobiology and phytomedicine include the distributionof sensitivity to fungicides in populations and distribution ofpopulation size Romero and Sutton (1997) analyzed thesensitivity of the banana leaf spot fungus (Mycosphaerella fijiensis) to the fungicide propiconazole in samples from untreated and treated areas in Costa Rica The differences inx and s among the areas can be explained by treatment his-tory The s in untreated areas reflects mostly environmen-tal conditions and stabilizing selection The increase in s af-ter treatment reflects the widened spectrum of sensitivitywhich results from the additional selection caused by use ofthe chemical
Similar results were obtained for the barley mildewpathogen Blumeria (Erysiphe) graminis f sp hordei and thefungicide triadimenol (Limpert and Koller 1990) whereagain s was higher in the treated region Mildew in Spainwhere triadimenol had not been used represented the orig-inal sensitivity In contrast in England the pathogen was of-ten treated and was consequently highly resistant differing bya resistance factor of close to 450 (x England x Spain)To obtain the same control of the resistant population thenthe concentration of the chemical would have to be increasedby this factor
The abundance of bacteria on plants varies among plantspecies type of bacteria and environment and has beenfound to be log-normally distributed (Hirano et al 1982Loper et al 1984) In the case of bacterial populations on theleaves of corn (Zea mays) the median population size (x ) increased from July and August to October but the rel-ative variability expressed (s) remained nearly constant (Hi-
rano et al 1982) Interestingly whereas s for the total num-ber of bacteria varied little (from 126 to 20) that for the sub-group of ice nucleation bacteria varied considerably (from 375to 804)
Plant physiology Recently convincing evidence was pre-sented from plant physiology indicating that the log-normaldistribution fits well to permeability and to solute mobility inplant cuticles (Baur 1997) For the number of combinationsof species plant parts and chemical compounds studiedthe median s for water permeability of leaves was 118 Thecorresponding s of isolated cuticles 130 appears to be con-siderably higher presumably because of the preparation of cu-ticles Again s was considerably higher for mobility of theherbicides Dichlorophenoxyacetic acid (24-D) and WL110547(1-(3-fluoromethylphenyl)-5-U-14C-phenoxy-1234-tetra-zole) One explanation for the differences in s for water andfor the other chemicals may be extrapolated from resultsfrom food technology where for transport through filters sis smaller for simple (eg spherical) particles than for morecomplex particles such as rods (E J Windhab [Eidgenoumls-sische Technische Hochschule Zurich Switzerland] per-sonal communication 2000)
Chemicals called accelerators can reduce the variability ofmobility For the combination of Citrus aurantium cuticles and24-D diethyladipate (accelerator 1) caused s to fall from 138to 117 For the same combination tributylphosphate (ac-celerator 2) caused an even greater decrease from 156 to 103Statistical reasoning suggests that these data with s values of117 and 103 are normally distributed (Baur 1997) Howeverbecause the underlying principles of permeability remainthe same we think these cases represent log-normal distrib-utions Thus considering only statistical reasons may lead tomisclassification which may handicap further analysis One
Table 2 (continued from previous page)
Discipline and typeof measurement Example n x s Reference
LinguisticsLength of spoken words in Different words 738 505 letters 147 Herdan 1958
phone conversation Total occurrence of words 76054 312 letters 165 Herdan 1958Length of sentences G K Chesterton 600 235 words 158 Williams 1940
G B Shaw 600 245 words 195 Williams 1940Social sciences and economicsAge of marriage Women in Denmark 1970s 30200 (124)a 107 years 169 Preston 1981Farm size in England 1939 na 272 hectares 255 Allanson 1992
and Wales 1989 na 377 hectares 290 Allanson 1992Income Households of employees in 17x106 sFr 6726 154 Statistisches Jahrbuch der
Switzerland 1990 Schweiz 1997
a The shift parameter of a three-parameter log-normal distribution
Notes na = not available PSI = Pollutant Standard Index acc = accelerator isp = individuals per species ai = active ingredient andcfu = colony forming units
May 2001 Vol 51 No 5 BioScience 349
Articles
question remains What are the underlying principles of per-meability that cause log-normal variability
Ecology In the majority of plant and animal communitiesthe abundance of species follows a (truncated) log-normal dis-tribution (Sugihara 1980 Magurran 1988) Interestingly therange of s for birds fish moths plants or diatoms was veryclose to that found within one group or another Based on thedata and conclusions of Preston (1948) we determined themost typical value of s to be 116 1
Food technology Various applications of the log-normaldistribution are related to the characterization of structuresin food technology and food process engineering Such dis-perse structures may be the size and frequency of particlesdroplets and bubbles that are generated in dispersingprocesses or they may be the pores in filtering membranesThe latter are typically formed by particles that are also log-normally distributed in diameter Such particles can also begenerated in dry or wet milling processes in which log-normal distribution is a powerful approximation The ex-amples of ice cream and mayonnaise given in Table 2 also pointto the presence of log-normal distributions in everyday life
Linguistics In linguistics the number of letters per wordand the number of words per sentence fit the log-normal dis-tribution In English telephone conversations the variabilitys of the length of all words usedmdashas well as of differentwordsmdashwas similar (Herdan 1958) Likewise the number ofwords per sentence varied little between writers (Williams1940)
Social sciences and economics Examples of log-normal distributions in the social sciences and economics in-clude age of marriage farm size and income The age of firstmarriage in Western civilization follows a three-parameter log-normal distribution the third parameter corresponds toage at puberty (Preston 1981) For farm size in England and
Wales both x and s increased over 50years the former by 386 (Allanson 1992)For income distributions x and s may fa-cilitate comparisons among societies andgenerations (Aitchison and Brown 1957Limpert et al 2000a)
Typical s valuesOne question arises from the comparison oflog-normal distributions across the sciencesTo what extent are s values typical for a cer-tain attribute In some cases values of s appear to be fairly restricted as is the case for
the range of s for latent periods of diseasesmdasha fact thatSartwell recognized (1950 1952 1966) and Lawrence reem-phasized (1988a) Describing patterns of typical skewness atthe established log level Lawrence (1988a 1988b) can be re-garded as the direct predecessor of our comparison of s val-ues across the sciences Aitchison and Brown (1957) usinggraphical methods such as quantilendashquantile plots and Lorenzcurves demonstrated that log-normal distributions describ-ing for example national income across countries or incomefor groups of occupations within a country show typicalshapes
A restricted range of variation for a specific research ques-tion makes sense For infectious diseases of humans for example the infection processes of the pathogens are similaras is the genetic variability of the human population The sameappears to hold for survival time after diagnosis of cancer al-though the value of s is higher this can be attributed to theadditional variation caused by cancer recognition and treat-ment Other examples with typical ranges of s come from lin-guistics For bacteria on plant surfaces the range of variationof total bacteria is smaller than that of a group of bacteriawhich can be expected because of competition Thus theranges of variation in these cases appear to be typical andmeaningful a fact that might well stimulate future research
Future challengesA number of scientific areasmdashand everyday lifemdashwill presentopportunities for new comparisons and for more far-reaching analyses of s values for the applications consideredto date Moreover our concept can be extended also to de-scriptions based on sigmoid curves such as for exampledosendashresponse relationships
Further comparisons of s values Permeability and mo-bility are important not only for plant physiology (Baur1997) but also for many other fields such as soil sciences andhuman medicine as well as for some industrial processes Withthe help of x and s the mobility of different chemicalsthrough a variety of natural membranes could easily be as-sessed allowing for comparisons of the membranes with oneanother as well as with those for filter actions of soils or withtechnical membranes and filters Such comparisons will un-doubtedly yield valuable insights
1Species abundance may be described by a log-normal law (Preston 1948)usually written in the form S(R) = S0 middot exp(ndasha2R2) where S0 is the numberof species at the mode of the distribution The shape parameter a amountsto approximately 02 for all species which corresponds to s = 116
Table 3 Established methods for describing log-normal distributions
Characterization Disadvantages
Graphical methodsDensity plots histograms box plots Spacey difficult to describe and compare
Indication of parametersLogarithm of X mean median Unclear which base of the logarithm should bestandard deviation variance chosen parameters are not on the scale of the
original data and values are difficult to interpret and use for mental calculations
Skewness and curtosis of X Difficult to estimate and interpret
350 BioScience May 2001 Vol 51 No 5
Articles
Farther-reaching analyses An adequate description ofvariability is a prerequisite for studying its patterns and esti-mating variance components One component that deservesmore attention is the variability arising from unknown rea-sons and chance commonly called error variation or in thiscase sE Such variability can be estimated if other conditionsaccounting for variabilitymdashthe environment and genetics forexamplemdashare kept constant The field of population genet-ics and fungicide sensitivity as well as that of permeability andmobility can demonstrate the benefits of analyses of variance
An important parameter of population genetics is migra-tion Migration among regions leads to population mixingthus widening the spectrum of fungicide sensitivity encoun-tered in any one of the regions mentioned in the discussionof phytomedicine and microbiology Population mixingamong regions will increase s but decrease the difference inx Migration of spores appears to be greater for instancein regions of Costa Rica than in those of Europe (Limpert etal 1996 Romero and Sutton 1997 Limpert 1999)
Another important aim of pesticide research is to esti-mate resistance risk As a first approximation resistance riskis assumed to correlate with s However s depends on ge-netic and other causes of variability Thus determining its ge-netic part s G is a task worth undertaking because genetic variation has a major impact on future evolution (Limpert1999) Several aspects of various branches of science areexpected to benefit from improved identification of com-ponents of s In the study of plant physiology and perme-ability noted above (Baur 1997) for example determiningthe effects of accelerators and their share of variability wouldbe elucidative
Sigmoid curves based on log-normal distributionsDosendashresponse relations are essential for understandingthe control of pests and pathogens (Horsfall 1956) Equallyimportant are dosendashresponse curves that demonstrate theeffects of other chemicals such as hormones or mineralsTypically such curves are sigmoid and show the cumulativeaction of the chemical If plotted against the logarithm ofthe chemical dose the sigmoid is symmetrical and corre-sponds to the cumulative curve of the log-normal distrib-ution at logarithmic scale (Figure 3b) The steepness ofthe sigmoid curve is inversely proportional to s and thegeometric mean value x equals the ldquoED50rdquo the chemicaldose creating 50 of the maximal effect Considering thegeneral importance of chemical sensitivity a wide field offurther applications opens up in which progress can be ex-pected and in which researchers may find the proposedcharacterization x xs advantageous
Normal or log-normalConsidering the patterns of normal and log-normal distrib-utions further as well as the connections and distinctions be-tween them (Tables 1 3) is useful for describing and ex-plaining phenomena relating to frequency distributions in lifeSome important aspects are discussed below
The range of log-normal variability How far can svalues extend beyond the range described from 11 to 33 Toward the high end of the scale of possible s values we foundone s larger than 150 for hail energy of clouds (Federer et al1986 calculations by W A S) Values below 12 may even becommon and therefore of great interest in science How-ever such log-normal distributions are difficult to distin-guish from normal onesmdashsee Figures 1 and 3mdashand thusuntil now have usually been taken to be normal
Because of the general preference for the normal distrib-ution we were asked to find examples of data that followeda normal distribution but did not match a log-normal dis-tribution Interestingly original measurements did not yieldany such examples As noted earlier even the classic exam-ple of the height of women (Figure 1a Snedecor and Cochran1989) fits both distributions equally well The distribution canbe characterized with 6254 inches plusmn 238 and 6248 inchestimes 1039 respectively The examples that we found of nor-mallymdashbut not log-normallymdashdistributed data consistedof differences sums means or other functions of originalmeasurements These findings raise questions about the roleof symmetry in quantitative variation in nature
Why the normal distribution is so popular Re-gardless of statistical considerations there are a number of rea-sons why the normal distribution is much better known thanthe log-normal A major one appears to be symmetry one ofthe basic principles realized in nature as well as in our cultureand thinking Thus probability distributions based on sym-metry may have more inherent appeal than skewed onesTwo other reasons relate to simplicity First as Aitchison andBrown (1957 p 2) stated ldquoMan has found addition an eas-ier operation than multiplication and so it is not surprisingthat an additive law of errors was the first to be formulatedrdquoSecond the established concise description of a normal sam-plemdashx plusmn smdashis handy well-known and sufficient to representthe underlying distribution which made it easier until nowto handle normal distributions than to work with log-normaldistributions Another reason relates to the history of thedistributions The normal distribution has been known andapplied more than twice as long as its log-normal sister distribution Finally the very notion of ldquonormalrdquo conjuresmore positive associations for nonstatisticians than does ldquolog-normalrdquo For all of these reasons the normal or Gaussiandistribution is far more familiar than the log-normal distri-bution is to most people
This preference leads to two practical ways to make datalook normal even if they are skewed First skewed distribu-tions produce large values that may appear to be outliers Itis common practice to reject such observations and conductthe analysis without them thereby reducing the skewnessbut introducing bias Second skewed data are often groupedtogether and their meansmdashwhich are more normally dis-tributedmdashare used for further analyses Of course followingthat procedure means that important features of the datamay remain undiscovered
May 2001 Vol 51 No 5 BioScience 351
Articles
Why the log-normal distribution is usually thebetter model for original data As discussed above theconnection between additive effects and the normal distribu-tion parallels that of multiplicative effects and the log-normaldistribution Kapteyn (1903) noted long ago that if data fromone-dimensional measurements in nature fit the normal dis-tribution two- and three-dimensional results such as surfacesand volumes cannot be symmetric A number of effects thatpoint to the log-normal distribution as an appropriate modelhave been described in various papers (eg Aitchison andBrown 1957 Koch 1966 1969 Crow and Shimizu 1988) In-terestingly even in biological systematics which is the scienceof classification the number of say species per family was ex-pected to fit log-normality (Koch 1966)
The most basic indicator of the importance of the log-normal distribution may be even more general howeverClearly chemistry and physics are fundamental in life and theprevailing operation in the laws of these disciplines is multi-plication In chemistry for instance the velocity of a simplereaction depends on the product of the concentrations of themolecules involved Equilibrium conditions likewise are gov-erned by factors that act in a multiplicative way From this amajor contrast becomes obvious The reasons governing fre-quency distributions in nature usually favor the log-normalwhereas people are in favor of the normal
For small coefficients of variation normal and log-normaldistributions both fit well For these cases it is natural tochoose the distribution found appropriate for related cases ex-hibiting increased variability which corresponds to the lawgoverning the reasons of variability This will most often bethe log-normal
ConclusionThis article shows in a nutshell the fundamental role of thelog-normal distribution and provides insights for gaining adeeper comprehension of that role Compared with establishedmethods for describing log-normal distributions (Table 3) theproposed characterization by x and s offers several ad-vantages some of which have been described before (Sartwell1950 Ahrens 1954 Limpert 1993) Both x and s describethe data directly at their original scale they are easy to calculateand imagine and they even allow mental calculation and es-timation The proposed characterization does not appear tohave any major disadvantage
On the first page of their book Aitchison and Brown(1957) stated that compared with its sister distributions thenormal and the binomial the log-normal distribution ldquohasremained the Cinderella of distributions the interest of writ-ers in the learned journals being curiously sporadic and thatof the authors of statistical textbooks but faintly arousedrdquoThisis indeed true Despite abundant increasing evidence that log-normal distributions are widespread in the physical biolog-ical and social sciences and in economics log-normal knowl-edge has remained dispersed The question now is this Canwe begin to bring the wealth of knowledge we have on nor-mal and log-normal distributions to the public We feel that
doing so would lead to a general preference for the log-normal or multiplicative normal distribution over the Gauss-ian distribution when describing original data
AcknowledgmentsThis work was supported by a grant from the Swiss FederalInstitute of Technology (Zurich) and by COST (Coordinationof Science and Technology in Europe) at Brussels and BernPatrick Fluumltsch Swiss Federal Institute of Technology con-structed the physical models We are grateful to Roy Snaydonprofessor emeritus at the University of Reading United King-dom to Rebecca Chasan and to four anonymous reviewersfor valuable comments on the manuscript We thank DonnaVerdier and Herman Marshall for getting the paper into goodshape for publication and E L also thanks Gerhard Wenzelprofessor of agronomy and plant breeding at Technical Uni-versity Munich for helpful discussions
Because of his fundamental and comprehensive contri-bution to the understanding of skewed distributions close to100 years ago our paper is dedicated to the Dutch astronomerJacobus Cornelius Kapteyn (van der Heijden 2000)
References citedAhrens LH 1954 The log-normal distribution of the elements (A fundamental
law of geochemistry and its subsidiary) Geochimica et CosmochimicaActa 5 49ndash73
Aitchison J Brown JAC 1957 The Log-normal Distribution Cambridge (UK)Cambridge University Press
Allanson P 1992 Farm size structure in England and Wales 1939ndash89 Jour-nal of Agricultural Economics 43 137ndash148
Baur P 1997 Log-normal distribution of water permeability and organic solutemobility in plant cuticles Plant Cell and Environment 20 167ndash177
Biondini R 1976 Cloud motion and rainfall statistics Journal of Applied Me-teorology 15 205ndash224
Boag JW 1949 Maximum likelihood estimates of the proportion of patientscured by cancer therapy Journal of the Royal Statistical Society B 1115ndash53
Crow EL Shimizu K eds 1988 Log-normal Distributions Theory and Ap-plication New York Dekker
Di Giorgio C Krempff A Guiraud H Binder P Tiret C Dumenil G 1996Atmospheric pollution by airborne microorganisms in the City of Mar-seilles Atmospheric Environment 30 155ndash160
Factor VM Laskowska D Jensen MR Woitach JT Popescu NC Thorgeirs-son SS 2000 Vitamin E reduces chromosomal damage and inhibits he-patic tumor formation in a transgenic mouse model Proceedings of theNational Academy of Sciences 97 2196ndash2201
Fagerstroumlm T Jagers P Schuster P Szathmary E 1996 Biologists put onmathematical glasses Science 274 2039ndash2041
Fechner GT 1860 Elemente der Psychophysik Leipzig (Germany) Bre-itkopf und Haumlrtel
mdashmdashmdash 1897 Kollektivmasslehre Leipzig (Germany) EngelmannFederer B et al 1986 Main results of Grossversuch IV Journal of Climate
and Applied Meteorology 25 917ndash957Feinleib M McMahon B 1960 Variation in the duration of survival of pa-
tients with the chronic leukemias Blood 15ndash16 332ndash349Gaddum JH 1945 Log normal distributions Nature 156 463 747Galton F 1879 The geometric mean in vital and social statistics Proceed-
ings of the Royal Society 29 365ndash367mdashmdashmdash 1889 Natural Inheritance London MacmillanGibrat R 1931 Les Ineacutegaliteacutes Economiques Paris Recueil SireyGroth BHA 1914 The golden mean in the inheritance of size Science 39
581ndash584
352 BioScience May 2001 Vol 51 No 5
Articles
Gut C Limpert E Hinterberger H2000 A computer simulation on the webto visualize the genesis of normal and log-normal distributionshttpstatethzchvislog-normal
Herdan G 1958 The relation between the dictionary distribution and theoccurrence distribution of word length and its importance for the studyof quantitative linguistics Biometrika 45 222ndash228
Hirano SS Nordheim EV Arny DC Upper CD 1982 Log-normal distrib-ution of epiphytic bacterial populations on leaf surfaces Applied and En-vironmental Microbiology 44 695ndash700
Horner RD 1987 Age at onset of Alzheimerrsquos disease Clue to the relative im-portance of etiologic factors American Journal of Epidemiology 126409ndash414
Horsfall JG 1956 Principle of fungicidal actions Chronica Botanica 30Johnson NL Kotz S Balkrishan N 1994 Continuous Univariate Distribu-
tions New York WileyKapteyn JC 1903 Skew Frequency Curves in Biology and Statistics Astro-
nomical Laboratory Groningen (The Netherlands) NoordhoffKeesing F 2000 Cryptic consumers and the ecology of an African Savanna
BioScience 50 205ndash215Koch AL 1966 The logarithm in biology I Mechanisms generating the
log-normal distribution exactly Journal of Theoretical Biology 23276ndash290
mdashmdashmdash 1969 The logarithm in biology II Distributions simulating the log-normal Journal of Theoretical Biology 23 251ndash268
Kondo K 1977 The log-normal distribution of the incubation time of ex-ogenous diseases Japanese Journal of Human Genetics 21 217ndash237
Krige DG 1966 A study of gold and uranium distribution patterns in theKlerksdorp Gold Field Geoexploration 4 43ndash53
Lawrence RJ 1988a The log-normal as eventndashtime distribution Pages211ndash228 in Crow EL Shimizu K eds Log-normal Distributions The-ory and Application New York Dekker
mdashmdashmdash1988b Applications in economics and business Pages 229ndash266 inCrow EL Shimizu K eds Log-normal Distributions Theory and Ap-plication New York Dekker
Lee ET 1992 Statistical Methods for Survival Data Analysis New York Wi-ley
Le Naour F Rubinstein E Jasmin C Prenant M Boucheix C 2000 Severelyreduced female fertility in CD9-deficient mice Science 287 319ndash321
Limpert E 1993 Log-normal distributions in phytomedicine A handy wayfor their characterization and application Proceedings of the 6th Inter-national Congress of Plant Pathology 28 Julyndash6 August 1993 MontrealNational Research Council Canada
mdashmdashmdash 1999 Fungicide sensitivity Towards improved understanding of ge-netic variability Pages 188ndash193 in Modern Fungicides and AntifungalCompounds II Andover (UK) Intercept
Limpert E Koller B 1990 Sensitivity of the Barley Mildew Pathogen to Tri-adimenol in Selected European Areas Zurich (Switzerland) Institute ofPlant Sciences
Limpert E Finckh MR Wolfe MS eds 1996 Integrated Control of CerealMildews and Rusts Towards Coordination of Research Across EuropeBrussels (Belgium) European Commission EUR 16884 EN
Limpert E Fuchs JG Stahel WA 2000a Life is log normal On the charmsof statistics for society Pages 518ndash522 in Haumlberli R Scholz RW Bill AWelti M eds Transdisciplinarity Joint Problem-Solving among Sci-ence Technology and Society Zurich (Switzerland) Haffmans
Limpert E Abbt M Asper R Graber WK Godet F Stahel WA Windhab EJ2000b Life is log normal Keys and clues to understand patterns of mul-tiplicative interactions from the disciplinary to the transdisciplinarylevel Pages 20ndash24 in Haumlberli R Scholz RW Bill A Welti M eds Trans-
disciplinarity Joint Problem-Solving among Science Technology and Society Zurich (Switzerland) Haffmans
Loper JE Suslow TV Schroth MN 1984 Log-normal distribution of bacte-rial populations in the rhizosphere Phytopathology 74 1454ndash1460
Magurran AE 1988 Ecological Diversity and its Measurement LondonCroom Helm
Malanca A Gaidolfi L Pessina V Dallara G 1996 Distribution of 226-Ra232-Th and 40-K in soils of Rio Grande do Norte (Brazil) Journal of En-vironmental Radioactivity 30 55ndash67
May RM 1981 Patterns in multi-species communities Pages 197ndash227 in MayRM ed Theoretical Ecology Principles and Applications OxfordBlackwell
McAlister D 1879 The law of the geometric mean Proceedings of the RoyalSociety 29 367ndash376
Ott WR 1978 Environmental Indices Ann Arbor (MI) Ann Arbor SciencePowers L 1936 The nature of the interaction of genes affecting four quan-
titative characters in a cross between Hordeum deficiens and H vulgareGenetics 21 398ndash420
Preston FW 1948 The commonness and rarity of species Ecology 29254ndash283
mdashmdashmdash 1962 The canonical distribution of commonness and rarity Ecol-ogy 43 185ndash215 410ndash432
mdashmdashmdash 1981 Pseudo-log-normal distributions Ecology 62 355ndash364Razumovsky NK 1940 Distribution of metal values in ore deposits Comptes
Rendus (Doklady) de lrsquoAcadeacutemie des Sciences de lrsquoURSS 9 814ndash816Renner E 1970 Mathematisch-statistische Methoden in der praktischen
Anwendung Hamburg (Germany) PareyRhew CR Miller RB Weiss RF 2000 Natural methyl bromide and methyle
chloride emissions from coastal salt marshes Nature 403 292ndash295Romero RA Sutton TB 1997 Sensitivity of Mycosphaerella fijiensis causal
agent of black sigatoka of banana to propiconozole Phytopathology 8796ndash100
Sachs L 1997 Angewandte StatistikAnwendung statistischer Methoden Hei-delberg (Germany) Springer
Sartwell PE 1950 The distribution of incubation periods of infectious dis-ease American Journal of Hygiene 51 310ndash318
mdashmdashmdash 1952 The incubation period of poliomyelitis American Journal ofPublic Health and the Nationrsquos Health 42 1403ndash1408
mdashmdashmdash 1966 The incubation period and the dynamics of infectious diseaseAmerican Journal of Epidemiology 83 204ndash216
Sinnot EW 1937 The relation of gene to character in quantitative inheritanceProceedings of the National Academy of Sciences 23 224ndash227
Snedecor GW Cochran WG 1989 Statistical Methods Ames (IA) Iowa Uni-versity Press
Statistisches Jahrbuch der Schweiz 1997 Zuumlrich (Switzerland) Verlag NeueZuumlricher Zeitung
Stehmann C De Waard MA 1996 Sensitivity of populations of Botrytis cinereato triazoles benomyl and vinclozolin European Journal of Plant Pathol-ogy 102 171ndash180
Sugihara G 1980 Minimal community structure An explanation of speciesabundunce patterns American Naturalist 116 770ndash786
Swoboda H 1974 Knaurs Buch der Modernen Statistik Muumlnchen (Germany)Droemer Knaur
van der Heijden P 2000 Jacob Cornelius Kapteyn (1851ndash1922) A Short Bio-graphy (16 May 2001 wwwstrwleidenunivnl~heijdenkapteynbiohtml)
Weber H1834 De pulsa resorptione auditu et tactu Annotationes anatom-icae et physiologicae Leipzig (Germany) Koehler
Williams CB 1940 A note on the statistical analysis of sentence length as acriterion of literary style Biometrika 31 356ndash361
342 BioScience May 2001 Vol 51 No 5
Articles
Some basic principles of additive and multiplicativeeffects can easily be demonstrated with the help of twoordinary dice with sides numbered from 1 to 6 Adding thetwo numbers which is the principle of most games leads tovalues from 2 to 12 with a mean of 7 and a symmetricalfrequency distribution The total range can be described as7 plus or minus 5 (that is 7 plusmn 5) where in this case 5 is notthe standard deviation Multiplying the two numbers how-ever leads to values between 1 and 36 with a highly skeweddistribution The total variability can be described as 6 mul-tiplied or divided by 6 (or 6 times 6) In this case the symme-try has moved to the multiplicative level
Although these examples are neither normal nor log-normal distributions they do clearly indicate that additiveand multiplicative effects give rise to different distributionsThus we cannot describe both types of distribution in thesame way Unfortunately however common belief has itthat quantitative variability is generally bell shaped andsymmetrical The current practice in science is to use sym-metrical bars in graphs to indicate standard deviations orerrors and the sign plusmn to summarize data even though thedata or the underlying principles may suggest skewed dis-tributions (Factor et al 2000 Keesing 2000 Le Naour et al2000 Rhew et al 2000) In a number of cases the variabili-ty is clearly asymmetrical because subtracting three stan-dard deviations from the mean produces negative values asin the example 100 plusmn 50 Moreover the example of the diceshows that the established way to characterize symmetricaladditive variability with the sign plusmn (plus or minus) has itsequivalent in the handy sign times (times or divided by) whichwill be discussed further below
Log-normal distributions are usually characterized interms of the log-transformed variable using as parametersthe expected value or mean of its distribution and thestandard deviation This characterization can be advanta-
geous as by definition log-normal distribu-tions are symmetrical again at the log level
Unfortunately the widespread aversion tostatistics becomes even more pronounced assoon as logarithms are involved This may bethe major reason that log-normal distribu-tions are so little understood in generalwhich leads to frequent misunderstandingsand errors Plotting the data can help butgraphs are difficult to communicate orally Inshort current ways of handling log-normaldistributions are often unwieldy
To get an idea of a sample most peopleprefer to think in terms of the originalrather than the log-transformed data Thisconception is indeed feasible and advisablefor log-normal data too because the famil-iar properties of the normal distributionhave their analogies in the log-normal dis-tribution To improve comprehension oflog-normal distributions to encourage
their proper use and to show their importance in life wepresent a novel physical model for generating log-normaldistributions thus filling a 100-year-old gap We alsodemonstrate the evolution and use of parameters allowingcharacterization of the data at the original scaleMoreover we compare log-normal distributions from avariety of branches of science to elucidate patterns of vari-ability thereby reemphasizing the importance of log-normal distributions in life
A physical model demonstrating thegenesis of log-normal distributionsThere was reason for Galton (1889) to complain about col-leagues who were interested only in averages and ignored ran-dom variability In his thinking variability was even part ofthe ldquocharms of statisticsrdquo Consequently he presented a sim-ple physical model to give a clear visualization of binomial andfinally normal variability and its derivation
Figure 2a shows a further development of this ldquoGaltonboardrdquo in which particles fall down a board and are devi-ated at decision points (the tips of the triangular obstacles)either left or right with equal probability (Galton used sim-ple nails instead of the isosceles triangles shown here so hisinvention resembles a pinball machine or the Japanese gamePachinko) The normal distribution created by the board re-flects the cumulative additive effects of the sequence of de-cision points
A particle leaving the funnel at the top meets the tip of thefirst obstacle and is deviated to the left or right by a distancec with equal probability It then meets the corresponding tri-angle in the second row and is again deviated in the same man-ner and so forth The deviation of the particle from one rowto the next is a realization of a random variable with possiblevalues +c and ndashc and with equal probability for both of themFinally after passing r rows of triangles the particle falls into
Figure 1 Examples of normal and log-normal distributions While thedistribution of the heights of 1052 women (a in inches Snedecor andCochran 1989) fits the normal distribution with a goodness of fit p value of075 that of the content of hydroxymethylfurfurol (HMF mgmiddotkgndash1) in 1573honey samples (b Renner 1970) fits the log-normal (p = 041) but not thenormal (p = 00000) Interestingly the distribution of the heights of womenfits the log-normal distribution equally well (p = 074)
height
fre
que
ncy
050
100
150
200
55 60 65 70
(a)
concentration
0
0 10 20 30 40
(b)
10
0 2
00 300 4
00
May 2001 Vol 51 No 5 BioScience 343
Articles
one of the r + 1 receptacles at the bottom The probabilitiesof ending up in these receptacles numbered 0 1r followa binomial law with parameters r and p = 05When many par-ticles have made their way through the obstacles the height ofthe particles piled up in the several receptacles will be ap-proximately proportional to the binomial probabilities
For a large number of rows the probabilities approach anormal density function according to the central limit theo-rem In its simplest form this mathematical law states that thesum of many (r) independent identically distributed randomvariables is in the limit as r normally distributed There-fore a Galton board with many rows of obstacles shows nor-mal density as the expected height of particle piles in the re-ceptacles and its mechanism captures the idea of a sum of rindependent random variables
Figure 2b shows how Galtonrsquos construction was modifiedto describe the distribution of a product of such variableswhich ultimately leads to a log-normal distribution To thisaim scalene triangles are needed (although they appear to beisosceles in the figure) with the longer side to the right Letthe distance from the left edge of the board to the tip of thefirst obstacle below the funnel be xm The lower corners of the
first triangle are at xm middot c and xmc (ignoring the gap neces-sary to allow the particles to pass between the obstacles)Therefore the particle meets the tip of a triangle in the nextrow at X = xm middot c or X = xm c with equal probabilities for bothvalues In the second and following rows the triangles withthe tip at distance x from the left edge have lower corners atx middot c and xc (up to the gap width) Thus the horizontal po-sition of a particle is multiplied in each row by a random vari-able with equal probabilities for its two possible values c and1c
Once again the probabilities of particles falling into any re-ceptacle follow the same binomial law as in Galtonrsquos device but because the receptacles on the right are widerthan those on the left the height of accumulated particles isa ldquohistogramrdquo skewed to the left For a large number of rowsthe heights approach a log-normal distribution This followsfrom the multiplicative version of the central limit theoremwhich proves that the product of many independent identi-cally distributed positive random variables has approxi-mately a log-normal distribution Computer implementationsof the models shown in Figure 2 also are available at the Website httpstatethzchvislog-normal (Gut et al 2000)
Figure 2 Physical models demonstrating the genesis of normal and log-normal distributions Particles fall from a funnelonto tips of triangles where they are deviated to the left or to the right with equal probability (05) and finally fall intoreceptacles The medians of the distributions remain below the entry points of the particles If the tip of a triangle is atdistance x from the left edge of the board triangle tips to the right and to the left below it are placed at x + c and x ndash c for the normal distribution (panel a) and x middot c and x c for the log-normal (panel b patent pending) c and c beingconstants The distributions are generated by many small random effects (according to the central limit theorem) that areadditive for the normal distribution and multiplicative for the log-normal We therefore suggest the alternative namemultiplicative normal distribution for the latter
ba
344 BioScience May 2001 Vol 51 No 5
Articles
J C Kapteyn designed the direct predecessor of the log-normal machine (Kapteyn 1903 Aitchison and Brown 1957)For that machine isosceles triangles were used instead of theskewed shape described here Because the trianglesrsquo width isproportional to their horizontal position this model alsoleads to a log-normal distribution However the isoscelestriangles with increasingly wide sides to the right of the en-try point have a hidden logical disadvantage The median ofthe particle flow shifts to the left In contrast there is no suchshift and the median remains below the entry point of the par-ticles in the log-normal board presented here (which wasdesigned by author E L) Moreover the isosceles triangles in
the Kapteyn board create additive effectsat each decision point in contrast to themultiplicative log-normal effects ap-parent in Figure 2b
Consequently the log-normal boardpresented here is a physical representa-tion of the multiplicative central limittheorem in probability theory
Basic properties of log-normal distributionsThe basic properties of log-normal dis-tribution were established long ago(Weber 1834 Fechner 1860 1897 Gal-ton 1879 McAlister 1879 Gibrat 1931Gaddum 1945) and it is not difficult tocharacterize log-normal distributions
mathematicallyA random variable X is said to be log-normallydistributed if log(X) is normally distributed (see the box onthe facing page) Only positive values are possible for thevariable and the distribution is skewed to the left (Figure 3a)
Two parameters are needed to specify a log-normal distri-bution Traditionally the mean micro and the standard deviation
(or the variance 2) of log(X) are used (Figure 3b) How-ever there are clear advantages to using ldquoback-transformedrdquovalues (the values are in terms of x the measured data)(1) micro = e micro = e
We then use X (micro ) as a mathematical expressionmeaning that X is distributed according to the log-normal law
with median micro and multiplicative stan-dard deviation
The median of this log-normal dis-tribution is med(X) = micro = e micro since microis the median of log(X) Thus the prob-ability that the value of X is greaterthan micro is 05 as is the probability thatthe value is less than micro The parame-ter which we call multiplicativestandard deviation determines theshape of the distribution Figure 4shows density curves for some selectedvalues of Note that micro is a scale pa-rameter hence if X is expressed in dif-ferent units (or multiplied by a con-stant for other reasons) then microchanges accordingly but remainsthe same
Distributions are commonly char-acterized by their expected value micro andstandard deviation In applications forwhich the log-normal distribution ad-equately describes the data these pa-rameters are usually less easy to inter-pret than the median micro (McAlister1879) and the shape parameter It isworth noting that is related to the
Figure 3 A log-normal distribution with original scale (a) and with logarithmicscale (b) Areas under the curve from the median to both sides correspond to one andtwo standard deviation ranges of the normal distribution
den
sity
original scalemicro micro times
micro = 100 = 2
(a)
00
005
0 50 100 200 300 400
den
sity
01
10 15 20 25 30log scale
micro= 2 = 0301
micro micro+
(b)
Figure 4 Density functions of selected log-normal distributions compared with anormal distribution Log-normal distributions (micro ) shown for five values ofmultiplicative standard deviation s are compared with the normal distribution (100 plusmn 20 shaded) The values cover most of the range evident in Table 2 Whilethe median micro is the same for all densities the modes approach zero with increasingshape parameters A change in micro affects the scaling in horizontal and verticaldirections but the essential shape remains the same
dens
ity
1215204080
00
01
00
2
0 50 100 150 200 250
(b)(a)
May 2001 Vol 51 No 5 BioScience 345
Articles
coefficient of variation by a monotonic increasing transfor-mation (see the box below eq 2)
For normally distributed data the interval micro plusmn covers aprobability of 683 while micro plusmn 2 covers 955 (Table 1)The corresponding statements for log-normal quantities are
[micro micro ] = micro x (contains 683) and[micro ( )2 micro ( )2] = micro x ( )2 (contains 955)This characterization shows that the operations of multi-
plying and dividing which we denote with the sign times (timesdivide) help to determine useful intervals for log-normal distributions (Figure 3) in the same way that theoperations of adding and subtracting (plusmn or plusminus) dofor normal distributions Table 1 summarizes and comparessome properties of normal and log-normal distributions
The sum of several independent normal variables is itselfa normal random variable For quantities with a log-normaldistribution however multiplication is the relevant operationfor combining them in most applications for example theproduct of concentrations determines the speed of a simple
chemical reaction The product of independent log-normalquantities also follows a log-normal distribution The medianof this product is the product of the medians of its factors Theformula for of the product is given in the box below (eq 3)
For a log-normal distribution the most precise (ieasymptotically most efficient) method for estimating the pa-rameters micro and relies on log transformation The meanand empirical standard deviation of the logarithms of the dataare calculated and then back-transformed as in equation 1These estimators are called x and s where x is the geometric mean of the data (McAlister 1879 eq 4 in the boxbelow) More robust but less efficient estimates can be obtainedfrom the median and the quartiles of the data as describedin the box below
As noted previously it is not uncommon for data with alog-normal distribution to be characterized in the literatureby the arithmetic mean x and the standard deviation s of asample but it is still possible to obtain estimates for micro and
Definition and properties of the log-normal distribution
A random variable X is log-normally distributed if log(X) has a normal distribution Usually natural logarithms are used but other bases would lead to thesame family of distributions with rescaled parameters The probability density function of such a random variable has the form
A shift parameter can be included to define a three-parameter family This may be adequate if the data cannot be smaller than a certain bound differentfrom zero (cf Aitchison and Brown 1957 page 14) The mean and variance are exp(micro + 2) and (exp( 2) ndash 1)exp(2micro+ 2) respectively and thereforethe coefficient of variation is
t
which is a function in only
The product of two independent log-normally distributed random variables has the shape parameter
since the variances at the log-transformed variables add
Estimation The asymptotically most efficient (maximum likelihood) estimators are
cv =
(4)
-
-
The quartiles q1 and q2 lead to a more robust estimate (q1q2)c for s where 1c = 1349 = 2 middot ndash1 (075) ndash1 denoting the inversestandard normal distribution function If the mean x and the standard deviation s of a sample are available ie the data is summa-rized in the form x plusmn s the parameters micro and s can be estimated from them by usingrespectively with cv = coefficient of variation Thus this estimate of s is determined only by the cv (eq 2)
and-
(3)
(2)
346 BioScience May 2001 Vol 51 No 5
Articles
(see the box on page 345) For example Stehmann andDe Waard (1996) describe their data as log-normal with thearithmetic mean x and standard deviation s as 41 plusmn 37Taking the log-normal nature of the distribution into ac-count the probability of the corresponding x plusmn s interval(04 to 78) turns out to be 884 instead of 683 More-over 65 of the population are below the mean and almostexclusively within only one standard deviation In contrastthe proposed characterization which uses the geometricmean x and the multiplicative standard deviation s reads30 x 22 (136 to 66) This interval covers approximately68 of the data and thus is more appropriate than theother interval for the skewed data
Comparing log-normal distributionsacross the sciencesExamples of log-normal distributions from various branch-es of science reveal interesting patterns (Table 2) In gener-al values of s vary between 11 and 33 with most in therange of approximately 14 to 3 The shapes of such distrib-utions are apparent by comparison with selected instancesshown in Figure 4
Geology and mining In the Earthrsquos crust the concen-tration of elements and their radioactivity usually follow a log-normal distribution In geology values of s in 27 examplesvaried from 117 to 56 (Razumovsky 1940 Ahrens 1954Malanca et al 1996) nine other examples are given in Table2 A closer look at extensive data from different reefs (Krige1966) indicates that values of s for gold and uranium increasein concert with the size of the region considered
Human medicine A variety of examples from medicinefit the log-normal distribution Latent periods (time from in-fection to first symptoms) of infectious diseases have often
been shown to be log-normally dis-tributed (Sartwell 1950 1952 1966Kondo 1977) approximately 70 of86 examples reviewed by Kondo (1977)appear to be log-normal Sartwell(1950 1952 1966) documents 37 casesfitting the log-normal distribution Aparticularly impressive one is that of5914 soldiers inoculated on the sameday with the same batch of faulty vac-cine 1005 of whom developed serumhepatitis
Interestingly despite considerabledifferences in the median x of la-tency periods of various diseases (rang-ing from 23 hours to several monthsTable 2) the majority of s values wereclose to 15 It might be worth trying toaccount for the similarities and dis-similarities in s For instance the smalls value of 124 in the example of the
Scottish soldiers may be due to limited variability within thisrather homogeneous group of people Survival time after di-agnosis of four types of cancer is compared with latent pe-riods of infectious diseases much more variable with s val-ues between 25 and 32 (Boag 1949 Feinleib and McMahon1960) It would be interesting to see whether x and s val-ues have changed in accord with the changes in diagnosis andtreatment of cancer in the last half century The age of onsetof Alzheimerrsquos disease can be characterized with the geo-metric mean x of 60 years and s of 116 (Horner 1987)
Environment The distribution of particles chemicalsand organisms in the environment is often log-normal Forexample the amounts of rain falling from seeded and un-seeded clouds differed significantly (Biondini 1976) andagain s values were similar (seeding itself accounts for thegreater variation with seeded clouds) The parameters forthe content of hydroxymethylfurfurol in honey (see Figure 1b)show that the distribution of the chemical in 1573 samples canbe described adequately with just the two values Ott (1978)presented data on the Pollutant Standard Index a measure ofair quality Data were collected for eight US cities the extremesof x and s were found in Los Angeles Houston and Seat-tle allowing interesting comparisons
Atmospheric sciences and aerobiology Another com-ponent of air quality is its content of microorganisms whichwasmdashnot surprisinglymdashmuch higher and less variable inthe air of Marseille than in that of an island (Di Giorgio et al1996) The atmosphere is a major part of life support systemsand many atmospheric physical and chemical properties follow a log-normal distribution law Among other examplesare size distributions of aerosols and clouds and parametersof turbulent processes In the context of turbulence the
Table 1 A bridge between normal and log-normal distributions
Normal distribution Log-normal distribution(Gaussian or additive (Multiplicative
Property normal distribution) normal distribution)
Effects (central limit theorem) Additive MultiplicativeShape of distribution Symmetrical SkewedModels
Triangle shape Isosceles ScaleneEffects at each decision point x x plusmn c x x c
CharacterizationMean x Arithmetic macrx GeometricStandard deviation s Additive s MultiplicativeMeasure of dispersion cv = sx sInterval of confidence
683 x plusmn s x x s955 x plusmn 2s x x (s)2
997 x plusmn 3s x x (s)3
Notes cv = coefficient of variation x = timesdivide corresponding to plusminus for the established sign plusmn
May 2001 Vol 51 No 5 BioScience 347
Articles
Table 2 Comparing log-normal distributions across the sciences in terms of the original data x is an estimator of themedian of the distribution usually the geometric mean of the observed data and s estimates the multiplicative standarddeviation the shape parameter of the distribution 68 of the data are within the range of x x s and 95 withinx x (s)2 In general values of s and some of x were obtained by transformation from the parameters given in theliterature (cf Table 3) The goodness of fit was tested either by the original authors or by us
Discipline and type of measurement Example n x s Reference
Geology and miningConcentration of elements Ga in diabase 56 17 mg middot kgndash1 117 Ahrens 1954
Co in diabase 57 35 mg middot kgndash1 148 Ahrens 1954Cu 688 037 267 Razumovsky 1940Cr in diabase 53 93 mg middot kgndash1 560 Ahrens 1954226Ra 52 254 Bq middot kgndash1 170 Malanca et al 1996Au small sections 100 (20 inch-dwt)a 139 Krige 1966
large sections 75000 na 242 Krige 1966U small sections 100 (25 inch-lb)a 135 Krige 1966
large sections 75000 na 235 Krige 1966Human medicineLatency periods of diseases Chicken pox 127 14 days 114 Sartwell 1950
Serum hepatitis 1005 100 days 124 Sartwell 1950Bacterial food poisoning 144 23 hours 148 Sartwell 1950Salmonellosis 227 24 days 147 Sartwell 1950Poliomyelitis 8 studies 258 126 days 150 Sartwell 1952Amoebic dysentery 215 214 days 211 Sartwell 1950
Survival times after cancer Mouth and throat cancer 338 96 months 250 Boag 1949diagnosis Leukemia myelocytic (female) 128 159 months 280 Feinleib and McMahon 1960
Leukemia lymphocytic (female) 125 172 months 321 Feinleib and McMahon 1960Cervix uteri 939 145 months 302 Boag 1949
Age of onset of a disease Alzheimer 90 60 years 116 Horner 1987
EnvironmentRainfall Seeded 26 211600 m3 490 Biondini 1976
Unseeded 25 78470 m3 429 Biondini 1976HMF in honey Content of hydroxymethylfurfurol 1573 556 g kgndash1 277 Renner 1970Air pollution (PSI) Los Angeles CA 364 1099 PSI 150 Ott 1978
Houston TX 363 491 PSI 185 Ott 1978Seattle WA 357 396 PSI 158 Ott 1978
AerobiologyAirborne contamination by Bacteria in Marseilles na 630 cfu mndash3 196 Di Giorgio et al 1996
bacteria and fungi Fungi in Marseilles na 65 cfu mndash3 230 Di Giorgio et al 1996Bacteria on Porquerolles Island na 22 cfu mndash3 317 Di Giorgio et al 1996Fungi on Porquerolles Island na 30 cfu mndash3 257 Di Giorgio et al 1996
PhytomedicineFungicide sensitivity EC50 Untreated area 100 00078 microg middot mlndash1 ai 185 Romero and Sutton 1997Banana leaf spot Treated area 100 0063 microg middot mlndash1 ai 242 Romero and Sutton 1997
After additional treatment 94 027 microg middot mlndash1 ai gt358 Romero and Sutton 1997Powdery mildew on barley Spain (untreated area) 20 00153 microg middot mlndash1 ai 129 Limpert and Koller 1990
England (treated area) 21 685 microg middot mlndash1 ai 168 Limpert and Koller 1990
Plant physiologyPermeability and Citrus aurantiumH2OLeaf 73 158 10ndash10 m sndash1 118 Baur 1997
solute mobility (rate of Capsicum annuumH2OCM 149 269 10ndash10 m sndash1 130 Baur 1997constant desorption) Citrus aurantium24ndashDCM 750 741 10ndash7 1 sndash1 140 Baur 1997
Citrus aurantiumWL110547CM 46 26310ndash7 1 sndash1 164 Baur 1997Citrus aurantium24ndashDCM 16 na 138 Baur 1997Citrus aurantium24ndashDCM + acc1 16 na 117 Baur 1997Citrus aurantium24ndashDCM 19 na 156 Baur 1997Citrus aurantium24ndashDCM + acc2 19 na 103 Baur 1997
EcologySpecies abundance Diatoms (150 species) na 121 isp 568 May 1981
Plants (coverage per species) na 04 739 Magurran 1988Fish (87 species) na 293 1182 Magurran 1988Birds (142 species) na na 3315 Preston 1962Moths in England (223 species) 15609 175 isp 866 Preston 1948Moths in Maine (330 species) 56131 195 isp 1067 Preston 1948Moths in Saskatchewan (277 species) 87110 na 2514 Preston 1948
Food technologySize of unit Crystals in ice cream na 15 microm 15 Limpert et al 2000b
(mean diameter) Oil drops in mayonnaise na 20 microm 2 Limpert et al 2000bPores in cocoa press cake na 10 microm 15ndash2 Limpert et al 2000b
348 BioScience May 2001 Vol 51 No 5
Articles
size of which is distributed log-normally (Limpert et al2000b)
Phytomedicine and microbiology Examples frommicrobiology and phytomedicine include the distributionof sensitivity to fungicides in populations and distribution ofpopulation size Romero and Sutton (1997) analyzed thesensitivity of the banana leaf spot fungus (Mycosphaerella fijiensis) to the fungicide propiconazole in samples from untreated and treated areas in Costa Rica The differences inx and s among the areas can be explained by treatment his-tory The s in untreated areas reflects mostly environmen-tal conditions and stabilizing selection The increase in s af-ter treatment reflects the widened spectrum of sensitivitywhich results from the additional selection caused by use ofthe chemical
Similar results were obtained for the barley mildewpathogen Blumeria (Erysiphe) graminis f sp hordei and thefungicide triadimenol (Limpert and Koller 1990) whereagain s was higher in the treated region Mildew in Spainwhere triadimenol had not been used represented the orig-inal sensitivity In contrast in England the pathogen was of-ten treated and was consequently highly resistant differing bya resistance factor of close to 450 (x England x Spain)To obtain the same control of the resistant population thenthe concentration of the chemical would have to be increasedby this factor
The abundance of bacteria on plants varies among plantspecies type of bacteria and environment and has beenfound to be log-normally distributed (Hirano et al 1982Loper et al 1984) In the case of bacterial populations on theleaves of corn (Zea mays) the median population size (x ) increased from July and August to October but the rel-ative variability expressed (s) remained nearly constant (Hi-
rano et al 1982) Interestingly whereas s for the total num-ber of bacteria varied little (from 126 to 20) that for the sub-group of ice nucleation bacteria varied considerably (from 375to 804)
Plant physiology Recently convincing evidence was pre-sented from plant physiology indicating that the log-normaldistribution fits well to permeability and to solute mobility inplant cuticles (Baur 1997) For the number of combinationsof species plant parts and chemical compounds studiedthe median s for water permeability of leaves was 118 Thecorresponding s of isolated cuticles 130 appears to be con-siderably higher presumably because of the preparation of cu-ticles Again s was considerably higher for mobility of theherbicides Dichlorophenoxyacetic acid (24-D) and WL110547(1-(3-fluoromethylphenyl)-5-U-14C-phenoxy-1234-tetra-zole) One explanation for the differences in s for water andfor the other chemicals may be extrapolated from resultsfrom food technology where for transport through filters sis smaller for simple (eg spherical) particles than for morecomplex particles such as rods (E J Windhab [Eidgenoumls-sische Technische Hochschule Zurich Switzerland] per-sonal communication 2000)
Chemicals called accelerators can reduce the variability ofmobility For the combination of Citrus aurantium cuticles and24-D diethyladipate (accelerator 1) caused s to fall from 138to 117 For the same combination tributylphosphate (ac-celerator 2) caused an even greater decrease from 156 to 103Statistical reasoning suggests that these data with s values of117 and 103 are normally distributed (Baur 1997) Howeverbecause the underlying principles of permeability remainthe same we think these cases represent log-normal distrib-utions Thus considering only statistical reasons may lead tomisclassification which may handicap further analysis One
Table 2 (continued from previous page)
Discipline and typeof measurement Example n x s Reference
LinguisticsLength of spoken words in Different words 738 505 letters 147 Herdan 1958
phone conversation Total occurrence of words 76054 312 letters 165 Herdan 1958Length of sentences G K Chesterton 600 235 words 158 Williams 1940
G B Shaw 600 245 words 195 Williams 1940Social sciences and economicsAge of marriage Women in Denmark 1970s 30200 (124)a 107 years 169 Preston 1981Farm size in England 1939 na 272 hectares 255 Allanson 1992
and Wales 1989 na 377 hectares 290 Allanson 1992Income Households of employees in 17x106 sFr 6726 154 Statistisches Jahrbuch der
Switzerland 1990 Schweiz 1997
a The shift parameter of a three-parameter log-normal distribution
Notes na = not available PSI = Pollutant Standard Index acc = accelerator isp = individuals per species ai = active ingredient andcfu = colony forming units
May 2001 Vol 51 No 5 BioScience 349
Articles
question remains What are the underlying principles of per-meability that cause log-normal variability
Ecology In the majority of plant and animal communitiesthe abundance of species follows a (truncated) log-normal dis-tribution (Sugihara 1980 Magurran 1988) Interestingly therange of s for birds fish moths plants or diatoms was veryclose to that found within one group or another Based on thedata and conclusions of Preston (1948) we determined themost typical value of s to be 116 1
Food technology Various applications of the log-normaldistribution are related to the characterization of structuresin food technology and food process engineering Such dis-perse structures may be the size and frequency of particlesdroplets and bubbles that are generated in dispersingprocesses or they may be the pores in filtering membranesThe latter are typically formed by particles that are also log-normally distributed in diameter Such particles can also begenerated in dry or wet milling processes in which log-normal distribution is a powerful approximation The ex-amples of ice cream and mayonnaise given in Table 2 also pointto the presence of log-normal distributions in everyday life
Linguistics In linguistics the number of letters per wordand the number of words per sentence fit the log-normal dis-tribution In English telephone conversations the variabilitys of the length of all words usedmdashas well as of differentwordsmdashwas similar (Herdan 1958) Likewise the number ofwords per sentence varied little between writers (Williams1940)
Social sciences and economics Examples of log-normal distributions in the social sciences and economics in-clude age of marriage farm size and income The age of firstmarriage in Western civilization follows a three-parameter log-normal distribution the third parameter corresponds toage at puberty (Preston 1981) For farm size in England and
Wales both x and s increased over 50years the former by 386 (Allanson 1992)For income distributions x and s may fa-cilitate comparisons among societies andgenerations (Aitchison and Brown 1957Limpert et al 2000a)
Typical s valuesOne question arises from the comparison oflog-normal distributions across the sciencesTo what extent are s values typical for a cer-tain attribute In some cases values of s appear to be fairly restricted as is the case for
the range of s for latent periods of diseasesmdasha fact thatSartwell recognized (1950 1952 1966) and Lawrence reem-phasized (1988a) Describing patterns of typical skewness atthe established log level Lawrence (1988a 1988b) can be re-garded as the direct predecessor of our comparison of s val-ues across the sciences Aitchison and Brown (1957) usinggraphical methods such as quantilendashquantile plots and Lorenzcurves demonstrated that log-normal distributions describ-ing for example national income across countries or incomefor groups of occupations within a country show typicalshapes
A restricted range of variation for a specific research ques-tion makes sense For infectious diseases of humans for example the infection processes of the pathogens are similaras is the genetic variability of the human population The sameappears to hold for survival time after diagnosis of cancer al-though the value of s is higher this can be attributed to theadditional variation caused by cancer recognition and treat-ment Other examples with typical ranges of s come from lin-guistics For bacteria on plant surfaces the range of variationof total bacteria is smaller than that of a group of bacteriawhich can be expected because of competition Thus theranges of variation in these cases appear to be typical andmeaningful a fact that might well stimulate future research
Future challengesA number of scientific areasmdashand everyday lifemdashwill presentopportunities for new comparisons and for more far-reaching analyses of s values for the applications consideredto date Moreover our concept can be extended also to de-scriptions based on sigmoid curves such as for exampledosendashresponse relationships
Further comparisons of s values Permeability and mo-bility are important not only for plant physiology (Baur1997) but also for many other fields such as soil sciences andhuman medicine as well as for some industrial processes Withthe help of x and s the mobility of different chemicalsthrough a variety of natural membranes could easily be as-sessed allowing for comparisons of the membranes with oneanother as well as with those for filter actions of soils or withtechnical membranes and filters Such comparisons will un-doubtedly yield valuable insights
1Species abundance may be described by a log-normal law (Preston 1948)usually written in the form S(R) = S0 middot exp(ndasha2R2) where S0 is the numberof species at the mode of the distribution The shape parameter a amountsto approximately 02 for all species which corresponds to s = 116
Table 3 Established methods for describing log-normal distributions
Characterization Disadvantages
Graphical methodsDensity plots histograms box plots Spacey difficult to describe and compare
Indication of parametersLogarithm of X mean median Unclear which base of the logarithm should bestandard deviation variance chosen parameters are not on the scale of the
original data and values are difficult to interpret and use for mental calculations
Skewness and curtosis of X Difficult to estimate and interpret
350 BioScience May 2001 Vol 51 No 5
Articles
Farther-reaching analyses An adequate description ofvariability is a prerequisite for studying its patterns and esti-mating variance components One component that deservesmore attention is the variability arising from unknown rea-sons and chance commonly called error variation or in thiscase sE Such variability can be estimated if other conditionsaccounting for variabilitymdashthe environment and genetics forexamplemdashare kept constant The field of population genet-ics and fungicide sensitivity as well as that of permeability andmobility can demonstrate the benefits of analyses of variance
An important parameter of population genetics is migra-tion Migration among regions leads to population mixingthus widening the spectrum of fungicide sensitivity encoun-tered in any one of the regions mentioned in the discussionof phytomedicine and microbiology Population mixingamong regions will increase s but decrease the difference inx Migration of spores appears to be greater for instancein regions of Costa Rica than in those of Europe (Limpert etal 1996 Romero and Sutton 1997 Limpert 1999)
Another important aim of pesticide research is to esti-mate resistance risk As a first approximation resistance riskis assumed to correlate with s However s depends on ge-netic and other causes of variability Thus determining its ge-netic part s G is a task worth undertaking because genetic variation has a major impact on future evolution (Limpert1999) Several aspects of various branches of science areexpected to benefit from improved identification of com-ponents of s In the study of plant physiology and perme-ability noted above (Baur 1997) for example determiningthe effects of accelerators and their share of variability wouldbe elucidative
Sigmoid curves based on log-normal distributionsDosendashresponse relations are essential for understandingthe control of pests and pathogens (Horsfall 1956) Equallyimportant are dosendashresponse curves that demonstrate theeffects of other chemicals such as hormones or mineralsTypically such curves are sigmoid and show the cumulativeaction of the chemical If plotted against the logarithm ofthe chemical dose the sigmoid is symmetrical and corre-sponds to the cumulative curve of the log-normal distrib-ution at logarithmic scale (Figure 3b) The steepness ofthe sigmoid curve is inversely proportional to s and thegeometric mean value x equals the ldquoED50rdquo the chemicaldose creating 50 of the maximal effect Considering thegeneral importance of chemical sensitivity a wide field offurther applications opens up in which progress can be ex-pected and in which researchers may find the proposedcharacterization x xs advantageous
Normal or log-normalConsidering the patterns of normal and log-normal distrib-utions further as well as the connections and distinctions be-tween them (Tables 1 3) is useful for describing and ex-plaining phenomena relating to frequency distributions in lifeSome important aspects are discussed below
The range of log-normal variability How far can svalues extend beyond the range described from 11 to 33 Toward the high end of the scale of possible s values we foundone s larger than 150 for hail energy of clouds (Federer et al1986 calculations by W A S) Values below 12 may even becommon and therefore of great interest in science How-ever such log-normal distributions are difficult to distin-guish from normal onesmdashsee Figures 1 and 3mdashand thusuntil now have usually been taken to be normal
Because of the general preference for the normal distrib-ution we were asked to find examples of data that followeda normal distribution but did not match a log-normal dis-tribution Interestingly original measurements did not yieldany such examples As noted earlier even the classic exam-ple of the height of women (Figure 1a Snedecor and Cochran1989) fits both distributions equally well The distribution canbe characterized with 6254 inches plusmn 238 and 6248 inchestimes 1039 respectively The examples that we found of nor-mallymdashbut not log-normallymdashdistributed data consistedof differences sums means or other functions of originalmeasurements These findings raise questions about the roleof symmetry in quantitative variation in nature
Why the normal distribution is so popular Re-gardless of statistical considerations there are a number of rea-sons why the normal distribution is much better known thanthe log-normal A major one appears to be symmetry one ofthe basic principles realized in nature as well as in our cultureand thinking Thus probability distributions based on sym-metry may have more inherent appeal than skewed onesTwo other reasons relate to simplicity First as Aitchison andBrown (1957 p 2) stated ldquoMan has found addition an eas-ier operation than multiplication and so it is not surprisingthat an additive law of errors was the first to be formulatedrdquoSecond the established concise description of a normal sam-plemdashx plusmn smdashis handy well-known and sufficient to representthe underlying distribution which made it easier until nowto handle normal distributions than to work with log-normaldistributions Another reason relates to the history of thedistributions The normal distribution has been known andapplied more than twice as long as its log-normal sister distribution Finally the very notion of ldquonormalrdquo conjuresmore positive associations for nonstatisticians than does ldquolog-normalrdquo For all of these reasons the normal or Gaussiandistribution is far more familiar than the log-normal distri-bution is to most people
This preference leads to two practical ways to make datalook normal even if they are skewed First skewed distribu-tions produce large values that may appear to be outliers Itis common practice to reject such observations and conductthe analysis without them thereby reducing the skewnessbut introducing bias Second skewed data are often groupedtogether and their meansmdashwhich are more normally dis-tributedmdashare used for further analyses Of course followingthat procedure means that important features of the datamay remain undiscovered
May 2001 Vol 51 No 5 BioScience 351
Articles
Why the log-normal distribution is usually thebetter model for original data As discussed above theconnection between additive effects and the normal distribu-tion parallels that of multiplicative effects and the log-normaldistribution Kapteyn (1903) noted long ago that if data fromone-dimensional measurements in nature fit the normal dis-tribution two- and three-dimensional results such as surfacesand volumes cannot be symmetric A number of effects thatpoint to the log-normal distribution as an appropriate modelhave been described in various papers (eg Aitchison andBrown 1957 Koch 1966 1969 Crow and Shimizu 1988) In-terestingly even in biological systematics which is the scienceof classification the number of say species per family was ex-pected to fit log-normality (Koch 1966)
The most basic indicator of the importance of the log-normal distribution may be even more general howeverClearly chemistry and physics are fundamental in life and theprevailing operation in the laws of these disciplines is multi-plication In chemistry for instance the velocity of a simplereaction depends on the product of the concentrations of themolecules involved Equilibrium conditions likewise are gov-erned by factors that act in a multiplicative way From this amajor contrast becomes obvious The reasons governing fre-quency distributions in nature usually favor the log-normalwhereas people are in favor of the normal
For small coefficients of variation normal and log-normaldistributions both fit well For these cases it is natural tochoose the distribution found appropriate for related cases ex-hibiting increased variability which corresponds to the lawgoverning the reasons of variability This will most often bethe log-normal
ConclusionThis article shows in a nutshell the fundamental role of thelog-normal distribution and provides insights for gaining adeeper comprehension of that role Compared with establishedmethods for describing log-normal distributions (Table 3) theproposed characterization by x and s offers several ad-vantages some of which have been described before (Sartwell1950 Ahrens 1954 Limpert 1993) Both x and s describethe data directly at their original scale they are easy to calculateand imagine and they even allow mental calculation and es-timation The proposed characterization does not appear tohave any major disadvantage
On the first page of their book Aitchison and Brown(1957) stated that compared with its sister distributions thenormal and the binomial the log-normal distribution ldquohasremained the Cinderella of distributions the interest of writ-ers in the learned journals being curiously sporadic and thatof the authors of statistical textbooks but faintly arousedrdquoThisis indeed true Despite abundant increasing evidence that log-normal distributions are widespread in the physical biolog-ical and social sciences and in economics log-normal knowl-edge has remained dispersed The question now is this Canwe begin to bring the wealth of knowledge we have on nor-mal and log-normal distributions to the public We feel that
doing so would lead to a general preference for the log-normal or multiplicative normal distribution over the Gauss-ian distribution when describing original data
AcknowledgmentsThis work was supported by a grant from the Swiss FederalInstitute of Technology (Zurich) and by COST (Coordinationof Science and Technology in Europe) at Brussels and BernPatrick Fluumltsch Swiss Federal Institute of Technology con-structed the physical models We are grateful to Roy Snaydonprofessor emeritus at the University of Reading United King-dom to Rebecca Chasan and to four anonymous reviewersfor valuable comments on the manuscript We thank DonnaVerdier and Herman Marshall for getting the paper into goodshape for publication and E L also thanks Gerhard Wenzelprofessor of agronomy and plant breeding at Technical Uni-versity Munich for helpful discussions
Because of his fundamental and comprehensive contri-bution to the understanding of skewed distributions close to100 years ago our paper is dedicated to the Dutch astronomerJacobus Cornelius Kapteyn (van der Heijden 2000)
References citedAhrens LH 1954 The log-normal distribution of the elements (A fundamental
law of geochemistry and its subsidiary) Geochimica et CosmochimicaActa 5 49ndash73
Aitchison J Brown JAC 1957 The Log-normal Distribution Cambridge (UK)Cambridge University Press
Allanson P 1992 Farm size structure in England and Wales 1939ndash89 Jour-nal of Agricultural Economics 43 137ndash148
Baur P 1997 Log-normal distribution of water permeability and organic solutemobility in plant cuticles Plant Cell and Environment 20 167ndash177
Biondini R 1976 Cloud motion and rainfall statistics Journal of Applied Me-teorology 15 205ndash224
Boag JW 1949 Maximum likelihood estimates of the proportion of patientscured by cancer therapy Journal of the Royal Statistical Society B 1115ndash53
Crow EL Shimizu K eds 1988 Log-normal Distributions Theory and Ap-plication New York Dekker
Di Giorgio C Krempff A Guiraud H Binder P Tiret C Dumenil G 1996Atmospheric pollution by airborne microorganisms in the City of Mar-seilles Atmospheric Environment 30 155ndash160
Factor VM Laskowska D Jensen MR Woitach JT Popescu NC Thorgeirs-son SS 2000 Vitamin E reduces chromosomal damage and inhibits he-patic tumor formation in a transgenic mouse model Proceedings of theNational Academy of Sciences 97 2196ndash2201
Fagerstroumlm T Jagers P Schuster P Szathmary E 1996 Biologists put onmathematical glasses Science 274 2039ndash2041
Fechner GT 1860 Elemente der Psychophysik Leipzig (Germany) Bre-itkopf und Haumlrtel
mdashmdashmdash 1897 Kollektivmasslehre Leipzig (Germany) EngelmannFederer B et al 1986 Main results of Grossversuch IV Journal of Climate
and Applied Meteorology 25 917ndash957Feinleib M McMahon B 1960 Variation in the duration of survival of pa-
tients with the chronic leukemias Blood 15ndash16 332ndash349Gaddum JH 1945 Log normal distributions Nature 156 463 747Galton F 1879 The geometric mean in vital and social statistics Proceed-
ings of the Royal Society 29 365ndash367mdashmdashmdash 1889 Natural Inheritance London MacmillanGibrat R 1931 Les Ineacutegaliteacutes Economiques Paris Recueil SireyGroth BHA 1914 The golden mean in the inheritance of size Science 39
581ndash584
352 BioScience May 2001 Vol 51 No 5
Articles
Gut C Limpert E Hinterberger H2000 A computer simulation on the webto visualize the genesis of normal and log-normal distributionshttpstatethzchvislog-normal
Herdan G 1958 The relation between the dictionary distribution and theoccurrence distribution of word length and its importance for the studyof quantitative linguistics Biometrika 45 222ndash228
Hirano SS Nordheim EV Arny DC Upper CD 1982 Log-normal distrib-ution of epiphytic bacterial populations on leaf surfaces Applied and En-vironmental Microbiology 44 695ndash700
Horner RD 1987 Age at onset of Alzheimerrsquos disease Clue to the relative im-portance of etiologic factors American Journal of Epidemiology 126409ndash414
Horsfall JG 1956 Principle of fungicidal actions Chronica Botanica 30Johnson NL Kotz S Balkrishan N 1994 Continuous Univariate Distribu-
tions New York WileyKapteyn JC 1903 Skew Frequency Curves in Biology and Statistics Astro-
nomical Laboratory Groningen (The Netherlands) NoordhoffKeesing F 2000 Cryptic consumers and the ecology of an African Savanna
BioScience 50 205ndash215Koch AL 1966 The logarithm in biology I Mechanisms generating the
log-normal distribution exactly Journal of Theoretical Biology 23276ndash290
mdashmdashmdash 1969 The logarithm in biology II Distributions simulating the log-normal Journal of Theoretical Biology 23 251ndash268
Kondo K 1977 The log-normal distribution of the incubation time of ex-ogenous diseases Japanese Journal of Human Genetics 21 217ndash237
Krige DG 1966 A study of gold and uranium distribution patterns in theKlerksdorp Gold Field Geoexploration 4 43ndash53
Lawrence RJ 1988a The log-normal as eventndashtime distribution Pages211ndash228 in Crow EL Shimizu K eds Log-normal Distributions The-ory and Application New York Dekker
mdashmdashmdash1988b Applications in economics and business Pages 229ndash266 inCrow EL Shimizu K eds Log-normal Distributions Theory and Ap-plication New York Dekker
Lee ET 1992 Statistical Methods for Survival Data Analysis New York Wi-ley
Le Naour F Rubinstein E Jasmin C Prenant M Boucheix C 2000 Severelyreduced female fertility in CD9-deficient mice Science 287 319ndash321
Limpert E 1993 Log-normal distributions in phytomedicine A handy wayfor their characterization and application Proceedings of the 6th Inter-national Congress of Plant Pathology 28 Julyndash6 August 1993 MontrealNational Research Council Canada
mdashmdashmdash 1999 Fungicide sensitivity Towards improved understanding of ge-netic variability Pages 188ndash193 in Modern Fungicides and AntifungalCompounds II Andover (UK) Intercept
Limpert E Koller B 1990 Sensitivity of the Barley Mildew Pathogen to Tri-adimenol in Selected European Areas Zurich (Switzerland) Institute ofPlant Sciences
Limpert E Finckh MR Wolfe MS eds 1996 Integrated Control of CerealMildews and Rusts Towards Coordination of Research Across EuropeBrussels (Belgium) European Commission EUR 16884 EN
Limpert E Fuchs JG Stahel WA 2000a Life is log normal On the charmsof statistics for society Pages 518ndash522 in Haumlberli R Scholz RW Bill AWelti M eds Transdisciplinarity Joint Problem-Solving among Sci-ence Technology and Society Zurich (Switzerland) Haffmans
Limpert E Abbt M Asper R Graber WK Godet F Stahel WA Windhab EJ2000b Life is log normal Keys and clues to understand patterns of mul-tiplicative interactions from the disciplinary to the transdisciplinarylevel Pages 20ndash24 in Haumlberli R Scholz RW Bill A Welti M eds Trans-
disciplinarity Joint Problem-Solving among Science Technology and Society Zurich (Switzerland) Haffmans
Loper JE Suslow TV Schroth MN 1984 Log-normal distribution of bacte-rial populations in the rhizosphere Phytopathology 74 1454ndash1460
Magurran AE 1988 Ecological Diversity and its Measurement LondonCroom Helm
Malanca A Gaidolfi L Pessina V Dallara G 1996 Distribution of 226-Ra232-Th and 40-K in soils of Rio Grande do Norte (Brazil) Journal of En-vironmental Radioactivity 30 55ndash67
May RM 1981 Patterns in multi-species communities Pages 197ndash227 in MayRM ed Theoretical Ecology Principles and Applications OxfordBlackwell
McAlister D 1879 The law of the geometric mean Proceedings of the RoyalSociety 29 367ndash376
Ott WR 1978 Environmental Indices Ann Arbor (MI) Ann Arbor SciencePowers L 1936 The nature of the interaction of genes affecting four quan-
titative characters in a cross between Hordeum deficiens and H vulgareGenetics 21 398ndash420
Preston FW 1948 The commonness and rarity of species Ecology 29254ndash283
mdashmdashmdash 1962 The canonical distribution of commonness and rarity Ecol-ogy 43 185ndash215 410ndash432
mdashmdashmdash 1981 Pseudo-log-normal distributions Ecology 62 355ndash364Razumovsky NK 1940 Distribution of metal values in ore deposits Comptes
Rendus (Doklady) de lrsquoAcadeacutemie des Sciences de lrsquoURSS 9 814ndash816Renner E 1970 Mathematisch-statistische Methoden in der praktischen
Anwendung Hamburg (Germany) PareyRhew CR Miller RB Weiss RF 2000 Natural methyl bromide and methyle
chloride emissions from coastal salt marshes Nature 403 292ndash295Romero RA Sutton TB 1997 Sensitivity of Mycosphaerella fijiensis causal
agent of black sigatoka of banana to propiconozole Phytopathology 8796ndash100
Sachs L 1997 Angewandte StatistikAnwendung statistischer Methoden Hei-delberg (Germany) Springer
Sartwell PE 1950 The distribution of incubation periods of infectious dis-ease American Journal of Hygiene 51 310ndash318
mdashmdashmdash 1952 The incubation period of poliomyelitis American Journal ofPublic Health and the Nationrsquos Health 42 1403ndash1408
mdashmdashmdash 1966 The incubation period and the dynamics of infectious diseaseAmerican Journal of Epidemiology 83 204ndash216
Sinnot EW 1937 The relation of gene to character in quantitative inheritanceProceedings of the National Academy of Sciences 23 224ndash227
Snedecor GW Cochran WG 1989 Statistical Methods Ames (IA) Iowa Uni-versity Press
Statistisches Jahrbuch der Schweiz 1997 Zuumlrich (Switzerland) Verlag NeueZuumlricher Zeitung
Stehmann C De Waard MA 1996 Sensitivity of populations of Botrytis cinereato triazoles benomyl and vinclozolin European Journal of Plant Pathol-ogy 102 171ndash180
Sugihara G 1980 Minimal community structure An explanation of speciesabundunce patterns American Naturalist 116 770ndash786
Swoboda H 1974 Knaurs Buch der Modernen Statistik Muumlnchen (Germany)Droemer Knaur
van der Heijden P 2000 Jacob Cornelius Kapteyn (1851ndash1922) A Short Bio-graphy (16 May 2001 wwwstrwleidenunivnl~heijdenkapteynbiohtml)
Weber H1834 De pulsa resorptione auditu et tactu Annotationes anatom-icae et physiologicae Leipzig (Germany) Koehler
Williams CB 1940 A note on the statistical analysis of sentence length as acriterion of literary style Biometrika 31 356ndash361
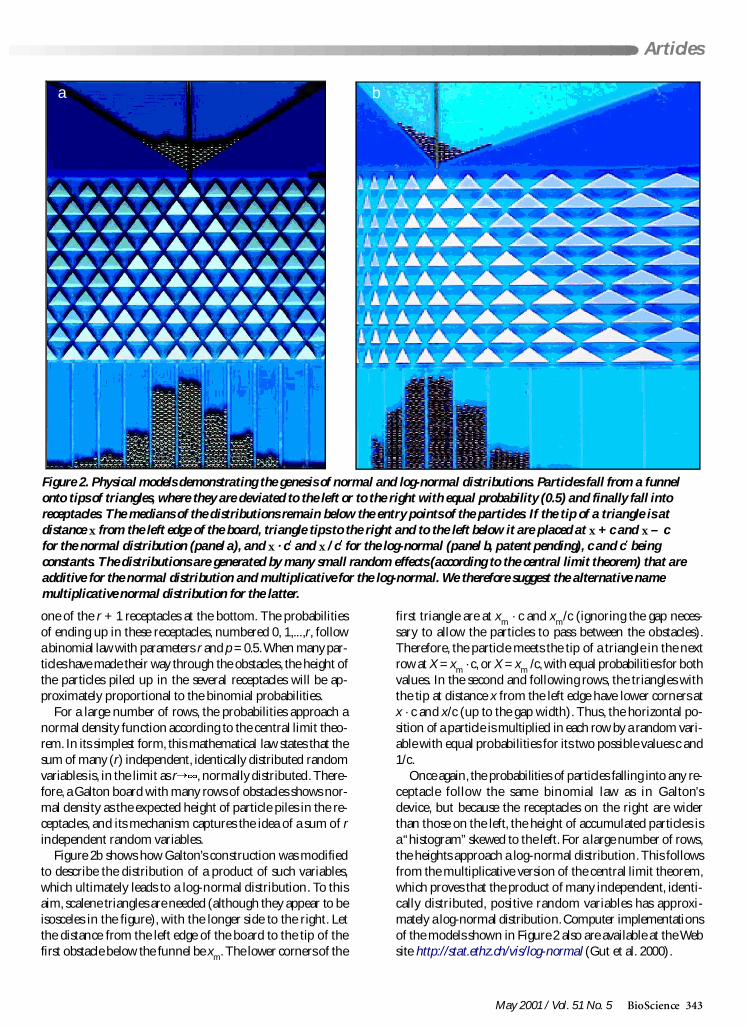
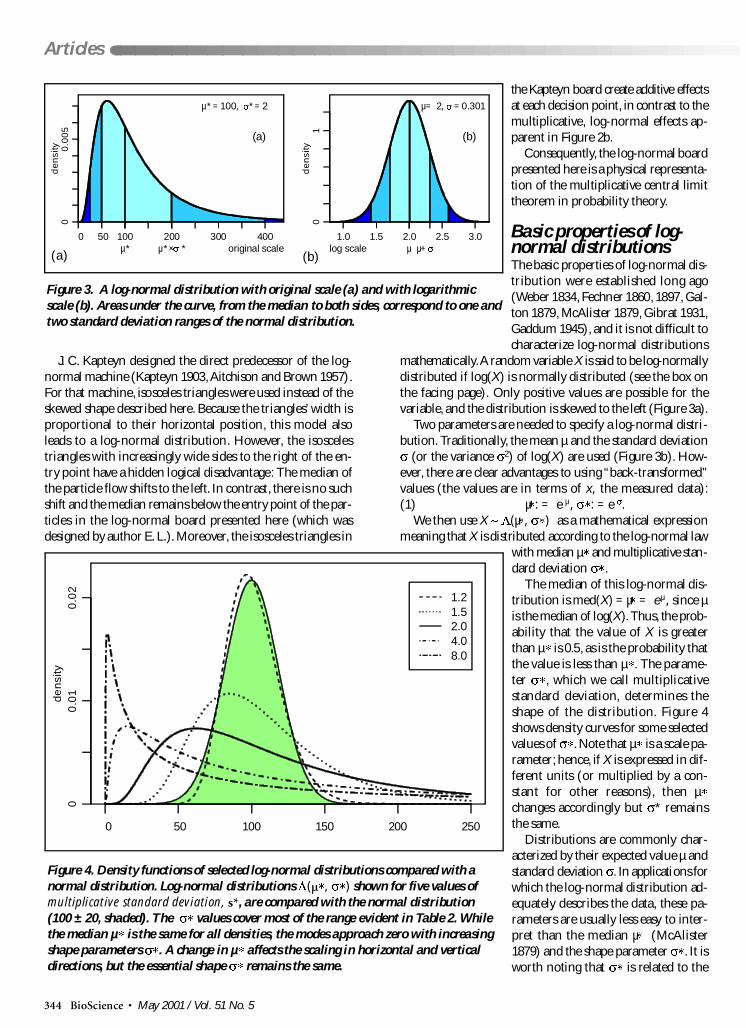
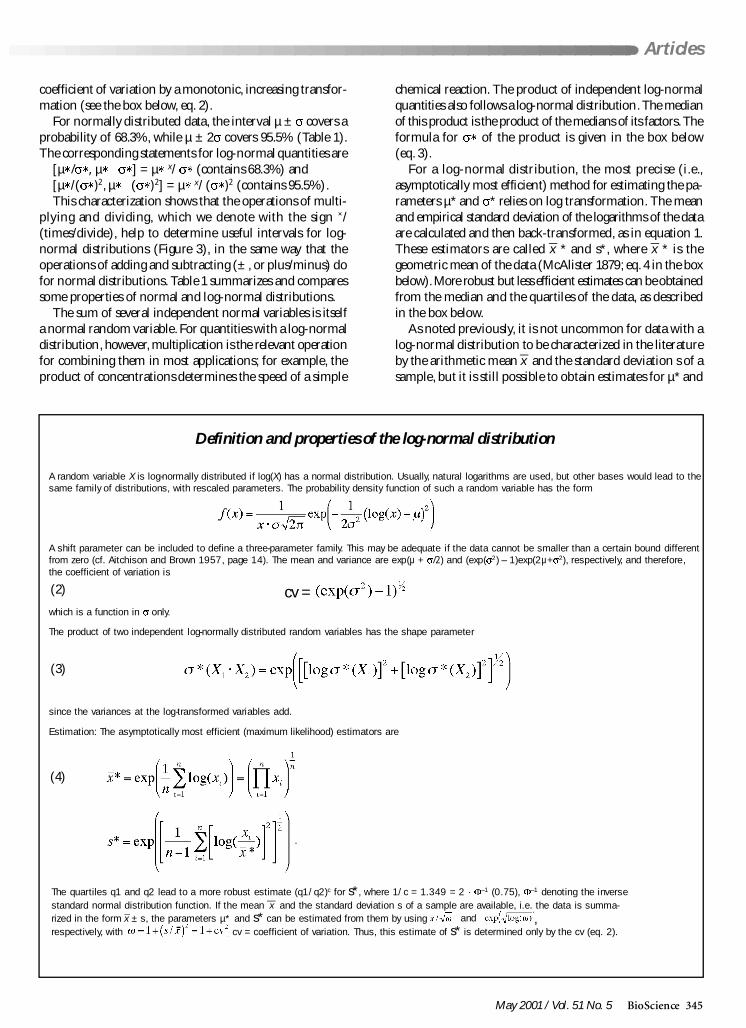
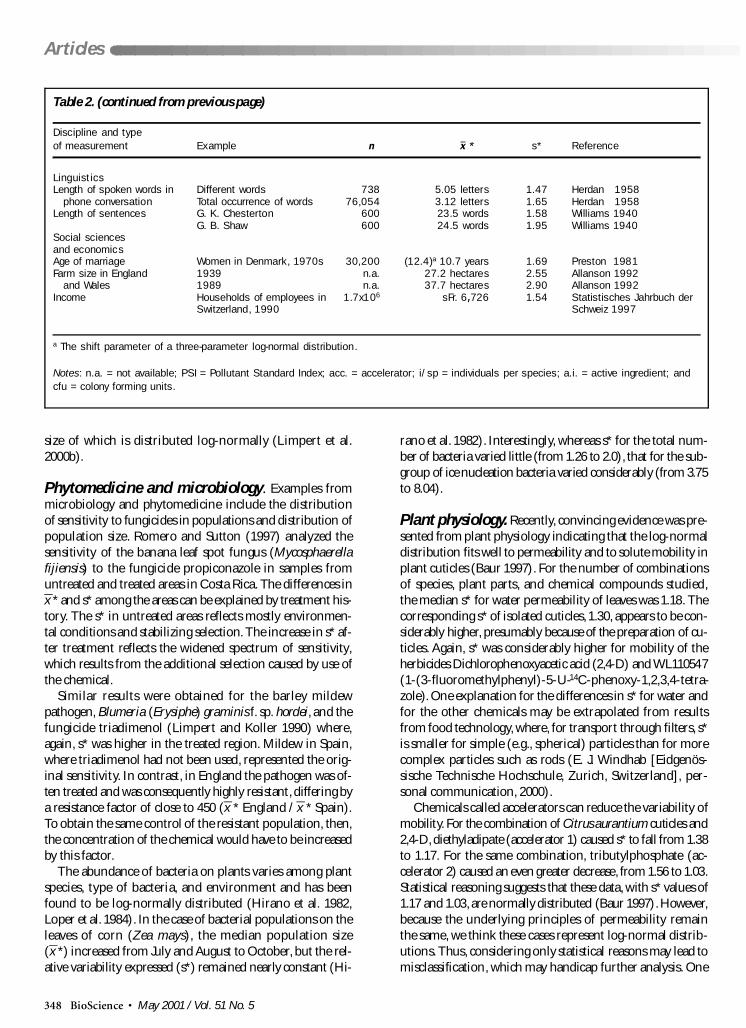
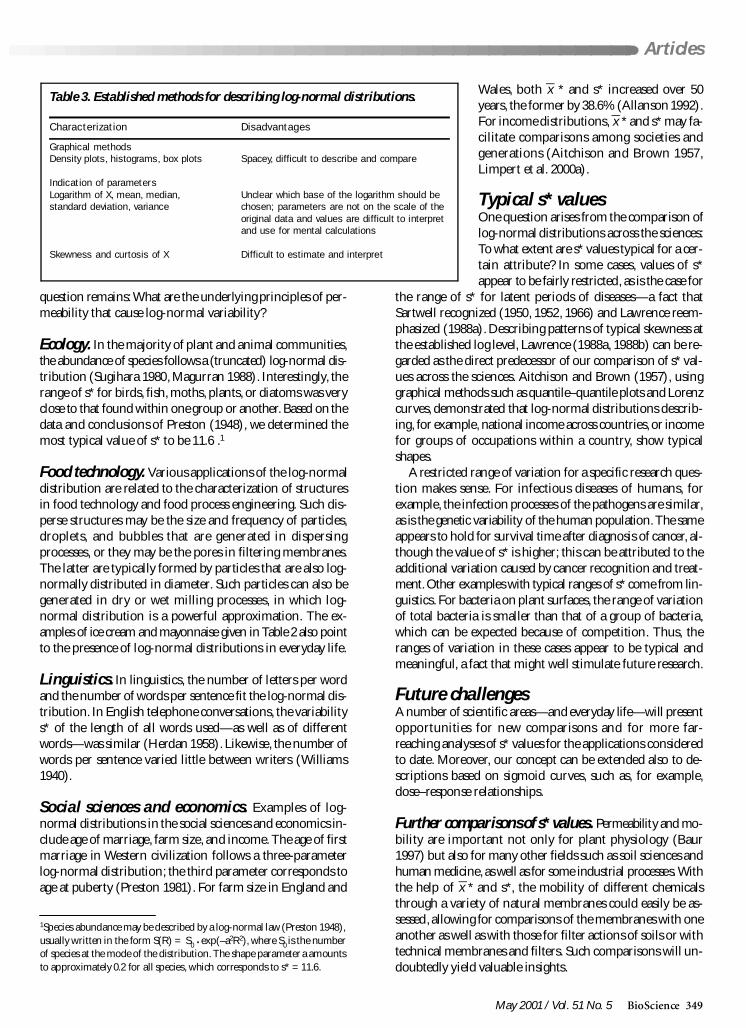
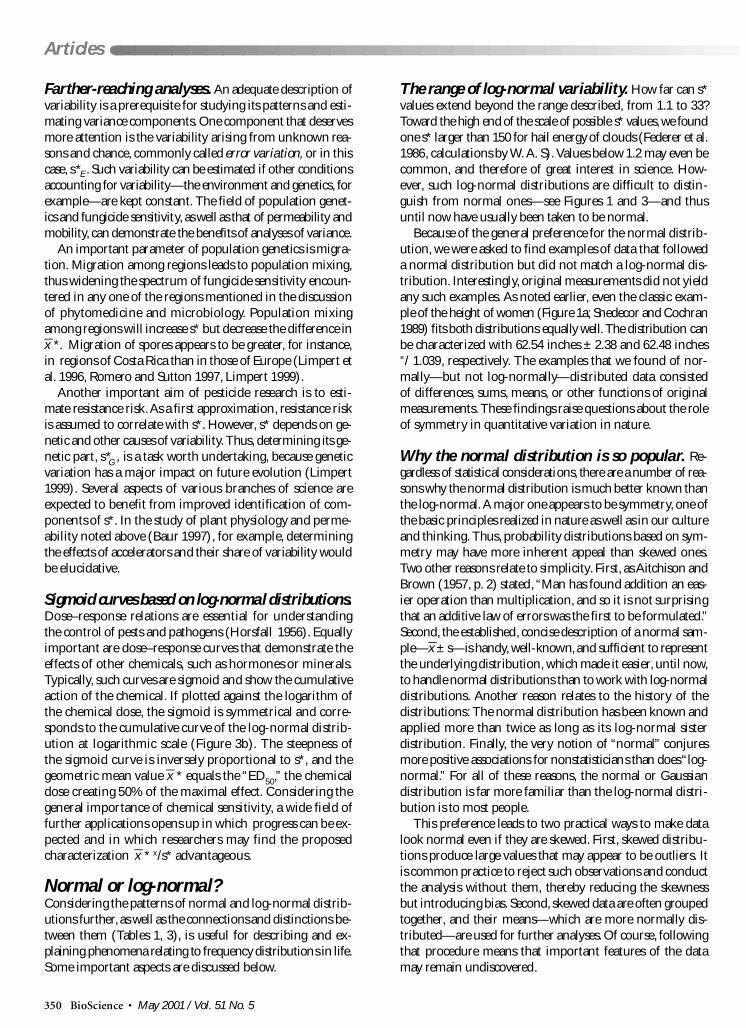