local multiple sequence alignment sequence motifs
DESCRIPTION
Local Multiple Sequence Alignment Sequence Motifs. Motifs. Motifs represent a short common sequence Regulatory motifs (TF binding sites) Functional site in proteins (DNA binding motif). Regulatory Motifs. DNA in every cell is identical Different cells have different functions - PowerPoint PPT PresentationTRANSCRIPT

Local Multiple Sequence Alignment
Sequence Motifs

Motifs
• Motifs represent a short common sequence– Regulatory motifs (TF binding sites) – Functional site in proteins (DNA binding motif)

Regulatory Motifs
• DNA in every cell is identical– Different cells have different functions
• Transcription is crucial aspect of regulation– Transcription factors (TFs) affect transcription
rates
• TFs bind to regulatory motifs – Motifs are 6 – 20 nucleotides long– Activators and repressors– Usually located near target gene, mostly
upstream
Transcription Start Site
SBFmotif
MCM1motif
Gene X
MCM1 SBF

E. Coli promoter sequences

Challenges
• How to recognize a regulatory motif?
• Can we identify new occurrences of known motifs in genome sequences?
• Can we discover new motifs within upstream sequences of genes?
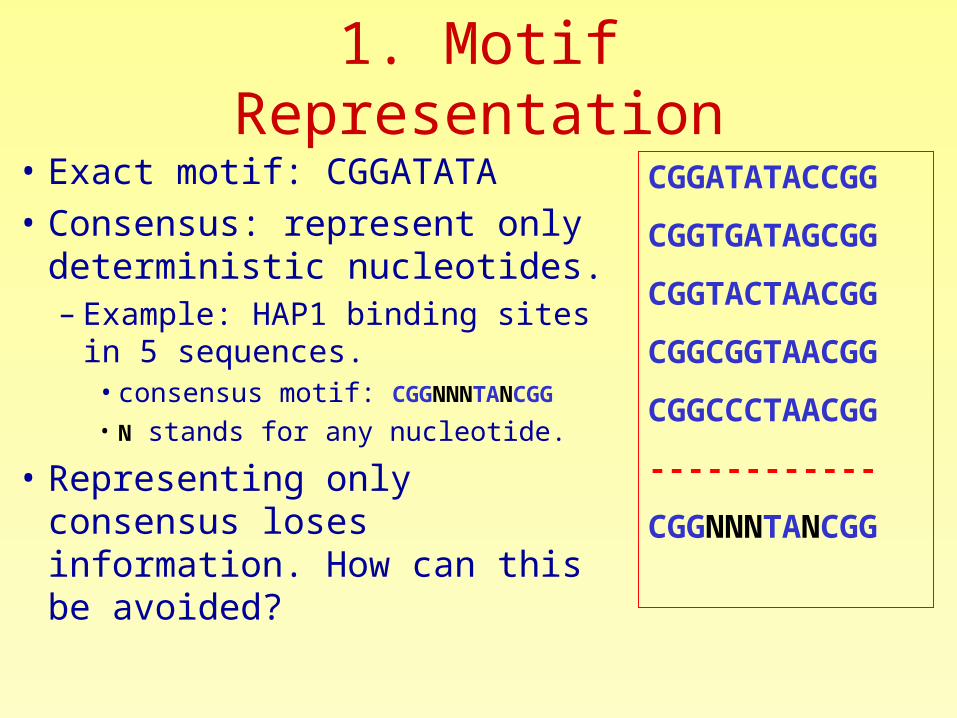
1. Motif Representation
• Exact motif: CGGATATA• Consensus: represent only
deterministic nucleotides.– Example: HAP1 binding sites in 5
sequences.• consensus motif: CGGNNNTANCGG • N stands for any nucleotide.
• Representing only consensus loses information. How can this be avoided?
CGGATATACCGG
CGGTGATAGCGG
CGGTACTAACGG
CGGCGGTAACGG
CGGCCCTAACGG
------------
CGGNNNTANCGG

TTGACA
-35 hexamerspacer
TATAAT
-10 hexamer
Transcription start site
interval
15 - 19 bases 5 - 9 bases
Consensus considerations
-35 -10
A weight matrix contains more information
A
T
GC
1 2 3 4 5 6
A
T
GC
1 2 3 4 5 6
Based on ~450 known promoters
0.1 0.1 0.1 0.5 0.2 0.5
0.7 0.7 0.2 0.2 0.2 0.2
0.1 0.1 0.5 0.1 0.1 0.2
0.1 0.1 0.2 0.2 0.5 0.1
0.1 0.7 0.2 0.6 0.5 0.1
0.7 0.1 0.5 0.2 0.2 0.8
0.1 0.1 0.1 0.1 0.1 0.0
0.1 0.1 0.2 0.1 0.1 0.1

1 2 3 4 5
A 0.1 0.25 0.05 0.7 0.6
C 0.3 0.25 0.8 0.1 0.15
T 0.5 0.25 0.05 0.1 0.05
G 0.1 0.25 0.1 0.1 0.2
PSPM – Position Specific Probability Matrix
• Represents a motif of length k
• Defines Pi{A,C,G,T} for i={1,..,k}.
– Pi (A) – frequency of nucleotide A in position i.

1 2 3 4 5
A 0.1 0.25 0.05 0.7 0.6
C 0.3 0.25 0.8 0.1 0.15
T 0.5 0.25 0.05 0.1 0.05
G 0.1 0.25 0.1 0.1 0.2
PSPM – Position Specific Probability Matrix
• Represents a motif of length k
• Defines Pi{A,C,G,T} for i={1,..,k}.
– Pi (A) – frequency of nucleotide A in position i.
• Each k-mer is assigned a probability. – Example: P(TCCAG)=0.5*0.25*0.8*0.7*0.2

Graphical Representation – Sequence Logo
• Horizontal axis: position of the base in the sequence.
• Vertical axis: amount of information.
• Letter stack: order indicates importance.
• Letter height: indicates frequency.
• Consensus can be read across the top of the letter columns.

2. Identification of Known Motifs within Genomic
Sequences• Motivation:
– identification of new genes controlled by the same TF.
– Infer the function of these genes.– enable better understanding of the regulation
mechanism.

1 2 3 4 5
A 0.1 0.25 0.05 0.7 0.6
C 0.3 0.25 0.8 0.1 0.15
T 0.5 0.25 0.05 0.1 0.05
G 0.1 0.25 0.1 0.1 0.2
Detecting a Known Motif within a Sequence using PSPM
• The PSPM is moved along the query sequence.• At each position the sub-sequence is scored for a
match to the PSPM.• Example:
sequence = ATGCAAGTCT…

• The PSPM is moved along the query sequence.• At each position the sub-sequence is scored for a
match to the PSPM.• Example:
sequence = ATGCAAGTCT…• Position 1: ATGCA
0.1*0.25*0.1*0.1*0.6=1.5*10-4
1 2 3 4 5
A 0.1 0.25 0.05 0.7 0.6
C 0.3 0.25 0.8 0.1 0.15
T 0.5 0.25 0.05 0.1 0.05
G 0.1 0.25 0.1 0.1 0.2
Detecting a Known Motif within a Sequence using PSPM

• The PSPM is moved along the query sequence.• At each position the sub-sequence is scored for a match to
the PSPM.• Example:
sequence = ATGCAAGTCT…• Position 1: ATGCA
0.1*0.25*0.1*0.1*0.6=1.5*10-4
• Position 2: TGCAA 0.5*0.25*0.8*0.7*0.6=0.042
1 2 3 4 5
A 0.1 0.25 0.05 0.7 0.6
C 0.3 0.25 0.8 0.1 0.15
T 0.5 0.25 0.05 0.1 0.05
G 0.1 0.25 0.1 0.1 0.2
Detecting a Known Motif within a Sequence using PSPM

Detecting a Known Motif within a Sequence using PSSM
Is it a random match, or is it indeed an occurrence of the motif?
PSPM -> PSSM (Probability Specific Scoring Matrix)– odds score matrix: Oi(n) where n {A,C,G,T} for i={1,..,k}
– defined as Pi(n)/P(n), where P(n) is background frequency.
Oi(n) increases => higher odds that n at position i is part of a real motif.

1 2 3 4 5
A 0.1 0.25 0.05 0.7 0.6
1 2 3 4 5
A 0.4 1 0.2 2.8 2.4
1 2 3 4 5
A -1.322 0 -2.322 1.485
1.263
PSSM as Odds Score Matrix• Assumption: the background frequency of each
nucleotide is 0.25.
1. Original PSPM (Pi):
2. Odds Matrix (Oi):
3. Going to log scale we get an additive score,Log odds Matrix (log2Oi):

1 2 3 4 5
A -1.32 0 -2.32 1.48 1.26
C 0.26 0 1.68 -1.32 -0.74
T 1 0 -2.32 -1.32 -2.32
G -1.32 0 -1.32 -1.32 -0.32
Calculating using Log Odds Matrix• Odds 0 implies random match;
Odds > 0 implies real match (?).• Example: sequence = ATGCAAGTCT…• Position 1: ATGCA
-1.32+0-1.32-1.32+1.26=-2.7odds= 2-2.7=0.15
• Position 2: TGCAA1+0+1.68+1.48+1.26 =5.42odds=25.42=42.8

Calculating the probability of a Match
ATGCAAG
• Position 1 ATGCA = 0.15

Calculating the probability of a Match
ATGCAAG
• Position 1 ATGCA = 0.15
• Position 2 TGCAA = 42.3

Calculating the probability of a Match
ATGCAAG
• Position 1 ATGCA = 0.15
• Position 2 TGCAA = 42.3
• Position 3 GCAAG =0.18

Calculating the probability of a match
ATGCAAG
• Position 1 ATGCA = 0.15
• Position 2 TGCAA = 42.3
• Position 3 GCAAG =0.18
P (i) = S / (∑ S)Example 0.15 /(.15+42.8+.18)=0.003
P (1)= 0.003P (2)= 0.993P (3) =0.004

Building a PSSM
• Collect all known sequences that bind a certain TF.
• Align all sequences (using multiple sequence alignment).
• Compute the frequency of each nucleotide in each position (PSPM).
• Incorporate background frequency for each nucleotide (PSSM).

PROBLEMS…
• When searching for a motif in a genome using PSSM or other methods – the motif is usually found all over the place
->The motif is considered real if found in the vicinity of a gene.
• Checking experimentally for the binding sites of a specific TF (location analysis) – the sites that bind the motif are in some cases similar to the PSSM and sometimes not!

3. Finding new Motifs
• We are given a group of genes, which presumably contain a common regulatory motif.
• We know nothing of the TF that binds to the putative motif.
• The problem: discover the motif.

Difficulties in Computational Identification
• Each motif can appear in any of m-k columns;there are (m-k)n possibilities.
• Noise:Mismatches are allowed, the motif is not exact.Not all sequences contain the motif.
• Statistical significance:k is short (6-20 nucleotides).m ranges from 10s (prokaryotes) to 1000s (eukaryotes) of nucleotides.=> a random motif can appear by chance in sequences.

Computational Methods• This problem has received a lot of attention from
CS people.• Methods include:
– Probabilistic methods – hidden Markov models (HMMs), expectation maximization (EM), Gibbs sampling, etc.
– Enumeration methods – problematic for inexact motifs of length k>10. …
• Current status: Problem is still open.

Tools on the Web• MEME – Multiple EM for Motif Elicitation.
http://meme.sdsc.edu/meme/website/• metaMEME- Uses HMM method
http://meme.sdsc.edu/meme• MAST-Motif Alignment and Search Tool
http://meme.sdsc.edu/meme
• TRANSFAC - database of eukaryotic cis-acting regulatory DNA elements and trans-acting factors. http://transfac.gbf.de/TRANSFAC/
• eMotif - allows to scan, make and search for motifs in the protein level. http://motif.stanford.edu/emotif/