load distribution in short bridges subjected to oversize
TRANSCRIPT

Dr. Sami W. Tabsh, P.E.
Department of Civil Engineering
American University of Sharjah
United Arab Emirates
WIDE TRUCK
Load Distribution in Short Bridges
Subjected to Oversize Vehicles

2
Outline
1. Introduction
2. Problem Statement
3. Objectives
4. Scope
5. Approach
6. Results
7. Conclusions

3
1. Introduction
Leading industries around the world rely heavily
on goods movement on roads:
Manufacturing
Oil and gas
Agriculture
Forest Products
Mineral Extraction
Paper
Dairy Products
Oil and gas

1. Introduction
4
Forest Products Mineral ExtractionAgriculture
5
1. Introduction
Truck weight and size are limited on bridges
because:
They reduce the useful life of the structure.
They cause damage to the deck, girders, cross-
bracing, joints, and bearings.
They result in accelerated maintenance, repair,
strengthening, or replacement work that is
required to keep structures at an acceptable level
of service.
6
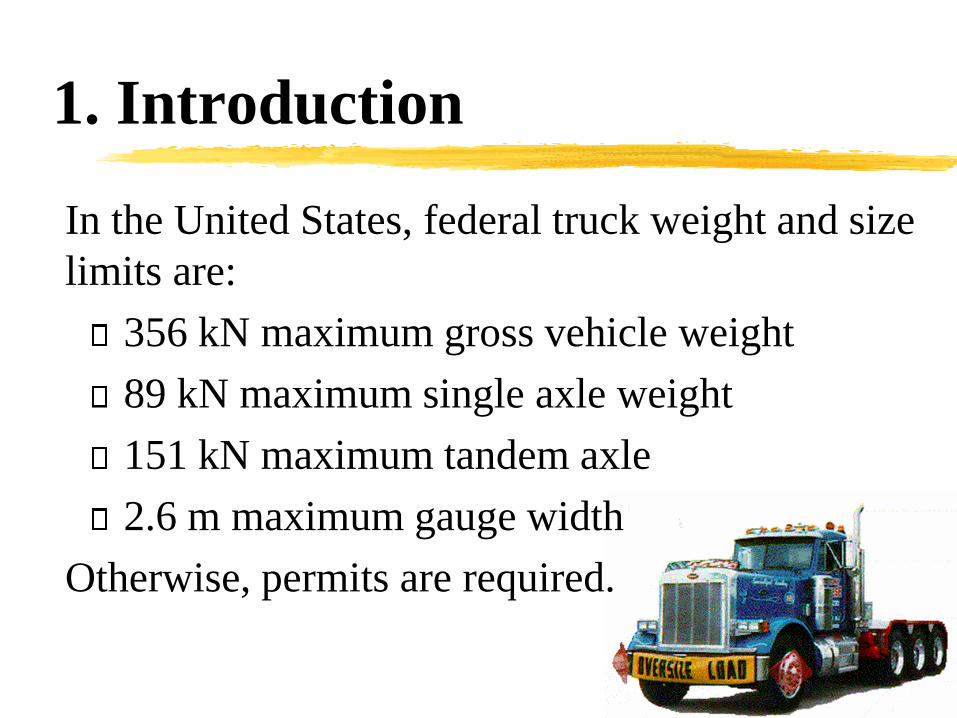
1. Introduction
In the United States, federal truck weight and size
limits are:
356 kN maximum gross vehicle weight
89 kN maximum single axle weight
151 kN maximum tandem axle
2.6 m maximum gauge width
Otherwise, permits are required.

7
1. Introduction
When truck weight or
configuration exceeds the
limit, a permit is required.
For a permit truck, a DOT
engineer must check the
structural adequacy of
bridges located along the
route of the permit truck.
1. Introduction
8
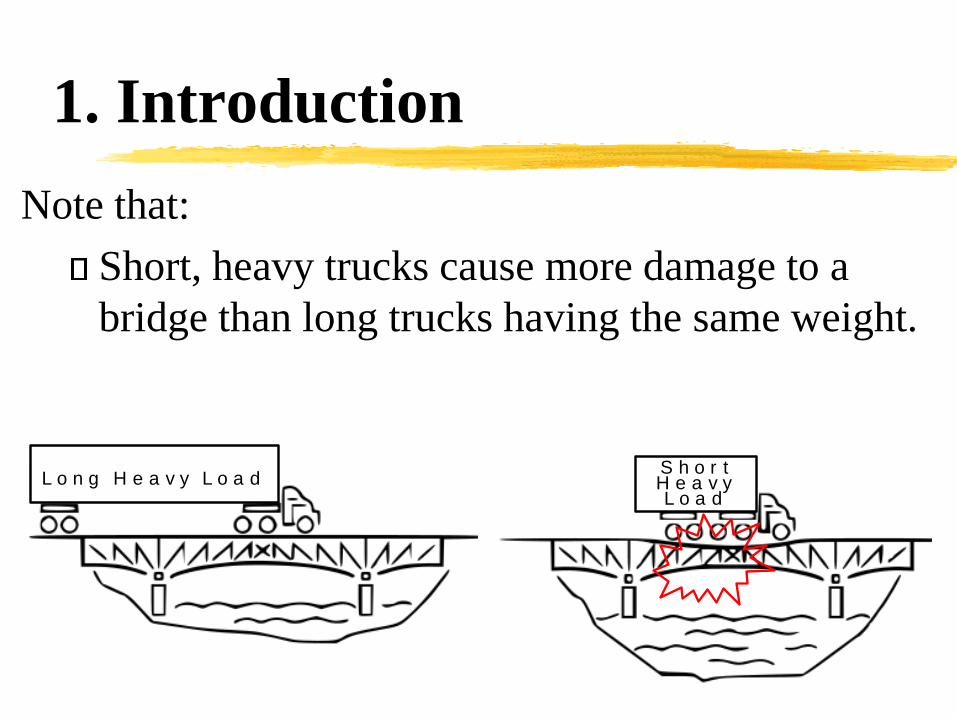
Note that:
Short, heavy trucks cause more damage to a
bridge than long trucks having the same weight.
L o n g H e a v y L o a dL o n g H e a v y L o a d
S h o r t H e a v y L o a d
L o n g H e a v y L o a dL o n g H e a v y L o a d
S h o r t H e a v y L o a d

1. Introduction
9
Note also that:
Trucks having narrow gage widths are more
critical than those with wide gauges with same
weight.
S h o r t
G a u g e
W i d e
G a u g eGage Gage

10
1. Introduction

11
1. Introduction
Girder Distribution Factor (GDF)
It is the fraction of live load effect on a single girder
relative to the load effect on the whole bridge.
WxGDF
Whole superstructure One girder
Weight
W
12
1. Introduction
Properties of Girder Distribution Factors
They can be used in lieu of a refined 3-D
structural analysis.
They can be used to check the strength and
serviceability of new and existing bridges.
They are presented in the specification for
regular bridges and truck configurations.
They depend on the bridge type, geometry,
continuity, skewness, and limit state.

13
1. Introduction
GDF in AASHTO’s LRFD
Flexure: Single Lane Loaded (without multiple
presence factor)
where S = girder spacing (mm)
L = span length (mm)
ts = slab thickness (mm)
Kg = longitudinal stiffness parameter (mm4)
𝐺𝐷𝐹 = 0.05 +𝑆
6800
0.4𝑆
𝐿
0.3𝐾𝑔
𝐿 𝑡𝑠3
0.1

14
1. Introduction
GDF in AASHTO’s LRFD (Cont’d)
Shear: Single Lane Loaded (without multiple presence
factor)
where S = girder spacing (mm)
𝐺𝐷𝐹 = 0.3 +𝑆
9120

15
2. Problem Statement
Bridges subjected to overweight trucks with
standard gauge can be analyzed using common
procedures in the design specifications.
Currently, bridges subjected to oversized trucks
with nonstandard gauge require refined analysis.
Evaluation of bridges subjected to oversized trucks
can be greatly simplified by developing new girder
distribution factors that account for the increased
gauge width of oversized vehicles.

16

17

3. Objectives
• To develop flexural and shear girder distribution
factors for slab-on-steel-girder bridges subjected
to oversized trucks having nonstandard gage
configuration and width.
• To determine the sensitivity of the girder
distribution factor in flexure and in shear to
changes in the truck gage width for bridges having
various span lengths and girder spacings.
18

19
4. Scope
Slab-on-girder bridges
Composite steel I-girders
Simple spans (14.6-43.9m)
Girder spacing (1.22-3.66m)
Interior girders
Flexure at midspan and shear at the support
Single-lane and dual-lane trucks
Gauge width (1.83-5.49m)

20
4. Scope
Bridge Lengths
Three different simple spans
14.6 m
29.3 m
43.9 m

21
4. Scope
Bridge Cross-sections
1.22m girder spacing
2.44m girder spacing
3.66m girder spacing
152mm
6 spaces @ 1.22m 0.61m0.61m
203mm
4 spaces @ 2.44m1.22m1.22m
254mm
3 spaces @ 3.66m1.83m1.83m

4. Scope
Slab thickness and steel girder dimensions
22
Span Length
(m)
Girder Spacing
(m)
Slab Thickness
(mm)
Flange Thickness
(mm)
Flange Width (mm)
Web Thickness
(mm)
Web Depth (mm)
14.64
1.22 152 22 292 15 536
2.44 203 22 292 15 840
3.66 254 22 292 15 1145
29.28
1.22 152 43 423 24 628
2.44 203 43 423 24 933
3.66 254 43 423 24 1238
43.92
1.22 152 45 405 26 813
2.44 203 45 405 26 1118
3.66 254 45 405 26 1423

4. Scope
23
Truck Configurations
AASHTO HS20-44 Design Truck (325 kN)
OHBDC Level 3 Truck (740 kN)
35 kN 145 kN 145 kN4.3 m 4.3-9 m
60 kN 2 at 160 kN each 160 kN200 kN
3.6 m 6 m 7.2 m1.2 m

4. Scope
24
Trucks Configurations (Cont’d)
PennDOT P-82 Permit Truck (907 kN)
HTL-57 (507 kN)
3 at 120 kN each67 kN 4 at 120 kN each
1.2 m1.2 m1.2 m1.2 m 1.2 m3.6 m 7.2 m
4.3 m1.2 m1.2 m
4.3 m4.3 m
40 kN 2 at 94 kN each 2 at 94 kN each94 kN

25
4. Scope
Gage Widths
1.83, 2.44, 3.05 & 3.66 m
G
Single-Lane Trailer Dual-Lane Trailer
3.66, 4.88 & 5.49 m
G
a
a 1.22, 1.22 & 1.83 m

26
5. Approach
The considered bridges
will be modeled in 3-
dimensions by finite
elements and analyzed
in the linearly elastic
range under static
loading.

5. Approach
Commonly used FEA models for girder bridges
27
Model #1
Model #2Model #3
Model #4

28
5. Approach
Details of the finite element model used in study.
The FE-model was validated by Bishara et al.
(1993) based on field testing of the Parsons
Avenue Bridge in Columbus, OH.
RIGID

29
5. Approach
Bishara, A.G., Liu, M.C., & El‐Ali, N.D., “Wheel Load Distribution on Simply Supported Skew I‐Beam
Composite Bridges,” Journal of Structural Engineering, ASCE, 1993 Vol. 119, No. 2, p. 399-419.

30
5. Approach
Example of a finite element model of a 29.3 m simple
span bridge with 2.4 m girder spacing and cross-bracing
located at the quarter points.
5-girder bridge system 4-girder bridge system

31
5. Approach
Longitudinal Position of Truck
Flexure:
Place axle closest to resultant of all axles at mid-span.
35 kN 145 kN 145kN
4.3 m 4.3 m

32
5. Approach
Longitudinal Position of Truck (Cont’d)
Shear:
Place truck rear heavy axle just off the support.
35 kN 145 kN 145kN
4.3 m 4.3 mL

33
5. Approach
Transverse Position of Truck
Move the truck transversely from one side of the bridge to
the other side until the load effect in the girder under
consideration (e.g. first interior girder) is maximized.
GaugeX

34
5. Approach
Calculating the GDF
For the critical transverse truck position, determine:
Flexure: longitudinal stress in the bottom flange of all girders.
Shear: reaction at the support for all girders.
53.3 MPa
-27.9 MPa
Flexure @ midspan

5. Approach
Determining the GDF from FE Analysis
Flexure
Shear
35
𝐺𝐷𝐹𝑀 =𝑓𝑗
𝑓𝑖𝑁𝑖=1
𝐺𝐷𝐹𝑉 =𝑅𝑗
𝑅𝑖𝑁𝑖=1
f = stress in bottom flange
R = girder support reaction

36
6. Results
Critical Truck Configuration
Truck configuration effect on GDF
(Span Length=29.3m & Gage Width=1.83m)
0
0.1
0.2
0.3
0.4
0.5
0.6
0.7
0.8
0 0.5 1 1.5 2 2.5 3 3.5 4 4.5 5 5.5
GD
F
Truck Location from Exterior Girder (m)
3.66 m girder
1.22 m girder
(a) Flexure
0
0.2
0.4
0.6
0.8
1
1.2
1.4
1.6
0 0.5 1 1.5 2 2.5 3 3.5 4 4.5 5 5.5G
DF
Truck Location from Exterior Girder (m)
HS20
OHBDC
HTL-57
P-82
3.66 m girder
1.22 m girder
(b) Shear
3.66 spacing
1.22 spacing
3.66 spacing
1.22 spacing

37
6. Results
FEA Results for Wide Single-Lane Trailer
0
0.15
0.3
0.45
0.6
0.75
0.9
1.83 2.44 3.05 3.66
GD
F
Gage Width (m)
Girder Spacing=1.22m
0
0.15
0.3
0.45
0.6
0.75
0.9
1.83 2.44 3.05 3.66
GD
F
Gage Width (m)
Girder Spacing=2.44m
L=14.6m
L=29.3m
L=43.9m
0
0.15
0.3
0.45
0.6
0.75
0.9
1.83 2.44 3.05 3.66
GD
F
Gage Width (m)
Girder Spacing=3.66m
Flexure
Shear
Flexure
Shear
Flexure
Shear

6. Results
New GDFs for Wide Single-Lane Trailers
Flexure
Shear
38where G = Gauge width (mm)
𝐺𝐷𝐹𝑀 𝑆𝑖𝑛𝑔𝑙𝑒−𝐿𝑎𝑛𝑒 = 0.05 +𝑆
4 𝐺
0.4𝑆
𝐿
0.25𝐾𝑔
𝐿 𝑡𝑠3
0.3
𝐺𝐷𝐹𝑉 𝑆𝑖𝑛𝑔𝑙𝑒−𝐿𝑎𝑛𝑒 = 0.20 +𝑆
31.7
1
𝐺
0.7

39
6. Results
FEA Results for Wide Dual-Lane Trailer
0
0.15
0.3
0.45
0.6
0.75
0.9
3.66 4.27 4.88 5.49
GD
F
Gage Width (m)
Girder Spacing=1.22m
0
0.15
0.3
0.45
0.6
0.75
0.9
3.66 4.27 4.88 5.49
GD
F
Gage Width (m)
Girder Spacing=2.44m
L=14.6m
L=29.3m
L=43.9m
0
0.15
0.3
0.45
0.6
0.75
0.9
3.66 4.27 4.88 5.49
GD
F
Gage Width (m)
Girder Spacing=3.66m
Flexure
ShearFlexure
Shear
Flexure
Shear

6. Results
New GDFs for Wide Dual-Lane Trailers
Flexure
Shear
40
where a = shortest distance between the exterior and
interior dual wheels (mm)
𝐺𝐷𝐹𝑀 𝐷𝑢𝑎𝑙−𝐿𝑎𝑛𝑒 = 0.05 +𝑆
ሻ4 (𝐺 − 𝑎
0.4𝑆
𝐿
0.25𝐾𝑔
𝐿 𝑡𝑠3
0.3
𝐺𝐷𝐹𝑉 𝐷𝑢𝑎𝑙−𝐿𝑎𝑛𝑒 = 0.19 +𝑆−915
8.75
1
𝑎
0.5 1
𝐺−2𝑎
0.4

41
6. Results
Accuracy of Developed GDF
0
0.2
0.4
0.6
0.8
1
0 0.2 0.4 0.6 0.8 1
Pro
po
sed
GD
F
FEM-based GDF
Single Lane Trailer
Flexure
Shear
0
0.2
0.4
0.6
0.8
1
0 0.2 0.4 0.6 0.8 1
Pro
po
sed
GD
F
FEM-based GDF
Dual Lane Trailer
Flexure
Shear
(GDF)proposed
(GDF)FEA≈ 1.082
(GDF)proposed
(GDF)FEA≈ 1.110

42
7. Conclusions
1. The HS20 truck produces the highest load effects
among the considered truck configurations.
2. The first interior girder often receives the highest
percentage of live load relative to other interior
girders.
3. Wide trucks produce lower girder distribution
factors than narrow trucks, and their effect on
shear is more critical than on flexure, especially
if the girder spacing is large.

7. Conclusions
4. The accuracy of the proposed GDF factors for
bridges subjected to oversized trucks is good.
5. When used on existing bridges subjected to
oversized vehicles, the proposed factors can
eliminate the time-consuming and complex 3-D
finite element analysis.
43

ACKNOWLEDGEMENT
Thanks are due to my former graduate student Ms
Muna M. Mitchell, currently with Walter P. Moore
in Austin, Texas, USA, for conducting the finite
element analyses.
44

Thank You
Questions?
45