lncs 7465 - stock market multi-agent … market multi-agent recommendation ... applied on the...
TRANSCRIPT
Stock Market Multi-Agent RecommendationSystem Based on the Elliott Wave Principle
Monica Tirea1, Ioan Tandau2, and Viorel Negru1
1 West University of Timisoara, Timisoara Romania{tirea.monica,vnegru}@info.uvt.ro
2 Green Mountain Analytics, Cary, North Carolina, [email protected]
Abstract. The goal of this paper is to create a hybrid recommendationsystem based on a Multi-Agent Architecture that will inform the traderabout the future stock trend in order to improve the profitability of ashort or medium time period investment.
We proposed a Multi-Agent Architecture that uses the numbers of theFibonacci Series and the Elliott Wave Theory, along with some specialTechnical Analysis Methods (namely Gap Analysis, Breakout System,Market Modes and Momentum Precedes Price) and Neural Networks(Multi-Layer Perceptron) and tries to combine and / or compare the re-sult given by part / all of them in order to forecast trends in the financialmarket. In order to validate our model a prototype was developed.
Keywords: Multi-Agent Systems, Elliott Wave Theory, TechnicalAnalysis Methods, Neural Networks, Fibonacci Series.
1 Introduction
Stock Market Forecasting has gained an important place in the research area dueto its attractive benefits and its commercial applications. Due to the fact thatthe stock market is noisy, non-linear, chaotic, dynamic, very complicated andinfluenced by many macro-economical factors it is almost impossible to make aperfect prediction of which is the best moment to buy / sell a stock or to forecasta market trend. During the last decades researchers have tried to combine a seriesof techniques in order to alleviate the insurmountable prediction problem andprovide better decision guidelines and optimized forecasting tools.
The most common techniques used are Fundamental and Technical Analy-sis [4,5,11]. Technical Analysis computes some indicators/oscillators, based ona stock historical data, which have the aim to signal a buy / sell moment.Fundamental Analysis takes in consideration the macro-economical factors thatinfluence the market in order to also signal a buy/sell moment. Another ap-proach is the use of Artificial Neural Networks [2,3,8] because of their abilityto capture patterns and relationships based on the historical data and to copewith the environmental changes that may occur in the market in order to helpin determining a future stock trend or a good moment to buy / sell.
G. Quirchmayr et al. (Eds.): CD-ARES 2012, LNCS 7465, pp. 332–346, 2012.c© IFIP International Federation for Information Processing 2012
SMMARS Based on the Elliott Wave Principle 333
In the field of Technical Analysis, there are a series of methods that areconsidered to be profitable such as Gap Analysis, Breakout Systems, MarketModes and Momentum Precedes Price. Another complex and comprehensiveTechnical Analysis Method is the Elliott Wave Theory [6,7].
The Elliott Wave Theory plays an important part in the stock market researcharea because of its ability to interpret the psychological aspect that may appearon a market behavior. Taking in consideration that stock prices are following atrend is very important to know which is the direction of the current trend andwhen this direction will change.
In completion to the Wave Analysis Stock Prediction Model proposal, whichis based on Fuzzy Logic Theory, Neural Network, and the Elliott Wave Theory[1], we add an agent based system that uses some special Technical AnalysisMethods, for a better detection of a good buy / sell moment and a better forecastof a market trend.
Based on this information we developed a framework (Stock Market Multi-Agent Recommendation System - SMMARS) in which we will combine the resultof these Technical Analysis Methods with the Neural Network Methods (Multi-Layer Peceptron) into a Multi-Agent Architecture in order to make a betterforecast on the future trend of a stock in a stock market.
This framework’s goal is to compare, to find a correlation between the resultfrom three different techniques and to combine them in order to improve the finalresults and to make a better forecast on the market future trend. We defined ahybrid system whose aim is to find a better solution to how we can manipulate aportfolio in order to have a substantial gain on the stock market. These methodsare applied on the Bucharest Stock Exchange Market (BSE).
In Section 2 we describe the Elliott Wave Principle and the methods associatedwith it along with the Technical Analysis Methods that we will use in orderto forecast a stock trend. Section 3 presents the proposed model of the agentarchitecture. Section 4 presents an analysis of our model on the Bucharest StockExchange, the results obtained along with the comparison of our model’s resultswith other similar models. Conclusions and future work is presented in the lastsection.
2 Elliott Wave Principle and Stock Market Forecasting
2.1 Profitable Methods Based on Technical Analysis
Stock Market prediction has been an interest area of research for many years.Researchers have played with Technical Analysis indicators and oscillators inorder to find a better way to predict an important moment to buy / sell on astock market. The profitable methods [7] based on the Technical Analysis areconsidered to be Gap Analysis Patterns, Breakout Systems, the Market’s Modeand the Momentum Precedes Price concept.
334 M. Tirea, I. Tandau, and V. Negru
Gap Analysis Method
We define a gap as the area on which no trades occurred. These methods cansignal an important event on the stock market based on the fundamental data oron the psychology of the crowd that accompanies this market movement. Takingin consideration the breaking news or changes that may appear in the market’sconditions, this method signals that something important happened [7,9].
In the case that this information is true and the price of a stock evolves inthe direction of the gap, then we can take in consideration two possible moves:we buy when the market gaps down below the low on the open and then crossesabove yesterday’s close and sell when the market opens above yesterday’s highand crosses below yesterday’s close; or we buy/sell if the market gaps up / downat some percentage of yesterday’s range above the open/ bellow the open. Gapsare good tools for forecasting short and medium trends.
We distinguish four basic categories of gaps : Common (appears in a tradingrange or congestion area, and reinforces the apparent lack of interest in thestock at that time); Breakaway (occurs when the price action is breaking outof their trading range or congestion area); Runaway (occurs when an increasedinterest in the stock appears); and Exhaustion (occurs when a high volume andlarge price difference between the previous day’s close and the new opening priceappears).
Breakout Systems
There are considered to be one of the best methods from the Technical Analysisbecause of their ability to carry the stock beyond the breakout point in order forthe user to have a gain on the market. We distinguish two categories of breakoutsystems: the channel breakout (occurs when a stock was trading in a givenchannel and the trading starts at a price higher than the top of that channel)and the volatility breakout (buy / sell when the market breaks above/below itsopen / previous close by a given percentage of the previous day’s range) [7,12].
Market Mode
This method has an interest in identifying the status of the market: if is trending,will continue to trend or will consolidate. In order to make such assumption weuse a series of Technical Analysis indicators. One of the most used indicators isthe Average Directional Movement (ADX) which signal the market status whenit goes above / below a set level. A market is considered to be trending whenthe indicator goes above 25, is consolidating when it goes below 20 [7].
Momentum Precedes Price
This method indicates whether or not a possible price change will occur. Basedon the market movement in one direction it is possible that the price will continuefurther in the same direction. A signal of buy / sell moment will appear if themomentum oscillator sets a new high / low and the oscillator is above / bellowzero [7].
SMMARS Based on the Elliott Wave Principle 335
2.2 Elliott Wave Principle
The market moves in ratios and patterns that reflects the human behavior of astock price’s trend. Taking this fact into consideration, the Elliott Wave Principleis defined as a two direction waves (impulse wave and corrective wave) [1,6,7].
The impulse wave is defined as a five wave sequence (noted 1− 2− 3− 4− 5)that follow the trend direction and the corrective wave is defined as a three wavesequence (noted a − b − c) in the opposite direction of the impulse wave. Thistype of waves can be used in short-term and long-term prediction because oftheir construction from similar patterns on a large or short scale.
Elliott defined a hierarchy of waves based on their degree: Grand Supercycle,Supercycle, Cycle, Primary, Intermediate, Minor, Minute, Minuette, Submin-uette. In this study we take into consideration the last four of them in order toforecast the stock market trend for short and medium term period.
Looking at a trend on the stock market we can identify on which position ofthe pattern we are by taking in consideration some rules :
1. The second wave in the Elliott Wave Pattern must not exceed the lengthof the first wave and cannot return a price lower than the one set at thebeginning of the first wave.
2. The third wave must not have the shortest length compared to the first andthe fifth waves.
3. The fourth wave must not return a lower price than the closing price of thefirst wave.
4. Wave two and four usually have alternate forms.5. Wave 1, 2, and 3 must have the same direction and wave 2, and 4 must be
in the opposite direction
The impulse waves are categorized as follows: extended wave ( this means thatone of the waves 1, 3, and 5 can be extended into an Elliott Wave sub-wavestructure), diagonal triangle (occurs when wave 5 is in the same line with wave2 and 4 causing a diagonal triangle), fifth wave failure (occurs when the lengthof wave five doesn’t exceed the length of wave 3, causing a double top in thetrend).
The Corrective Wave are also categorized as follows: Zig-Zag (5 − 3 − 5 sub-wave structure); Flat (3 − 3 − 5 sub-wave structure, a and b wave having thesame length); Irregular (3 − 3 − 5 sub-wave structure, with b longer than a);Horizontal Triangle (5-wave triangular pattern composed of 3 − 3 − 3 − 3 − 3sub-wave structure); Double Three (any combination of the above having theform abcxabc where x is the link wave); Triple Three (any combination of theabove having the form abcxabcxabc where x is the link wave).
2.3 Fibonacci Mathematics in Financial Markets
The wave principle discovered by Elliott, has in practice a connection with theFibonacci sequence [13] due to the fact that this series defines the static anddynamic characteristics of a natural system. The Fibonacci sequence is definedas a sequence of derived numbers starting from two initial values
336 M. Tirea, I. Tandau, and V. Negru
(1, 1, 2, 3, 5, 8, 13, 21, 34, 55, 89, 144, 233. . .).
We take in consideration four ratios computed from the Fibonnacci Sequence.Starting from the fifth element, if we divide the current number with the previousnumber we get a ratio of 1.618. If we divide the current number with the nextnumber in the series we get a ratio of 0.618. If we divide the current number withthe number on the previous two position we get a ratio of 2.618. If we divide thecurrent number with the number in the series that precedes it with two positionwe get a ratio of 0.382. These are called the Fibonacci ratios and in the ElliottWave Theory, this ratios are the primary factor of the extent of price and timemovements in a stock market.
These ratios are used in order to explain the market behavior and to spota wave. Applied on the Elliott Wave Principles, this ratios have the followingbehavior: wave 2 corrects up to 50% or 62% of wave 1; wave 4 corrects up to24% to 28% of wave 3; wave 3 has the length 1.62, 2.62, 4.25 of the length ofwave 1; wave 5 depends either on the wave 1 or on the length of the parallelfrom the start of the wave 1 until the end of the wave 3.
3 Agent Based Architecture
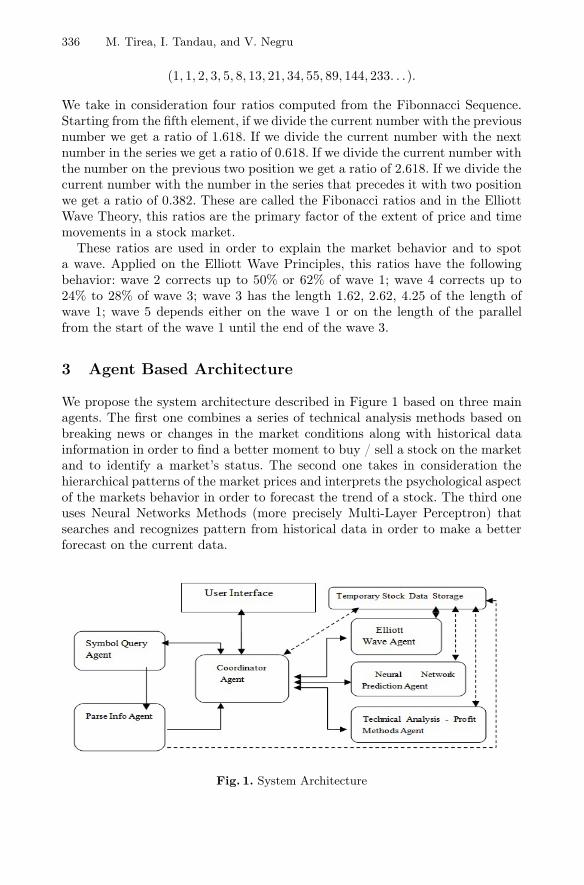
We propose the system architecture described in Figure 1 based on three mainagents. The first one combines a series of technical analysis methods based onbreaking news or changes in the market conditions along with historical datainformation in order to find a better moment to buy / sell a stock on the marketand to identify a market’s status. The second one takes in consideration thehierarchical patterns of the market prices and interprets the psychological aspectof the markets behavior in order to forecast the trend of a stock. The third oneuses Neural Networks Methods (more precisely Multi-Layer Perceptron) thatsearches and recognizes pattern from historical data in order to make a betterforecast on the current data.
Fig. 1. System Architecture
SMMARS Based on the Elliott Wave Principle 337
Coordinator Agent (CA)
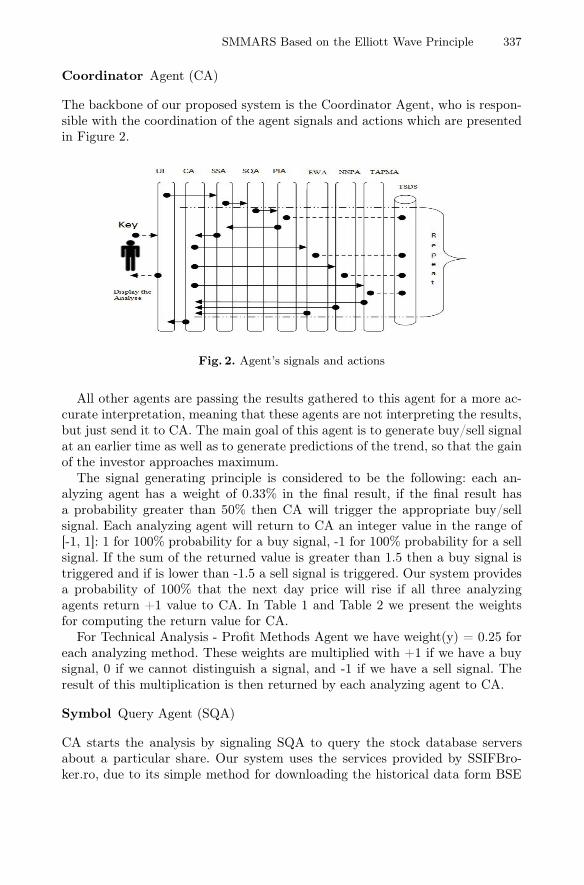
The backbone of our proposed system is the Coordinator Agent, who is respon-sible with the coordination of the agent signals and actions which are presentedin Figure 2.
Fig. 2. Agent’s signals and actions
All other agents are passing the results gathered to this agent for a more ac-curate interpretation, meaning that these agents are not interpreting the results,but just send it to CA. The main goal of this agent is to generate buy/sell signalat an earlier time as well as to generate predictions of the trend, so that the gainof the investor approaches maximum.
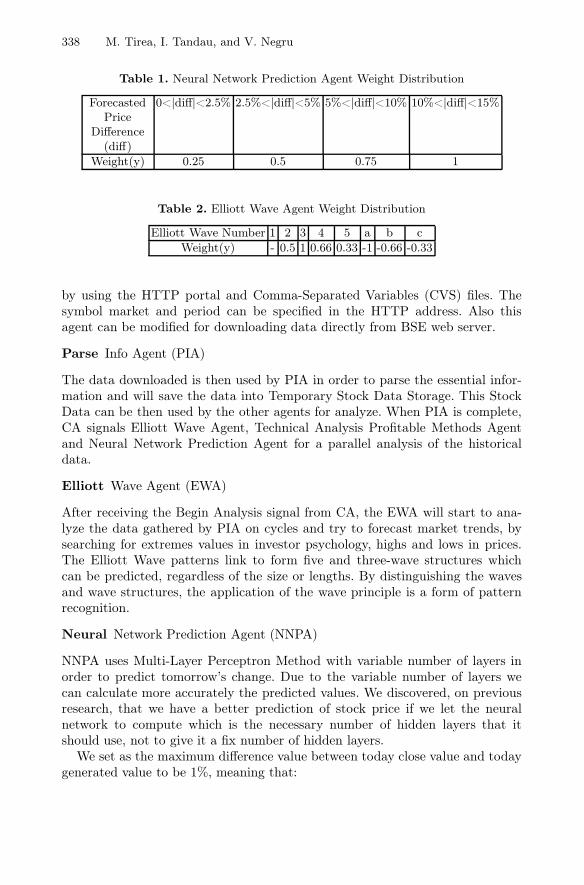
The signal generating principle is considered to be the following: each an-alyzing agent has a weight of 0.33% in the final result, if the final result hasa probability greater than 50% then CA will trigger the appropriate buy/sellsignal. Each analyzing agent will return to CA an integer value in the range of[-1, 1]: 1 for 100% probability for a buy signal, -1 for 100% probability for a sellsignal. If the sum of the returned value is greater than 1.5 then a buy signal istriggered and if is lower than -1.5 a sell signal is triggered. Our system providesa probability of 100% that the next day price will rise if all three analyzingagents return +1 value to CA. In Table 1 and Table 2 we present the weightsfor computing the return value for CA.
For Technical Analysis - Profit Methods Agent we have weight(y) = 0.25 foreach analyzing method. These weights are multiplied with +1 if we have a buysignal, 0 if we cannot distinguish a signal, and -1 if we have a sell signal. Theresult of this multiplication is then returned by each analyzing agent to CA.
Symbol Query Agent (SQA)
CA starts the analysis by signaling SQA to query the stock database serversabout a particular share. Our system uses the services provided by SSIFBro-ker.ro, due to its simple method for downloading the historical data form BSE
338 M. Tirea, I. Tandau, and V. Negru
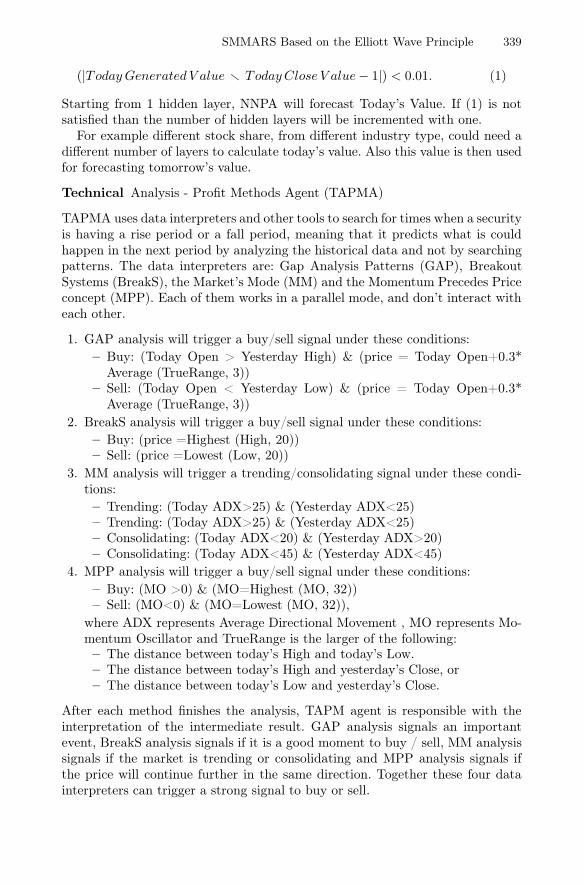
Table 1. Neural Network Prediction Agent Weight Distribution
ForecastedPrice
Difference(diff)
0<|diff|<2.5% 2.5%<|diff|<5% 5%<|diff|<10% 10%<|diff|<15%
Weight(y) 0.25 0.5 0.75 1
Table 2. Elliott Wave Agent Weight Distribution
Elliott Wave Number 1 2 3 4 5 a b cWeight(y) - 0.5 1 0.66 0.33 -1 -0.66 -0.33
by using the HTTP portal and Comma-Separated Variables (CVS) files. Thesymbol market and period can be specified in the HTTP address. Also thisagent can be modified for downloading data directly from BSE web server.
Parse Info Agent (PIA)
The data downloaded is then used by PIA in order to parse the essential infor-mation and will save the data into Temporary Stock Data Storage. This StockData can be then used by the other agents for analyze. When PIA is complete,CA signals Elliott Wave Agent, Technical Analysis Profitable Methods Agentand Neural Network Prediction Agent for a parallel analysis of the historicaldata.
Elliott Wave Agent (EWA)
After receiving the Begin Analysis signal from CA, the EWA will start to ana-lyze the data gathered by PIA on cycles and try to forecast market trends, bysearching for extremes values in investor psychology, highs and lows in prices.The Elliott Wave patterns link to form five and three-wave structures whichcan be predicted, regardless of the size or lengths. By distinguishing the wavesand wave structures, the application of the wave principle is a form of patternrecognition.
Neural Network Prediction Agent (NNPA)
NNPA uses Multi-Layer Perceptron Method with variable number of layers inorder to predict tomorrow’s change. Due to the variable number of layers wecan calculate more accurately the predicted values. We discovered, on previousresearch, that we have a better prediction of stock price if we let the neuralnetwork to compute which is the necessary number of hidden layers that itshould use, not to give it a fix number of hidden layers.
We set as the maximum difference value between today close value and todaygenerated value to be 1%, meaning that:
SMMARS Based on the Elliott Wave Principle 339
(|Today Generated V alue � Today Close V alue − 1|) < 0.01. (1)
Starting from 1 hidden layer, NNPA will forecast Today’s Value. If (1) is notsatisfied than the number of hidden layers will be incremented with one.
For example different stock share, from different industry type, could need adifferent number of layers to calculate today’s value. Also this value is then usedfor forecasting tomorrow’s value.
Technical Analysis - Profit Methods Agent (TAPMA)
TAPMA uses data interpreters and other tools to search for times when a securityis having a rise period or a fall period, meaning that it predicts what is couldhappen in the next period by analyzing the historical data and not by searchingpatterns. The data interpreters are: Gap Analysis Patterns (GAP), BreakoutSystems (BreakS), the Market’s Mode (MM) and the Momentum Precedes Priceconcept (MPP). Each of them works in a parallel mode, and don’t interact witheach other.
1. GAP analysis will trigger a buy/sell signal under these conditions:– Buy: (Today Open > Yesterday High) & (price = Today Open+0.3*
Average (TrueRange, 3))– Sell: (Today Open < Yesterday Low) & (price = Today Open+0.3*
Average (TrueRange, 3))2. BreakS analysis will trigger a buy/sell signal under these conditions:
– Buy: (price =Highest (High, 20))– Sell: (price =Lowest (Low, 20))
3. MM analysis will trigger a trending/consolidating signal under these condi-tions:– Trending: (Today ADX>25) & (Yesterday ADX<25)– Trending: (Today ADX>25) & (Yesterday ADX<25)– Consolidating: (Today ADX<20) & (Yesterday ADX>20)– Consolidating: (Today ADX<45) & (Yesterday ADX<45)
4. MPP analysis will trigger a buy/sell signal under these conditions:– Buy: (MO >0) & (MO=Highest (MO, 32))– Sell: (MO<0) & (MO=Lowest (MO, 32)),
where ADX represents Average Directional Movement , MO represents Mo-mentum Oscillator and TrueRange is the larger of the following:– The distance between today’s High and today’s Low.– The distance between today’s High and yesterday’s Close, or– The distance between today’s Low and yesterday’s Close.
After each method finishes the analysis, TAPM agent is responsible with theinterpretation of the intermediate result. GAP analysis signals an importantevent, BreakS analysis signals if it is a good moment to buy / sell, MM analysissignals if the market is trending or consolidating and MPP analysis signals ifthe price will continue further in the same direction. Together these four datainterpreters can trigger a strong signal to buy or sell.
340 M. Tirea, I. Tandau, and V. Negru
4 Results
Our architecture uses JAVA Agent Development (JADE) framework for imple-menting our system agents. By using JADE we can fully distribute the resources,the information and the control on a computer or mobile terminals. The dataused by SMMARS framework are downloaded from the services offered by ssif-brocker.ro, which is a founding member of the Bucharest Stock Exchange.
We test our proposed system on two Bucharest Stock Exchange symbols: OLTand TLV, based on a time frame of one month (March 2012).
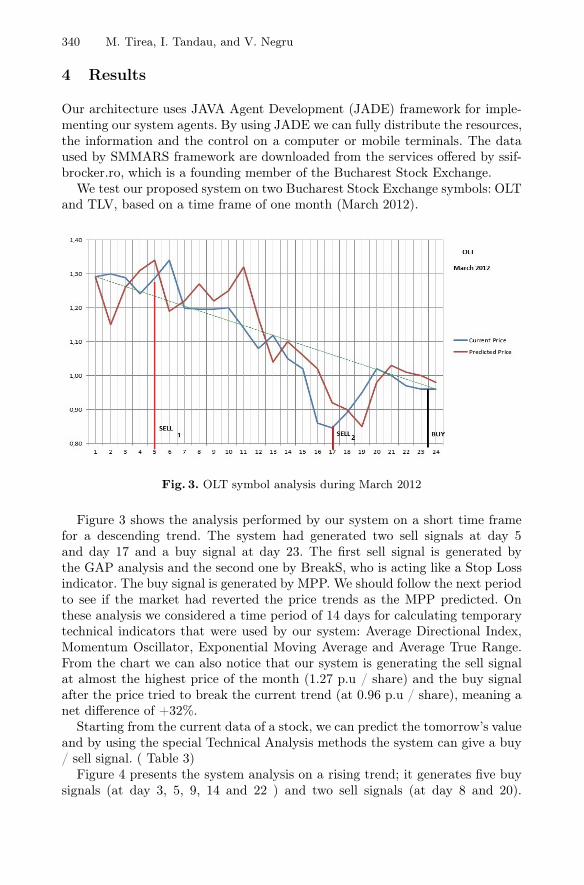
Fig. 3. OLT symbol analysis during March 2012
Figure 3 shows the analysis performed by our system on a short time framefor a descending trend. The system had generated two sell signals at day 5and day 17 and a buy signal at day 23. The first sell signal is generated bythe GAP analysis and the second one by BreakS, who is acting like a Stop Lossindicator. The buy signal is generated by MPP. We should follow the next periodto see if the market had reverted the price trends as the MPP predicted. Onthese analysis we considered a time period of 14 days for calculating temporarytechnical indicators that were used by our system: Average Directional Index,Momentum Oscillator, Exponential Moving Average and Average True Range.From the chart we can also notice that our system is generating the sell signalat almost the highest price of the month (1.27 p.u / share) and the buy signalafter the price tried to break the current trend (at 0.96 p.u / share), meaning anet difference of +32%.
Starting from the current data of a stock, we can predict the tomorrow’s valueand by using the special Technical Analysis methods the system can give a buy/ sell signal. ( Table 3)
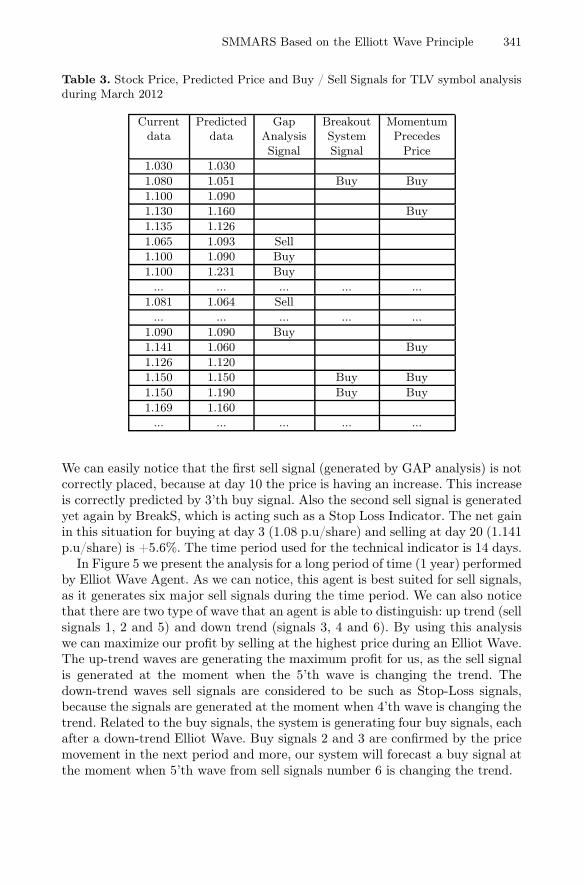
Figure 4 presents the system analysis on a rising trend; it generates five buysignals (at day 3, 5, 9, 14 and 22 ) and two sell signals (at day 8 and 20).
SMMARS Based on the Elliott Wave Principle 341
Table 3. Stock Price, Predicted Price and Buy / Sell Signals for TLV symbol analysisduring March 2012
Currentdata
Predicteddata
GapAnalysisSignal
BreakoutSystemSignal
MomentumPrecedes
Price1.030 1.0301.080 1.051 Buy Buy1.100 1.0901.130 1.160 Buy1.135 1.1261.065 1.093 Sell1.100 1.090 Buy1.100 1.231 Buy
... ... ... ... ...1.081 1.064 Sell
... ... ... ... ...1.090 1.090 Buy1.141 1.060 Buy1.126 1.1201.150 1.150 Buy Buy1.150 1.190 Buy Buy1.169 1.160
... ... ... ... ...
We can easily notice that the first sell signal (generated by GAP analysis) is notcorrectly placed, because at day 10 the price is having an increase. This increaseis correctly predicted by 3’th buy signal. Also the second sell signal is generatedyet again by BreakS, which is acting such as a Stop Loss Indicator. The net gainin this situation for buying at day 3 (1.08 p.u/share) and selling at day 20 (1.141p.u/share) is +5.6%. The time period used for the technical indicator is 14 days.
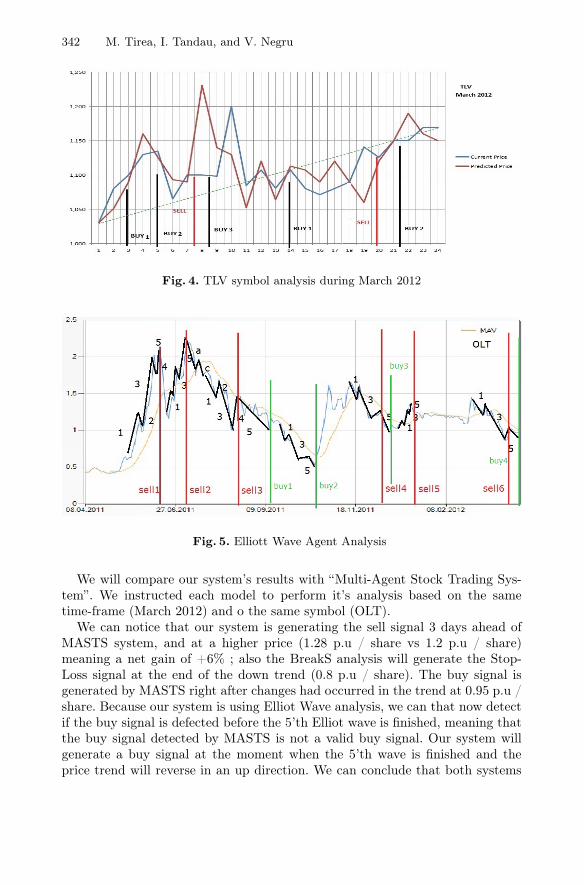
In Figure 5 we present the analysis for a long period of time (1 year) performedby Elliot Wave Agent. As we can notice, this agent is best suited for sell signals,as it generates six major sell signals during the time period. We can also noticethat there are two type of wave that an agent is able to distinguish: up trend (sellsignals 1, 2 and 5) and down trend (signals 3, 4 and 6). By using this analysiswe can maximize our profit by selling at the highest price during an Elliot Wave.The up-trend waves are generating the maximum profit for us, as the sell signalis generated at the moment when the 5’th wave is changing the trend. Thedown-trend waves sell signals are considered to be such as Stop-Loss signals,because the signals are generated at the moment when 4’th wave is changing thetrend. Related to the buy signals, the system is generating four buy signals, eachafter a down-trend Elliot Wave. Buy signals 2 and 3 are confirmed by the pricemovement in the next period and more, our system will forecast a buy signal atthe moment when 5’th wave from sell signals number 6 is changing the trend.
342 M. Tirea, I. Tandau, and V. Negru
Fig. 4. TLV symbol analysis during March 2012
Fig. 5. Elliott Wave Agent Analysis
We will compare our system’s results with “Multi-Agent Stock Trading Sys-tem”. We instructed each model to perform it’s analysis based on the sametime-frame (March 2012) and o the same symbol (OLT).
We can notice that our system is generating the sell signal 3 days ahead ofMASTS system, and at a higher price (1.28 p.u / share vs 1.2 p.u / share)meaning a net gain of +6% ; also the BreakS analysis will generate the Stop-Loss signal at the end of the down trend (0.8 p.u / share). The buy signal isgenerated by MASTS right after changes had occurred in the trend at 0.95 p.u /share. Because our system is using Elliot Wave analysis, we can that now detectif the buy signal is defected before the 5’th Elliot wave is finished, meaning thatthe buy signal detected by MASTS is not a valid buy signal. Our system willgenerate a buy signal at the moment when the 5’th wave is finished and theprice trend will reverse in an up direction. We can conclude that both systems
SMMARS Based on the Elliott Wave Principle 343
Fig. 6. Comparison between the Stock Market Multi-Agent Recommendation System(SMMARS) and Multi-Agent Stock Trading System (MASTS) buy / sell signals
can detect buy/sell signals at good price/share ratio, but because our proposedsystem is implementing the Elliot Wave principle, we can detect if non-validsignals appear. Also our system is implementing a Stop-Loss mechanism whichis able to save future losses.
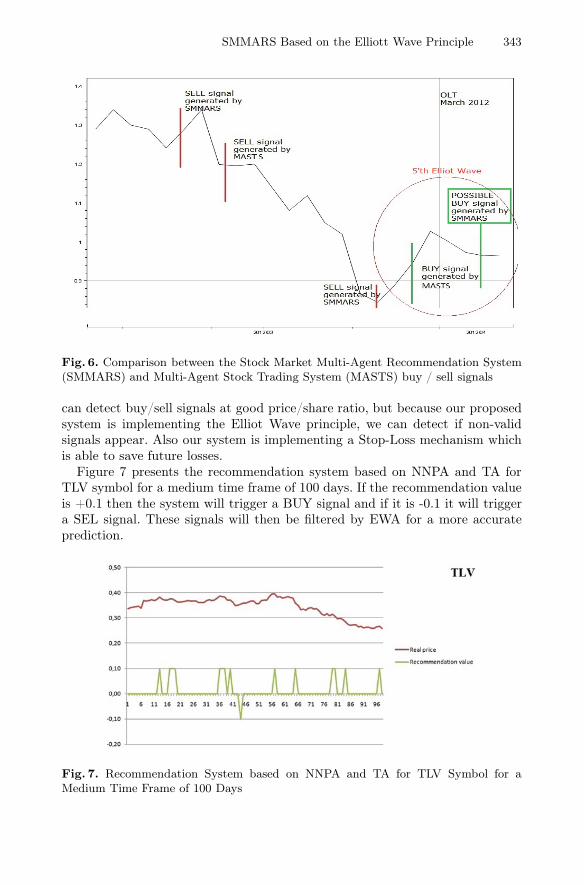
Figure 7 presents the recommendation system based on NNPA and TA forTLV symbol for a medium time frame of 100 days. If the recommendation valueis +0.1 then the system will trigger a BUY signal and if it is -0.1 it will triggera SEL signal. These signals will then be filtered by EWA for a more accurateprediction.
Fig. 7. Recommendation System based on NNPA and TA for TLV Symbol for aMedium Time Frame of 100 Days
344 M. Tirea, I. Tandau, and V. Negru
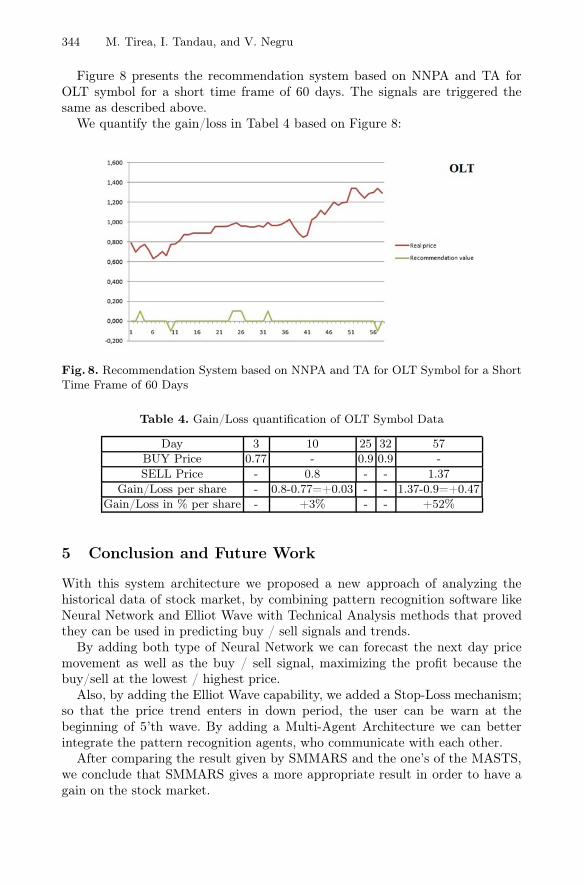
Figure 8 presents the recommendation system based on NNPA and TA forOLT symbol for a short time frame of 60 days. The signals are triggered thesame as described above.
We quantify the gain/loss in Tabel 4 based on Figure 8:
Fig. 8. Recommendation System based on NNPA and TA for OLT Symbol for a ShortTime Frame of 60 Days
Table 4. Gain/Loss quantification of OLT Symbol Data
Day 3 10 25 32 57BUY Price 0.77 - 0.9 0.9 -SELL Price - 0.8 - - 1.37
Gain/Loss per share - 0.8-0.77=+0.03 - - 1.37-0.9=+0.47Gain/Loss in % per share - +3% - - +52%
5 Conclusion and Future Work
With this system architecture we proposed a new approach of analyzing thehistorical data of stock market, by combining pattern recognition software likeNeural Network and Elliot Wave with Technical Analysis methods that provedthey can be used in predicting buy / sell signals and trends.
By adding both type of Neural Network we can forecast the next day pricemovement as well as the buy / sell signal, maximizing the profit because thebuy/sell at the lowest / highest price.
Also, by adding the Elliot Wave capability, we added a Stop-Loss mechanism;so that the price trend enters in down period, the user can be warn at thebeginning of 5’th wave. By adding a Multi-Agent Architecture we can betterintegrate the pattern recognition agents, who communicate with each other.
After comparing the result given by SMMARS and the one’s of the MASTS,we conclude that SMMARS gives a more appropriate result in order to have again on the stock market.
SMMARS Based on the Elliott Wave Principle 345
As a future work, we propose to solve the risk management problems in orderto minimize the losses on a portfolio and to take decision based on noises, howmuch and in which circumstances these noises can influence the market trend.
This system can be used in order to generate forecasts based on historicaldata in tourism domain such as the number of specific utilities and the servicedemands that must be used in order to attract tourist in a region.
Acknowledgment. This work was partially supported by the strategic grantPOSDRU/CPP107/ DMI1.5/S/78421, Project ID 78421 (2010), co-financed bythe European Social Fund – Investing in People, within the Sectorial OperationalProgram Human Resources Development 2007 – 2013.
And, partially supported by the grant of the European Commission FP7-REGPOT-CT-2011-284595 (HOST) and Romanian national grant PN-II-ID-PCE-2011-3-0260(AMICAS).
References
1. Atsalakis, G.S., Dimitrakakis, E.M., Zopounidis, C.D.: Elliott Wave Theory andneuro-fuzzy systems, in stock market prediction: The WASP system. Expert Sys-tems with Applications 38, 9196–9206 (2011)
2. Chang, P.-C., Liu, C.-H., Lin, J.-L., Fan, C.-Y., Ng, C.S.P.: A neural network witha case based dynamic window for stock trading prediction. Expert Systems withApplications 36(3, Pt. 2), 6889–6898 (2009)
3. Guresen, E., Kayakutlu, G., Daim, T.U.: Using artificial neural network mod-els in stock market index prediction. Expert Systems with Applications 38(8),10389–10397 (2011)
4. Tirea, M., Tandau, I., Negru, V.: Multi-Agent Stock Trading Algorithm Model. In:SYNASC - 13th International Symposium on Symbolic and Numeric Algorithmsfor Scientific Computing, Timisoara, September 26-29, pp. 365–372 (2011)
5. Lam, M.: Neural network techniques for financial performance prediction: integrat-ing fundamental and technical analysis. Decision Support Systems 37(4), 567–581(2004)
6. Poser, S.W.: Applying Elliott Wave Theory Profitably. Wiley & Son (2003)7. Ruggiero Jr., M.: Cybernetic Trading Strategies - Developing a Profitable Trading
System with State-of-the-Art Technologies. John Wiley & Son (1997)8. Khan, Z.H., Alin, T.S., Hussain, M.: Price Prediction of Share Market using
Artificial Neural Networks (ANN). International Journal of Computer Applica-tions 22(2), 42–47 (2011)
9. Schumakera, R.P., Chenb, H.: A quantitative stock prediction system based onfinancial news. Information Processing & Management 45(5), 571–583 (2009)
10. Alsubaiea, A., Najand, M.: Trading volume, time-varying conditional volatility, andasymmetric volatility spillover in the Saudi stock market. Journal of MultinationalFinancial Management 19(2), 139–159 (2009)

346 M. Tirea, I. Tandau, and V. Negru
11. Wanga, J.-L., Chan, S.-H.: Stock market trading rule discovery using pattern recog-nition and technical analysis. Expert Systems with Applications 33(2), 304–315(2007)
12. Pierdziocha, C., Döpkeb, J., Hartmanna, D.: Forecasting stock market volatil-ity with macroeconomic variables in real time. Journal of Economics and Busi-ness 60(3), 256–276 (2008)
13. Boroden, C.: Fibonacci Trading: How to Master the Time and Price Advantage.McGraw-Hill (2008)