living near the edge: being close to mature forest ...ecite.utas.edu.au/98524/1/fountain jones...
TRANSCRIPT
Ecological Applications, 25(3), 2015, pp. 800–811� 2015 by the Ecological Society of America
Living near the edge: Being close to mature forest increases the rateof succession in beetle communities
NICHOLAS M. FOUNTAIN-JONES,1,4 GREGORY J. JORDAN,1 THOMAS P. BAKER,1 JAYNE M. BALMER,2 TIM WARDLAW,3
AND SUSAN C. BAKER1,3
1School of Biological Sciences, University of Tasmania, Hobart 7001 Australia2School of Land and Food, University of Tasmania, Hobart 7001 Australia
3Forestry Tasmania, Hobart 7001 Australia
Abstract. In increasingly fragmented landscapes, it is important to understand howmature forest affects adjacent secondary forest (forest influence). Forest influence onecological succession of beetle communities is largely unknown. We investigated successionand forest influence using 235 m long transects across boundaries between mature andsecondary forest at 15 sites, sampling a chronosequence of three forest age classes (5–10, 23–29, and 42–46 years since clear-cutting) in tall eucalypt forest in Tasmania, Australia. Ourresults showed that ground-dwelling beetle communities showed strong successional changes,and in the oldest secondary forests, species considered indicators of mature forest hadrecolonized to abundance levels similar to those observed within adjacent mature foreststands. However, species composition also showed forest influence gradients in all age classes.Forest influence was estimated to extend 13 m and 20 m in the youngest and intermediate-agedsecondary forests, respectively. However, the estimated effect extended to at least 176 m in theoldest secondary forest. Our environmental modeling suggests that leaf litter, microclimate,and soil variables were all important in explaining the spatial variation in beetle assemblages,and the relative importance of factors varied between secondary forest age classes.
Mature-forest beetle communities can recolonize successfully from the edge, and our resultsprovide a basis for land managers to build mature habitat connectivity into forest mosaicstypical of production forests. Our results also indicate the importance of forest influence indetermining potential conservation value of older secondary forest for beetles.
Key words: Coleoptera; ecotone; Eucalyptus; forest influence; gradient forests modeling; litter input;secondary forest.
INTRODUCTION
Natural and human-induced disturbance have led to
forest landscapes that are increasingly fragmented,
especially in production forest. Species with a strong
dependence on mature forest can be particularly vulner-
able in such landscapes, and biodiversity conservation
strategies usually focus on protecting these species in
large reserves. However, these reserves are often discon-
nected and distant from production forest areas, and are
unlikely to be large enough on their own to maintain
viable populations of all these species. Complementary
management of production forest landscapes may im-
prove the long-term survival prospects of many such
species (Spence et al. 1996). However, this management
depends on understanding how mature-forest species
recolonize secondary forest, and particularly the biotic
effects of the forest edges found throughout fragmented
landscapes (Hopp et al. 2010, Baker et al. 2013a).
The extensive literature describing edge effects largely
focuses on the biotic impacts of disturbed forest on the
interior of mature forest remnants (Harper et al. 2005).
However, relatively few studies have assessed the
opposite effect: how mature forest affects adjacent
disturbed habitat (Baker et al. 2013a). This forest
influence (Keenan and Kimmins 1993, Beese et al.
2003) involves a complex set of biotic and abiotic factors
affecting the survival and establishment of many
elements of the biota. In particular, proximity to mature
forest may endow disturbed forest with mature forest
environmental attributes that can facilitate survival and/
or reestablishment by species adapted to mature forest
conditions (Tabor et al. 2007). Shading from the edge,
for example, results in cooler and moister conditions
that favor rainforest species (Tabor et al. 2007). Forest
influence effects have been shown for vascular plants
(e.g., Matlack 1994, Tabor et al. 2007), non-vascular
plants (Baker et al. 2013b), amphibians (Demaynadier
and Hunter 2008), and invertebrates (e.g., Koivula et al.
2002, Siira-Pietikainen and Haimi 2009). For inverte-
brates, several studies show declines in species affiliated
with mature forests with distance from old-growth forest
(Spence et al. 1996, Buddle et al. 2006, Jonsson and
Nordlander 2006). Forest influence can facilitate recol-
onization for a variety of groups and in a variety of
Manuscript received 16 February 2014; revised 30 July 2014;accepted 12 August 2014. Corresponding Editor: A. K. Brody.
4 E-mail: [email protected]
800
systems, though the underlying mechanisms are poorly
understood.
Forest influence on regeneration operates through
mature forest both providing a source of species for
recolonization and moderating the environment of the
regenerating forest. Major disturbance will typically
eliminate mature forest microhabitat and the subset of
species with strict dependence on such microhabitats
(Spence et al. 1996), and such species are typically
presumed to recolonize from adjacent mature forests
(Lemieux and Lindgren 2004, Chazdon et al. 2009,
Hopp et al. 2010). Gradients of forest influence within
regenerating forest may therefore involve dispersal
limitation; species which are dispersal limited are more
likely to recolonize areas closer to the source mature
forest (Niemela et al. 1993, Michaels and McQuillan
1995, Koivula et al. 2002). The successional processes of
colonization and stand development naturally lead to
changes in the forest environment, particularly in the
forest understory, which in turn can facilitate the
recolonization of mature-forest species from other taxa.
For example, plant detritus, forest canopy cover, and
microclimate all change with vegetation succession in
ways that can be relevant to recolonization by inverte-
brates (Magura et al. 2002, Hopp et al. 2010, Roume et
al. 2011). Leaf litter and coarse woody debris provide
food resources, predator protection, and increased
insulation against microclimate extremes (Koivula et
al. 1999, Jonsson and Nordlander 2006, Entling et al.
2007, Nakamura et al. 2009, Grove and Forster 2011).
Other factors related to succession, e.g., soil chemistry,
can affect invertebrates (Schwerk and Szyszko 2007,
Antvogel and Bonn 2008, Cornellise and Hafernik 2009,
Walker et al. 2010). Shading provided by the mature
forest causes microclimatic gradients that are important
in determining beetle community composition (Spence et
al. 1996, Nakamura et al. 2009), by affecting the beetles
directly and indirectly through impacts on vegetation
and soil characteristics (Matlack 1994). In particular,
canopy closure is typically associated with large changes
in microclimate that are pertinent to arthropod com-
munity succession (Niemela et al. 1996, Nakamura et al.
2009).
Litter-dwelling beetles (Coleoptera) are a particularly
suitable group for investigating forest influence, as they
are both ecologically important and amenable to study.
They are abundant, relatively easy to sample and
identify, and many taxa are sensitive to forest distur-
bance, including disturbance created by forest harvest-
ing (e.g., Rosenvald and Lohmus 2008, Baker et al.
2009a, Hyvarinen et al. 2009). Determining the main
factors driving forest influence on beetle communities is
important for developing forest management practices
that improve outcomes for biodiversity conservation
through the maintenance or restoration of landscape
connectivity. How far the forest influence effect extends
into secondary forest and how this pattern changes
across successional time is largely unknown.
This study therefore aims to assess how ground-
dwelling beetle communities respond to forest influenceand community turnover from mature into secondary
forest by using a chronosequence approach. In partic-ular, we focus on the spatial scale of forest influence (as
measured using depth of forest influence, DFI). Wehypothesize that dispersal is a critical factor that drivesforest influence on successional change post harvest.
Furthermore, we investigate and report on whichenvironmental factors are driving edge gradients and
beetle recolonization in three forest age classes (5–10,23–29, and 42–46 years since clear-cutting) in tall
eucalypt forest in Tasmania, Australia.
METHODS
Study sites
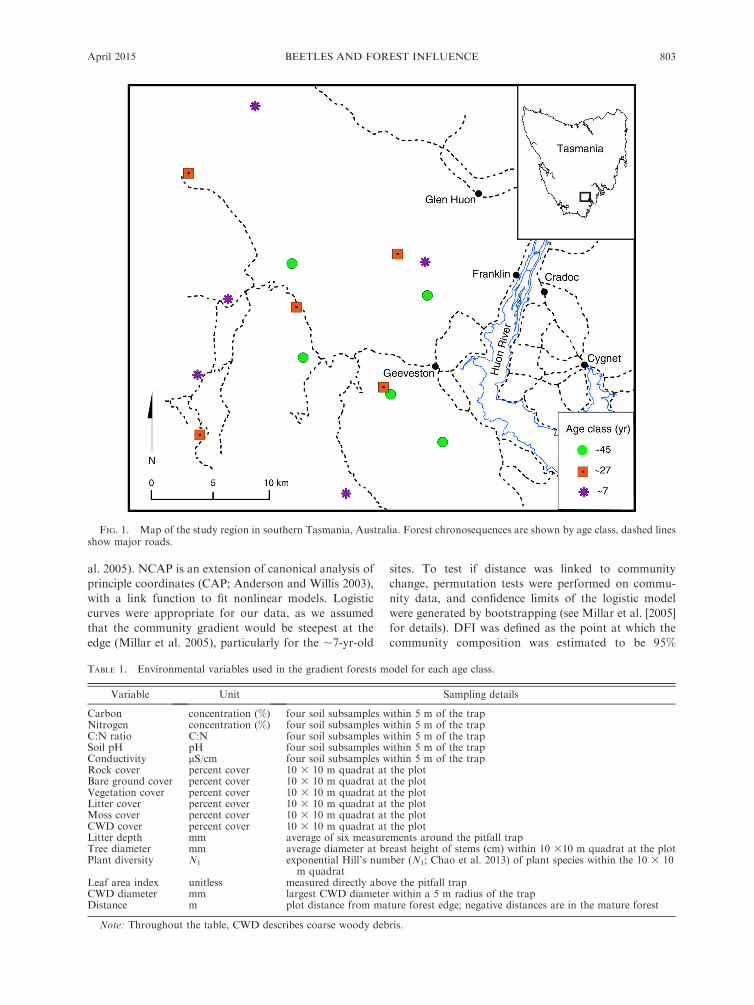
Fifteen sites were selected in Tasmania’s Southern
Forests region (see Fig. 1), within and adjacent to theWarra Long-Term Ecological Research (LTER) area(see Brown et al. 2001). Each site was established to
contain a boundary between mature unlogged forest anda harvested area in its first rotation after clear-fell, burn,
and sow silviculture (see Hickey [1994] for details).Mature forest was defined as forest possessing repro-
ductively active eucalypt and rainforest species at thetime of logging and that had not been significantly
disturbed by wildfire for at least 40 yr before the site washarvested. The unlogged mature forest had at least one
age cohort of eucalypts older than 110 yr (Turner et al.2009) that formed the upper canopy up to 50 m tall, had
not been significantly disturbed by wildfires for at least70 yr, and had an understory stratum comprising a
heterogeneous mix of sclerophyllous and rainforest treespecies. Sclerophyllous species dominate the understory
during the initial period after a fire, with a progressiveenrichment by rainforest elements as the interval sincethat last fire increases.
The experiments employed a balanced design with five
replicate sites for each of three age classes of silvicul-turally regenerated forest. The three age classes com-prised sites averaging ;45 yr (harvested between 1966
and 1970), ;27 yr (harvested between 1983 and 1989),and ;7 yr (harvested between 2002 and 2007) post
disturbance (see Appendix A: Table A1). Forests ;7 yrold were dominated by emerging eucalypts and scle-
rophyllous species both up to 7 m in height, with thesedge Gahnia grandis forming a ground cover. After a
further 20 yr, the eucalypts and sclerophyllous specieshad formed a dense canopy on average 22 m in height
and the sedge was in decline. In ;45-yr-old forest, thecanopy reached approximately 27 m.
At each site, three transects were established perpen-dicular to the boundary between mature and silvicul-
tural forest, starting 35 m within mature forest andending 200 m inside the harvested site. We used designs
with unequal distances between plots to focus samplingwhere edge effects are more likely (Harper et al. 2005,
Baker et al. 2007, Ewers and Didham 2008). Plots were
April 2015 801BEETLES AND FOREST INFLUENCE
established in the mature forest at�35 and�15 m from
the edge (35 and 15 m into the mature forest,
respectively) and into the harvested areas at 15, 35, 70,
120, and 200 m. Thus there were 315 plots (15 sites 3 3
transects 3 7 distances). The height of mature forest at
our study sites was approximately 40–65 m, hence plot
distances were located both within and beyond one
mature-forest tree height into harvested areas. Spatial
autocorrelation and depletion effects are not significant
for pitfall-trap sampling in this forest type (Baker and
Barmuta 2006).
Each site was controlled for slope (no greater than
108), altitude (100–350 m above sea level), and distance
from the next site of the same age class (.5 km). We
excluded sites close to rivers and major creeks, but
tolerated small creeks and streams, as they are
ubiquitous in the landscape. Sites bisected by roads
were excluded and all plots were at least 40 m from any
road or track.
Beetle sampling
Pitfall trapping is a common method of collecting
beetle community data in wet forests (Niemela et al.
1993, Baker et al. 2007, 2009). We deployed a single
pitfall trap in each of the 315 plots. To replace traps lost
through flooding or disturbance, we placed an addition-
al trap ;20 m from the main pitfall in the middle
transect of each site. Only 33 of these additional pitfalls
were required. Each trap was constructed from 150 mm
lengths of 8.5 cm diameter PVC pipe buried in the soil,
with plastic cups (8.6 cm diameter, 12.2 cm height) inside
the pipe, flush with the soil surface. Approximately 200
mL of 100% propylene glycol (Fronine, Riverstone,
Australia) was added to each trap as a preservative. A
protective plastic plate (180 mm diameter) was posi-
tioned 2 cm above the trap to prevent flooding and
disturbance. Traps were operational for exactly 30 d for
each of three sampling periods (spring, summer, and
autumn 2011, 2012). Traps were then collected and the
contents transferred immediately to 96% ethanol
(Merck, Kylsyth, Australia).
All beetles were then identified to morphospecies
(sensu Oliver and Beattie 1996). Of these morphospe-
cies, 27% were assigned to species, another 58% to
genus, and the remainder (15%) to subfamily or family
using keys (Lawrence et al. 1999), specimen matching to
the Tasmanian Forest Insect Collection (TFIC; Forestry
Tasmania, Hobart, Australia), or by expert assistance.
Seasonal effects were not central to our hypotheses, so
data were pooled across seasons to maximize commu-
nity signals.
Vegetation and environmental data
We measured 17 environmental and biotic variables
from all plots and two microclimatic variables from the
middle transect plots (Table 1). Vegetation cover, plant
species diversity, average tree diameter, and percent
cover of litter, moss, and coarse woody debris (CWD)
were measured in 10 3 10 m quadrats adjacent to the
pitfall trap. Maximum diameter of woody material was
also measured at each quadrat (minimum diameter 5
mm). At each quadrat, four 0–10 cm depth soil cores
were taken and combined together. Within 48 h of
collection, each sample was stored in a paper bag in a
cool, dry area until ready for analysis. Soil was sieved
using a 2-mm sieve to remove leaf litter, roots, and
rocks, and then ground in a mortar and pestle. The soil
pH and conductivity were measured using a Palintest
pH meter (Gateshead, UK) and an Elmetron CPC-411
conductivity meter (Zabrze, Poland), calibrated on each
day of testing. We followed the Palintest procedure of
shaking a 1:4 solution of soil to distilled water for 1 min
prior to taking the pH meter reading. For conductivity,
we used a 1:5 solution of soil to distilled water shaken
for 2 min, and allowed this to settle before reading as per
the manufacturer’s instructions. Nitrogen and carbon
were analyzed using a Perkins Elmer Series II 2400
CHNS/O Elemental Analyzer (Waltham, Massachu-
setts, USA), following the manufacturer’s protocol.
Litter depth was also recorded, with four measure-
ments taken to the nearest millimeter with vernier
calipers (Mitutoyo, Kawasaki, Japan) within 1 m of
pitfall traps and then averaged. Leaf area index (LAI)
was measured directly over the trap using hemispherical
photography and analyzed using Scion Image (Breda
2003). Hobo temperature and humidity loggers (Onset,
Bourne, Massachusetts, USA) were placed within a 2 m
radius of each trap 20 cm above the ground on the
middle transect at each site, and measured temperature
and relative humidity every 15 min for the duration of
the study.
Statistical analysis
To test for distance and age effects on species
abundance and richness, a two-way factorial ANOVA
was conducted with forest age and distance as factors.
Indicator species analysis was performed for each age
class on common species (.5 individuals). This analysis
(presented in Appendix D: Table D1) was designed to
provide information about likely habitat preferences of
individual species. To enable this, plots were divided
into mature (�15,�35 m), near edge (15, 35 m), and far
from edge (120, 200 m) categories for each forest age,
and 70-m plots were excluded to keep a balanced design.
This analysis was performed using the package indic-
species in R (De Caceres et al. 2012). However, to ensure
objectivity, unless otherwise stated, species categorized
as mature-forest indicators for further testing of the
response of such species to distance or succession were
based on a previous study (Baker 2006), rather than the
analysis of species from the present study.
For multivariate analyses, we used Bray-Curtis
similarity matrices of square-root-transformed abun-
dance data. We predicted DFI using nonlinear canonical
analysis of principle coordinates (NCAP) to estimate the
logistic gradient in the beetle community data (Millar et
NICHOLAS M. FOUNTAIN-JONES ET AL.802 Ecological ApplicationsVol. 25, No. 3
al. 2005). NCAP is an extension of canonical analysis of
principle coordinates (CAP; Anderson and Willis 2003),
with a link function to fit nonlinear models. Logistic
curves were appropriate for our data, as we assumed
that the community gradient would be steepest at the
edge (Millar et al. 2005), particularly for the ;7-yr-old
sites. To test if distance was linked to community
change, permutation tests were performed on commu-
nity data, and confidence limits of the logistic model
were generated by bootstrapping (see Millar et al. [2005]
for details). DFI was defined as the point at which the
community composition was estimated to be 95%
FIG. 1. Map of the study region in southern Tasmania, Australia. Forest chronosequences are shown by age class, dashed linesshow major roads.
TABLE 1. Environmental variables used in the gradient forests model for each age class.
Variable Unit Sampling details
Carbon concentration (%) four soil subsamples within 5 m of the trapNitrogen concentration (%) four soil subsamples within 5 m of the trapC:N ratio C:N four soil subsamples within 5 m of the trapSoil pH pH four soil subsamples within 5 m of the trapConductivity lS/cm four soil subsamples within 5 m of the trapRock cover percent cover 10 3 10 m quadrat at the plotBare ground cover percent cover 10 3 10 m quadrat at the plotVegetation cover percent cover 10 3 10 m quadrat at the plotLitter cover percent cover 10 3 10 m quadrat at the plotMoss cover percent cover 10 3 10 m quadrat at the plotCWD cover percent cover 10 3 10 m quadrat at the plotLitter depth mm average of six measurements around the pitfall trapTree diameter mm average diameter at breast height of stems (cm) within 10 310 m quadrat at the plotPlant diversity N1 exponential Hill’s number (N1; Chao et al. 2013) of plant species within the 10 3 10
m quadratLeaf area index unitless measured directly above the pitfall trapCWD diameter mm largest CWD diameter within a 5 m radius of the trapDistance m plot distance from mature forest edge; negative distances are in the mature forest
Note: Throughout the table, CWD describes coarse woody debris.
April 2015 803BEETLES AND FOREST INFLUENCE
similar to interior disturbed forest along our 200-m
transects in harvested secondary forest. Rare species
were omitted from analyses if they occurred in ,5 plots.
NCAP was conducted in R version 3.02 (R Develop-
ment Core Team 2013) using 9999 randomizations (see
Supplement). The forest influence effect on the abun-
dance of Tasmanian mature wet-forest indicator species
(see Baker 2006) was analyzed using quasi-Poisson
regression, as the variance was much greater than the
mean.
The effects of site and distance from edge on beetle
community composition were tested for each age using a
mixed permutational MANOVA (PERMANOVA)
model (Anderson 2001), treating site as a random effect
and distance as a fixed effect. The permutation tests of
significance were based on 9999 unrestricted permuta-
tions of the raw data where the three transects were
considered replicates. PERMANOVAs were also used
to test for successional age differences. In this case, only
data sampled from mature forest (�15 and �35 m) and
from 120 and 200 m into secondary forest were analyzed
to avoid the edge transition zone. As mature plots were
not independent of adjacent secondary forest plots, one-
way fixed PERMANOVA was used to test for differ-
ences between mature forest and adjacent secondary
forest for each age. Differences between secondary-
forest communities were separately tested using a two-
way PERMANOVA with age fixed and site as a random
factor. CAP analysis was also used to test and visualize
the differences between mature forest and each of the
age classes. The CAP ordination was constrained by
distance. These tests were conducted using PRIMER 6
PERMANOVAþ (Anderson et al. 2008). Two-way
factorial ANOVA was also used to test the differences
in abundance of species associated with mature forests
(Baker 2006) between each secondary forest stage and
corresponding mature forest, with age and disturbance
(i.e., mature or secondary forest) as factors.
Distance-based linear models (DISTLM; Anderson
and Legendre 1999, McArdle and Anderson 2001) were
used to model community response to the environmental
predictors (Table 1). The complete environmental data
set was screened for multi-collinearity and, as DISTLM
fits a linear model, leaf litter, rock, and bare ground
cover were log-transformed to normalize variance. The
procedure was performed using the BEST selection
procedure in PRIMER 6 PERMANOVAþ (Anderson et
al. 2008). Gradient forest modeling was not appropriate
for use on the successional data set as, unlike DISTLM,
this modeling procedure is not suitable when only a low
number of plots are considered (,100; R. Thomson,
personal communication).
To understand how vegetation and environmental
covariates affected community turnover within age
classes, we used gradient forest modeling (GFM; Ellis
et al. 2012) on the beetle abundance data set. GFM is
an extension of the random forests machine learning
tree ensemble model that analyzes community-wide
responses to environmental gradients (Ellis et al. 2012).
Random forest methods are useful for understanding
community responses to gradients because they do not
assume linearity of predictor or response variables and
are not sensitive to highly correlated environmental
variables (Strobl et al. 2008). GFM modeling assembles
a large number of decision trees, and collates the
distribution of splits in the tree (Thomson et al. 2014).
Cumulative distribution of splits or cumulative impor-
tance curves are generated for each species and provide
a measure of community change in n-dimensional
environmental space (Thomson et al. 2014). Each tree
is generated using a random partitioning procedure
based on a subset of plots and cross-validated using the
remaining plots. Each split is selected from ;27% of
the predictor variables, in our case five out of 19
environmental variables. Covariate importance is
calculated by randomly permuting each variable and
estimating the degradation of explanatory performance
(see Ellis et al. [2012] for more details). We modeled
changes in community composition in each age class
using 17 of the environmental variables measured
(Table 1; two of the 19 variables measured were
collinear, and thus excluded from analysis). Microcli-
matic variables were excluded because they were only
available for one transect per site. All plots were
included, beetle abundance data was square-root-
transformed, and species were omitted from analysis
if they occurred in ,5 plots in each age. In total, 1000
trees were generated for each species. GFM analysis
was conducted in R using the package gradientForest
(package available online).5 R script is provided in the
Supplement.
Nonlinear regressions were conducted in R to further
assess the relationships between distance and tempera-
ture, humidity, and other important variables identified
in the GFM for each age.
RESULTS
Beetle forest influence gradient
In total, 11 830 beetles from 271 species were
collected. There was no overall significant relationship
between distance from edge and total beetle abundance
and species richness in any age class, although average
beetle abundance was highest in the 15-m plots in all
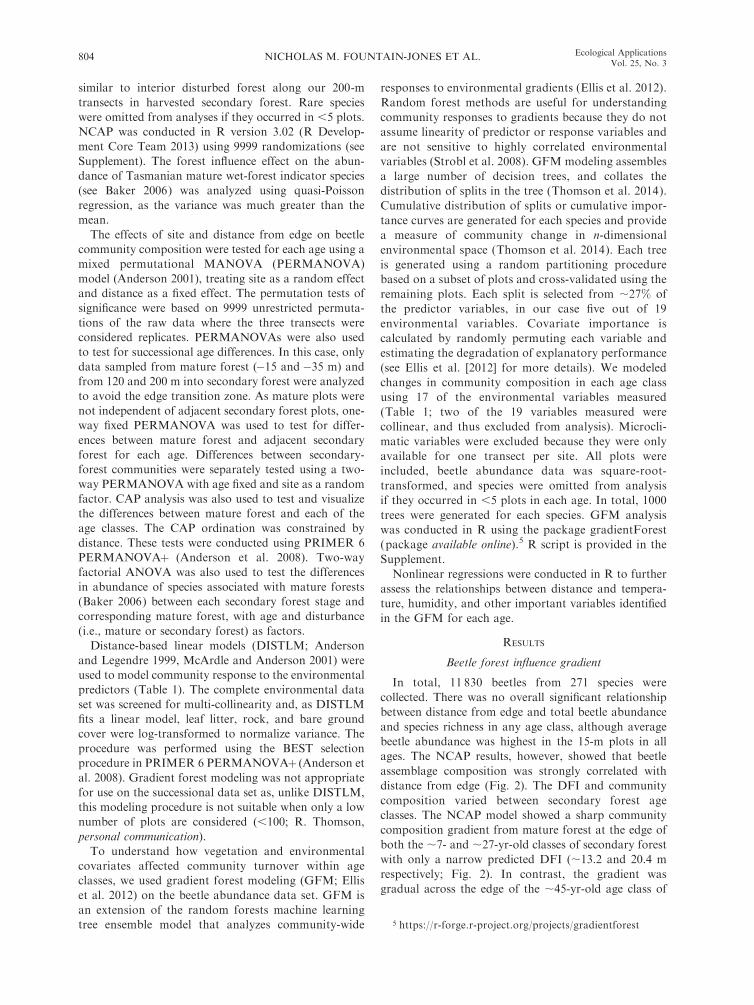
ages. The NCAP results, however, showed that beetle
assemblage composition was strongly correlated with
distance from edge (Fig. 2). The DFI and community
composition varied between secondary forest age
classes. The NCAP model showed a sharp community
composition gradient from mature forest at the edge of
both the ;7- and ;27-yr-old classes of secondary forest
with only a narrow predicted DFI (;13.2 and 20.4 m
respectively; Fig. 2). In contrast, the gradient was
gradual across the edge of the ;45-yr-old age class of
5 https://r-forge.r-project.org/projects/gradientforest
NICHOLAS M. FOUNTAIN-JONES ET AL.804 Ecological ApplicationsVol. 25, No. 3
secondary forest, which had an estimated DFI of 176 m
(Fig. 2). The curve did not plateau at 200 m from theforest boundary and confidence intervals extended
beyond 200 m, which suggests that the transects were
not long enough to incorporate the entire edge gradientfor this age class. The magnitude of community change
was also much less for this age (;0.2, i.e., 20%) over the
transect, compared to ;1 (i.e., 100%) for the younger
stages. The confidence intervals were large for eachforest age class (Fig. 2).
The PERMANOVA results confirmed that distance
from mature forest was an important factor for beetle
communities in each age class (PERMANOVA pairwisetests: for ;7-yr-old, pseudo F6 ¼ 1.366, P ¼ 0.008; for
;27-yr-old, pseudo F4,6 ¼ 1.47, P ¼ 0.018; for ;45-yr-
old, pseudo F4,6 ¼ 1.31, P ¼ 0.013).
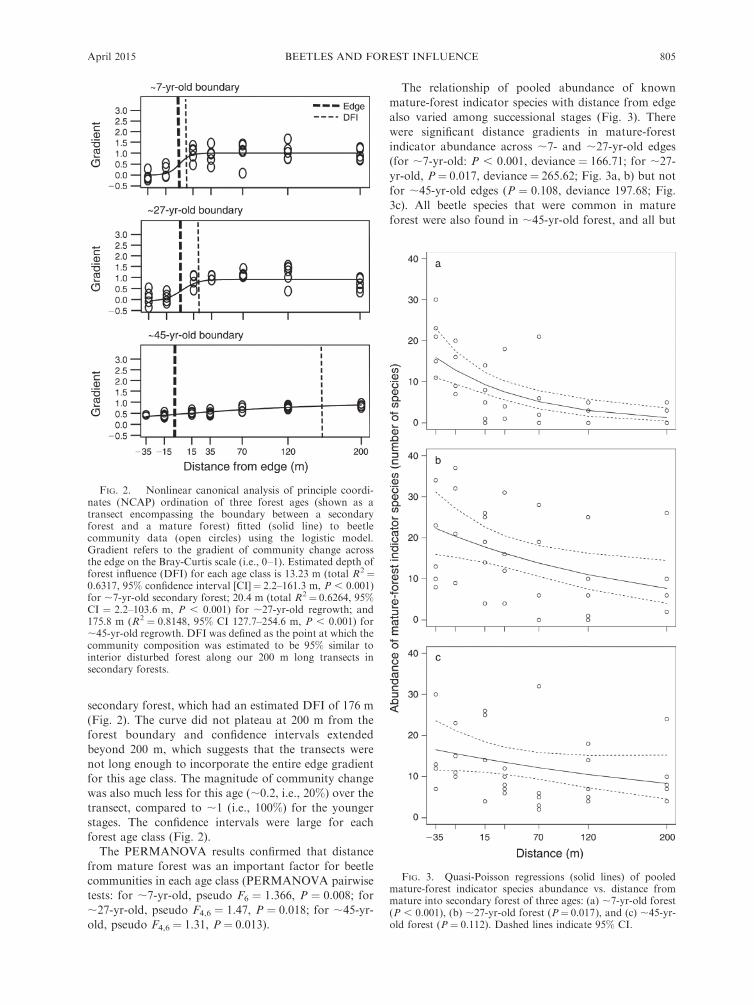
The relationship of pooled abundance of known
mature-forest indicator species with distance from edge
also varied among successional stages (Fig. 3). There
were significant distance gradients in mature-forest
indicator abundance across ;7- and ;27-yr-old edges
(for ;7-yr-old: P , 0.001, deviance ¼ 166.71; for ;27-
yr-old, P¼ 0.017, deviance¼ 265.62; Fig. 3a, b) but not
for ;45-yr-old edges (P ¼ 0.108, deviance 197.68; Fig.
3c). All beetle species that were common in mature
forest were also found in ;45-yr-old forest, and all but
FIG. 2. Nonlinear canonical analysis of principle coordi-nates (NCAP) ordination of three forest ages (shown as atransect encompassing the boundary between a secondaryforest and a mature forest) fitted (solid line) to beetlecommunity data (open circles) using the logistic model.Gradient refers to the gradient of community change acrossthe edge on the Bray-Curtis scale (i.e., 0–1). Estimated depth offorest influence (DFI) for each age class is 13.23 m (total R2¼0.6317, 95% confidence interval [CI]¼ 2.2–161.3 m, P , 0.001)for ;7-yr-old secondary forest; 20.4 m (total R2¼ 0.6264, 95%CI ¼ 2.2–103.6 m, P , 0.001) for ;27-yr-old regrowth; and175.8 m (R2 ¼ 0.8148, 95% CI 127.7–254.6 m, P , 0.001) for;45-yr-old regrowth. DFI was defined as the point at which thecommunity composition was estimated to be 95% similar tointerior disturbed forest along our 200 m long transects insecondary forests.
FIG. 3. Quasi-Poisson regressions (solid lines) of pooledmature-forest indicator species abundance vs. distance frommature into secondary forest of three ages: (a) ;7-yr-old forest(P , 0.001), (b) ;27-yr-old forest (P¼ 0.017), and (c) ;45-yr-old forest (P¼ 0.112). Dashed lines indicate 95% CI.
April 2015 805BEETLES AND FOREST INFLUENCE
one of these (Austronemadus TFIC sp. 03 (Leiodidae))
was relatively common (see Appendix E).
Beetle succession
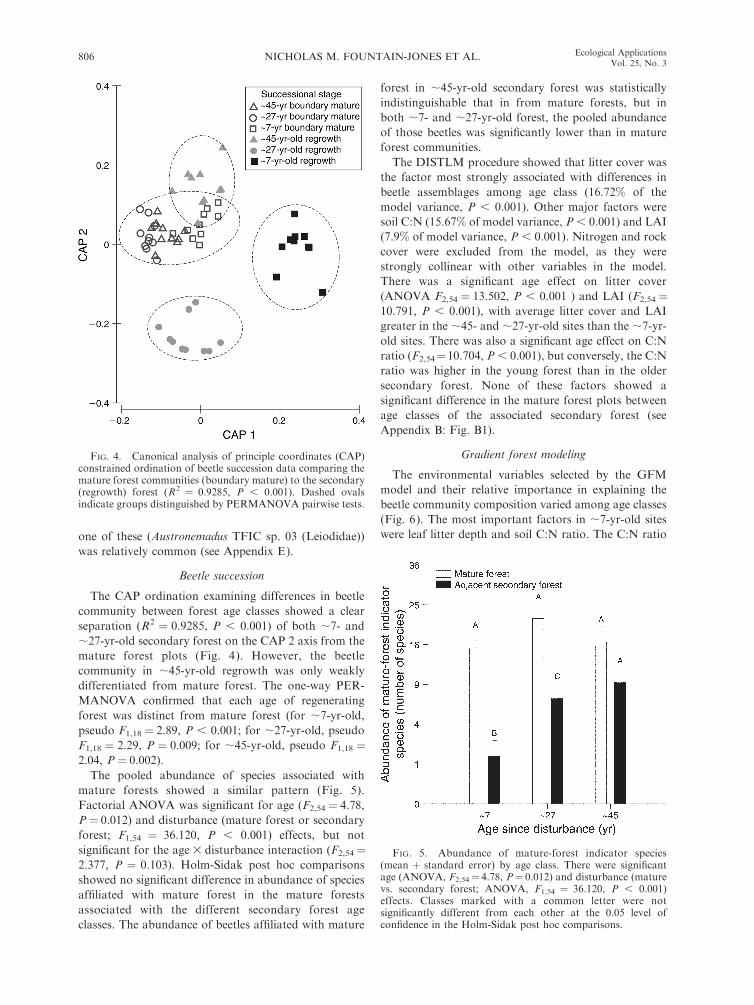
The CAP ordination examining differences in beetle
community between forest age classes showed a clear
separation (R2 ¼ 0.9285, P , 0.001) of both ;7- and
;27-yr-old secondary forest on the CAP 2 axis from the
mature forest plots (Fig. 4). However, the beetle
community in ;45-yr-old regrowth was only weakly
differentiated from mature forest. The one-way PER-
MANOVA confirmed that each age of regenerating
forest was distinct from mature forest (for ;7-yr-old,
pseudo F1,18 ¼ 2.89, P , 0.001; for ;27-yr-old, pseudo
F1,18 ¼ 2.29, P ¼ 0.009; for ;45-yr-old, pseudo F1,18 ¼2.04, P ¼ 0.002).
The pooled abundance of species associated with
mature forests showed a similar pattern (Fig. 5).
Factorial ANOVA was significant for age (F2,54 ¼ 4.78,
P¼ 0.012) and disturbance (mature forest or secondary
forest; F1,54 ¼ 36.120, P , 0.001) effects, but not
significant for the age 3 disturbance interaction (F2,54¼2.377, P ¼ 0.103). Holm-Sidak post hoc comparisons
showed no significant difference in abundance of species
affiliated with mature forest in the mature forests
associated with the different secondary forest age
classes. The abundance of beetles affiliated with mature
forest in ;45-yr-old secondary forest was statistically
indistinguishable that in from mature forests, but in
both ;7- and ;27-yr-old forest, the pooled abundance
of those beetles was significantly lower than in mature
forest communities.
The DISTLM procedure showed that litter cover was
the factor most strongly associated with differences in
beetle assemblages among age class (16.72% of the
model variance, P , 0.001). Other major factors were
soil C:N (15.67% of model variance, P , 0.001) and LAI
(7.9% of model variance, P , 0.001). Nitrogen and rock
cover were excluded from the model, as they were
strongly collinear with other variables in the model.
There was a significant age effect on litter cover
(ANOVA F2,54 ¼ 13.502, P , 0.001 ) and LAI (F2,54 ¼10.791, P , 0.001), with average litter cover and LAI
greater in the ;45- and ;27-yr-old sites than the ;7-yr-
old sites. There was also a significant age effect on C:N
ratio (F2,54¼10.704, P , 0.001), but conversely, the C:N
ratio was higher in the young forest than in the older
secondary forest. None of these factors showed a
significant difference in the mature forest plots between
age classes of the associated secondary forest (see
Appendix B: Fig. B1).
Gradient forest modeling
The environmental variables selected by the GFM
model and their relative importance in explaining the
beetle community composition varied among age classes
(Fig. 6). The most important factors in ;7-yr-old sites
were leaf litter depth and soil C:N ratio. The C:N ratio
FIG. 4. Canonical analysis of principle coordinates (CAP)constrained ordination of beetle succession data comparing themature forest communities (boundary mature) to the secondary(regrowth) forest (R2 ¼ 0.9285, P , 0.001). Dashed ovalsindicate groups distinguished by PERMANOVA pairwise tests.
FIG. 5. Abundance of mature-forest indicator species(mean þ standard error) by age class. There were significantage (ANOVA, F2,54¼ 4.78, P¼ 0.012) and disturbance (maturevs. secondary forest; ANOVA, F1,54 ¼ 36.120, P , 0.001)effects. Classes marked with a common letter were notsignificantly different from each other at the 0.05 level ofconfidence in the Holm-Sidak post hoc comparisons.
NICHOLAS M. FOUNTAIN-JONES ET AL.806 Ecological ApplicationsVol. 25, No. 3
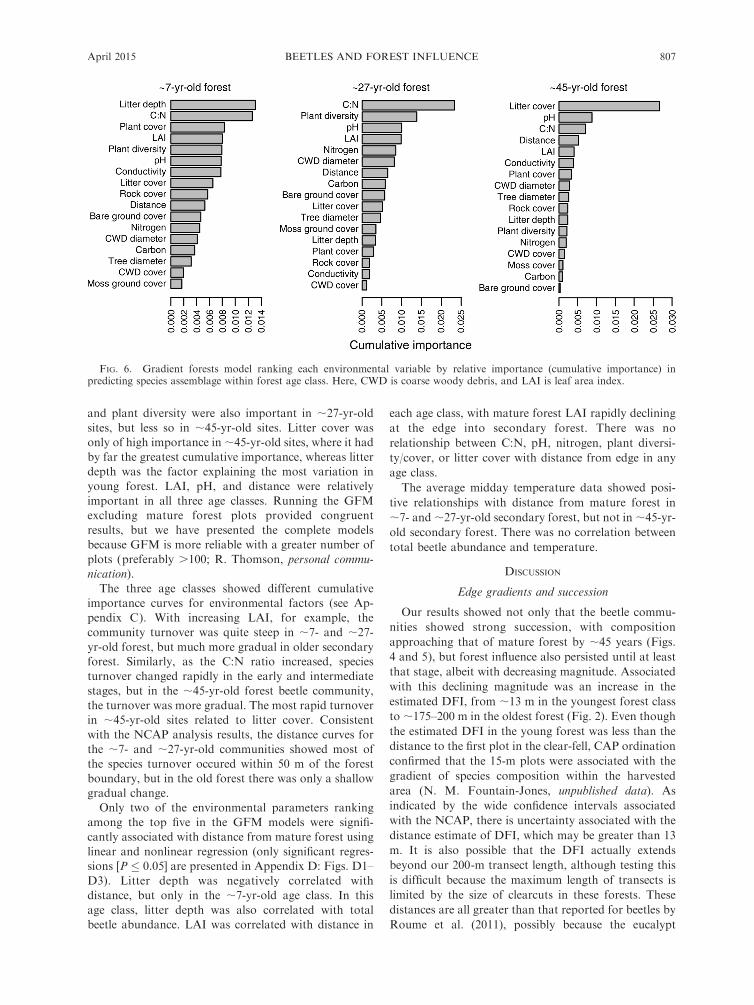
and plant diversity were also important in ;27-yr-old
sites, but less so in ;45-yr-old sites. Litter cover wasonly of high importance in ;45-yr-old sites, where it had
by far the greatest cumulative importance, whereas litter
depth was the factor explaining the most variation in
young forest. LAI, pH, and distance were relatively
important in all three age classes. Running the GFMexcluding mature forest plots provided congruent
results, but we have presented the complete models
because GFM is more reliable with a greater number of
plots (preferably .100; R. Thomson, personal commu-nication).
The three age classes showed different cumulative
importance curves for environmental factors (see Ap-
pendix C). With increasing LAI, for example, the
community turnover was quite steep in ;7- and ;27-
yr-old forest, but much more gradual in older secondaryforest. Similarly, as the C:N ratio increased, species
turnover changed rapidly in the early and intermediate
stages, but in the ;45-yr-old forest beetle community,
the turnover was more gradual. The most rapid turnoverin ;45-yr-old sites related to litter cover. Consistent
with the NCAP analysis results, the distance curves for
the ;7- and ;27-yr-old communities showed most of
the species turnover occured within 50 m of the forest
boundary, but in the old forest there was only a shallowgradual change.
Only two of the environmental parameters ranking
among the top five in the GFM models were signifi-
cantly associated with distance from mature forest using
linear and nonlinear regression (only significant regres-sions [P � 0.05] are presented in Appendix D: Figs. D1–
D3). Litter depth was negatively correlated with
distance, but only in the ;7-yr-old age class. In this
age class, litter depth was also correlated with total
beetle abundance. LAI was correlated with distance in
each age class, with mature forest LAI rapidly declining
at the edge into secondary forest. There was no
relationship between C:N, pH, nitrogen, plant diversi-
ty/cover, or litter cover with distance from edge in any
age class.
The average midday temperature data showed posi-
tive relationships with distance from mature forest in
;7- and ;27-yr-old secondary forest, but not in ;45-yr-
old secondary forest. There was no correlation between
total beetle abundance and temperature.
DISCUSSION
Edge gradients and succession
Our results showed not only that the beetle commu-
nities showed strong succession, with composition
approaching that of mature forest by ;45 years (Figs.
4 and 5), but forest influence also persisted until at least
that stage, albeit with decreasing magnitude. Associated
with this declining magnitude was an increase in the
estimated DFI, from ;13 m in the youngest forest class
to ;175–200 m in the oldest forest (Fig. 2). Even though
the estimated DFI in the young forest was less than the
distance to the first plot in the clear-fell, CAP ordination
confirmed that the 15-m plots were associated with the
gradient of species composition within the harvested
area (N. M. Fountain-Jones, unpublished data). As
indicated by the wide confidence intervals associated
with the NCAP, there is uncertainty associated with the
distance estimate of DFI, which may be greater than 13
m. It is also possible that the DFI actually extends
beyond our 200-m transect length, although testing this
is difficult because the maximum length of transects is
limited by the size of clearcuts in these forests. These
distances are all greater than that reported for beetles by
Roume et al. (2011), possibly because the eucalypt
FIG. 6. Gradient forests model ranking each environmental variable by relative importance (cumulative importance) inpredicting species assemblage within forest age class. Here, CWD is coarse woody debris, and LAI is leaf area index.
April 2015 807BEETLES AND FOREST INFLUENCE
forests on either side of our boundaries showed greater
biotic and abiotic similarities than the woodland and
agricultural fields in the French study. For example,
even ;7 years after logging, emerging eucalypts provide
some shade and litter resources that may lessen the
severity of the gradient. Furthermore, unlike in agricul-
tural fields, the substantial coarse woody debris remain-
ing after logging may aid species recovery, since many of
the species we collected are known to be saproxylic. Our
results also indicate that mature-forest species continue
to occur in secondary forest, although their abundance
declines with distance from mature forest. This illus-
trates that forest edges are permeable boundaries for
beetles (Ries et al. 2004), even when there are large
differences in habitat conditions, as, for instance, occurs
soon after harvesting.
The longer but much weaker forest influence gradients
in older (;45-year-old) secondary forest (Fig. 2) indicate
that either mature forest is still acting as a source
population for beetle recolonization, or beetles affiliated
with mature forests are gradually moving further into
harvested areas with time. Although the latter process
could be due to constraints on mobility of mature-forest
beetles, it could also reflect other aspects of forest
influence, such as a greater density of regenerating
rainforest tree species nearer the edge (Tabor et al.
2007). By ;45 years after harvesting, these trees will
approach maturity and provide litter and shade.
Our observations that ;45-year-old forest beetle
communities were relatively similar to those of mature
forests (Figs. 4 and 5) are broadly consistent with the
35–50 years suggested for near-complete beetle assem-
blage recovery in Atlantic forest in Brazil (Hopp et al.
2010) and 50–70 years for carabids in boreal forests
(Koivula et al. 2002, Buddle et al. 2006). However, the
persistence of edge gradients shows that this rate of
ecological reassembly of mature forest source commu-
nities is constrained by how close the secondary forest is
to mature forest. This relatively long edge gradient is
comparable to estimated dispersal distances from
mature into long-established secondary forest for
Scandinavian beetle fungivores (Jonsson and Nord-
lander 2006). Thus, it would be worthwhile to investi-
gate whether differences between secondary forest and
mature forest beetle communities may be persistent, as
was found in hemlock forests (Latty et al. 2006).
Species responses to succession
This study clearly demonstrates distinct beetle succes-
sional assemblages in each forest age. In Tasmania, most
species considered indicators of young (;3-year-old)
forest by Baker (2006) were also indicators in our ;7-
year-old plots (see Appendix E). These species may be
pyrophilic, or responding to the changed habitat
conditions such as increased light or altered food
resources. For example, the early seral indicator
Mecyclothorax ambiguus (Carabidae: Psydrinae) has
also been collected in native grassland (Michaels
1999), which may suggest a preference for open
conditions. As observed in other studies in Tasmanian
wet forests, young seral species were uncommon in ;27-
year-old forest, and not collected at all at the ;45-year-
old sites (Michaels and McQuillan 1995, Baker 2006).
The overall change in community gradient in the ;27-
year-old regenerating forest appears to be mainly driven
by mid-successional specialist species, including Micro-
silpha ANIC Thayer sp. 15 (Staphylinidae: Micro-
silphinae) and Decilaus TFIC sp. 03 (Curculionidae:
Cryptorynchinae) (see Appendix E for species abun-
dance data). However, mature-forest specialists are
generally more abundant in the ;27-year-old regener-
ating forest than in ;7-year-old forests, and the slope of
their decline in abundance with distance from edge is
shallower (Fig. 3).
Environmental modeling
The observation that leaf litter attributes were the
most important explanatory variables in ;7- and ;45-
year-old sites (Fig. 6) makes sense, because leaf litter is
the primary habitat for forest ground-dwelling beetle
species and affects the microspatial distribution of some
species that prefer open ground (Magura et al. 2005).
The decline in litter depth with distance in the ;7-year-
old sites suggests that mature forest is providing
additional inputs of leaf litter near edges, and this
habitat provision might be significant for facilitating
beetle recolonization. These results are consistent with
previous studies indicating that litter is an important
predictor of beetle recolonization and succession (Mi-
chaels and McQuillan 1995, Magura et al. 2005,
Nakamura et al. 2009).
The importance of plant diversity as an explanatory
variable for forest influence in young and intermediate
edges may reflect its relationship with diversity of leaf
litter chemistry (Bardgett and Shine 1999). Since
monotypic litter contains lower abundance and diversity
of micro-arthropods than litter from several plant
species, plant diversity is likely to have cascading effects
on arthropods (Hansen 2000). The increased structural
diversity supplied by rainforest plants typically present
near mature edges (Tabor et al. 2007; J. Balmer,
unpublished data) may also facilitate recolonization of
beetle species affiliated with mature forests.
The importance of soil C:N ratio in the community
gradient model for each forest age class as well as the
beetle succession model (Fig. 6) may reflect impacts on
predatory beetles resulting from the sensitivity of
common prey (e.g., mites and springtails) to this ratio
(Noti et al. 2003, Jensen et al. 2006). The lack of a
relationship between distance and C:N ratio may be due
to high spatial variability in levels of both C and N
(Shaw et al. 2008). C:N was affected by forest age, with
;7-year-old stands having a higher C:N than the older
secondary forest, presumably due to the migration of
nitrogen from the soil into the canopy as the forest ages
(Finzi et al. 1998). Few studies have measured beetle
NICHOLAS M. FOUNTAIN-JONES ET AL.808 Ecological ApplicationsVol. 25, No. 3
community responses to soil C:N ratio, yet other soil
variables are known to be important (Schwerk and
Szyszko 2007, Antvogel and Bonn 2008). Soil pH affects
carabid communities (McCracken 1994, Schwerk and
Szyszko 2007, Antvogel and Bonn 2008) and was an
explanatory factor in the GFM. However, as with all
variables, the association of beetle communities with pH
may not be causal, it may simply reflect a strong link
between pH, soil moisture, and LAI (Antvogel and
Bonn 2008).
The strong predictive power of LAI (Fig. 6) suggests
that forest cover has a significant impact on beetle
communities, presumably mediated by effects on micro-
climate. High LAI results in significantly lower temper-
atures and evaporative demand in these forests (Baker et
al. 2014). There were strong temperature and LAI
gradients across the ;7-year-old edges, but the gradients
in later successional stages were less pronounced. Even
;7 years after harvest, the 15-m and 35-m plots had a
greater LAI and were cooler compared to plots further
away from the boundary, showing a strong forest
influence effect. In the GFM, increasing LAI explains
species turnover predominantly in the early and
intermediate age sites and little in ;45-year-old sites.
LAI was also important in explaining the beetle
community successional changes. Canopy closure occurs
in this forest type at ;20 years after harvest and clearly
had an impact on community composition in both our
older regrowth age classes. Canopy closure facilitates
increased moisture content of the surface soil and a
decrease in temperature and humidity fluctuations
(Entling et al. 2007). For some mature-forest species,
canopy closure may therefore be the most important
factor enabling successful recolonization beyond shaded
edge conditions (Koivula et al. 2002, Grimbacher et al.
2006, Nakamura et al. 2009). However, collinearity of
variables in the model results in some ambiguity about
which factors drive the patterns observed here. Exper-
imental work on the effects of environmental variables
on beetle recolonization would help resolve this ambi-
guity.
Conservation and management outcomes
This study clearly illustrates the importance of
maintaining mature forest in production forest land-
scapes through its impacts on the successional trajectory
of beetle communities in adjacent secondary forest. Not
only do these mature forests have ecologically important
effects on leaf litter inputs, microclimate, and shading on
nearby regenerating forest, but they also provide sources
of mature-forest species. The nearly complete reassem-
bly of mature forest communities within ;175–200 m by
;45 years after harvest shows how retained mature
forest can assist species reestablishment and persistence
in secondary forest landscapes (Chazdon et al. 2009,
Hopp et al. 2010).
Our results are relevant to forest managers looking to
build connectivity into fragmented landscapes, as sec-
ondary forests with mature forest boundaries may harbor
a comparable beetle community over time. Maintaining
sufficient mature forest embedded within harvested
landscapes should be a high priority, since our study
demonstrates that as well as providing habitat for species
requiring this successional stage, they appear to influence
successional dynamics of the entire landscape. Further-
more, this study shows the conservation potential of
retention forestry approaches like aggregated retention,
where unlogged patches are retained within harvested
areas (Baker et al. 2009). Current practices for designing
aggregated retention harvests sometimes require that the
harvested area is no more than one mature tree height
from retained mature forest (forest influence target;
Baker and Read 2011). The almost complete recovery
of beetle assemblages associated with mature forests up to
200 m from mature forest by ;45 years indicate that this
one-tree height target is relatively conservative for beetles,
at least for this age class, although the estimated DFI was
substantially less than one mature forest tree height for
;7- and ;27-year-old age classes. However, since our
study surveyed clear-cut edges rather than gradients from
small isolated aggregates, the poorly understood effects of
mature forest patch size or total quantity of mature forest
in the surrounding landscape may also be important
limitations to the reestablishment of beetles, which
require further study.
This study was one of the first to analyze the long-
term impacts of forest influence on forest biodiversity.
The relatively rapid recovery of mature-forest succes-
sional communities was driven by edge recolonization
coupled with litter input and microclimate factors.
Mature forest stands are not necessarily islands in a
secondary forest mosaic, but instead are critical com-
ponents facilitating connectivity and succession in
fragmented landscapes.
ACKNOWLEDGMENTS
This project was funded by the Australian Research CouncilLinkage Grant LP100100050. We thank Tom Spies and JerryFranklin for their advice. We also thank Kaely Kreger andBianca Deans for field/lab assistance and soil data, KevinBonham and Lynne Forster for assistance with beetleidentification and sorting, and Peter Harrison and RussellThomson for statistical advice. We also thank ForestryTasmania for financial and logistical support and access tothe Tasmanian Forest Insect Collection (TFIC).We are gratefulfor reviewer comments that improved the manuscript.
LITERATURE CITED
Anderson, M. J. 2001. A new method for non-parametricmultivariate analysis of variance. Austral Ecology 26:32–46.
Anderson, M. J., R. N. Gorley, and K. R. Clarke. 2008.PERMANOVAþ for PRIMER: guide to software andstatistical methods. PRIMER-E, Plymouth, UK.
Anderson, M. J., and P. Legendre. 1999. An empiricalcomparison of permutation methods for tests of partialregression coefficients in a linear model. Journal of StatisticalComputation and Simulation 62:271–303.
Anderson, M. J., and T. J. Willis. 2003. Canonical analysis ofprincipal coordinates: a useful method of constrainedordination for ecology. Ecology 84:511–525.
April 2015 809BEETLES AND FOREST INFLUENCE
Antvogel, H., and A. Bonn. 2008. Environmental parametersand microspatial distribution of insects: a case study ofcarabids in an alluvial forest. Ecography 24:470–482.
Baker, S., and L. Barmuta. 2006. Evaluating spatial autocor-relation and depletion in pitfall-trap studies of environmentalgradients. Journal of Insect Conservation 10:269–276.
Baker, S., and S. Read. 2011. Variable retention silviculture inTasmania’s wet forests: ecological rationale, adaptive man-agement and synthesis of biodiversity benefits. AustralianForestry 74:218–232.
Baker, S. C. 2006. A comparison of litter beetle assemblages(Coleoptera) in mature and recently clearfelled Eucalyptusobliqua forest. Australian Journal of Entomology 45:130–136.
Baker, S. C., L. A. Barmuta, P. B. McQuillan, and A. M. M.Richardson. 2007. Estimating edge effects on ground-dwelling beetles at clearfelled non-riparian stand edges inTasmanian wet eucalypt forest. Forest Ecology and Man-agement 239:92–101.
Baker, S. C., S. J. Grove, L. Forster, K. J. Bonham, and D.Bashford. 2009. Short-term responses of ground-activebeetles to alternative silvicultural systems in the WarraSilvicultural Systems Trial, Tasmania, Australia. ForestEcology and Management 258:444–459.
Baker, S. C., T. A. Spies, T. J. Wardlaw, J. Balmer, J. F.Franklin, and G. J. Jordan. 2013a. The harvested side ofedges: Effect of retained forests on the re-establishment ofbiodiversity in adjacent harvested areas. Forest Ecology andManagement 302:107–121.
Baker, T. P., G. J. Jordan, P. J. Dalton, and S. C. Baker. 2013b.Impact of distance to mature forest on the recolonisation ofbryophytes in a regenerating Tasmanian wet eucalypt forest.Australian Journal of Botany 61:633.
Baker, T. P., G. J. Jordan, E. A. Steel, N. M. Fountain-Jones,T. J. Wardlaw, and S. C. Baker. 2014. Microclimate throughspace and time: microclimatic variation at the edge ofregeneration forests over daily, yearly and decadal timescales.. Forest Ecology and Management 334:174–184.
Bardgett, R. D., and A. Shine. 1999. Linkages between plantlitter diversity, soil microbial biomass and ecosystem functionin temperate grasslands. Soil Biology and Biochemistry31:317–321.
Beese, W. J., B. G. Dunsworth, K. Zielke, and B. Bancroft.2003. Maintaining attributes of old-growth forests in coastalB.C. through variable retention. Forestry Chronicle 79:570–578.
Breda, N. J. J. 2003. Ground-based measurements of leaf areaindex: a review of methods, instruments and currentcontroversies. Journal of Experimental Botany 54:2403–2417.
Brown, M. J., H. J. Elliott, and J. E. Hickey. 2001. An overviewof the Warra Long-Term Ecological Research Site. Tasfor-ests 13:1–8.
Buddle, C. M., D. W. Langor, G. R. Pohl, and J. R. Spence.2006. Arthropod responses to harvesting and wildfire:implications for emulation of natural disturbance in forestmanagement. Biological Conservation 128:346–357.
Chao, A., N. Gotelli, T. C. Hsieh, E. Sander, K. H. Ma, R. K.Colwell, and A. M. Ellison. 2013. Rarefaction and extrap-olation with Hill numbers: a framework for sampling andestimation in species diversity studies. Ecological Mono-graphs 84:45–67.
Chazdon, R. L., C. A. Peres, D. Dent, D. Sheil, A. E. Lugo, D.Lamb, N. E. Stork, and S. E. Miller. 2009. The potential forspecies conservation in tropical secondary forests. Conserva-tion Biology 23:1406–1417.
Cornellise, T. M., and J. E. Hafernik. 2009. Effects of soilcharacteristics and human disturbance on tiger beetleoviposition. Ecological Entomology 34:495–503.
De Caceres, M., P. Legendre, S. K. Wiser, and L. Brotons.2012. Using species combinations in indicator value analyses.Methods in Ecology and Evolution 3:973–982.
Demaynadier, P. G., and M. L. Hunter. 2008. Effects ofsilvicultural edges on the distribution and abundance ofamphibians in Maine. Conservation Biology 12:340–352.
Ellis, N., S. J. Smith, and C. R. Pitcher. 2012. Gradient forests:calculating importance gradients on physical predictors.Ecology 93:156–168.
Entling, W., M. H. Schmidt, S. Bacher, R. Brandl, and W.Nentwig. 2007. Niche properties of Central Europeanspiders: shading, moisture and the evolution of the habitatniche. Global Ecology and Biogeography 16:440–448.
Ewers, R. M., and R. K. Didham. 2008. Pervasive impact oflarge-scale edge effects on a beetle community. Proceedingsof the National Academy of Sciences USA 105:5426–5429.
Finzi, A. C., N. Van Breemen, and C. D. Canham. 1998.Canopy tree–soil interactions within temperate forests:species effects on soil carbon and nitrogen. EcologicalApplications 8:440–446.
Grimbacher, P. S., C. P. Catterall, and R. L. Kitching. 2006.Beetle species’ responses suggest that microclimate mediatesfragmentation effects in tropical Australian rainforest.Austral Ecology 31:458–470.
Grove, S., and L. Forster. 2011. A decade of change in thesaproxylic beetle fauna of eucalypt logs in the Warra long-term log-decay experiment, Tasmania. 2. Log-size effects,succession, and the functional significance of rare species.Biodiversity and Conservation 20:2167–2188.
Hansen, R. A. 2000. Effects of habitat complexity andcomposition on a diverse litter microarthropod assemblage.Ecology 81:1120–1132.
Harper, K. A., S. E. Macdonald, P. J. Burton, J. Chen, K. D.Brosofske, S. C. Saunders, E. S. Euskirchen, D. A. R.Roberts, M. S. Jaiteh, and P. A. Esseen. 2005. Edge influenceon forest structure and composition in fragmented land-scapes. Conservation Biology 19:768–782.
Hickey, J. 1994. A floristic comparison of vascular species inTasmanian oldgrowth mixed forest with regeneration result-ing from logging and wildfire. Australian Journal of Botany42:383–404.
Hopp, P. W., R. Ottermanns, E. Caron, S. Meyer, and M. Roß-Nickoll. 2010. Recovery of litter inhabiting beetle assem-blages during forest regeneration in the Atlantic forest ofsouthern Brazil. Insect Conservation and Diversity 3:103–113.
Hyvarinen, E., J. Kouki, and P. Martikainen. 2009. Prescribedfires and retention trees help to conserve beetle diversity inmanaged boreal forests despite their transient negative effectson some beetle groups. Insect Conservation and Diversity2:93–105.
Jensen, T. C., H. P. Leinaas, and D. O. Hessen. 2006. Age-dependent shift in response to food element composition inCollembola: contrasting effects of dietary nitrogen. Oecolo-gia 149:583–592.
Jonsson, M., and G. Nordlander. 2006. Insect colonisation offruiting bodies of the wood-decaying fungus Fomitopsispinicola at different distances from an old-growth forest.Pages 281–295 in D. L. Hawksworth and A. T. Bull, editors.Arthropod diversity and conservation. Springer, Dordrecht,Netherlands.
Keenan, R. J., and J. P. Kimmins. 1993. The ecological effectsof clear-cutting. Environmental Reviews 1:121–144.
Koivula, M., J. Kukkonen, and J. Niemela. 2002. Borealcarabid-beetle (Coleoptera, Carabidae) assemblages alongthe clear-cut originated succession gradient. Biodiversity andConservation 11:1269–1288.
Koivula, M., P. Punttila, Y. Haila, and J. Niemela. 1999. Leaflitter and the small-scale distribution of carabid beetles(Coleoptera, Carabidae) in the boreal forest. Ecography22:424–435.
Latty, E. F., S. M. Werner, D. J. Mladenoff, K. F. Raffa, andT. A. Sickley. 2006. Response of ground beetle (Carabidae)assemblages to logging history in northern hardwood–
NICHOLAS M. FOUNTAIN-JONES ET AL.810 Ecological ApplicationsVol. 25, No. 3
hemlock forests. Forest Ecology and Management 222:335–347.
Lawrence, J., A. Hastings, M. Dallwitz, T. Paine, and E.Zurcher. 1999. Beetles of the world. CSIRO Publishing,Melbourne, Australia.
Lemieux, J. P., and B. S. Lindgren. 2004. Ground beetleresponses to patch retention harvesting in high elevationforests of British Columbia. Ecography 27:557–566.
Magura, T., B. Tothmeresz, and Z. Elek. 2005. Impacts of leaf-litter addition on carabids in a conifer plantation. Biodiver-sity and Conservation 14:475–491.
Magura, T., B. Tothmeresz, and T. Molnar. 2002. Forest edgeand diversity: carabids along forest-grassland transects.Biodiversity and Conservation 10:287–300.
Matlack, G. R. 1994. Plant species migration in a mixed-historyforest landscape in eastern North America. Ecology 75:1491.
McArdle, B. H., and M. J. Anderson. 2001. Fitting multivariatemodels to community data: a comment on distance-basedredundancy analysis. Ecology 82:290–297.
McCracken, D. I. 1994. A fuzzy classification of moorlandground beetle (Coleoptera: Carabidae) and plant communi-ties. Pedobiologia 38:12–27.
Michaels, K. F. 1999. Carabid beetle (Coleoptera: Carabidae)communities in Tasmania: classification for nature conser-vation. Pages 374–379 in W. Ponder and D. Lunney, editors.The other 99%. The conservation and biodiversity ofinvertebrates. The Royal Zoological Society of New SouthWales, Sydney, Australia.
Michaels, K. F., and P. B. McQuillan. 1995. Impact ofcommercial forest management on geophilous carabid beetles(Coleoptera: Carabidae) in tall, wet Eucalyptus obliqua forestin southern Tasmania. Australian Journal of Ecology20:316–323.
Millar, R. B., M. J. Anderson, and G. Zunun. 2005. Fittingnonlinear environmental gradients to community data: ageneral distance-based approach. Ecology 86:2245–2251.
Nakamura, A., C. P. Catterhall, C. J. Burwell, R. L. Kitching,and A. P. N. House. 2009. Effects of shading and mulchdepth on the colonisation of habitat patches by arthropods ofrainforest soil and litter. Insect Conservation and Diversity2:221–231.
Niemela, J., Y. Haila, and P. Punttila. 1996. The importance ofsmall-scale heterogeneity in boreal forests: variation indiversity in forest-floor invertebrates across the successiongradient. Ecography 19:352–368.
Niemela, J., D. Langor, and J. R. Spence. 1993. Effects of clear-cut harvesting on boreal ground-beetle assemblages (Cole-optera: Carabidae) in Western Canada. Conservation Biol-ogy 7:551–561.
Noti, M. I., H. M. Andre, X. Ducarme, and P. Lebrun. 2003.Diversity of soil oribatid mites (Acari: Oribatida) from HighKatanga (Democratic Republic of Congo): a multiscale andmultifactor approach. Biodiversity and Conservation 12:767–785.
Oliver, I., and A. J. Beattie. 1996. Invertebrate morphospeciesas surrogates for species: a case study. Conservation Biology10:99–109.
R Development Core Team. 2013. R: a language andenvironment for statistical computing. R Foundation forStatistical Computing, Vienna, Austria. www.r-project.org
Ries, L., R. J. Fletcher, J. Battin, and T. D. Sisk. 2004.Ecological responses to habitat edges: mechanisms, models,and variability explained. Annual Review of Ecology,Evolution, and Systematics 35:491–522.
Rosenvald, R., and A. Lohmus. 2008. For what, when, andwhere is green-tree retention better than clear-cutting? Areview of the biodiversity aspects. Forest Ecology andManagement 255:1–15.
Roume, A., M. Deconchat, L. Raison, G. Balent, and A. Ouin.2011. Edge effects on ground beetles at the woodlot–fieldinterface are short-range and asymmetrical. Agricultural andForest Entomology 13:395–403.
Schwerk, A., and J. Szyszko. 2007. Successional patterns ofcarabid fauna (Coleoptera: Carabidae) in planted andsuccessional forests growing on old arable land. BalticJournal of Coleopterology 7:9–15.
Shaw, C. H., J. R. Boyle, and A. Y. Omule. 2008. Estimatingforest soil carbon and nitrogen stocks with double samplingfor stratification. Soil Science Society of America 72:1611–1620.
Siira-Pietikainen, A., and J. Haimi. 2009. Changes in soil fauna10 years after forest harvestings: comparison between clearfelling and green-tree retention methods. Forest Ecology andManagement 258:332–338.
Spence, J. R., D. W. Langor, J. Niemela, H. A. Carcamo, andC. R. Currie. 1996. Northern forestry and carabids: the casefor concern about old-growth species. Annales ZoologiciFennici 33:173–184.
Strobl, C., A. L. Boulesteix, T. Kneib, T. Augustin, and A.Zeileis. 2008. Conditional variable importance for randomforests. BMC Bioinformatics 9:307.
Tabor, J., C. McElhinny, J. Hickey, and J. Wood. 2007.Colonisation of clearfelled coupes by rainforest tree speciesfrom mature mixed forest edges, Tasmania, Australia. ForestEcology and Management 240:13–23.
Thomson, R. J., N. A. Hill, R. Leaper, N. Ellis, C. R. Pitcher,N. S. Barrett, and G. J. Edgar. 2014. Congruence in demersalfish, macroinvertebrate, and macroalgal community turnoveron shallow temperate reefs. Ecological Applications 24:287–299.
Turner, P. A. M., J. Balmer, and J. B. Kirkpatrick. 2009. Stand-replacing wildfires? The incidence of multi-cohort and single-cohort Eucalyptus regnans and E. obliqua forests in southernTasmania. Forest Ecology and Management 258:366–375.
Walker, L. R., D. A. Wardle, R. D. Bardgett, and B. D.Clarkson. 2010. The use of chronosequences in studies ofecological succession and soil development. Journal ofEcology 98:725–736.
SUPPLEMENTAL MATERIAL
Ecological Archives
Appendices A–E and the Supplement are available online: http://dx.doi.org/10.1890/14-0334.1.sm
Data Availability
Data associated with this paper have been deposited in Dryad: http://dx.doi.org/10.5061/dryad.10c30
April 2015 811BEETLES AND FOREST INFLUENCE