livestock, dairy, and poultry outlook - february...
TRANSCRIPT
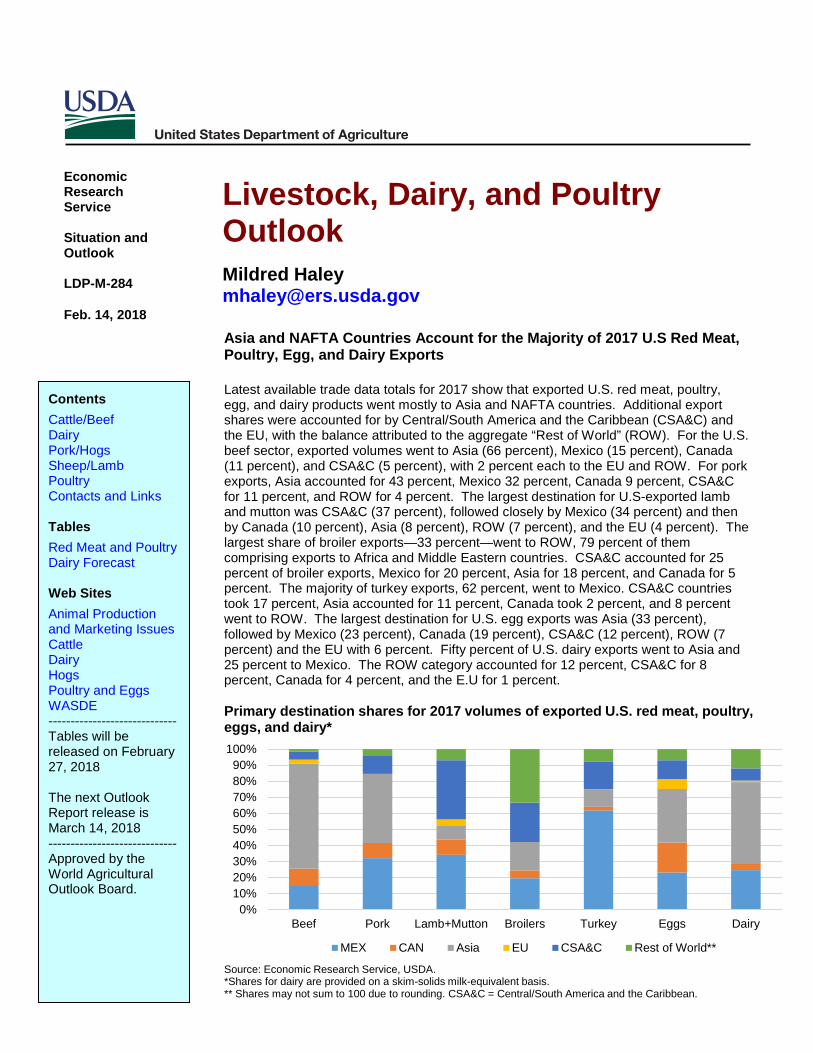
Asia and NAFTA Countries Account for the Majority of 2017 U.S Red Meat, Poultry, Egg, and Dairy Exports Latest available trade data totals for 2017 show that exported U.S. red meat, poultry, egg, and dairy products went mostly to Asia and NAFTA countries. Additional export shares were accounted for by Central/South America and the Caribbean (CSA&C) and the EU, with the balance attributed to the aggregate “Rest of World” (ROW). For the U.S. beef sector, exported volumes went to Asia (66 percent), Mexico (15 percent), Canada (11 percent), and CSA&C (5 percent), with 2 percent each to the EU and ROW. For pork exports, Asia accounted for 43 percent, Mexico 32 percent, Canada 9 percent, CSA&C for 11 percent, and ROW for 4 percent. The largest destination for U.S-exported lamb and mutton was CSA&C (37 percent), followed closely by Mexico (34 percent) and then by Canada (10 percent), Asia (8 percent), ROW (7 percent), and the EU (4 percent). The largest share of broiler exports—33 percent—went to ROW, 79 percent of them comprising exports to Africa and Middle Eastern countries. CSA&C accounted for 25 percent of broiler exports, Mexico for 20 percent, Asia for 18 percent, and Canada for 5 percent. The majority of turkey exports, 62 percent, went to Mexico. CSA&C countries took 17 percent, Asia accounted for 11 percent, Canada took 2 percent, and 8 percent went to ROW. The largest destination for U.S. egg exports was Asia (33 percent), followed by Mexico (23 percent), Canada (19 percent), CSA&C (12 percent), ROW (7 percent) and the EU with 6 percent. Fifty percent of U.S. dairy exports went to Asia and 25 percent to Mexico. The ROW category accounted for 12 percent, CSA&C for 8 percent, Canada for 4 percent, and the E.U for 1 percent.
0%10%20%30%40%50%60%70%80%90%
100%
Beef Pork Lamb+Mutton Broilers Turkey Eggs Dairy
MEX CAN Asia EU CSA&C Rest of World**
Primary destination shares for 2017 volumes of exported U.S. red meat, poultry, eggs, and dairy*
Source: Economic Research Service, USDA.*Shares for dairy are provided on a skim-solids milk-equivalent basis. ** Shares may not sum to 100 due to rounding. CSA&C = Central/South America and the Caribbean.
Livestock, Dairy, and Poultry Outlook Mildred Haley [email protected]
Economic Research Service Situation and Outlook LDP-M-284 Feb. 14, 2018
Contents Cattle/Beef Dairy Pork/Hogs Sheep/Lamb Poultry Contacts and Links Tables Red Meat and Poultry Dairy Forecast Web Sites Animal Production and Marketing Issues Cattle Dairy Hogs Poultry and Eggs WASDE -----------------------------Tables will be released on February 27, 2018 The next Outlook Report release is March 14, 2018 ----------------------------- Approved by the World Agricultural Outlook Board.

Cattle/Beef: A large portion of the U.S. cattle inventory is in an area experiencing drought, which is likely affecting the timing of placements of feeder cattle in feedlots. As a result of higher late-2017 placements and relatively slower growth in the 2017 calf crop, the forecast for 2018 commercial beef production was lowered from last month to 27.7 billion pounds. This reflects anticipation of fewer cattle to be placed in feedlots in the first half of the year and marketed in the second half, although it is largely offset by the first-half marketing of cattle placed in late-2017. Based on continued strength in overseas demand, the 2018 beef export forecast was revised upward, following double-digit growth in 2017. Dairy: Due to recent price movements and relatively weak expected domestic demand, the 2018 all-milk price forecast has been lowered to $15.70-$16.40 per cwt, a reduction from $15.80-$16.60 forecast last month. Due to lower-than-expected milk per cow in the fourth quarter of 2017, lower projected milk prices, and higher expected feed prices, the 2018 milk production forecast has been lowered to 218.7 billion pounds, 0.1 billion pounds less than last month’s forecast. The U.S. is expected to be competitive in international markets, especially on a skim-solids milk-equivalent basis. As a result, the 2018 forecast for exports on a skim-solids basis has been raised to 42.5 billion pounds, 0.5 billion more than last month’s forecast. Domestic use forecasts have been lowered on both milk-fat and skim-solids milk-equivalent bases by 0.2 billion and 0.8 billion pounds, respectively. Pork/Hogs: January was characterized by lower processor margins, due to generally higher hog prices likely brought about by competition from expanded processing capacity. Pork production in the first quarter of 2018 is expected to be about 6.6 billion pounds, almost 3 percent above a year earlier. Pork exports in 2017, 5.6 billion pounds, were 7.5 percent larger than exports in 2016. Exports in 2018 are expected to be 5.9 billion pounds, almost 5 percent higher than 2017 volumes. Sheep/Lamb: The sheep inventory registered a fractional decline, with 20,000 fewer animals than last year. While the NASS Sheep and Goats report shows 25,000 more market lambs on January 1, 2018, than in the same period last year, the 40,000-drop in breeding sheep inventory is likely to create headwinds for the industry. Production for 2018 is forecast to show little change, and domestic consumption is likely to be supplemented by slightly higher imports. Ongoing tight supplies of lamb and mutton in the domestic market are likely to limit export growth potential, but full-year 2018 exports are forecast to increase by 36 percent over 2017. Poultry: Broiler production and weights were up again in December, contributing to higher projected production, while recent price data resulted in a slightly higher price projection. Table egg production resumed its small but important contraction in December, and exports had strong growth. Recent price surges contributed to raised price projections. Initial estimates for 2017 annual turkey production were lower than 2016. With prices remaining well below historic averages, 2018 production is anticipated to decrease slightly as well.
2 Livestock, Dairy, and Poultry Outlook/LDP-M-284/February 14, 2018
Economic Research Service, USDA

Cattle / Beef
Cattle Report Shows Slower Rate of Expansion for U.S. Herd
The USDA National Agricultural Statistics Service (NASS) released its semi-annual Cattle report. The number of cattle and calves estimated on January 1, 2018, reached 94.4 million head, which was 0.7 percent higher year over year and the fourth year of expansion. Compared to last year, cow-calf producers are indicating their intentions to retain 237,000 fewer beef heifers (-3.7 percent) for breeding in their herds. Overall, the U.S. herd is still relatively low, down from its all-time peak of 132.0 million in 1975 and up from its recent low of 88.5 million head in 2014, and has expanded at a slower pace. The report also included a number of revisions to the January 1, 2017, inventory classes. The January 2017 cattle and calf inventory was 93.7 million head, which showed 1.9 percent growth from 2016, whereas the inventory grew 3.1 percent from 2015 to 2016. In addition, the 2017 calf crop was revised downward by 492,000 head from the July 1 Cattle report to 35.8 million calves.
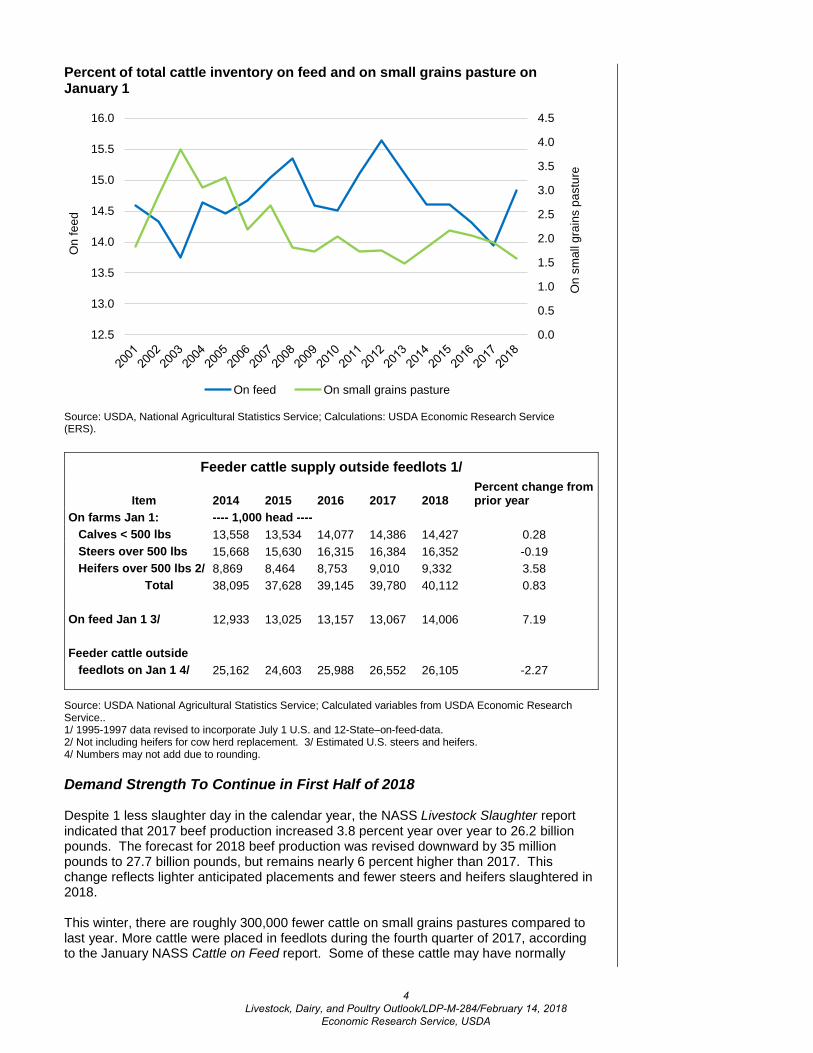
The Cattle report also indicated fewer cattle on small grains pastures than in 2017. The estimate of 1.5 million head on small grains pastures on January 1, 2018, was 16.7 percent below the 1.8 million head reported last year. This level of small grains pasturing is likely, in part, reflecting drought conditions in the Southern Plains1. To a degree, it likely bolstered the number of cattle on feed in all U.S. feedlots, which was up by 939,000 head (+7.2 percent) to 14.0 million head on January 1 from last year. As illustrated in the chart below, though the percent of total cattle inventory on small grains pastures showed some recovery from the 2011-2012 drought, it has begun to decline in recent years. Further, as a result of some cattle likely moving from pastures to feedlots, the number of cattle available to place in feedlots in 2018 was 2.3 percent (447,000 head) lower than last year (see table below).
1 U.S. Drought Monitor on February 6, 2018, http://droughtmonitor.unl.edu
405060708090
100110120130140
1918
1923
1928
1933
1938
1943
1948
1953
1958
1963
1968
1973
1978
1983
1988
1993
1998
2003
2008
2013
2018
Cattle inventory, including calves, on January 1Million head
Source: USDA National Agricultural Statistics Service.
3 Livestock, Dairy, and Poultry Outlook/LDP-M-284/February 14, 2018
Economic Research Service, USDA
Feeder cattle supply outside feedlots 1/
Item 2014 2015 2016 2017 2018 Percent change from prior year
On farms Jan 1: ---- 1,000 head ---- Calves < 500 lbs 13,558 13,534 14,077 14,386 14,427 0.28 Steers over 500 lbs 15,668 15,630 16,315 16,384 16,352 -0.19 Heifers over 500 lbs 2/ 8,869 8,464 8,753 9,010 9,332 3.58
Total 38,095 37,628 39,145 39,780 40,112 0.83
On feed Jan 1 3/ 12,933 13,025 13,157 13,067 14,006 7.19
Feeder cattle outside feedlots on Jan 1 4/ 25,162 24,603 25,988 26,552 26,105 -2.27
Source: USDA National Agricultural Statistics Service; Calculated variables from USDA Economic Research Service.. 1/ 1995-1997 data revised to incorporate July 1 U.S. and 12-State–on-feed-data. 2/ Not including heifers for cow herd replacement. 3/ Estimated U.S. steers and heifers. 4/ Numbers may not add due to rounding.
Demand Strength To Continue in First Half of 2018
Despite 1 less slaughter day in the calendar year, the NASS Livestock Slaughter report indicated that 2017 beef production increased 3.8 percent year over year to 26.2 billion pounds. The forecast for 2018 beef production was revised downward by 35 million pounds to 27.7 billion pounds, but remains nearly 6 percent higher than 2017. This change reflects lighter anticipated placements and fewer steers and heifers slaughtered in 2018.
This winter, there are roughly 300,000 fewer cattle on small grains pastures compared to last year. More cattle were placed in feedlots during the fourth quarter of 2017, according to the January NASS Cattle on Feed report. Some of these cattle may have normally
0.0
0.5
1.0
1.5
2.0
2.5
3.0
3.5
4.0
4.5
12.5
13.0
13.5
14.0
14.5
15.0
15.5
16.0
On
smal
l gra
ins
past
ure
On
feed
On feed On small grains pasture
Percent of total cattle inventory on feed and on small grains pasture on January 1
Source: USDA, National Agricultural Statistics Service; Calculations: USDA Economic Research Service(ERS).
4 Livestock, Dairy, and Poultry Outlook/LDP-M-284/February 14, 2018
Economic Research Service, USDA
been grazed on winter pasture, and to the extent they were placed earlier, some that were expected to be slaughtered in second-half 2018 are now anticipated to be slaughtered in the first half. In a typical graze-out period, more cattle would be placed on feed late in the first quarter and marketed in the second half of the year. The timing and weight of placements in the coming months will increasingly depend on precipitation in the Southern Plains.
Despite higher cattle slaughter and beef production during January 2018 relative to January 2017, wholesale beef prices climbed above 2017. With packers’ margins above 2017 in early 2018, January fed steer prices also averaged above year-earlier levels. On expectations of continued demand strength, fed steer price forecasts for the first and second quarters were raised to $122.00-$126.00 per hundredweight (cwt) and $117.00-$125.00/cwt, respectively. Although first-quarter fed steer prices are expected to average above 2017, second-quarter prices could be pressured by marketings. The 2018 quarterly price forecasts for feeder steers were left unchanged.
2017 Beef Export Volume Largest Ever; Second Consecutive Year of Double-Digit Growth
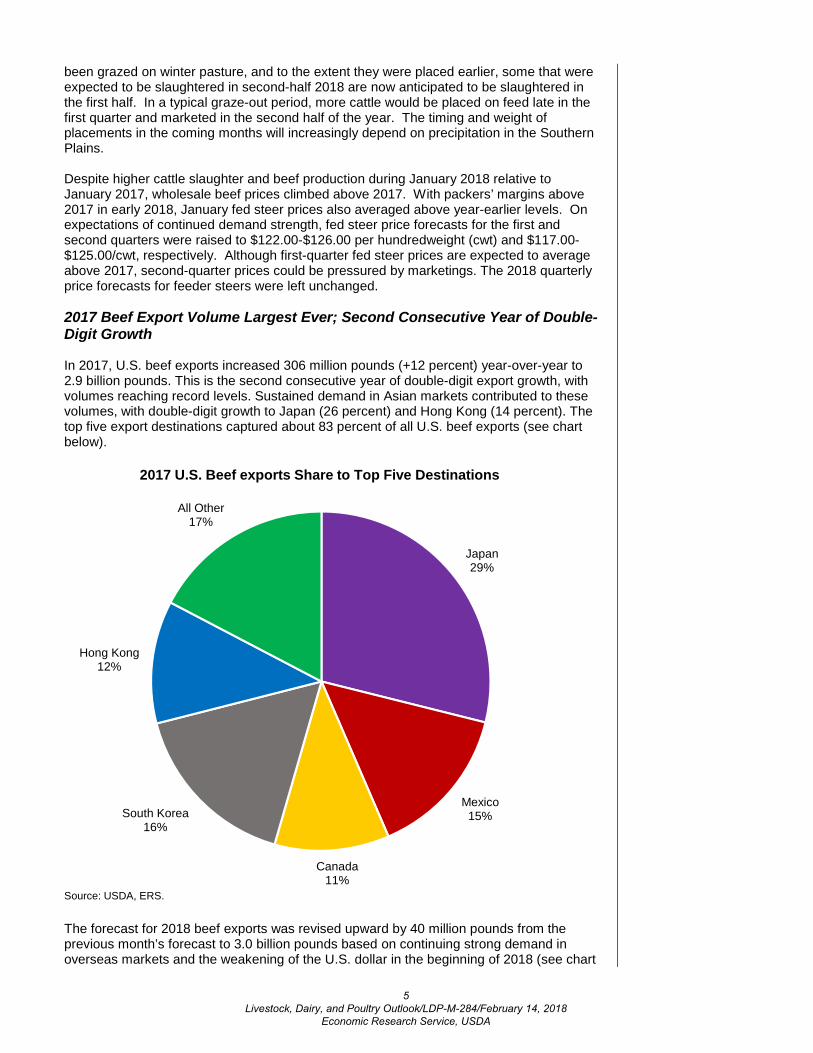
In 2017, U.S. beef exports increased 306 million pounds (+12 percent) year-over-year to 2.9 billion pounds. This is the second consecutive year of double-digit export growth, with volumes reaching record levels. Sustained demand in Asian markets contributed to these volumes, with double-digit growth to Japan (26 percent) and Hong Kong (14 percent). The top five export destinations captured about 83 percent of all U.S. beef exports (see chart below).
The forecast for 2018 beef exports was revised upward by 40 million pounds from the previous month’s forecast to 3.0 billion pounds based on continuing strong demand in overseas markets and the weakening of the U.S. dollar in the beginning of 2018 (see chart
Japan29%
Mexico15%
Canada11%
South Korea16%
Hong Kong12%
All Other17%
2017 U.S. Beef exports Share to Top Five Destinations
Source: USDA, ERS.
5 Livestock, Dairy, and Poultry Outlook/LDP-M-284/February 14, 2018
Economic Research Service, USDA

below). The U.S. dollar trade index has dropped to the lowest level since June 2015, making U.S. products more attractive in foreign markets. Reflecting a continued tightness of beef availability from Oceania, increased U.S. shipments are expected to go mainly to Asian markets.
U.S. Beef Imports Slightly Down in 2017
Beef imports in 2017 were down slightly (-20.3 million pounds) from year-earlier levels to just under 3.0 billion pounds. Lower than expected beef imports reflect tighter beef supplies from Oceania due to prolonged drought and continued herd rebuilding. Some of the decline in lean beef imports was offset by higher U.S. cow slaughter. U.S. reductions in imports were from Australia (-71.9 million pounds), New Zealand (-55.5 million pounds), and Brazil (-14.3 million pounds), while there were increases from Mexico (+80 million pounds), Canada (+23 million pounds), and Nicaragua (+22 million pounds). Overall, five countries supplied more than 90 percent of the U.S. beef import supply (see chart below). The import forecast for 2018 is unchanged from the previous month.
90
95
100
105
110
115
120
125
130
Trade-weighted U.S. dollar index*: Broad, index Jan. 1997=100, monthly, not seasonally adjusted
Source: Board of Governors of the Federal Reserve System of the United States.*The trade-weighted US dollar index is a measure of the value of the United States dollar relative to majortrading partner’s currencies.
6 Livestock, Dairy, and Poultry Outlook/LDP-M-284/February 14, 2018
Economic Research Service, USDA

Cattle Export Growth in 2018 To Continue
Cattle exports in 2017 more than doubled from 2016 levels to 192,984 head, mainly due to increased exports to Canada. Exports to Canada were more than double from 2016 in each month of 2017, resulting in a 289-percent increase from 37,340 head in 2016 to 145,284 head in 2017. The relative weakening of the trade-weighted U.S. dollar and higher feeder cattle prices in Canada relative to the United States during October and November supported greater U.S. shipments to Canada. Exports to Mexico were only slightly higher in 2017 from the previous year. U.S. cattle shipments to other destinations, mainly Turkey, Vietnam, and Qatar, increased fourfold above year-earlier levels to 17,981 head (up by 14,479 head) in 2017. Based on the strong pace of exports during the end of the year and the weakening of the U.S. dollar in the beginning of 2018, the 2018 cattle export forecast was increased by 10,000 head from January’s forecast to 200,000 head.
U.S. cattle imports in 2017 totaled 1.8 million head, up 97,681 head (+5.7 percent) from the previous year. The 16-percent decline from Canada (-122,466 head) was outweighed by a year-over-year 23-percent increase in imports from Mexico (+220,150 head). Higher feeder cattle prices in the U.S. during late-spring and summer 2017, along with an increased cattle supply in Mexico, likely increased Mexican shipments. The 2018 cattle import forecast is unchanged from the previous month’s forecast.
- Russell Knight, [email protected], and Lekhnath Chalise,[email protected]
Australia 23%
Canada 25%
New Zealand 18%
Brazil 5%
Mexico 19%
All Other 10%
2017 U.S. Beef Imports Share from Top Five Suppliers
Source: USDA, ERS.
7 Livestock, Dairy, and Poultry Outlook/LDP-M-284/February 14, 2018
Economic Research Service, USDA
Dairy Recap of the 2017 Dairy Industry Situation The simple average all-milk price rose from $16.30 per cwt in 2016 to $17.63 in 2017. The lower average price in 2016 was due to relatively low prices at the beginning of that year. The all-milk price in the first quarter of 2017 was $18.23 per cwt. It fell to $16.83 in the second quarter, but then rose to $17.70 and $17.73 in the third and fourth quarters of 2017, respectively. Annual average prices of butter, cheese, nonfat dry milk (NDM), and dry whey all increased from 2016 to 2017. Milk production continued growing throughout 2017, increasing 1.7 percent over the previous year (adjusted for leap year). Milk cows numbered 9.392 million head, on average, an increase of 64,000 from 2016. Milk per cow was 22,937 pounds in 2017, 1.0 percent higher than 2016 (adjusted for leap year). The year-over-year growth rate in yield per cow decreased through the year. In the first quarter, it was 1.6 percent over the first quarter of 2016 (adjusted for leap year). In the second, third, and fourth quarters, the year-over-year growth rate decreased to 1.0, 0.9, and 0.5 percent, respectively. Along with higher milk prices through most of 2017, relatively low feed prices contributed to the increase in milk production for the year. Average calendar-year prices for corn, soybean meal, and alfalfa hay were $3.36 per bushel, $316 per short ton, and $145.33 per short ton, respectively. The milk-feed ratio averaged 2.42 for the year, an increase from 2.26 in 2016. Relatively strong global demand for products appears to have contributed to the rise of prices in 2017, especially for products with high milk-fat content. Consumer perceptions of butterfat have changed in recent years as several studies have indicated possible lower risks of consuming butterfat and detrimental effects of alternative trans fats. The Oceania export price for butter rose from $1.49 in 2016 to $2.43 per pound in 2017, and the Western Europe price rose from $1.60 to $2.69 per pound. The U.S. domestic price increase was not as large, from $2.08 per pound in 2016 to $2.33 per pound in 2017. The strength in global demand for milk fat has resulted in a global surplus of skim solids. At the end of 2017, the European Union (EU) held 833 million pounds of skim milk powder in public storage from its intervention program. Most of the stocks were more than a year old. Higher global demand and U.S. price competitiveness translated into higher U.S. exports. Exports of butterfat products, whey products, cheese, and skim milk powder/nonfat dry milk (SMP/NDM) increased from 2016 to 2017. Overall, exports increased from 8.4 billion to 9.3 billion pounds (10.7 percent) on a milk-fat milk-equivalent basis and from 39.0 billion to 40.8 billion pounds (4.6 percent) on a skim-solids milk-equivalent basis. While export quantities went up from 2016 to 2017, import quantities went down from 7.0 billion to 6.0 billion pounds on a milk-fat basis (-14.3 percent) and from 6.5 to 6.1 billion pounds on a skim-solids basis (-6.2 percent). While the U.S. dairy industry benefited from higher global demand, domestic use of dairy products was relatively weak in 2017. On a milk-fat basis, domestic use increased only 0.3 percent from the previous year, quite remarkable after 3 years of solid growth, particularly the 3.3 percent growth of 2016. On a skim-solids basis, domestic use decreased by 0.7 percent after 3 years of growth. Domestic use declined for all of the dairy products tracked by USDA Economic Research Service except for butter, American-type cheese, and lactose. Domestic use of butter increased by only 0.3 percent. Domestic use of Other-than-American cheese fell by 0.1 percent, the first decline since 2008, a year of recession. The weak domestic use of 2017 is puzzling given the strengthening of the economy throughout the year. While higher wholesale prices compared to 2016 may have played a role in the relatively low quantities demanded, the price changes were likely not large enough to fully account for the observed statistics.
8 Livestock, Dairy, and Poultry Outlook/LDP-M-284/February 14, 2018
Economic Research Service, USDA
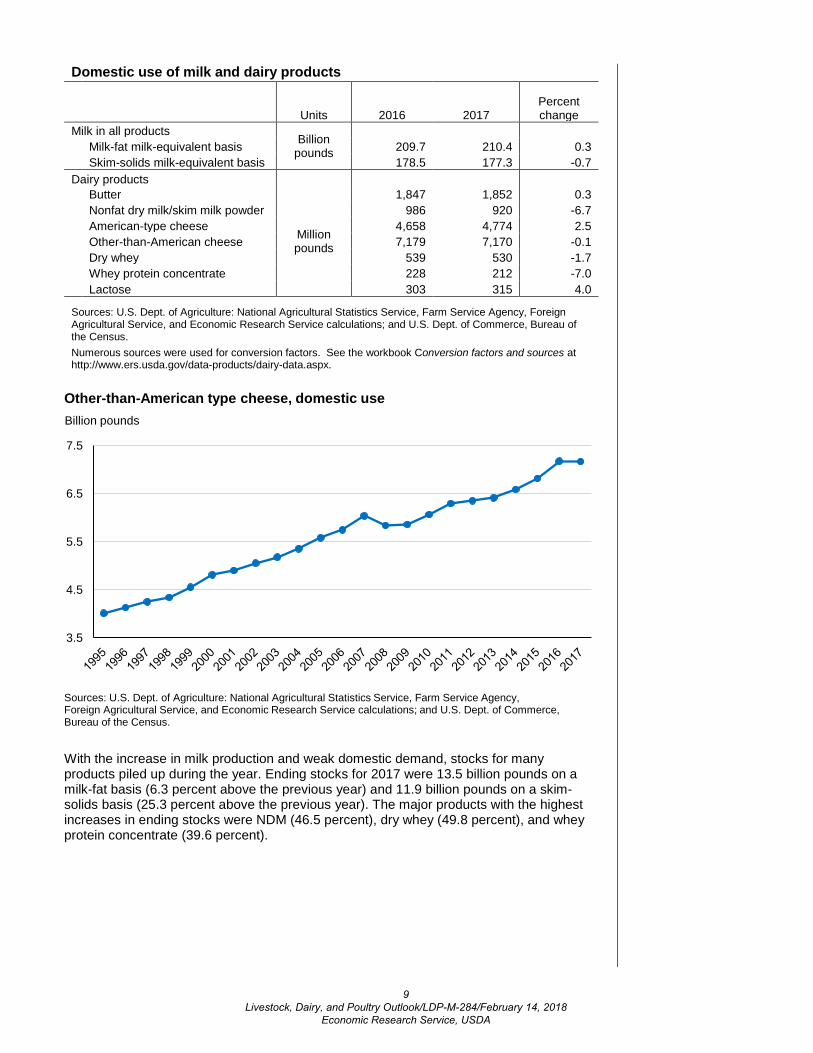
Domestic use of milk and dairy products
Units 2016 2017 Percent change
Milk in all products Billion
pounds
Milk-fat milk-equivalent basis 209.7 210.4 0.3
Skim-solids milk-equivalent basis 178.5 177.3 -0.7 Dairy products
Butter
Million pounds
1,847 1,852 0.3 Nonfat dry milk/skim milk powder 986 920 -6.7 American-type cheese 4,658 4,774 2.5 Other-than-American cheese 7,179 7,170 -0.1 Dry whey 539 530 -1.7 Whey protein concentrate 228 212 -7.0
Lactose 303 315 4.0
Sources: U.S. Dept. of Agriculture: National Agricultural Statistics Service, Farm Service Agency, Foreign Agricultural Service, and Economic Research Service calculations; and U.S. Dept. of Commerce, Bureau of the Census. Numerous sources were used for conversion factors. See the workbook Conversion factors and sources at http://www.ers.usda.gov/data-products/dairy-data.aspx.
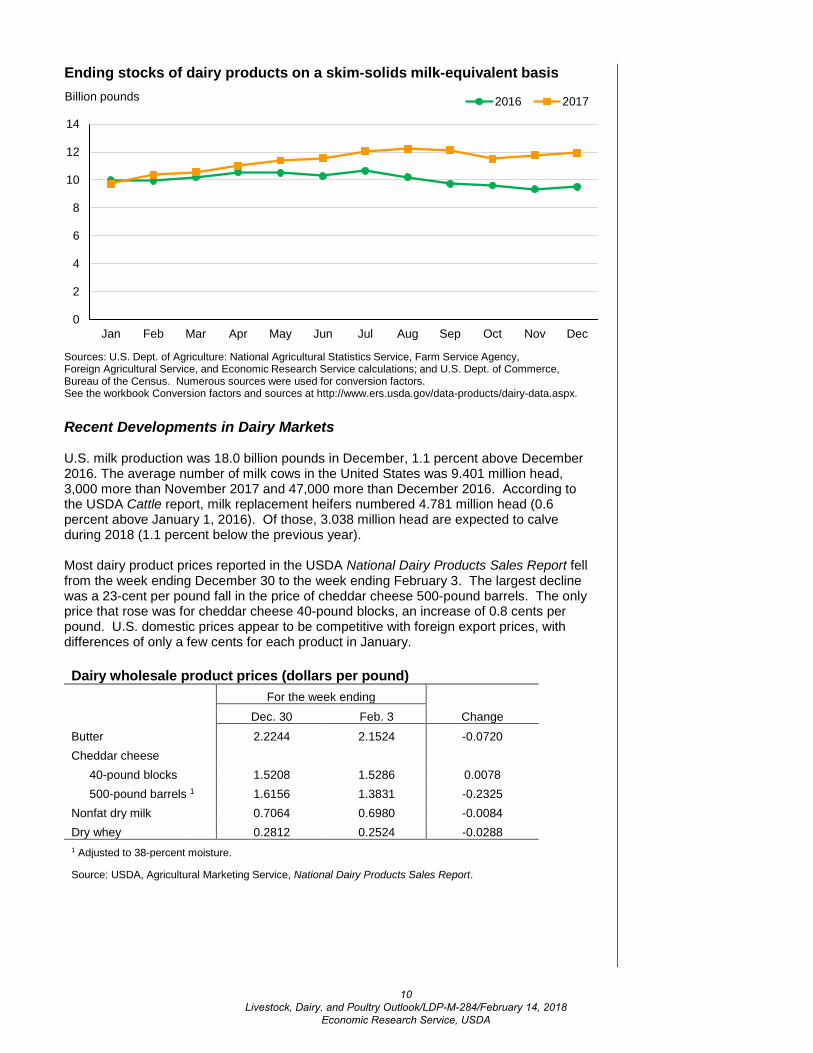
With the increase in milk production and weak domestic demand, stocks for many products piled up during the year. Ending stocks for 2017 were 13.5 billion pounds on a milk-fat basis (6.3 percent above the previous year) and 11.9 billion pounds on a skim-solids basis (25.3 percent above the previous year). The major products with the highest increases in ending stocks were NDM (46.5 percent), dry whey (49.8 percent), and whey protein concentrate (39.6 percent).
3.5
4.5
5.5
6.5
7.5
Sources: U.S. Dept. of Agriculture: National Agricultural Statistics Service, Farm Service Agency, Foreign Agricultural Service, and Economic Research Service calculations; and U.S. Dept. of Commerce, Bureau of the Census.
Other-than-American type cheese, domestic useBillion pounds
9 Livestock, Dairy, and Poultry Outlook/LDP-M-284/February 14, 2018
Economic Research Service, USDA
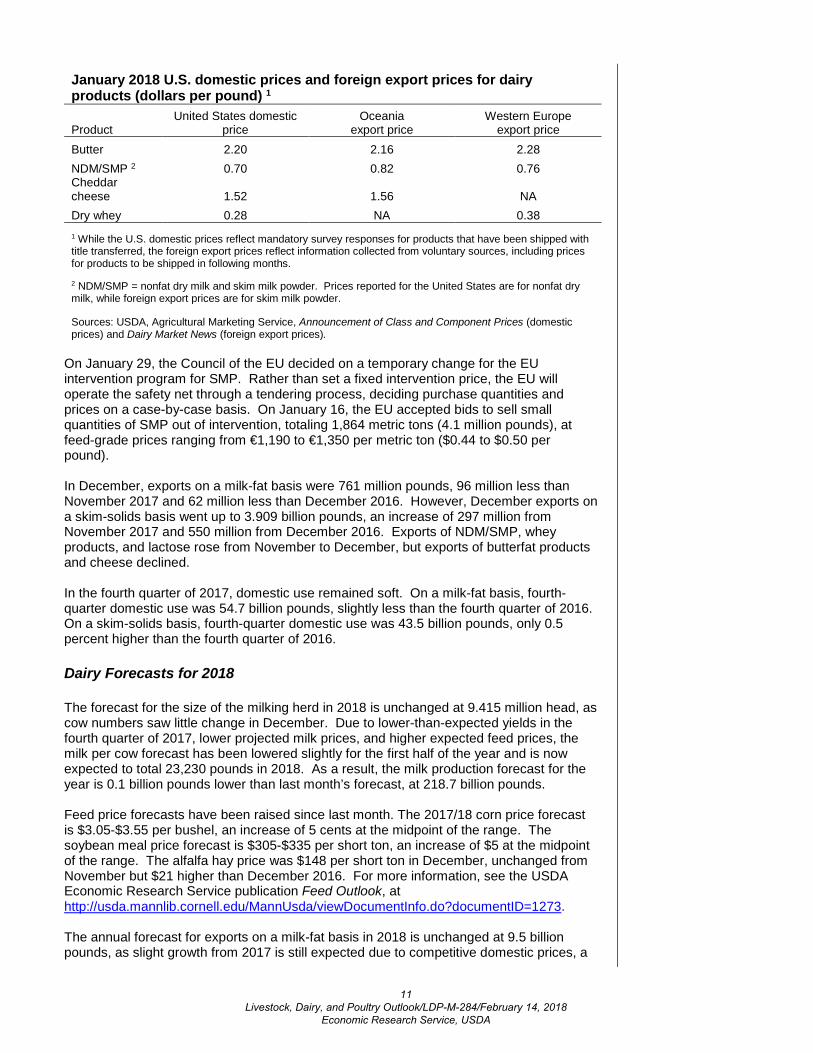
Recent Developments in Dairy Markets U.S. milk production was 18.0 billion pounds in December, 1.1 percent above December 2016. The average number of milk cows in the United States was 9.401 million head, 3,000 more than November 2017 and 47,000 more than December 2016. According to the USDA Cattle report, milk replacement heifers numbered 4.781 million head (0.6 percent above January 1, 2016). Of those, 3.038 million head are expected to calve during 2018 (1.1 percent below the previous year). Most dairy product prices reported in the USDA National Dairy Products Sales Report fell from the week ending December 30 to the week ending February 3. The largest decline was a 23-cent per pound fall in the price of cheddar cheese 500-pound barrels. The only price that rose was for cheddar cheese 40-pound blocks, an increase of 0.8 cents per pound. U.S. domestic prices appear to be competitive with foreign export prices, with differences of only a few cents for each product in January. Dairy wholesale product prices (dollars per pound) For the week ending Dec. 30 Feb. 3 Change Butter 2.2244 2.1524 -0.0720 Cheddar cheese 40-pound blocks 1.5208 1.5286 0.0078
500-pound barrels 1 1.6156 1.3831 -0.2325 Nonfat dry milk 0.7064 0.6980 -0.0084 Dry whey 0.2812 0.2524 -0.0288 1 Adjusted to 38-percent moisture. Source: USDA, Agricultural Marketing Service, National Dairy Products Sales Report.
0
2
4
6
8
10
12
14
Jan Feb Mar Apr May Jun Jul Aug Sep Oct Nov Dec
2016 2017
Sources: U.S. Dept. of Agriculture: National Agricultural Statistics Service, Farm Service Agency, Foreign Agricultural Service, and Economic Research Service calculations; and U.S. Dept. of Commerce, Bureau of the Census. Numerous sources were used for conversion factors. See the workbook Conversion factors and sources at http://www.ers.usda.gov/data-products/dairy-data.aspx.
Ending stocks of dairy products on a skim-solids milk-equivalent basisBillion pounds
10 Livestock, Dairy, and Poultry Outlook/LDP-M-284/February 14, 2018
Economic Research Service, USDA
January 2018 U.S. domestic prices and foreign export prices for dairy products (dollars per pound) 1
Product United States domestic
price Oceania
export price Western Europe
export price Butter 2.20 2.16 2.28 NDM/SMP 2 0.70 0.82 0.76 Cheddar cheese 1.52 1.56 NA Dry whey 0.28 NA 0.38 1 While the U.S. domestic prices reflect mandatory survey responses for products that have been shipped with title transferred, the foreign export prices reflect information collected from voluntary sources, including prices for products to be shipped in following months.
2 NDM/SMP = nonfat dry milk and skim milk powder. Prices reported for the United States are for nonfat dry milk, while foreign export prices are for skim milk powder.
Sources: USDA, Agricultural Marketing Service, Announcement of Class and Component Prices (domestic prices) and Dairy Market News (foreign export prices).
On January 29, the Council of the EU decided on a temporary change for the EU intervention program for SMP. Rather than set a fixed intervention price, the EU will operate the safety net through a tendering process, deciding purchase quantities and prices on a case-by-case basis. On January 16, the EU accepted bids to sell small quantities of SMP out of intervention, totaling 1,864 metric tons (4.1 million pounds), at feed-grade prices ranging from €1,190 to €1,350 per metric ton ($0.44 to $0.50 per pound). In December, exports on a milk-fat basis were 761 million pounds, 96 million less than November 2017 and 62 million less than December 2016. However, December exports on a skim-solids basis went up to 3.909 billion pounds, an increase of 297 million from November 2017 and 550 million from December 2016. Exports of NDM/SMP, whey products, and lactose rose from November to December, but exports of butterfat products and cheese declined. In the fourth quarter of 2017, domestic use remained soft. On a milk-fat basis, fourth-quarter domestic use was 54.7 billion pounds, slightly less than the fourth quarter of 2016. On a skim-solids basis, fourth-quarter domestic use was 43.5 billion pounds, only 0.5 percent higher than the fourth quarter of 2016. Dairy Forecasts for 2018 The forecast for the size of the milking herd in 2018 is unchanged at 9.415 million head, as cow numbers saw little change in December. Due to lower-than-expected yields in the fourth quarter of 2017, lower projected milk prices, and higher expected feed prices, the milk per cow forecast has been lowered slightly for the first half of the year and is now expected to total 23,230 pounds in 2018. As a result, the milk production forecast for the year is 0.1 billion pounds lower than last month’s forecast, at 218.7 billion pounds. Feed price forecasts have been raised since last month. The 2017/18 corn price forecast is $3.05-$3.55 per bushel, an increase of 5 cents at the midpoint of the range. The soybean meal price forecast is $305-$335 per short ton, an increase of $5 at the midpoint of the range. The alfalfa hay price was $148 per short ton in December, unchanged from November but $21 higher than December 2016. For more information, see the USDA Economic Research Service publication Feed Outlook, at http://usda.mannlib.cornell.edu/MannUsda/viewDocumentInfo.do?documentID=1273. The annual forecast for exports on a milk-fat basis in 2018 is unchanged at 9.5 billion pounds, as slight growth from 2017 is still expected due to competitive domestic prices, a
11 Livestock, Dairy, and Poultry Outlook/LDP-M-284/February 14, 2018
Economic Research Service, USDA

weaker dollar, and plentiful domestic supplies. The 2018 annual import forecast on a milk-fat basis is also unchanged at 6.0 billion pounds. Expectations of domestic demand for products with high milk-fat content are weaker than reflected in last month’s forecast based on recent price weakness and high stocks; therefore, the 2018 domestic use forecast on a milk-fat basis has been lowered 0.2 billion pounds to 214.9 billion. Ending stocks for 2018 on a milk-fat basis are forecast 0.1 billion pounds higher than last month’s forecast, at 12.9 billion pounds. On a skim-solids basis, exports for 2018 are projected 0.5 billion pounds higher than the previous forecast, at 42.5 billion pounds, as recent strength in exports of NDM/SMP, whey products, and lactose is expected to carry into the first half of 2018. Imports on a skim-solids basis are now forecast at 6.0 billion pounds for the year, 0.1 billion pounds higher than the last forecast. The domestic use forecast has been lowered 0.8 billion pounds to 181.6 billion, as domestic use lagged year-ago levels in November and December despite lower prices for most dairy products. Ending stocks on a skim-solids basis for the year are forecast at 11.6 billion pounds, unchanged from last month’s forecast. Small changes have been made in forecasts for some product prices in 2018. The cheddar cheese price forecast has been lowered to $1.530-$1.600 per pound for the year, as prices in the first half are projected lower but should still climb throughout the year. Recent price declines and continued flagging growth in butter consumption have motivated a decrease in the butter price forecast for the year to $2.195-$2.295 per pound. The dry whey and NDM price annual forecasts are unchanged at $0.270-$0.300 and $0.715-$0.775 per pound, respectively. The Class III price forecast has been lowered to $14.20-$14.90 per cwt due to lower cheese prices; the Class IV price forecast for 2018 is also lower at $13.35-$14.15 because of lower butter prices. The all-milk price forecast for the year is $15.70-$16.40 per cwt, 15 cents lower at the midpoint of the range than last month’s forecast. - Jonathan Law, [email protected], and Jerry Cessna, [email protected]
12 Livestock, Dairy, and Poultry Outlook/LDP-M-284/February 14, 2018
Economic Research Service, USDA

Pork/Hogs Increased Hog Slaughter and Higher Hog Prices in January 2018 Commercial pork production in the first quarter of 2018 is expected to be 6.6 billion pounds, about 2.9 percent above the same period a year ago. This forecast represents a reduction of about 75 million pounds from the January forecast. The lower-than-expected pace of January hog slaughter prompted the change. Estimated federally inspected hog slaughter in January was 10.65 million head, almost 6 percent ahead of January 2017. The January 2018 average price of live equivalent 51-52 percent lean hogs of $50.40 per cwt—almost 11 percent above year-earlier prices—shows how recently-increased U.S. hog processor capacity has translated into an increase in demand for hogs: more hogs, purchased at higher prices by processors, to fill expanded processing capacity. While higher hog prices benefit producers, it is not clear whether current consumer demand for pork is keeping pace with production increases. Margin compression—in this case, processor costs increasing faster than product prices—could turn out to be a short term outcome of expanded processing capacity. In January 2018, the gross processor margin (hog price-wholesale pork carcass cutout) averaged $12.70 per cwt, almost 33 percent lower than the gross margin in January 2017. While both hog prices and the wholesale carcass cutout value increased in January, hog prices increased faster, pressuring processor margins. The wholesale value of the pork cutout increased by about 4 percent from January 2 to January 31, but hog prices increased by almost 17 percent. The rapid increase in hog prices is almost certainly brought about by increased processor competition for live hogs. With 2018 real GDP growth expected to be around 2.8 percent, however, domestic demand for pork is expected to increase proportionally. In recent years, U.S consumer demand for bacon has been particularly strong. Last year, belly primal—the primary input to bacon manufacture—was the source of much of the cutout’s increase in value. Whether belly values can fuel the carcass cutout in 2018—and thus processor margins—is unclear. Among the factors that contributed to the 2017 run-up in belly prices was the record-low beginning stocks level. Beginning belly stocks last year, at almost 18 million pounds, were the lowest recorded level since December 1977. Beginning belly stocks this year, however, were more than double those of a year earlier, at 39.675 million pounds. On the other hand, just 1 month into 2018, the increase in the value of the cutout in January compared to December 2017 was attributable to the belly primal, with small increases from the ham, butt, and rib primals.
13 Livestock, Dairy, and Poultry Outlook/LDP-M-284/February 14, 2018
Economic Research Service, USDA

The expansion of U.S. processing capacity elevates the importance of pork exports as a component of total pork demand. In 2017, 22 percent of U.S. commercial pork production was exported. This year, exports are expected to be 5.9 billion pounds, almost 5 percent above 2017 and 21.9 percent of commercial pork production. For the year 2017, the 10 largest export markets are summarized below. Roughly the same set of countries is expected to account for about 95 percent of U.S exports in 2018. It is anticipated that increased U.S pork production this year, and the lower pork prices that accompany it, will make U.S pork a very good buy in major foreign markets.
50
75
100
125
150
175
200
225
1 8 15 22 29 36 43 50
2017 20163-yr.avg. 2018
Weekly pork belly primal price$/cwt
Source: Agricultural Marketing Service, USDA.
010,00020,00030,00040,00050,00060,00070,00080,00090,000
Jan.
Feb.
Mar
.Ap
r.M
ayJu
n.Ju
l.Au
g.Se
p.O
ct.
Nov
.D
ec.
201720163-yr. avg.
Monthly ending stocks, pork belliesthousand pounds
Source: National Agricultural Statistics Service, USDA.
-1.50-1.25-1.00-0.75-0.50-0.25 0.00 0.25 0.50 0.75 1.00 1.25 1.50 1.75 2.00 2.25 2.50
Carcass
Loin
Butt
Pic
Rib
Ham
Belly
Other
Primal contributions to $1.60 difference in carcass cutout value, between January 2018 and December 2017
Source: Agricultural Marketing Service, USDA.
14 Livestock, Dairy, and Poultry Outlook/LDP-M-284/February 14, 2018
Economic Research Service, USDA
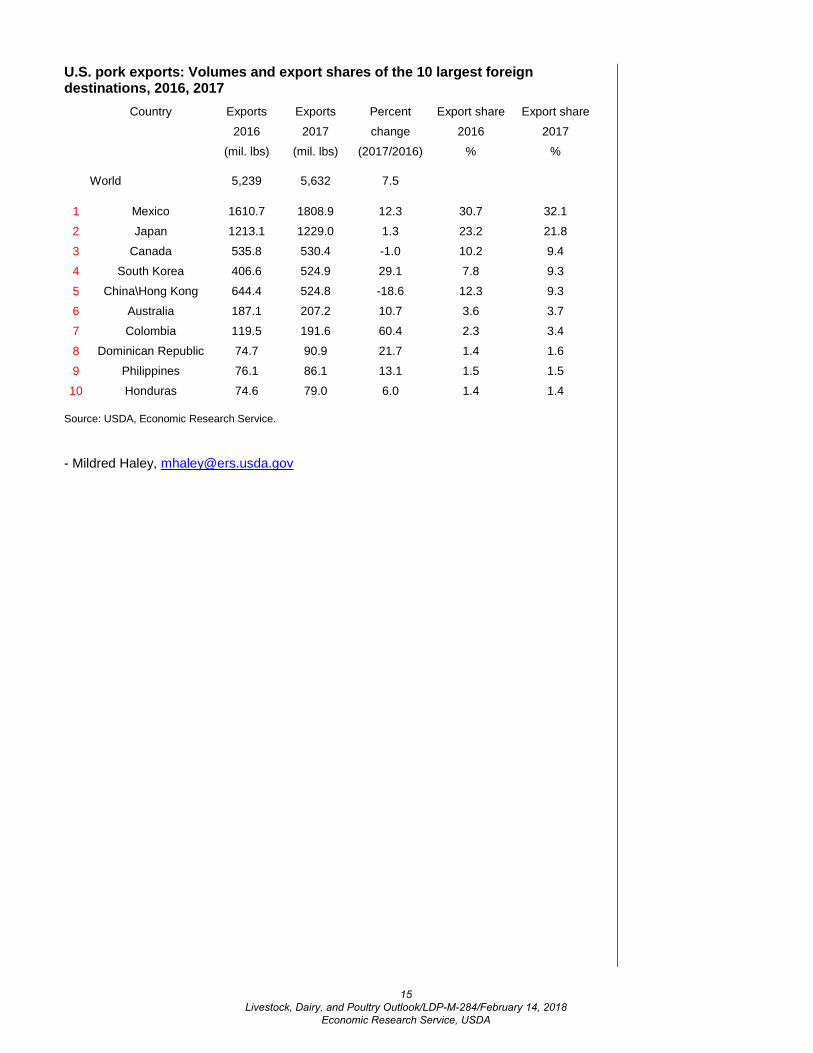
U.S. pork exports: Volumes and export shares of the 10 largest foreign destinations, 2016, 2017
Country Exports Exports Percent Export share Export share
2016 2017 change 2016 2017
(mil. lbs) (mil. lbs) (2017/2016) % %
World 5,239 5,632 7.5 1 Mexico 1610.7 1808.9 12.3 30.7 32.1 2 Japan 1213.1 1229.0 1.3 23.2 21.8 3 Canada 535.8 530.4 -1.0 10.2 9.4 4 South Korea 406.6 524.9 29.1 7.8 9.3 5 China\Hong Kong 644.4 524.8 -18.6 12.3 9.3 6 Australia 187.1 207.2 10.7 3.6 3.7 7 Colombia 119.5 191.6 60.4 2.3 3.4 8 Dominican Republic 74.7 90.9 21.7 1.4 1.6 9 Philippines 76.1 86.1 13.1 1.5 1.5
10 Honduras 74.6 79.0 6.0 1.4 1.4
Source: USDA, Economic Research Service. - Mildred Haley, [email protected]
15 Livestock, Dairy, and Poultry Outlook/LDP-M-284/February 14, 2018
Economic Research Service, USDA

Sheep / Lamb Sheep and Lamb Inventory Down Slightly in 2018 The sheep inventory registered a fractional decline of 20,000 fewer animals than last year. The NASS Sheep and Goats report estimated the inventory of all sheep and lamb in the United States on January 1, 2018, at 5.230 million head. Texas, the largest sheep producing State, had a 40,000-head increase in 2018, recovering from the 15,000-head decline the previous year. Colorado and South Dakota also had increases, gaining by 25,000 and 10,000 head, respectively. However, California, the second largest sheep producing State, had a 30,000-head decline. Wyoming, Idaho, and Iowa also had inventory decreases, in excess of 10,000-head each.
16 Livestock, Dairy, and Poultry Outlook/LDP-M-284/February 14, 2018
Economic Research Service, USDA

While the NASS Sheep and Goats report shows that there are 25,000 more market lambs on January 1, 2018, than on the same date last year, the drop in breeding sheep inventory portends fewer animals available for market in the latter half of 2018. Despite a 30,000-head increase in breeding sheep in Texas, the total U.S. breeding sheep inventory decreased by 45,000 head, 1 percent below the previous year to 3.83 million head. This was comprised of 5,000 fewer replacement lambs under 1 year and 40,000 fewer ewes 1 year and older. With the lambing rate remaining fairly stable at 105 lambs per 100 ewes 1 year or older, attempts at inventory growth could result in an already tight lamb market becoming ever tighter. Slight Improvement in Prices Expected in 2018 The Choice slaughter lamb prices at San Angelo, Texas ended 2017 at their lowest levels for the year. The fourth-quarter slaughter-lamb price was $131.22 per cwt, dragged down by a healthy supply of meat in the livestock and poultry complex and the lower prices of those competing meats. January 2018 prices were little changed from late last year, averaging $130.88 per cwt. Prices are expected to improve slightly as the quarter progresses, however, as increased seasonal demand for the religious holidays is expected to bolster lamb prices. Easter and Passover begin during the first week of April, and the impact on lamb demand and prices should be felt in the first quarter. First-quarter 2018 prices are forecast at $130-$134 per cwt. Production Expected To Show Little Change in 2018 Commercial lamb and mutton production totaled 145 million pounds in 2017, down 3 percent from 2016, with the fourth quarter totaling 37 million pounds. The NASS Sheep and Goats report shows the market sheep and lamb inventory up 2 percent from January 2018, which suggests that lamb meat supply during the first half of 2018 could be higher than last year; however, the smaller 2017 lamb crop, coupled with a small breeding-sheep flock, suggests that fewer slaughter animals may be available during the latter half of 2018. First-quarter 2018 lamb and mutton production are forecast at 37 million pounds,
17 Livestock, Dairy, and Poultry Outlook/LDP-M-284/February 14, 2018
Economic Research Service, USDA
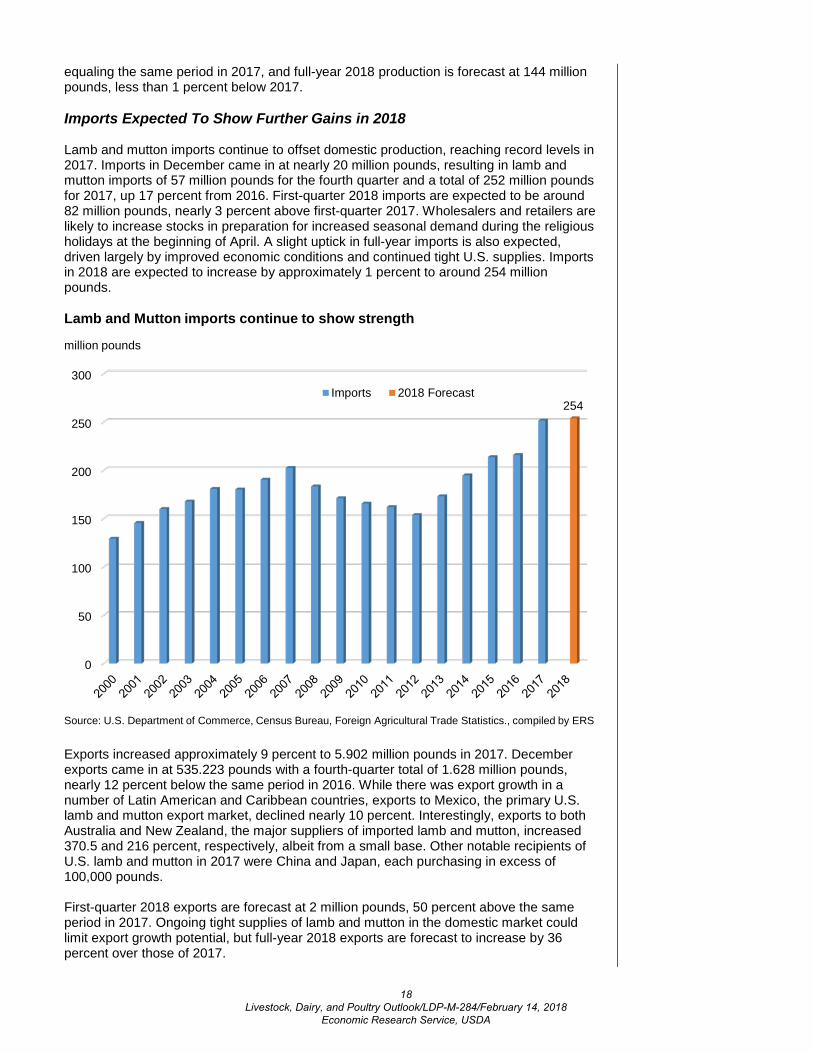
equaling the same period in 2017, and full-year 2018 production is forecast at 144 million pounds, less than 1 percent below 2017. Imports Expected To Show Further Gains in 2018 Lamb and mutton imports continue to offset domestic production, reaching record levels in 2017. Imports in December came in at nearly 20 million pounds, resulting in lamb and mutton imports of 57 million pounds for the fourth quarter and a total of 252 million pounds for 2017, up 17 percent from 2016. First-quarter 2018 imports are expected to be around 82 million pounds, nearly 3 percent above first-quarter 2017. Wholesalers and retailers are likely to increase stocks in preparation for increased seasonal demand during the religious holidays at the beginning of April. A slight uptick in full-year imports is also expected, driven largely by improved economic conditions and continued tight U.S. supplies. Imports in 2018 are expected to increase by approximately 1 percent to around 254 million pounds.
Exports increased approximately 9 percent to 5.902 million pounds in 2017. December exports came in at 535.223 pounds with a fourth-quarter total of 1.628 million pounds, nearly 12 percent below the same period in 2016. While there was export growth in a number of Latin American and Caribbean countries, exports to Mexico, the primary U.S. lamb and mutton export market, declined nearly 10 percent. Interestingly, exports to both Australia and New Zealand, the major suppliers of imported lamb and mutton, increased 370.5 and 216 percent, respectively, albeit from a small base. Other notable recipients of U.S. lamb and mutton in 2017 were China and Japan, each purchasing in excess of 100,000 pounds. First-quarter 2018 exports are forecast at 2 million pounds, 50 percent above the same period in 2017. Ongoing tight supplies of lamb and mutton in the domestic market could limit export growth potential, but full-year 2018 exports are forecast to increase by 36 percent over those of 2017.
0
50
100
150
200
250
300
254Imports 2018 Forecast
Source: U.S. Department of Commerce, Census Bureau, Foreign Agricultural Trade Statistics., compiled by ERS
million pounds
Lamb and Mutton imports continue to show strength
18 Livestock, Dairy, and Poultry Outlook/LDP-M-284/February 14, 2018
Economic Research Service, USDA

U.S. lamb and mutton exports to major destinations, 2016 and 2017
2016 2017 Year-over-Year change
--Thousand pounds-- Mexico 2,219 2,008 -9.5% Canada 239 569 137.7% Bahamas 264 336 27.2% United Arab Emirates 53 226 328.7% Bermuda 306 221 -27.6% Aruba 96 181 89.3% Jamaica 39 172 342.2% Trinidad and Tobago 85 160 88.7% Guatemala 2 116 6028.6% Panama 82 113 37.9% Australia 24 112 370.5% China (Mainland) 0 106 Japan 0 106 U.S. Total Exports 5,420 5,902 8.9%
Source: U.S. Department of Commerce, Census Bureau, Foreign Agricultural Trade Statistics., compiled by ERS. - Keithly Jones, [email protected]
19 Livestock, Dairy, and Poultry Outlook/LDP-M-284/February 14, 2018
Economic Research Service, USDA
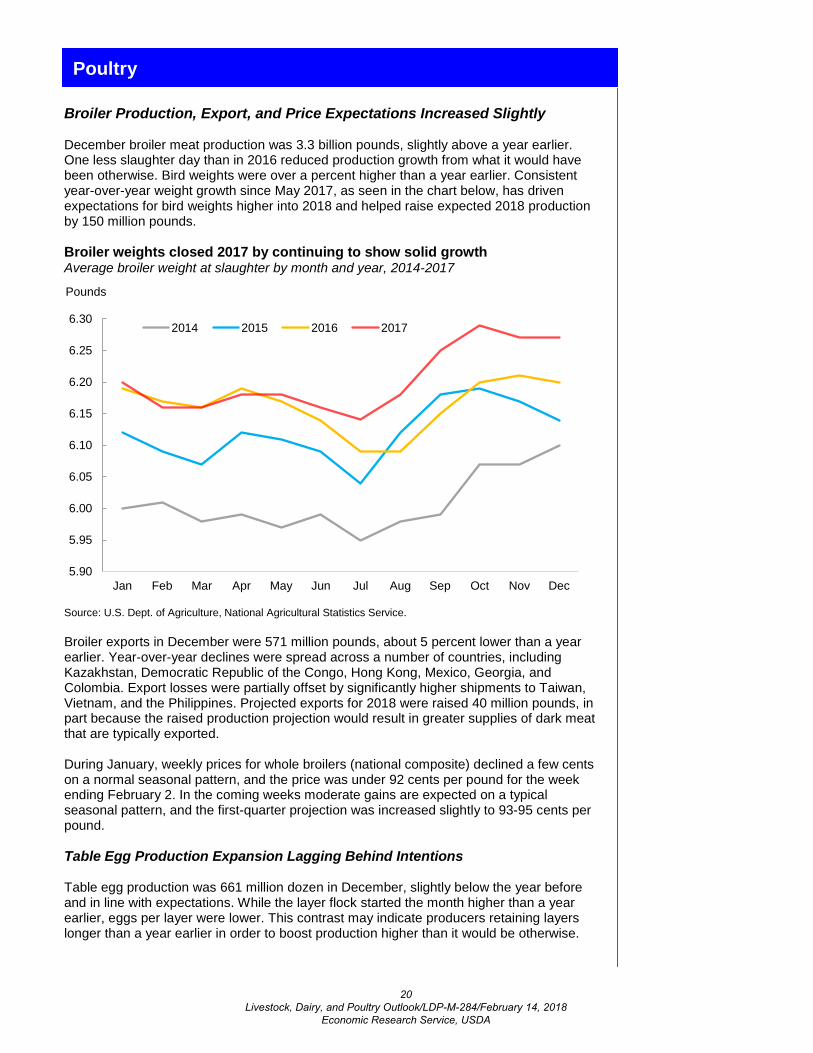
Poultry Broiler Production, Export, and Price Expectations Increased Slightly December broiler meat production was 3.3 billion pounds, slightly above a year earlier. One less slaughter day than in 2016 reduced production growth from what it would have been otherwise. Bird weights were over a percent higher than a year earlier. Consistent year-over-year weight growth since May 2017, as seen in the chart below, has driven expectations for bird weights higher into 2018 and helped raise expected 2018 production by 150 million pounds. Broiler weights closed 2017 by continuing to show solid growth Average broiler weight at slaughter by month and year, 2014-2017
Source: U.S. Dept. of Agriculture, National Agricultural Statistics Service. Broiler exports in December were 571 million pounds, about 5 percent lower than a year earlier. Year-over-year declines were spread across a number of countries, including Kazakhstan, Democratic Republic of the Congo, Hong Kong, Mexico, Georgia, and Colombia. Export losses were partially offset by significantly higher shipments to Taiwan, Vietnam, and the Philippines. Projected exports for 2018 were raised 40 million pounds, in part because the raised production projection would result in greater supplies of dark meat that are typically exported. During January, weekly prices for whole broilers (national composite) declined a few cents on a normal seasonal pattern, and the price was under 92 cents per pound for the week ending February 2. In the coming weeks moderate gains are expected on a typical seasonal pattern, and the first-quarter projection was increased slightly to 93-95 cents per pound. Table Egg Production Expansion Lagging Behind Intentions Table egg production was 661 million dozen in December, slightly below the year before and in line with expectations. While the layer flock started the month higher than a year earlier, eggs per layer were lower. This contrast may indicate producers retaining layers longer than a year earlier in order to boost production higher than it would be otherwise.
5.90
5.95
6.00
6.05
6.10
6.15
6.20
6.25
6.30
Jan Feb Mar Apr May Jun Jul Aug Sep Oct Nov Dec
2014 2015 2016 2017
Pounds
20 Livestock, Dairy, and Poultry Outlook/LDP-M-284/February 14, 2018
Economic Research Service, USDA
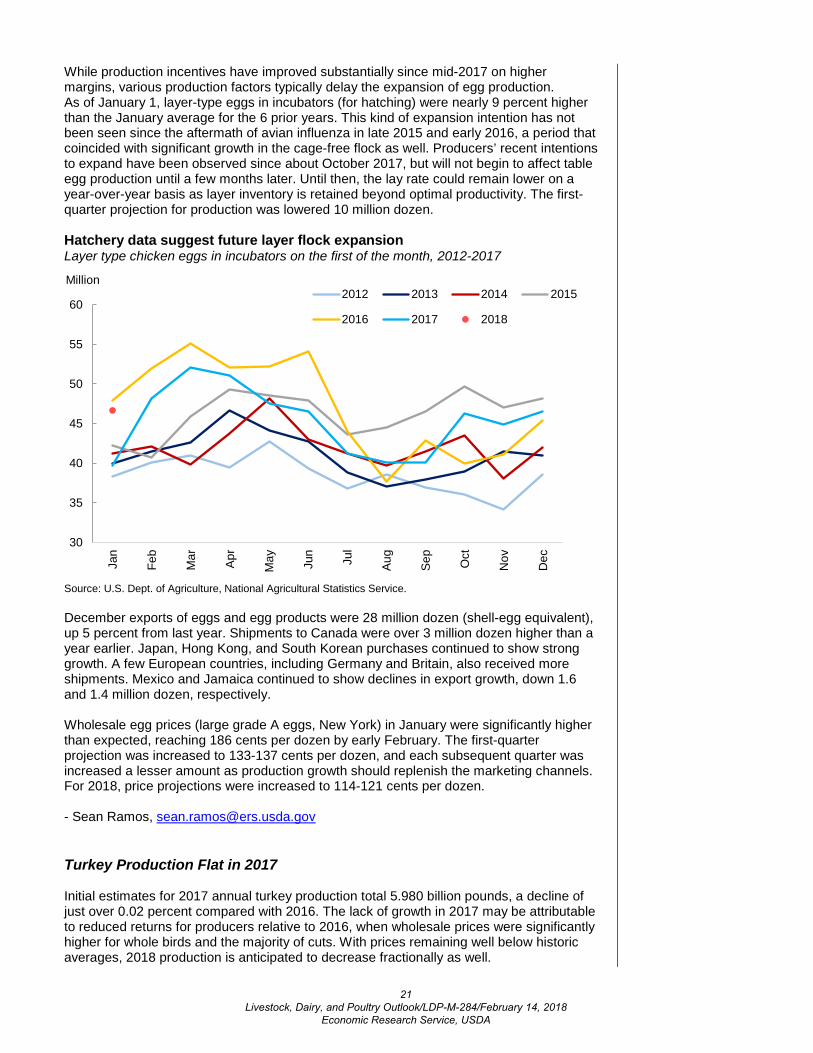
While production incentives have improved substantially since mid-2017 on higher margins, various production factors typically delay the expansion of egg production. As of January 1, layer-type eggs in incubators (for hatching) were nearly 9 percent higher than the January average for the 6 prior years. This kind of expansion intention has not been seen since the aftermath of avian influenza in late 2015 and early 2016, a period that coincided with significant growth in the cage-free flock as well. Producers’ recent intentions to expand have been observed since about October 2017, but will not begin to affect table egg production until a few months later. Until then, the lay rate could remain lower on a year-over-year basis as layer inventory is retained beyond optimal productivity. The first-quarter projection for production was lowered 10 million dozen. Hatchery data suggest future layer flock expansion Layer type chicken eggs in incubators on the first of the month, 2012-2017
Source: U.S. Dept. of Agriculture, National Agricultural Statistics Service. December exports of eggs and egg products were 28 million dozen (shell-egg equivalent), up 5 percent from last year. Shipments to Canada were over 3 million dozen higher than a year earlier. Japan, Hong Kong, and South Korean purchases continued to show strong growth. A few European countries, including Germany and Britain, also received more shipments. Mexico and Jamaica continued to show declines in export growth, down 1.6 and 1.4 million dozen, respectively. Wholesale egg prices (large grade A eggs, New York) in January were significantly higher than expected, reaching 186 cents per dozen by early February. The first-quarter projection was increased to 133-137 cents per dozen, and each subsequent quarter was increased a lesser amount as production growth should replenish the marketing channels. For 2018, price projections were increased to 114-121 cents per dozen. - Sean Ramos, [email protected] Turkey Production Flat in 2017 Initial estimates for 2017 annual turkey production total 5.980 billion pounds, a decline of just over 0.02 percent compared with 2016. The lack of growth in 2017 may be attributable to reduced returns for producers relative to 2016, when wholesale prices were significantly higher for whole birds and the majority of cuts. With prices remaining well below historic averages, 2018 production is anticipated to decrease fractionally as well.
30
35
40
45
50
55
60
Jan
Feb
Mar Ap
r
May Jun
Jul
Aug
Sep
Oct
Nov
Dec
2012 2013 2014 2015
2016 2017 2018
Million
21 Livestock, Dairy, and Poultry Outlook/LDP-M-284/February 14, 2018
Economic Research Service, USDA
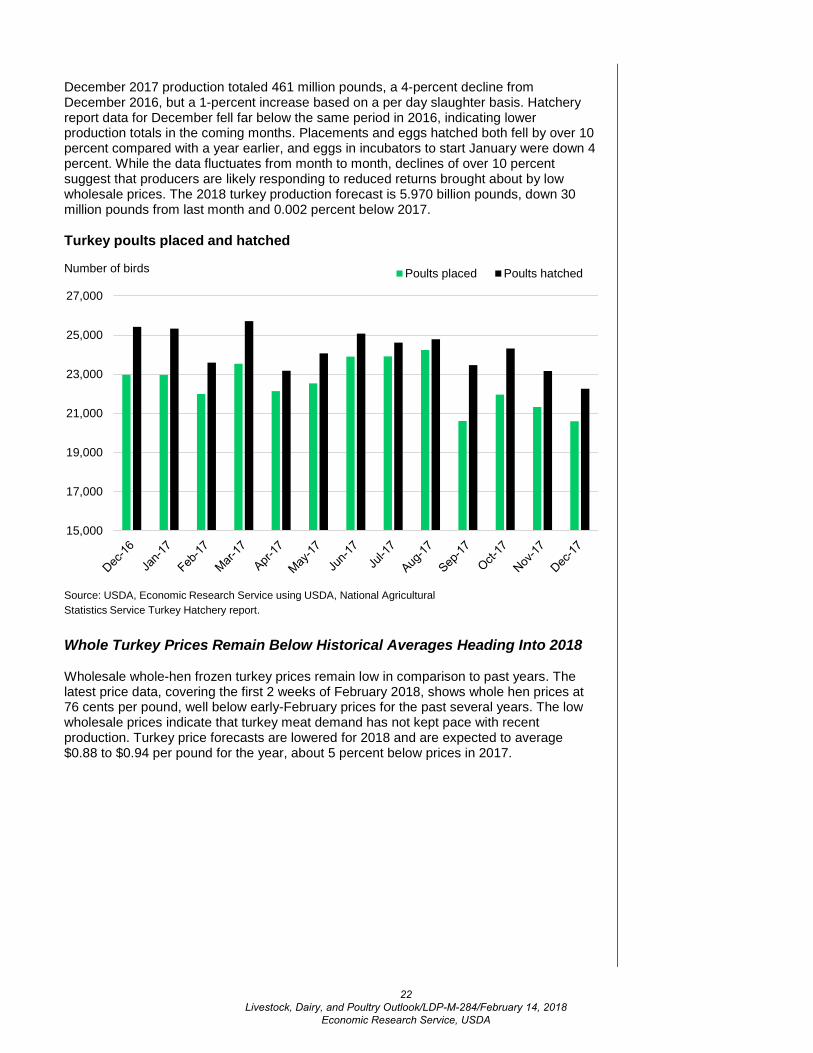
December 2017 production totaled 461 million pounds, a 4-percent decline from December 2016, but a 1-percent increase based on a per day slaughter basis. Hatchery report data for December fell far below the same period in 2016, indicating lower production totals in the coming months. Placements and eggs hatched both fell by over 10 percent compared with a year earlier, and eggs in incubators to start January were down 4 percent. While the data fluctuates from month to month, declines of over 10 percent suggest that producers are likely responding to reduced returns brought about by low wholesale prices. The 2018 turkey production forecast is 5.970 billion pounds, down 30 million pounds from last month and 0.002 percent below 2017.
Whole Turkey Prices Remain Below Historical Averages Heading Into 2018 Wholesale whole-hen frozen turkey prices remain low in comparison to past years. The latest price data, covering the first 2 weeks of February 2018, shows whole hen prices at 76 cents per pound, well below early-February prices for the past several years. The low wholesale prices indicate that turkey meat demand has not kept pace with recent production. Turkey price forecasts are lowered for 2018 and are expected to average $0.88 to $0.94 per pound for the year, about 5 percent below prices in 2017.
15,000
17,000
19,000
21,000
23,000
25,000
27,000
Poults placed Poults hatchedNumber of birds
Source: USDA, Economic Research Service using USDA, National AgriculturalStatistics Service Turkey Hatchery report.
Turkey poults placed and hatched
22 Livestock, Dairy, and Poultry Outlook/LDP-M-284/February 14, 2018
Economic Research Service, USDA
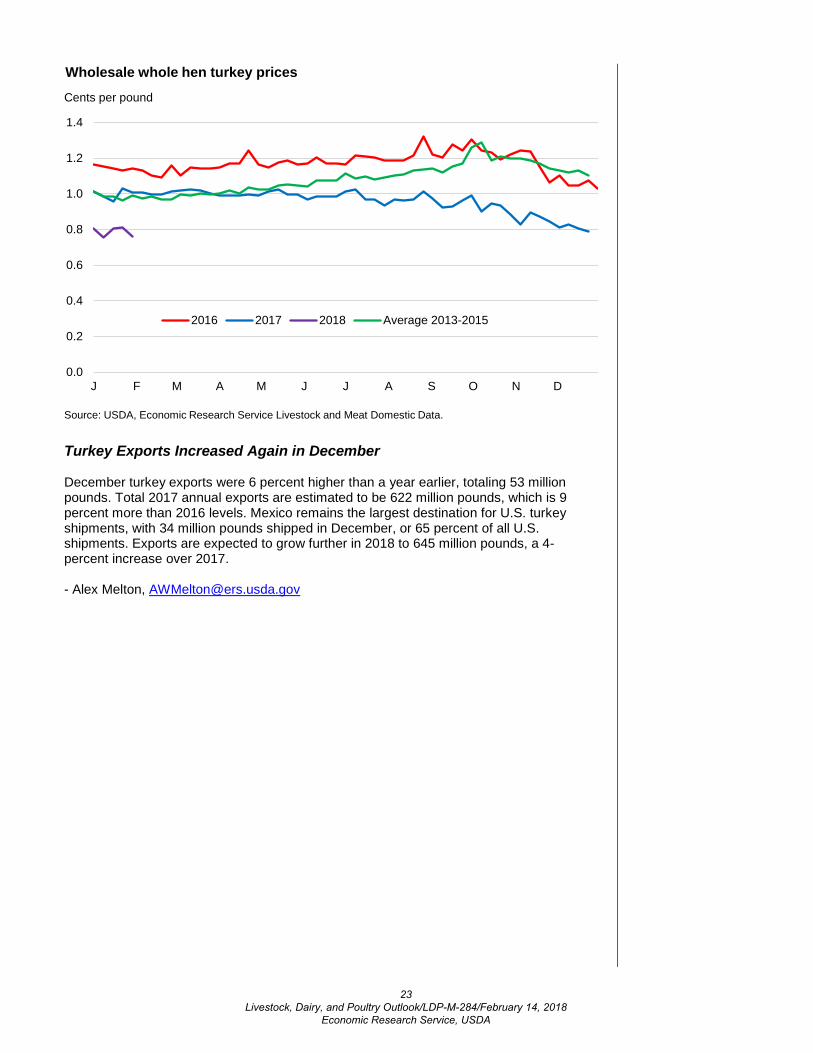
Turkey Exports Increased Again in December December turkey exports were 6 percent higher than a year earlier, totaling 53 million pounds. Total 2017 annual exports are estimated to be 622 million pounds, which is 9 percent more than 2016 levels. Mexico remains the largest destination for U.S. turkey shipments, with 34 million pounds shipped in December, or 65 percent of all U.S. shipments. Exports are expected to grow further in 2018 to 645 million pounds, a 4-percent increase over 2017. - Alex Melton, [email protected]
0.0
0.2
0.4
0.6
0.8
1.0
1.2
1.4
J F M A M J J A S O N D
2016 2017 2018 Average 2013-2015
Cents per pound
Wholesale whole hen turkey prices
Source: USDA, Economic Research Service Livestock and Meat Domestic Data.
23 Livestock, Dairy, and Poultry Outlook/LDP-M-284/February 14, 2018
Economic Research Service, USDA

Data Products Meat Price Spreads, https://www.ers.usda.gov/data-products/meat-price-spreads/, provides monthly average values at the farm, wholesale, and retail stages of the marketing chain for selected animal products.
Livestock and Meat Trade Data, http://www.ers.usda.gov/data-products/livestock-and-meat-international-trade-data/, contains monthly and annual data for imports and exports of live cattle and hogs, beef and veal, lamb and mutton, pork, broilers, turkey, and shell eggs.
Livestock & Meat Domestic Data, http://www.ers.usda.gov/data-products/livestock-meat-domestic-data/, contains domestic supply, disappearance, and price data.
Dairy Data, https://www.ers.usda.gov/data-products/dairy-data/, includes data from multiple sources concerning supply, demand, and prices for the dairy industry.
Related Websites Livestock, Dairy, and Poultry Outlook, http://www.ers.usda.gov/publications/?page=1&topicId=0&authorId=0&seriesCode=LDPM&sort=CopyrightDate&sortDir=desc Animal Production and Marketing Issues, https://www.ers.usda.gov/topics/animal-products/animal-production-marketing-issues/ Cattle, https://www.ers.usda.gov/topics/animal-products/cattle-beef/ Dairy, https://www.ers.usda.gov/topics/animal-products/dairy/ Hogs, https://www.ers.usda.gov/topics/animal-products/hogs-pork/ Poultry and Eggs, https://www.ers.usda.gov/topics/animal-products/poultry-eggs/ WASDE, http://usda.mannlib.cornell.edu/MannUsda/viewDocumentInfo.do?documentID=1194
Contact Information Mildred M. Haley (coordinator) (202) 694-5176 [email protected] Chalise (Cattle/beef) (202) 694-5371 [email protected] Russell Knight (Cattle/beef) (202) 694-5566 [email protected] M. Haley (hogs/pork) (202) 694-5176 [email protected] Ramos (poultry, poultry trade, (202) 694-5443 [email protected]) Alex Melton (Turkey) (202) 694-5409 [email protected] Jerry Cessna (dairy) (202) 694-5171 [email protected] Law (dairy) (202) 694-5544 [email protected] Jones (sheep and lamb) (202) 694-5172 [email protected] Liggon (web publishing) (202) 694-5056 [email protected]
Subscription Information Subscribe to ERS e-mail notification service at https://www.ers.usda.gov/subscribe-to-ers-e-newletters/ to receive timely notification of newsletter availability.
The U.S. Department of Agriculture (USDA) prohibits discrimination in all its programs and activities on the basis of race, color, national origin, age, disability, and, where applicable, sex, marital status, familial status, parental status, religion, sexual orientation, genetic information, political beliefs, reprisal, or because all or a part of an individual’s income is derived from any public assistance program. (Not all prohibited bases apply to all programs.) Persons with disabilities who require alternative means for communication of program information (Braille, large print, audiotape, etc.) should contact USDA’s TARGET Center at (202) 720-2600 (voice and TDD). To file a complaint of discrimination write to USDA, Director, Office of Civil Rights, 1400 Independence Avenue, S.W., Washington, D.C. 20250-9410 or call (800) 795-3272 (voice) or (202) 720-6382 (TDD). USDA is an equal opportunity provider and employer.
E mail Notification
Readers of ERS outlook reports have two ways they can receive an e-mail notice about release of reports and associated data.
• Receive timely notification (soonafter the report is posted on theweb) via USDA’s Economics,Statistics and Market InformationSystem (which is housed atCornell University’s MannLibrary). Go tohttp://usda.mannlib.cornell.edu/MannUsda/aboutEmailService.doand follow the instructions toreceive e-mail notices about ERS,Agricultural Marketing Service,National Agricultural StatisticsService, and World AgriculturalOutlook Board products.
• Receive weekly notification (onFriday afternoon) via the ERSwebsite. Go tohttps://www.ers.usda.gov/topics/farm-economy/commodity-outlook/email-notification/ andfollow the instructions to receivenotices about ERS outlookreports, Amber Waves magazine,and other reports and dataproducts on specific topics. ERSalso offers RSS (really simplesyndication) feeds for all ERSproducts.
20 Livestock, Dairy, and Poultry Outlook/LDP-M-283/January 19, 2018
Economic Research Service, USDA
24 Livestock, Dairy, and Poultry Outlook/LDP-M-284/February 14, 2018
Economic Research Service, USDA

U.S. red meat and poultry forecasts2015 2016 2017 2018
I II III IV Annual I II III IV Annual I II III IV Annual I II III IV Annual
Production, million lb Beef 5,665 5,856 6,068 6,109 23,698 5,938 6,187 6,472 6,625 25,221 6,300 6,404 6,731 6,738 26,173 6,570 7,175 6,885 7,095 27,725 Pork 6,162 5,925 5,958 6,457 24,501 6,230 5,963 6,100 6,648 24,941 6,409 6,137 6,239 6,796 25,581 6,595 6,440 6,580 7,270 26,885 Lamb and mutton 38 39 37 37 150 38 39 36 37 150 37 36 35 37 145 37 35 35 37 144 Broilers 9,718 10,021 10,372 9,937 40,048 10,039 10,253 10,338 10,065 40,696 10,233 10,407 10,551 10,468 41,659 10,475 10,675 10,800 10,650 42,600 Turkeys 1,429 1,389 1,352 1,458 5,627 1,435 1,520 1,515 1,511 5,981 1,487 1,481 1,479 1,532 5,979 1,465 1,470 1,490 1,545 5,970
Total red meat & poultry 23,157 23,382 23,940 24,150 94,630 23,834 24,118 24,623 25,038 97,613 24,612 24,618 25,191 25,725 100,145 25,293 25,952 25,948 26,751 103,944 Table eggs, mil. doz. 1,820 1,726 1,664 1,728 6,938 1,793 1,827 1,876 1,939 7,435 1,902 1,896 1,899 1,938 7,635 1,925 1,930 1,950 2,000 7,805
Per capita disappearance, retail lb 1/ Beef 13.1 13.6 13.9 13.3 54.0 13.6 13.9 14.1 14.0 55.6 14.0 14.2 14.4 14.3 56.9 14.2 15.6 14.6 14.9 59.2 Pork 12.2 11.8 12.1 13.6 49.8 12.6 11.9 12.1 13.5 50.1 12.4 11.8 12.4 13.5 50.1 12.3 12.5 12.8 14.2 51.8 Lamb and mutton 0.2 0.3 0.2 0.3 1.0 0.3 0.3 0.2 0.3 1.0 0.3 0.3 0.2 0.3 1.1 0.3 0.2 0.2 0.3 1.1 Broilers 21.4 22.1 23.3 22.1 89.0 22.5 22.7 22.7 21.8 89.8 22.4 22.9 23.2 22.5 91.0 22.9 23.2 23.5 23.1 92.6 Turkeys 3.5 3.6 3.9 4.9 16.0 3.6 3.9 4.2 4.9 16.6 3.7 3.7 4.0 5.0 16.4 3.8 3.6 4.0 4.9 16.4
Total red meat & poultry 50.9 51.8 53.8 54.6 211.1 52.9 53.0 53.7 54.9 214.6 53.2 53.2 54.7 55.9 217.0 53.9 55.5 55.5 57.7 222.6 Eggs, number 65.7 62.9 61.9 65.7 256.3 67.5 67.4 68.8 71.0 274.7 68.5 68.2 68.4 69.1 274.2 68.8 68.8 69.6 71.3 278.6
Market prices Choice steers, 5-area Direct, $/cwt 162.43 158.11 144.22 127.71 148.12 134.81 127.68 113.26 107.69 120.86 122.96 132.76 112.46 117.88 121.52 122-126 117-125 110-120 112-122 116-123 Feeder steers, Ok City, $/cwt 210.31 219.65 208.11 173.59 202.92 155.83 146.49 140.66 128.30 142.82 129.56 147.75 148.12 154.88 145.08 146-150 144-152 136-146 134-144 141-148 Cutter Cows, National L.E., $/cwt 107.61 109.50 103.34 77.80 99.56 73.50 75.87 73.16 57.75 70.07 62.63 69.65 69.78 58.68 65.16 60-64 59-67 58-68 57-67 59-66 Choice slaughter lambs, San Angelo, $/cwt 147.17 140.09 146.23 142.52 144.00 133.33 136.15 137.52 131.88 134.72 138.91 153.46 141.29 131.22 141.22 130-134 131-139 133-143 130-140 132-139 Nat'l base cost, 51-52 % lean, live equivalent, $/cwt 48.47 53.20 54.59 44.66 50.23 44.63 53.71 49.26 37.02 46.16 49.73 51.70 55.59 44.89 50.48 49-51 49-53 47-51 40-44 47-49 Broilers, national composite, cents/lb 97.00 104.20 83.70 77.20 90.50 84.60 93.00 81.7 78.00 84.30 88.50 104.70 94.9 86.10 93.50 93-95 92-98 84-92 83-89 88-94 Turkeys, national, cents/lb 99.60 108.50 126.40 130.10 116.20 114.70 116.50 120.70 116.60 117.10 100.40 99.10 96.9 88.0 96.10 79-81 87-93 91-99 96-104 88-94 Eggs, New York, cents/doz. 146.90 170.30 235.70 174.10 181.80 121.50 67.90 71.60 81.70 85.70 80.00 74.70 102.1 147.0 100.9 133-137 101-107 106-114 115-125 114-121
U.S. trade, million lb, carcass wt. equivalent Beef & veal exports 523 607 542 595 2,267 535 621 661 738 2,556 651 683 746 782 2,862 710 740 785 790 3,025 Beef & veal imports 878 990 890 613 3,371 793 831 751 639 3,015 699 813 814 668 2,994 720 810 820 680 3,030 Lamb and mutton imports 53 56 46 59 214 68 55 41 52 216 80 58 57 57 252 82 57 56 59 254 Pork exports 1,224 1,339 1,173 1,274 5,010 1,229 1,318 1,235 1,457 5,239 1,432 1,426 1,230 1,544 5,632 1,475 1,425 1,350 1,650 5,900 Pork imports 279 266 270 300 1,116 293 257 266 275 1,091 264 281 283 287 1,116 260 240 250 250 1,000 Broiler exports 1,624 1,713 1,487 1,496 6,321 1,585 1,605 1,734 1,720 6,644 1,711 1,618 1,664 1,787 6,780 1,720 1,740 1,760 1,730 6,950 Turkey exports 148 123 125 132 529 116 141 160 153 569 133 148 167 173 621 145 150 170 180 645 Live swine imports (thousand head) 1,309 1,541 1,371 1,519 5,740 1,468 1,406 1,371 1,412 5,656 1,449 1,458 1,298 1,395 5,600 1,450 1,450 1,350 1,450 5,700Note: Forecasts are in bold.1/ Per capita meat and egg disappearance data are calculated using the Resident Population Plus Armed Forces Overseas series from the Census Bureau of the Department of Commerce.Source: World Agricultural Supply and Demand Estimates and Supporting Materials.For further information, contact: Mildred M. Haley, [email protected] 2/12/2018
25 Livestock, Dairy, and Poultry Outlook/LDP-M-284/February 14, 2018
Economic Research Service, USDA

Dairy Forecasts2016
Annual I II III IV Annual I II III IV Annual
Milk cows (thousands) 9,328 9,370 9,398 9,402 9,399 9,392 9,410 9,415 9,420 9,420 9,415Milk per cow (pounds) 22,775 5,717 5,886 5,688 5,646 22,937 5,765 5,960 5,755 5,750 23,230Milk production (billion pounds) 212.4 53.6 55.3 53.5 53.1 215.4 54.2 56.1 54.2 54.2 218.7Farm use 1.0 0.2 0.2 0.3 0.3 1.0 0.2 0.2 0.3 0.3 1.0Milk marketings 211.4 53.3 55.1 53.2 52.8 214.4 54.0 55.9 54.0 53.9 217.7
Milk-fat (billion pounds milk equiv.)Milk marketings 211.4 53.3 55.1 53.2 52.8 214.4 54.0 55.9 54.0 53.9 217.7Beginning commercial stocks 12.3 12.7 16.2 17.9 16.3 12.7 13.5 17.0 18.5 16.0 13.5Imports 7.0 1.5 1.4 1.5 1.6 6.0 1.5 1.4 1.5 1.6 6.0Total supply 230.8 67.6 72.7 72.6 70.7 233.2 69.0 74.3 73.9 71.5 237.3Commercial exports 8.4 2.1 2.5 2.3 2.4 9.3 2.2 2.5 2.4 2.3 9.5Ending commercial stocks 12.7 16.2 17.9 16.3 13.5 13.5 17.0 18.5 16.0 12.9 12.9Net removals 0.0 0.0 0.0 0.0 0.0 0.0 0.0 0.0 0.0 0.0 0.0Domestic commercial use 209.7 49.3 52.4 54.0 54.7 210.4 49.8 53.3 55.5 56.3 214.9
Skim solids (billion pounds milk equiv.)Milk marketings 211.4 53.3 55.1 53.2 52.8 214.4 54.0 55.9 54.0 53.9 217.7Beginning commercial stocks 9.2 9.5 10.6 11.6 12.1 9.5 11.9 12.1 12.5 11.7 11.9Imports 6.5 1.7 1.5 1.4 1.5 6.1 1.5 1.5 1.5 1.6 6.0Total supply 227.1 64.5 67.1 66.2 66.5 230.0 67.4 69.4 68.0 67.2 235.7Commercial exports 39.0 9.8 10.3 9.7 11.0 40.8 10.3 10.9 10.6 10.6 42.5Ending commercial stocks 9.5 10.6 11.6 12.1 11.9 11.9 12.1 12.5 11.7 11.6 11.6Net removals 0.0 0.0 0.0 0.0 0.0 0.0 0.0 0.0 0.0 0.0 0.0Domestic commercial use 178.5 44.2 45.2 44.4 43.5 177.3 45.0 46.0 45.6 44.9 181.6
Milk prices (dollars/cwt) 1 All milk 16.30 18.23 16.83 17.70 17.73 17.63 15.45 15.20 15.55 16.60 15.70
-15.75 -15.80 -16.45 -17.60 -16.40
Class III 14.87 16.49 15.74 16.13 16.34 16.17 13.55 13.90 14.50 14.85 14.20-13.85 -14.50 -15.40 -15.85 -14.90
Class IV 13.77 15.37 14.80 16.36 14.12 15.16 12.85 13.30 13.55 13.80 13.35-13.25 -14.00 -14.55 -14.90 -14.15
Product prices (dollars/pound) 2Cheddar cheese 1.605 1.648 1.555 1.623 1.712 1.634 1.480 1.500 1.555 1.590 1.530
-1.510 -1.560 -1.645 -1.690 -1.600
Dry whey 0.288 0.485 0.509 0.434 0.347 0.444 0.255 0.265 0.275 0.285 0.270-0.275 -0.295 -0.305 -0.315 -0.300
Butter 2.078 2.200 2.229 2.597 2.295 2.330 2.130 2.205 2.240 2.215 2.195-2.190 -2.295 -2.360 -2.345 -2.295
Nonfat dry milk 0.829 0.955 0.874 0.874 0.763 0.867 0.690 0.705 0.715 0.765 0.715-0.720 -0.755 -0.785 -0.835 -0.775
Totals may not add due to rounding.1 Simple averages of monthly prices. May not match reported annual averages.
For further information, contact Jerry Cessna, 202-694-5171, [email protected], or contact Jonathan Law, 202-694-5544, [email protected] in Livestock, Dairy, and Poultry Outlook, http://usda.mannlib.cornell.edu/MannUsda/viewDocumentInfo.do?documentID=1350.
20182017
2 Simple averages of monthly prices calculated by the Agricultural Marketing Service for use in class price formulas. Based on weekly U.S. Dept. of Agriculture, National Dairy Products Sales Report .
Sources: USDA, National Agricultural Statistics Service; USDA, Agricultural Marketing Service; USDA, Foreign Agricultural Service; and USDA, World Agricultural Outlook Board.
26 Livestock, Dairy, and Poultry Outlook/LDP-M-284/February 14, 2018
Economic Research Service, USDA