livestock, dairy, and poultry outlook - cornell...
TRANSCRIPT
Hogs and Pork: Second-half 2007 pork exports will likely be lower than a year ago. In 2008, lower pork prices from increased U.S. supplies and stronger economic growth in Mexico are expected to bring about resumed, moderate export growth. U.S. exports in 2008 are expected to be about 3.1 billion pounds, slightly more than 3 percent above exports this year. Lower second-half exports this year and larger supplies are expected to keep hog prices about even with second-half prices of 2006. Third-quarter 2007 prices for 51-52 percent live equivalent hogs are expected to range between $51 and $53 per hundredweight (cwt), close to third-quarter prices a year ago. Fourth-quarter prices are expected to range between $45 and $49 per cwt, a little higher than fourth-quarter 2006. Cattle and Beef: Cow slaughter continues at a heavy pace, due in part to dry pasture and range conditions in the Southeast, Southwest, and, increasingly, parts of the Corn Belt. Corn prices declined following the National Agricultural Statistics Service’s June 29, 2007 Acreage report that corn-planted acreage in 2007 is 19 percent higher than 2006 acreage. Dairy: High milk and dairy product prices and lower-than-expected feed prices should boost production enough this year to limit further price rises. Prices could ease slightly in 2008. The higher production forecast in 2007 comes from higher cow numbers, as yield growth appears below trend.
Livestock, Dairy, and Poultry Outlook Mildred M. Haley, coordinator 2007 Export Volume Expected Flat This Year, Moderate Growth To Resume in 2008
LDP-M-157 July 20, 2007
Contents Hogs and Pork Cattle and Beef Dairy Sheep and Lamb Poultry Aquaculture Contacts and Links Tables at a Glance Red Meat and Poultry Economic Indicators Dairy Web Sites Animal Production and Marketing Issues Cattle Dairy Hogs Poultry and Eggs WASDE
-------------- Tables will be released on July 24, 2007 The next newsletter release is August 20, 2007
-------------- Approved by the
World Agricultural Outlook Board.

2 Livestock, Dairy, & Poultry Outlook/LDP-M-157/July 20, 2007
Economic Research Service, USDA
Sheep and Lamb: Improved pasture conditions in the plains States should contribute to producers withholding animals for herd rebuilding. This will contribute to further declines in lamb and mutton production, as well as a drop in lamb and mutton exports and live sheep exports. Despite lower production and tight supplies, producer price response for 2007 has been negligible.
Poultry: With the strengthening in broiler prices, growers have gradually expanded production. Broiler meat production in the second quarter is expected to be down slightly from the previous year, but it is expected to be higher in the third and fourth quarters of 2007. Whole turkey prices continue to be considerably above year-earlier levels, as stocks of whole birds are lower.
Aquaculture: On June 28, the U.S. Food and Drug Administration (FDA) announced that it was initiating an import alert for certain species of farmed seafood from China. The alert was in response to numerous cases of contamination. The five species listed were eel, shrimp, catfish, basa (a species similar to catfish), and dace, which is similar to carp.

Hogs and Pork
3 Livestock, Dairy, & Poultry Outlook/LDP-M-157/July 20, 2007
Economic Research Service, USDA
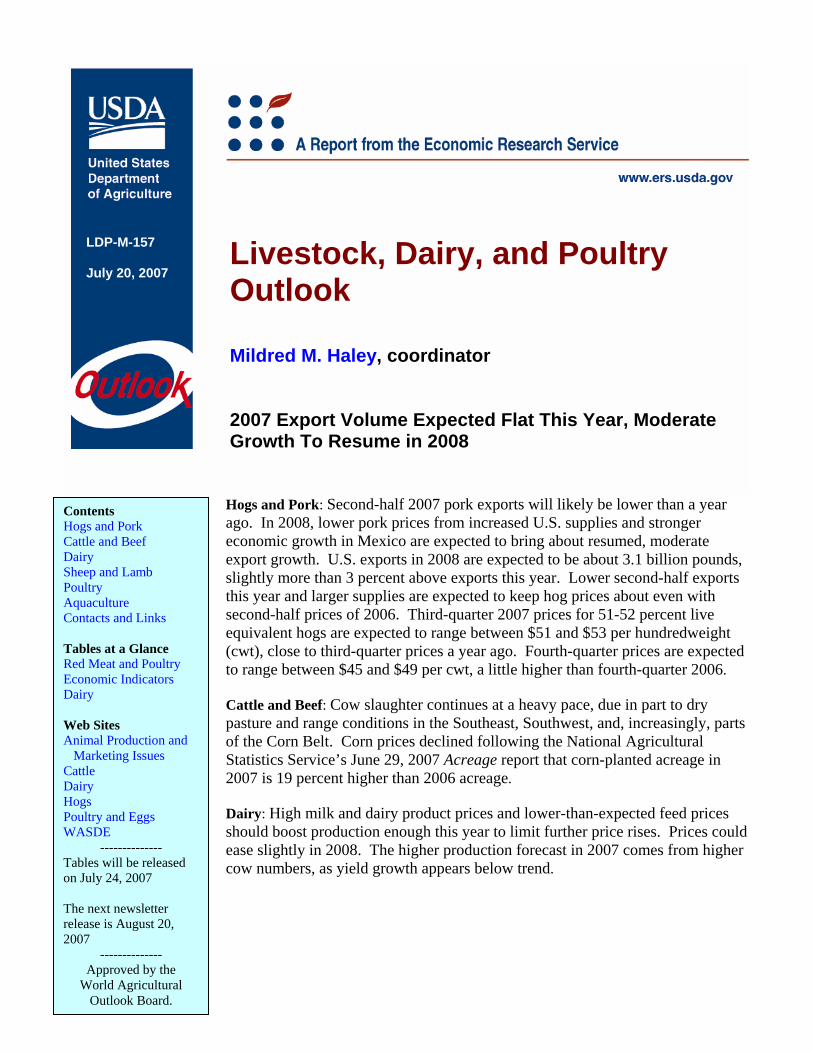
Quarterly Hogs and Pigs Indicates Continuation of Slow-Growth in Breeding Herd Swine breeders appeared to shrug off uncertainties surrounding feed costs and indications of softening pork demand, continuing to slowly add animals to the U.S. breeding inventory. The Quarterly Hogs and Pigs report issued on June 29, 2007 indicated that the June 1 inventory of animals kept for breeding had increased by 35,000 head since last March, and by almost 1 percent since June 1, 2006. The largest herd additions occurred in Minnesota and Missouri, where inventories for both had increased by 20,000 head since June 1, 2006. Minnesota’s breeding inventory increased by 3 percent, and Missouri’s by 6 percent, compared with June 2006. The quarterly report also showed continued increases in litter rates. The litter rate for the first quarter of 2007 was revised upward from 9.08 pigs per litter to 9.09, and the rate for the March-May pig crop came in at 9.15 pigs per litter, a record for the U.S. breeding herd. The December-May pig crop, together with assumptions of slightly higher year-over-year average dressed weights, points to second-half 2007 pork production of about 11.1 billion pounds, an increase of almost 3.9 percent over the same period last year. All together, reported June-November farrowing intentions at 1 percent above a year earlier—together with assumptions of slightly higher 2008 December-May farrowings, of continued growth of litter rates, and slightly higher year-over-year average dressed rates—imply an estimated 2008 pork production of almost 22 billion pounds, more than 1.5 percent greater than production this year.
June 1 inventory of all breeding animals, 1995-2007
5800
6000
6200
6400
6600
6800
7000
7200
1995 1996 1997 1998 1999 2000 2001 2002 2003 2004 2005 2006 2007
1000
hea
d
Source: USDA/NASS. http://www.nass.usda.gov/Data_and_Statistics/Quick_Stats/index.asp
4 Livestock, Dairy, & Poultry Outlook/LDP-M-157/July 20, 2007
Economic Research Service, USDA
March-May pigs per litter, 1995-2007
8.2
8.3
8.4
8.5
8.6
8.7
8.8
8.9
9
9.1
9.2
1995 1996 1997 1998 1999 2000 2001 2002 2003 2004 2005 2006 2007
pigs
-per
-litte
r
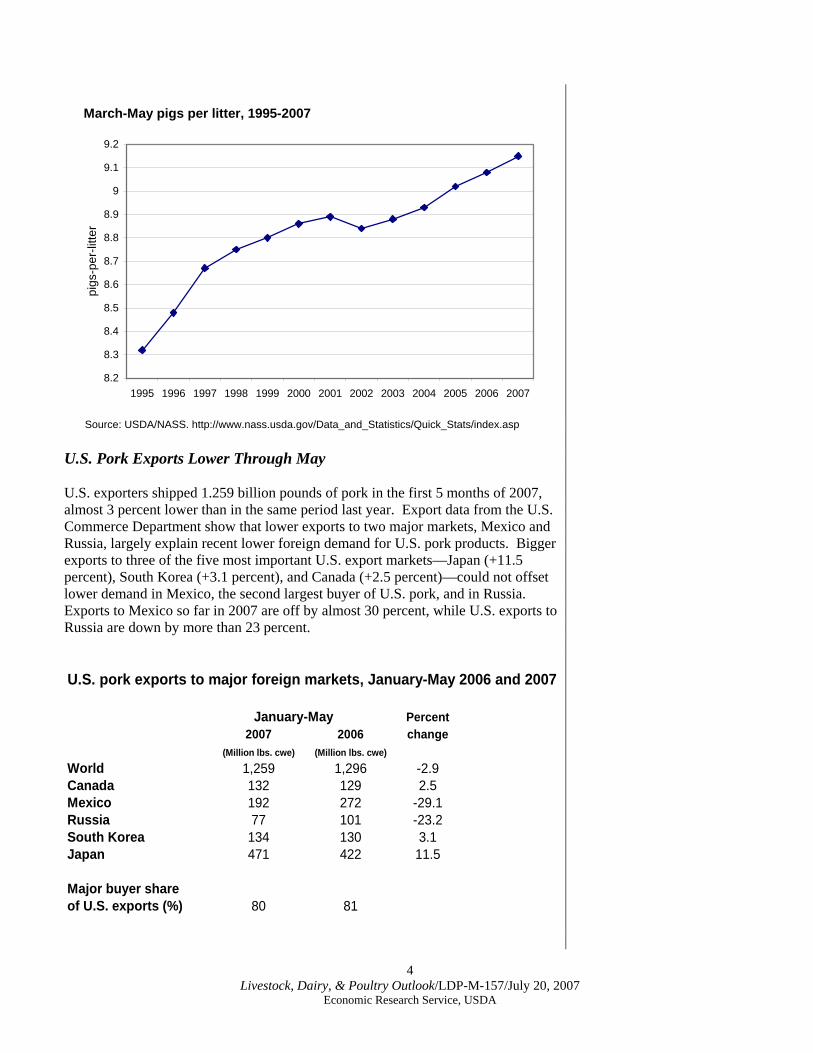
Source: USDA/NASS. http://www.nass.usda.gov/Data_and_Statistics/Quick_Stats/index.asp U.S. Pork Exports Lower Through May U.S. exporters shipped 1.259 billion pounds of pork in the first 5 months of 2007, almost 3 percent lower than in the same period last year. Export data from the U.S. Commerce Department show that lower exports to two major markets, Mexico and Russia, largely explain recent lower foreign demand for U.S. pork products. Bigger exports to three of the five most important U.S. export markets—Japan (+11.5 percent), South Korea (+3.1 percent), and Canada (+2.5 percent)—could not offset lower demand in Mexico, the second largest buyer of U.S. pork, and in Russia. Exports to Mexico so far in 2007 are off by almost 30 percent, while U.S. exports to Russia are down by more than 23 percent. U.S. pork exports to major foreign markets, January-May 2006 and 2007
January-May Percent2007 2006 change
(Million lbs. cwe) (Million lbs. cwe)
World 1,259 1,296 -2.9Canada 132 129 2.5Mexico 192 272 -29.1Russia 77 101 -23.2South Korea 134 130 3.1Japan 471 422 11.5
Major buyer share of U.S. exports (%) 80 81
5 Livestock, Dairy, & Poultry Outlook/LDP-M-157/July 20, 2007
Economic Research Service, USDA
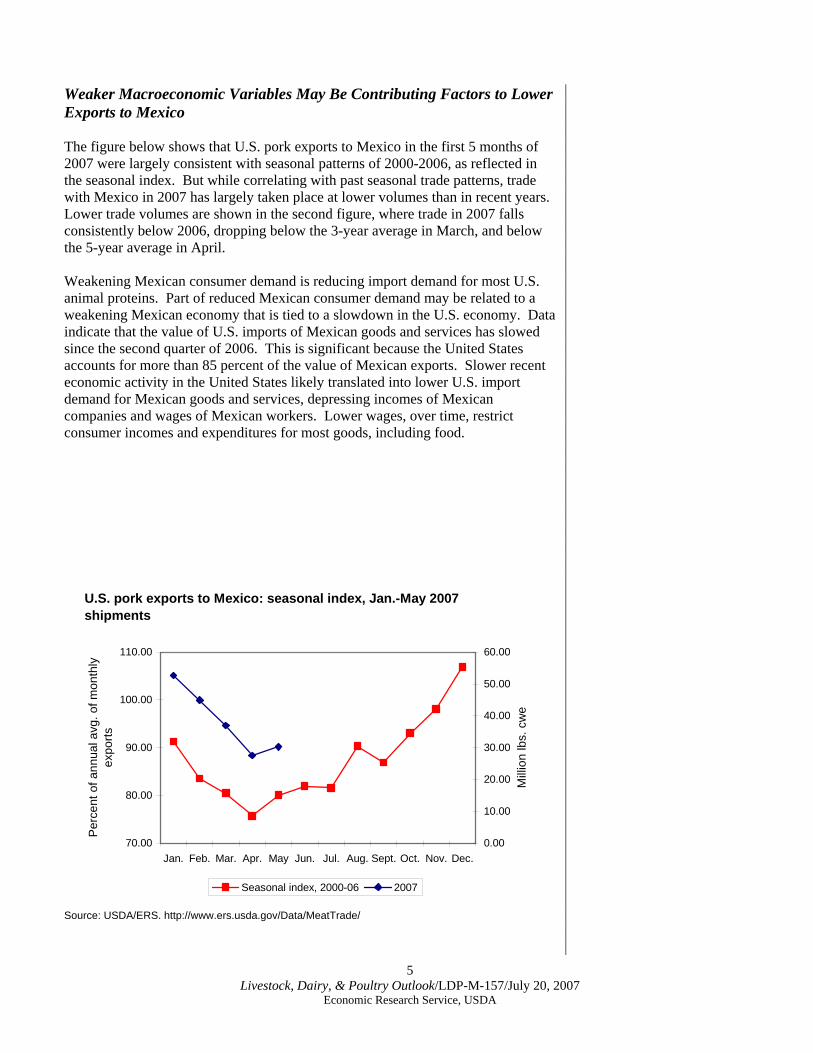
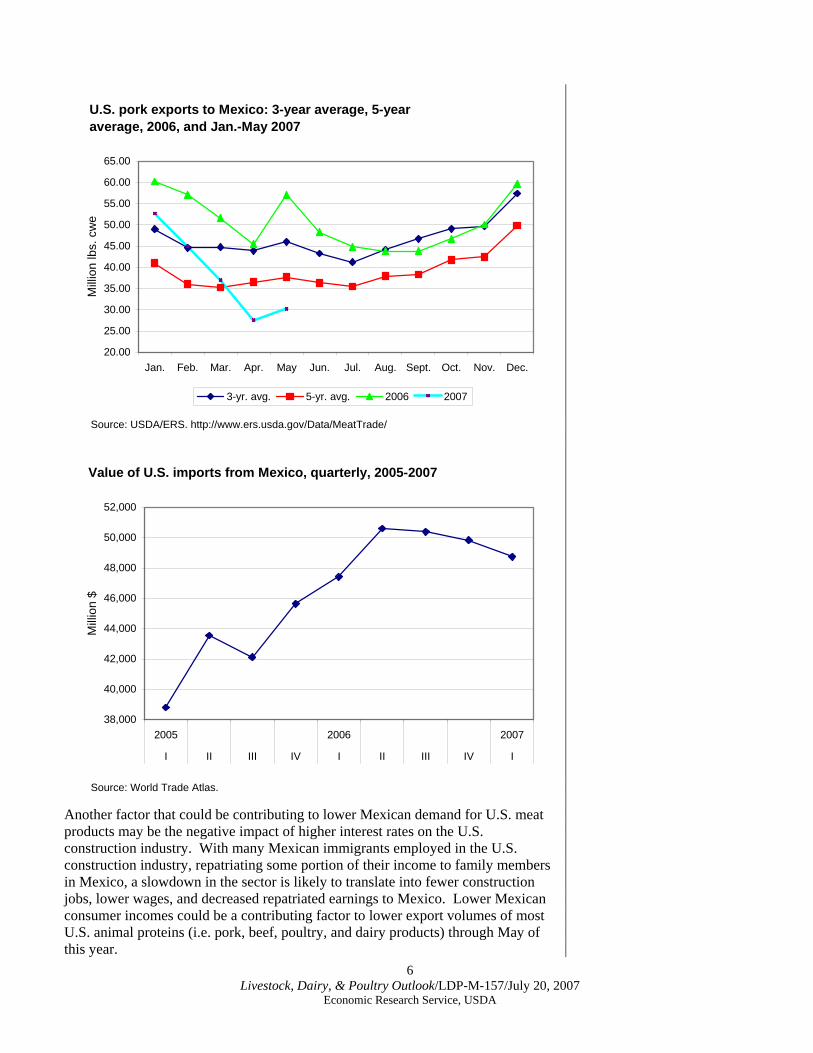
Weaker Macroeconomic Variables May Be Contributing Factors to Lower Exports to Mexico The figure below shows that U.S. pork exports to Mexico in the first 5 months of 2007 were largely consistent with seasonal patterns of 2000-2006, as reflected in the seasonal index. But while correlating with past seasonal trade patterns, trade with Mexico in 2007 has largely taken place at lower volumes than in recent years. Lower trade volumes are shown in the second figure, where trade in 2007 falls consistently below 2006, dropping below the 3-year average in March, and below the 5-year average in April. Weakening Mexican consumer demand is reducing import demand for most U.S. animal proteins. Part of reduced Mexican consumer demand may be related to a weakening Mexican economy that is tied to a slowdown in the U.S. economy. Data indicate that the value of U.S. imports of Mexican goods and services has slowed since the second quarter of 2006. This is significant because the United States accounts for more than 85 percent of the value of Mexican exports. Slower recent economic activity in the United States likely translated into lower U.S. import demand for Mexican goods and services, depressing incomes of Mexican companies and wages of Mexican workers. Lower wages, over time, restrict consumer incomes and expenditures for most goods, including food.
U.S. pork exports to Mexico: seasonal index, Jan.-May 2007 shipments
70.00
80.00
90.00
100.00
110.00
Jan. Feb. Mar. Apr. May Jun. Jul. Aug. Sept. Oct. Nov. Dec.
Per
cent
of a
nnua
l avg
. of m
onth
ly
expo
rts
0.00
10.00
20.00
30.00
40.00
50.00
60.00
Mill
ion
lbs.
cw
e
Seasonal index, 2000-06 2007
Source: USDA/ERS. http://www.ers.usda.gov/Data/MeatTrade/
6 Livestock, Dairy, & Poultry Outlook/LDP-M-157/July 20, 2007
Economic Research Service, USDA
U.S. pork exports to Mexico: 3-year average, 5-year average, 2006, and Jan.-May 2007
20.00
25.00
30.00
35.00
40.00
45.00
50.00
55.00
60.00
65.00
Jan. Feb. Mar. Apr. May Jun. Jul. Aug. Sept. Oct. Nov. Dec.
Mill
ion
lbs.
cw
e
3-yr. avg. 5-yr. avg. 2006 2007
Source: USDA/ERS. http://www.ers.usda.gov/Data/MeatTrade/
Value of U.S. imports from Mexico, quarterly, 2005-2007
38,000
40,000
42,000
44,000
46,000
48,000
50,000
52,000
2005 2006 2007
I II III IV I II III IV I
Mill
ion
$
Source: World Trade Atlas. Another factor that could be contributing to lower Mexican demand for U.S. meat products may be the negative impact of higher interest rates on the U.S. construction industry. With many Mexican immigrants employed in the U.S. construction industry, repatriating some portion of their income to family members in Mexico, a slowdown in the sector is likely to translate into fewer construction jobs, lower wages, and decreased repatriated earnings to Mexico. Lower Mexican consumer incomes could be a contributing factor to lower export volumes of most U.S. animal proteins (i.e. pork, beef, poultry, and dairy products) through May of this year.
7 Livestock, Dairy, & Poultry Outlook/LDP-M-157/July 20, 2007
Economic Research Service, USDA
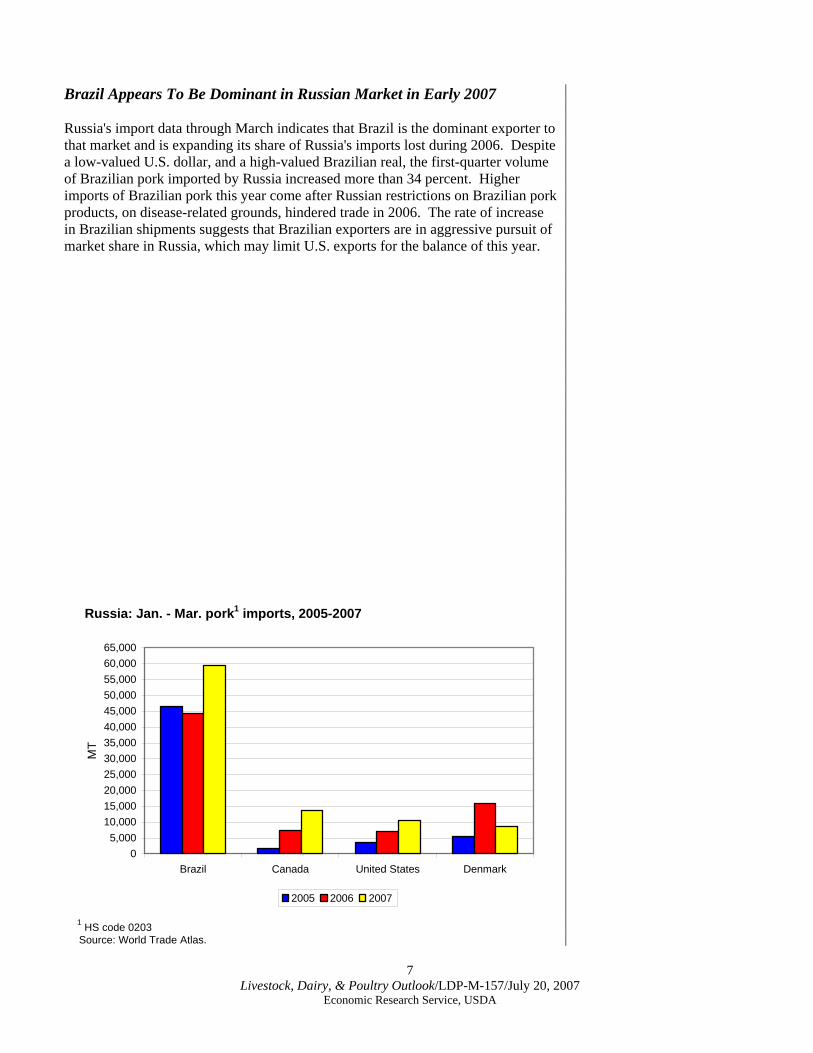
Brazil Appears To Be Dominant in Russian Market in Early 2007 Russia's import data through March indicates that Brazil is the dominant exporter to that market and is expanding its share of Russia's imports lost during 2006. Despite a low-valued U.S. dollar, and a high-valued Brazilian real, the first-quarter volume of Brazilian pork imported by Russia increased more than 34 percent. Higher imports of Brazilian pork this year come after Russian restrictions on Brazilian pork products, on disease-related grounds, hindered trade in 2006. The rate of increase in Brazilian shipments suggests that Brazilian exporters are in aggressive pursuit of market share in Russia, which may limit U.S. exports for the balance of this year.
Russia: Jan. - Mar. pork1 imports, 2005-2007
05,000
10,00015,00020,00025,00030,00035,00040,00045,00050,00055,00060,00065,000
Brazil Canada United States Denmark
MT
2005 2006 2007
1 HS code 0203 Source: World Trade Atlas.
8 Livestock, Dairy, & Poultry Outlook/LDP-M-157/July 20, 2007
Economic Research Service, USDA
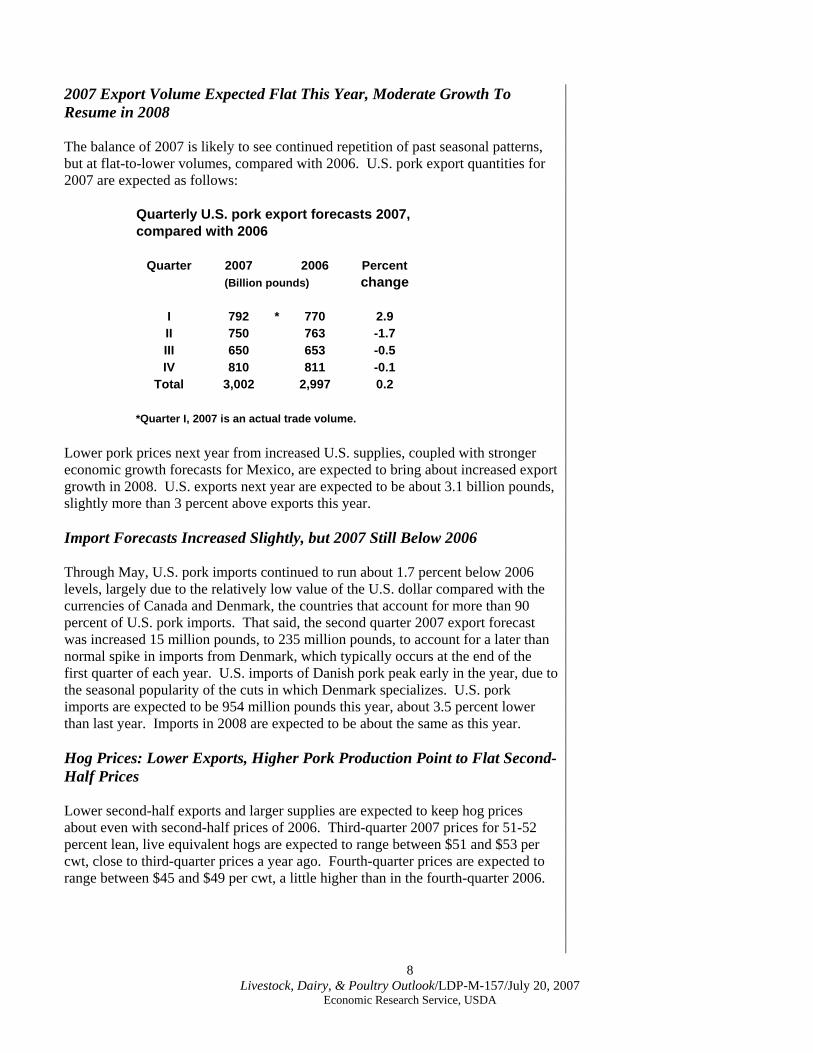
2007 Export Volume Expected Flat This Year, Moderate Growth To Resume in 2008 The balance of 2007 is likely to see continued repetition of past seasonal patterns, but at flat-to-lower volumes, compared with 2006. U.S. pork export quantities for 2007 are expected as follows:
Quarterly U.S. pork export forecasts 2007,compared with 2006
Quarter 2007 2006 Percent (Billion pounds) change
I 792 * 770 2.9II 750 763 -1.7III 650 653 -0.5IV 810 811 -0.1
Total 3,002 2,997 0.2
*Quarter I, 2007 is an actual trade volume. Lower pork prices next year from increased U.S. supplies, coupled with stronger economic growth forecasts for Mexico, are expected to bring about increased export growth in 2008. U.S. exports next year are expected to be about 3.1 billion pounds, slightly more than 3 percent above exports this year. Import Forecasts Increased Slightly, but 2007 Still Below 2006 Through May, U.S. pork imports continued to run about 1.7 percent below 2006 levels, largely due to the relatively low value of the U.S. dollar compared with the currencies of Canada and Denmark, the countries that account for more than 90 percent of U.S. pork imports. That said, the second quarter 2007 export forecast was increased 15 million pounds, to 235 million pounds, to account for a later than normal spike in imports from Denmark, which typically occurs at the end of the first quarter of each year. U.S. imports of Danish pork peak early in the year, due to the seasonal popularity of the cuts in which Denmark specializes. U.S. pork imports are expected to be 954 million pounds this year, about 3.5 percent lower than last year. Imports in 2008 are expected to be about the same as this year. Hog Prices: Lower Exports, Higher Pork Production Point to Flat Second-Half Prices Lower second-half exports and larger supplies are expected to keep hog prices about even with second-half prices of 2006. Third-quarter 2007 prices for 51-52 percent lean, live equivalent hogs are expected to range between $51 and $53 per cwt, close to third-quarter prices a year ago. Fourth-quarter prices are expected to range between $45 and $49 per cwt, a little higher than in the fourth-quarter 2006.
9 Livestock, Dairy, & Poultry Outlook/LDP-M-157/July 20, 2007
Economic Research Service, USDA
Retail Pork Prices Moving Up Second-quarter retail pork prices averaged $2.87 per pound, almost 3 percent above the same period last year. Increased retail pork prices likely reflect the higher cost of marketing meat products, with much of the cost increases probably accounted for by higher energy prices. The total pork price spread increased almost 1 percent from the same period a year ago, with most of that increase attributable to a wider wholesale-to-retail component of the supply chain. It appears that retailers, in turn, were able to pass along some of their cost increases to retail consumers.
Cattle and Beef
10 Livestock, Dairy, & Poultry Outlook/LDP-M-157/July 20, 2007
Economic Research Service, USDA
Crop, Cattle, and Beef Price Volatility Expected This Summer National Agricultural Statistics Service’s (NASS) June 29, 2007 Acreage report indicated corn-planted area of 92.9 million acres, 19 percent higher than 2006 and 14 percent above 2005 acreage. Soybean and cotton acreages are 15 and 28 percent below 2006 acreages. Despite reduced hay stocks at the end of the winter of 2006-07, hay acreage is up by less than 2 percent from 2006. Wheat acreage is up by 6 percent over 2006 acreage, but does not reflect intentions for winter wheat to be planted in the fall of 2007. In light of the increased acreage and a larger carry-in, USDA reduced its forecast corn price by 30 cents per bushel to $2.80 to $3.40 for the 2007/08 crop year, but declining crop conditions in the Eastern Cornbelt and Southeast and flooding in the southeastern Great Plains are setting the stage for corn price volatility throughout this summer. Wheat and soybean prices have been raised. Flooding has occurred in areas of the Southern Plains, accompanied by deteriorating pasture and range conditions in many parts of the United States, especially in the Southeast and Southwest. As a result, cow slaughter continues well ahead of 2006 and 2005 levels. Second-quarter commercial cow slaughter is estimated to be about 10 percent above second-quarter 2006 and 22 percent above second-quarter. This rate of cow slaughter is likely pressuring cow inventories and could set the stage for slower cattle inventory expansion over the next couple of years. Despite the high levels of cow slaughter, Sioux Falls boner cow prices for June 2007 averaged 13 percent above June 2006 prices. Support for feeder cattle prices provided by modest feeder cattle supplies continues to partially offset the negative effects of relatively high feed prices and declining fed cattle and beef prices. Oklahoma City 750-800-pound feeder cattle prices for June 2007 averaged 1 percent below June 2006 prices. For June 2007, Nebraska 1,100-1,300-pound fed cattle prices per cwt averaged 7 percent above 2006 prices. This higher relative price is consistent with the lower cattle slaughter, lower average slaughter weights, and lower beef production observed recently on a weekly basis (week of July 6, 2007 versus July 7, 2006). However, the largest June inventory since the 1,000-plus-head feedlot series began in 1996 should have implied higher production and lower prices. The heifer share of total federally inspected (FI) slaughter through May 2007 has been below both 2006 and the 5-year average for all but February 2007. A low heifer share of FI slaughter could indicate heifer retention. However, the May 2007 heifer share of total FI slaughter was almost even with the May 2006 level and could be an indication that heifer retention has been declining. Declining heifer retention and relatively high levels of commercial cow slaughter provide the potential for a declining cattle breeding herd. The July 1, 2007 Cattle inventory report from NASS will provide additional information on cattle inventory dynamics.
11 Livestock, Dairy, & Poultry Outlook/LDP-M-157/July 20, 2007
Economic Research Service, USDA
Beef prices have been on a roller coaster recently. Wholesale Choice beef cutout values for the 4 weeks ending June 30, 2007 declined by 2 percent from June 2006 values, while Select values declined by 6 percent. These relative declines, along with a relatively low share—by historical standards—of Choice and higher beef, suggest relatively low supplies of Choice beef. With few exceptions, this situation has existed in the beef industry since before 2003. This has resulted in a June 2007 average price per cwt for 50-percent lean trimmings 62 percent above the 2006 price. The June 2007 average price per cwt of 90-percent lean trim, which gives value to and is mixed with 50-percent lean to make ground beef, was 10 percent above the 2006 price. While live cattle prices and wholesale values have declined recently, the average retail Choice beef price for June 2007, at $4.22, was 1 percent above June 2006 prices. The spread between wholesale cutout values and retail beef prices, $1.97 per pound, narrowed from the May spread of $2.23 per pound. Increasing U.S. beef exports to Japan and Korea continue to provide positive pressure on beef prices and the cattle/beef complex as these two countries slowly increase beef imports.
Dairy
12 Livestock, Dairy, & Poultry Outlook/LDP-M-157/July 20, 2007
Economic Research Service, USDA
Increased Milk Production on the Horizon Could Moderate Prices Slightly in 2008 USDA projects 2007 milk production at 184.3 billion pounds, virtually unchanged from June’s estimate. Sharply higher milk prices in the current quarter and continued high prices for the balance of the year, combined with more favorable feed prices, will likely lead to higher cow numbers. Yield per cow, however, is expected to rise by only 1.4 percent year-over-year. This rise is below that of recent years. Near-record plantings and good growing conditions have moderated grain price forecasts from early 2007 expectations. However, a key to increased production is lower expected alfalfa hay prices and favorable weather. Growing conditions for hay and alfalfa are improved over last year’s drought conditions in most of the country. Milk production in 2008 is forecast at 188.4 billion pounds, up 2.2 percent from the 2007 expected total and indicating a return to growth that is closer to trend. Tight world supplies of dairy products, along with a weak dollar, has buoyed dairy exports, especially for nonfat dry milk (NDM). Australia is not expected to increase supplies to world markets until 2008 at the earliest, and low availabilities of products from the European Union combine to keep global supplies tight. Domestic demand for dairy products, especially cheese, will keep product prices high throughout the balance of 2007. Prices could moderate slightly in 2008. The average cheese price is expected to be $1.675 to $1.705 a pound in 2007 and to dip to $1.550 to $1.650 a pound in 2008. Butter prices are projected to average $1.370 to $1.430 a pound in 2007 and to drop slightly in 2008, averaging $1.335 to $1.465 a pound. NDM prices are projected at $1.665 to $1.695 a pound in 2007 and to decline slightly to $1.590 to $1.660 a pound next year. Whey price projections remain unchanged from June’s forecast of 68.5 to 70.5 cents a pound this year and 65.0 to 68.0 cents a pound next year. Given diary product price forecasts, milk prices will likely continue at current high levels. The annual Class IV average is expected to be $18.15 to $18.55 per cwt in 2007. The Class III price is forecast to average $18.00 to $18.30 per cwt for the year. The reported all milk price is expected to be sharply higher in 2007 compared with 2006 and will likely average $19.00 to $19.30 per cwt for the year. Milk prices will likely moderate in 2008. The Class IV price is forecast to average $17.45 to $18.55 per cwt, and the Class III price to average $16.55 to $17.55 per cwt. The all milk price is forecast to average $18.20 to $19.20 per cwt for 2008, a slight decline.
Sheep and Lamb
13 Livestock, Dairy, & Poultry Outlook/LDP-M-157/July 20, 2007
Economic Research Service, USDA
Improved Weather Conditions Could Spur Lamb Retention Improved pasture conditions in the plains States should contribute to producers withholding animals for herd rebuilding. This will contribute to further declines in lamb and mutton production, as well as a drop in lamb and mutton exports and live sheep exports. Second-quarter 2007 lamb and mutton production is expected to be down about 6 percent from the same period last year, while third-quarter production is expected to be unchanged. At the same time, lamb and mutton exports are expected to be down about 60 percent from the same period last year, while live exports are expected to be down about 2 percent. Despite lower production and tight supplies, producer price response has been negligible. The second-quarter 2007 Choice slaughter lamb prices at the San Angelo, Texas market averaged $82.23 per cwt and has not changed significantly since first-quarter 2007, though it was $15.67 per cwt above the same period a year earlier. Prices are expected to increase only slightly from the first-half during the third quarter due to the expected seasonal slowdown in both supply and demand. Third-quarter prices are expected to be between $83 and $85 per cwt. Imports of lamb and mutton continue to offset production declines and remain strong, despite relatively strong Australian and New Zealand currencies relative to the U.S. dollar. A weaker U.S. dollar generally causes imports to be more costly. This suggests that the increase in U.S. imports may be fueled by factors other than price. For the first 5 months of 2007, imports totaled about 86 million pounds, 7 percent above the same period last year, with 75 percent coming from Australia and 25 percent from New Zealand. Imports from New Zealand increased 9 percent, while imports from Australia increased 6 percent. Second-quarter 2007 imports are expected to be up 14 percent from the same period last year. Lamb and mutton exports for the first 5 months of 2007 have dropped considerably, down 40 percent from the same period last year. This is largely due to the drop in exports to Mexico and the major Caribbean markets. Mexico took in 42 percent less lamb and mutton in the first 5 months of 2007 than during the same period a year ago, while Bermuda and Bahamas, two large consumers of U.S. lamb exports, took in 59 percent and 53 percent less, respectively. Interestingly, exports to Canada were up 50 percent during the first 5 months of 2007. High energy cost in most of the Caribbean countries may be resulting in consumers reapportioning their consumption basket and opting for less lamb meat. Second-quarter 2007 exports are expected to decline 60 percent from the same period last year. Live sheep exports in the first 5 months have also dropped 2 percent from the same period in 2006. Mexico, which took in 80 percent of the U.S. live sheep exports in 2006, has seen a 23-percent drop in the first 5 months from the same period last year. Favorable weather conditions in the plains States will likely increase retention and reduce culling, resulting in fewer animals available for the live sheep trade in the remainder of 2007.
Poultry
14 Livestock, Dairy, & Poultry Outlook/LDP-M-157/July 20, 2007
Economic Research Service, USDA
Broiler Meat Production Estimates for Third and Fourth Quarters Decreased U.S. broiler meat production over the first 5 months of 2007 was 14.6 billion pounds, down 2.4 percent from the same period in 2006. Recently the number of chicks being placed for growout has been well above a year earlier, and the number of birds in the broiler breeder flock in May was up 1.7 percent from the previous year. With these trends in place, the production estimate for the second half of 2007 is 18.1 billion pounds, a 2.3-percent increase from the second half of 2006. The production estimate for 2008 was increased by 100 million pounds to 36.5 billion pounds, 2.3 percent higher than in 2007. Over the last 5 weeks (June 16 to July 14), the average weekly number of chicks being placed for growout was 175 million, up 3 percent from the same period in 2006. Chicks being placed for growout during this period would likely be going to slaughter between the second half of July and the middle of August. Broiler meat production in May totaled 3.2 billion pounds, down 1.3 percent from a year earlier. The decrease in meat production was largely due to smaller meat yields per bird (down 0.9 percent), as the number of birds slaughtered in May was 784 million (down 0.4 percent) and the average live weight per bird was up 0.7 percent from a year earlier to 5.52 pounds. Preliminary data point toward a small decrease in total broiler meat production in June, mostly due to 1 less slaughter day in June 2007 compared with June 2006. The decline in the number of birds slaughtered is expected to be partially offset by a small increase in average bird weights at slaughter. With growth in broiler production expected to increase in the second half of 2007, prices for most broiler products are projected to level off or decline slightly compared with the strong first-half prices. Prices for whole birds averaged 78 cents per pound during first-half 2007, 26 percent higher than in the same period in 2006. Prices for broiler parts have also been much stronger in the first half of 2007. Boneless, skinless breast meat prices in the Northeast market averaged $1.52 per pound in first-half 2007, up 43 percent from the same period in 2006, and over the same period leg quarter prices were up 79 percent. Similar large increases in prices also occurred for wing and thigh products. Even with a forecast increase in broiler meat production in the second half of 2007, broiler meat stocks are expected to remain below those of 2006 for the remainder of 2007. Ending stock levels for the second, third, and fourth quarters were all reduced by 25 million pounds from earlier estimates, due to strong export demand and the relatively high prices for beef and pork products.
15 Livestock, Dairy, & Poultry Outlook/LDP-M-157/July 20, 2007
Economic Research Service, USDA
Turkey Production Rises in May Domestic turkey production totaled 510 million pounds in May, up 2.9 percent from the previous year. The number of turkeys slaughtered was up 3.4 percent and the average weight at slaughter was 28.5 pounds, down less than 1 percent from the previous year. With the increase in May, turkey meat production for the first 5 months has increased 4.2 percent compared with the same period in 2006. The increase in meat production is basically a product of higher numbers of birds slaughtered, as the average weight at slaughter over the first 5 months of 2007 has been slightly lower. Turkey meat production in the second half of 2007 is estimated at 2.94 billion pounds, up 1.7 percent from second-half 2006. The most recent turkey hatchery report showed that the net placement of poults for growout in June was 2 percent higher than the previous year. Over the first 6 months of 2007, the total net placement of poults for growout was 157 million, up 5.1 percent from the same period in 2006. Even with relatively strong increases in turkey meat production, steady export demand and higher prices in the first half of 2007 for broiler and other meat products has meant that whole turkey prices are considerably higher than year-earlier levels. Prices for whole hen turkeys in the Eastern market averaged 77.8 cents per pound in the second quarter, up 9 percent from the previous year. Whole turkey prices are expected to remain well above those of a year earlier through the third quarter, but are expected be about even with the year-earlier prices in the fourth quarter. Prices for other turkey products have not increased as much as whole birds, but are generally higher than a year earlier. The export market for turkey products in the first half of 2007 has benefited from higher broiler prices. At the end of May, cold storage holdings of turkey products totaled 400 million pounds, down 14 percent from the previous year. Cold storage holdings for whole turkeys totaled 213 million pounds, down 2 percent from the same period in 2006. For turkey parts, cold storage holdings totaled 186 million pounds, down 25 percent from the same period in 2006. Cold storage holdings are expected to remain tight throughout the remainder of the year, and the estimates for ending stocks for the remaining three quarters have been reduced. The expected quarterly ending-stock levels for 2008 were also lowered. Egg Production Continues Down in May U.S. table egg production totaled 537 million dozen in May, down 1.1 percent from the same period the previous year. Over the first 5 months of 2007, egg production has been down every month when compared with the previous year. The lower production in May was the result of a smaller number of birds in the non-hatching laying flock. During May the number of birds in the table egg laying flock averaged 281 million, down 1.9 percent from May 2006. It is expected that the number of birds in the table egg laying flock will remain below that of a year earlier over at least the next quarter, as the number of birds in the layer breeding flock has also been lower than the previous year for the last 4 months.
16 Livestock, Dairy, & Poultry Outlook/LDP-M-157/July 20, 2007
Economic Research Service, USDA
The smaller production of table eggs has translated into much higher egg prices at the wholesale level. Over the last 8 months (November 2006 to June 2007), wholesale egg prices have averaged $0.98 per dozen, after averaging $0.66 per dozen over the first three quarters of 2006. In the second quarter of 2007, the wholesale price in the New York market averaged $0.92 per dozen, up 47 percent from second-quarter 2006. The expected average price for eggs was increased to $0.90 per dozen in the third quarter, but the fourth-quarter estimate of $0.94 per dozen was left unchanged. In addition to the lower production levels, egg prices have also benefited from a strong export market. Over the first 5 months of 2007, egg exports have totaled 91.4 million dozen, a 25-percent increase from the same period in 2006. Egg exports have been higher to a number of countries, but the majority of the increase has been due to larger shipments to Mexico (up 15 percent), China (up 224 percent), and a number of EU countries (shipments to the Netherlands, the United Kingdom, and Germany were all up over 74 percent).
Aquaculture
17 Livestock, Dairy, & Poultry Outlook/LDP-M-157/July 20, 2007
Economic Research Service, USDA
FDA Tightens Controls on Imports of Five Farm-raised Fish Species from China On June 28, the U.S. Food and Drug Administration (FDA) announced that it was initiating broader import controls for five species of farm-raised seafood from China. The action was in response to numerous cases of contamination. The five species listed were eel, shrimp, catfish, basa (a species similar to catfish), and dace, which is similar to carp. China is by far the world’s largest aquaculture producer and large portions of its aquaculture products are exported to the United States. Of the 5 species listed, shipments of shrimp are the largest in terms of quantity and value. In 2006, China was the second-largest shrimp supplier to the United States in terms of quantity (150 million pounds) and fourth in terms of value ($331 million). However, not all of China’s shrimp exports to the United States are farm-raised and the available trade data does not differentiate between farm-raised and wild-harvest products. For a more extensive review of 2006 U.S. shrimp imports see: www.ers.usda.gov/publications/ldp/2007/04Apr/LDPM154.pdf U.S. imports of catfish and related species from China totaled approximately 16.8 million pounds in 2006 and had a value of $29.5 million. In terms of quantity, this was about 22 percent of all catfish products imported into the United States in 2006. In contrast, total sales by U.S. catfish producers of domestic product were 284 million pounds in 2006. China is the major supplier of eels to the United States (82 percent of the total), with shipments totaling 3.1 million pounds and valued at $12.5 million in 2006.
Contacts and Links
18 Livestock, Dairy, & Poultry Outlook/LDP-M-157/July 20, 2007
Economic Research Service, USDA
Data Products Meat Price Spreads, http://www.ers.usda.gov/Data/MeatPriceSpreads/, provides monthly average price values, and the differences among those values, at the farm, wholesale, and retail stages of the production and marketing chain for selected cuts of beef, pork, and broilers. In addition, retail prices are provided for beef and pork cuts, turkey, whole chickens, eggs, and dairy products. Livestock and Meat Trade Data, http://www.ers.usda.gov/Data/MeatTrade/, contains monthly and annual data for the past 1-2 years for imports and exports of live cattle and hogs, beef and veal, lamb and mutton, pork, broiler meat, turkey meat, and shell eggs. The tables report physical quantities, not dollar values or unit prices. Breakdowns by major trading countries are included. Related Websites Animal Production and Marketing Issues, http://www.ers.usda.gov/briefing/AnimalProducts/ Cattle, http://www.ers.usda.gov/briefing/cattle/ Dairy, http://www.ers.usda.gov/briefing/dairy/ Hogs, http://www.ers.usda.gov/briefing/hogs/ Poultry and Eggs, http://www.ers.usda.gov/briefing/poultry/ WASDE, http://usda.mannlib.cornell.edu/MannUsda/viewDocumentInfo.do?documentID=1194
Contact Information Mildred M. Haley (coordinator) (202) 694-5176 [email protected] David J. Harvey (poultry) (202) 694-5177 [email protected] Ken Mathews (cattle) (202) 694-5183 [email protected] Monte Vandeveer (beef trade) (202) 694-5158 [email protected] Keithly Jones (sheep and goats) (202) 694-5172 [email protected] Mildred M. Haley (hogs/pork) (202) 694-5176 [email protected] Roger Hoskin (dairy) (202) 694-5148 [email protected] David Johnson (web publishing) (202) 694-5222 [email protected] Christopher Davis (poultry trade) (202) 694-5167 [email protected] Fawzi Taha (eggs) (202) 694-5178 [email protected] Subscription Information Subscribe to ERS e-mail notification service at http://www.ers.usda.gov/updates/ to receive timely notification of newsletter availability. Printed copies can be purchased from the USDA Order Desk by calling 1-800-999-6779 (specify the issue number or series SUB-LDPM-4042
The U.S. Department of Agriculture (USDA) prohibits discrimination in all its programs and activities on the basis of race, color, national origin, age, disability, and, where applicable, sex, marital status, familial status, parental status, religion, sexual orientation, genetic information, political beliefs, reprisal, or because all or a part of an individual's income is derived from any public assistance program. (Not all prohibited bases apply to all programs.) Persons with disabilities who require alternative means for communication of program information (Braille, large print, audiotape, etc.) should contact USDA's TARGET Center at (202) 720-2600 (voice and TDD). To file a complaint of discrimination write to USDA, Director, Office of Civil Rights, 1400 Independence Avenue, S.W., Washington, D.C. 20250-9410 or call (800) 795-3272 (voice) or (202) 720-6382 (TDD). USDA is an equal opportunity provider and employer.
E-mail Notification Readers of ERS outlook reports have two ways they can receive an e-mail notice about release of reports and associated data. • Receive timely notification (soon after the report is posted on the web) via USDA’s Economics, Statistics and Market Information System (which is housed at Cornell University’s Mann Library). Go to http://usda.mannlib.cornell.edu/ MannUsda/aboutEmailService.do and follow the instructions to receive e-mail notices about ERS, Agricultural Marketing Service, National Agricultural Statistics Service, and World Agricultural Outlook Board products. • Receive weekly notification (on Friday afternoon) via the ERS website. Go to http://www.ers.usda.gov/Updates/ and follow the instructions to receive notices about ERS outlook reports, Amber Waves magazine, and other reports and data products on specific topics. ERS also offers RSS (really simple syndication) feeds for all ERS products. Go to http://www.ers.usda.gov/rss/ to get started.
19 Livestock, Dairy, & Poultry Outlook/LDP-M-157/July 20, 2007
Economic Research Service, USDA
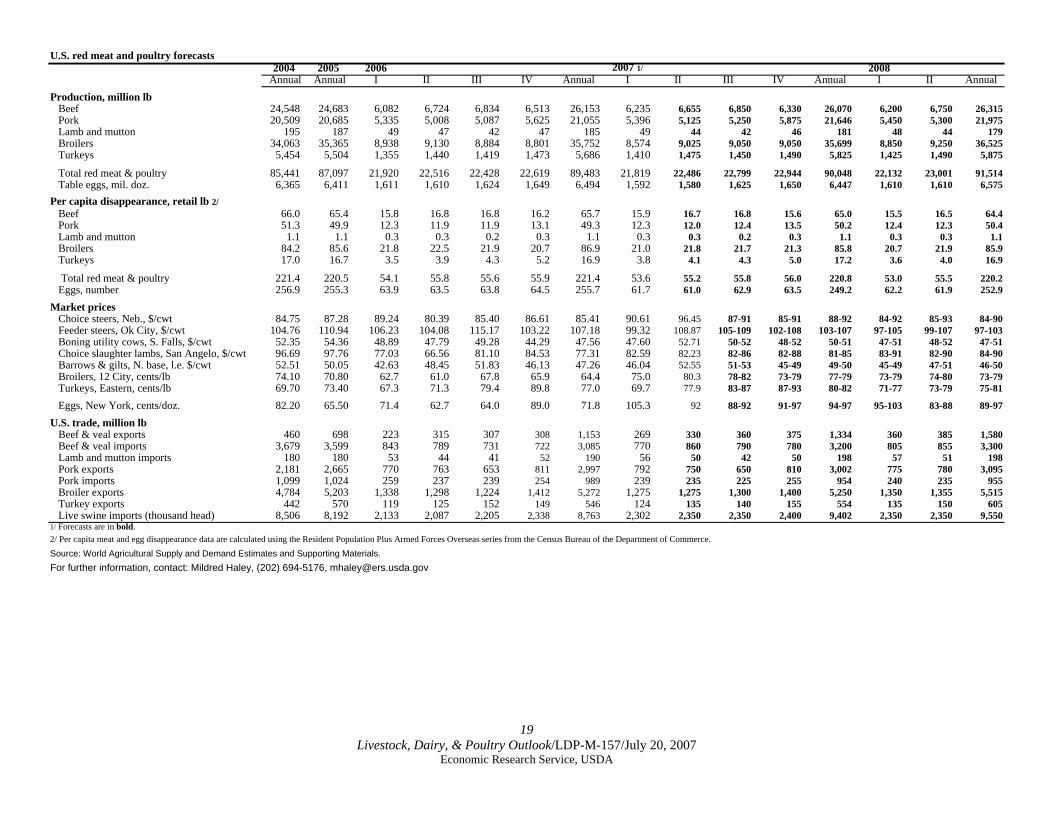
U.S. red meat and poultry forecasts2004 2005 2006 2007 1/ 2008
Annual Annual I II III IV Annual I II III IV Annual I II AnnualProduction, million lb Beef 24,548 24,683 6,082 6,724 6,834 6,513 26,153 6,235 6,655 6,850 6,330 26,070 6,200 6,750 26,315 Pork 20,509 20,685 5,335 5,008 5,087 5,625 21,055 5,396 5,125 5,250 5,875 21,646 5,450 5,300 21,975 Lamb and mutton 195 187 49 47 42 47 185 49 44 42 46 181 48 44 179 Broilers 34,063 35,365 8,938 9,130 8,884 8,801 35,752 8,574 9,025 9,050 9,050 35,699 8,850 9,250 36,525 Turkeys 5,454 5,504 1,355 1,440 1,419 1,473 5,686 1,410 1,475 1,450 1,490 5,825 1,425 1,490 5,875
Total red meat & poultry 85,441 87,097 21,920 22,516 22,428 22,619 89,483 21,819 22,486 22,799 22,944 90,048 22,132 23,001 91,514 Table eggs, mil. doz. 6,365 6,411 1,611 1,610 1,624 1,649 6,494 1,592 1,580 1,625 1,650 6,447 1,610 1,610 6,575
Per capita disappearance, retail lb 2/ Beef 66.0 65.4 15.8 16.8 16.8 16.2 65.7 15.9 16.7 16.8 15.6 65.0 15.5 16.5 64.4 Pork 51.3 49.9 12.3 11.9 11.9 13.1 49.3 12.3 12.0 12.4 13.5 50.2 12.4 12.3 50.4 Lamb and mutton 1.1 1.1 0.3 0.3 0.2 0.3 1.1 0.3 0.3 0.2 0.3 1.1 0.3 0.3 1.1 Broilers 84.2 85.6 21.8 22.5 21.9 20.7 86.9 21.0 21.8 21.7 21.3 85.8 20.7 21.9 85.9 Turkeys 17.0 16.7 3.5 3.9 4.3 5.2 16.9 3.8 4.1 4.3 5.0 17.2 3.6 4.0 16.9
Total red meat & poultry 221.4 220.5 54.1 55.8 55.6 55.9 221.4 53.6 55.2 55.8 56.0 220.8 53.0 55.5 220.2 Eggs, number 256.9 255.3 63.9 63.5 63.8 64.5 255.7 61.7 61.0 62.9 63.5 249.2 62.2 61.9 252.9
Market prices Choice steers, Neb., $/cwt 84.75 87.28 89.24 80.39 85.40 86.61 85.41 90.61 96.45 87-91 85-91 88-92 84-92 85-93 84-90 Feeder steers, Ok City, $/cwt 104.76 110.94 106.23 104.08 115.17 103.22 107.18 99.32 108.87 105-109 102-108 103-107 97-105 99-107 97-103 Boning utility cows, S. Falls, $/cwt 52.35 54.36 48.89 47.79 49.28 44.29 47.56 47.60 52.71 50-52 48-52 50-51 47-51 48-52 47-51 Choice slaughter lambs, San Angelo, $/cwt 96.69 97.76 77.03 66.56 81.10 84.53 77.31 82.59 82.23 82-86 82-88 81-85 83-91 82-90 84-90 Barrows & gilts, N. base, l.e. $/cwt 52.51 50.05 42.63 48.45 51.83 46.13 47.26 46.04 52.55 51-53 45-49 49-50 45-49 47-51 46-50 Broilers, 12 City, cents/lb 74.10 70.80 62.7 61.0 67.8 65.9 64.4 75.0 80.3 78-82 73-79 77-79 73-79 74-80 73-79 Turkeys, Eastern, cents/lb 69.70 73.40 67.3 71.3 79.4 89.8 77.0 69.7 77.9 83-87 87-93 80-82 71-77 73-79 75-81
Eggs, New York, cents/doz. 82.20 65.50 71.4 62.7 64.0 89.0 71.8 105.3 92 88-92 91-97 94-97 95-103 83-88 89-97
U.S. trade, million lb Beef & veal exports 460 698 223 315 307 308 1,153 269 330 360 375 1,334 360 385 1,580 Beef & veal imports 3,679 3,599 843 789 731 722 3,085 770 860 790 780 3,200 805 855 3,300 Lamb and mutton imports 180 180 53 44 41 52 190 56 50 42 50 198 57 51 198 Pork exports 2,181 2,665 770 763 653 811 2,997 792 750 650 810 3,002 775 780 3,095 Pork imports 1,099 1,024 259 237 239 254 989 239 235 225 255 954 240 235 955 Broiler exports 4,784 5,203 1,338 1,298 1,224 1,412 5,272 1,275 1,275 1,300 1,400 5,250 1,350 1,355 5,515 Turkey exports 442 570 119 125 152 149 546 124 135 140 155 554 135 150 605 Live swine imports (thousand head) 8,506 8,192 2,133 2,087 2,205 2,338 8,763 2,302 2,350 2,350 2,400 9,402 2,350 2,350 9,5501/ Forecasts are in bold.2/ Per capita meat and egg disappearance data are calculated using the Resident Population Plus Armed Forces Overseas series from the Census Bureau of the Department of Commerce.Source: World Agricultural Supply and Demand Estimates and Supporting Materials.For further information, contact: Mildred Haley, (202) 694-5176, [email protected]
20 Livestock, Dairy, & Poultry Outlook/LDP-M-157/July 20, 2007
Economic Research Service, USDA
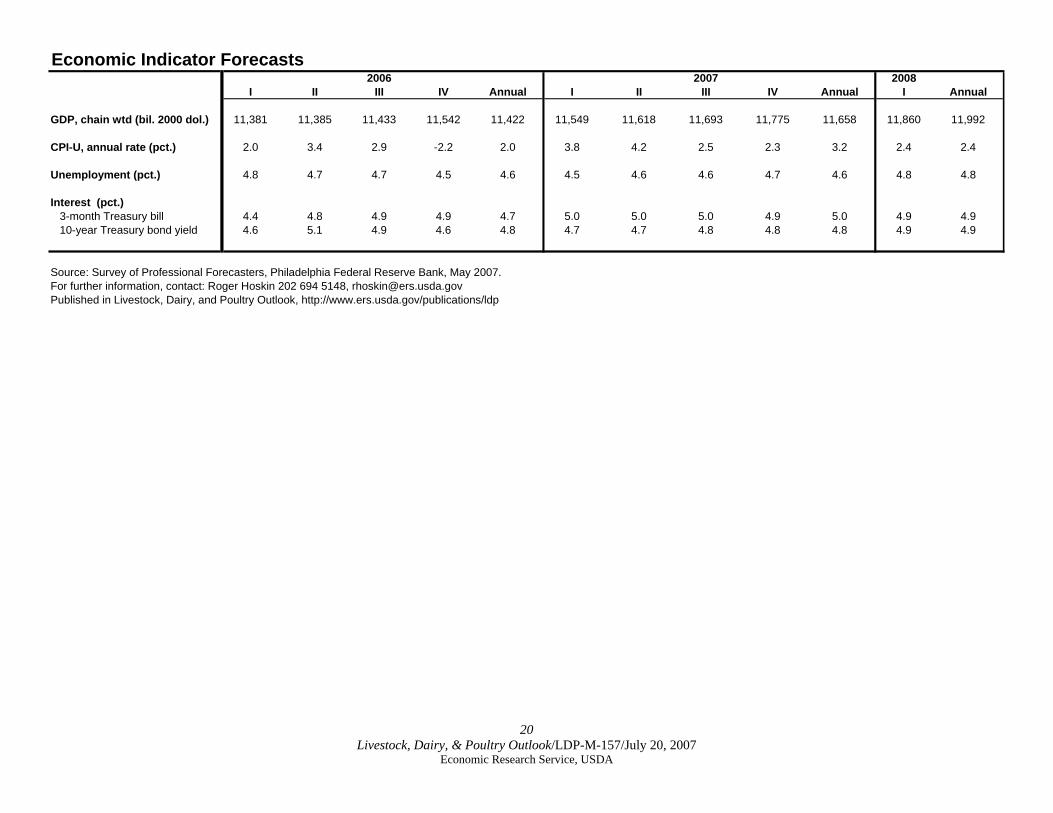
Economic Indicator Forecasts2006 2007 2008
I II III IV Annual I II III IV Annual I Annual
GDP, chain wtd (bil. 2000 dol.) 11,381 11,385 11,433 11,542 11,422 11,549 11,618 11,693 11,775 11,658 11,860 11,992
CPI-U, annual rate (pct.) 2.0 3.4 2.9 -2.2 2.0 3.8 4.2 2.5 2.3 3.2 2.4 2.4
Unemployment (pct.) 4.8 4.7 4.7 4.5 4.6 4.5 4.6 4.6 4.7 4.6 4.8 4.8
Interest (pct.) 3-month Treasury bill 4.4 4.8 4.9 4.9 4.7 5.0 5.0 5.0 4.9 5.0 4.9 4.9 10-year Treasury bond yield 4.6 5.1 4.9 4.6 4.8 4.7 4.7 4.8 4.8 4.8 4.9 4.9
Source: Survey of Professional Forecasters, Philadelphia Federal Reserve Bank, May 2007.For further information, contact: Roger Hoskin 202 694 5148, [email protected] in Livestock, Dairy, and Poultry Outlook, http://www.ers.usda.gov/publications/ldp
21 Livestock, Dairy, & Poultry Outlook/LDP-M-157/July 20, 2007
Economic Research Service, USDA
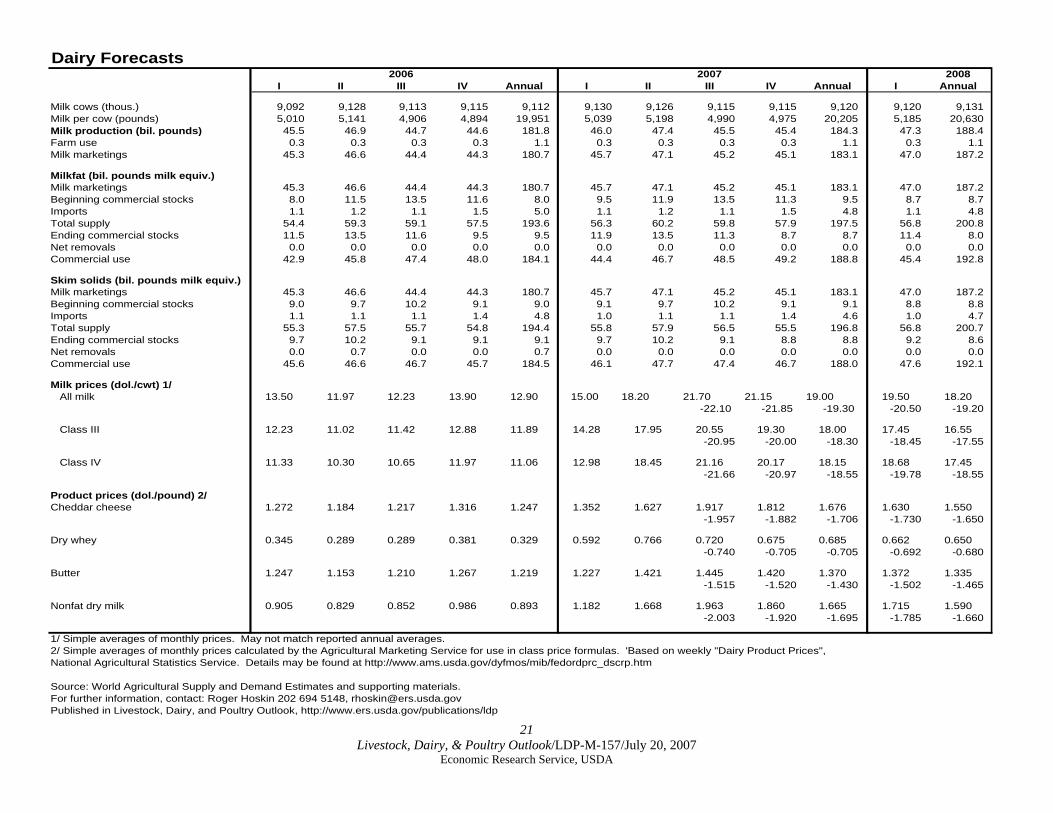
Dairy Forecasts2006 2007 2008
I II III IV Annual I II III IV Annual I Annual
Milk cows (thous.) 9,092 9,128 9,113 9,115 9,112 9,130 9,126 9,115 9,115 9,120 9,120 9,131Milk per cow (pounds) 5,010 5,141 4,906 4,894 19,951 5,039 5,198 4,990 4,975 20,205 5,185 20,630Milk production (bil. pounds) 45.5 46.9 44.7 44.6 181.8 46.0 47.4 45.5 45.4 184.3 47.3 188.4Farm use 0.3 0.3 0.3 0.3 1.1 0.3 0.3 0.3 0.3 1.1 0.3 1.1Milk marketings 45.3 46.6 44.4 44.3 180.7 45.7 47.1 45.2 45.1 183.1 47.0 187.2
Milkfat (bil. pounds milk equiv.)Milk marketings 45.3 46.6 44.4 44.3 180.7 45.7 47.1 45.2 45.1 183.1 47.0 187.2Beginning commercial stocks 8.0 11.5 13.5 11.6 8.0 9.5 11.9 13.5 11.3 9.5 8.7 8.7Imports 1.1 1.2 1.1 1.5 5.0 1.1 1.2 1.1 1.5 4.8 1.1 4.8Total supply 54.4 59.3 59.1 57.5 193.6 56.3 60.2 59.8 57.9 197.5 56.8 200.8Ending commercial stocks 11.5 13.5 11.6 9.5 9.5 11.9 13.5 11.3 8.7 8.7 11.4 8.0Net removals 0.0 0.0 0.0 0.0 0.0 0.0 0.0 0.0 0.0 0.0 0.0 0.0Commercial use 42.9 45.8 47.4 48.0 184.1 44.4 46.7 48.5 49.2 188.8 45.4 192.8
Skim solids (bil. pounds milk equiv.)Milk marketings 45.3 46.6 44.4 44.3 180.7 45.7 47.1 45.2 45.1 183.1 47.0 187.2Beginning commercial stocks 9.0 9.7 10.2 9.1 9.0 9.1 9.7 10.2 9.1 9.1 8.8 8.8Imports 1.1 1.1 1.1 1.4 4.8 1.0 1.1 1.1 1.4 4.6 1.0 4.7Total supply 55.3 57.5 55.7 54.8 194.4 55.8 57.9 56.5 55.5 196.8 56.8 200.7Ending commercial stocks 9.7 10.2 9.1 9.1 9.1 9.7 10.2 9.1 8.8 8.8 9.2 8.6Net removals 0.0 0.7 0.0 0.0 0.7 0.0 0.0 0.0 0.0 0.0 0.0 0.0Commercial use 45.6 46.6 46.7 45.7 184.5 46.1 47.7 47.4 46.7 188.0 47.6 192.1
Milk prices (dol./cwt) 1/ All milk 13.50 11.97 12.23 13.90 12.90 15.00 18.20 21.70 21.15 19.00 19.50 18.20
-22.10 -21.85 -19.30 -20.50 -19.20
Class III 12.23 11.02 11.42 12.88 11.89 14.28 17.95 20.55 19.30 18.00 17.45 16.55-20.95 -20.00 -18.30 -18.45 -17.55
Class IV 11.33 10.30 10.65 11.97 11.06 12.98 18.45 21.16 20.17 18.15 18.68 17.45-21.66 -20.97 -18.55 -19.78 -18.55
Product prices (dol./pound) 2/Cheddar cheese 1.272 1.184 1.217 1.316 1.247 1.352 1.627 1.917 1.812 1.676 1.630 1.550
-1.957 -1.882 -1.706 -1.730 -1.650
Dry whey 0.345 0.289 0.289 0.381 0.329 0.592 0.766 0.720 0.675 0.685 0.662 0.650-0.740 -0.705 -0.705 -0.692 -0.680
Butter 1.247 1.153 1.210 1.267 1.219 1.227 1.421 1.445 1.420 1.370 1.372 1.335-1.515 -1.520 -1.430 -1.502 -1.465
Nonfat dry milk 0.905 0.829 0.852 0.986 0.893 1.182 1.668 1.963 1.860 1.665 1.715 1.590-2.003 -1.920 -1.695 -1.785 -1.660
1/ Simple averages of monthly prices. May not match reported annual averages.2/ Simple averages of monthly prices calculated by the Agricultural Marketing Service for use in class price formulas. 'Based on weekly "Dairy Product Prices", National Agricultural Statistics Service. Details may be found at http://www.ams.usda.gov/dyfmos/mib/fedordprc_dscrp.htm
Source: World Agricultural Supply and Demand Estimates and supporting materials.For further information, contact: Roger Hoskin 202 694 5148, [email protected] in Livestock, Dairy, and Poultry Outlook, http://www.ers.usda.gov/publications/ldp