liverpool plains, nsw airborne geophysical survey, 1995 ... · spln ntrvl mnt g-r ptrtr...
TRANSCRIPT

r
~.~ ~9 s-17-~ "'IIII! LIVERPOOL PLAINS, NSW
AIRBORNE GEOPHYSICAL
SURVEY, 1995 OPERATIONS REpORT
IMi PUBLICATIONS {L
By
K FRANKLIN
RECORD 1995/75

• • • • • • • • • • • • • • • • • • • • • • • • • • • • • • • •
LIVERPOOL PLAINS, NSW AIRBORNE GEOPHYSICAL SURVEY, 1995 .
OPERATIONS REPORT
by
R. Franklin
Australian Geological Survey Organisation Record 1995/75
• 1IIIIIIIImifl • *R9507501*
Australian GeolOgical Survey Organisation

DEPARTMENT OF PRIMARY INDUSTRIES AND ENERGY
Minister for Resources: The Hon. David Beddall, MP Secretary: Greg Taylor
AUSTRALIAN GEOLOGICAL SURVEY ORGANISATION
Executive Director: Neil Williams
© Commonwealth of Australia
ISSN: 1039-0073
ISBN: 0 642 22386 6
This work is copyright. Apart from any fair dealings for the purposes of study, research, criticism or review, as permitted under the Copyright Act, no part may be reproduced by any process without written permission. Copyright is the responsibility of the Executive Director, Australian Geological Survey Organisation. Inquiries should be directed to the Principal Information Officer, Australian Geological Survey Organisation, GPO Box 378, Canberra City, ACT, 2601.
Australian Geological Survey Organisation
• • • • • • • • • • • • • • • • • • • • • • • • • • • • • • • • .,r •

• • • • • • • • • • • • • • • • • • • • • • • • • • • • • • • • • •
CONTENTS
SUMMARY
1. SUR'VEY AREA AND P AMMETERS ................................................ 1 (i) Area Description ............................................................................... 1 (ii) Survey Parameters ............................................................................ 1
2. LOGISTICS ............................................................................................. 1 (i) Operating Base and Dates of Flying ............................................... 1 (ii) Survey Aircraft and Field Crew ...................................................... 1
3. SUR'VEY EQUIPMENT ......................................................................... 2 (i) Major equipment .............................................................................. 2 (ii) Navigation ........................................................................................ 3 (iii) Magn.etometer .................................................................................. 4 (iv) Gamma-ray Spectrometer ................................................................ 4 (v) Altimeter ........................................................................................... 5
(vi) Barometer and Thermometer .......................................................... 5 (vii) Base Station Magnetometer ............................................................ 5 (viii) Data Acquisition ............................................................................... 5
4. C~mRATION ....................................................................................... 6 (i) Compensation for the Magnetic Field of the Aircraft ..................... 6 (ii) Gamma-ray Spectrometer Calibration ............................................ 6
5. DATA PROCESSIN'G ............................................................................. 7 (i) Data Checking and Editing ............................................................. 7 (ii) Flight Path Recovery ........................................................................ 7 (iii) Magnetic Data Processing ............................................................... 8 (iv) Gamma-ray Spectrometer Data Processing .................................... 9 (v) Digital Elevation Model Data Processing ..................................... 11 (vi) Final Products ................................................................................ 13
REFERENCES ...................................................................................... 15
APPENDICES
Australian Geological Survey Organisation

APPENDICES
A. Survey Area
B. Flying Dates and Line Kilometres Flown
C. Real Time Differential GPS
D. Specifications of G833 Helium Magnetometer
E. Specifications of RMS Instruments Automatic Aeromagnetic Digital Compensator
F. Specifications of Gamma-ray Spectrometer Components
G. Specifications of G866 Base Station Magnetometer
H. Aircraft Data Acquisition System
I. Compensation Results
J. Gamma-ray Spectrometer Test Line Location
K. The Australian Geodetic Datum
L. Corrections to Differential GPS Navigation Data
M. Geophysical Maps
N. AGSO Archive Data, Grid and Magnetic Tape Format for Airborne Geophysical Data
Australian GeolOgical Survey Organisation
• • • • • • • • • • • • • • • • • • • • • • • • • • • • • • • • • •

• • • • • • • • • • • • • • • • • • • • • • • • • • • • • • • • • •
SUMMARY
As part of the National Environmental Geoscience Mapping Accord the Australian Geological Survey Organisation flew an airborne geophysical survey of 43 200 line km over an irregularly shaped area to the west of Tamworth, NSW from 13 February to 27 March 1995. The flight line direction was east-west and the line spacing was 200 m. Flying height was at an altitude of 80m above ground level.
This survey was specifically designed to help assess the extent of soil salinity, rising water tables and land degradation on the Liverpool Plains. The new datasets will provide the framework for future landuse and exploration and assist in developing strategies for environmental management and resource development.
The total magnetic intensity, gamma-ray spectrometric and digital elevation model data which were collected during the survey, have been processed and are available for purchase, in both digital (point located data and gridded) and map form, from the Australian Geological Survey Organisation. Colour and greyscale pixel image maps are also available.
Australian Geological Survey Organisation

- 1-1. SURVEY AREA AND PARAMETERS
(i) Area Description
The Liverpool Plains airborne survey covers an irregularly shaped area centredsouthwest of Tamworth, NSW. The exact survey area is shown in Appendix A.
(ii) Survey Parameters
AltitudeFlight line directionTie line direction:Survey Line spacing:Flight line spacing:Tie line spacing:
Survey distance flown:
Lines:Ties:Total distance:
Sampling interval
Magnetics:Gamma-ray spectrometrics:GPS/Doppler/Altimeter/VLF:Barometric pressure/Temperature:
2. LOGISTICS
80 m nominal terrain clearanceEast-WestNorth-South
200 m2000 m
39164 km4036 km
43200 km
0.1 seconds (approx 7m)1.0 seconds (approx 67m)1.0 seconds (approx 67m)10.0 seconds (approx 670m)
(i) Operating Base and Dates of Flying
(a) Operating Base
Aircraft and crew were based at Tamworth, NSW for the duration of the surveyfrom 9 February to 29 March 1995.
(b) Flying Dates
A compensation flight for the magnetic field of the aircraft was flown on13 February. Production flying commenced on 14 February and continued throughto 27 March. Appendix B summarises flying days and distances flown.
(ii) Survey Aircraft and Field Crew
(a)^AircraftAero Commander 500 S "Shrike", VH-BGE
Australian Geological Survey Organisation

(b) Field Crew Party Leader: Technicians: Operators:
Pilots:
3. SURVEY EQUIPMENT
(i) Major Equipment
Magnetometer:
Compensator:
-2-
Ross Franklin Dave Pownall Lars Rickardsson "Curly" Wilcox Capt. John Biffin Capt. Murray Terwey Capt. Grahame Brett
(Skywest Aviation) (" ") (" «)
Geometrics G833 helium magnetometer
RMS Instruments Automatic Aeromagnetic Digital Compensator
Gamma-ray spectrometer: Exploranium gamma-ray spectrometer consisting of a GR820 spectrum processor and two DET1024 spectrometer crystal detectors (33.561 total volume)
Altimeter:
Barometer:
Thermometer:
Navigation:
Doppler
Video:
Acquisition hardware:
Acquisition software:
Collins AL T -50 radar altimeter
AGSO digital-Setra sensor
AGSO digital-RS sensor
Ashtech XII "Ranger" GPS receivers and Ashtech "Ranger" differential processing software with a real time link between receivers using Philips 8010 radio transceivers
Racal (Decca) doppler antenna (80561 CAD) Sperry C 14 D compass
National colour video camera (WV CL 302E) National VCR (NV 180) National LCD TV (TeL 3A) National Time Date Generator (WJ 810)
HP-A400 computer, HP9122 720 Kb 3.5 inch dual floppy disc drive and HP Thinkjet printer Compaq Notebook and 120 Mb portable hard disk drive
AGSO-developed HP assembler language program
Australian Geological Survey Organisation
• • • • • • • • • • • • • • • • • • • • • • • • • • • • • • • • • •

• • • • • • • • • • • • • • • • • • • • • • • • • • • • • • • • • •
-3-
(ii) Navigation
(a) GPS Navigation System
Navigation of the survey aircraft was by the real-time differential GPS method employing a base at Tamworth airport from which correction strings were transmitted to a receiver in the aircraft. The aircraft navigation system used an Ashtech XII global positioning system (GPS) receiver which manipulated range data received from satellites every second and calculated the current latitude and longitude coordinates in the World Geodetic System 1984 (WGS84) of the aircraft. The range data were recorded internally in the GPS receiver every five seconds. GPS corrections to the range data from the base receiver were applied in real time via a network of strategically placed transceivers. The real time method is described in Appendix C.
The calculated position of the aircraft was recorded on the aircraft acquisition system every second and was used to provide the pilot with aircraft guidance information on an LCD display.
Differential GPS post flight processing, used a base GPS receiver which was set up in AGSO's field office caravan and internally recorded range data every five seconds. The data were post processed using Ashtech 'Ranger' software at the end of each flying day. The error in position of the post processed flight path data is approximately 5-10 metres. This was determined by flying over a known ground position from each of the cardinal directions.
The position of the base station GPS receiver was accurately determined by differential GPS surveying using the aerodrome reference point CARP), located at Tamworth aerodrome, as a fixed reference.
The determined base station GPS coordinates (WGS 84) were: Longitude : 150°50"54.740' E Latitude 31°05"08.273' S Ellipsoidal height 452.7 m
The horizontal positions of the geophysical data from the survey are reported with respect to the WGS84 datum which is almost identical to the Geocentric Datum of Australia (GDA). It is intended that the GDA will be fully adopted in Australia by the year 2000. In the survey area there is an apparent translation in geographical position of 206 metres from AGD66 to WGS84.
(b) Doppler Navigation System
Doppler navigation data were used as a secondary navigation system for the aircraft. The doppler data were used as a back-up for the main navigation system (GPS) and to infill any gaps in the GPS data, none of which were more than 4 km.
Australian Geological Survey Organisation

• -4- ..
(c) Video Flight Path Recording •
The aircraft's flight path was recorded on a VHS video system consisting of a • National colour video camera with a wide angle lens, a National VCR and a National LCD TV. This system was also used for locating start and end positions for • the gamma-ray spectrometer test lines. •
(iii) Magnetometer •
A Geometrics G833 helium magnetometer, with the sensor mounted in a boom • attached to the rear of the aircraft, was used for the survey. The specifications of • the magnetometer are summarised in Appendix D.
The recorded total magnetic field data were compensated in real time using an RMS Instruments automatic aeromagnetic digital compensator (AADC). The AADC compensates for the effects of aircraft motion and heading. The specifications of the AADC are summarised in Appendix E. Compensation procedures are described in Chapter 4.
The AADC low pass filters the total magnetic field intensity data using a second order 0.9 Hz recursive Butterworth filter. The filtered compensated total magnetic field intensity data were recorded on the aircraft acquisition system.
(iv) Gamma-ray Spectrometer
An Exploranium gamma-ray spectrometer, incorporating two DET1024 crystal detectors with a total volume of 33.56 litres, was used. The crystal gains were controlled by an Exploranium GR820 spectrum processor. Appendix F summarises the specifications of the gamma-ray spectrometer components.
Two hundred and fifty six channels of data between 0.0 MeV and 3.0 MeV were recorded every second. These data were recorded on a portable hard disk via a communications link between the HP-A400 computer acquisition system and a Compaq Notebook computer.
Additionally five channels of data were recorded using the following window limits:
Total Count Potassium Uranium Thorium Cosmic
0.40·3.00 MeV 1.35-1.57 MeV 1.63-1.89 MeV 2.42-2.82 MeV 3.00-6.00 MeV
The Total Count, Potassium, Uranium and Thorium counts were used for data checking during acquisition and the Cosmic counts were used for background estimation and later data processing. A cumulative 256 channel spectrum between 0.0 MeV and 3.0 MeV was also recorded every 100 seconds. System live time (sample time - total dead time) was output with the data for later data processing.
Australian Geological Survey Organisation
• • • • • • • • • • .. • • • • • • • • • • • • • •

•
• -5-(v) Altimeter
• A Collins ALT-50 radar altimeter was used to measure ground clearance. Theradar altimeter display indicates ground clearance from 0-2000 feet. The
• manufacturer's specifications claim a +/-2% accuracy for the ALT-50 system.
• Prior to commencement of production flying the radar altimeter system was• checked. This involved flying the aircraft at 30 metre height intervals, up to a
height of 180 metres over Bendigo airstrip using the aircraft's barometric altimeter• as the height reference. Radar altimeter and GPS height data were recorded for
each height interval flown. A comparison of these data with the aircraft's• barometric altimeter verified that the system was operating satisfactorily.
(vi) Barometer and Thermometer
Atmospheric temperature and pressure were measured using a digital barometer(Setra sensor) and digital thermometer (RS sensor). Although both of these units
• were built by AGSO, the sensors were factory calibrated and no AGSO calibrationswere performed.
(vii) Base Station Magnetometer
• Daily variations of the Earth's magnetic field were monitored using a GeometriesG866 proton precession base station magnetometer, the specifications of which are
• given in Appendix G. The base station was set up in an area of shallow magnetic
• gradient, away from cultural influences and within telemetry range of AGSO'soffice caravan. Data from the base station were telemetered back to AGSO's field
• office caravan for display and recording on a Toshiba T1600 lap-top computer. Thetelemetry system used AGSO-built modems incorporating Phillips 828 UHF mobile
• radiotelephone transmit boards at a frequency of 471.8 MHz.
• Throughout the survey, base station data were recorded every twenty seconds• during production flights.
111^(viii) Data Acquisition
The acquisition program and system were run using a HP-A400 computer with• data recorded on 3.5 inch floppy discs using a HP9122 720 Kb disc drive. The
one-second multichannel spectra were recorded on a portable hard disk linked to• the acquisition system through a Compaq Notebook computer.
The acquisition program was developed in-house at AGSO. The data aredisplayed in real time in the aircraft in analogue form on a HP Thinkjet printer. Aschematic diagram of the aircraft's acquisition system is shown in Appendix H.
•
Australian Geological Survey Organisation•

-6-
4. CALIBRATION
(i) Compensation for the Magnetic Field of the Aircraft
Compensation flights were flown in an area of low magnetic gradient prior to thestart of the survey and after each aircraft service. They were flown at an altitude of2930 m above sea level, approximately 50 kilometres north-east of Tam.worth overan area between 151°20' to 151°30'E and 36°40' to 36°50'S.
The compensation comprises a series of rolls(+/-10°), pitches(+/-5°) and yaws(+/-5°) in the four cardinal headings to enable the AADC to calculate correctioncoefficients needed to remove aircraft manoeuvre noise. Each manoeuvrecomponent was of 20 seconds duration.
The compensation manoeuvres were repeated after calculation of the coefficientsto check the compensation quality. Peak-to-peak noise during repeat manoeuvresand after the final compensation was 0.30 nT or less. On normal survey flights,noise levels from all sources were generally less than 0.15 nT peak-to-peak.
The AADC calculates basic statistics which reflect the degree of merit of thecompensation. These include the standard deviation of the recorded data withoutcorrections applied, the standard deviation with the corrections applied, theimprovement ratio (the ratio of the standard deviation of the recorded data withoutand with the corrections applied) and the vector norm (the degree of difficulty incalculating the corrections). These statistics are given for all compensations inAppendix I.
(ii) Gamma-ray Spectrometer Calibration
The GR820 spectrum processor uses a sophisticated automatic control method tomaintain crystal alignment while stabilising on naturally occuring isotopes(typically Potassium) During operation the system continuously monitors each ofthe eight crystals signals and accumulates a separate spectra for each configuredsignal. When the confidence level for the selected stabilisation peak (Potassium) isexceeded, the peak channel of this isotope is computed, compared to the correctpeak location, and the gain is then corrected.
Gamma-ray spectrometric test lines were flown at the beginning and end of eachproduction flight. These lines were flown at survey altitude along a dirt road andlasted 150 seconds or approximately 10 kilometres. The location of the test linesused for the survey is shown in Appendix J.
Background corrections for gamma-ray data are calculated using a full spectrummethod (Minty, 1992) .
After each flight, statistics were calculated from data recorded between fixedreference points observed on video along the test line. These statistics wererecorded in spreadsheet form and compared with the preceding flights in order todetect any irregularities. In particular, the difference between the average in thetotal count channel for the most recently flown test line and the running average of
Australian Geological Survey Organisation

•
• -7-all the previously flown test lines was analysed. This value only rarely varied by
• greater than 10% for the test line, well inside a 15% variation which would be• considered acceptable.
• 5. DATA PROCESSING
• Flight path recovery, data checking and editing, and preliminary processing,• gridding and imaging were performed at the survey base using the Geophysical
Mapping Section's airborne data processing system, ARGUS. This preliminary• processing was repeated in Canberra using the successor to ARGUS, the new
INTREPID airborne geophysical data processing and visualisation system as a• direct comparison. Final magnetic, gamma-ray spectrometric and digital elevation• model data processing were carried out using INTREPID.
• (i) Data Checking and Editing
• Data recorded on the aircraft acquisition system were transferred on a flight by• flight basis to a hard disk in a Compaq SLT386s/20 laptop computer. This computer
was networked to a Sun Sparcstation 1PX and all aircraft data were transferred tothe Sun hard drive to be edited, using AGSO-developed software, for missingvalues, noise, spikes or steps. All the recorded data were displayed for each survey
• line and any errors were interactively corrected. Anomalies arising from cultural• influences, such as sheds, houses and fences, were usually not edited out. They
were only edited out if they caused severe noise or caused the magnetometer to lose• lock.
(ii) Flight Path Recovery
Range data which were recorded internally every five seconds on both GPSreceivers were post-processed daily in the field using "Ranger" - an Ashtechproprietary program "Ranger" calculates the corrected flight path (longitude,
• latitude and height) relative to the WGS84 reference ellipsoid.
At the end of each flying day the corrected longitude and latitude data calculated• at five second intervals by "Ranger" were used to correct the GPS data which were
• recorded every one second on the aircraft acquisition system. As well as thestandard "Ranger" corrections, other acquisition system specific corrections were
• applied. Position data were retained in the WGS84 coordinate system, which isdefined in Appendix K. The full correction procedure is described in Appendix L
• and is outlined below.
(a) Position calculation delay correction.•
(b) Fiducial synchronisation correction.•
• (c) "Ranger" corrections.
• (d) Low pass filter.
• (e) Coordinate system conversion.•
Australian Geological Survey Organisation•

-8-
(f) Reference navigation data to position of magnetometer sensor.
(g) Doppler infill of gaps.
The fully corrected flight path was plotted each day to check the position of survey lines and their spacing. Navigation reflies were determined by the following criteria:
Line Spacing Across Track Deviation Distance along line
200m 50m greater than 3 km
When both the across track deviation and along line distance were exceeded that portion of the survey line was reflown. This occurred very infrequently.
(iii) Magnetic Data Processing
Raw magnetic data were merged with the navigation data, and diurnal variation corrections were removed. The IGRF 1990 geomagnetic reference field, updated to 1995.25 and for an altitude of 300 m above sea level, which was estimated to be the mean survey altitude, was then subtracted from the data. The IGRF was calculated from the coefficients defined by the IAGA (1991). All magnetic values were adjusted by a constant so that the average residual magnetic field value was approximately 5000 nT.
The data were levelled using standard tie line levelling procedures. The steps involved in the tie line levelling were as follows.
(a) Tie line 440 was chosen as a reference tie.
(b) All other ties were levelled to this tie line using degree one polynomial adjustments.
(c) Lines were adjusted on a flight by flight basis to minimise the differences at line/tie crossover points, using degree one polynomial adjustments.
(d) Ties were then adjusted to minimise crossover differences, using degree one polynomial adjustments.
(e) Finally the lines were adjusted individually to minimise crossover differences, using degree one polynomial adjustments.
The data were micro-levelled using the technique described by Minty (1991), using the following parameters.
(a) Low pass filter in the flight line direction with a cut-off wavelength of 8000 metres.
Australian Geological Survey Organisation
• • • • • • • • • • • • • • • • • • • • • • • • • • • • • • • • • •

•
• -9-(b) High pass filter in the tie line direction with a cut-off wavelength of 800
• metres.•
(c) Correction strings were low pass filtered with a cut-off wavelength of• 1000 metres before being applied to the line data. Adjustments were limited
to a maximum of 15 nT.•
• Micro-levelling was repeated for the magnetic data using the followingparameters.
•(a) Low pass filter in the flight line direction with a cut-off wavelength of
• 1000 metres.a
(b) High pass filter in the tie line direction with a cut-off wavelength of• 400 metres.
• Correction strings were low pass filtered with a cut-off wavelength ofa^1000 metres before being applied to the line data. Adjustments were limitedto a maximum of 10 nT.
•
• The micro-levelled data were gridded using the minimum curvature techniquedescribed by Briggs (1974), employing a grid cell size of 40 m (1.5").
I(iv) Gamma-ray Spectrometer Data Processing.a
a^The 1 second multichannel spectrometer data were first corrected for systemdeadtime and then energy calibrated. The energy calibration technique useda^involves nominating a standard spectrum to which all other spectra are matched byiteratively adjusting the zero level and gain using a double quadratic minimisation
• technique ( Minty and others, 1990).a Four-channel data were created by summing adjacent channels (from the• deadtime corrected and energy calibrated multichannel data) over the conventional
4 windows (as given in Chapter 3 - Section (iv) ). Background estimates for each of• the four recording windows were removed. These estimates were determined as• follows.
a^(a) Aircraft and Cosmic BackgroundAircraft and cosmic spectra for the AGSO aircraft were determined from highI^altitude calibration flights using the procedure described by Minty and
a^Richardson (1989).
a^(b) Total BackgroundThe total background in the uranium window is the sum of the aircraft, cosmic
• and radon background. The total count and potassium window backgroundsa^were estimated directly from the uranium background since they are linearly
dependent (Grasty, 1975). The thorium window was considered to be• unaffected by atmospheric radon, so total thorium background was estimated
from the aircraft and cosmic backgrounds. Adjustments for radon effects in the• other channels were made at the end of the processing sequence.•
Australian Geological Survey Organisation•

-10-
The data were corrected for height attenuation and reduced to a nominal flying height of 80 m. Where the aircraft attained a height of 250 m or higher above the ground gamma Dray spectrometric data have been set to undefined. Height attenuation corrections were made using the following formula
Ncorrected N uncorrected e -u(H-h)
= where
Ncorrected = corrected counts
Nuncorrected = uncorrected counts
H = nominal flying height
h = measured flying height
u = attenuation coefficient
Attenuation coefficients for each channel are given below
Uwtalcount = 0.006354
~otassium = 0.009084
lluranium = 0.005967
'Uthorium = 0.006145
• • • • • • • • • • • • • • • • •
Channel interaction corrections (stripping) to correct for Compton scattering • were then applied to the data. Stripping ratios for the AGSO system were determined by Minty and others (1990) using portable calibration sources. The • corrections were applied as follows •
N TH(corrected) = NTH
NU(corrected) = Nu - A x NTH(corrected)
N K(corrected) = NK - B X N TH - C x NU(corrected)
where NTH = counts in the thorium channel
Nu = counts in the uranium
NK = counts in the potassium channel
A = 0.447 + 0.00046*height
B = 0.399 + 0.00107*height
C = 0.832 + 0.00109*height
GammaDray spectrometric data were levelled in much the same way as the magnetic data. However, prior to sampling the crossover points, a 5 point convolution filter was passed over the data. Note that these filtered data were only used for the crossover analysis and the final point located data have not been filtered.
Australian Geological Survey Organisation
• • • • • • • • • • • • • •

•-11-
The steps involved in tie line levelling were as follows.
(a) Tie line 450 was chosen as a reference tie.
(b) All other ties were levelled to this tie using degree one polynomial• adjustments.•
(c) Lines were adjusted on a flight by flight basis to minimise the differences atline/tie crossover points, using degree one polynomial adjustments.
• (d) Ties were then adjusted to minimise crossover differences, using degree one• polynomial adjustments.
• (e) Finally the lines were adjusted individually to minimise crossoverdifferences, using degree one polynomial adjustments.
• The data were micro-levelled using the technique described by Minty (1991,using the following parameters.
(a) Low pass filter in the flight line direction with a cut-off wavelength of8000 metres for Total Count, Potassium and Thorium, and 6000 metres forUranium.
(b) High pass filter in the tie line direction with a cut-off wavelength of800 metres for Total Count and Potassium, 1600 metres for Thorium, and2000 metres for Uranium
(c) Correction strings were low pass filtered with a cut-off wavelength of1000 metres before being applied to the line data. Adjustments were limited
• to a maximum of 150, 30, 12 and 15 counts/sec for Total Count, Potassium,Uranium and Thorium respectively.
The micro-levelled data were gridded using the minimum curvature technique• described by Briggs (1974), employing a grid cell size of 40 m (1.5").
(v) Digital Elevation Model Data Processing.•
As described in Chapter 5 - Section (ii), range data recorded internally every five• seconds on both GPS receivers were post-processed on a daily basis using "Ranger"• - an Ashtech proprietary program. "Ranger" calculates the position of aircraft GPS
receiver's antenna, including longitude, latitude and height relative to the WGS84reference ellipsoid for each set of range data (every five seconds).
• As in the case of the longitude and latitude data, the following acquisition systemspecific corrections, which are described in Appendix K, are applied to the heightdata:
(a) Position calculation delay correction.
1111Australian Geological Survey Organisation•

-12-(b) Fiducial synchronisation correction.
(c) Coordinate system conversion.
The corrected height data, which are relative to the AGD84 reference ellipsoid,are then linearly interpolated to one second samples (70 metres) and are mergedwith the longitude and latitude data.
A radar altimeter provided the aircraft's ground clearance, the altimeter databeing sampled every one second.^ •
The raw ground elevation data were then calculated as the difference betweenthe height of the aircraft above the ellipsoid and the height of the aircraft above theground. These raw elevation data calculated every one second (70 metres) arerelative to the WGS84 reference ellipsoid - the ellipsoid being a horizontal datum
Elevation data were tie line levelled and the steps involved are described below.
(a) Tie line 450 was chosen as the reference tie.
(b) All other ties were levelled to the reference tie using degree two polynomialadjustments.
(c) Lines were adjusted on a flight by flight basis to minimise the differences atline/tie crossover points, using degree two polynomial adjustments.
(d) Ties were then adjusted to minimise crossover differences, using degree twopolynomial adjustments.
(e) Finally the lines were adjusted individually to minimise crossoverdifferences, using degree two polynomial adjustments.
The data were micro-levelled using the technique described by Minty (1991),using the following parameters.
(a) Low pass filter in the flight line direction with a cut-off wavelength of2000 metres.
(b) High pass filter in the tie line direction with a cut-off wavelength of800 metres.
(c) Correction strings were low pass filtered with a cut-off wavelength of400 metres before being applied to the line data. Adjustments were limited toa maximum of 25 metres.
Additional micro-levelling was needed where Temperature and Pressure wereused to calculate the elevation. This occured for two and a half flights where lineseparation was 200 metres. The following micro-levelling parameters were used.
Australian Geological Survey Organisation
••
••
11
•
a
•
•
•• -13-
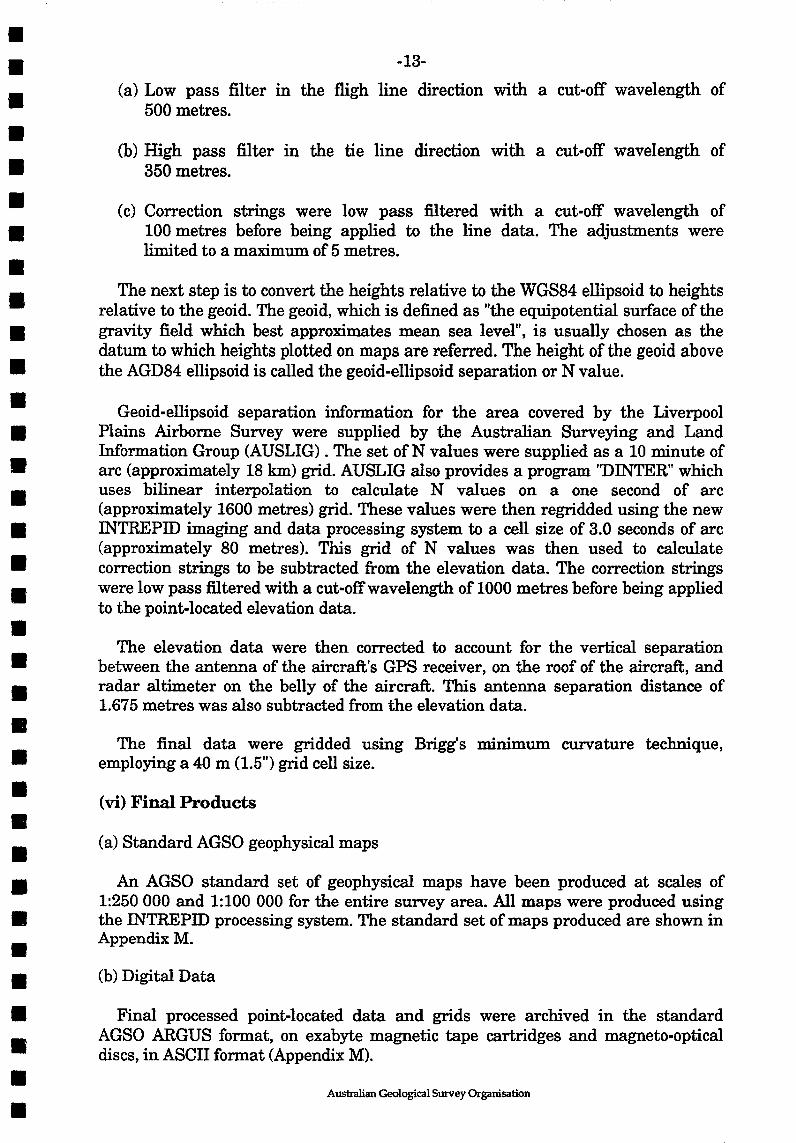
(a) Low pass filter in the fligh line direction with a cut-off wavelength of500 metres.
•(b) High pass filter in the tie line direction with a cut-off wavelength of
350 metres.
(c) Correction strings were low pass filtered with a cut-off wavelength of100 metres before being applied to the line data. The adjustments werelimited to a maximum of 5 metres.
The next step is to convert the heights relative to the WGS84 ellipsoid to heightsrelative to the geoid. The geoid, which is defined as "the equipotential surface of the
• gravity field which best approximates mean sea level", is usually chosen as thedatum to which heights plotted on maps are referred. The height of the geoid above
• the AGD84 ellipsoid is called the geoid-ellipsoid separation or N value.
Geoid-ellipsoid separation information for the area covered by the Liverpool• Plains Airborne Survey were supplied by the Australian Surveying and Land
Information Group (AUSLIG) . The set of N values were supplied as a 10 minute of• arc (approximately 18 kin) grid. AUSLIG also provides a program "MITER" which
uses bilinear interpolation to calculate N values on a one second of arc(approximately 1600 metres) grid. These values were then regridded using the newINTREPID imaging and data processing system to a cell size of 3.0 seconds of arc(approximately 80 metres). This grid of N values was then used to calculatecorrection strings to be subtracted from the elevation data. The correction stringswere low pass filtered with a cut-off wavelength of 1000 metres before being appliedto the point-located elevation data.
The elevation data were then corrected to account for the vertical separationbetween the antenna of the aircraft's GPS receiver, on the roof of the aircraft, andradar altimeter on the belly of the aircraft. This antenna separation distance of1.675 metres was also subtracted from the elevation data.
The final data were gridded using Brigg's minimum curvature technique,employing a 40 m (1.5") grid cell size.
(vi) Final Products
(a) Standard AGSO geophysical maps
• An AGSO standard set of geophysical maps have been produced at scales of1:250 000 and 1:100 000 for the entire survey area. All maps were produced using
• the INTREPID processing system. The standard set of maps produced are shown inAppendix M.
• (b) Digital Data
Final processed point-located data and grids were archived in the standardAGSO ARGUS format, on exabyte magnetic tape cartridges and magneto-opticaldiscs, in ASCII format (Appendix M).•
Australian Geological Survey Organisation

-14-
(c) Pixel Image Maps
Additional to the standard AGSO geophysical maps listed in AppendixM, pixelimage maps of the Liverpool Plains have been compiled using the method described by Milligan and others (1992). The following pixel image maps have been released.
(1) Colour 1:250000 scale composite pixel-image of airborne gamma-ray spectrometry - Red (Potassium), Green (Thorium), Blue (Uranium).
(2) Greyscale 1:250 000 scale pixel-image map of first vertical derivative of total magnetic intensity reduced to the pole with easterly illumination.
(3) Colour 1:250000 scale pixel-image of total magnetic intensity reduced to the pole with illumination from the north-east.
(4)Colour 1:250000 scale pixel-image of the digital elevation model with illumination from the east.
Australian Geological Survey Organisation
• • • • • • • • • • • • • • • • • • • • • • • • • • • • • • • • • •

-15-
• References
Briggs, I.C., 1974 - Machine contouring using minimum-curvature. Geophysics, 39,• 39-48.
a^Grasty, R. L., 1975 - Uranium measurements by airborne gamma-ray• spectrometry. Geophysics, 40, 503-519.
• International Association of Geomagnetism and Aeronomy, 1991 - Division VWorking Group 8. International Geomagnetic Reference Field, 1991 Revision.
• Journal of Geomagnetism and Geoelectricity, 43, 1007-1012.•
International Atomic Energy Agency, 1991 - Airborne Gamma Ray Spectrometer• Surveying. International Atomic Energy Agency Technical Reports Series Number• 323, IAEA Vienna.
• Milligan, P. R., Morse, M. P., and Rajagopalan, S., 1992 - Pixel map preparationusing the HSV colour model. Exploration Geophysics, 23, 219-224.
Minty, B. R. S., Morse, M. P., and Richardson, L. M., 1990 - Portable calibrationsources for airborne gamma-ray spectrometers. Exploration Geophysics, 21,187-195.
• Minty, B. R. S., 1991 - Simple micro-levelling for aeromagnetic data. Exploration• Geophysics, 22, 591-592.
• Minty, B. R. S., 1992 - Airborne gamma-ray spectrometric background estimation
• using full spectrum analysis. Geophysics, 57, 279-287.
• Minty, B. R. S., and Richardson, L. M., 1989 - Calibration of the BMR airbornegamma-ray spectrometer upward-looking detector, February 1989. Bureau of
• Mineral Resources, Australia, Record 198918.•
•
•
aI
a•
•Australian Geological Survey Organisation•

APPENDIX A Survey Area
1490 45' 150"30'
: - t § 8 ~ Il !l g 8 @ Ii ~ ~ 8 ~ t $
30" 52'30" S _J~_ 1O.w __ .3O" 52' 30" S
1200 1200
1400 1400
1600 1600
IBOO 1000
2COO 2000
2200
2400
2600
2800
3COO
3200
3400
3600
3800
,coo
4200
AAOO
]50" 52' 30"
~ ~ 3]° 30' S -----
4600 -,.' L 31"30'$
4600
I
"q -I SOOO sooo I I
31° 37' 30" S -----1---5200-1
~ ~ ~ I 1 I I
~ s ee .. ' ............ ' .,P-IrJi2W.._ 31" 37' 30" S
149"45' 149" 52' 30"
0 20
1 I 5800
31"45'S \---sg'4tI-40km i ~ 8 ~ ~ ii ~ 8 ~ t g n
I I I 150"45'
150" 7' 30" 150"15'
UVERPOOl PlA1NS SURVEY 1995
~
o "~
V ~- =-30" 00' S i i 30" 00' S
1 , I I I
-4ARRAlI*----I , , I , I
1 I , ,
I
, I ----,fl_----, I , I , I
I I I , I
--~...:----
I , I , I
--Sl~---, I , I I I
I , I I ,
---llGI"""'---I I I I I , , I , I
, I , I I
- -""i"5FlNCf- --I , I I
I I I 1 I
- - Nf-wc""S'i-E - --1 , 1 I , I
I I I I 33"OO'Si I I ) 33°00'S
148" 30' 153" 00'
Australian Geological Survey Organisation

• APPENDIXB·l
• • Flying Dates and Line Kilometres Flown
• DATE FLIGHT COMMENTS LINE/TIE NUMBER KILOMETRES
• 09/02/95 Ferry Canberra - Tamworth
• 12/02/95 113 Compensation flight 13/02/95 114 Compensation #1
• 14102/95 115 Operations normal 360 15/02/95 116 Operations normal 600
• 16/02/95 117 Operations normal 890
• 16/02/95 118 Operations normal 590 17/02/95 119 Operations normal 740
• 17/02/95 120 Operations normal 740 18/02/95 121 Operations normal 740
•• 18/02/95 122 GPS cloverleaf & altimeter check
• 19/02/94 123 Operations normal 740 19/02/95 124 Operations normal 740
• 20/02/95 125 Operations normal 660 20/02/95 126 Operations normal 740 • 21102/95 127 Operations normal 890
• 22/02/95 128 Operations normal 740 23/02/95 129 Operations normal 890
• 24102/95 130 Flight abandoned - alternator intermittent 150 24102/95 131 Compensation #2 • 25/02/95 132 Operations normal 780
• 25/02/95 133 Operations normal 930 26/02/95 134 Operations normal 780
• 26/02/95 135 Operations normal 930 27/02/95 136 Operations normal 780 • 27/02/95 137 Operations normal 930
• 28/02/95 138 Operations normal 780 28/02/95 139 Operations normal 930
• 01103/95 140 Operations normal 780 01103/95 141 Operations normal 930 • 02/03/95 142 Operations normal 930
• 03/03/95 143 Flight abandoned - high winds 150 04/03/95 144 Operations normal 620
• 05/03/95 145 Flight abandoned - high winds 390 08/03/95 14617 Operations normal 670 • 09/03/95 148 Operations normal 890
• 09/03/95 149 Operations normal 750 10/03/95 150 Operations normal 940
• 11103/95 151 Operations normal 750 11103/95 152 Operations normal 940 • 12/03/95 153 Operations normal 640
• 12/03/95 154 Operations normal 750 13/03/95 155 Operations normal 750
• 13/03/95 156 Operations normal 780 14103/95 157 Operations normal 840 • 15/03/95 158 Operations normal 620
• Australian Geological Survey Organisation
•

DATE
16/03/95 16/03/95 17/03/95 18/03/95 19/03/95 19/03/95 20/03/95 20/03/95 21103195 21103/95 22103/95 23/03/95 24103195 24103/95 25/03/95 26/03/95 26/03/95 27/03/95
APPENDIX B-2
Flying Dates and Line Kilometres Flown
FLIGHT NUMBER
159 160 161 162 163 164 165 166-7 168 169 170 171 172 173 174 175 176 177
COMMENTS
Operations normal Operations normal Operations normal Operations normal Operations normal Operations normal Operations normal Operations normal Operations normal Operations normal Operations normal Operations normal Operations normal Flight abandoned - high winds Operations normal Operations normal Operations normal Operations normal
Totalline/tie kilometres flown
Total flights in survey 65
Productive survey flights 60 Unproductive survey flights 5 Abandoned flights 4
Unproductive survey flights consisted of:
Aircraft ferries Compensation flights Test flights
Abandoned survey flights consisted of:
1 3 1
In flight bad weather 3 Equipment malfunction 1
Australian Geological Survey Organisation
• • • LINE 1 TIE • KILOMETRES
760 • 600 • 840 860 • 860 720 • 780 • 860 780 • 800 • 780 780 • 710 350 • 890 • 860 620 • 180
• 43200 • • • • • • • • • • • • • • • • • •

• • • • • • • • • • • • • .' • • • • • • • • • • • • • • • • • • • •
APPENDIXC
REAL TIME DIFFERENTIAL GPS
Real time differential GPS navigation is used to improve navigational accuracy. Tracking using this method is more precise than by only using a single GPS receiver thus allowing a pilot to fly a line with less deviation.
The navigation equipment consisted of two Ashtech XII GPS receivers; one in the field office caravan (base) located at a known position at the Tamworth airport, and the other in the aircraft. The two identical GPS receivers were configured to run in differential mode.
The base station GPS calculated satellite range corrections which were transmitted to the aircraft by a UHF radio link. The base radio transmitter was a Philips PRM 8010 UHF radio, transmitting at 5 watts power through a UHF colinear antenna mounted about 10 meters above ground level.
The radio in the aircraft was a Philips PRM 8030 transceiver with a "voting" facility, which enables the receiver to search out and lock onto the strongest signal available. The receiving antenna in the aircraft was a groundplane independent type, mounted on the top of the tail.
To extend the range of operation, two repeater stations for the telemetry system were used, each of which incorporated a pair of Philips PRM 8010 radios. The receiving antennas for the repeaters were a nine element Yagi aimed at the base transmitter, while the transmitting antennas were a colinear type mounted about 10 metres above the ground. One repeater was situated at Cana Trig (694 metres as}) and the other at Tambar Mountain (806 metres asl). Cana Trig was approximately 35 km south-west of the base and Tambar Mountain was approximately 105 km west of the base. With this configuration real time navigation was possible for the whole survey area.
The frequencies for the network were:
Tx from caravan ................................... .490.175MHz.
Repeater from Cana Trig ...................... 474.775MHz.
Repeater from Tambar Mountain ....... .490.525MHz.
The modems used to interface between the GPS receivers and the radios at the base station and in the aircraft were AGSO designed units incorporating TCM3105 chips operating at 1200 baud.
Australian Geological Survey Organisation

APPENDIXD
SPECIFICATIONS - G833 HELIUM MAGNETOMETER
Operating range:
Temperature:
Sensitivity:
Bandwidth:
Loop scan rate:
Input power:
Output signal:
Dimensions:
Weight:
20,000 to 95,000 nT
-20 to +50 °C
0.0032 nT/root Hz RMS
350 Hz (-3dB point)
1000 cycles/second
28VDC,6Amax
At He gyromagnetic frequency, approximately 28.02468 Hz/nT. Three volts peak to peak
Sensor cell - 80 mm diameter x 145 mm length Scan processor - 270 x 120 x 85 mm Control panel - 19 inch rack mount
approximately 6 kg
Australian Geological Survey Organisation
• • • • • • • • • • • • • '. • • • • • • • • • • • • • • • • • • • •

• • • • • • • • • • • • • • • • • • • • • • • • • • • • • • • • • •
APPENDIXE·l
Specifications· RMS Instruments Automatic Aeromagnetic Digital Compensator
INPUTS:
INPUT FREQUENCY RANGE:
MAGNETIC FIELD RANGE:
RESOLUTION:
one or two high sensitivity magnetometers of optical absorption type.
70 KHz - 350 KHz - Cs sensor 140 KHz -700 KHz - K sensor 560 KHz - 2800 KHz - He sensor 850 Hz - 4260 Hz - Overhauser
20,000 - 100,000 nT (gamma)
1 pT (picotesla)
COMPENSATION PROCEDURE: improvement ratio 10 - 20 typical for total field improvement ratio 20 - 100 typical for gradient
ACCURACY OF COMPENSATION: 0.035 nT (gamma) standard deviation for the entire aircraft flight envelope in the bandwidth 0 - 1 Hz typical
DATA OUTPUT RATE: 10Hz
SYSTEM FREQUENCY RESPONSE: 0 - 0.9 Hz
INTERNAL SYSTEM NOISE:
DURATION OF CALIBRATION: FLIGHT MANOUEVRES
VECTOR MAGNETOMETER:
MICROCOMPUTER:
KEYBOARD:
DISPLAY:
OUTPUTS:
less than 2 pT (standard deviation in the bandwidth 0 - 1 Hz)
5 - 8 minutes typical
Develco Model 9202-02 (3-axis fluxgate)
SBC-11121 Plus (DEC) Front End LSI-11173 (DEC) Main CPU
limited alphanumeric
green fluorescent, 80 character self scan panel
serial data communication port: RS232C - max. rate 19.2 K Baud
parallel output port: 16 bit with full handshaking (DRV11-J) (optional)
Australian Geological Survey Organisation

APPENDIX E·2
Specifications. RMS Instruments Automatic Aeromagnetic Digital Compensator
POWER:
ENVIRONMENTAL:
28 +/- 4 VDC, 5A, 150 W (for single magnetometer) 7 A, 196 W (for gradiometer system)
OPERATING TEMPERATURE: 0 to 50 degrees C
STORAGE TEMPERATURE: -20 to 55 degrees C
RELATIVE HUMIDITY: 0 - 99%, non-condensing
ALTITUDE: 0 - 6000 m (0 - 20,000 ft)
PHYSICAL DATA: console dimensions: 483 x 178 x 440 mm console weight: 12.5 kg power supply dimensions: 225 x 180 x 220 mm power supply weight: 5.5 kg
Australian Geological Survey Organisation
• • • • • • • • • • • • • • • • • • • • • • • • • • • • • • • • • •

• • • • • • • • • • • • • • • • • • • • • • • • • • • • • • • • • •
APPENDIX F·l
SPECIFICATIONS· GR820 SPECTROMETER SYSTEM
A. Detector Controller
- Maximum number of crystals - 16. Each crystal has individual pole-zero cancellation, semi-gaussian shaping and advanced base line restoration circuitry.
- Continuous, individual-crystal spectrum analysis ensures that optimum system stabilization is achieved. Resolution is calculated by a sophisticated gaussian curve fitting algorithm to perform an accurate centroid analysis of the selected stabilization peak.
- High energy cosmic pulses are accumulated in a separate channel.
- Accurate pile-up rejection for simultaneous pulses allows qualitative gamma-ray spectrum analysis almost independent of the system count rate. Special circuitry analyzes for pulse pile-up and permits only detector signals from single events to be analyzed. Simultaneous events in adjacent crystals are added to reduce the Compton effect.
- Residual pulse pile-up at 100,000 counts/sec are less than 2%.
B. Analog to digital converter (ADC)
- 50 mhz Wilkinson ramp ADC.
- Linearity - integral - less than 0.2% - differential - less than 1%.
- Average system dead-time is less than 5 microseconds/pulse.
- Live-time channel records the actual system live-time. This data is output with the digital data which allows post correction for system dead-time to an accuracy of 0.1%.
- Number of channels - selection of 256 channels or 512 channel operation.
- Maximum number of counts/channel - 65,535 (16 bits).
- The lower threshold - manually selectable from channel 2 to channel 50 (20-500 kev).
- The upper threshold is set to 3 Mev. All pulses above 3 MeV are accumulated in the cosmic channel as a direct measure of cosmic ray activity.
- ADC offset set from the keyboard.
- The maximum input count rate is 100,000 counts/second.
Australian Geological Survey Organisation
APPENDIX F·2
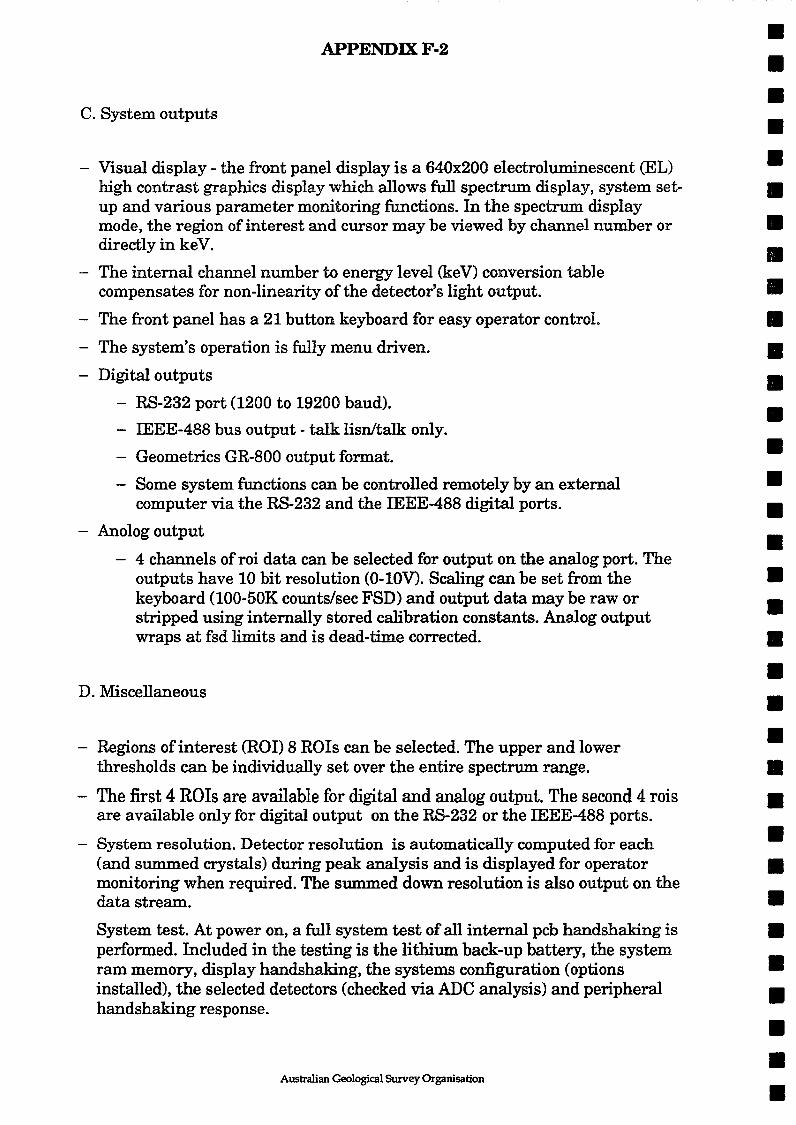
C. System outputs
- Visual display - the front panel display is a 640x200 electroluminescent (EL) high contrast graphics display which allows full spectrum display, system setup and various parameter monitoring functions. In the spectrum display mode, the region of interest and cursor may be viewed by channel number or directly in ke V.
- The internal channel number to energy level (ke V) conversion table compensates for non-linearity of the detector's light output.
- The front panel has a 21 button keyboard for easy operator control.
- The system's operation is fully menu driven.
- Digital outputs
- RS-232 port (1200 to 19200 baud).
- IEEE-4BB bus output - talk lisn/talk only.
- Geometrics GR-BOO output format.
- Some system functions can be controlled remotely by an external computer via the RS-232 and the IEEE-4BB digital ports.
- Anolog output
- 4 channels of roi data can be selected for output on the analog port. The outputs have 10 bit resolution (0-10V). Scaling can be set from the keyboard (100-50K counts/sec FSD) and output data may be raw or stripped using internally stored calibration constants. Analog output wraps at fsd limits and is dead-time corrected.
D. Miscellaneous
- Regions of interest (RO!) 8 ROls can be selected. The upper and lower thresholds can be individually set over the entire spectrum range.
- The first 4 ROIs are available for digital and analog output. The second 4 rois are available only for digital output on the RS-232 or the IEEE-4BB ports.
- System resolution. Detector resolution is automatically computed for each (and summed crystals) during peak analysis and is displayed for operator monitoring when required. The summed down resolution is also output on the data stream.
System test. At power on, a full system test of all internal pcb handshaking is performed. Included in the testing is the lithium back-up battery, the system ram memory, display handshaking, the systems configuration (options installed), the selected detectors (checked via ADC analysis) and peripheral handshaking response.
Australian GeolOgical Survey Organisation
• • • • • • • • • • • • • • • • • • • • • • • • • • • • • • • • • •

• • • • • • • • • • • • • • • • • • • • • • • • • • • • • • • • • •
APPENDIX F-3
- Configuration menus. The configuration menus allow the selection of the number of detectors in use, confidence levels for gain analysis, maximum crystal resolution levels for each detector (with operator warning if levels exceeded), output configurations for analog and digital data and various special display/monitoring functions.
- Maintenance. A set of special menus allows the user to test and calibrate many system functions including system test, ADC offset, low level discriminator etc.
- Power: 28V - 1.25 amps
E. Detectors
The crystals are housed in specially designed hi-impact polystyrene cases using low background materials for minimum signal attenuation. Full thermal and internal shock protection allows the units to be directly mounted to the floor. A very low noise, high voltage power supply is housed in each pack so high voltage is not present in the connecting cables. A unique preamplifier with special processing for signal optimization is used. The GPX-I024 has 4 crystals with a total volume of 16.78 litres
- Outputs. Individual BNC connectors output each crystal's signal separately.
- Size: GPX-1024 : 73x51x30 cms)
- Weight: GPX-I024: 84 kg
- Power : 28 V @ 0.5 A/crystal pack
- Temperature limitations
Closed pack: storage -40 to +60, operation -40 to +60 deg. C
Open pack: not recommended
Temperature gradient
Closed pack: -40 to +50 (instantaneous)
Open pack: a change of 1 deg. Clhr.
Australian Geological Survey Organisation
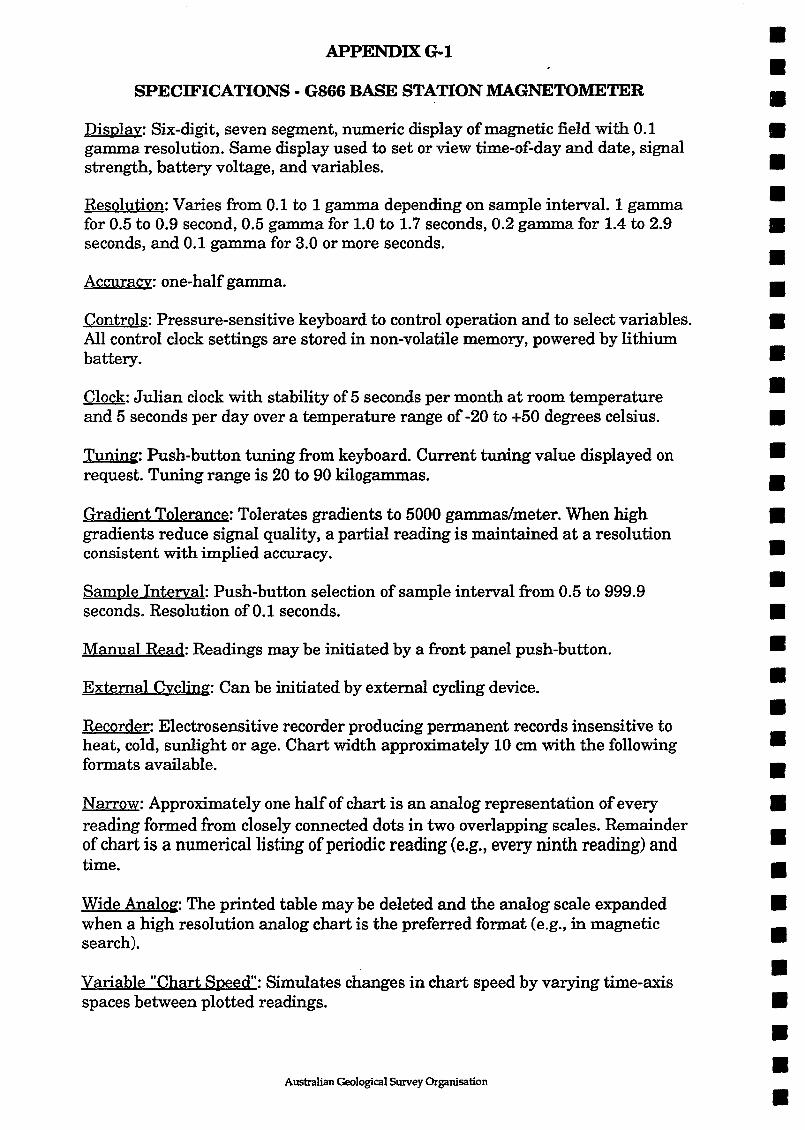
APPENDIXG·l
SPECIFICATIONS· G866 BASE STATION MAGNETOMETER
Display: Six-digit, seven segment, numeric display of magnetic field with 0.1 gamma resolution. Same display used to set or view time-of-day and date, signal strength, battery voltage, and variables.
Resolution: Varies from 0.1 to 1 gamma depending on sample interval. 1 gamma for 0.5 to 0.9 second, 0.5 gamma for 1.0 to 1.7 seconds, 0.2 gamma for 1.4 to 2.9 seconds, and 0.1 gamma for 3.0 or more seconds.
Accuracy: one-half gamma.
Controls: Pressure-sensitive keyboard to control operation and to select variables. All control clock settings are stored in non-volatile memory, powered by lithium battery.
Clock: Julian clock with stability of 5 seconds per month at room temperature and 5 seconds per day over a temperature range of -20 to +50 degrees celsius.
Tunin~: Push-button tuning from keyboard. Current tuning value displayed on request. Tuning range is 20 to 90 kilogammas.
Gradient Tolerance: Tolerates gradients to 5000 gammas/meter. When high gradients reduce signal quality, a partial reading is maintained at a resolution consistent with implied accuracy.
Sample Interval: Push-button selection of sample interval from 0.5 to 999.9 seconds. Resolution of 0.1 seconds.
Manual Read: Readings may be initiated by a front panel push-button.
External Cycling: Can be initiated by external cycling device.
Recorder: Electrosensitive recorder producing permanent records insensitive to heat, cold, sunlight or age. Chart width approximately 10 cm with the following formats available.
Narrow: Approximately one half of chart is an analog representation of every reading formed from closely connected dots in two overlapping scales. Remainder of chart is a numerical listing of periodic reading (e.g., every ninth reading) and time.
Wide Analog: The printed table may be deleted and the analog scale expanded when a high resolution analog chart is the preferred format (e.g., in magnetic search).
Variable "Chart Speed": Simulates changes in chart speed by varying time-axis spaces between plotted readings.
Australian Geological Survey Organisation
• • • • • • • • • • • • • • • • • • • • • • • • • • • • • • • • • •

• • • • • • • • • • • • • • • • • • • • • • • • • • • • • • • • • •
APPENDIX G·2
SPECIFICATIONS· G866 BASE STATION MAGNETOMETER
Recorder Scale: Four, push-button selected scales of 10/100, 20/200, 50/500 or 100/1000 gammas full scale. The analog records are dual range, as though there were two overlapping pens recording at different scale factors. The scales overlap by 20% with hysteresis so that there is no jitter at the scale edges. Event Mark: A front panel push button or external input will cause an extra mark to be added for identification of special events.
Paper Feed: Advances paper rapidly for loading and unloading paper. Also causes the printer to annotate the record with sensitivity, scale factors, sample interval and date.
Special Functions: Internal switch, accessible by hinging up the front panel, allows selection ofvariations in operation:
(a) Vary "chart speed" (see recorder). (b) Narrow chart (see recorder). (c) Wide analog chart (see recorder). (d) Power conservation. Display will automatically shut off 7 seconds after a
reading has been taken, or two minutes after a key has been depressed. (e) 3-point running average (smooths data by taking running average). (f) 5-point running average (smooths data by taking running average). (g) 7-point running average (smooths data by taking running average). (h) Control disable (disable all front panel controls which might be used to
modify the stored parameters, prevents operator errors), saves power.
Outputs: (1) BCD character serial output of time, day and field readings for use with external digital recorder. (Also outputs suitable handshaking signals for interfacing.) and (2) RS-232-C compatible ASCII output of time, day, and field reading: followed by a carriage return and line feed at three selectable baud rates (110,300,9600). This output is for an external printer or computer-based acquisition system.
Australian Geological Survey Organisation

APPENDIX H AIRCRAFT ACQUISITION SYSTEM
28v Int/Ex[
,'6780 cu. em I ERr I 28v Int/E."(t crystal lIRE-AMP I
Spectra
28v Int/EXI 116780 cu. em I ERr-I crystal I mE·AMP I GR 820
i
28 V 28 V
28 V
f-Jamor R:l G833
I Sensor Helium Console Mag
AADC I
IFluxgate r Attitude
10Hz
115v
Decca 80 F
Doppler
In/Out
28v Mux +15v
C14 SID D
Compass +5
- ~ F
~ A D f-----
J5;l I A
5v I A~ RHAmps~ I
FLT Sv AF D No. I
I LHAmps~-I 1
100HZ
FID +24v Timer Baro '--
On
Temp +/- 12v
L 12,
--1 UHF Rx r-f------8-
12v 1-- l?v 12v
_____ c=--WJ 810 NV 180
Camera :':verl~ l VCR
28v tr -- l
In~ctro --L::...:J 28v
Ext 28v
Collins
I Rad Alt 50 I
28v GPS DIFF 12v PS
9.Sv
12 V --Compaq
pectro
'C r -
.-----
r-
Sv 11. ,---
Sp ectro
M'
HP
A40
-256
0
Com puter
M ux
Vi deo GPS
Ti mer
1I5v
122
,---1pp
28v lOs
ASHTEC
Ranger
GPS -
/
AI
i __ .J
PHd
Sv
lIS v
Thinkjet
Printer
28 v
IT 703
Terminal
LCD Nav
Display
y 9.Sv
----- -----_ .. __ ._-------------------.! Australian Geological Survey Organisation
• • • • • • • • • • • • • • • • • • • • • • • • • • • • • • • • • •
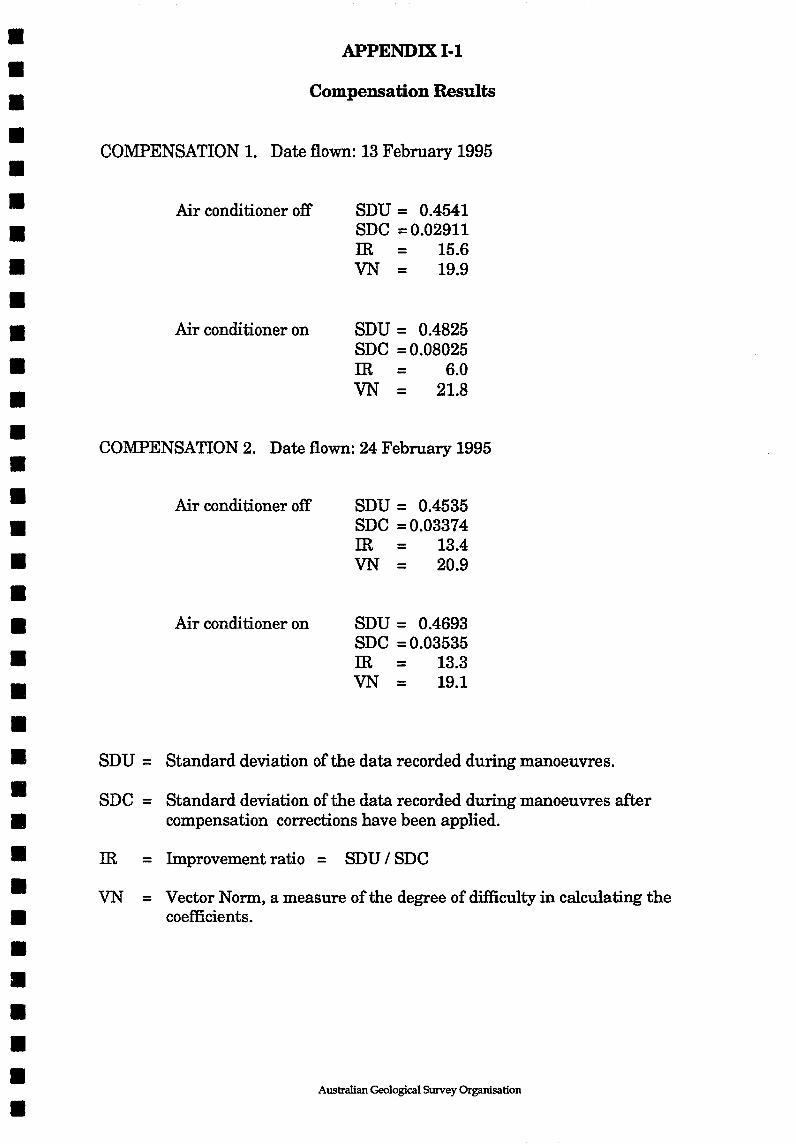
APPENDIX 1·1
Compensation Results
COMPENSATION 1. Date flown: 13 February 1995
Air conditioner off
Air conditioner on
SDU = 0.4541 SDC = 0.02911 IR = 15.6 VN = 19.9
SDU = 0.4825 SDC = 0.08025 IR = 6.0 VN = 21.8
CO:MPENSATION 2. Date flown: 24 February 1995
Air conditioner off
Air conditioner on
SDU = 0.4535 SDC = 0.03374 IR = 13.4 VN = 20.9
SDU = 0.4693 SDC = 0.03535 IR = 13.3 VN = 19.1
SDU = Standard deviation of the data recorded during manoeuvres.
SDC = Standard deviation of the data recorded during manoeuvres after compensation corrections have been applied.
IR = Improvement ratio = SDU / SDC
VN = Vector Norm, a measure of the degree of difficulty in calculating the coefficients.
Australian Geological Survey Organisation

APPENDIXJ Gamma-ray Spectrometer Test Line Location
150°11'56" 151°00' 30° 54' S r----------------------------, 30° 54' S
N
1
10
31 ° 42' S '---_______ ---"'-_______ ~'___ _____ ---l 31° 42' S
150°11'56" 151°00'
Australian Geological Survey Organisation
• • • • • • • • • • • • • • • • • • • • • • • • • • • • • • • • • •

• • • • • • • • • • • • • • • • • • • • • • • • • • • • • • • • • •
APPENDIXK
The Australian Geodetic Datum
For geophysical surveys the real shape of the earth has to be considered. An ellipsoid of revolution around the earth's north-south axis approximates the earth's shape. This figure is called the spheroid. The mean sea level equipotential surface describing the shape of the earth is known as the geoid.
r Ellipsoid
r Geoid
Australian Geodetic Datum
Calculated positions from the GPS are in the World Geodetic System 1984 (WGS84). The WGS84 datum is a global geocentric reference datum that has as its origin the Earth's centre of mass. The non-geocentric datum which comprises the Australian National Spheroid (ANS) is oriented and located in such a manner as to "best-fit" the geoid over the Australian continent.
The WGS84 datum is almost identical to the Geocentric Datum of Australia (GDA). It is intended that the GDA will be fully adopted in Australia by the year 2000.
The WGS84 datum is defined by a semi-major axis (a) and flattening (f) of the selected ellipsoid.
a f
= =
6378137m 11298.2572
There is an apparent translation in geographical position over the survey area of 206 metres when converting from WGS84 to AGD66.
Australian Geological Survey Organisation

APPENDIXL
Corrections to Differential GPS Navigation Data
(a) Position calculation delay correction
A correction due to the finite time taken for the GPS system to calculate a position and transfer the information to the acquisition system. A delay of 0.6 seconds has been determined for calculations using up to eight satellites by flying clover leaf patterns over a reference point. This value is considered to be representative and was used for all delay corrections.
(b) Fiducial synchronisation correction
A correction due to the time lag between when a GPS position is available to the acquisition system and when the next fiducial is available to pair the position with.
(c) "Ranger" corrections
U sing the range data which are recorded internally on both GPS receivers every five seconds, "Ranger" calculates the correct positions at five second intervals along the flight path. These corrected positions are utilised when correcting the aircraft raw position data which are recorded every second.
Discontinuities (steps) sometimes occur in raw GPS data. These are also manifested as steps in the correction set.
When such steps in the raw GPS data occur between successive correction values, the corrections are linearly interpolated to the step boundary using corrections from the appropriate side of the step.
If multiple steps in the raw GPS data occur between successive correction values it is impossible to interpolate corrections over this interval, in which case the intervening GPS data are set to undefined.
(d) Low pass filter
The problem described in (c) can lead to small steps in the data where the original steps were too small to detect so were not corrected. A low pass 11 point convolution filter with a cut-off wavelength of 300 m was passed over the data.
(e) Reference navigation data to position of magnetometer sensor
The calculated GPS positions refer to the position of the GPS receiver's antenna. Since the magnetometer is the most position sensitive instrument, all position data is shifted 11.4 meters toward the rear of the aircraft to correspond with the position of the magnetometer's sensor.
(£) Doppler infill of gaps
Whenever gaps «10 km) in the GPS data occurred they were infilled with data generated from the doppler navigation system. Gaps in the GPS data greater than ten kilometres were reflown.
Australian GeolOgical Survey Organisation
• • • • • • • • • • • • • • • • • • • • • • • • • • • • • • • • • •

• APPENDIXM
• • Geophysical Maps
• Name Type Contour Interval Reference 1 Vertical Scale Number
• • 1:250 000 scale
• Liverpool Plains TMI Contours 25 nT 22-1/H56-1311
• " TC Contours 100 cps 22-1JH56-13/2 " DEM Contours 10 m 22-1JH56-• 13/19
• 1:100 000 scale
• • Liverpool Plains North TMI Contours 10 nT 22-2/H56-1311-IN
" TC Contours 50 cps 22-2IH56-13/2-• IN
• " Flight Path 22-2IH56-13/3-
• IN " TMI Profiles 800 nT/cm 22-2IH56-13/4-
• IN
• Liverpool Plains South TMI Contours 10 nT 22-2IH56-13/1-
• 18 " TC Contours 50 cps 22-2IH56-13/2-
• 18 " Flight Path 22-2IH56-13/3-
• 18 " TMI Profiles 800 nT/cm 22-21H56-13/4-• 18
• • • • • • • • • • • • Australian Geological Survey Organisation
•

APPENDIXN-l
AGSO ARCHIVE DATA, GRID AND MAGNETIC TAPE FORMAT FOR AIRBORNE GEOPHYSICAL DATA
CONTENTS
1. THE AGSO SEQUENTIAL FILE STRUCTURE
1.1 INTRODUCTION
1.2 GENERAL FILE STRUCTURE
1.3 CHANNELS AND SAMPLES
1.4 SEGMENT DIRECTORY RECORD
1.5 DATA RECORD
1.6 NO DATA VALUE
1.7 STANDARD DATA CHANNELS
2. PHYSICAL FORMAT FOR MAGNETIC TAPES
2.1 GENERAL
2.2 PHYSICAL PARAMETERS OF TAPE
2.3 TAPE STRUCTURE
2.4 PHYSICAL RECORDS AND BLOCKS
3. GRID FILE FORMAT
3.1 HEADER RECORD
3.2 DATA RECORDS
TABLES
FIGURES
Australian GeolOgical Survey Organisation
• • • • • • • • • • • • • • • • • • • • • • • • • • • • • • • • • •

• • • • • • • • • • • • • • • • • • • • • • • • • • • • • • • • • •
APPENDIX N·2
AGSO ARCHIVE DATA, GRID AND MAGNETIC TAPE FORMAT FOR AIRBORNE GEOPHYSICAL DATA
1. THE AGSO SEQUENTIAL FILE STRUCTURE
1.1 INTRODUCTION
This appendix describes the general sequential file structure used by AGSO to store airborne geophysical data. For the purpose of this survey ten data chains are involved for each line and tie. They are:
channel 4 edition 1 (processed navigation) channel 4 edition 2 (processed magnetics) channel 4 edition 3 (processed spectrometrics) channel 4 edition 4 (processed digital elevation model) channel 5 edition 1 (doppler) channel 6 edition 1 (raw spectrometrics) channel 8 edition 1 (raw magnetics) channel 10 edition 1 (multi-channel spectra) channel 14 edition 1 (pressure,temperature,cosmic data) channel 16 edition 1 (raw navigation)
1.2 GENERAL FILE STRUCTURE
The information pertaining to each traverse (line or tie) is held on the file as a separate entity called a segment. Segments are separated from each other by industry standard EOF records. The end of the file is indicated by two or more consecutive EOF records. Each segment consists of two types of records. Both types are 5120 characters long.
1. Segment Directory Record (SDR) : the first record on each segment. It defines the data content of the segment.
2. Data Records (DAR's) : hold the measured data values. The general structure is shown in Figure 1.
1.3 CHANNELS AND SAMPLES
Data are recorded at regular intervals in time along a traverse. The data recorded at one instant of time are held as any ordered set or sub-set. Each set is held logically distinct and referred to as a channel. The data records in a segment hold all the information for one channel in the form of a data chain, then all the data for the next channel and so on for as many channels as the segment holds.
Each channel is uniquely defined by a channel number and an edition number. The measurement(s) taken for a channel at a given time is called a sample. Samples are held within each channel in increasing order of fiducial (time).
Australian GeolOgical Survey Organisation

APPENDIXN-3
AGSO ARCHIVE DATA, GRID AND MAGNETIC TAPE FORMAT FOR AIRBORNE GEOPHYSICAL DATA
In defining channels the channel number can be used to define the sample format and the edition type of the data. For example, within AGSO, samples with format (longitude, latitude, value, value .... ) have a channel number of 4 with edition 2 for magnetics and edition 3 for radiometries.
1.4 SEGMENT nmECTORY RECORD (SDR)
Lines and ties are uniquely identified as follows:
1. Project number: a unique number to identify the survey.
2. Group number: a unique number within a survey for each flight made. That is, several lines may be recorded on one flight (group). AGSO convention is for group numbers to lie between 001 and 999 inclusive.
3. Segment numbers : a unique number within a survey for a line or tie. AGSO convention is for ordinary line numbers to lie bewteen 1000 and 9999 inclusive and tie line numbers between 100 and 999 inclusive.
The segment directory record identifies the data segment at Project, Group and Segment level and defines the data channels, their structure and the location of their data chains in the segment. Each SDR consists of one or more 10 word blocks. The first, the Segment Identification Block (Sm), identifies the segment and gives the number of data channels held in the segment.
For this survey the number of data channels is ten as mentioned in the introduction. Subsequent blocks, one for each data channel, define the data channels and their location within the segment. These are called Channel Identification Blocks (Cm's). A typical SDR is shown in Figure 1 and its extact format given in Table 1. All unused words in the SDR are set to zero.
The last word in the record in the past has been used as a check sum and represents the sum of all the other words in the record. The check sum word is no longer used and is set to zero.
The overall record format is 219, 509110, 112.
1.5 DATA RECORD (DAR)
These each contain 512 values. The first two are fiducials giving the fiducial range of the samples contained in the record. The next 508 represent data values, the second last is always zero (to maintain compatability with our random access file format) and the last is a record check sum representing the sum of all other values in the record.
Australian GeolOgical Survey Organisation
• • • • • • • • • • • • • • • • • • • • • • • • • • • • • • • • • •

• • • • • • • • • • • • • • • • • • • • • • • • • • • • • • • • • •
APPENDIX N·4
AGSO ARCHIVE DATA, GRID AND MAGNETIC TAPE FORMAT FOR AIRBORNE GEOPHYSICAL DATA
If a record is the last one in a data chain for a given channel all unused values are set to zero, with the next channel commencing at the start of the next data record. The N data records in a segment are numbered from 2 to N+l, the SDR being regarded as record one in a segment, with records for a given channel following each other sequentially. The data record addresses in the channel identification block of the SDR refer to this sequential numbering of the data records. A typical segment is shown in Figure 1 and the exact format of a data record given in Table 2.
The overall format of each data record is : 219, 509110, I12.
1.6 NO DATA VALUE
For a variety of reasons it is sometimes necessary to flag a data value to indicate it is to be ignored. This is achieved by replacing the data word in question by the value 536870912. If a gap exists in a data chain each word of every sample involved must be replaced by 536870912, the so-called missing value. Thus a 1:1 correspondence is maintained between the fiducials encompassed by a data chain and its samples.
1.7 STANDARD DATA CHANNELS
The standard AGSO data channels are :
channel 4 edition 1 (processed navigation) channel 4 edition 2 (processed magnetics) channel 4 edition 3 (processed spectrometries) channel 4 edition 4 (processed digital elevation model) channel 5 edition 1 (doppler) channel 6 edition 1 (raw spectrometries) channel 8 edition 1 (raw magnetics) channel 10 edition 1 (multi-channel spectra) channel 14 edition 1 (pressure,temperature,cosmic data) channel 16 edition 1 (raw navigation)
C4 El • Navigation Channel number = 4 Edition number = 1 Sample size = 2 words word 1 = Longitude in degrees * 1 000 000 word 2 = Latitude in degrees * 1 000 000
Australian Geological Survey Organisation

APPENDIXN-5
AGSO ARCmvE DATA, GRID AND MAGNETIC TAPE FORMAT FOR AIRBORNE GEOPHYSICAL DATA
C4 E2 • Corrected Total Magnetic Intensity Channel number = 4 Edition number = 2 Sample size = 4 words word 1 and word 2 as for C4 E1 word 3 = final (non micro-levelled) TMI (nT) * 1000 word 4 = final micro-levelled TMI (nT) *1000
C4 E3 • Corrected Gamma-ray Spectrometer Data Channel number = 4 Edition number = 3 Sample size = 7 words word 1 and word 2 as for C4 E 1 word 3 = final Total Count (counts/sec) * 1000 word 4 = final Potassium (counts/sec) * 1000 word 5 = final Uranium (counts/sec) * 1000 word 6 = final Thorium (counts/sec) * 1000 word 7 = Altitude in metres above ground level
C4 E4 . Corrected Digital Elevation Model Data Channel number = 4 Edition number = 2 Sample size = 4 words word 1 and word 2 as for C4 E 1 word 3 = final Aircraft Elevation (metres above sea level) * 100 word 4 = final Terrain Elevation (metres above sea level) * 100
C5 El . Doppler navigation data Channel number = 5 Edition number = 1 Sample size = 2 words word 1 = doppler along track (km) word 2 = doppler across track (m)
C6 El . Raw spectrometer data, Raw VLF data. Channel number = 6 Edition number = 1 Sample size = 7 words word 1 = Total count (counts/sec) * 1000 word 2 = Potassium (counts/sec) * 1000 word 3 = Uranium (counts/sec) * 1000 word 4 = Thorium (counts/sec) * 1000 word 5 = Altitude in metres above ground level word 6 = VLF Total Field (% of primary field) word 7 = VLF Vertical Quadrature (% of primary field)
Australian Geological Survey Organisation
• • • • • • • • • • • • • • • • • • • • • • • • • • • • • • • • • •

• • • • • • • • • • • • • • • • • • • • • • • • • • • • • • • • • •
APPENDIX N·6
AGSO ARCHIVE DATA, GRID AND MAGNETIC TAPE FORMAT FOR AIRBORNE GEOPHYSICAL DATA
C8 El - Raw Magnetics Channel number = 8 Edition number = 1 Sample size = 1 word word 1 = TMI * 1000
CIO El- Multi-channel spectra
Channel number = 10 Edition number = 1 Sample size = 290 words word 1 = start fiducial for spectra word 2 = integration time for spectra (seconds) word 3 - 34 = define energy range of spectra, fiducials etc.
Some control words yet to be defined. word 35 = counts in channel 0 (* 1000) word 36 = counts in channell (* 1000) word 290 = counts in channel 255 (* 1000)
C14 El- Pressure and Temperature Channel number = 14 Edition number = 1 Sample size = 7 words word 1 = pressure in millibars * 10 word 2 = temperature in degrees celsius * 10 word 3 - 6 = no longer used word 7 = cosmic channel (counts) * 1000
CI6 El - Raw GPS data Channel number = 16 Edition number = 1 Sample size = 4 words word 1 = Longitude in degrees * 1 000 000 word 2 = Latitude in degrees * 1 000 000 word 3 = GPS time in seconds * 1000.
GPS time is recorded in seconds from midnight the previous Sunday word 4 = Lag time. Time difference between time when a position is calculated
and time until the next fiducial is generated by the data acquisition system. (hundredths of a second)
2. PHYSICAL FORMAT FOR MAGNETIC TAPES
2.1 GENERAL
Each magnetic tape (MT) consists of a sequence of segments, each segment consisting of one or more physical records. Segments are to be separated by one EOF markers. The end of all information on a tape must be flagged by two or
Australian GeolOgical Survey Organisation

APPENDIXN-7
AGSO ARCHIVE DATA, GRID AND MAGNETIC TAPE FORMAT FOR AIRBORNE GEOPHYSICAL DATA
more consecutive EOF markers. Industry standard EOF records apply. Records are to be fixed length and each block is to contain one record.
2.2 PHYSICAL PARAMETERS OF TAPES
a. Tapes are 12.7 mm (0.5 inch) wide, 9 track industry standard magnetic tapes.
b. Each tape has an external label identifying the airborne survey, character code, recording density, date tape written and the reel number in the set.
2.3 TAPE STRUCTURE
a. 9 track b. Written in ASCII c. Recording density of 6250 bpi d. International Standards Organisation end-of-block markers (EOB) e. International Standards Organisation end-of-file markers (EOF) f. No multi-tape files g. Multi-file tapes can be expected. Files will not span tapes. h. Last file on each tape shall end with at least two EOF's.
2.4 PHYSICAL RECORDS AND BLOCKS
a. Fixed length records of 5120 characters b. One record per block
3. GRID FILE FORMAT
3.1 HEADER RECORD
The first record on the file defines the content of the grid, including:
a. Origin in latitude and longitude. b. Grid cell size. c. Number of rows and columns in the grid. d. Storage mode, i.e. whether the data is stored row by row or column by
column. In general the data is stored by row. e. The exact header record format is in Table 3.
3.2 DATA RECORDS
Each data record contains 320 values in E16.10 format. No location data is held in the data records - the location of a grid point is determined by its
Australian GeolOgical Survey Organisation
• • • • • • • • • • • • • • • • • • • • • • • • • • • • • • • • • •

• • • • • • • • • • • • • • • • • • • • • • • • • • • • • • • • • •
APPENDIX N·8
AGSO ARCHIVE DATA, GRID AND MAGNETIC TAPE FORMAT FOR AIRBORNE GEOPHYSICAL DATA
sequence within the file. The data for the grid may be sequenced in row or column order (i.e. row by row or column by column respectively). Each row or column is written on consecutive records and begins at the start of a new record. If the rows/columns do not contain a multiple of 320 values the last record for each row/column is padded with zeros. Any point in the grid which is undefined is set to -9999.0.
In ROW mode, rows are sequenced from north to south and within each row values are ordered from west to east.
In COLUMN mode, columns are sequenced from west to east and within each column values are ordered from north to south.
Australian Geological Survey Organisation

• APPENDIX N·9 • AGSO ARCHIVE DATA, GRID AND MAGNETIC TAPE FORMAT • FOR AIRBORNE GEOPHYSICAL DATA
• TABLE 1 • SEGMENT DIRECTORY RECORD FORMAT • • 1. SEGMENT IDENTIFICATION BLOCK • WORD CONTENT AND USE FORMAT • 1 PROJECT IDENTIFICATION 19 • 2 GROUP IDENTIFIACTION 19 • 3 SEGMENT IDENTIFICATION no • 4 NUMBER OF CHANNELS ON SEGMENT no 5 DATE CODE - YYMMDD no • 6 FIDUCIAL FACTOR - (fiducial size in seconds) no • 7 TIME OF DAY AT FIDUCIAL ZERO IN SECONDS no • 8 BEARING IN DEGREES (0-359) MEASURED EAST OF NORTH no • 9 ALTITUDE IN METRES ABOVE SEA LEVEL no • 10 GROUND CLEARANCE IN METRES' no • •
2. CHANNEL IDENTIFICATION BLOCK (for the Nth channel) • • WORD CONTENT AND USE FORMAT • 1 CHANNEL CODE no • 2 EDITION NUMBERS no FIDUCIAL INTERVAL BETWEEN SAMPLES no • 3
4 NUMBER OF DATA VALUES (WORDS) PER SAMPLE no • 5 ADDRESS OF FIRST DATA RECORD FOR CHANNEL no • 6 ADDRESS OF LAST SAMPLE IN DATA CHAIN I10 • 7 FIDUCIAL OF FIRST SAMPLE IN DATA CHAIN no • 8 FIDUCIAL OF LAST SAMPLE IN DATA CHAIN no • 9 UNUSED - SET TO ZERO no • 10 UNUSED - SET TO ZERO no
• • • Australian Geological Survey Organisation •

• • • • • • • • • • • • • • • ,. • • • • • • • • • • • • • • • • • •
APPENDIX N·IO
AGSO ARCHIVE DATA, GRID AND MAGNETIC TAPE FORMAT FOR AIRBORNE GEOPHYSICAL DATA
TABLE 2
DATA RECORD FORMAT
WORD CONTENT AND USE FORMAT
1
2
3
4
511
512
FIDUCIAL AT FIRST DATA SAMPLE IN RECORD
FIDUCIAL AT LAST DATA SAMPLE IN RECORD
FIRST WORD OF Fm8T SAMPLE
SECOND WORD OF Fm8T SAMPLE
FIRST WORD OF SECOND SAMPLE
SECOND WORD OF SECOND SAMPLE
ETC
ALWAYSUNUSED-SETTOZERO
ALWAYS UNUSED - SET TO ZERO
NOTE: 1. A data sample can be of any length greater than zero.
2. Each record contains an integral number of samples. This may lead to several unused words at the end of the record which are set to zero.
i.e. If a sample is 7 words long 72 samples will fit in a data record and words 507-510 will be set to zero.
Australian GeolOgical Survey Organisation
19
19
no no
110
110
110
112

• APPENDIXN·ll • AGSO ARCHIVE DATA, GRID AND MAGNETIC TAPE FORMAT • FOR AIRBORNE GEOPHYSICAL DATA
• TABLES • • GRID HEADER RECORD FORMAT • • CHARACTER FIELD FORTRAN CONTENT • POSITION LENGTH FORMAT
1-60 60 6A10 Grid Identification • 61-170 10 11A10 Facts defining data • acquisition/processing 171-180 10 A10 x,y units defining grid, Usually • degrees. 181-192 12 E12.6 x origin of surface. Bottom left hand • corner. • 193-204 12 E12.6 y origin of surface. Bottom left hand
corner. • 205-214 10 A10 Type of z data in grid (e.g. TMI). 215-216 2 A2 Blanks. • 217-228 12 112 Number of data records per column or • row. 229-240 12 E12.6 Grid increment in the x direction • 241-252 12 E12.6 Grid increment in the y direction 253-262 10 A10 Time when original surface created • (hh.mm.ss). • 263-286 24 2A10,A4 Filter used on original z data. 287-310 12 2E12.6 x,y co-ordinate of the bottom left hand • corner of the grid. Same as x,y origin. 311-320 10 A10 Date of creation of surface • (dd/mm/yy). • 321-344 24 2A10,A4 Blanks. 345-368 12 2E12.6 x,y co-ordinate of top right hand • comer of grid. NOTE: these values
• are too large by one grid increment for tapes created prior to 01/06/85. • 369-373 5 15 Number of rows in the grid.
374-378 5 15 Number of columns in the grid. • 379-382 4 A4 Blanks. 383-388 6 A6 Defines if the grid is stored in • column mode (COLUMN) or row • mode (ROW).
389-5120 Blank filled. • • • • Australian Geological Survey Organisation
•