link’n learn: property funds, private equity and real …€™n learn: property funds, private...
TRANSCRIPT
September 2016 Update
Link’n Learn: Property Funds, Private Equity and Real Estate

Speakers
Francesco PiantoniDirector– Strategy, Regulatory and Corporate FinanceDeloitte LuxembourgE: [email protected]: +352 451 453 371
David McCaffreySenior Manager– AuditDeloitte IrelandE: [email protected]: +353 1 417 2983
Rory Brown Manager– AuditDeloitte IrelandE: [email protected]: +353 1 417 5745

Agenda
1
2 RE Strategies
3
Financial Cash Flows & Operations4
Balance Sheet and Profit & Loss examples5
RE from an Investor Perspective6
Fund Structures
Numbers and Trends

Numbers and Trends
© 2016 Link’n Learn Webinars 5
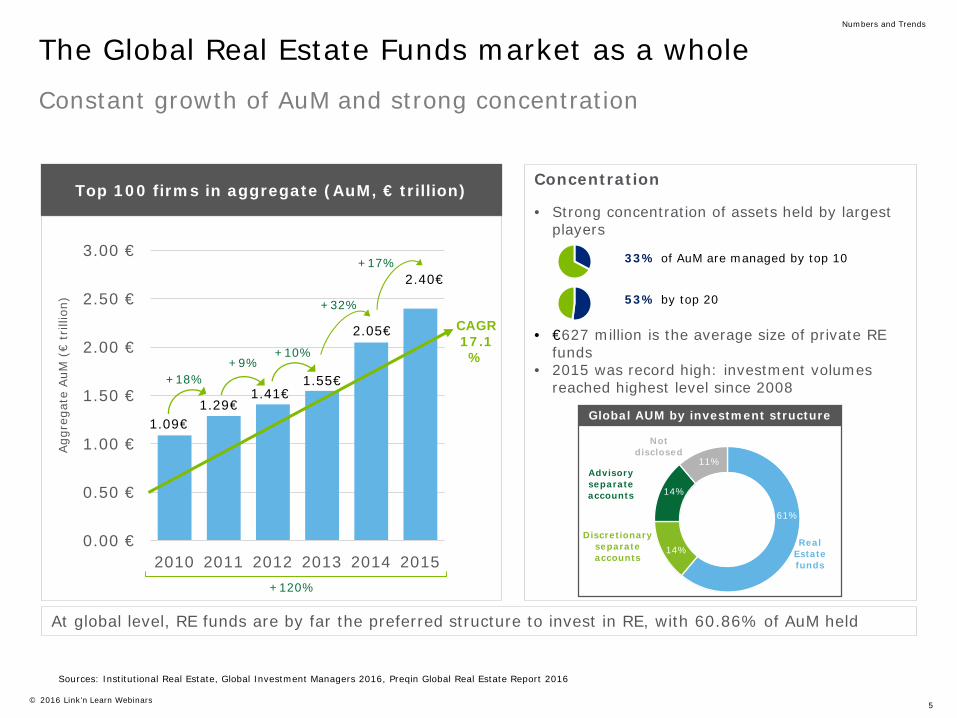
Constant growth of AuM and strong concentration
The Global Real Estate Funds market as a whole
Concentration
• Strong concentration of assets held by largest players
• €627 million is the average size of private RE funds
• 2015 was record high: investment volumes reached highest level since 2008
At global level, RE funds are by far the preferred structure to invest in RE, with 60.86% of AuM held
33% of AuM are managed by top 10
53% by top 20
Sources: Institutional Real Estate, Global Investment Managers 2016, Preqin Global Real Estate Report 2016
0.00 €
0.50 €
1.00 €
1.50 €
2.00 €
2.50 €
3.00 €
2010 2011 2012 2013 2014 2015+120%
Agg
rega
te A
uM(€
trill
ion)
1.09€1.29€
1.41€1.55€
2.40€
2.05€ CAGR17.1%
+18%+9%
+10%
+32%
+17%
Top 100 firms in aggregate (AuM, € trillion)
Real Estate funds
Discretionary separate accounts
Advisory separate accounts
Not disclosed
Global AUM by investment structure
14%
61%
11%
14%
Numbers and Trends
© 2016 Link’n Learn Webinars 6
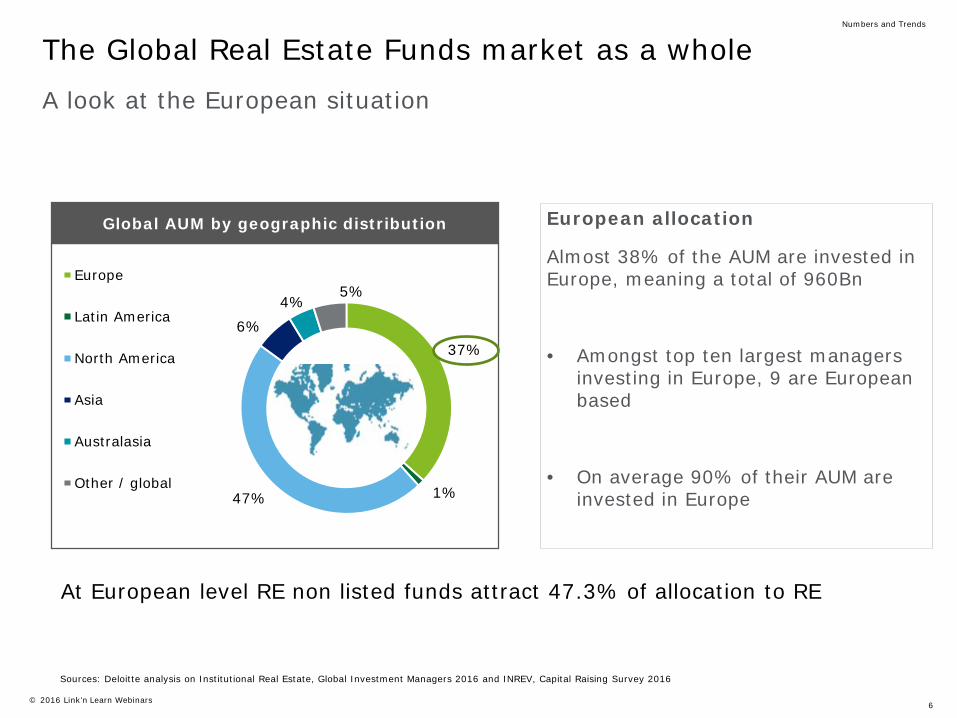
The Global Real Estate Funds market as a wholeA look at the European situation
37%
1%47%
6%4%
5%Europe
Latin America
North America
Asia
Australasia
Other / global
Global AUM by geographic distribution European allocation
Almost 38% of the AUM are invested in Europe, meaning a total of 960Bn
• Amongst top ten largest managers investing in Europe, 9 are European based
• On average 90% of their AUM are invested in Europe
Sources: Deloitte analysis on Institutional Real Estate, Global Investment Managers 2016 and INREV, Capital Raising Survey 2016
At European level RE non listed funds attract 47.3% of allocation to RE
Numbers and Trends

© 2016 Link’n Learn Webinars 7
Real Estate in NumbersLargest Investment managers based on AuM
Source: Institutional Real Estate, Inc – Global Investment Mangers 2016
Global
Rank Investment Manager Europe AuM in €M
Total AuM in €M
1 Swiss Life Asset Managers 62,200.00 62,200.00
2 AXA Investment Managers – Real Assets 59,152.00 62,904.00
3 Aviva Investors 44,120.87 45,719.95
4 Credit Suisse Real Estate Investment Management 42,070.49 45,775.44
5 CBRE Global Investors 41,779.69 82,639.11
6 Deka ImmobilienInvestment/WestInvest 30,961.00 33,173.20
7 The Blackstone Group 29,036.88 135,795.02
8 M&G Real Estate 28,734.61 33,905.48
9 Aberdeen Asset Management 26,143.74 26,289.11
10 TH Real Estate 25,448.80 84,400.49
Rank Investment Manager Total AuM in €M
1 Brookfield Asset Management 137,054.00
2 The Blackstone Group 135,795.02
3 TH Real Estate 84,400.49
4 CBRE Global Investors 82,639.11
5 Hines 82,031.74
6 MetLife Investment Management 75,993.93
7 UBS Asset Management, Global Real Estate 67,259.28
8 AXA Investment Managers – Real Assets 62,904.00
9 Swiss Life Asset Managers 62,200.00
10 J.P. Morgan Asset Management – Global Real Assets 60,071.64
Europe
Numbers and Trends
© 2016 Link’n Learn Webinars 8
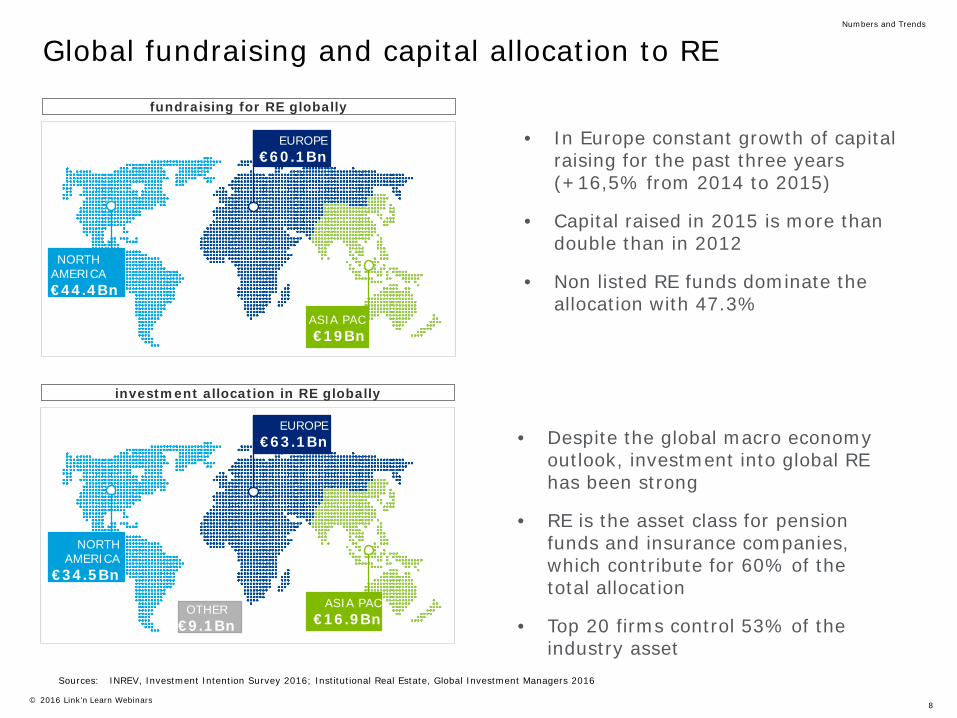
Global fundraising and capital allocation to RE
• In Europe constant growth of capital raising for the past three years (+16,5% from 2014 to 2015)
• Capital raised in 2015 is more than double than in 2012
• Non listed RE funds dominate the allocation with 47.3%
• Despite the global macro economy outlook, investment into global RE has been strong
• RE is the asset class for pension funds and insurance companies, which contribute for 60% of the total allocation
• Top 20 firms control 53% of the industry asset
Sources: INREV, Investment Intention Survey 2016; Institutional Real Estate, Global Investment Managers 2016
Numbers and Trends
EUROPE€60.1Bn
ASIA PAC€19Bn
NORTH AMERICA€44.4Bn
OTHER€13Bn
EUROPE€63.1Bn
ASIA PAC€16.9Bn
NORTH AMERICA
€34.5Bn
AFRICA
0%OTHER
€9.1Bn
fundraising for RE globally
investment allocation in RE globally
© 2016 Link’n Learn Webinars 9
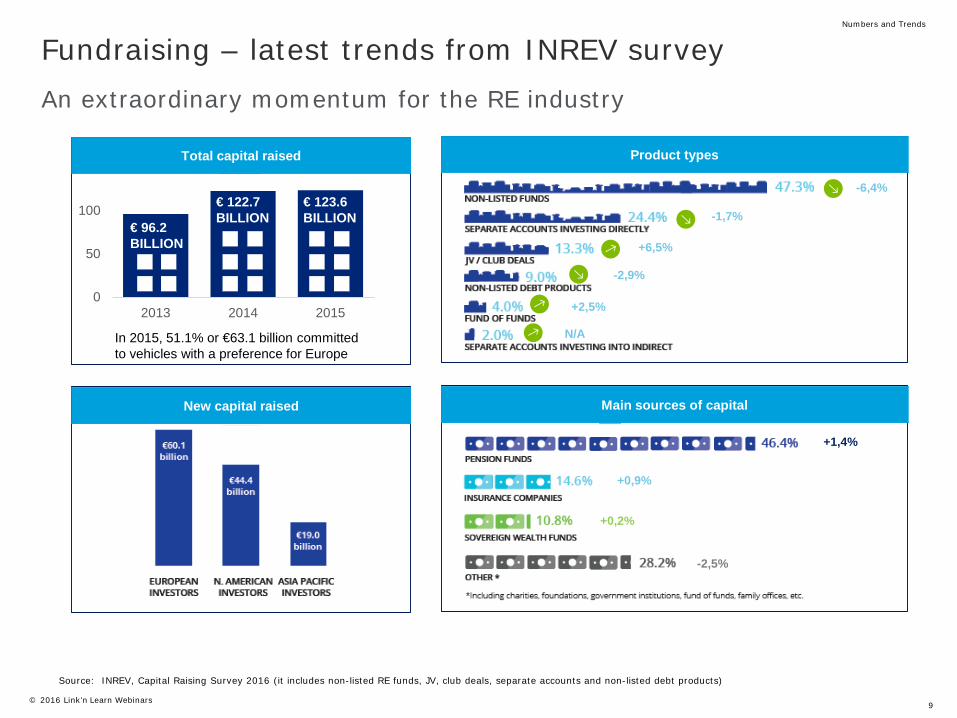
Source: INREV, Capital Raising Survey 2016 (it includes non-listed RE funds, JV, club deals, separate accounts and non-listed debt products)
Fundraising – latest trends from INREV surveyAn extraordinary momentum for the RE industry
In 2015, 51.1% or €63.1 billion committedto vehicles with a preference for Europe
0
50
100
2013 2014 2015
€ 96.2 BILLION
€ 122.7 BILLION
€ 123.6 BILLION
New capital raised Main sources of capital
Product typesTotal capital raised
-6,4%
-1,7%
+6,5%
-2,9%
+2,5%
N/A
+1,4%
+0,9%
+0,2%
-2,5%
Numbers and Trends
© 2016 Link’n Learn Webinars 10
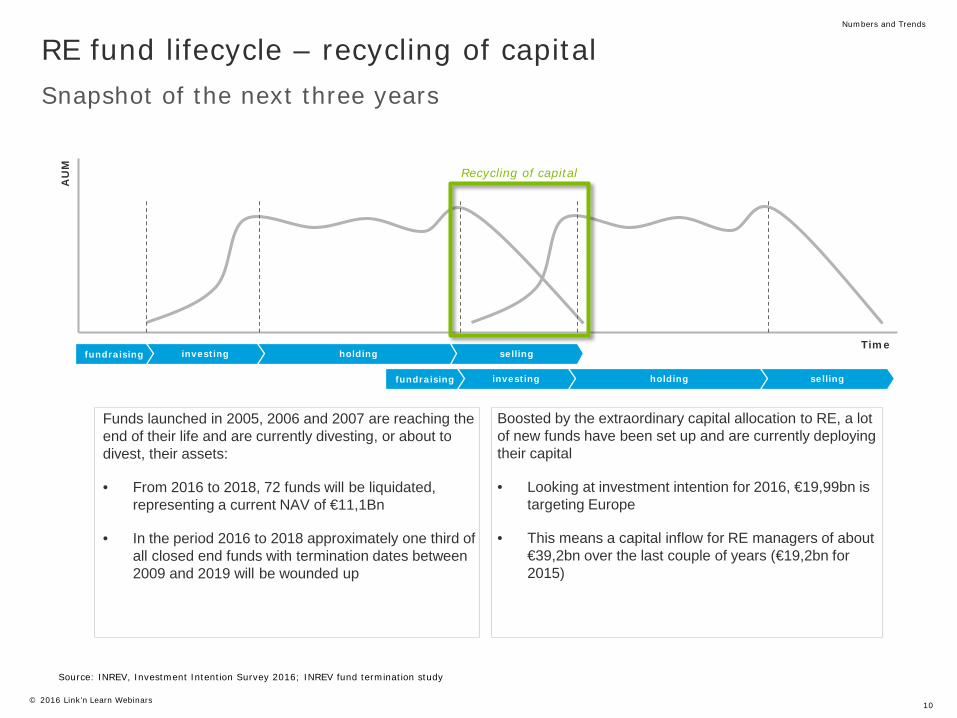
Source: INREV, Investment Intention Survey 2016; INREV fund termination study
RE fund lifecycle – recycling of capital
holding sellingfundraising investing
AU
M
Time
Recycling of capital
Snapshot of the next three years
holding sellingfundraising investing
Funds launched in 2005, 2006 and 2007 are reaching the end of their life and are currently divesting, or about to divest, their assets:
• From 2016 to 2018, 72 funds will be liquidated, representing a current NAV of €11,1Bn
• In the period 2016 to 2018 approximately one third of all closed end funds with termination dates between 2009 and 2019 will be wounded up
Boosted by the extraordinary capital allocation to RE, a lot of new funds have been set up and are currently deploying their capital
• Looking at investment intention for 2016, €19,99bn is targeting Europe
• This means a capital inflow for RE managers of about €39,2bn over the last couple of years (€19,2bn for 2015)
Numbers and Trends

RE Strategies
© 2016 Link’n Learn Webinars 12
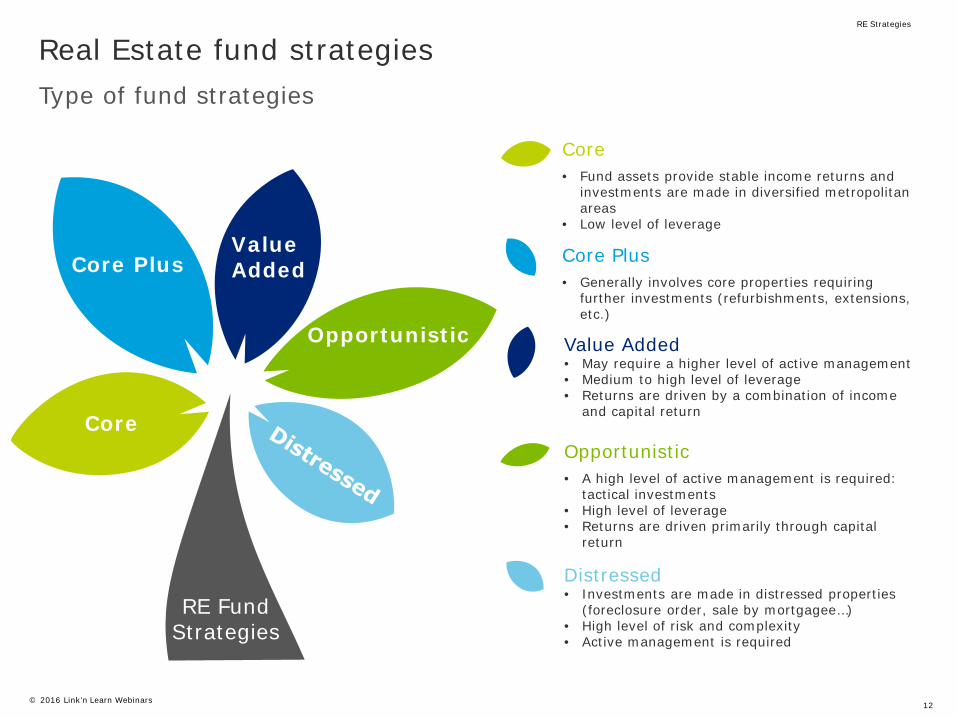
Core• Fund assets provide stable income returns and
investments are made in diversified metropolitan areas
• Low level of leverage
Value Added• May require a higher level of active management • Medium to high level of leverage • Returns are driven by a combination of income
and capital return
Opportunistic• A high level of active management is required:
tactical investments• High level of leverage• Returns are driven primarily through capital
return
Core Plus• Generally involves core properties requiring
further investments (refurbishments, extensions, etc.)
Distressed• Investments are made in distressed properties
(foreclosure order, sale by mortgagee…)• High level of risk and complexity• Active management is required
RE Fund Strategies
Core
Core PlusValue Added
Opportunistic
Real Estate fund strategiesType of fund strategies
RE Strategies
© 2016 Link’n Learn Webinars 13
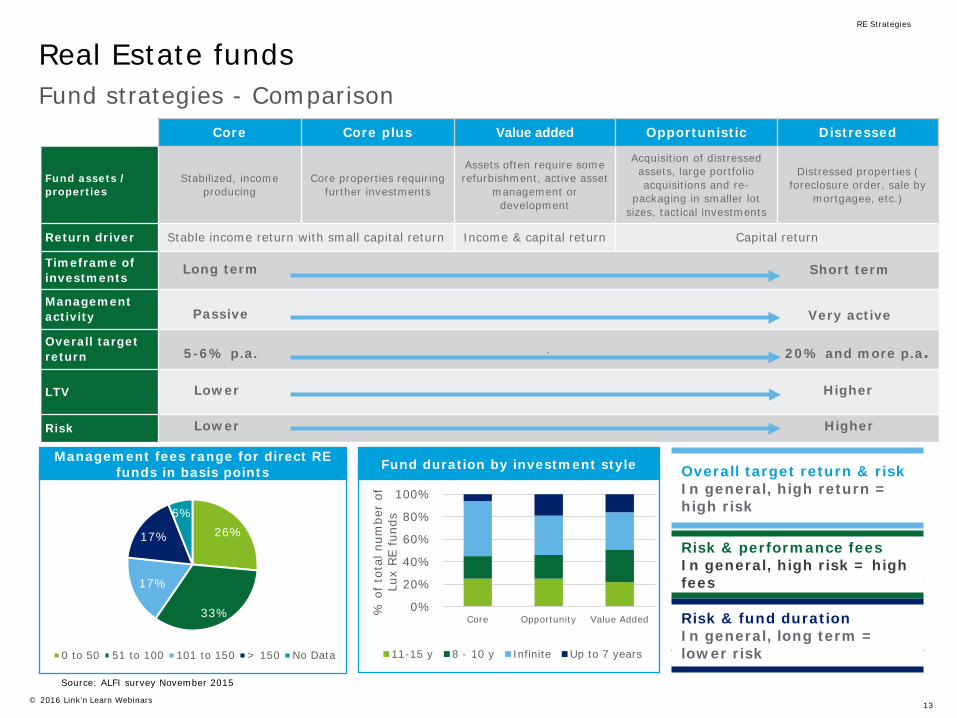
Real Estate fundsFund strategies - Comparison
Core Core plus Value added Opportunistic Distressed
Fund assets / properties
Stabilized, income producing
Core properties requiring further investments
Assets often require some refurbishment, active asset
management or development
Acquisition of distressed assets, large portfolio acquisitions and re-
packaging in smaller lot sizes, tactical investments
Distressed properties ( foreclosure order, sale by
mortgagee, etc.)
Return driver Stable income return with small capital return Income & capital return Capital return
Timeframe of investments
Management activity
Overall target return .
LTV
Risk
20% and more p.a.5-6% p.a.
HigherLower
Short termLong term
Very activePassive
Fund duration by investment style
0%
20%
40%
60%
80%
100%
Core Opportunity Value Added
% o
f to
tal n
umbe
r of
Lu
x RE
fund
s
11-15 y 8 - 10 y Infinite Up to 7 years
Management fees range for direct RE funds in basis points Overall target return & risk
In general, high return = high risk
Risk & performance feesIn general, high risk = high fees
Risk & fund durationIn general, long term = lower risk
Source: ALFI survey November 2015
Lower Higher
26%
33%
17%
17%
6%
0 to 50 51 to 100 101 to 150 > 150 No Data
RE Strategies

Fund Structures
© 2016 Link’n Learn Webinars 15
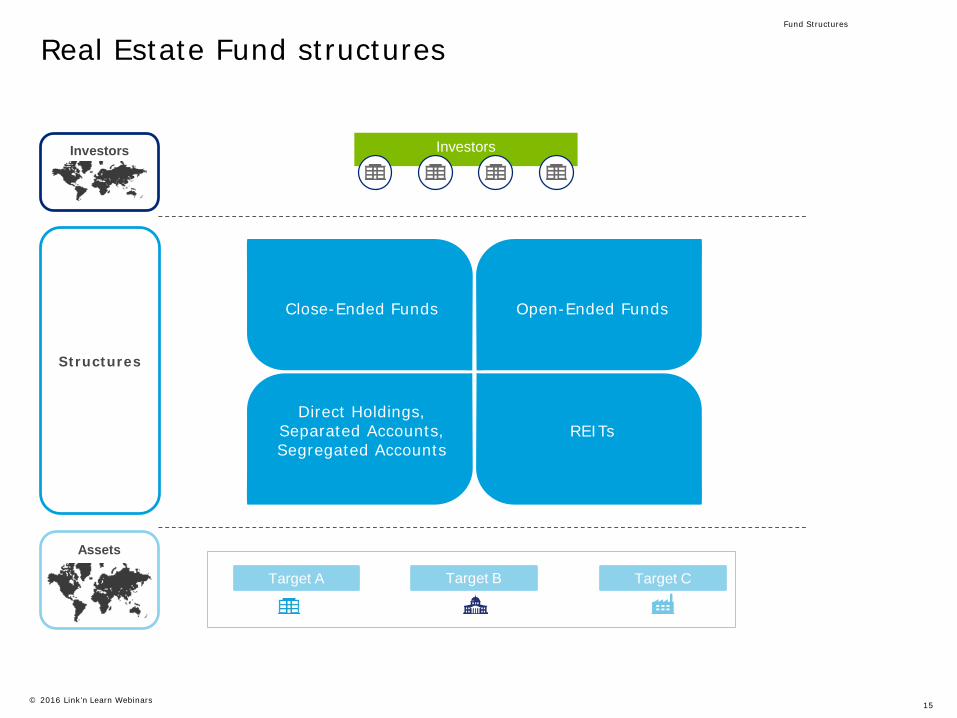
Real Estate Fund structures
Investors
Target BTarget A Target C
Investors
Assets
Structures
Close-Ended Funds Open-Ended Funds
Direct Holdings, Separated Accounts, Segregated Accounts
REITs
Fund Structures

© 2016 Link’n Learn Webinars 16
Close-ended FundFunds set up for a limited period of time: Definite Life
holding sellingfundraising investing
In a Nutshell
• Fund with a fixed life and well defined timeframe to buy and sell assets
• Subscriptions are made for capital commitment which are subsequently drawn up over time
• Redemptions are generally not permitted
Au
M
Fund Manager looks for investors to join the fund through
roadshows and fund marketing
Fund Manager finds investors and starts
to buy assets
Management of the assets according to the strategy of the
fund
Disposal of the assets and
distribution of proceeds
Fund Structures
Time
© 2016 Link’n Learn Webinars 17
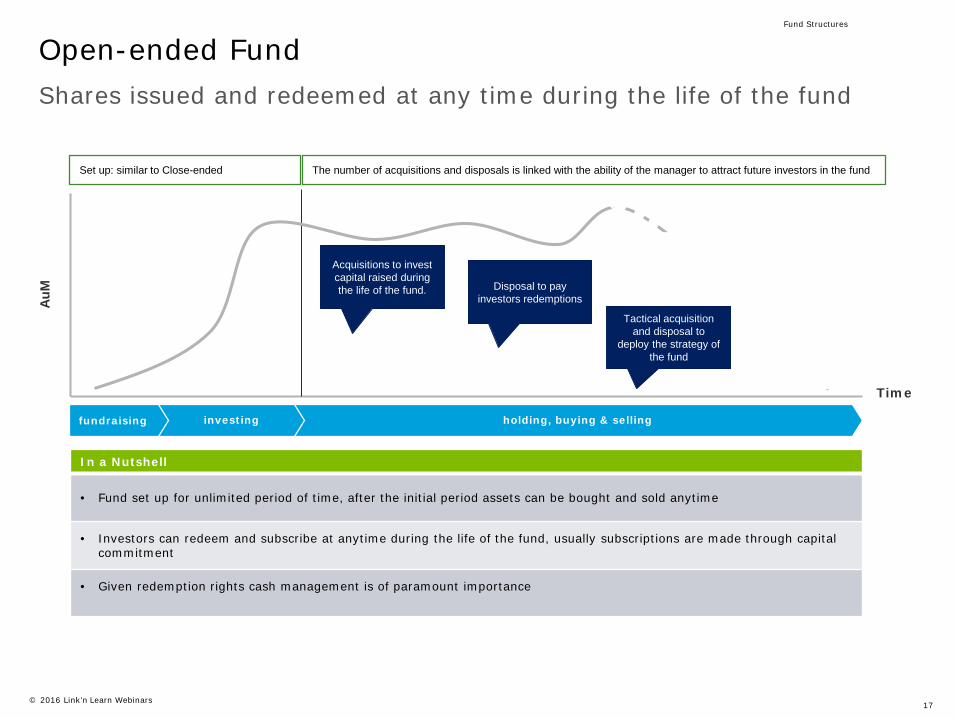
Open-ended FundShares issued and redeemed at any time during the life of the fund
holding, buying & sellingfundraising investing
In a Nutshell
• Fund set up for unlimited period of time, after the initial period assets can be bought and sold anytime
• Investors can redeem and subscribe at anytime during the life of the fund, usually subscriptions are made through capital commitment
• Given redemption rights cash management is of paramount importance
AuM
Set up: similar to Close-ended The number of acquisitions and disposals is linked with the ability of the manager to attract future investors in the fund
Acquisitions to invest capital raised during the life of the fund. Disposal to pay
investors redemptions
Tactical acquisition and disposal to
deploy the strategy of the fund
Fund Structures
Time

© 2016 Link’n Learn Webinars 18
REIT structures
REIT Structures
Transparency of financial reporting
Tax neutral structures
Obligation to distribute the bulk of its rental income
Generally listed and traded on stock
exchanges
REIT legislation prohibits
over-gearing and over-exposure
EPRA Best Practices
Recommendations
Diversified investors
Regulated environment
Fund Structures

Financial Cash Flows & Operations
© 2016 Link’n Learn Webinars 20
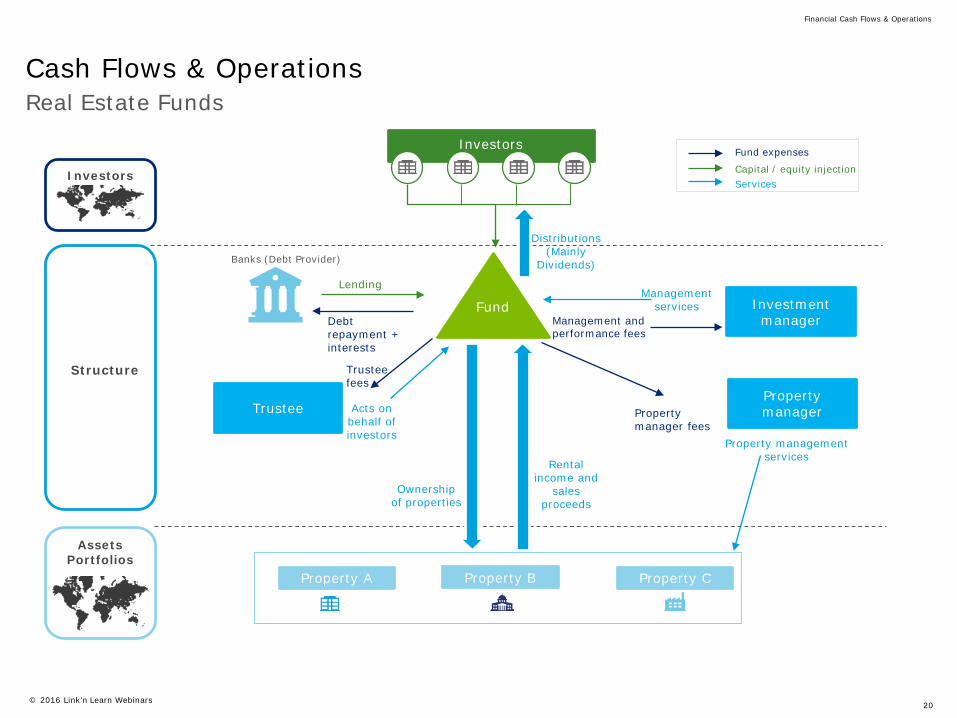
Cash Flows & Operations
Financial Cash Flows & Operations
Real Estate Funds
Investors
Property BProperty A Property C
Investors
Assets Portfolios
Structure
Management and performance fees
Fund Management
servicesDebt repayment + interests
Fund expenses
Capital / equity injectionServices
Banks (Debt Provider)
Investment manager
TrusteeProperty manager
Lending
Property management services
Property manager fees
Trustee fees
Acts on behalf of investors
Ownership of properties
Rental income and
sales proceeds
Distributions (Mainly
Dividends)

Balance Sheet and Profit & Loss examples
© 2016 Link’n Learn Webinars 22
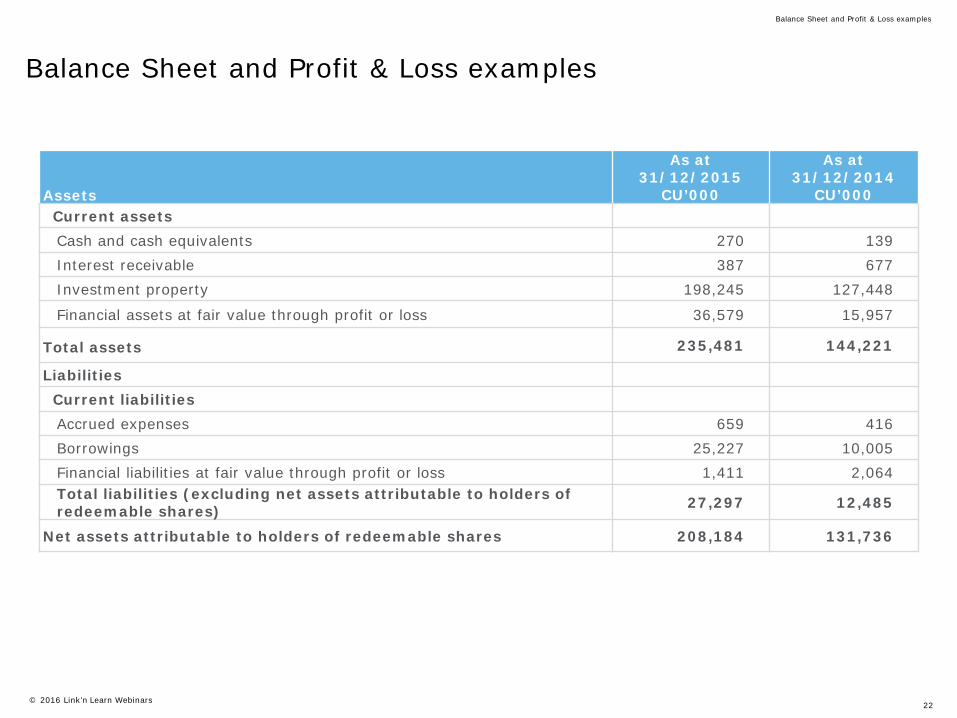
Balance Sheet and Profit & Loss examples
Balance Sheet and Profit & Loss examples
Assets
As at31/12/2015
CU’000
As at31/12/2014
CU’000Current assetsCash and cash equivalents 270 139Interest receivable 387 677Investment property 198,245 127,448
Financial assets at fair value through profit or loss 36,579 15,957
Total assets 235,481 144,221
LiabilitiesCurrent liabilitiesAccrued expenses 659 416Borrowings 25,227 10,005Financial liabilities at fair value through profit or loss 1,411 2,064Total liabilities (excluding net assets attributable to holders of redeemable shares) 27,297 12,485
Net assets attributable to holders of redeemable shares 208,184 131,736

© 2016 Link’n Learn Webinars 23
Balance Sheet and Profit & Loss examples
Balance Sheet and Profit & Loss examples
Year ended31/12/2015
CU’000
Year ended31/12/2014
CU’000Revenue
Rental income 29,521 10,909Net change in unrealized gains/(losses) on financial assets and liabilities
held at fair value through profit or loss 15,741 (4,301)
Fair value movement on investment property 32,993 3,551Total operating income 78,255 10,159Expenses
Management fees (1,998) (2,851)Performance fees (88) (174)Custodian fees (216) (443)Administration fees (138) (76)Transaction costs (107) (321)Professional fees (7) (10)Director’s fees (15) (15)Other expenses (7) (1)Total operating expenses (2,579) (3,893)Operating profit/(loss) 75,679 6,268
Finance costsInterest expense (386) (1,419)
Profit/(loss) after distributions and before tax 75,293 4,849Withholding taxes (87) (60)
Profit/(loss) after distributions and tax 76,058 4,789
Increase/(decrease) in net assets attributable to holders of redeemable shares
75,206 4,789

RE from an Investor Perspective
© 2016 Link’n Learn Webinars 25
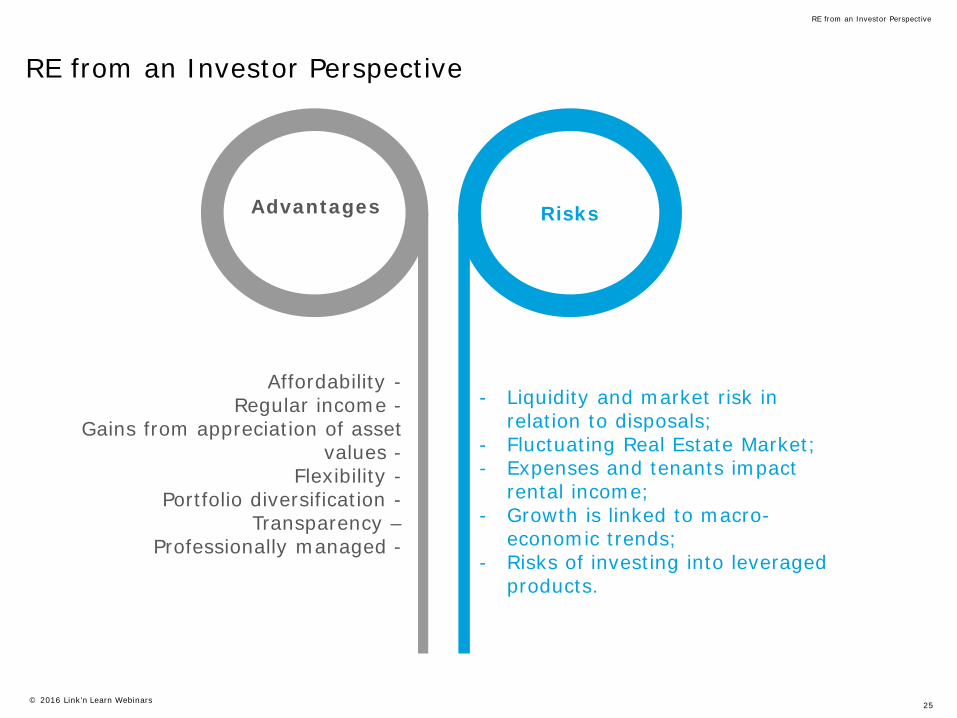
RE from an Investor Perspective
RE from an Investor Perspective
RisksAdvantages
Affordability -Regular income -
Gains from appreciation of asset values -
Flexibility -Portfolio diversification -
Transparency –Professionally managed -
- Liquidity and market risk in relation to disposals;
- Fluctuating Real Estate Market;- Expenses and tenants impact
rental income;- Growth is linked to macro-
economic trends;- Risks of investing into leveraged
products.

© 2016 Link’n Learn Webinars 26
Questions?

Deloitte refers to one or more of Deloitte Touche Tohmatsu Limited, a private company limited byguarantee, and its network of member firms, each of which is a legally separate and independententity. Please see www.deloitte.com/ie/about for a detailed description of the legal structure of DeloitteTouche Tohmatsu Limited and its member firms.
With nearly 2,000 people in Ireland, Deloitte provide audit, tax, consulting, and corporate finance topublic and private clients spanning multiple industries. With a globally connected network of memberfirms in more than 150 countries, Deloitte brings world-class capabilities and high-quality service toclients, delivering the insights they need to address their most complex business challenges. With over210,000 professionals globally, Deloitte is committed to becoming the standard of excellence.
This publication contains general information only, and none of Deloitte Touche Tohmatsu Limited,Deloitte Global Services Limited, Deloitte Global Services Holdings Limited, the Deloitte ToucheTohmatsu Verein, any of their member firms, or any of the foregoing’s affiliates (collectively the“Deloitte Network”) are, by means of this publication, rendering accounting, business, financial,investment, legal, tax, or other professional advice or services. This publication is not a substitute forsuch professional advice or services, nor should it be used as a basis for any decision or action thatmay affect your finances or your business. Before making any decision or taking any action that mayaffect your finances or your business, you should consult a qualified professional adviser. No entity inthe Deloitte Network shall be responsible for any loss whatsoever sustained by any person who relieson this publication.
© 2016 Deloitte. All rights reserved