linking the patterns of change in composition and function in bacterioplankton successions along...
TRANSCRIPT
Ecology, 91(5), 2010, pp. 1466–1476� 2010 by the Ecological Society of America
Linking the patterns of change in composition and functionin bacterioplankton successions along environmental gradients
JEROME COMTE1
AND PAUL A. DEL GIORGIO
Groupe de Recherche Interuniversitaire en Limnologie (GRIL), Departement des Sciences Biologiques, Universite du Quebeca Montreal, CP 8888, Succursale Centre Ville, Montreal, Quebec H3C3P8 Canada
Abstract. The connections that exist between the composition of bacterial communitiesand their functional attributes are still a matter of intense debate, despite over a decade ofintense studies. Here we explored three different facets of the links that may exist betweenbacterioplankton compositional and functional successions that occurred along the water flowpath in a complex watershed in southern Quebec. We analyzed the correlation betweencomposition and function in terms of their absolute patterns, and in terms of their rates ofchange relative to transit time in environmental transitions, and relative to shifts in resourcesalong the same transitions. Our results showed that the absolute patterns in bacterialcommunity composition (BCC, using DGGE [denaturing gradient gel electrophoresis]profiles) and functional capacities (FC, using BIOLOG profiles) were not correlated, butthat the rates of change in BCC and FC along the transitions were strongly correlated to eachother. Further, we observed that the strength and shape of the relationship between thechanges in BCC and FC varied relative to the type and intensity of gradient considered.Collectively, these results showed that BCC and FC are strongly related but in a very dynamicmanner, such that their absolute patterns do not appear to be connected. This in turn suggestsa high level of functional redundancy that occurs both within the existing community and inthe meta-community from which phylotypes are selected to occupy the new niches that arecreated along the transitions.
Key words: bacterial composition; bacterial function; bacterioplankton successions; environmentaltransitions; resource gradients; watershed.
INTRODUCTION
Aquatic bacteria are involved in all key biogeochem-
ical processes, and they play a major role in the trophic
structure in all aquatic ecosystems. The metabolic and
biogeochemical functions of these aquatic bacterial
communities have been the focus of research for many
decades now (Ducklow 2008). More recently, the
widespread application of molecular techniques has
revealed an unsuspected level of genetic diversity within
aquatic prokaryotic communities (Pedros-Alio 2006).
Yet the connections that exist between the various
aspects of microbial diversity and community function
in these aquatic bacterial assemblages have only recently
been explored and are still a matter of intense discussion
(Horner-Devine et al. 2006, Smith 2007, Allison and
Martiny 2008).
The exploration of links between diversity and
function in natural bacterial communities remains a
major challenge because of the extremely high diversity,
functional and metabolic versatility, and complex
structure and regulation of most natural communities.
Laboratory microcosms and experimental systems have
been extensively used to explore these links, and these
involve the manipulation of both the structure of the
bacterial community and the environmental conditions.
Some of these studies have shown evidence of significant
relationships between bacterial diversity and some
aspects of community function (Horner-Devine et al.
2003, Bell et al. 2005), but these results are difficult, if
not impossible, to extrapolate to natural systems.
Studies carried out in natural communities, on the other
hand, have yielded contrasting and inconclusive results,
with evidence for both significant connections between
composition, richness, or diversity with some aspect of
the function of the system (Findlay et al. 2003, Kirch-
man et al. 2004, Reinthaler et al. 2005, Alonso-Saez et
al. 2007, Bertilsson et al. 2007), and many others
reporting weak or no links at all (Langenheder et al.
2005, Findlay and Sinsabaugh 2006).
Regardless of the approach, most studies have
attempted to find direct correlations between composi-
tion and function, the underlying assumption being that
any link, if it exists, must be causal and predicable. The
apparently conflicting results that are found in the
literature suggest in fact that the connections between
composition and functional capacities may only be
expressed at certain temporal and spatial scales and not
in others, and may emerge only under certain environ-
Manuscript received 14 May 2009; revised 11 August 2009;accepted 24 August 2009. Corresponding Editor: B. J. M.Bohannan.
1 E-mail: [email protected]
1466
mental conditions. Further, the nature of the connection
itself may be different from the deterministic type of linkthat is generally assumed.
In previous work, we have shown that the variousaspects of freshwater bacterial community structure,
including composition and functional capacities, presentdifferent levels of ecosystem specificity, and that the
connections between them are often weak and tempo-rally variable (Comte and del Giorgio 2009). In thispaper, we focus on the connections between composition
and functional capacities in freshwater bacterioplanktoncommunities using a broader approach that seeks, on
the one hand, to explore this link over a wide range offreshwater environmental gradients and of temporal and
spatial scales, and on the other, to understand the extentto which the connection may be expressed differently
under varying environmental conditions. We have alsoassessed different facets of the relationship between
composition and function, and not only a direct,deterministic link between them. The experimental
design was based on examining a range of environmen-tal transitions along the water flow path in a complex
watershed in southern Quebec. These transitions variedin their type (i.e., river to lake, lake to wetland), in their
intensity (i.e., the magnitude of change in resources),and in the temporal and spatial scales at which theyoccurred. We have chosen to measure community
profiles of individual C substrate utilization, usingBIOLOG Ecoplates (Garland et al. 2001), as a measure
of functional capacity (FC), because the capacity toutilize organic substrates is at the base of the functioning
of heterotrophic bacterioplankton communities, and allother biogeochemical and ecological functions necessar-
ily depend on the acquisition of C and energy. Bacterialcommunity composition (BCC) was determined using
polymerase chain reaction (PCR)-based denaturinggradient gel electrophoresis (DGGE) profiles. We have
assessed the correlation between the patterns in BCCand FC at the whole watershed scale, and have also
assessed the rates of change of BCC and FC along theseenvironmental transitions and how these rates of change
relate to each other. We further examined how the typeand intensity of environmental gradient experienced bybacteria influence the strength of coupling in the
dynamics of BCC and FC.
MATERIALS AND METHODS
Sampling site and procedure
The study watershed is located 100 km southeast of
Montreal (Quebec, Canada) (45830028.800 N, 73835016.800
W) and has a network of interconnected lakes (ranging
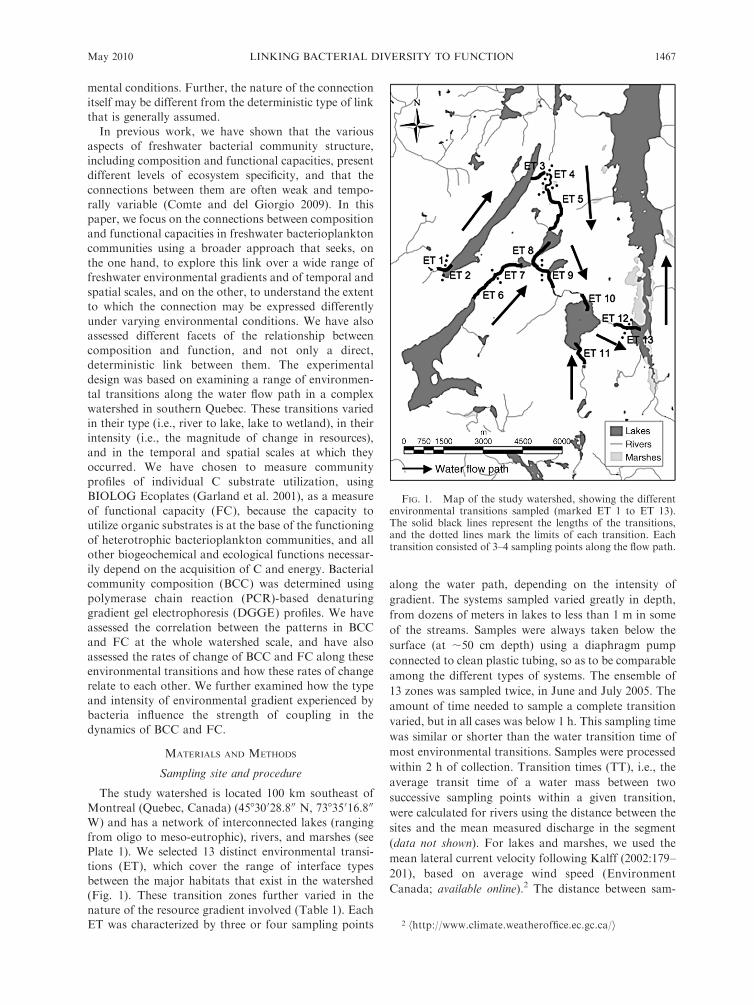
from oligo to meso-eutrophic), rivers, and marshes (seePlate 1). We selected 13 distinct environmental transi-
tions (ET), which cover the range of interface typesbetween the major habitats that exist in the watershed(Fig. 1). These transition zones further varied in the
nature of the resource gradient involved (Table 1). EachET was characterized by three or four sampling points
along the water path, depending on the intensity of
gradient. The systems sampled varied greatly in depth,
from dozens of meters in lakes to less than 1 m in some
of the streams. Samples were always taken below the
surface (at ;50 cm depth) using a diaphragm pump
connected to clean plastic tubing, so as to be comparable
among the different types of systems. The ensemble of
13 zones was sampled twice, in June and July 2005. The
amount of time needed to sample a complete transition
varied, but in all cases was below 1 h. This sampling time
was similar or shorter than the water transition time of
most environmental transitions. Samples were processed
within 2 h of collection. Transition times (TT), i.e., the
average transit time of a water mass between two
successive sampling points within a given transition,
were calculated for rivers using the distance between the
sites and the mean measured discharge in the segment
(data not shown). For lakes and marshes, we used the
mean lateral current velocity following Kalff (2002:179–
201), based on average wind speed (Environment
Canada; available online).2 The distance between sam-
FIG. 1. Map of the study watershed, showing the differentenvironmental transitions sampled (marked ET 1 to ET 13).The solid black lines represent the lengths of the transitions,and the dotted lines mark the limits of each transition. Eachtransition consisted of 3–4 sampling points along the flow path.
2 hhttp://www.climate.weatheroffice.ec.gc.ca/i
May 2010 1467LINKING BACTERIAL DIVERSITY TO FUNCTION
pling sites was determined from digital maps using
ArcGIS software 9.0 (ESRI 2004).
Environmental variables
Concentrations of total phosphorus (TP) and nitro-
gen (TN) were measured by the persulfate digestion
method (Cattaneo and Prairie 1995). Colorimetric
analyses were carried out on a Spectro Ultrospec 2100
Pro spectrophotometer (Biochrom, Cambridge, UK) for
phosphorus and on an Alpkem RFA300 Flow Solution
IV autoanalyzer (OI Analytical, College Station, Texas,
USA) for nitrogen. Concentrations of dissolved organic
carbon (DOC) were measured by high temperature
persulfate oxidation on an OI 1010 TIC/TOC analyzer
(OI Analytical, College Station, Texas, USA), in 0.2-mm
filtered samples. In addition, water color was measured
as absorbance at 440 and 280 nm on a spectrophotom-
eter.
Bacterial community composition
Bacterial community composition (BCC) was deter-
mined by denaturing gradient gel electrophoresis
(DGGE) of the 16S rRNA gene. Details of the method
are given in Comte and del Giorgio (2009). In brief,
samples were extracted by adding successively CTAB
buffer and 0.4% b-ME. The aqueous phase was
extracted twice with equal volume of chloroform/
isoamyl alcohol (24:1), and the resulting aqueous phase
was combined with ½ volume of 5 mol/L NaCl and 1
volume of isopropanol. Precipitated DNA was washed
with 70% ETOH, and resuspended in 25 lL of sterile
water. Six ng of DNA extracts were amplified in 50-lLPCR reactions using the Taq PCR core kit (Qiagen,
Mississauga, Ontario, Canada) and GC clamp-358 F
and 907 rM primers (HPLC purified; Sigma Genosys,
Oakville, Ontario, Canada) using a touchdown cycle.
PCR products (100 ng) were analyzed in 40–65%denaturant gradient gels for 16 h at 100 V and 608C
using a Dcode DGGE machine (Biorad, Mississauga,
Ontario, Canada). Bands were stained (SYBR Gold,
molecular probes) and visualized under ultraviolet
illumination. Gel pictures were analyzed using Quantity
One software (Biorad) by estimating the relative
contribution of each band to the total band signal in
the lane. Bands located in the same position in the
different lanes of the gel were matched and assumed to
be similar populations.
Bacterial functional capacities
We determined carbon substrate utilization profiles
measured using BIOLOG Ecoplates as a measure of
bacterial functional capacities. Details of the methods
are given in Comte and del Giorgio (2009). In brief, the
96-well Ecoplates were inoculated with unfiltered water
samples (125 lL). Immediately upon inoculation, the
zero time-point absorbance of each plate was read at 595
nm. Color development (i.e., utilization of C substrate
from bacteria) was followed using a TECAN Genios
microplate reader (TECAN, Mannedorf, Switzerland)
for 3–7 days until maximum color development was
reached. The overall color development of each plate
was expressed as average well color development
(AWCD), and this was computed each time the plates
were read; we used the absorbance profiles correspond-
ing to the time at which the AWCD was closest to the
reference absorbance of 0.5 AWCD (60.2) (Garland et
al. 2001).
Data processing
The different steps of data processing are summarized
in Fig. 2.
Construction of raw and dissimilarity matrices (Fig. 2,
steps 1–2).—The raw data matrices (Fig. 2, step 1)
consisted of an equal number of rows, representing
individual sampling sites, and a variable number of
columns, representing either the absorbance value for a
TABLE 1. Description of the characteristics of the 13 environmental transitions (ET) in the study watershed (southern Quebec,Canada) sampled during the summer of 2005.
ET TT (h) Length (m)
DOC (mg/L) TP (lg/L) TN (mg/L)
Inlet Output Inlet Output Inlet Output
1 0.1 40.6 3.3 (2.6–3.8) 3.7 (3.2–4.3) 4.4 (4.1–4.6) 8.6 (5.7–10.7) 0.3 (0.3–0.4) 0.4 (0.3–0.5)2 19.2 533.9 3.7 (3.2–4.3) 3.5 (2.2–2.8) 8.6 (5.7–10.7) 1 (0.4–1.3) 0.4 (0.3–0.5) 0.1 (0.1–0.2)3 20 565.1 2.1 (2.1–2.2) 2.8 (2.6–3) 2 (0.9–2.9) 4.7 (2.6–6.3) 0.1 (0.1–0.2) 0.2 (0.16–0.17)4 5.4 153.97 5.7 (4.4–7.9) 5.1 (4.9–5.7) 9.4 (7.1–12) 7.1 (6–8.8) 0.3 (0.2–0.4) 0.3 (0.2–0.3)5 0.8 863.5 5.1 (4.9–5.7) 5.3 (3.9–7.3) 7.1 (6–8.8) 8.9 (7.1–11.5) 0.3 (0.2–0.3) 0.2 (0.2–0.3)6 1 2366.8 4.6 (4.5–4.6) 5 (4.5–5.8) 7.3 (4.1–9) 13 (7.5–18.3) 0.2 (0.2–0.3) 0.4 (0.3–0.5)7 11.9 335.3 5 (4.5–5.8) 6.2 (6.1–6.3) 13 (7.5–18.3) 10 (7.6–13.1) 0.4 (0.3–0.5) 0.3 (0.2–0.3)8 56.4 1597.9 4.6 (4.4–4.7) 5.4 (5.1–5.6) 7.6 (4.2–9.7) 7.8 (3.8–13.7) 0.2 (0.15–0.2) 0.2 (0.17–0.24)9 36.5 1722.5 5.4 (5.1–5.6) 6.4 (5.7–7.2) 7.8 (3.8–13.7) 8.4 (4.4–13.5) 0.2 (0.17–0.24) 0.3 (0.2–0.3)10 21.6 627.4 6 (4.8–7.1) 6 (6–6.1) 9 (6.6–12.9) 5.3 (4.3–7.4) 0.3 (0.2–0.3) 0.2 (0.19–0.22)11 36.5 938.4 10 (9–12) 6.1 (5.7–6.4) 21 (20–22) 6 (4.6–8.1) 0.4 (0.4–0.5) 0.2 (0.2–0.3)12 0.05 94.6 5.9 (5.7–6.1) 6.1 (5.7–6.4) 16 (4.7–32.3) 11 (4.1–19.2) 0.3 (0.2–0.3) 0.2 (0.2–0.3)13 6.27 175 6.1 (5.7–6.4) 6.7� 11 (4.1–19.2) 11 (8.3–12.4) 0.24 (0.2–0.3) 0.3 (0.2–0.3)
Notes: TT represents the water transit time of the transitions, and their length is also provided. DOC, TP, and TN refer toconcentrations of dissolved organic carbon, total phosphorus, and total nitrogen, respectively. All values represent mean values(minimum–maximum range in parentheses), based on three replicates, except ET 13, where there were missing DOC values(denoted by �).
JEROME COMTE AND PAUL A. DEL GIORGIO1468 Ecology, Vol. 91, No. 5
given substrate in the case of the functional capacity
(FC) matrix, and the relative fluorescence of a DGGE
band in the case of the BCC matrix. In order to attain
normality, the raw data were log10-transformed in the
case of the FC matrix, and arcsine-transformed in the
case of the BCC matrix, the latter transformation being
more appropriate for proportion data containing zero
values. Additionally, data were standardized to the
mean and standard deviation to minimize the influence
of extreme values in the calculation of Euclidean
distances. Site dissimilarity matrices based on BCC
and FC were then built with Euclidean distances using
PRIMER 5.2 software (Clarke and Gorley 2001) (Fig. 2,
step 2). We did not combine the data from the two
sampling periods, and we thus generated two separate
BCC and two FC dissimilarity matrices. In addition, we
constructed two resource matrices (one for each month)
with the same sites and where the columns were TP, TN,
DOC, and absorbance at 280 and 440 nm.
Correlation between absolute patterns in BCC and FC
(Fig. 2, step 3).—The site patterns generated by BCC
and FC were analyzed using both multidimentional
scaling and ANOSIM (Primer 5.2). The relationship
between the absolute patterns in BCC and FC was
analyzed using a Procrustes analysis (MATLAB 7.5.0
software; Kendall 1989), which is a modified Mantel test
that finds the best superimposition that maximizes the fit
between two dissimilarity matrices (Peres-Neto and
Jackson 2001). The resulting metric of association (m2)
indicates the correlation (Fig. 2, step 3) between the
dissimilarity matrices, with values between 0 (perfect
correlation between the two) and 1 (no correlation
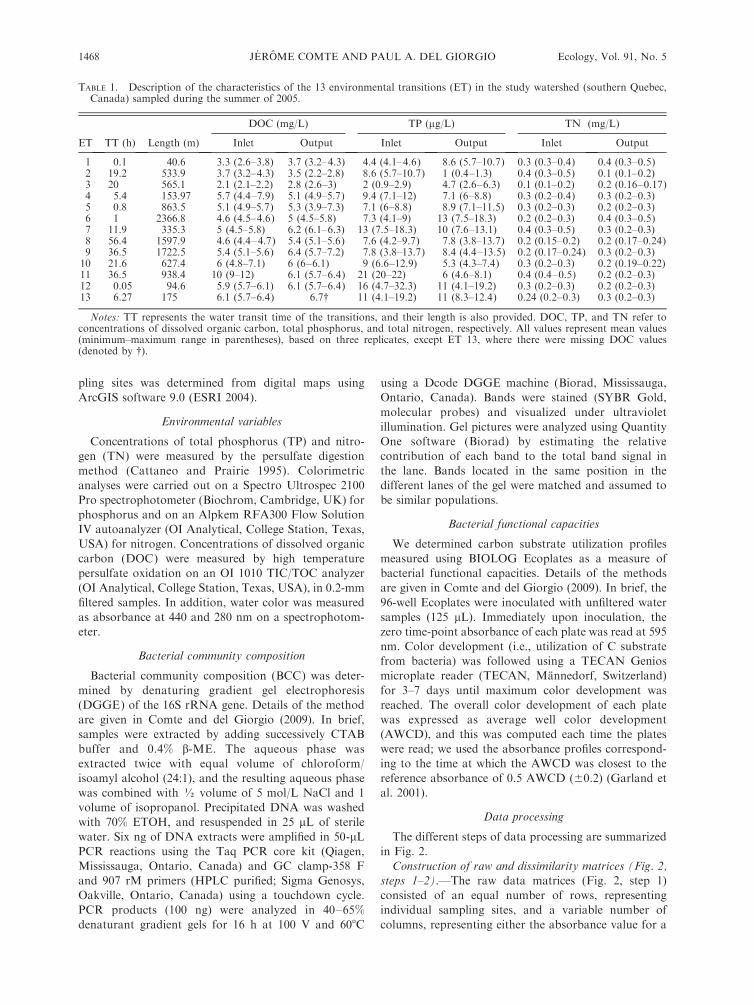
FIG. 2. Schematic of the sequence of data processing and analysis. Step 1: The construction of raw data matrices, where rowscorrespond to individual sampling sites (s), and columns correspond to either the denaturing gradient gel electrophoresis (DGGE)band fluorescence (bacterial community composition [BCC] matrix), BIOLOG absorbance data (functional capacity [FC matrix]),or the chemical (resource matrix) data (v). Step 2: Construction of site dissimilarity matrices (using Euclidean distances) based onDGGE, BIOLOG, and resource data. Step 3: Analysis of the correlation between the site patterns generated by BCC (DGGE) andby FC (BIOLOG), using Procrustes analysis. Step 4: An example of the calculation of rates of change of BCC for an individualtransition (example shown for ET3, June 2005). The dissimilarity values of DGGE (dBCC) and FC (dFC) of successive sitesrelative to the initial sampling site for that particular transition were extracted from the respective dissimilarity matrices and plottedas a function of transit time within the transition (Step 4a), to derive a rate of change in dissimilarity per unit transit time. The rateof change was also calculated as a function of the gradient in resources along the same transition (Step 4b, change in BCC relativeto change in DOC concentration used in this example). Step 5: Analysis of the relationship between rates of change in BCC and FC,as functions of both transit time and the various resource gradients, using least-square regression.
May 2010 1469LINKING BACTERIAL DIVERSITY TO FUNCTION
between the two); the statistical significance of the m2
was set at P ¼ 0.05.Calculation of rate of change of BCC and FC relative to
transition time (TT; Fig. 2, step 4).—For eachenvironmental transition, we estimated the rates of
change in BCC and FC as the increase in dissimilarityalong the transition as a function of transition time
(TT). The first sampling point of each transition wasconsidered as the starting reference; we obtained fromthe matrices described in step 2 the values of dissimilar-
ity of the successive sampling points along the transi-tion, relative to this initial point, and did this for both
BCC and FC (Fig. 2, step 4a). We used the slope of theleast-square regression model of the relationship be-
tween dissimilarity and TT as an estimate of the rate ofchange of BCC (and FC) along each transition. We did
this for each of the 13 transitions zones and for the twosampling periods, potentially generating a total of 26
estimates of rate of change for BCC, FC, and resources,respectively. However, due to missing data in the raw
matrices (resulting from sampling or analytical prob-lems), the actual final number of rate estimates for each
of these categories is lower, ranging from 12 to 17points.
Calculation of rate of change of BCC and FC relative tochanges in resources (Fig. 2, step 4b).—In addition to
estimating the rate of change in BCC and FC relative totransition time, as described in step 4a, we estimated the
rates of change of these two components relative to thechange in resources within each transition zone. To dothis, we used the same values of dissimilarity in BCC or
FC along successive sampling stations, as described instep 2, but we analyzed them not as a function of
transition time, but as a function of the differences inconcentration in TP, TN, and DOC in these same
stations relative also to the reference point. The least-square slope of this regression represents the rate of
change in BCC and FC per unit change in any of theseindividual resources (Fig. 2, step 4b). In addition, we
regressed the dissimilarities in BCC and FC along thetransition as a function of the dissimilarities in the
overall resource matrix, to derive a rate of change inBCC and FC relative to the change in the ensemble of
resources.Relationships between patterns of change in BCC and
FC (Fig. 2, step 5).—The relationship between rates ofchange in BCC and FC were analyzed by least-square
regression using JMP 7.0 software (SAS Institute, Cary,North Carolina, USA). The estimated rates of changewere log10-transformed to attain normality.
RESULTS
Environmental heterogeneity
Bacteria experienced a range of environmental gradi-ents along the water flow path in our study watershed.
For example, in ET 2 and 6, total phosphorus changedmore than in other zones, whereas in ET 8 the gradient
was stronger for DOC (Table 1). In addition, ET 11 was
the only environmental transition that presents the more
drastic changes in all type of resources. In addition, for a
given type of gradient, there was a large spatial and
temporal variability in the intensity of change. For
example, bacteria experienced changes in DOC concen-
trations in a relatively short period of time in ET 5 and
12, whereas ET 9 had a similar total change in DOC but
over a much longer transition period (Table 1).
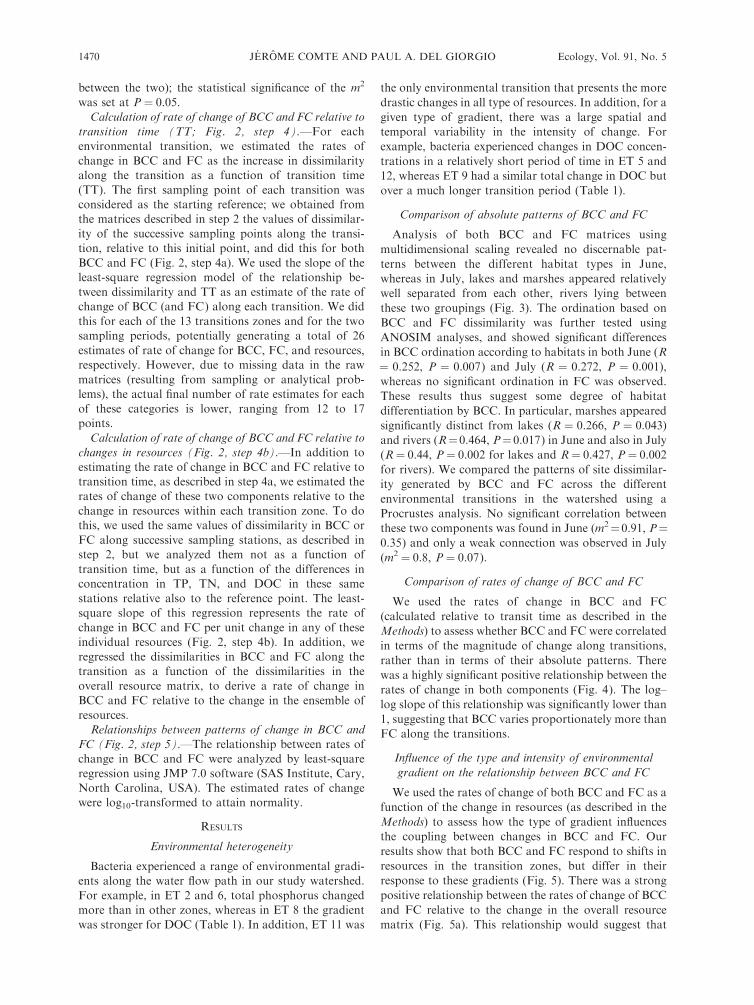
Comparison of absolute patterns of BCC and FC
Analysis of both BCC and FC matrices using
multidimensional scaling revealed no discernable pat-
terns between the different habitat types in June,
whereas in July, lakes and marshes appeared relatively
well separated from each other, rivers lying between
these two groupings (Fig. 3). The ordination based on
BCC and FC dissimilarity was further tested using
ANOSIM analyses, and showed significant differences
in BCC ordination according to habitats in both June (R
¼ 0.252, P ¼ 0.007) and July (R ¼ 0.272, P ¼ 0.001),
whereas no significant ordination in FC was observed.
These results thus suggest some degree of habitat
differentiation by BCC. In particular, marshes appeared
significantly distinct from lakes (R ¼ 0.266, P ¼ 0.043)
and rivers (R¼0.464, P¼0.017) in June and also in July
(R¼ 0.44, P¼ 0.002 for lakes and R¼ 0.427, P¼ 0.002
for rivers). We compared the patterns of site dissimilar-
ity generated by BCC and FC across the different
environmental transitions in the watershed using a
Procrustes analysis. No significant correlation between
these two components was found in June (m2¼ 0.91, P¼0.35) and only a weak connection was observed in July
(m2 ¼ 0.8, P ¼ 0.07).
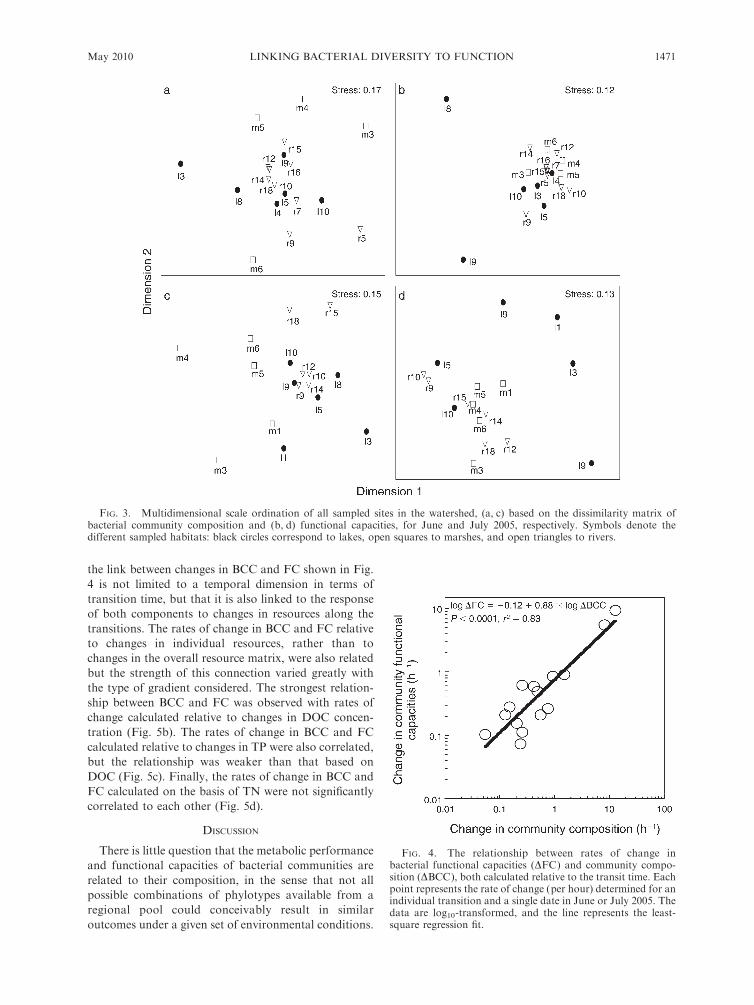
Comparison of rates of change of BCC and FC
We used the rates of change in BCC and FC
(calculated relative to transit time as described in the
Methods) to assess whether BCC and FC were correlated
in terms of the magnitude of change along transitions,
rather than in terms of their absolute patterns. There
was a highly significant positive relationship between the
rates of change in both components (Fig. 4). The log–
log slope of this relationship was significantly lower than
1, suggesting that BCC varies proportionately more than
FC along the transitions.
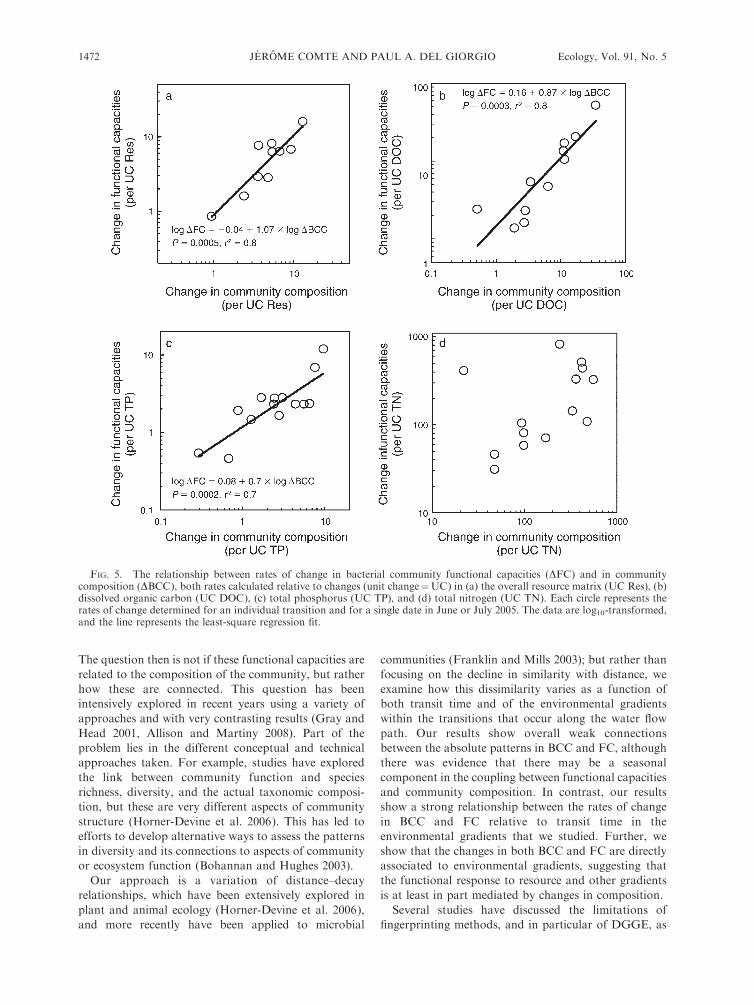
Influence of the type and intensity of environmental
gradient on the relationship between BCC and FC
We used the rates of change of both BCC and FC as a
function of the change in resources (as described in the
Methods) to assess how the type of gradient influences
the coupling between changes in BCC and FC. Our
results show that both BCC and FC respond to shifts in
resources in the transition zones, but differ in their
response to these gradients (Fig. 5). There was a strong
positive relationship between the rates of change of BCC
and FC relative to the change in the overall resource
matrix (Fig. 5a). This relationship would suggest that
JEROME COMTE AND PAUL A. DEL GIORGIO1470 Ecology, Vol. 91, No. 5
the link between changes in BCC and FC shown in Fig.
4 is not limited to a temporal dimension in terms of
transition time, but that it is also linked to the response
of both components to changes in resources along the
transitions. The rates of change in BCC and FC relative
to changes in individual resources, rather than to
changes in the overall resource matrix, were also related
but the strength of this connection varied greatly with
the type of gradient considered. The strongest relation-
ship between BCC and FC was observed with rates of
change calculated relative to changes in DOC concen-
tration (Fig. 5b). The rates of change in BCC and FC
calculated relative to changes in TP were also correlated,
but the relationship was weaker than that based on
DOC (Fig. 5c). Finally, the rates of change in BCC and
FC calculated on the basis of TN were not significantly
correlated to each other (Fig. 5d).
DISCUSSION
There is little question that the metabolic performance
and functional capacities of bacterial communities are
related to their composition, in the sense that not all
possible combinations of phylotypes available from a
regional pool could conceivably result in similar
outcomes under a given set of environmental conditions.
FIG. 4. The relationship between rates of change inbacterial functional capacities (DFC) and community compo-sition (DBCC), both calculated relative to the transit time. Eachpoint represents the rate of change (per hour) determined for anindividual transition and a single date in June or July 2005. Thedata are log10-transformed, and the line represents the least-square regression fit.
FIG. 3. Multidimensional scale ordination of all sampled sites in the watershed, (a, c) based on the dissimilarity matrix ofbacterial community composition and (b, d) functional capacities, for June and July 2005, respectively. Symbols denote thedifferent sampled habitats: black circles correspond to lakes, open squares to marshes, and open triangles to rivers.
May 2010 1471LINKING BACTERIAL DIVERSITY TO FUNCTION
The question then is not if these functional capacities are
related to the composition of the community, but rather
how these are connected. This question has been
intensively explored in recent years using a variety of
approaches and with very contrasting results (Gray and
Head 2001, Allison and Martiny 2008). Part of the
problem lies in the different conceptual and technical
approaches taken. For example, studies have explored
the link between community function and species
richness, diversity, and the actual taxonomic composi-
tion, but these are very different aspects of community
structure (Horner-Devine et al. 2006). This has led to
efforts to develop alternative ways to assess the patterns
in diversity and its connections to aspects of community
or ecosystem function (Bohannan and Hughes 2003).
Our approach is a variation of distance–decay
relationships, which have been extensively explored in
plant and animal ecology (Horner-Devine et al. 2006),
and more recently have been applied to microbial
communities (Franklin and Mills 2003); but rather than
focusing on the decline in similarity with distance, we
examine how this dissimilarity varies as a function of
both transit time and of the environmental gradients
within the transitions that occur along the water flow
path. Our results show overall weak connections
between the absolute patterns in BCC and FC, although
there was evidence that there may be a seasonal
component in the coupling between functional capacities
and community composition. In contrast, our results
show a strong relationship between the rates of change
in BCC and FC relative to transit time in the
environmental gradients that we studied. Further, we
show that the changes in both BCC and FC are directly
associated to environmental gradients, suggesting that
the functional response to resource and other gradients
is at least in part mediated by changes in composition.
Several studies have discussed the limitations of
fingerprinting methods, and in particular of DGGE, as
FIG. 5. The relationship between rates of change in bacterial community functional capacities (DFC) and in communitycomposition (DBCC), both rates calculated relative to changes (unit change¼UC) in (a) the overall resource matrix (UC Res), (b)dissolved organic carbon (UC DOC), (c) total phosphorus (UC TP), and (d) total nitrogen (UC TN). Each circle represents therates of change determined for an individual transition and for a single date in June or July 2005. The data are log10-transformed,and the line represents the least-square regression fit.
JEROME COMTE AND PAUL A. DEL GIORGIO1472 Ecology, Vol. 91, No. 5
descriptors of taxa richness and diversity in natural
microbial communities (Hewson and Fuhrman 2004,
Woodcock et al. 2006, Bent et al. 2007, Blackwood et al.
2007). These molecular techniques inevitably have a
threshold of absolute abundance below which taxa are
not detected (Casamayor et al. 2000, Blackwood et al.
2006); this threshold seems higher for DGGE than for
other fingerprinting methods (Casamayor et al. 2002).
All the evidence suggests that DGGE detects mostly the
numerically dominant taxa in the community (Casa-
mayor et al. 2000, Lindstrom 2000). Other fingerprinting
techniques, such as ARISA and TRFLP appear to have
lower thresholds of detection and typically yield a higher
taxa resolution (Casamayor et al. 2002, Hewson and
Fuhrman 2004, Donavaro et al. 2006), but still have the
same basic limitations. DGGE, as well as the other
fingerprinting techniques, are thus clearly inappropriate
to assess the overall taxa richness in microbial samples,
or to determine overall microbial diversity. However,
the DGGE approach, while admittedly limited in terms
of resolution, does allow for large-scale comparisons of
samples, and targets the taxa that are most likely to be
responsible for a large fraction of the observed ambient
activity (Bernard et al. 2000). In the case of our study,
which focused on linking the changes in bacterial
composition and bulk community function along
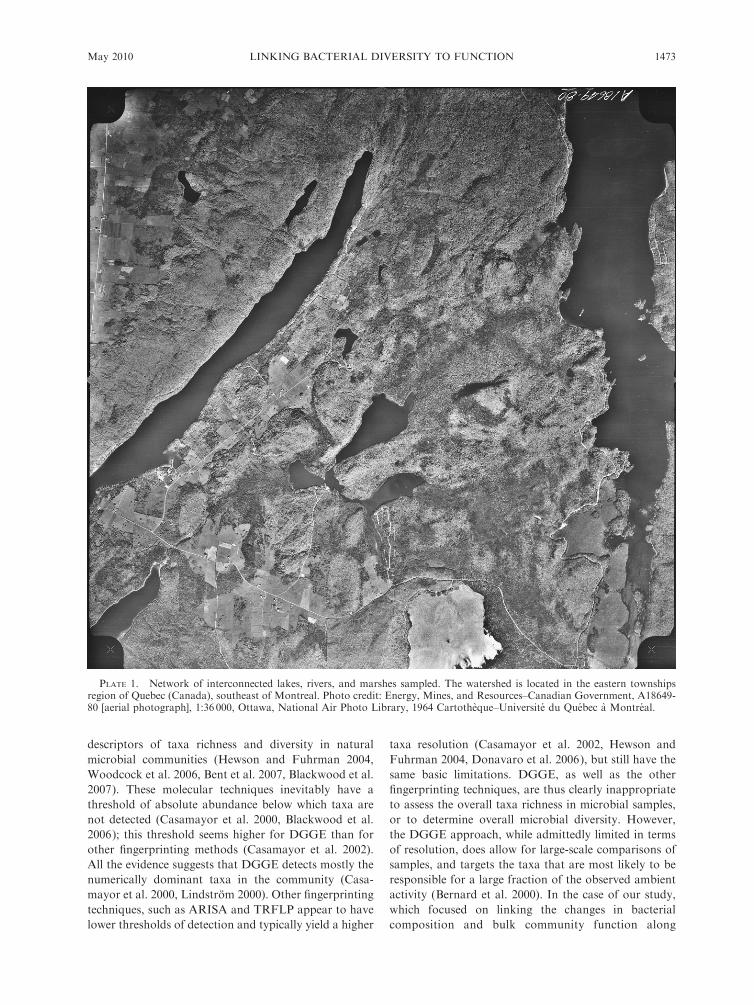
PLATE 1. Network of interconnected lakes, rivers, and marshes sampled. The watershed is located in the eastern townshipsregion of Quebec (Canada), southeast of Montreal. Photo credit: Energy, Mines, and Resources–Canadian Government, A18649-80 [aerial photograph], 1:36 000, Ottawa, National Air Photo Library, 1964 Cartotheque–Universite du Quebec a Montreal.
May 2010 1473LINKING BACTERIAL DIVERSITY TO FUNCTION
gradients, the inclusion of rarer taxa through the use of
more sensitive approaches would have probably not
yielded increased insight into these connections. The
composition matrix we used was based not on presence/
absence of bands (taxa) alone, but rather on their
relative contribution to total community DNA in each
sample. The inclusion of rare and low abundant taxa,
which may vary inconsistently between samples, would
have had either little impact on the actual patterns, or in
fact, could have even weakened the patterns and links
that we found, by adding noise to the community
response signal involving the dominant players.
Likewise, the use of techniques based on substrate
utilization profiles, such as BIOLOG Ecoplates, has
greatly increased in the last decade (reviewed by
Preston-Mafham et al. 2002). Several studies have
discussed the problems related to enrichment and
selection that occur during the incubations, and have
questioned the extent to which the resulting profiles can
be used to characterize natural communities (Konopka
et al. 1998, Preston-Mafhan et al. 2002). It has been
shown that the composition of the community that
develops during these incubations may be very different
to that of the ambient community, and may also differ
between plates (Garland 2000). In addition, the sub-
strates provided in those plates do not necessarily
represent those available or most common in situ
(Garland 2000). Interestingly, in our own experiments
we have consistently noted that replicate plates of the
same sample yield very similar profiles, and that these
profiles remain relatively stable at least over the short- to
medium-term within a given system (data not shown),
suggesting that even though there may be selection and
enrichment of certain taxa during incubation, bacterial
communities from different habitats, or from the same
habitat in time, have very distinct and repeatable
BIOLOG profiles. In this study, we are not assuming
that the substrate utilization profile that we measured
using BIOLOG represents exactly the profile that the in
situ community expressed. Rather, we exploit the fact
that different communities consistently develop distinct
BIOLOG profiles, with the underlying assumption that
these distinct BIOLOG profiles must reflect some
property of the ambient community, in terms of number
and numerical distribution of taxa and metabolic
capabilities in the natural assemblage, which are then
selected for during the BIOLOG incubation.
Previous studies of the connection between microbial
diversity and function have focused on patterns in
species richness, rather than on community composi-
tion, as we have done here. Our analysis shows no
relationship between the number of bands and any of
the patterns we have reported here (data not shown).
This would suggest that, contrary to previous reports
(Horner-Devine et al. 2003, Bell et al. 2005), the
adjustments in function that occur along transitions
are more strongly linked to changes in the identity and
relative distribution of the main players rather than to
changes in the total number of dominant phylotypes.
Our results further suggest a relatively high level of
functional redundancy in these bacterial communities,
which is expressed at two different levels. On the one
hand, we have shown in Fig. 4 that there is a three-order
of magnitude range in rates of change in FC compared to
a four-order of magnitude range in BCC, indicating that
changes in function are associated with proportionally
higher changes in BCC, which suggests a relatively high
degree of functional redundancy within these communi-
ties wherein variations in FC are not proportional to
changes in BCC, especially at low levels of environmen-
tal change. On the other hand, these results would
suggest a high level of redundancy within the regional
meta-community. Our study system represents a net-
work of connected aquatic habitats and their respective
interfaces within a single watershed, therefore charac-
terized by a common regional bacterial meta-community
(Yannarell and Triplett 2005). In previous studies in this
area we have shown that each habitat type within this
network (lakes, rivers, marshes) presents some level of
ecosystem specificity in terms of community composition
(Comte and del Giorgio 2009). Our present work shows
a higher degree of uncoupling between changes in BCC
and FC at low rates of change (Fig. 5b), but that in
transitions with more drastic environmental gradients,
changes in composition and function appear to be more
strongly coupled (Fig. 5a). This would suggest that in
steeper gradients functional adjustments cannot be
carried out within the existing range of capacities (i.e.,
existing functional redundancy) and require changes in
community composition. The lack of significant corre-
lation between the absolute patterns in BCC and FC
would indicate that there are multiple combinations of
phylotypes available from the regional pool that can
fulfill these adjustments and carry out similar functions,
in addition to that which exists within the community at
any given point in time and space.
It is unlikely that dispersal played an important role in
shaping the patterns in composition that we observed
because the study systems are highly interconnected
within a relatively small area. In addition, previous work
in this region has shown no evidence that dispersal
influences lake bacterial community composition (Beis-
ner et al. 2006). Rather, our results point to strong local
environmental forcing and that the gradients within our
watershed further select from within the regional pool of
phylotypes those that can potentially occupy the new
niches that are created along the transitions. The
importance of local factors in determining species
sorting has recently been emphasized (Beisner et al.
2006, Van der Gucht et al. 2007).
In our study, the functional capacities appeared
strongly related to DOC, and whereas the gradient in
DOC appeared to elicit adjustments in function that
were clearly mediated by changes in composition, the
actual configuration of the community was probably
JEROME COMTE AND PAUL A. DEL GIORGIO1474 Ecology, Vol. 91, No. 5
determined not by the DOC gradient itself, but by the
combined influence of other resources and possibly
other physical and biological processes. In this regard,
the slopes of the log–log relationships between BCC and
FC suggest differences in their response to each of the
gradients studied. The slopes based on changes in the
ensemble of resources (Fig. 5a) as well as that based on
DOC concentrations (Fig. 5b) were not significantly
different from unity, suggesting that the changes in BCC
and FC relative to both the overall resource and DOC
gradients are of similar magnitude. However, the slope
of the relationship based on changes in TP is signif-
icantly lower than unity (Fig. 5c), suggesting that BCC is
more responsive to changes in TP. There is thus
indication that the magnitude of change in BCC relative
to changes in TP, for example, was greater than that of
FC, which suggests that phosphorous availability may
play an important role in shaping community compo-
sition beyond any influence of DOC. A corollary of this
would be that while DOC gradients may drive the
adjustments in function (expressed as changes in
substrate uptake capacities), in the context of wide-
spread functional redundancy in terms of C metabolism,
other gradients may act on the species sorting to
determine the final configuration of the community that
attains this adjustment. It has been well established that
bacterial communities respond to changes in quality and
quantity of organic matter (Crump et al. 2003, Eiler et
al. 2003) and nutrients (Lindstrom 2000, Schafer et al.
2001), but how these interact to shape the resulting
configuration of the community remains unclear.
Our results suggest that DOC plays a key role in
shaping these freshwater bacterial successions, and of
modulating the connections between composition and
function. There is evidence that not only the DOC
concentration changes along these transitions, but its
quality as well (F. Guillemette, personal communication)
as the water moves across these interfaces, and thus
bacteria must react to both quantitative and qualitative
changes in organic resources. It is thus not surprising
that DOC appears to be a major regulating factor of the
functional capacities that we chose to examine here,
which are based on substrate consumption profiles.
There are many other functional categories that we
could have potentially examined, related to other types
of functions such as nutrient cycling, the utilization of
various energy pathways, and others. It is likely that
DOC will play a lesser role in shaping the change in
other functional categories, but the main conclusions of
our work probably will still apply.
A scenario of significant functional redundancy both
at the community and meta-community levels in terms
of C utilization, coupled to some degree of specialization
on other environmental requirements, would lead to the
observed covariation in terms of rates of change between
composition and functional capacities, but to the lack of
correlation in their actual absolute patterns. It is clear
from our results then that widespread functional
redundancy does not imply lack of connection between
composition and function, but rather that redundancy
influences how the connection between composition and
function is expressed. Collectively our results show that
while it may be possible to predict the magnitude of
change in bacterioplantkon function and composition
from each other or from the environment, the actual
outcome is much more difficult to constrain. These
results in turn point to the limits of our capacity to
predict aspects of the structure and functioning of
bacterial communities in aquatic ecosystems, and
probably apply to other communities as well.
ACKNOWLEDGMENTS
We thank L. Fauteux, M. Bergevin, and C. Beauchemin fortheir assistance in the field and in laboratory analyses. DOCdata were provided by F. Guillemette. We are grateful to P.Peres-Neto for help with statistical analyses and to Y. Prairieand A. Parkes for stream data. We acknowledge J. M. Gasoland C. Pedros-Alio and two anonymous reviewers for theircomments and input in previous versions of the manuscript.This work was supported by grants from the National Scienceand Engineering Research Council of Canada.
LITERATURE CITED
Allison, S. D., and J. B. H. Martiny. 2008. Resistance,resilience, and redundancy in microbial communities. Pro-ceedings of the National Academy of Sciences (USA) 105:11512–11519.
Alonso-Saez, L., J. Arıstegui, J. Pinhassi, L. Gomez-Con-sarnau, J. M. Gonzalez, D. Vaque, S. Agustı, and J. M.Gasol. 2007. Bacterial assemblage structure and carbonmetabolism along a productivity gradient in the NE AtlanticOcean. Aquatic Microbial Ecology 46:43–53.
Beisner, B. E., P. R. Peres-Neto, E. S. Lindstrom, A. Barnett,and M. L. Longhi. 2006. The role of environmental andspatial processes in structuring lake communities frombacteria to fish. Ecology 87:2985–2991.
Bell, T., J. A. Newman, B. W. Silverman, S. L. Turner, andA. K. Lilley. 2005. The contribution of species richness andcomposition to bacterial services. Nature 436:1157–1160.
Bent, S. J., J. D. Pierson, and L. J. Forney. 2007. Measuringspecies richness based on microbial community fingerprints:the emperor has no clothes. Applied and EnvironmentalMicrobiology 73:2399–2401.
Bernard, L., H. Schafer, F. Joux, C. Courties, G. Muyzer, andP. Lebaron. 2000. Genetic diversity of total, active andculturable marine bacteria in coastal seawater. AquaticMicrobial Ecology 23:1–11.
Bertilsson, S., A. Eiler, A. Nordqvist, and N. O. G. Jørgensen.2007. Links between bacterial production, amino-acidutilization and community composition in productive lakes.ISME Journal 1:532–544.
Blackwood, C. B., D. Hudleston, D. R. Zak, and J. S. Buyer.2007. Interpreting ecological diversity indices applied toterminal restriction fragment length polymorphism data:insights from simulated microbial communities. Applied andEnvironmental Microbiology 73:5276–5283.
Bohannan, B. J. M., and J. Hughes. 2003. New approaches toanalyzing microbial biodiversity data. Current Opinion inMicrobiology 6:282–287.
Casamayor, E. O., R. Massana, S. Benlloch, L. Øvreas, B. Dıez,V. J. Goddard, J. M. Gasol, I. Joint, F. Rodrıguez-Valera,and C. Pedros-Alio. 2002. Changes in archaeal, bacterial andeukaryal assemblages along a salinity gradient by comparisonof genetic fingerprinting methods in a multipond solarsaltern. Environmental Microbiology 4:338–348.
May 2010 1475LINKING BACTERIAL DIVERSITY TO FUNCTION
Casamayor, E. O., H. Schafer, L. Baneras, C. Pedros-Alio, andG. Muyzer. 2000. Identification and spatio-temporal differ-ences between microbial assemblages from two neighboringsulfurous lakes: comparison by microscopy and denaturinggradient gel electrophoresis. Applied and EnvironmentalMicrobiology 66:499–508.
Cattaneo, A., and Y. T. Prairie. 1995. Temporal variability inthe chemical characteristics along the Riviere de l’Achigan:How many samples are necessary to describe streamchemistry? Canadian Journal of Fisheries and AquaticSciences 52:828–835.
Clarke, K. R., and R. N. Gorley. 2001. PRIMER version 5 usermanual tutorial. PRIMER-E, Plymouth, UK.
Comte, J., and P. A. del Giorgio. 2009. Links betweenresources, C metabolism, and the major components ofbacterioplankton community structure across a range offreshwater ecosystems. Environmental Microbiology 11:1704–1716.
Crump, B. C., G. W. Kling, M. Bahr, and J. E. Hobbie. 2003.Bacterioplankton community shifts in an Arctic lakecorrelate with seasonal changes in organic matter source.Applied and Environmental Microbiology 69:2253–2268.
Donavaro, R., G. M. Luna, A. Dell’Anno, and B. Pietrangeli.2006. Comparison of two fingerprinting techniques, terminalrestriction fragment length polymorphism and automatedribosomal intergenic spacer analysis, for determination ofbacterial diversity in aquatic environments. Applied andEnvironmental Microbiology 72:5982–5989.
Ducklow, H. 2008. Microbial services: challenges for microbialecologists in a changing world. Aquatic Microbial Ecology53:13–19.
Eiler, A., S. Langenheder, S. Bertilsson, and L. J. Tranvik.2003. Heterotrophic bacterial growth efficiency and commu-nity structure at different natural organic carbon concentra-tions. Applied and Environmental Microbiology 69:3701–3709.
ESRI (Environmental Systems Resource Institute). 2004.Arcmap 9.0. ESRI, Redlands, California, USA.
Findlay, S. E. G., and R. L. Sinsabaugh. 2006. Large-scalevariation in subsurface stream biofilms: a cross-regionalcomparison of metabolic function and community similarity.Microbial Ecology 52:491–500.
Findlay, S. E. G., R. L. Sinsabaugh, W. V. Sobczak, and M.Hoostal. 2003. Metabolic and structural response of hypo-rheic microbial communities to variations in supply ofdissolved organic matter. Limnology and Oceanography 48:1608–1617.
Franklin, R. B., and A. L. Mills. 2003. Multi-scale variation inspatial heterogeneity for microbial community structure in aneastern Virginia agricultural field. FEMS MicrobiologyEcology 44:335–346.
Garland, J. L. 2000. Potential and limitations of BIOLOG formicrobial community analysis. Pages 521–527 in C. R. B. Belland P. Johnson-Green, editors. Microbial biosystems: newfrontiers. Atlantic Canada Society for Microbial Ecology,Halifax, Nova Scotia, Canada.
Garland, J. L., A. L. Mills, and J. S. Young. 2001. Relativeeffectiveness of kinetic analysis vs single point readings forclassifying environmental samples based on community-levelphysiological profiles (CLPP). Soil Biology and Biochemistry33:1059–1066.
Gray, N. D., and I. M. Head. 2001. Linking genetic identity andfunction in communities of uncultured bacteria. Environ-mental Microbiology 3:481–492.
Hewson, I., and J. A. Fuhrman. 2004. Richness and diversity ofbacterioplankton species along an estuarine gradient inMoreton Bay, Australia. Applied and Environmental Micro-biology 70:3425–3433.
Horner-Devine, M. C., J. Green, and B. J. M. Bohannan. 2006.Patterns in prokaryotic biodiversity. Pages 19–39 in N. A.Logan, H. M. Lappin-Scott, and P. C. F. Oyston, editors.Prokaryotic diversity: mechanisms and significance. Cam-bridge University Press, New York, New York, USA.
Horner-Devine, M. C., M. A. Leibold, V. H. Smith, andB. J. M. Bohannan. 2003. Bacterial diversity patterns along agradient of primary productivity. Ecology Letters 6:613–622.
Kalff, J. 2002. Limnology. Prentice-Hall, Upper Saddle River,New Jersey, USA.
Kendall, D. G. 1989. A survey of the statistical theory of shape.Statistical Science 4:87–99.
Kirchman, D. L., A. I. Ditell, S. E. G. Findlay, and D. Fischer.2004. Changes in bacterial activity and community structurein response to dissolved organic matter in the Hudson River,New York. Aquatic Microbial Ecology 35:243–257.
Konopka, A., L. Oliver, and R. F. Turco. 1998. The use ofcarbon substrate utilization patterns in environmental andecological microbiology. Microbial Ecology 35:103–115.
Langenheder, S., E. S. Lindstrom, and L. J. Tranvik. 2005.Weak coupling between community composition and func-tioning of aquatic bacteria. Limnology and Oceanography50:957–967.
Lindstrom, E. S. 2000. Bacterioplankton community composi-tion in five lakes differing in trophic status and humiccontent. Microbial Ecology 40:104–113.
Pedros-Alio, C. 2006. Marine microbial diversity: can it bedetermined? Trends in Microbiology 14:257–263.
Peres-Neto, P. R., and D. A. Jackson. 2001. How well domultivariate data sets match? The advantages of a Procrus-tean superimposition approach over the Mantel test.Oecologia 129:169–178.
Preston-Mafham, J., L. Boddy, and P. F. Randerson. 2002.Analysis of microbial community functional diversity usingsole-carbon-source utilisation profiles—a critique. FEMSMicrobiology Ecology 42:1–14.
Reinthaler, T., C. Winter, and G. J. Herndl. 2005. Relationshipbetween bacterioplankton richness, respiration, and produc-tion in the southern North Sea. Applied and EnvironmentalMicrobiology 71:2260–2266.
Schafer, H., L. Bernard, C. Courties, P. Lebaron, P. Servais, R.Pukall, E. Stackebrandt, M. Troussellier, T. Guindulain, J.Vives-Rego, and G. Muyzer. 2001. Microbial communitydynamics in Mediterranean nutrient-enriched seawater mes-ocosms: changes in the genetic diversity of bacterialpopulations. FEMS Microbiology Ecology 34:243–253.
Smith, V. H. 2007. Microbial diversity–productivity relation-ships in aquatic ecosystems. FEMS Microbiology Ecology62:181–186.
Van der Gucht, K., et al. 2007. The power of species sorting:local factors drive bacterial community composition over awide range of spatial scales. Proceedings of the NationalAcademy of Sciences (USA) 104:20404–20409.
Woodcock, S., T. P. Curtis, I. M. Head, M. Lunn, and W. T.Sloan. 2006. Taxa–area relationships for microbes: theunsampled and the unseen. Ecology Letters 9:805–812.
Yannarell, A. C., and E. W. Triplett. 2005. Geographic andenvironmental sources of variation in lake bacterial commu-nity composition. Applied Environmental Microbiology 71:227–239.
JEROME COMTE AND PAUL A. DEL GIORGIO1476 Ecology, Vol. 91, No. 5