linking palaeoenvironmental data and models to …everleye/ecosystem dynamics... · 2013-10-18 ·...
TRANSCRIPT
Linking palaeoenvironmental dataand models to understand the pastand to predict the futureN. John Anderson1, Harald Bugmann2, John A. Dearing3 and Marie-Jose Gaillard4
1 Department of Geography, Loughborough University, Loughborough, UK, LE11 3TU2 Forest Ecology, Department of Environmental Sciences, Swiss Federal Institute of Technology Zurich, 8092 Zurich, Switzerland3 Department of Geography, University of Liverpool, Liverpool, UK, L69 7ZT4 Department of Biology and Environmental Sciences, University of Kalmar, SE-39182 Kalmar, Sweden
Review TRENDS in Ecology and Evolution Vol.21 No.12
Complex, process-based dynamic models are used toattempt to mimic the intrinsic variability of the naturalenvironment, ecosystem functioning and, ultimately, topredict future change. Palaeoecological data provide themeans for understanding past ecosystem change andare the main source of information for validating long-term model behaviour. As global ecosystems becomeincreasingly stressed by, for example, climate change,human activities and invasive species, there is an evengreater need to learn from the past and to strengthenlinks between models and palaeoecological data. Usingexamples from terrestrial and aquatic ecosystems, wesuggest that better interactions between modellers andpalaeoecologists can help understand the complexity ofpast changes. With increased synergy between the twoapproaches, there will be a better understanding of pastand present environmental change and, hence, animprovement in our ability to predict future changes.
IntroductionWith the possibility of significant environmental changeoccurring over the coming decades, there is a pressing needto optimise our understanding of ecological change to helpprovide a sound theoretical basis for the sustainable man-agement of ecosystems and for measures adopted byhuman societies to cope with environmental change. Inrecent years, a research agenda has emerged that focuseson the combined use of palaeoenvironmental data drawnfrom environmental archives, such as lake sediments,peat deposits, floodplain stratigraphy and tree-rings,and dynamic simulation models based on mathematicalexpressions for biological and abiotic processes. Severalrecent developments have led to this synergy.
First, recent analyses of instrumental andpalaeoenvironmental records show that anthropogenicdisturbance in the form of global warming, disruption ofnutrient cycles, soil erosion, atmospheric pollution, UVradiation, land-cover change, habitat destruction andspecies invasions, has brought about considerable changeto ecosystems and their rates of change over the past 250years [1]. This has increased the need for models that
Corresponding author: Anderson, N.J. ([email protected]).Available online 26 September 2006.
www.sciencedirect.com 0169-5347/$ – see front matter � 2006 Elsevier Ltd. All rights reserve
produce ecological scenarios over the following years,decades and centuries. Second, the belief that the way inwhich ecosystems respond today might be a legacy of thehistory of the system [2] implies thatmodelling our presentand future will require a starting point in the past. Thus,where relevant timescales are greater than the length oftime over which instrumental data occur, palaeoenviron-mental data usually represent the only means for drivingand testing simulation models. Third, following Deevey’s[3] adage of ‘coaxing history to conduct experiments’, awealth of information about ecological change can begained frommodelling the past to test post hoc hypotheses.Comparing model outputs for the past with palaeoenvir-onmental data can help untangle the relative roles ofmultiple stressors on an ecosystem, for example, climate,human activity and disease on vegetation change [4], orcan help identify the role of internally generated ecologicalchange, for example in aquatic ecosystems [5]. Fourth, theincreased theoretical awareness of the complexity ofecosystems, particularly the likelihood of sudden unanti-cipated responses, has focused attention on the evidencefor nonlinear change contained in palaeoenvironmentaltime series. Such time series not only provide the meansto validate complexity theory, but could be the only way oftesting the ability of dynamic models to simulate rarelyoccurring thresholds.
We highlight here a holistic view of environmentalchange that combines dynamic modelling and palaeoeco-logical methods [6] in a methodological framework wherepalaeoenvironmental reconstruction, hypothesis genera-tion and testing, and model development and validationare linked over a wide range of spatial and temporal scales,and levels of system complexity [7]. The main interactionsbetween modellers and palaeoecologists to date havefocussed on climate per se, especially in terms of usingpalaeoenvironmental records, such as pollen diagrams, asa response to climate forcing [8,9] and, hence, as a palaeo-climate proxy. However, at smaller spatial and temporalscales, particularly during the period of major anthropo-genic activity, models should be able ideally to simulate theinteractions among climate, ecosystems and humanactivities. Therefore, we also summarize the recent devel-opments in simulating the long-term (decades–centuries)
d. doi:10.1016/j.tree.2006.09.005
Box 1. Models of ecological processes and palaeoecological
research
Quantitative models range from simple, static relationships that
represent a ‘black box’ view of relationships between system
variables (e.g. pollen biomass or diatom nutrient transfer functions
[37]), to highly sophisticated, dynamic and ‘mechanistic’
approaches where the rates of change of the variables of the
system (rather than their state) are described; such quantitative
models can therefore be used to study temporal changes in complex
phenomena. A model is a deliberate simplification of reality (‘all
models are wrong, but some models are useful’ [60]) and the
scientific question posed largely determines the value of a given
model. All scientists rely on various forms of models, qualitative or
quantitative. Hence, the common divide between ‘modellers’ and
‘non-modellers’ is inappropriate.
In palaeoecology, a dynamic view of ecological processes is
essential, but difficult because the temporal resolution of
palaeoecological data tends to be relatively low (rarely annual and
hardly ever subannual). In addition, the measured variables often
represent the integrated response of ecosystems or even
landscapes, rather than local-scale variables that are typically
simulated by dynamic models. In this context, dynamic models
that explicitly resolve the key driving variables in a mechanistic
manner have been used successfully to simulate vegetation
dynamics during the Holocene [61]. Most of these studies focused
on forest succession and used forest gap models [62]; four modes of
such applications can be distinguished:
� Model validation: until the 1990s, the major emphasis was on
using pollen data from lake profiles to test the applicability of
models under climatic conditions (e.g. [63–65]). Thus, palaeoeco-
logical data were used in a ‘one-way’ manner to validate
ecological models.
� Projecting the future: model applications have long been used to
provide scenario assessments of the future behaviour of
ecosystems under changing environmental conditions (e.g.
[66,67]). Such an application requires previous model validation
efforts, where palaeoecological data have an important role.
� Synthesizing research findings: models can be used to integrate
and synthesize data across disciplines and even temporal or
spatial scales [68,69]; we are not aware of such applications in the
field of palaeoecology, but believe that such applications hold
much promise.
� Supporting data interpretation: dynamic models can be used to
assist in the interpretation of palaeoecological data by performing
scenario runs to test hypotheses about key driving factors for the
observed palaeo-proxies, such as pollen frequencies or macro-
fossil densities.
Review TRENDS in Ecology and Evolution Vol.21 No.12 697
ecological change at patch, stand, water body andcatchment and/or landscape scales, providing examplesof dynamic models developed for terrestrial and aquaticecosystem communities, and abiotic processes.
Terrestrial systemsChanges in vegetation structure, both natural andanthropogenic-driven, have considerable impact on localand regional climate, hydrology and biogeochemicalcycling. Given the impact of catchment changes on lakeand stream chemistry, and the recent emphasis onintegrated ecosystem science, terrestrial palaeoecologyand modelling are increasingly required to address thecomplexities and consequences of these changes.
Using models to understand vegetation dynamics at
stand–landscape scales
Dynamic models are models that describe the rates ofchange of variables characterizing a system rather thanthe state of the system itself, often by the use of differenceor differential equations. They have been combined suc-cessfully with palaeoecological data since the early 1980s.Whereas the early focus was on model validation (Box 1),attention has since shifted to the application of models forquantitatively evaluating hypotheses of the causes of vege-tation changes inferred from palaeo-records. This hasproved particularly successful for separating the directeffects of climate on vegetation dynamics from those ofnatural disturbances or anthropogenic impacts. Forexample, models have been used to identify periods ofthe past for which climate reconstructions need additionalattention: Hall and McGlone [10] simulated vegetationdynamics for islands of New Zealand for a period in therecent past [700–800 yr before present (BP)] and in the firsthalf of the Holocene (7000–8000 yr BP). They interpreteddeviations between model outputs and palaeoecologicaldata in the more distant period as an indication thatclimatic conditions must have been significantly differentfrom those that are usually assumed to have prevailedat that time.
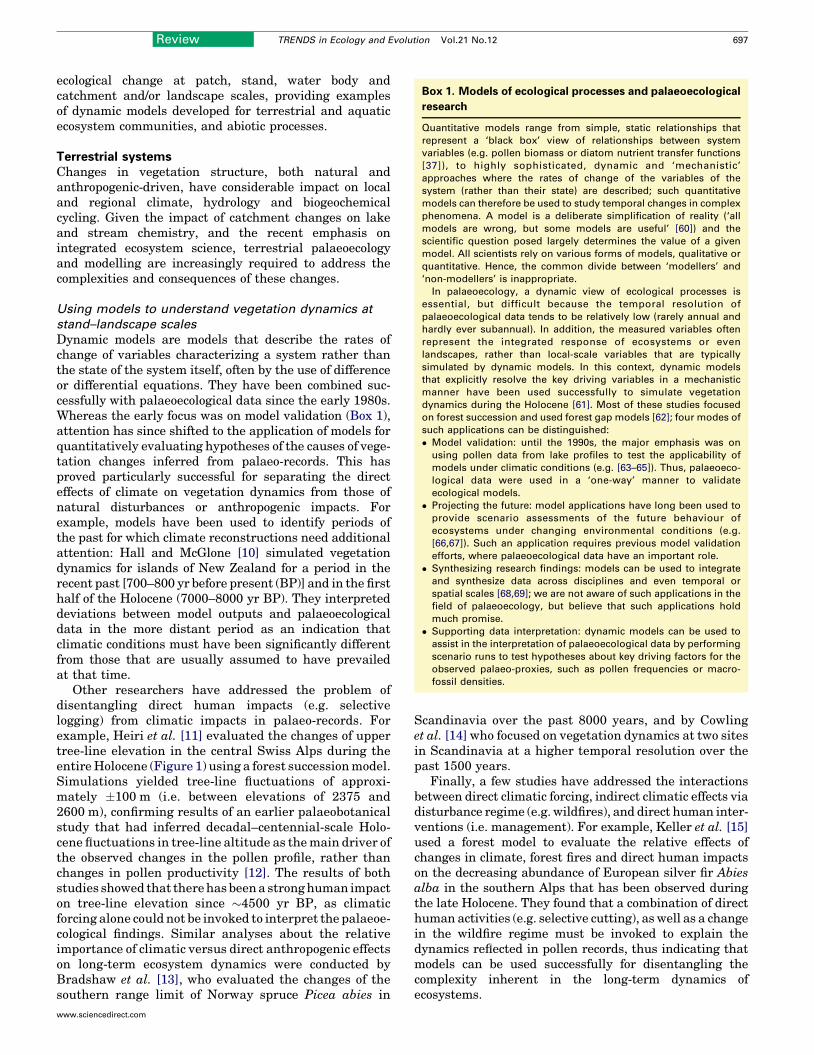
Other researchers have addressed the problem ofdisentangling direct human impacts (e.g. selectivelogging) from climatic impacts in palaeo-records. Forexample, Heiri et al. [11] evaluated the changes of uppertree-line elevation in the central Swiss Alps during theentireHolocene (Figure 1) using a forest successionmodel.Simulations yielded tree-line fluctuations of approxi-mately �100 m (i.e. between elevations of 2375 and2600 m), confirming results of an earlier palaeobotanicalstudy that had inferred decadal–centennial-scale Holo-cene fluctuations in tree-line altitude as themain driver ofthe observed changes in the pollen profile, rather thanchanges in pollen productivity [12]. The results of bothstudies showed that therehas beena stronghuman impacton tree-line elevation since �4500 yr BP, as climaticforcing alone could not be invoked to interpret the palaeoe-cological findings. Similar analyses about the relativeimportance of climatic versus direct anthropogenic effectson long-term ecosystem dynamics were conducted byBradshaw et al. [13], who evaluated the changes of thesouthern range limit of Norway spruce Picea abies in
www.sciencedirect.com
Scandinavia over the past 8000 years, and by Cowlinget al. [14] who focused on vegetation dynamics at two sitesin Scandinavia at a higher temporal resolution over thepast 1500 years.
Finally, a few studies have addressed the interactionsbetween direct climatic forcing, indirect climatic effects viadisturbance regime (e.g. wildfires), and direct human inter-ventions (i.e. management). For example, Keller et al. [15]used a forest model to evaluate the relative effects ofchanges in climate, forest fires and direct human impactson the decreasing abundance of European silver fir Abiesalba in the southern Alps that has been observed duringthe late Holocene. They found that a combination of directhuman activities (e.g. selective cutting), as well as a changein the wildfire regime must be invoked to explain thedynamics reflected in pollen records, thus indicating thatmodels can be used successfully for disentangling thecomplexity inherent in the long-term dynamics ofecosystems.
Figure 1. Alpine tree-line changes. (a) Macrofossil data and (b) simulation results from the FORCLIM model ([72]) for the upper tree-line site Gouille Rion (Valais,
Switzerland, 2350 m a.s.l.). A chironomid-based temperature reconstruction that is independent of vegetation proxies was used to drive the model. The changes in species
composition and tree-line position simulated in this study showed general agreement with palaeobotanical data between 11 000 and 4500 yr BP. In the late Holocene,
however, palaeobotanical evidence indicated a lowering of the tree-line, whereas the simulation projected continuous forest cover up to an altitude of 2400 m a.s.l. Thus,
changes in temperature alone can account for changes in tree-line elevation at this site only for the first half of the Holocene, and the results corroborate palaeoecological
interpretations that there has been strong human influence on Alpine tree-line elevation since at least 4500 yr BP. Modified with permission from [11].
698 Review TRENDS in Ecology and Evolution Vol.21 No.12
Geomorphic and landscape-response models
Palaeoenvironmental records exist for flood frequency andmagnitude, soil erosion, sediment yield, fluxes of carbonand nutrients and macroscale changes in river channels ata variety of spatial scales [16]. Learning about thefunctioning of modern systems from studies of these pastgeomorphic records takes many forms [17,18].
Some attempts have been made to model thesepalaeoenvironmental data in terms of abstract systemsconcepts. For example, Dearing and Zolitschka [19]analysed the magnitude–frequency characteristics of highresolution time series of sediment accumulation in LakeHolzmaar, Germany, and found that the early Holocenefluvial system conformed to a power function model ofself-organized criticality. In this state, most small changesin system behaviour are the result of nonlinear internalprocesses, but these are punctuated by disproportionatelylarge responses to large external forcing. Latercombinations of climate and human impact in thecatchment substantially modified this apparent ‘natural’state, giving rise to more simple relationships betweenerosion, land use and climate.
However,most linkswithmodels are concernedwith thedevelopment, forcing and testing of a steadily increasingnumber of dynamic process-based models [20–22]. Two-dimensional models include hydrological models that aredriven by meteorological time series that compute water,soil or sediment discharge based on basic catchment prop-erties, such as size, relative relief and land-cover change.When compared with regional reconstructions of valleyinfilling throughout the Holocene [23] or high-resolutionlake sediment proxies of flooding over recent centuries [2],
www.sciencedirect.com
they have the potential to unravel climate and humanimpacts on key ecological processes.
Progress in linking data and models for dissolvedinorganic and organic components has been slower.Despite the existence of lake sediment and soil chronose-quence records of Holocene chemical trends (e.g. [24,25]),there have been few attempts to link these with weath-ering models. However, the mineral–weathering modelsPROFILE and SAFE [26,27] show promise in simulatingsoil mineral depletion in observed soil chronosequences,river water-quality data and lake sediment data, althoughfurther success will require better parameterization ofmineral:water contact and dissolved organic carbon(DOC) (John Boyle, pers. commun.). DOC has a major rolein lake functioning and its concentrations can reflect bothnatural climate and anthropogenic forcing. Battarbee et al.[28], comparing MAGIC and diatom models, argue thataltered DOC concentrations over the past 100–150 years[29] might cause MAGIC to overestimate lake water pHbefore 1850.
Three-dimensional models are distributed and spatiallyexplicit within a catchment [30]. Some of the most promis-ing models are based on cellular automata where each cellin a grid of interactive cubic cells across a landscapecontains appropriate rules and equations for simulatinga range of processes. The interaction between cells at eachtime step enables continuous feedback and the develop-ment of emergent phenomena, which are key features ofmodels that seek to capture nonlinear environmentalchange [31]. For example, the CAESAR model [32,33]can generate spatial patterns of sediment movement(e.g. alluvial fans or river morphology) and catchment
Box 2. Reconstructing past vegetation cover
The reconstruction of past terrestrial vegetation and landscape over
long timescales is based on fossil pollen data, although the
quantitative interpretation of pollen data in terms of vegetation
abundance remains a challenge. Among the recent developments in
quantifying pollen–vegetation relationships is the LRA, which uses
mechanistic versions of extended R-value (ERV) models (which
model pollen–vegetation relationships) [53,70].
ERV models take into account the dispersal and deposition
characteristics of pollen grains. LRA applies a mathematically
defined source area of pollen (i.e. the ‘relevant source area of
pollen’ or RSAP [48]). This is the distance from the lake shore (or
coring point in a bog) beyond which the pollen–vegetation
relationship does not improve, (i.e. the distance at which the
relationship is best and, hence, for which reconstruction using the
ERV-models will be most accurate). ERV-models can be illustrated
by Equation I:
PL ¼ DWVA� PPE þ BP [Eqn I]
where PL is pollen loading (i.e. pollen deposited on the surface of a
lake or bog), DWVA is the distance-weighted vegetation abundance
(i.e. plants close to the lake or bog contribute more pollen to the
deposition basin than do plants further away), PPE is the pollen
productivity estimate (i.e. plants produce variable quantities of
pollen per unit area depending on the species), and BP is background
pollen (i.e. a constant quantity and composition of pollen coming
from beyond the RSAP; see above) [48].
One of the most important assumptions of LRA is that, within a
region, there are no significant between-lake differences in pollen
assemblages from large sites (lakes or bogs), whereas there are
significant between-lake differences in pollen assemblages from
small sites. Sugita [51,52] has estimated the size of large lakes to be
�100–500 ha, whereas small lakes are <100 ha, with 1–5 ha being
ideal. Moreover, pollen assemblages in large lakes represent the
regional vegetation, while those in small lakes represent a mixture
of the local vegetation within the relevant source area of pollen and
the regional vegetation beyond that source area, also called
‘background pollen’ [48], as expressed in the ERV-model equation
above. As a result, LRA includes two calibration models to translate
pollen data into plant abundance: REVEALS for inferring regional
plant abundance from pollen assemblages in large sites, and LOVE
for inferring local plant abundance from pollen assemblages in
small sites [50,51].
LRA generates vegetation abundances that can be represented as
pie diagrams for time slices, as shown in Figure 3, main text, for
modern time, or as percentage diagrams (vegetation abundances
plotted against time; M.J.G. et al., unpublished). These figures can
then be used in combination with spatial information from GIS on
soils, geomorphology and human settlements to produce
vegetation maps for various time slices in the past.
Review TRENDS in Ecology and Evolution Vol.21 No.12 699
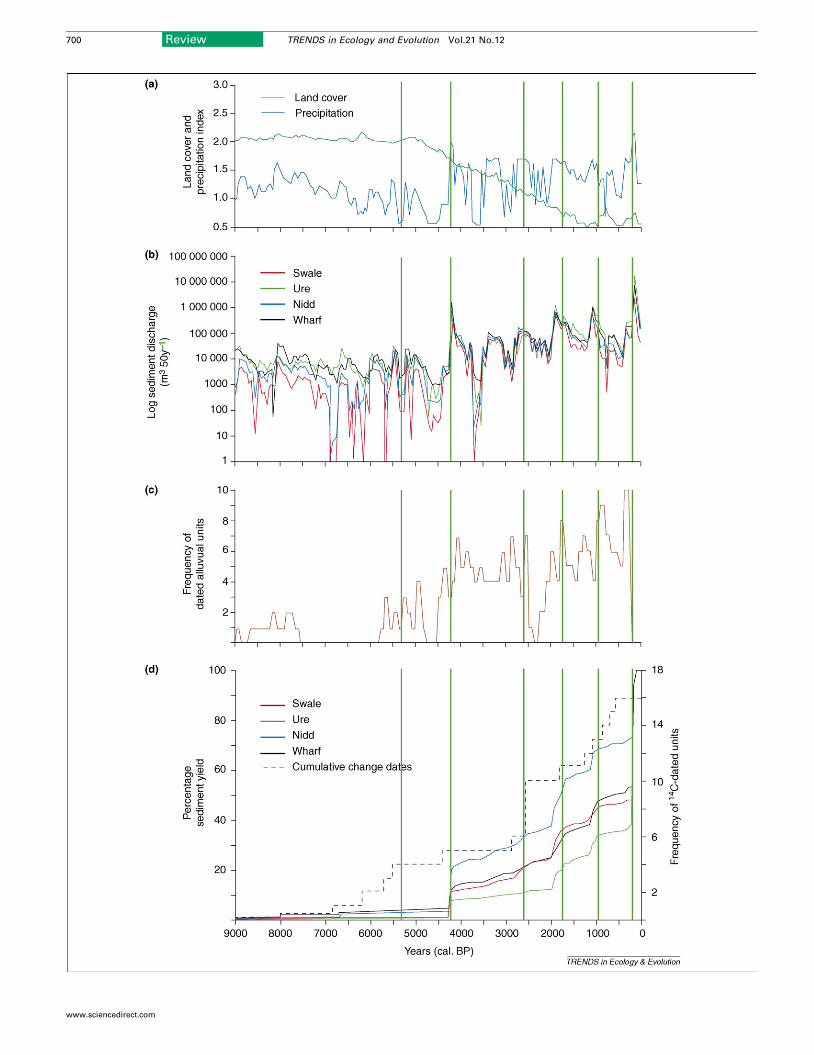
outputs in the form of sediment discharge (Figure 2).Modelled outputs of sediment discharge from four uplandrivers in northern England capture much of the trend anddetail of the regional alluviation history.
Such modelling frameworks could help us to overcomethe constraints imposed by using conventional linearmethods over relatively long time periods. In the future,they might enable a far greater degree of integrationand feedback between the biological and inorganicsubsystems of catchment ecosystems than is currentlypossible.
Lakes and estuariesModels of contemporary lake functioning have focussed onvarious processes related to thermal structure [34], phy-toplankton growth [35] as well as complex, integratedwhole-lake ecosystems [36]. Palaeolimnological data,combined with transfer functions [37], are used to derivequantitative estimates of past pH or phosphorus, andindicate how far a lake is removed from its baseline status[38]. Although the accuracy of any reconstructed valueneeds to be known, the length of the monitoring data setsavailable for validation is currently too short to be able todo this. One way of overcoming this problem is thatdynamic models can be run retrospectively (hindcast)and the output then compared with the palaeolimnologicalreconstructions (Figure 3). The MAGIC model of catch-ment soil and surface water acidity [39] has been usedextensively for hindcasting, where model output has beencompared with diatom-inferred pH [28]; there are discre-pancies, however, which highlight possible processes thathave been overlooked or their importance has changedwith time (e.g. levels of DOC).
Lake sediment records are complex (noisy in astatistical sense) and often show rapid changes. Theprocesses driving these changes can be unambiguous(e.g. anthropogenic eutrophication and acidification) butinterpreting natural changes are problematic as pastprocessesmight be different to those operating today. Evenfor contemporary systems, there is considerable difficultyin trying to disentangle the effects of multiple stressors(e.g. reduced nutrient loading against a background ofchanging climate). Complex interactions, between increas-ing temperatures, changing nutrient availability andpredator–prey relationships, are also observed in manylakes [40], but tend to be overlooked in interpretations ofpalaeolimnological data, which focus instead on one keyprocess (e.g. climate).
For recent time periods, however, the amount ofvariance that can be explained by climate is often smalland illustrates the difficulty of separating climate fromother drivers [41]. Dynamic models, can be used to testthose explanations put forward to explain the varianceobserved in stratigraphic data and offer the possibility ofan improved understanding of past processes. Forexample, although biological change in Arctic lakes isunambiguous [42], the causal mechanism is still unclear[43]. Dynamic models offer the possibility of determiningwhether the changes observed in arctic lakes are due totemperature increases (i.e. in lake heat budgets, ice-freeperiods and intensity of thermal stratification) or to the
www.sciencedirect.com
interaction of climate with other processes. For example,Hamilton et al. [44] applied the DYRESIM model ofstratification, combined with future climate scenariosand increased atmospheric nitrogen loading, to a smalllake and showed that climate warming by itself had noeffect on lake productivity, increased nutrient inputs arenecessary to increase productivity. Thus, there is a clearneed for a combination of modelling, palaeolimnology andlong-term monitoring to provide accurate explanations orpredictions of aquatic system changes [6].
Process-based models of lakes have the advantage thatthey are well-constrained physically, although over longtimescales rapid infilling (and hence shallower waterdepths) can affect their functioning [45]. Estuaries,however, are open-ended, have greater energy inputsand are more dynamic. Although there are linearhydrodynamic models available for coastal estuaries, thenonlinear nature of coastal processes and their change over
700 Review TRENDS in Ecology and Evolution Vol.21 No.12
www.sciencedirect.com
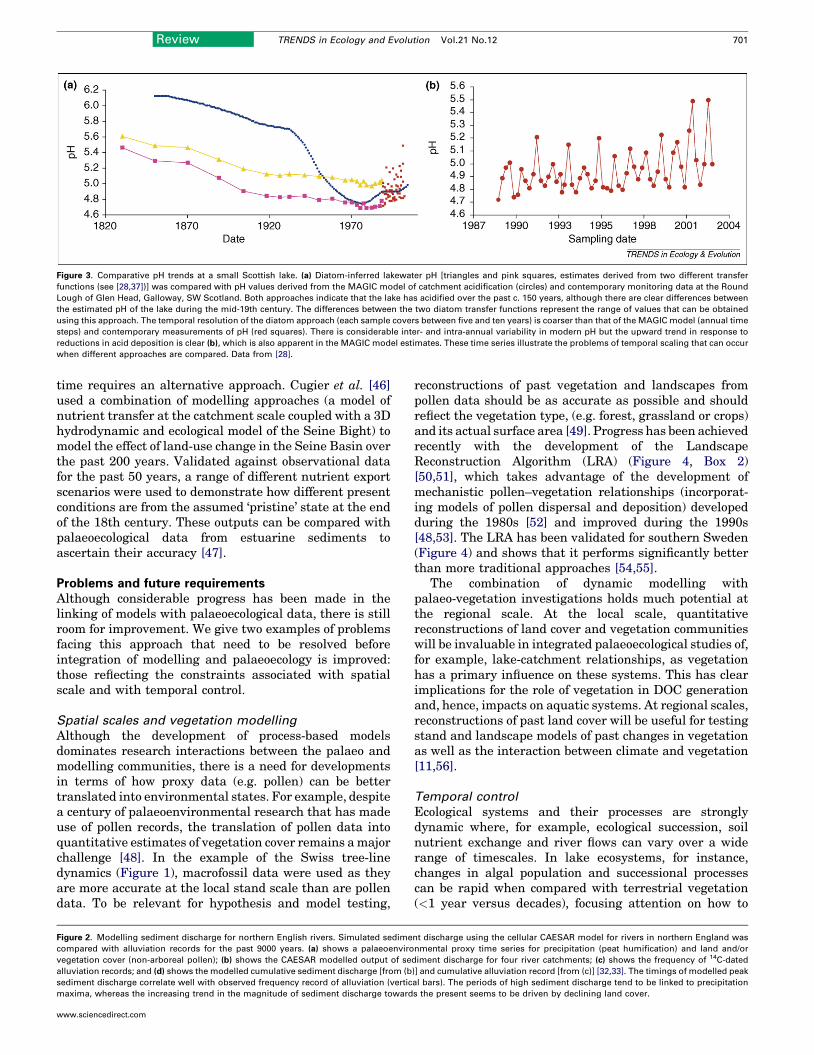
Figure 3. Comparative pH trends at a small Scottish lake. (a) Diatom-inferred lakewater pH [triangles and pink squares, estimates derived from two different transfer
functions (see [28,37])] was compared with pH values derived from the MAGIC model of catchment acidification (circles) and contemporary monitoring data at the Round
Lough of Glen Head, Galloway, SW Scotland. Both approaches indicate that the lake has acidified over the past c. 150 years, although there are clear differences between
the estimated pH of the lake during the mid-19th century. The differences between the two diatom transfer functions represent the range of values that can be obtained
using this approach. The temporal resolution of the diatom approach (each sample covers between five and ten years) is coarser than that of the MAGIC model (annual time
steps) and contemporary measurements of pH (red squares). There is considerable inter- and intra-annual variability in modern pH but the upward trend in response to
reductions in acid deposition is clear (b), which is also apparent in the MAGIC model estimates. These time series illustrate the problems of temporal scaling that can occur
when different approaches are compared. Data from [28].
Review TRENDS in Ecology and Evolution Vol.21 No.12 701
time requires an alternative approach. Cugier et al. [46]used a combination of modelling approaches (a model ofnutrient transfer at the catchment scale coupled with a 3Dhydrodynamic and ecological model of the Seine Bight) tomodel the effect of land-use change in the Seine Basin overthe past 200 years. Validated against observational datafor the past 50 years, a range of different nutrient exportscenarios were used to demonstrate how different presentconditions are from the assumed ‘pristine’ state at the endof the 18th century. These outputs can be compared withpalaeoecological data from estuarine sediments toascertain their accuracy [47].
Problems and future requirementsAlthough considerable progress has been made in thelinking of models with palaeoecological data, there is stillroom for improvement. We give two examples of problemsfacing this approach that need to be resolved beforeintegration of modelling and palaeoecology is improved:those reflecting the constraints associated with spatialscale and with temporal control.
Spatial scales and vegetation modelling
Although the development of process-based modelsdominates research interactions between the palaeo andmodelling communities, there is a need for developmentsin terms of how proxy data (e.g. pollen) can be bettertranslated into environmental states. For example, despitea century of palaeoenvironmental research that has madeuse of pollen records, the translation of pollen data intoquantitative estimates of vegetation cover remains amajorchallenge [48]. In the example of the Swiss tree-linedynamics (Figure 1), macrofossil data were used as theyare more accurate at the local stand scale than are pollendata. To be relevant for hypothesis and model testing,
Figure 2. Modelling sediment discharge for northern English rivers. Simulated sedime
compared with alluviation records for the past 9000 years. (a) shows a palaeoenviro
vegetation cover (non-arboreal pollen); (b) shows the CAESAR modelled output of se
alluviation records; and (d) shows the modelled cumulative sediment discharge [from (b
sediment discharge correlate well with observed frequency record of alluviation (vertic
maxima, whereas the increasing trend in the magnitude of sediment discharge toward
www.sciencedirect.com
reconstructions of past vegetation and landscapes frompollen data should be as accurate as possible and shouldreflect the vegetation type, (e.g. forest, grassland or crops)and its actual surface area [49]. Progress has been achievedrecently with the development of the LandscapeReconstruction Algorithm (LRA) (Figure 4, Box 2)[50,51], which takes advantage of the development ofmechanistic pollen–vegetation relationships (incorporat-ing models of pollen dispersal and deposition) developedduring the 1980s [52] and improved during the 1990s[48,53]. The LRA has been validated for southern Sweden(Figure 4) and shows that it performs significantly betterthan more traditional approaches [54,55].
The combination of dynamic modelling withpalaeo-vegetation investigations holds much potential atthe regional scale. At the local scale, quantitativereconstructions of land cover and vegetation communitieswill be invaluable in integrated palaeoecological studies of,for example, lake-catchment relationships, as vegetationhas a primary influence on these systems. This has clearimplications for the role of vegetation in DOC generationand, hence, impacts on aquatic systems. At regional scales,reconstructions of past land cover will be useful for testingstand and landscape models of past changes in vegetationas well as the interaction between climate and vegetation[11,56].
Temporal control
Ecological systems and their processes are stronglydynamic where, for example, ecological succession, soilnutrient exchange and river flows can vary over a widerange of timescales. In lake ecosystems, for instance,changes in algal population and successional processescan be rapid when compared with terrestrial vegetation(<1 year versus decades), focusing attention on how to
nt discharge using the cellular CAESAR model for rivers in northern England was
nmental proxy time series for precipitation (peat humification) and land and/or
diment discharge for four river catchments; (c) shows the frequency of 14C-dated
)] and cumulative alluviation record [from (c)] [32,33]. The timings of modelled peak
al bars). The periods of high sediment discharge tend to be linked to precipitation
s the present seems to be driven by declining land cover.
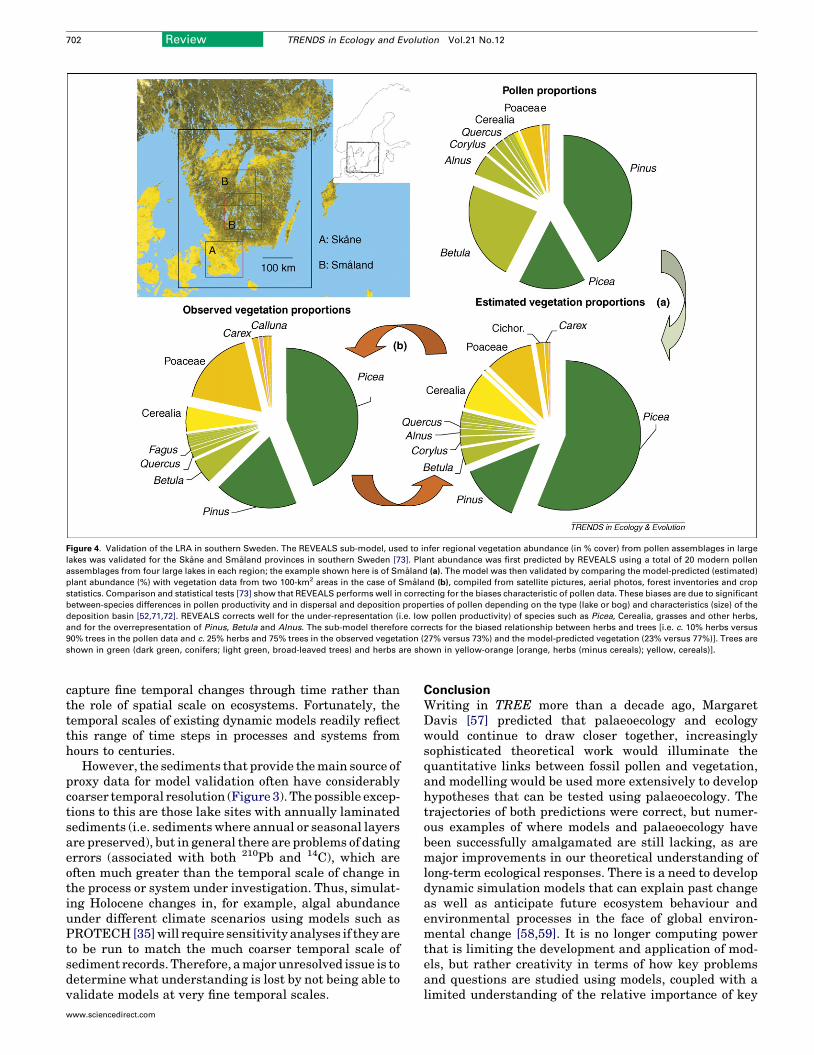
Figure 4. Validation of the LRA in southern Sweden. The REVEALS sub-model, used to infer regional vegetation abundance (in % cover) from pollen assemblages in large
lakes was validated for the Skane and Smaland provinces in southern Sweden [73]. Plant abundance was first predicted by REVEALS using a total of 20 modern pollen
assemblages from four large lakes in each region; the example shown here is of Smaland (a). The model was then validated by comparing the model-predicted (estimated)
plant abundance (%) with vegetation data from two 100-km2 areas in the case of Smaland (b), compiled from satellite pictures, aerial photos, forest inventories and crop
statistics. Comparison and statistical tests [73] show that REVEALS performs well in correcting for the biases characteristic of pollen data. These biases are due to significant
between-species differences in pollen productivity and in dispersal and deposition properties of pollen depending on the type (lake or bog) and characteristics (size) of the
deposition basin [52,71,72]. REVEALS corrects well for the under-representation (i.e. low pollen productivity) of species such as Picea, Cerealia, grasses and other herbs,
and for the overrepresentation of Pinus, Betula and Alnus. The sub-model therefore corrects for the biased relationship between herbs and trees [i.e. c. 10% herbs versus
90% trees in the pollen data and c. 25% herbs and 75% trees in the observed vegetation (27% versus 73%) and the model-predicted vegetation (23% versus 77%)]. Trees are
shown in green (dark green, conifers; light green, broad-leaved trees) and herbs are shown in yellow-orange [orange, herbs (minus cereals); yellow, cereals)].
702 Review TRENDS in Ecology and Evolution Vol.21 No.12
capture fine temporal changes through time rather thanthe role of spatial scale on ecosystems. Fortunately, thetemporal scales of existing dynamic models readily reflectthis range of time steps in processes and systems fromhours to centuries.
However, the sediments that provide themain source ofproxy data for model validation often have considerablycoarser temporal resolution (Figure 3). The possible excep-tions to this are those lake sites with annually laminatedsediments (i.e. sediments where annual or seasonal layersare preserved), but in general there are problems of datingerrors (associated with both 210Pb and 14C), which areoften much greater than the temporal scale of change inthe process or system under investigation. Thus, simulat-ing Holocene changes in, for example, algal abundanceunder different climate scenarios using models such asPROTECH [35]will require sensitivity analyses if they areto be run to match the much coarser temporal scale ofsediment records. Therefore, amajor unresolved issue is todetermine what understanding is lost by not being able tovalidate models at very fine temporal scales.
www.sciencedirect.com
ConclusionWriting in TREE more than a decade ago, MargaretDavis [57] predicted that palaeoecology and ecologywould continue to draw closer together, increasinglysophisticated theoretical work would illuminate thequantitative links between fossil pollen and vegetation,and modelling would be used more extensively to develophypotheses that can be tested using palaeoecology. Thetrajectories of both predictions were correct, but numer-ous examples of where models and palaeoecology havebeen successfully amalgamated are still lacking, as aremajor improvements in our theoretical understanding oflong-term ecological responses. There is a need to developdynamic simulation models that can explain past changeas well as anticipate future ecosystem behaviour andenvironmental processes in the face of global environ-mental change [58,59]. It is no longer computing powerthat is limiting the development and application of mod-els, but rather creativity in terms of how key problemsand questions are studied using models, coupled with alimited understanding of the relative importance of key
Review TRENDS in Ecology and Evolution Vol.21 No.12 703
ecological processes and the restrictions on data that areavailable for their parameterization.
AcknowledgementsThe authors acknowledge discussions with other colleagues at a recentworkshop held in Buellton, California, for the IGBP-PAGES Focus 5Programme ‘Past Ecological Processes and Human-EnvironmentInteractions’. M.J.G. thanks Shinya Sugita, Anna Brostrom and SofieHellman for discussions and access to unpublished data, and the fundingagencies VR (Swedish Research Council) and Nordforsk (the NordicResearch Council). We are grateful to Steve Juggins for assistance withFigure 3 and the anonymous reviewers for comments.
References1 Steffen, W. et al., eds (2004) Global Change and the Earth System: A
Planet under Pressure, Springer-Verlag2 Foster, G.C. et al. (2003) Meteorological and land use controls on past
and present hydro-geomorphic processes in the pre-alpineenvironment: an integrated lake-catchment study at the Petit Lacd’Annecy, France. Hydrol. Proc. 17, 3287–3305
3 Deveey, E.S. (1969) Coaxing history to conduct experiments.BioScience 19, 40–43
4 Tinner,W. et al. (2003) Climatic change and contemporaneous land-usephases north and south of the Alps 2300 BC to 800 AD. Quat. Sci. Rev.22, 1447–1460
5 Scheffer, M. and Carpenter, S.R. (2003) Catastrophic regime shiftsin ecosystems: linking theory to observation. Trends Ecol. Evol. 18,648–656
6 Battarbee, R.W. et al. (2005) Combining palaeolimnological andlimnological approaches in assessing lake ecosystem response tonutrient reduction. Freshw. Biol. 50, 1772–1780
7 Kitchell, J.F. et al. (1988) Epistemology, experimentation andpragmatism. In Complex Interactions in Lake Communities(Carpenter, S.R., ed.), pp. 263–280, Springer Verlag
8 Brovkin, V. et al. (2003) Stability analysis of the climate-vegetationsystem in the northern high latitudes. Clim. Change 57, 119–138
9 Claussen, M. et al. (2003) Simulated global-scale response of theclimate system to Dansgaard/Oeschger and Heinrich events. Clim.Dyn. 21, 361–370
10 Hall, G.M.J. and McGlone, M.S. (2001) Forest reconstruction and pastclimatic estimates for a deforested region of south-eastern NewZealand. Landscape Ecol. 16, 501–521
11 Heiri, C. et al. (2006) A model-based reconstruction of Holocenetree-line dynamics in the Central Swiss Alps. J. Ecol. 94, 206–216
12 Tinner, W. and Theurillat, J.P. (2003) Uppermost limit, extent, andfluctuations of the timberline and tree-line ecocline in the SwissCentral Alps during the past 11,500 years. Arct. Antarct Alp. Res.35, 158–169
13 Bradshaw, R.H.W. et al. (2000) The effects of climate change on thedistribution and management of Picea abies in southern Scandinavia.Can. J. For. Res. 30, 1992–1998
14 Cowling, S.A. et al. (2001) Palaeovegetation-model comparisons,climate change and tree succession in Scandinavia over the past1500 years. J. Ecol. 89, 227–236
15 Keller, F. et al. (2002) Effects of climate, fire, and humans on forestdynamics: forest simulations compared to the palaeological record.Ecol. Model. 152, 109–127
16 Dearing, J.A. and Jones, R.T. (2003) Coupling temporal and spatialdimensions of global sediment flux through lake and marine sedimentrecords. Glob. Planet. Change 39, 147–168
17 Dearing, J.A. et al. (2006) Human–environment interactions: learningfrom the past. Reg. Environ. Change 6, 1–16
18 Dearing, J.A. Integration of world and earth systems: heritage andforesight. In The World System and the Earth System: GlobalSocio-Environmental Change and Sustainability 3000 BC – AD 2000(Hornborg, A. et al., eds), Left Coast Books (in press)
19 Dearing, J.A. and Zolitschka, B. (1999) System dynamics andenvironmental change: an exploratory study of Holocene lakesediments at Holzmaar, Germany. Holocene 9, 531–540
20 Lang, A. et al., eds (2003) Long-term Hillslope and Fluvial SystemModelling, Springer
21 Wainwright, J. and Mulligan, M. (2003) Environmental Modelling:Finding Simplicity in Complexity, John Wiley & Sons
www.sciencedirect.com
22 Kelly, R.E.J. et al., eds (2004) Spatial Modelling of the TerrestrialEnvironment. John Wiley & Sons
23 FavisMortlock, D. et al. (1997) Modelling long-term anthropogenicerosion of a loess cover: South Downs, UK. Holocene 7, 79–89
24 Renberg, I. (1990) A 12600 year perspective of the acidification ofLilla-Oresjon, southwest Sweden. Philos. Trans. R. Soc. B 327, 357–361
25 Engstrom, D.R. et al. (2000) Chemical and biological trends during lakeevolution in recently deglaciated terrain. Nature 408, 161–166
26 Sverdrup, H. and Warfvinge, P. (1988) Weathering of primarysilicate minerals in the natural soil environment in relation to achemical-weathering model. Water Air Soil Pollut. 38, 387–408
27 Warfvinge, P. et al. (1995) Modelling geochemistry and lake pH sinceglaciation at Lake Gardsjon. Water Air Soil Pollut. 85, 713–718
28 Battarbee, R.W. et al. (2005) Reconstructing pre-acidification pH for anacidified Scottish loch: a comparison of palaeolimnological andmodelling approaches. Environ. Pollut. 137, 135–149
29 Evans, C.D. et al. (2005) Long-term increases in surface waterdissolved organic carbon: observations, possible causes andenvironmental impacts. Environ. Pollut. 137, 55–71
30 Coulthard, T.J. (2001) Landscape evolution models: a software review.Hydrol. Process. 15, 165–173
31 Dearing, J.A. et al. (2006) Models for coastal simulation based oncellular automata: the need and potential. Philos. Trans. R. Soc. A364, 1051–1071
32 Coulthard, T.J. and Macklin, M.G. (2001) How sensitive are riversystems to climate and land-use changes? A model-basedevaluation. J. Quat. Sci. 16, 347–351
33 Coulthard, T.J. et al. (2005) Modelling differential catchment responseto environmental change. Geomorphology 69, 222–241
34 Stefan, H.G. et al. (2001) Simulated fish habitat changes in NorthAmerican lakes in response to projected climate warming. Trans. Am.Fish. Soc. 130, 459–477
35 Elliott, J.A. et al. (2001) An investigation of dominance inphytoplankton using the PROTECH model. Freshw. Biol. 46, 99–108
36 Jorgensen, S.E. (2005) Recent developments in lake modelling. Wat.Sci. Technol. 51, 5–12
37 Birks, H.J.B. (1998) Numerical tools in palaeolimnology - progress,potentialities, and problems. J. Paleolimnol. 20, 307–332
38 Bennion, H. et al. (2004) Assessing eutrophication and referenceconditions for Scottish freshwater lochs using subfossil diatoms.J. Appl. Ecol. 41, 124–138
39 Sverdrup, H. et al. (2005) Modeling recovery of Swedish ecosystemsfrom acidification. Ambio 34, 25–31
40 Jeppesen, E. et al. (2005) Lake responses to reduced nutrient loading -an analysis of contemporary long-term data from 35 case studies.Freshw. Biol. 50, 1747–1771
41 Hall, R.I. et al. (1999) Effects of agriculture, urbanization, and climateon water quality in the northern Great Plains. Limnol. Oceanogr. 44,739–756
42 Smol, J.P. et al. (2005) Climate-driven regime shifts in thebiological communities of arctic lakes. Proc. Natl. Acad. Sci. U. S. A.102, 4397–4402
43 Bergstrom,A.K. andJansson,M. (2006)Atmospheric nitrogendepositionhas caused nitrogen enrichment and eutrophication of lakes in thenorthern hemisphere. Glob. Change Biol. 12, 635–643
44 Hamilton, D.P. et al. (2002) Effects of atmospheric nutrient inputs andclimate change on the trophic status of Crystal Lake, Wisconsin. Verh.Internat. Verein. Limnol. 28, 467–470
45 Rasmussen, P. and Anderson, N.J. (2005) Natural and anthropogenicforcing of aquatic macrophyte development in a shallow Danish lakeduring the last 7000 years. J. Biogeogr. 32, 1993–2005
46 Cugier, P. et al. (2005) Modelling the eutrophication of the Seine Bight(France) under historical, present and future riverine nutrient loading.J. Hydrol. 304, 381–396
47 Clarke, A.L. et al. (2006) Long-term trends in eutrophication andnutrients in the coastal zone. Limnol. Oceanogr. 51, 385–397
48 Sugita, S. (1994) Pollen representation of vegetation in quaternarysediments – theory and method in patchy vegetation. J. Ecol. 82,881–897
49 Sugita, S. et al. (1999) Landscape openness and pollen records: asimulation approach. Holocene 9, 409–421
50 Sugita, S. Theory of quantitative reconstruction of vegetation. II. Allyou need is LOVE. Holocene (in press)
704 Review TRENDS in Ecology and Evolution Vol.21 No.12
51 Sugita, S. Theory of quantitative reconstruction of vegetation. I. Pollenfrom large lakes reveals regional vegetation. Holocene (in press)
52 Prentice, I.C. (1985) Pollen representation, source Aaea, and basin size– toward a unified theory of pollen analysis. Quat. Res. 23, 76–86
53 Sugita, S. (1993) A model of pollen source area for an entire lakesurface. Quat. Res. 39, 239–244
54 Bradshaw, R. and Holmqvist, B.H. (1999) Danish forest developmentduring the last 3000 years reconstructed from regional pollen data.Ecography 22, 53–62
55 Lindbladh, M. et al. (2000) Pattern and process in south Swedishforests during the last 3000 years, sensed at stand and regionalscales. J. Ecol. 88, 113–128
56 Brovkin, V. et al. (2004) Role of land cover changes for atmospheric CO2increase and climate change during the last 150 years. Glob. ChangeBiol. 10, 1253–1266
57 Davis, M.B. (1994) Ecology and paleocology begin to merge. TrendsEcol. Evol. 9, 357–358
58 Dearing, J.A. et al. (2006) Human-environment interactions: towardssynthesis and simulation. Reg. Environ. Change 6, 115–123
59 Dearing, J.A. Human–environment interactions: learning from thepast. In Integrated History and Future People of the Earth(Costanza, R. et al., eds), MIT Press (in press)
60 Box, G.E.P. (1979) Robustness in the strategy of scientific modelbuilding. In Robustness in Statistics (Launer, R. and Wilkinson, G.,eds), pp. 201–236, Academic Press
61 Solomon, A.M. et al. (1981) Simulating the role of climate change andspecies immigration in forest succession. In Forest Succession: Conceptsand Application (West, D.C. et al., eds), pp. 154–177, Springer
62 Botkin, D.B. et al. (1972) Some ecological consequences of a computermodel of forest growth. J. Ecol. 60, 849–872
Forthcoming C
Are you organizing a conference, workshop or meeting that w
the details to us at [email protected] and we will feature it in o
9–13 January 2007
3rd Biennial Meeting of the International Biogeography
Society (IBS), Puerto De La Cruz, Tenerife, Canary
Islands
(http://www.biogeography.org/).
19–24 February 2007
International Conference on the Environment: Survival
and Sustainability, Nicosia, Cyrpus
http://www.neuconference.org/
25 February–2 March 2007
International workshop on ’Colonization versus
invasion: do the same traits matter? Towards a joint
perspective in research on range expansion of native
and biological invasion of non-indigenous plants’
Monte Verita, Ascona, Switzerland
http://www.unizh.ch/uwinst/Ascona
1–4 March 2007
Environmental History Meeting, Baton Rouge, LO,
USA
http://www.lsu.edu/lsupress/catalog/Fall2004/books/
Colten_Unnatural.html
15–20 April 2007
The 3rd Global Botanic Gardens Congress, Wuhan, PR China
http://www.3gbgc.com
13–19 May 2007
VIIIth Neotropical Ornithological Congress, Estado
Monagas, Venezuela
(http://www.esa.org/federation/meetings/
FirstCallContributions_VIIINOC.pdf)
22–27 May 2007
EcoSummit 2007: Ecological Complexity and
Sustainability: Challenges and Opportunities for
21st-Century’s Ecology, Beijing, PR China
http://www.ecosummit2007.elsevier.com
www.sciencedirect.com
63 Davis, M.B. and Botkin, D.B. (1985) Sensitivity of cool-temperateforests and their fossil pollen record to rapid temperature-change.Quat. Res. 23, 327–340
64 Lotter, A. and Kienast, F. (1992) Validation of a forest successionmodelby means of annually laminated sediments.Geol. Surv. Fin. Spec. Pap.Ser. 14, 25–31
65 Campbell, I.D. and McAndrews, J.H. (1993) Forest disequilibriumcaused by rapid little Ice-Age cooling. Nature 366, 336–338
66 Solomon, A.M. (1986) Transient-response of forests to CO2-inducedclimate change – simulation modeling experiments in easternnorth-America. Oecologia 68, 567–579
67 Shugart, H. (1998) Terrestrial Ecosystems in Changing Environments,Cambridge University Press
68 Pastor, A.D. and Post, W.M. (1988) Response of northern forests toCO2-induced climatic change: dependence on soil water and nitrogenavailabilities. Nature 334, 55–58
69 Friend, A.D. et al. (1993) A physiology-based model of forest dynamics.Ecology 74, 792–797
70 Prentice, I.C. and Parsons, R.W. (1983) Maximum-likelihood linearcalibration of pollen spectra in terms of forest composition. Biometrics39, 1051–1057
71 Brostrom, A. et al. (2004) Pollen productivity estimates for thereconstruction of past vegetation cover in the cultural landscape ofsouthern Sweden. Holocene 14, 368–381
72 Bugmann, H.K.M. and Solomon, A.M. (2000) Explaining forestcomposition and biomass across multiple biogeographical regions.Ecol. Appl. 10, 95–114
73 Hellman, S. et al. Quantitative reconstruction of past regionalplant-cover using pollen records from large lake: validation of theREVEALS model in southern Sweden. J. Quat. Sci. (in press)
onferences
ould be of interest to TREE readers? If so, please e-mail
ur Forthcoming Conference filler.
22–27 May 2007
EcoSummit 2007: Ecological Complexity and
Sustainability: Challenges and Opportunities for
21st-Century’s Ecology. Beijing, PR China
http://www.ecosummit2007.elsevier.com/
5–8 June 2007
ESEE 2007. Integrating Natural and Social Sciences
for Sustainability, Leipzig, Germany
http://www.esee2007.ufz.de
16–21 June 2007
Evolution Annual Meeting, held jointly by the Society
for the Study of Evolution, the American Society of
Naturalists and the Society of Systematic Biologists,
Christchurch, New Zealand
http://www.evolutionsociety.org/meetings.htm
1–5 July 2007
Society for Conservation Biology Annual Meeting, Port
Elizabeth, South Africa
http://www.nmmu.ac.za/scb/
16–18 July 2007
ENTO ’07: RES Annual National Meeting and RES
Symposium on Aquatic Insects, Edinburgh, UK
http://www.royensoc.co.uk/
5–10 August 2007
92nd ESA Annual Meeting, held jointly with SER, San
Jose, CA, USA
http://www.esa.org/meetings/FutureAnnualMeetings.php
12–18 August 2007
30th Congress of the International Association of
Theoretical and Applied Limnology, Montreal, Canada
(http://www.sil2007.org)
20–25 August 2007
11th Congress of The European Society for
Evolutionary Biology, Uppsala, Sweden
(http://www.eseb.org/)