linkages between fisheries, poverty and growth: key concepts and methodology
Upload: water-food-and-livelihoods-in-river-basins-basin-focal-projects
Post on 14-Jan-2015
2.029 views
DESCRIPTION
A report prepared for the Department for International Development (DFID) Project: ‘The Role of Fisheries in Poverty Alleviation and Growth: Past, Present and Future’TRANSCRIPT
APPENDIX D
Case Study Methodology
and
Theoretical Background
INVESTIGATING THE LINKAGESBETWEEN FISHERIES, POVERTYAND GROWTH:
KEY CONCEPTS ANDMETHODOLOGY
A report prepared for the
Department for International Development (DFID)Project: ‘The Role of Fisheries in Poverty Alleviationand Growth: Past, Present and Future’
DFID/PASS Contract: AG0213February 2005 (Final version)

D-2
STUDY TEAM
Dr. Stephen CunninghamDr. Arthur E. Neiland
IDDRA LtdPortsmouth TechnopoleKingston CrescentPortsmouthHants PO2 8FA
Tel: +44 (0) 2392 658232Fax: +44 (0) 2392 658201E-mail: [email protected], [email protected]

D-3
SUMMARY
This background report presents a methodology for the DFID/PASS Project ‘TheRole of Fisheries in Poverty Alleviation and Growth: Past, Present and Future’.
The objective of the study is to conceptualise the interface between poverty reductionand fisheries development. In particular, the study seeks to identify the links betweenpoverty reduction and fisheries development under different policy arrangements,supported by empirical evidence generated through a number of case study countries.
There are five sections to this report: Section 1 gives an introduction and theobjectives of the project overall. Section 2 outlines the study approach for Phase 1(background report and methodology). Section 3 is the core of the report andpresents succinctly the key issues that are central to the study covering the areas of –poverty and development, economic growth and fisheries, fisheries development andmanagement, policy and governance. The overview of the issues above isunderpinned by a series of more detailed appendices. Drawing on Section 3, Section4 develops a template for the case study reports, and Section 5 presents the Terms ofReference for the case study authors.
The national case-studies will be undertaken in 8 countries (Bangladesh, India,Thailand, South Pacific Island States, Morocco, Mauritania, Malawi and Canada).The results will be synthesized to produce a final report and policy brief by June2005.
KEY WORDS:
Fisheries; Policy; Poverty; Economic Growth; Concepts; Methodology;

D-4
ACRONYMS AND ABBREVIATIONS
BMI Body Mass IndexBN Basic Needs approachCEC Commission of the European CommunityDFID Department for International Development of the United KingdomDWFN Distance Water Fishing NationsDC Developed CountryDevC Developing CountriesEU European UnionEEZ Exclusive Economic ZonesFAO United Nations Food and Agriculture OrganisationFFA Forum Fisheries Agency (South Pacific)FGT Foster-Greer-Thorbecke measureFMU Fisheries Management UnitGDI Gender Development IndexGDP Gross Domestic ProductGNP Gross National ProductHDI Human Development IndexIMF International Monetary FundIQ Individual QuotaITQ Individual Transferable QuotaMDG Millennium Development GoalsMEY Maximum Economic YieldMSY Maximum Sustainable YieldNAM Non-Aligned MovementNGO Non-Government OrganisationNR Natural ResourcesNRM Natural Resources ManagementOAU Organisation for African UnityOECD Organisation for Economic Cooperation and DevelopmentPASS Programme of Advisory and Support Services to DFID (HTPSE Ltd)PEP Poverty-Environment PartnershipPG Poverty GapPQLI Physical Quality of Life IndexPRS Poverty Reduction StrategyPRSP Poverty Reduction Strategy Paper (World Bank)RMR Resting Metabolic RateRNR Renewable Natural ResourcesSAP Structural Adjustment ProgrammeSD Sustainable DevelopmentSSF Small Scale FisheriesSY Sustainable YieldTAC Total Allowable CatchTC Total CostTR Total RevenueUNCLOS United Nations Conference on Law of the SeaUNDP United Nations Development ProgrammeUNRISD United Nations Research Institute on Social Development

D-5
WFS World Food SurveyWTO World Trade Organisation

D-6
CONTENTS
Page no.SUMMARY 3ACRONYMS AND ABBREVIATIONS 4
1. INTRODUCTION AND OBJECTIVES 7
2. STUDY APPROACH 82.1. General approach2.2. Phase 1 study components2.2.1. Literature review2.2.2. Consultation with experts2.2.3. Production of briefing papers2.2.4. Synthesis of briefing papers2.2.5. Development of study template and case-studies2.2.6. Selection of country case-studies2.2.7. Review and finalisation of methodology2.2.8. Implementation of Phase 22.2.9. Preparation for Phase 3
8889999
10101011
3. KEY ISSUES 113.1 Introduction3.2. Poverty and development;3.3. Economic growth and fisheries3.4. Fisheries development and management3.5. Policy and governance
1113151619
4. STUDY TEMPLATE 22
5. TERMS OF REFERENCE – COUNTRY CASE-STUDIES 27
6. CONCLUDING REMARKS 30
APPENDICES 31A1. Poverty and Development – Evolving Concepts and Approaches 32A2. Economic Growth and Fisheries 48A3. Fisheries Development and Management – Key Issues 57A4. Policy and Governance for Development 75

D-7
1. INTRODUCTION AND OBJECTIVES
The objective of the Renewable Natural Resource (RNR) and Agriculture Team inDFID’s Policy Division is to increase the contribution of RNR and agriculture(including fisheries) to reducing poverty, by encouraging decision makers to adoptpolicies and measures that can be integrated in practical ways into broader povertyreduction processes.
The fisheries programme initiated by the Team recognises that fisheries are ofteninstrumental in helping reduce poverty, and underpin the livelihoods of the absolutepoor in rural areas of many developing countries.
The objective of this study is to conceptualise the interface between povertyreduction and fisheries development. In particular, the study seeks to identify thelinks between poverty reduction and fisheries development under different policyarrangements, supported by empirical evidence generated through a number of casestudy countries.
The main outputs of the study are shown in Box 1:
This background report is structured as follows. Section 2 outlines the studyapproach.
Section 3 is the core of this report and presents succinctly the key issues that arecentral to the study. Section 3.1 outlines current thinking on poverty, itsmeasurement, diagnosis and approaches to poverty reduction. A key general findingis that a major factor in poverty reduction around the world is broad economicgrowth. Section 3.2 looks therefore at the factors determining economic growthperformance and on the role that the fisheries sector might play in contributing toeconomic growth. Section 3.3 considers the development and management offisheries. It focuses on the way in which fisheries can contribute to povertyreduction. Section 3.4 discusses the importance of the policy environment forensuring that the potential contribution of the fisheries sector is fully realised.
Section 3 presents an overview of the issues. It is supported by Appendices A1-A4,which provide more detailed discussion.
Drawing on Section 3 and on the Appendices, Section 4 develops a template for thecase study reports, and Section 5 presents the Terms of Reference for the Case Studyauthors.
Box 1: Main outputs of the study
• the empirical evidence of the role of fisheries in supporting growth andpoverty reduction, presented in the form of a set of case studies, and
• a synthesis policy paper with outline strategy to guide future DFIDinterventions.

D-8
2. STUDY APPROACH
2.1. General approach
The study team drew upon their expertise in development economics, naturalresource management and fisheries policy and governance to address the specificobjectives of the current phase (Phase 1) of the overall study (Box 2). This includesexperience of fisheries management in both Developed and Developing Countries,and with particular reference to the usage of multi-disciplinary approaches andframeworks.
The overall study structure and implementation schedule is shown in Box 2 below:
2.2. Phase 1: Study components
The approach for Phase 1 (November 2004 – February 2005) consisted of ninecomponents, as follows;
2.2.1. Literature review
To provide an essential underpinning to the study and to allow the development of abackground paper, a review of the international literature was undertaken. With anemphasis on providing a good understanding of the conceptual link between povertyreduction and fisheries development, it was necessary to draw on a broad range ofliterature including areas such as fisheries management and development, naturalresource management, economic development and economic growth, poverty andpoverty analysis, and policy and governance. The idea is that the background paper(this report) will be informed by both fisheries and non-fisheries elements, but thatthe process is expected to be two-way, with the background paper from this project
Box 2: Overview of study
‘The Role of Fisheries in Poverty Alleviation and Growth: Past, Present andFuture’
Phase 1 (15 Nov 2004 – 4 Feb 2005):Produce background paper in order to develop case-study approach includingtemplate for case-studies and Terms of Reference for case-study authors;
Phase 2 (Feb 2005 – 31 March 2005)Case-studies undertaken in eight countries (Bangladesh, India, Thailand, ForumFisheries Agency (South Pacific Island States), Mauritania, Morocco, Malawi andCanada);
Phase 3 (4 April 2005 – 13 May 2005)Develop synthesis report, policy brief and final project report;
D-9
having wider implications than just to the fishery sector in terms of ensuring pro-poor growth based on common pool resources.
2.2.2. Consultation with relevant experts and practitioners
At various times during Phase 1, the work of the study was discussed with a numberof relevant experts and practitioners in the fields of fisheries and development,principally at DFID. In addition, Arthur Neiland attended a one-day meeting on themanagement of natural resources as part of the VI. Poverty-Environment Partnership(PEP) meeting in Berlin on 2nd December 2004 (PEP, 2004), and gave a presentationon fisheries and pro-poor growth. This provided a good opportunity to interact withexperts from a wide range of international development organisations, and toparticipate in discussions on the role of natural resources in pro-poor growth.
2.2.3. Production of four briefing papers
The results of the literature review were used to produce four briefing papers whichattempt to identify and explain the major issues relevant to the study. Each of thesepapers is included as a separate appendix to this report as follows:
A1: Poverty and Development – Evolving Concepts and Approaches;A2: Economic Growth and FisheriesA3. Fisheries Development and Management;A4: Policy and Governance for Development;
2.2.4. Synthesis of briefing papers
The four briefing papers (above) were then synthesised to present a succinctidentification of the key issues and the inter-relationships between them. From thebeginning, the approach which was laid down for the study was used to guide thesynthesis. Essentially, it was decided to approach the problem of pro-poor growthfrom the fish resource end of the spectrum, looking at two important aspects. First,historically and in the present, to consider the strategy that has been adopted for theexploitation of fish stocks, and the impact of this on economic growth, and on thepoor in particular. Second, alternative strategies for the exploitation of fish resourcesand the impact that such strategies might be expected to have for pro-poor growthand other important indicators, such as resource sustainability. Initially, therefore, thesynthesis focuses on poverty and poverty alleviation (A1), and the important role ofeconomic growth in this (A2). The contribution of fisheries to economic growth isthen considered, looking at fisheries development and management options (A3).Finally, the impact of the policy and governance context on fisheries and itscontribution to economic growth and poverty alleviation is examined (A4).
2.2.5. Development of study template and national case studies
On the basis of the key issues identified and synthesised (above), a study templatewas developed to form the basis of a series of national case-studies from around theworld. The case-studies will be implemented by nationals (or country specialists)from a range of countries / regions (as explained below), using both primary and

D-10
secondary information sources, analysing the role of the fisheries sector for povertyalleviation. Each case-study will be defined by a Terms of Reference (Section 5).
It is planned that the case-studies will examine information and trends from currentfisheries systems as well as historical information (where appropriate) to assist indeveloping an understanding of the key role fisheries has played in the past,continues to play today and is likely to play in the future.
The case-studies will take account of the impacts (and likely future impacts) ofrecent declines in capture fisheries. Although these may have been offset by gainsthrough (say) value-added processing and high-value, export-oriented aquaculture,the extent to which (i) this is sustainable; and (ii) the poor have benefited directly orindirectly from these gains (or, conversely, the extent to which they have become‘losers’) are factors to be examined.
2.2.6. Selection of case-study countries
The following countries have been identified for case studies:
Bangladesh; India; Thailand; Pacific Island States (Forum Fisheries Agency);Mauritania; Morocco; Malawi; and Canada (Atlantic cod);
2.2.7. Review and finalisation of study methodology
As part of the process of developing the study, a draft version of the current reportwas distributed to a number of relevant experts and development practitioners forcomment, and also to the selected case-study authors. Comments and suggestions onthe content were requested, with particular reference to the following points:
- Do the four briefing papers (A1 – A4) provide effective coverage of key issuesrelevant to the study?
- Does the synthesis (Section 3) show the important linkages between issues?- Does the study template (Section 4), building upon the synthesis (above), provide
a useful framework for the case-studies?- Comment on the availability of information in your country relevant to
completing each of the template sections (for case-study authors in particular).
In the light of comments received, the draft report and methodology was finalisedand then re-distributed to the case-study authors and others.
2.2.8. Arrangements for implementation of Phase 2
Phase 2 will commence with the commissioning of the national case-studies inFebruary 2005. The case-study authors will be expected to provide an interimprogress report on 7th March, and the IDDRA team will provide comments on anyissues arising during the course of the work. An e-mailing list will be established forthis purpose. By 31 March 2005, the draft case-study reports should be completedand sent to IDDRA.
D-11
2.2.9. Preparation for Phase 3
Following completion of the case studies, a key synthesis paper will be prepared.Case study authors will be asked to comment on this paper, which will cover thefollowing broad areas (and others depending on the results obtained).
Key Synthesis Paper:
The IDDRA study team will distil relevant evidence from the case studies andsynthesise this into a key policy brief/strategy paper (to be defined) that will identify:
- Common facets of success in the development of fisheries for sustainable growth;- Common facets of success in the development of fisheries for poverty reduction;- Trade offs between efficiency (e.g. using DWFNs vs. local fleets), equity (e.g.
open access for the poor - safety nets with rent dissipation and thesustainability/effectiveness of this compared with other possible scenarios suchas decommissioning and alternative income generation) and environment (e.g.fishing within multi-species stocks vs. biodiversity);
- Recommendations for future strategies (including capacity building) inter alia tosupport pro-poor growth.
The analysis will focus on features relevant to governance, policy processes andmanagement that have led to successful pro-poor outcomes as a result of wealthgenerated sustainably from fisheries and aquatic resources.
3. KEY ISSUES
3.1. Introduction
In this section, the key issues that are central to the overall study will be presentedsuccinctly. A more detailed discussion is provided in the Appendices (A1-A4) whichunderpin this section.
It is recommended that case-study authors should read these sections and theappendices carefully, and use them to focus their implementation of the studytemplate (Section 4 below). In other words, the case-study authors should attempt toensure adequate coverage of the key issues highlighted in this section (and theappendices) within the reports which they produce. The reason for emphasising thispoint (which will appear obvious to the experienced case-study authors selected forwork) is that many of the ideas and approaches to fisheries management and itsrelationship to poverty presented in this methodology report are relatively novel – forexample, fisheries management is conventionally based on biological principles,whereas in this study the focus is on ideas from economics and social sciences suchas resource rent generation and use, and institutional frameworks and policyprocesses. A significant complication in all this is that government documents andother likely sources of information in many countries will tend to focus on biologicalmanagement of fisheries, and it will require a significant level of detective work, bycase study authors, to put together the alternative information required for a more

D-12
broad-based analysis of fisheries and poverty. This is the challenge faced by thecurrent study.
To begin, it should be recognised that fish resources are inherently extremelyvaluable, representing a potential source of renewable wealth to the countries whichown them. It was the observation (in Canada in the 1950s) that the fishers exploitingthese valuable resources were ironically amongst the poorest members of society thatgave the impetus for the development of fisheries economics.
Since the 1950s, much progress has been made to explain in theory why theexploitation of such valuable resources is so often associated with poverty.Regrettably, less progress has been made in developing and implementing policiesthat allow the wealth inherent in fish resources to be generated and used for povertyalleviation.
The lack of progress in practical implementation may be explained in many ways. Anumber of broad themes may be identified, however, which are developed further inthe sub-sections 3.2 to 3.5 below.
The theory of fisheries economics demonstrates, and the empirical evidenceconfirms, that unmanaged fisheries will be overexploited, always in an economicsense and in many cases biologically also. The management of fisheries is thereforerequired. But developing effective management schemes has proved to be a difficulttask.
One important reason is that it has taken a long time for the concept of wealth (in theform of resource rents) to enter policy consciousness, and this process is far fromcomplete. As a result, the benefits obtainable from fish resources have been, and inmany countries (both developed and developing) continue to be, perceived purely interms of the fishing activity itself (employment, incomes, value-added, livelihoods).Perceiving the benefits solely in this way has at least two unfortunate effects. First, itmakes high exploitation levels appear attractive, since generally variable likeemployment are positively correlated with the exploitation level. Second, it meansthat in order to benefit from fish resources, people must be fishers (or be closelyassociated with the fishing activity or someone who is).
To the extent that it is addressed at all in policy formulation, the issue of the natureof the benefits from fish resources is generally only addressed implicitly. There isoften an implicit assumption that the benefits must be taken through the activity.When the objective is to use such resources for poverty reduction, it becomesessential to address explicitly the nature of the benefits available and sought.Otherwise, it is impossible to answer questions such as: what is the target group ofpoor people? A policy relying on activity-based benefits can only target poor fishexploiters (or at best poor fishing communities) whereas a policy based on the wealthof the resource allows much broader scope in terms of potential beneficiaries.
Important subsidiary aims of this study are:
D-13
• to demonstrate the nature, and through the case studies the quantitativeimportance, of the different types of benefit obtainable from theexploitation of fish resources, and
• to assess the potential contribution of fish resources to poverty reductionas a function of the type of benefit.
A second major reason for the lack of practical progress in fisheries management isthe absence of appropriate instruments and institutional arrangements. Partly, this isbecause inappropriate objectives have emerged from the policy process. Forexample, resource sustainability, which is in fact simply a constraint on the ability toachieve other goals, is probably the most common objective for fisheriesmanagement. As a result, in many cases, fisheries management has become littlemore than a forlorn attempt to keep exploitation levels within the resource constraint.Even where it has been achieved, resource sustainability has usually been associatedwith economic overexploitation, with the wealth of the resource dissipated.
However, even where the importance of economic factors is recognised in the policyprocess, the design and implementation of appropriate instruments and institutionalarrangements has proven to be a difficult challenge.
The result is that the widespread failure of fisheries management has resulted inmissed opportunities for sustained fisheries-based growth and in many cases to thegradual erosion of their potential to address poverty outcomes.
In order to reverse this situation, radical change in the approach to fisheriesdevelopment and management is needed. The following sections outline the mainissues in this change.
3.2. Poverty and development
Poverty is a major global problem with about half of the world’s population living onless than US$2/day. In the World Development Report (2000), the World Bank statesthat poverty elimination is the world’s greatest challenge, and an internationaldevelopment target has been proposed (OECD) of reducing half of the proportion ofpeople living in extreme poverty by 2015. Many donors and internationaldevelopment agencies have responded with a range of plans.
There is also an active and growing debate and associated research into key povertyissues – How to measure poverty? How to identify and characterise the poor? Whatare the causes of poverty? How to address poverty reduction? There has also been arenewed interest and recognition of the role of economic growth in development,with greater emphasis on the distribution of benefits (‘pro-poor growth’).
There are three broad categories of methods used to measure poverty – nutrition-based methods, basic needs and composite indicators, and income-based measures.All of these methods have both strengths and weaknesses. The limitations of income-based measures (e.g. failure to include non-marketed production) originally spurredattempts to develop new approaches, leading to the emergence of the Basic Needs(BN) and Human Development Index (HDI).

D-14
However, subsequent research has shown a high degree of correlation betweenincome and HDI, BN-indicators and others. Overall, income-based measures aim toquantify the number of individuals or households falling below selected povertylines. Other indicators of relative poverty include the $1/day and $2/day measures.
The reporting of income-based measures at national level provide a general overviewof poverty for policy-makers. They can also be decomposed by region, sector, genderetc and provide an indication of which societal groups are vulnerable and howpoverty alleviation interventions might impact on such ‘at risk’ groups.
Poverty measures provide an indication of the scale of the problem, but they cannotprovide any explanation on why people are poor or why poverty is so significant inparticular sectors or countries. Since the 1950s, development economists haveattempted to provide an understanding of the causes of poverty, and in turn, thevarious theories and explanations have been used, to varying degrees, bygovernments and development agencies to inform relevant policy and actions.
Development thinking has centred on the following themes. First, the developmentrecord and the experience of many East Asian countries during the 1970s and 1980sindicated that economic growth could lead to poverty reduction. However, it wasalso found that simply transferring policies (e.g. structural adjustment and neo-liberalprogrammes) from one region to another was not always workable. Therefore futurepolicy to promote economic growth for poverty alleviation would have to takeaccount of a full range of factors (e.g. political stability, markets, investment climateetc) on a country-specific basis.
Second, following further research into the mechanisms of poverty (e.g. impactassessments of the SAP in Africa), investigators such as Sen concluded that aperson’s or household’s capability to access economic benefits is crucial indetermining vulnerability to poverty, and this will be determined by their position insociety (or entitlement). In other words, starvation could not simply be equated withfood shortages (a production problem), but could equally be a consequence of a lackof purchasing power (a trade/exchange failing). Building upon this work, theemergence of new, broad-based and multi-disciplinary approaches to povertyanalysis (e.g. sustainable livelihoods approach) have opened up a wide debate onhow poverty should be measured, assessed and deal with.
Third, there has been an increasing level of political attention and financialcommitment to international development and poverty reduction in the past fiveyears leading to the adoption of the Millennium Development Goals and the PovertyReduction Strategy Paper approach by most governments and international agencies.There is also an on-going debate over the elements that should be at the centre of anysensible poverty reducing strategy.
The topic of ‘pro-poor growth’ (the average growth rate of the incomes of the poor –the absolute definition) has also emerged. While there is ongoing research into itsmeaning and application, there seems to be a general consensus in a few areas:

D-15
- growth is fundamental for poverty reduction, and in principle growth as suchdoes not seem to affect inequality;
- growth accompanied by progressive distributional change is better than growthalone;
- education, infrastructure and macro-economic stability seem to positively affectboth growth and distribution of income.
It is interesting to note that the absolute definition of pro-poor growth is an income-defined measure of poverty status, and that it only considers the incomes of poorpeople. DFID explains that the pro-poor banner is useful because it aligns economicgrowth with changes in the well-being of the poor. Also that most policies thatincrease growth also reduce poverty and many policies that are effective for reducingpoverty also increase growth.
3.3. Economic Growth and Fisheries
There is widespread agreement that economic growth is a necessary condition forpoverty to be reduced in an economy. It is not, however, sufficient since there is aneed to ensure that the opportunity that such growth provides does, in fact, translateinto poverty reduction.
Economic theory and empirical evidence suggest that government macroeconomicpolicy is an important determinant of economic growth. Among the most importantfactors identified are:
• Free trade• Stable prices• Private enterprise• A well-educated and healthy labour force• Diversified exports without the dominance of a few primary products
These macroeconomic factors are beyond the scope of a single sector of the economysuch as fishing, so the key question is: how best can the sector contribute?
The answer to this question is complicated by a number of factors. First, economicgrowth is clearly not the only macroeconomic objective, and Governments maydecide, or have no choice but, to pursue other priorities, such as the immediate needto provide livelihoods for the poor.
Second, even where it is chosen, economic growth is a demanding target, particularlyin the case of poor developing countries. There is now broad acceptance around theworld and across the political spectrum that growth requires market-based economicand institutional reform and implementing such reforms is challenging.
The main difficulty is that many of the policies that promote economic growth areeffectively investments in the sense that they involve some sacrifice now in return fora gain in the future. They may therefore worsen the Government's performanceconcerning other policy dimensions, for instance changes in economic structure maycause substantial short-run unemployment. Moreover, such investments will pose thesocial welfare problem that some people will gain and others will lose. Those who

D-16
expect to lose will resist change, and being a relatively small identifiable group, eachof whom stands to lose significantly, they may well be able to organise themselvesinto an effective political lobby group. Implementing economic growth policies isnot likely to be politically easy therefore.
In the case of the fisheries sector, two of the factors determining economic growthperformance have particular significance. First, there is the issue of free trade and itscorollary the liberalisation of trade, and second, there is the issue of dependence onnatural resources and primary products.
Liberalising trade to move towards free trade is recognised as a general factorfavouring economic growth. However, in the case of fisheries, the impact of suchliberalisation depends crucially on the fishery management structure in place. Manyfisheries around the world remain in conditions that approximate to free and openaccess. In such cases, it can be demonstrated that liberalising trade is likely to haveperverse, counter-intuitive impacts. In particular, the fish-exporting country is likelyto lose from liberalisation.
Only if both the fish-exporting and the fish-importing countries have economicallyrational fishery management systems in place (examples of such systems arediscussed in the next section) will trade liberalisation be unequivocally beneficial.
The second difficulty is that economic research suggests that heavy dependence bycountries on natural resources, such as fish, reduces economic growth (regardless ofhow dependence is measured, e.g. % of GDP, % of exports). A number ofexplanations have been put forward to explain this somewhat surprising result. In thecase of fishing, the most plausible explanation seems to be simply the fact that untilrecently almost all of the world's fisheries were very poorly managed from aneconomic point of view.
Maximising the contribution to economic growth requires therefore two related steps.First, the focus of fisheries management must be placed far more centrally on theissue of economic efficiency in the exploitation of fish resources. Second, the way inwhich economically-rationally-exploited fish resources can contribute to growthneeds to be clarified.
Whether maximising the economic growth potential of fish resources also maximisestheir contribution to poverty alleviation is a slightly different question.
3.4. Fisheries Development and Management
The previous section argued that economic growth is necessary, although notsufficient, for poverty reduction, and that economically rational fisheriesmanagement is necessary, although also not sufficient, to maximise the contributionof fish resources to economic growth. This section discusses the problem ofeconomically rational fishery management.
If fisheries are not managed, and access to them remains free and open, then theywill be overexploited. This overexploitation arise first in its economic dimension of

D-17
overcapacity. If economic conditions permit (prices high enough relative to fishingcosts), overexploitation will also occur in its biological dimension of overfishing(defined for instance as fishing beyond maximum sustainable yield – MSY).
The reason why such overexploitation occurs is because the fish resource is avaluable capital asset. The implicit return on this asset is called the resource rent.Under conditions of free and open access, this resource rent is perceived by fishers tobe profit, and drives overexploitation of the fishery.
Over the years, fishery management systems have often focussed on the overfishingdimension of the overexploitation problem (to the extent of it being widely arguedthat fisheries that are not overfished require development rather than management).This focus has led to worsening of the overcapacity problem.
The key issue for fishery management success is resource rents, and to prevent themfrom leading to overexploitation requires that either access no longer be open, or thatit no longer be free (or some combination of the two). As well as explainingoverexploitation, resource rents are a crucial indicator in fisheries. They measure onthe one hand the cost of fishery management failure and on the other the potentialcontribution of the fish resource to economic and social welfare. It is very surprisingtherefore that so few estimates of resource rent are available.
One reason perhaps for the lack of such estimates is that in order to be able tocalculate resource rents meaningfully, fisheries must be organised into fisherymanagement units - FMUs (that is, a fish stock, or group of stocks, associated withthe fishers, or groups of fishers, that do or might exploit them). This kind ofapproach was promoted by the FAO in the 1980s but its implementation has beenvery gradual, although there are some signs that it may be speeding up followingsuccess in some countries.
This emphasis on FMUs contrasts with an approach of great importance in relation tothe topic of fisheries and poverty reduction. A standard approach has been to identifysmall scale fisheries (SSF or artisanal fisheries as they are sometimes called) and toargue that they require special treatment. However, although the intentionsunderlying this approach are laudable, the outcome generally is to disadvantage SSF.The big problem is that they have no interface with other groups of fishers and find itdifficult to establish and to protect their rights. The FMU approach on the other handsees SSF as one among many production technologies within a unit. They can bemanaged either on the same basis as other groups within the unit, or may be givenspecial treatment if it is felt that they must be protected for some reason.
There are few fishery management systems that allow the issue of resource rents tobe dealt with. Under free and open access, the rents are dissipated, going to fundunnecessary capacity or simply being lost as fish stocks are run down. Aneconomically rational management system then is one that allows resource rentseither to be capitalised in some way or to be extracted.
Capitalisation of resource rents can occur under use right systems. Two broad useright systems exist (each with many possible variations) based either on catch or on

D-18
fishing effort. The best known example of the former is the individual transferablequota system and of the latter, vessel licences. In both cases, resource rents will becapitalised into the price of the use rights (i.e. the price of an ITQ or the price of avessel licence, assuming that they are transferable from one fisher to another).
In principle, catch and effort systems are equivalent. In practice, they differ. In somefisheries it may be practically impossible to control the catch (too many landingpoints, too many outlets for the catch) so there may be no option but to adopt effortcontrol. But where it can be adopted catch control is to be preferred. The reason isthat it is not possible to control all dimensions of effort so one or two dimensionshave to be chosen as proxies (e.g. vessel numbers and engine power). The problem isthat fishers will be given an incentive to expand the use of uncontrolled inputs toreplace the controlled ones in the production of effort, and effort-based managementtends to become therefore an ongoing race between the managers and the fishers.
Despite differences, in both cases resource rents will be capitalised into the price ofrights. If for instance resource rents were to increase, fishers would still seek toexpand their catch (as they would under free and open access) but to do so legallythey will have to purchase use rights, driving up the price of these.
The use of co-management may help the operation of both ITQ and licensingsystems. Community-based management is one form of co-management that is putforward as a possible solution to the fishery management problem. But such schemesare largely institutional, the choice of management instruments is no different underthem and the problems faced are similar, although they may help to ensurecompliance.
An alternative to use rights, either individual or communal, is taxation. Rather thanattacking the free and open access problem through the open part of the problem,taxation does so through the free part. By correcting fish prices, taxation can forcefishers to take into account the cost of using the fish stock. In this way resource rentscan be extracted. It is difficult however to use taxation as the sole managementmethod.
An ideal economically rational management scheme probably has elements thereforeof use rights and taxation within a fishery management unit framework. A proportionof resource rents will be capitalised into the price of the use rights and a proportionwill be extracted. In this way fish resources can contribute to economic growth byadding to the process of capital accumulation. The capital made available can beused to undertake investments to help the poor. One advantage of this approach isthat the target group of poor people is independent of fish exploitation itself. Someeconomic growth benefits will also come through the fishing activity itself, althoughsuch benefits may not necessarily be concentrated on the poor. The main poverty-related benefits will appear through potential to fund pro-poor growth
This economic-growth-based approach can be contrasted with an alternativeapproach which is to use to resource to provide activities (employment, livelihoods,incomes) for poor fishers. In very poor countries, or very poor regions of poorcountries, there may be little choice but to follow such a strategy. And once it has

D-19
been followed for a while, the Government may become locked into it, because thenumber of people involved may become very great. Although providing somebenefits to the poor, this approach creates poverty traps. The target group for such apolicy is necessarily poor fishers only (the poor in the rest of economy are excludedfrom benefiting from valuable fish resources but it is not clear why). There is also aclear limit to the policy, in that not everyone can be a fisher, so that eventuallychoices will have to be made, even within the target group.
The point should also be made that the second broad policy approach has often beenchosen by default, being the consequence of fishery management failure rather thanthe desired result of government policy. The first policy approach (based on growth)might be seen as the opportunity cost of the second, but because few estimates offoregone resource rents are available this cost is usually unknown.
Where the activity-based approach has arisen by default or is no longer considereddesirable, the policy problem will be how to move from one approach to the other.The transitional period may be very difficult, especially if the activity-basedapproach has been pursued for a long period of time.
Amongst other things, the case studies will provide empirical evidence on use of thetwo broad approaches. They will also provide evidence of the policy options formoving from activity-based to growth-based strategies
3.5. Policy and governance
In most countries, economic structure and the policy environment do not remainconstant. Even with respectable rates of growth, the total number in poverty canincrease. And it has done so in many countries because of adverse changes ineconomic structure and the absence of appropriate policies by government. In simpleterms, growth does not help the poor unless it reaches the poor. Nor does governmenthelp unless the poor are the beneficiaries of public policies.
The design and implementation of appropriate policies for economic growth,development, poverty alleviation, natural resource management, fisheries,management and other areas are major challenges in developing countries. In recentyears, an increased level of research activity in the policy domain in general hasprovided a better understanding of how success can be achieved, or in other words,how the performance of policy can be increased, measured against stated objectivesor other relevant indicators.
An important entry-point for research has been to consider and further develop thedefinitions and concepts which underpin this domain, principally - policy, the policyprocess and governance.
Policy can be defined as a course of action proposed or adopted by those withresponsibility for a given area (usually government) and expressed as formalstatements or positions. The linear (or rational) model presents policy-making as aproblem-solving process which is rational, balanced, objective and analytical. It isassumed that policy-makers approach the issues rationally and carefully considering

D-20
all relevant information. Policy can also be viewed as the ‘policy process’, which isnot linear, at all, and incorporates a certain fluidity between decision-making,knowledge and the operationalisation of policy. It can also be thought of as a broadnon-linear course of action, consisting of a web of inter-related decisions whichevolve over time during implementation. Policy is increasingly seen as an inherentlypolitical process, rather than simply the instrumental execution of rational decisions.
Governance can also be defined in different ways. At one level, governance is themanner in which power is exercised in the management of a country’s economic andsocial resources. Governance also refers to the whole array of processes wherebyelements in society (government and non-government) wield power and authority,and influence and enact policies and decisions concerning public life, and economicand social development.
The close association between ‘governance’ and ‘government’ is an important entry-point for considering the role of government, the nature of the state and the impacton policy-making and implementation in different countries throughout the world. Italso focuses attention on the terms ‘good governance’ and ‘strong and weak states’.
In simple terms, some countries are classified as ‘Developed Countries’ and some as‘Developing Countries’. Reynolds (1999) after surveying more than a century ofcomparative development experience in 40 developing countries concluded that ‘thesingle most important explanatory variable [of development] is political organisationand the administrative competence of government’. A proper use of public resourcesand donor transfers appears to be a good indication of good governance. Agovernment’s impact on development is not simply a function of fiscal resources, butalso a more intangible thing which one can call the ‘quality of government’.
Policy analysis, at all levels (international, national, meso and local), attempts toassess (e.g. have stated policy objectives been achieved?) and evaluate (e.g. whatfactors have affected implementation?) the performance of policy. This is not an easyexercise given the associated complexity. However, with regards to the relationshipbetween natural resource management (e.g. fisheries management) and the impact onlivelihoods and poverty alleviation, recent research has helped to identify andunderstand a range of important issues which affect policy performance, as follows:
- recognition: is the value of the natural resources sector valued by policy-makers?- information/assessment: does this support policy and management decisions?- policy narratives: is there an appropriate conceptualisation of the relationships,
development pathways and options?- nature of the policy process: is it dynamic, active and willing to adapt and take
hard decisions? Is it transparent, evidence-based and accountable?- participation: do all relevant stakeholders contribute to policy design and
implementation (through management systems)?- laws: is there a well-established legal framework? (as a basis for rights and
actions?)- institutions: is there an appropriate institutional framework (rules and
organisations)?

D-21
- management capacity: is there an appropriate capacity to manage the naturalresources system (technical, financial capacity)?
- political will/desire: is there sufficient political will/desire to manage naturalresources effectively?
Finally, given the range of factors which can affect the performance of policy inimportant and inter-related areas of natural resource management, economic growthand poverty reduction, where should the emphasis be placed for future work? Threeareas appear to be particularly important (from the international literature):
- to raise the profile of the ‘environment’ and ‘natural resources’ (re: MillenniumDevelopment Goal 7) within the Poverty Reduction Strategy Papers process; forfisheries, there is a need to clarify the role of the sector in national developmentstrategies, and to better understand the level and pathways of benefits flows;
- to develop analytical frameworks linking NR to economic growth and povertyalleviation, incorporating a full range of factors affecting policy, at differentlevels and over time; in fisheries there is a need to broaden the analysis relevantto planning and management, with particular reference to fisheries as a source ofwealth for economic growth and poverty alleviation;
- to define appropriate policy recommendations and methods of operationalisingpolicy relevant to maximising the contribution of the environment and naturalresources to development and poverty alleviation; in fisheries, the key issue ishow to improve fisheries management performance in this respect.

D-22
4. CASE STUDY TEMPLATE
Template for Case Study Country Reports
(i) General instructions
This template outlines the main issues that case study reports should address. It isintended to help the orientation of the reports but is not intended to be astraightjacket. Where necessary, case study authors may develop other areas that areof particular relevance to their country. In that case, IDDRA should be kept informedso that it is possible to check the relevance for the other cases.
(ii) Purpose
The purpose of each case study is:- to present, for each the case study country, empirical evidence concerning the
impact of past and present fish resource exploitation and utilisation patterns foreconomic growth and poverty reduction
- to analyse the potential contribution of fish resources to economic growth andpoverty reduction under different (improved) exploitation and utilisation patternsin the future
- to provide a measure of the economic (opportunity) cost of past and currentpolicies (in terms of foregone resource rents)
- to identify data gaps and thereby identify priority areas for data collection andresearch in the future
- to identify policy gaps and thereby identify areas for policy reform in the future
(iii) Important methodology considerations
Each country report should try to follow the structure consisting of five sections asshown below. For each section you should consider carefully the objective of thesection, the variables to be considered and the types of information which should beincluded.
It is also important that each case study author should carefully consider theinformation upon which the case study is based. In advance of collecting and usinginformation relevant to the study, it is worthwhile spending some time reviewing:
- the possible sources of information – for example, formal records and documents(e.g. government reports), formal and informal documents from projects (e.g.project survey reports), key informants (e.g. government officials or experts), andcommunity leaders (e.g. heads of fishing groups or communities);
- the likely gaps in the records, and the quality and reliability of the informationwhich is available;
- the best way of making such assessments about the information base, anddeveloping a strategy for dealing with any weaknesses. For example, for anyspecific issue, such as the contribution of fisheries to employment or income, it isadvisable to obtain estimates from a number of sources (government records,

D-23
project records, NGOs etc) and then compare them. If the estimates are not agood match, then it is important to investigate the reason for this, and try todecide what is the most reliable estimate based on additional sources such asexpert opinion;
It is also important to consider how each particular section below (1-5) relates to the‘key issues’ which have been identified and discussed by the study methodologyreport (and presented in detail in the report appendices). As indicated in themethodology report, the current study aims to focus on a broad range of issuesrelating to fisheries management and economic development (poverty), as opposed tomore conventional analyses of fisheries management which tends to emphasise fishstock management and biology-based approaches. Therefore, one of the majorchallenges which you will face in producing your report is to integrate conventionalanalyses of fisheries management in your case study country (which will be widelyavailable through official reports) and the set of key issues identified in the studymethodology.
The five sections which should make up the case study reports (and which can besupplemented by additional appendices) are as follows:
1. BACKGROUND (2 to 3 pages, A4, 12 point, single-spaced)
Objective: to provide a general profile of the country (national context); based onmost recent statistics / information and with an indication of trends where possible;
Possible Information sources: Official Government Reports, World Bank countryprofile document; or a World Bank Poverty Reduction Strategy Paper;
Key questions / variables to cover might include:
- history, structure and nature of government and national politics;- important national policy priorities;
- Population (date of census)- Population growth rate (value%). Is it increasing, decreasing, stable?- Differences between rural and urban areas? Also coastal areas? Are people comingto the coast? Where are the large cities?
- Economic structure: importance and growth rates of different sectors- Unemployment- Balance of payments
- Indicators of national characteristics and development status (political, social,economic, Human Development Index)
Notes: this should be a brief section, use summary tables and graphics wherepossible; include more detailed statistics information in appendices to the mainreport; where appropriate identify the reliability of the statistics / information used, ifpossible;

D-24
2. POVERTY (3 to 5 pages)
Objective: to examine the poverty status of the case study country; to explain thereasons for poverty; and to give an account of the relationship between poverty andthe fisheries sector;
Possible Information sources: Government Reports; National Statistics; Reports ofResearch Programmes and Development Agencies; Reports from NGOs; Multi-Lateral donor documents (e.g. WB-PRSPs); Fisheries Sector Reports and ResearchProgrammes Reports;
Key Variables / Questions which might be covered:
- How is poverty defined in your country?
- What proportion of the population is estimated to be living in poverty on theadopted definition? How is this figure changing over time?
- Which economic sectors and/or regions are most affected by poverty? What are thefactors that explain this? (Are there any specific empirical studies that look at thesefactors?)
- Report on any studies that have been undertaken of poverty in general; and also anystudies which have looked at poverty in the fisheries sector.
Notes: The overview of poverty measurement methodology, results and analysispresented in Appendix A1 will provide an initial guide to the types of issues andinformation important for this section. However, it is likely that poverty assessmentin the different case study countries will vary, and the case study authors should tryto highlight any issues specific to their country.
3. ECONOMIC GROWTH (3 to 5 pages)
Objective: to examine the nature and patterns of economic growth of the case studycountry, and the contribution of the fisheries sector;
Possible Information sources: Government Reports; National Statistics; Reports ofdonor and other international organsaitions;
Key questions / variables to cover might include:
- What are the contributors to economic growth?
- GDP per capita (1980, 1990, 2000, or series)
- What is the fishing sector contribution to GDP, to exports and to other keyeconomic indicators for your country

D-25
- How is the fishing sector defined for these purposes (marine fish catching, inlandfish catching, aquaculture, fish trading, fish processing)
Notes: An overview of economic growth and the relationship to the fisheries sector isprovided in Appendix A2, and raises a range of important issues relevant to thissection including the importance of effective fisheries and the difficulty of measuringthe contribution of environmental resources to economic growth. Each case studyauthor should try to consider these types of issues within the context of their casestudy country.
4. FISHERIES DEVELOPMENT AND MANAGEMENT (5 to 10 pages)
Objective: to examine the role of fisheries in development by analysing bothfisheries exploitation (or activity-related) benefits and wealth-related benefits;
Possible information sources: Government Reports; Official Statistics; Reports fromResearch Programmes; NGO Reports; Expert Interviews; Interviews withCommunity leaders; Interviews with industry leaders;
Key questions / variables to cover might include:
- What are the principal fish resources?- What are the landed values?- Give the historical trends if possible?
Fisheries exploitation or activity-related benefits
- How many people are employed catching fish? Can this be broken down byfishery?
- What is the average wage of these people? And the variability in wages betweenfishers and over time?
- How does this compare with the average wage for comparable activities (definethese activities)
- What other activities are undertaken with respect to fishing?- trading- processing- other specify
- How many people are employed in each activity? Breakdown women and men
- What are average incomes and their variability for each activity? Breakdown forwomen and men
- Do fish resources play a role in food security? If so, how? How many people areaffected? How is the number changing over time?
D-26
- Are fish resources used to provide subsistence livelihoods? If so, how many peopleare involved? How is the number changing over time?
Wealth-related benefits
- Are fisheries managed on a fishery management plan basis? If so, how are theFisheries Management Units (FMUs) defined?
- What are the main FMUs?
- Has resource rent been estimated for any fisheries? If so which? What are theresults?
- Is access limited (restricted) for any fisheries? If so which? How is access limited?How do new entrants enter the fishery?
- If use rights exist, are they traded? What information is available on their price?
- How much revenue does the Government generate from fishing? What proportioncomes from domestic fishing? How is it raised? What proportion comes from foreignfishing? How is it raised?
Notes: An overview of some of the key issues relevant to this section is provided byAppendix A3. Special emphasis is given to the importance of empirical informationto inform the analysis of different fisheries management approaches (re: managementwhich focuses on activity-related vs. wealth-related approaches). Case study authorsshould recognise the importance of this empirical information, and attempt to securerelevant and high quality data (a key part of the study overall).
5. POLICY MAKING (5 to 10 pages)
Objective: to examine the policy context, policy frameworks and policy processesrelevant to fisheries management and economic development (poverty alleviation) ineach case study country;
Possible information sources: Government Reports; Research Publications; Donorand international organisations reports; NGO publications; Key interviews withGovernment staff; Key interviews with actors in the fisheries sector; Key interviewswith other policy experts;
Key questions / variables might include:
- How is poverty issue addressed at macroeconomic level? (Is there a PovertyReduction or Eradication Plan)
- What other policies have been applied to address poverty? (e.g. Factor and productmarket policies? Pro-poor spending on infrastructure? Policies to direct patterns ofgrowth?)
D-27
- What are the government’s objectives?
- Which organisations (Government, non-Government, civil society) are responsiblefor the design and implementation of policies and instruments for poverty reduction?
- What are the main instruments being used?
- What evaluations have been undertaken of these policies and instruments? Howsuccessful are they judged to have been? What factors explain their success orotherwise?
- How does the fishing sector figure in the policy? Is it specifically mentioned in thePRSP or similar?
- How does the view of the fishing sector differ between different Ministries (e.g.fisheries versus finance) and how are conflicting views reconciled?
- How is linkage between fish resources, economic growth and poverty reductionarticulated to policy makers?
- What socio-economic studies have been undertaken of the fisheries sector and howare the results implemented in policy terms?
- What role is played by NGOs, fisher and other organisations and civil society ingeneral?
- What factors affect the participation of poor people in economic growth activities,policy-making and implementation?
- Are there any data or research gaps relevant to improved policy-making that needto be addressed?
- What are the important areas for policy development in the future with reference tothe linkage between fisheries, economic growth and poverty reduction?(opportunities)
- What factors are likely to impact on the nature and rate of policy development inthese areas in the future? (constraints)
Notes: An overview of issues relevant to policy and governance is provided inAppendix A4, and it is important to recognise that policy analysis for many fisheriesin relation to economic development (and poverty reduction) is very limited in mostcountries. Case study authors may have to draw upon a wide range of informationsources (and to triangulate between them) in order to produce a succinct overview ofthe policy framework (in general) and the factors which affect policy performance.

D-28
5. CASE STUDY TERMS OF REFERENCE
The UK Department for International Development (DfID) seeks to increase thecontribution of fisheries to reducing poverty, by encouraging decision makers toadopt policies and measures that can be integrated in practical ways into broaderpoverty reduction processes.
To this end, it has commissioned IDDRA to undertake a study to identify the linksbetween poverty reduction and fisheries development under different policyarrangements
An important part of this study is a number of case studies which will provideempirical evidence on the role of fisheries in supporting growth and povertyreduction. The case studies will be undertaken in close collaboration with IDDRAstaff. Case study authors will make the following contributions to the overall study:
1. Comment on the background document, produced by IDDRA, which outlines themain issues in linking fisheries exploitation and poverty reduction. Comment inparticular on the proposed template for the case study reports, which is includedin the background report as section 4. On the basis of comments received,IDDRA will finalise the background report and the template.
2. On the basis of the finalised template (attached), write for their case studycountry a report of between 8,000 and 10,000 words, supported by appendiceswhere appropriate.
3. Provide, where they are in the public domain, copies of key source documents(e.g. PRSP or parts thereof relevant to fisheries, Fishery sector strategydocument, Fishery management plans for key fisheries, Studies of rents in keyfisheries, .....). Ideally, these documents should be provided in electronic format(Word or scanned).
4. Read and comment on the synthesis report and policy brief produced by IDDRAusing the background document and case study material.
Timing
Case studies will be commissioned as soon as possible following receipt ofcomments and finalisation of the background report and template.
Case study authors should provide a FIRST INTERIM PROGRESS REPORT BY7TH MARCH 2005. This report should include a status report on the work inprogress, annotations of the template and indications of available backgroundmaterial. It would be useful if copies of the material referred to in point 3 abovecould be supplied by this date.
Case study authors should provide a COMPLETE DRAFT REPORT BY 31MARCH 2005, plus copies of the material referred to in point 3 above.

D-29
Where necessary any revisions to the complete draft report must be completed by 30APRIL 2005.

D-30
6. CONCLUDING REMARKS
The current report is the main output of Phase 1 of the DFID/PASS project ‘The Roleof Fisheries in Poverty Alleviation and Growth: Past, Present and Future’. As abackground document to the study, it provides an overview of relevant conceptual,theoretical and empirical information in four areas – poverty and development,economic growth and fisheries, fisheries development and management, and policyand governance. This information is summarised in the main body of the report(underpinned by more detailed appendices) and is used to develop a methodology inthe form of a template for a series of national case-studies.
The information presented draws upon on a broad range of literature. This wasconsidered important in order to provide a good basis for research into the role offisheries in poverty alleviation and growth (the key objective). It is intended that theresearch should be informed by both fisheries and non-fisheries elements andperspectives, with the eventual outputs having implications for the fishery sector andother common pool resources, in terms of ensuring pro-poor growth.
The next phase (2) of the project will involve national case-studies implemented ineight developing countries using the study template. The resulting studies will besynthesised into a main report and used to produce a policy brief by June 2005.

D-31
APPENDICES

D-32
A1: POVERTY AND DEVELOPMENT – EVOLVING CONCEPTSAND APPROACHES
A1.1. INTRODUCTION AND OBJECTIVES
Poverty is a major global problem, with half of the world’s population living on lessthan $2/day. In the World Development Report (2000), the World Bank recognisedpoverty elimination as the “world’s greatest challenge”. The Organisation forEconomic Cooperation and Development (OECD) has proposed the internationaldevelopment target of reducing by half the proportion of people living in extremepoverty by 2015. International development agencies have responded with a widerange of new plans and interventions, making poverty alleviation the new priorityagenda for these organisations.
In parallel, debate and discussion, and research into key poverty issues has alsoincreased, covering areas such as poverty measurement, the identification of the poorand their characteristics, and the investigation of best policy approaches andinterventions for poverty alleviation. This has included an attempt to build uponrelated concepts and ideas – for example, what is the relationship between economicgrowth and poverty alleviation? – and, the possibility of learning from pastapproaches – for example, what is the impact of economic structural adjustmentprogrammes (SAP) on poverty in particular countries?
An important recent development has been the broadening of poverty definitions andanalyses – to explain poverty by looking at a range of factors (economic, social,institutional etc) – and to design interventions accordingly. At the same time, therehas been a renewed recognition of the role of economic growth in development, butgreater emphasis has been placed on the distribution of benefits as an importantfactor in poverty alleviation (the concept of ‘pro-poor growth’). In the followingbrief account, the relationship between the various concepts and ideas, and resultantpolicy approaches for poverty alleviation which have emerged over the past 50 yearswill be described. In turn, this will be used to identify relevant research priorities anddevelopment approaches, with regards to the role of natural resource management,and fisheries in particular (the focus of the current study).
There are three sections to follow. The first section addresses the fundamentalquestion ‘Who are the poor’ by examining the various methods used for measuringpoverty. The second section presents some empirical data from a selection of Africancountries derived from the application of these methods. The third section addressesthe second fundamental question ‘Why are people poor?’ and what policyapproaches are used for poverty alleviation.
A1.2. WHO ARE THE POOR? METHODS FOR MEASURING POVERTY
There are three broad categories of methods used to measure poverty – nutrition-based methods, basic needs and composite indicators, and income-based measures –as shown in Table 1.

D-33
First, in the case of nutrition-based methods, a poverty index can be generated bymeasuring the extent of food energy deficiency. There are two ways of doing this: (i)direct computation – by recording the energy intakes of individuals relative torequirements (e.g. in 1948, FAO started out by setting an average daily calorie intakerequirement for adults of 2,600 calories, an approach which has undergone variousrefinements since then); (ii) anthropological studies – which compare an individual’sphysiological condition with calibrated norms (e.g. for children – underweightcondition connected with poor nutrition in the past can be gauged by measuringheight-for-weight; for adults, various Body Mass Indices, BMI, are often employed).Overall, nutrition-based methods can give some idea of national malnourishment, butfail to capture the magnitude of the nutritional shortfall. In the case of directcomputation, there are various limitations for policy-making (e.g. the measurementsrepresent a ‘snapshot’ of calorie intake at one point in time). For anthropologicalstudies there are also various weaknesses (e.g. it is difficult to compare calibratednorms between countries).
Second, the basic needs and composite indicator methods arose in the 1970s in anattempt to reflect that human needs include food, but also health, education, water,shelter and transport (Streeten et al. 1982, p.7). The challenge was how to identify,measure and aggregate appropriate indicators into a common index. Threeapproaches evolved (i) UN Research Institute on Social Development (UNRISD)Index (1970) which included 19 core indicators forming a composite developmentindex. This was judged to be more sensitive than income-based indices to changes ineconomic and social conditions, but its principal weakness was that it tried tomeasure development based on structural change rather than human welfarerequirements; (ii) the Physical Quality of Life Index (PQLI) (after Morris, 1979)proposed three key variables as a basis – life expectancy at age 1, infant mortality,and literacy levels. While this index permitted international comparisons, it wascriticised for the variables included, and the arbitrary allocation of weightings toeach; (iii) the UN Human Development Index (1990) was designed to take intoaccount relative international income levels, and also how such incomes are spent.Computed annually by the UNDP since 1990, it combines proxies for individualliving standards (real GDP per capita), longevity (life expectancy at birth) andknowledge (educational attainment). The resulting index figure per country arebetween 0 (lowest level of development) and 1 (highest level). Overall, the HDI has

D-34
Table.1: Poverty measurement methodology – an overview (synthesized fromThorpe, 2004)
PovertyMeasurements
Method Comments
Nutrition-based Focus: Poverty index by measuring extent of foodenergy deficiency – 2 approaches;
(i) Direct computation: by recording the energyintakes of individuals relative to requirements:
- FAO World Food Survey (1948): set an averagedaily calorie intake of 2,600/person;
- FAO WFS (1952): level adjusted down to reflect‘needs’ in developing countries;
- FAO WFS (1974): minimum nutritionalbenchmark of 1.2 Resting Metabolic Rate(RMR); to prevent stunted growth and healthrisks;
- FAO WFS (1985): 1.4 RMR for active workinglife;
- FAO WFS (1996): attempts to integrate info onmetabolic rates and anthropometric studies togive robust assessment of nutritional deficiency;
(ii) Anthropological studies: compare an individual’sphysiological condition with calibrated norms; keyareas:
- children: (I) wasting – low weight for height(starvation); (ii) stunting – low height-for-age(prolonged under-nutrition); (iii) underweight – lowweight-for-age (past under-nutrition or currentvulnerability);- adults: use of Body Mass Indices (BMIs)
- overall give some idea of prevalence ofnational malnourishment, but fail to capturemagnitude of nutritional shortfall;
Some limitations for policy-making:- represent a ‘snapshot’ of calorie intake atone point in time;- global impact of disease is presumedconstant;- no account of behavioural adaptation tolow calorie intake;- underplays importance of nutrients (otherthan calories);
- give a general indication of nutrition andpoverty;- some limitations:- majority of studies tend to focus onvulnerable members of society (due toresource constraints);- difficult to compare calibrated normsbetween countries;- behavioural adaptation can affectinterpretation of results;
Basic needs andcompositeindicators
Focus: human needs include food, but also health,education, water, shelter and transport – problem ofhow to identify, quantify and aggregate into an index;various attempts:
(i) UN Research Institute on Social Development(UNRISD) Index (1970) – 16 core indicators forminga composite development index;
(ii) Physical Quality of Life Index (PQLI) (Morris,1979) – 3 variables: life expectancy at age 1, infantmortality and literacy levels;
(iii) UN Human Development Index (1990 -) –combines proxies for individual living standards (realGDP per capita), longevity (life expectancy at birth)and knowledge (educational attainment); the resultingindex figure per country are between 0 (lowest levelof development) and 1 (highest level).
- more sensitive than income-based indicesto changes in economic and socialconditions; emphasis on measuringstructural change;
- permitted international comparisons;criticised for variables included andweightings (arbitrary?);
- further extended concept of poverty, butsome weaknesses: (I) some factors notincluded (e.g. governance); (ii) weak onpolitics; (iii) data reliability (poor peoplereally included?); (iv) how are the individualfactors weighted?

D-35
Income-basedmeasures
Background: recent research has re-confirmed theimportance of income-based poverty indicators; Dietzand Gibson (1994) have shown a high degree ofcorrelation between GNP per capita and HDI;Isenman (1980) and Sen (1981) also note thecorrelation between BN-based indicators and averagereal incomes; Dasgupta and Wheale (1992) disclosethat political and civil liberties are positively relatedto real incomes per capita;
Focus: to quantify the number ofindividuals/households falling below selected povertyand destitution lines;
Note: 4 key decisions underpin all measures of thistype: (I) how to establish an actual poverty line; (ii)how to identify the extent of household poverty; (iii)how to treat non-traded goods and services; (iv) howto deal with under-reporting or mis-reporting ofincome;
Three measures:(i) The Headcount measure: the proportion of thepopulation (persons or households) whoseconsumption level falls below the specified povertyline;(ii) The Poverty Gap (PG) measure: quantifies theextent to which a poor person or household fallsbelow poverty line;(iii) Foster-Greer-Thorbecke (FGT) (1984) measure:or the squared poverty gap measure determinesincome variation amongst the poor;
Other measures:Indicators of the dimensions of relative poverty (orinequality) include:- US$1/day or US$2/day measures;- Bottom decile or quintile: proportion of income
received by the poorest 10 or 20 per cent;- Top decile or quintile: proportion of income in
top 10 or 20 percent;- Gini Coefficient (and Lorenz Curve) from 1
(perfect inequality – one person has all theincome) to 0 (income is divided equally amongstall);
- income based poverty measures reported atnational level are frequently decomposed toindicate how poverty levels vary accordingto place of residence (e.g. urban/rural),sector of employment (e.g. agriculture,industry, etc), gender and educational levelof household head. The resultant povertyprofiles enable policy-makers not only toidentify which societal sub-groups arevulnerable, but also to assess how proposedpoverty alleviation measures may impact onsuch ‘at-risk’ groups;
- income-based measures (of incomeshortfalls) also have limitations as a policy-guiding tool: (I) inflation needs to be takeninto account in determining and re-calculating poverty lines; (ii) provision ofpublic goods and services must also betreated carefully, and the social valueaggregated to reflect the true level ofhousehold income; (iii) inter-countrycomparisons must be treated with care (e.g.US$1/day is a useful indicator, but cannot beused to assess progress at the country levelor guide policy formulation).
helped to further extend the concepts of poverty and development, but it also hassome weaknesses (e.g. some key factors such as governance are not included, thereare questions about the reliability of the underlying data, and the weightings offactors).
Third, with regards to income-based measures, according to Thorpe (2004), althoughthe shortcomings of income-based measures (e.g. failure to include non-marketed

D-36
production and remedy distorted prices) originally spurred attempts to developcomplements and alternatives – and led to the emergence of the Basic Needs (BN)approach and the HDI – subsequent research has re-confirmed the importance ofincome-based indicators (e.g. Dietz and Gibson (1994) have shown a high degree ofcorrelation between GNP per capita and HDI; Isenman (1980) and Sen (1981) alsonote the correlation between BN-based indicators and average real incomes;Dasgupta and Wheale (1992) show that political and civil liberties are positivelyrelated to real incomes per capita). Overall, then, income-based measures aim toquantify the number of individuals or households falling below selected poverty anddestitution lines. According to Thorpe (2004), there are four key decisions whichunderpin all measures of this type: how to establish an actual poverty line, how toidentify the extent of household poverty, how to treat non-traded goods and services,and how to deal with under-reporting or mis-reporting of income. There are threemain measures: (i) the Headcount measure – the proportion of the population(persons or households) whose consumption level falls below the specified povertyline; (ii) the Poverty Gap measure – the extent to which a poor person falls below thepoverty line; (iii) the Foster-Greer-Thorbecke (FGT) measure (or the squared povertygap measure) – determines income variation amongst the poor.
Other indicators of relative poverty (or inequality) can also be calculated including:the ‘US$1/day’ or ‘US$2/day’ measures; income received by the top and bottomdeciles of the population; and Gini Coefficient (or Lorenz curve) expressing perfectinequality (value =1) to perfect equality income (value =0).
The reporting of income-based measures at national level provide a general overviewof poverty for policy-makers. They are also useful when decomposed to indicate howpoverty levels vary according to place of residence (e.g. urban/rural), sector ofemployment (e.g. agriculture, industry etc), gender and educational level of thehousehold head. This profiling exercise can help policy-makers to identify whichsocietal groups are vulnerable and how poverty alleviation interventions mightimpact on such ‘at risk’ groups.
However, income-based measures also have certain limitations for policy-makers.For example, the actual calculations must be transparent to see how factors suchinflation and the value of public service provision is treated. In addition, care isneeded with international comparisons involving measures such as the US$1 orUS$2/day incomes; although these are useful indicators of global progress, theycannot be used to assess progress at the country level or guide policy-formation.
A1.3. EMPIRICAL EXAMPLES OF POVERTY MEASUREMENT
In this sub-section, empirical examples of the results of poverty measurements, usingthe methods described above, from an arbitrary selection of countries in Africa areprovided by way of illustration.
First, Table 2 shows the prevalence of undernourishment (using a nutrition-basedmethod). The countries with highest prevalence are Somalia, Eritrea, Burundi andMozambique (percentage terms) and Ethiopia, Tanzania, Kenya and Mozambique(absolute numbers). Whilst Benin, Burkina Faso, Ghana, Mali, Mauritania, Nigeria

D-37
and Senegal have all seen the undernourished proportion of their population fallbetween 1979/81 and 1995/7, the reverse is true for Somalia, Tanzania, Madagascar,Namibia and Mozambique.
Second, Table 3 shows results using the Human Development Index (HDI), itscomponents and the Gender Development Index (GDI). In general, Africa comes outrelatively badly under the HDI, with African countries occupying the last 28 placesin this global league table. In Table 3, Ghana (119) and Kenya (123) have the highestrankings, and Burundi (160) and Burkina Faso (159) have the lowest. In general, forAfrica, Mauritius (63) is highest followed by Cape Verde (91) and South Africa (94).
Table 2 Prevalence of undernourishment in a selection of African countries
Undernourishment in Total PopulationPop 1996Number1995/7
Propn1979/81
Propn1990/2
Propn1995/7
Benin 5.5 0.8 36 21 15Burkina Faso 10.7 3.2 64 32 30Burundi 6.3 4.0 38 44 63Eritrea 3.3 2.2 NA NA 67Ethiopia 56.8 28.7 NA NA 51Ghana 18.2 2.0 61 29 11Kenya 27.8 11.4 25 47 41Madagascar 14.2 5.6 18 34 39Mali 10.2 2.9 59 30 29Mauritania 2.4 0.3 35 15 13Mozambique 17.9 11.3 54 66 63Nigeria 101.4 8.3 40 13 8Senegal 8.6 1.5 19 19 17Somalia 8.5 6.2 55 70 73Tanzania 30.7 12.3 23 30 40
Notes: Numbers are in millions, Popn are percentage figures. NA or non-availability of information. Source: FAO (1999; Table 1)
Table 3 Human Development Index (HDI), its components and the Gender DevelopmentIndex (GDI)
HDIRank
LifeExpect
Adult Lit(%)
Enrol (%) GDP GDI
Benin 147 53.6 39.0 45 933 134Burkina Faso 159 46.1 23.0 23 965 144Burundi 160 40.6 46.9 19 578 145Eritrea 148 51.8 52.7 26 880 133Ethiopia 158 44.1 37.4 27 628 142Ghana 119 56.6 70.3 42 1,881 108Kenya 123 51.3 81.5 51 1,022 112Madagascar 135 52.2 65.7 44 799 122Mali 153 51.2 39.8 28 753 138Mauritania 139 51.1 41.6 41 1,609 126Mozambique 157 39.8 43.2 23 861 141Nigeria 136 51.5 62.6 45 853 123Senegal 145 52.9 36.4 36 1,419 130Somalia - - - - - -Tanzania 140 51.1 74.7 32 501 124
Notes: Life Expect. Is life expectancy at Birth (1995); Adult literacy rate is the percentage aged 15 andabove (1999). Enrol. Is the Combined primary, secondary and tertiary gross enrolment ratio for 1999. GDPis GDP per capita (US$ adjusted in PPP terms, 1999), GDI is the Gender-related Development Index.Source: UNDP (2001: Tables 1 and 21)

D-38
Third, Table 4 presents the most recent income-based estimates for poverty in Africa.At a national level, over half of the populations of the following countries werebelow the poverty line – Burkina Faso, Madagascar, Mauritania and Tanzania. Theconverse was true for Benin, Burundi, Ghana, Kenya, Nigeria and Senegal (over50% population above the poverty line). Interestingly, for all countries, where datawere available in Table 4, the level of poverty was higher in rural compared to urbanareas.
Fourth, Table 5 presents the poverty measurements for selected African countriescompared to International Poverty Lines. Mali and Nigeria have the highestpercentage of their populations (70-90%) living below the US$1 and US$2/day lines.
Table 4 Population below the Poverty Line (Most Recent Surveys)
Percentage below LineYearRural Urban National
Benin 1995 - - 33Burkina Faso AAET 68.0 44.3 64.1Burundi 1990 - - 36.2Eritrea - - - -Ethiopia - - - -Ghana 1992 34.3 26.7 31.4Kenya 1992 46.4 29.3 42.0Madagascar 1993/4 77.0 47.0 70.0Mali - - - -Mauritania 1989/90 - - 57.0Mozambique - - - -Nigeria 1992/3 36.4 30.4 34.1Senegal AAET 49.7 40.9 46.1Somalia - - - -Tanzania 1991 - - 51.1
Notes: AAET in the year column refers to data sourced from Ali and Thorbecke (2000: Tables A6 and A7);Source: World Bank (2000, Table 4);
Table 5. International Poverty Lines (Relative Poverty)
US$1 a Day US$2 a DaySurvey Year% Popbelow
Poverty Gap(%)
% Pop below Poverty Gap(%)
Benin - - - - -Burkina Faso 1994 61.2 25.5 85.8 50.9Burundi - - - - -Eritrea - - - - -Ethiopia 1995 31.3 8.0 76.4 32.9Ghana - - - - -Kenya 1994 26.5 9.0 62.3 27.5Madagascar 1993 60.2 24.5 88.8 51.3Mali 1994 72.8 37.4 90.6 60.5Mauritania 1995 3.8 1.0 22.1 6.6Mozambique 1996 37.9 12.0 78.4 36.8Nigeria 1997 70.2 34.9 90.8 59.0Senegal 1995 26.3 7.0 67.8 28.2Somalia - - - - -Tanzania 1993 19.9 4.8 59.7 23.0
Source: World Bank (2000: Table 4)

D-39
Fifth, Table 6 shows the results for Inequality in Africa (income-based). Forexample, in Nigeria, Mali and Burkina Faso, the richest 10% of the populationaccount for about 40% of total national income/consumption, whereas the poorest10% account for 1-2% of total national income, with Gini Coefficients of about 0.5or above reflecting this level of inequality.
Finally, before leaving this section, it is important to re-emphasise the complexity ofpoverty measurement. Thorpe (2004) in his overview, leaves this to Szekely et al(2000, p.29)
‘So how much poverty is there…? The answer is that it depends. It is largely drivenby the choice of equivalence scales, assumptions about the existence of economies ofscale in consumption, the way in which missing and zero incomes are treated, and bythe way in which the data is adjusted or not for mis-reporting. It also depends on thedefinition of the poverty line, on the index chosen to summarise the information, andon other choices…’
A1.4. WHY ARE PEOPLE POOR? AND WHAT POLICIES ARE NEEDEDFOR POVERTY ALLEVIATION?
The poverty measures presented above provide an indication of the scale of theproblem which needs to be addressed. They cannot provide any explanation on whypeople are poor or why poverty is so significant in particular countries. Clearly, inorder to address poverty through specific policy actions, it is essential to understandthe circumstances and factors which have led to this state. Since the 1950s,development economists have attempted to provide this understanding, leading to aseries of development theories, which have been used to varying degrees by nationalgovernments and bi-lateral and multi-lateral assistance agencies to formulate andimplement policies for development and poverty alleviation. In the following section,
Table 6. Inequality in Africa
Survey Year Poorest 10% Poorest 20% Richest 10% Gini CoefficientBenin - - - - -Burkina Faso 1994 2.2 5.5 39.5 0.482Burundi 1992 3.4 7.9 26.6 0.333Eritrea - - - - -Ethiopia 1995 3.0 7.1 33.7 0.40Ghana 1998 2.4 5.9 29.5 0.396Kenya 1994 1.8 5.0 34.9 0.445Madagascar 1997 2.2 5.4 37.3 0.46Mali 1994 1.8 4.6 40.4 0.505Mauritania 1995 2.5 6.4 28.4 0.373Mozambique 1996/97 2.5 6.5 31.7 0.396Nigeria 1996/97 1.6 4.4 40.8 0.506Senegal 1995 2.6 6.4 33.5 0.413Somalia - - - - -Tanzania 1993 2.8 6.8 30.1 0.382
Notes: The Poorest/Richest columns refer to this decile/quintiles share of total income / consumption.Source: UNDP (2001: Table 12)

D-40
a brief overview will be presented of the evolution of development theory, and theresultant policy approaches which have emerged and have been applied, withparticular reference to natural resources, agriculture and fisheries.
It is important to note that despite the fact that over 1 billion people are living inpoverty today, the past 25 years have also seen unprecedented progress in thedeveloping world. For example, per capita income has doubled, life expectancy hasincreased by ten years, and infant mortality rates have been halved. However, thisoverall pattern conceals an extremely uneven pattern of progress – while East Asiancountries have made significant progress, 36 countries (19 in Sub-Saharan Africa)are poorer today than they were a generation ago.
Thirlwell (1994) proposes that four types of low-income countries (with high levelsof poverty) can be distinguished:
- countries with low per capita incomes but experiencing rapid progress and withenormous future potential based on indigenous resources;
- countries with rising per capita incomes but with less hope of rapid self-sustaining growth because of resource limitations;
- countries rich in resources, but with per capita income still relatively stagnant;- countries with a stationary per capita income and with little prospect of raising
living standards;
From one perspective, this simple classification emphasises that a rise in real nationalincome (i.e. economic growth) is an important basis for development (and thealleviation of poverty). However, in recent years, many development economistshave stressed that development must imply more than just economic growth, andshould be a sustained secular rise in real income accompanied by changes in socialattitudes and customs which have in the past impeded economic advance. Meier(1995) explains that economic development is not simply economic growth
‘Development involves growth plus change, that is, there are certain qualitativedimensions in the development process that extend beyond the growth and expansionof the economy. The qualitative dimensions will manifest themselves certainly as theimproved performance of factors of production and new technologies, but alsothrough the development of new institutions, and a change in attitudes and values’
The way in which development theories and associated policies have emerged in thepast 50 years has been characterised by a number of re-curing themes, as follows:
- the long-time debate over the role and relationship between economic growth andincreases in welfare at the national level;
- overlapping (and often confusing) definitions and usage of the terms economicgrowth, development, economic development and sustainable development;
- the emergence of ‘poverty’ as a specific topic and policy area;- the difficulty of integrating macro- and micro-level study findings and policy
actions;- the varying roles given to natural resources sectors (including agriculture and
fisheries) in development and poverty alleviation;

D-41
It is possible to identify at least eight phases of development theory and policyevolution since 1950. Table 6 provides a detailed overview of these phases withparticular reference to agriculture and fisheries policy in developing countries (Adetailed explanation of these phases can be found in Neiland 2001). In summary,however, development thinking has centred on the following themes:
First, economic growth and poverty reduction – what have we learned from the past?- it was initially assumed that development was synonymous with economic growth,and that economic growth leads to poverty reduction. This seemed to be confirmedby the experience of many East Asian countries during the 1970s and 1980s. In otherwords, by introducing the policies for economic growth which had worked in E.Asia,to other parts of the world, poverty alleviation would soon follow. This centredmainly on policies for structural adjustment or neo-liberal programmes, designed topromote broad-based economic growth and human capital development, which weresupported by the World Bank and IMF. However, despite some initial success, theSAP also attracted widespread criticisms – it was found that a standard SAP policypackage could not be easily applied to the countries of the South, especially in Africawhere human, institutional, economic and infrastructure barriers were significant;also SAP requires a relatively long transitional period (3-10 years?), with identifiablehuman costs that inordinately burden the low income groups, in addition to theuncertainly over the linkage between economic growth and poverty reduction inmany countries. In other words, could it be assumed that economic growth would bepro-poor in a majority of situations?
What other lessons does the development record of the past 50 years reveal? Ingeneral, many commentators indicate that there is room for cautious optimism inmost situations. The literature (e.g. Grindle, 1991; Lal, 1995; Meier, 1995; andSutton, 1999) indicates that ultimately the major issue is the quality of governmentpolicy-making and the role of politics in determining that quality. There are manydimensions to this relationship, as follows:
(i) Political stability: it is difficult to say what type of political regime is best fordevelopment, but political instability matters – political instability hinderseconomic development;
(ii) Markets: They appear to be a necessary (but not sufficient alone) fordemocracy; decentralisation of power in markets prevents politicalmonopoly;
(iii) Domestic constituency: Policy reforms depend on the emergence ofconstituencies (associations of citizens who organise themselves with acommon objective in mind);
(iv) Strong/weak states: More significant that the strength of the state is thequality of the state-craft (or governance) – the quality of policy decisions,their credibility, their transparency, and the administrative capacity toimplement policies;
(v) Change: This can occur for various reasons including the rapid emergence ofenlightened leadership and technocrats, or the slower and more subtlechanges that are possible through the political reform process.

D-42
Second, access to benefits must complement the generation or availability of benefits- the implementation of the SAP and the investigation of its impact, particularly inAfrica, led to a better understanding of the mechanisms by which people andhouseholds in developing countries can become vulnerable to impoverishment, oralternatively, how they prosper and capitalise on new opportunities which arise.Fundamentally, the capability to access economic benefits is crucial, and this will bedetermined by the person’s or household’s position in society. Sen (1981) asked‘why did people starve in conditions of plenty?’ The answer was entitlement collapse– starvation could not simply be equated with food shortages (a production problem),but could equally be a consequence of a lack of purchasing power (a trade/exchangefailing). According to Sen (1981)
“A person’s ability to command food…depends on the entitlement relations thatgovern possession and use in that society. It depends on what he owns, whatexchange possibilities are offered to him, what is given to him free, and what is takenaway from him” (p.154-155)
Building upon Sen’s and other work, the emergence of new, broad-based and multi-disciplinary approaches to poverty analysis, and in particular, the sustainablelivelihoods approach and techniques such as poverty profiling, have opened up awide debate on how poverty should be measured, assessed and deal with. Forexample, the World Bank appears to have complemented its conventional approach(income poverty) with a more multi-dimensional model based on a capital assetframework, as explained by Radoki (1999):
‘The crucial determinants of households’ ability to achieve increased well-being aretheir access to capital assets and the effects of external conditioning variables whichconstrain or encourage the productive use and accumulation of such assets’ (p.322)
Third, policy approaches for dealing with the complexity of poverty – there has beenan increasing level of political attention and financial commitment to internationaldevelopment and poverty reduction in the past five years leading to the adoption ofthe Millennium Development Goals and the Poverty Reduction Strategy Paperapproach by most international agencies. Lopez (2004) also observes that at the sametime
‘there is an on-going debate over the elements that should be at the center of anysensible poverty reducing strategy. Should such a strategy have a growth bias orinstead mainly concentrate on empowering the poor to benefit from growth? Isinequality affected in general by growth? How does existing inequality affect theimpact of growth on poverty, and how does inequality affect growth? Moreimportantly, which policies should be at the center of a poverty-reducing strategy?”(p.2)
The topic of ‘pro-poor growth’ has emerged has emerged in recent years and there isan increasing level of research activity attempting to better understand its meaningand application. Lopez (2004) on the basis of his wide-ranging review ‘Pro-PoorGrowth: A review of what we know (and what we don’t)’ reaches the followingconclusions:

D-43
There seems to be a general consensus in a few areas:(i) Growth is fundamental for poverty reduction, and in principle growth as such
does not seem to affect inequality;(ii) Growth accompanied by progressive distributional change is better than
growth alone;(iii) High initial inequality is a brake on poverty reduction;(iv) Poverty itself is also likely to be a barrier for poverty reduction;(v) Asset inequality seems to predict lower future growth rates;(vi) Education, infrastructure and macroeconomic stability seem to positively
affect both growth and distribution of income;
Lopez continues ‘Beyond this, there seems to be little agreement. We still do notknow enough about the potential impact of income inequality and redistribution ongrowth, and we know very little about the potential impact that a number of policies(trade, financial sector liberalisation, fiscal adjustment among others) have oninequality in general.
DFID (2004a/b) in two recent briefing sheets define pro-poor growth (the absolutedefinition) as
‘…the average growth rate of the incomes of poor people’ (p.1).
It is interesting to note that this is an ‘income-defined’ measure of poverty status (asopposed to more broadly-based poverty indicators or approaches). The absolutedefinition of pro-poor growth considers only the incomes of poor people. DFID(2004) explain that
‘the ‘pro-poor’ growth banner is useful because it aligns economic growth withchanges in the well-being of the poor. This helps to build coalitions betweendeveloping–country governments, the private sector and donors. In particular, itmakes clear that policy-makers do not have to choose between ‘pro-poor growth’ andpro-poor’ policies. The two outcomes overlap because most policies that increasegrowth also reduce poverty, and many policies that are effective for reducing povertyalso increase growth’ (p.3)
Another important dimension is that of pro-poor growth and inequality – apreference for the absolute definition of pro-poor growth does not imply thatinequality should be ignored in the design of poverty reduction strategies. Indeed,policy-makers should integrate overall growth rate with changes in inequality to findthe most pro-poor policy outcomes.
So what are the policies needed to raise the rate of pro-poor growth? DFID (2004b)proposes four broad conditions as follows:
(i) Create strong incentives for investment;(ii) Foster international economic links;(iii) Provide broad access to assets and markets;(iv) Reduce risk and vulnerability;

D-44
To elaborate more on these four points, first, private investment is essential forgrowth, and governments have an important role in facilitating this by providing astable and secure national context (e.g. by putting in place sound macro-economicpolicies and protecting legal rights). Second, the integration of the world economyoffers opportunities for developing countries, as new markets, business partners,jobs, goods and services become available. Both policy and non-policy barriers (e.g.tariff barriers and transport infrastructure) need to be overcome to promoteinternational trade. Third, people need access to a broad range of assets (human,physical, financial, natural and social), and government can help (e.g. widespreadschooling of good quality and access to primary health care increases the poor’shuman assets). People also need access to a wide range of markets (e.g. input,consumable and labour markets), and governments can again help to lower the mainbarriers (e.g. transportation infrastructure and social structures). Fourth, measures areneeded to reduce the effects on poor people of risk, vulnerability and adversepersonal circumstances. For example, governments can do this by pursuing stableeconomic policies, or by schemes which broaden access to assets and markets forpoor households (helping to smooth out consumption and income).
Finally, it should be noted that the four conditions to promote pro-poor growthinvolve both trade-offs and choices. For example, encouraging international trademay expose rural producers to greater income risks from fluctuating commodityprices. Given limited budgets, governments face hard choices between expenditureon health, education and infrastructure investments. Ultimately, success in achievingpro-poor growth, through these meeting four conditions, will depend on the qualityof a country’s governance – requiring strong political leadership, persistence andexternal support.
A1.5. BIBLIOGRAPHY
Dasgupta, P. and Wheale, M. (1992) On Measuring the Quality of Life. WorldDevelopment 20(1): 119-31.
DFID (2004a) What is Pro-Poor Growth and Why Do We Need to Know? Pro-PoorGrowth Briefing Note 1. (Feb). London: DFID.
DFID (2004b) How to Accelerate Pro-Poor Growth: A Basic Framework for PolicyAnalysis. Pro-Poor Growth Briefing Note 2 (Sept). London: DFID.
Dietz, J.L. and Gibson, L. (1994) What is Development?: The Human DevelopmentIndex: A new Measure of Progress? [mimeo] Fullerton: California State University.
FAO (1948) World Food Survey, Rome: FAO.
FAO (1974) The Fourth World Food Survey. Rome: FAO.
FAO (1985) The Fifth World Food Survey. Rome: FAO.
FAO (1996) The Sixth World Food Survey. Rome: FAO.

D-45
FAO (1999) The State of Food Insecurity in the World. Rome: FAO.
Foster, J., Greer, J. and Thorbecke, E. (1984) A Class of Decomposable PovertyMeasures. Econometrica 52, 761-5.
Grindle, M. (1991) The New Political Economy: Positive Economics and NegativePolitics. In: Meier, G. (ed) Politics and Policy-making in Developing Countries:Perspectives on the New Political Economy. San Francisco: ICS Press.
Isenman, P. (1980) Basic Needs: The Case of Sri Lanka. World Development 8(3):237-58.
Lal, D. (1995) The Misconceptions of Development Economics. Pp. 56-64. In:Corbridge, S. (ed) Development Studies: A Reader. London: Edward Arnold.
Lopez, J.H. (2004) Pro-Poor Growth: A Review of What We Know (and What WeDon’t). Washington DC: World Bank.
Meier, G.M. (1995) Leading Issues in Development Economics. New York, Oxford:Oxford University Press.
Morris, M.D. (1979) Measuring the Condition of the World’s Poor: The PLQI Index.Oxford: Pergamon Press.
Neiland, A.E. (2001) A Multi-disciplinary Investigation of Artisanal Fisheries inNorth East Nigeria with Particular Reference to Resource Management, EconomicDevelopment and Policy Analysis. PhD Thesis, University of Portsmouth, unpub.
Neiland, A.E. and Bene, C. (eds) (2004) Poverty and Small-scale Fisheries in WestAfrica. Kluwer Academic Publishers.
Radoki, C. (1999) A Capital Assets Framework for Analysing Household LivelihoodStrategies: Implications for Policy. Development Policy Review 17: 315-42.
Sen, A. (1981) Public Action and the Quality of Life in Developing Countries.Oxford Bulletin of Economics and Statistics 43(4): 287-319.
Sen, A. (1981a) Poverty and Famines: An Essay on Entitlement and Deprivation.Oxford: Oxford University Press.
Streeten, P., Burki, S.J., ul Haq M., Hicks, and Stewart, F. (eds) (1982) First ThingsFirst: Meeting Basic Needs in Deveoping Countries. Oxford: Oxford UniversityPress.
Sutton, R. (1999) The Policy Process: An Overview. ODI Working Paper No. 118.London: ODI.

D-46
Szekely, M., Lustig, N., Cumpa, M., and Meija, J.A. (2000) Do We Know HowMuch Poverty There Is? Inter-American Development Bank Research DepartmentWorking Paper No 437 Washington DC.
Thirlwell, A.P. (1994) Growth and Development. Basingstoke and London: TheMacMillan Press Ltd.
Thorpe, A. (2004) The Nature and Causes of Poverty: An Overview. In: Neiland,A.E. and Bene, C. (eds) Poverty and Small-scale Fisheries in West Africa.Dordrecht: Kluwer Academic Publishers. Pp. 9-36.
UNDP (2001) Human Development Report. Oxford: Oxford University Press.
UNDP (1997) Human Development Report. Oxford: Oxford University Press.
UNDP (1995) Human Development Report. Oxford: Oxford University Press.
UNDP (1992) Human Development Report. Oxford: Oxford University Press.
UNRISD (1970) Contents and Measurements of Socioeconomic Development.Geneva: United Nations Research Institute for Social Development.
World Bank (2000) World Development Report 2000/1: Attacking Poverty. NewYork: Oxford University Press.
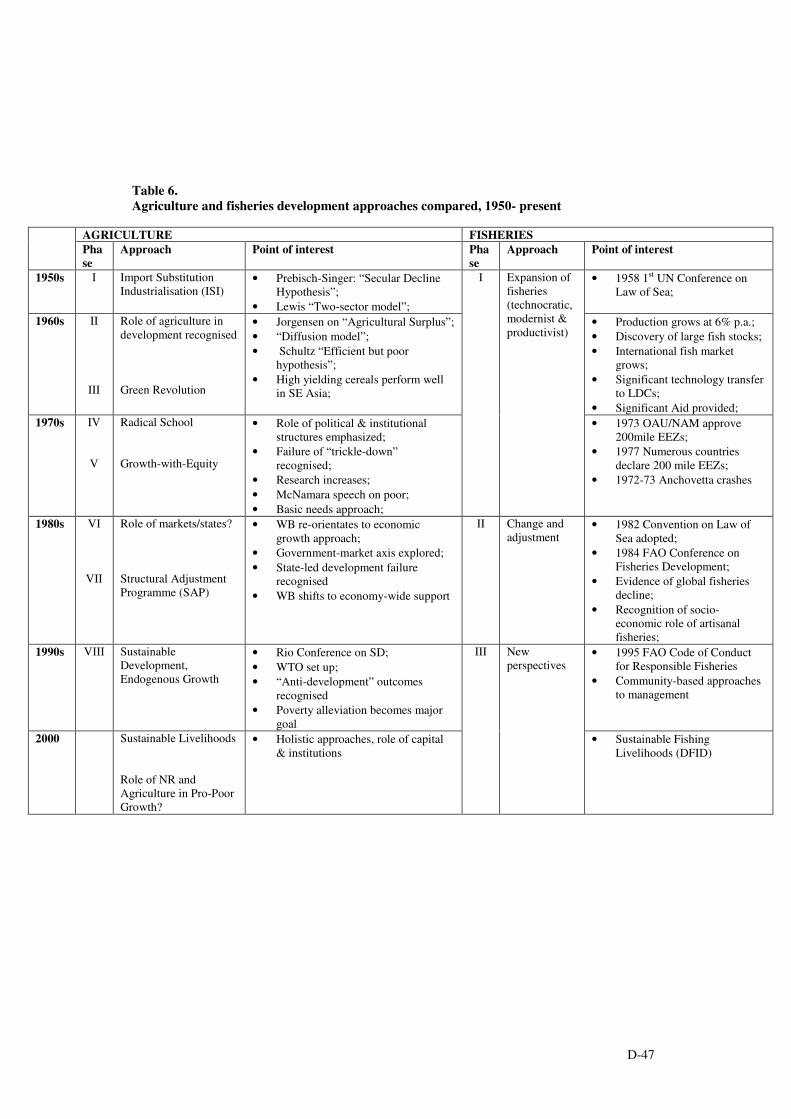
D-47
Table 6.Agriculture and fisheries development approaches compared, 1950- present
AGRICULTURE FISHERIESPhase
Approach Point of interest Phase
Approach Point of interest
1950s I Import SubstitutionIndustrialisation (ISI)
• Prebisch-Singer: “Secular DeclineHypothesis”;
• Lewis “Two-sector model”;
• 1958 1st UN Conference onLaw of Sea;
1960s II
III
Role of agriculture indevelopment recognised
Green Revolution
• Jorgensen on “Agricultural Surplus”;• “Diffusion model”;• Schultz “Efficient but poor
hypothesis”;• High yielding cereals perform well
in SE Asia;
• Production grows at 6% p.a.;• Discovery of large fish stocks;• International fish market
grows;• Significant technology transfer
to LDCs;• Significant Aid provided;
1970s IV
V
Radical School
Growth-with-Equity
• Role of political & institutionalstructures emphasized;
• Failure of “trickle-down”recognised;
• Research increases;• McNamara speech on poor;• Basic needs approach;
I Expansion offisheries(technocratic,modernist &productivist)
• 1973 OAU/NAM approve200mile EEZs;
• 1977 Numerous countriesdeclare 200 mile EEZs;
• 1972-73 Anchovetta crashes
1980s VI
VII
Role of markets/states?
Structural AdjustmentProgramme (SAP)
• WB re-orientates to economicgrowth approach;
• Government-market axis explored;• State-led development failure
recognised• WB shifts to economy-wide support
II Change andadjustment
• 1982 Convention on Law ofSea adopted;
• 1984 FAO Conference onFisheries Development;
• Evidence of global fisheriesdecline;
• Recognition of socio-economic role of artisanalfisheries;
1990s VIII SustainableDevelopment,Endogenous Growth
• Rio Conference on SD;• WTO set up;• “Anti-development” outcomes
recognised• Poverty alleviation becomes major
goal
• 1995 FAO Code of Conductfor Responsible Fisheries
• Community-based approachesto management
2000 Sustainable Livelihoods
Role of NR andAgriculture in Pro-PoorGrowth?
• Holistic approaches, role of capital& institutions
III Newperspectives
• Sustainable FishingLivelihoods (DFID)
D-48
A2 ECONOMIC GROWTH AND FISHERIES
A2.1. INTRODUCTION
There is widespread agreement that economic growth is an important, probably themost important, factor enabling poverty to be reduced in an economy. DfID (2004)estimates that many African countries require annual growth rates of 7% if they areto achieve the Millennium Development Goals by 2015. However, although anecessary condition, economic growth alone will not be sufficient since there is aneed to ensure that it also contributes to poverty reduction. This view was re-affirmed by the May 2004 Shanghai Agenda on Poverty Reduction, which arguedthat growth is critical for job creation and poverty reduction but it must be pro-poorand accompanied by investments in poor people through adequate and effectiveservice delivery.
Given the importance of economic growth, this appendix looks first at the factorsthat determine growth and at some explanations why the growth performance ofcountries has differed through time. It then looks at some growth issues of particularrelevance to the fisheries sector.
A2.2. THE BIG PICTURE
The fundamental economic principles
Economic growth is a macroeconomic issue. For many years, the factors thatdetermined economic growth were a settled matter in economics. Broadly speaking,so-called classical economists beginning with Adam Smith argued that growthdepended on increasing the quantity and the quality of the three main factors ofproduction: land, labour and capital. But the quantity of land is basically fixed. Andincreasing the quantity of labour cannot have much impact on living standardsbecause it is output per capita that matters. This leaves two major sources of growth:
• Increases in the quantity of capital through saving and investment (capitalaccumulation)
• Increases in the quality of land, labour and capital
And the way in which increases could be achieved were through:• High levels of saving and investment leading to capital accumulation• Increased efficiency through division of labour and through free trade
(which would effectively increase the size of the market), througheducation, through technological progress and through laws andinstitutions.
This theory was challenged in the 1950s by the view that economic growth wasexogenous. It is not worth going into detail here concerning this theory. In essence, itwas argued that many of the factors identified had only a short run, transitory impactand that in the long run, economic growth depended only on population growth andtechnological progress. It was further argued that both of these factors were not

D-49
determined by economic factors. The important conclusion was that economic policywas irrelevant for economic growth.
This exogenous growth theory held sway for a couple of decades, but by the 1980swas increasingly called into question. In particular, if it were true, how was itpossible to explain the divergent growth performance of countries over long periodsof time?
Gradually, the classical economic theory outlined (very briefly) above wasrehabilitated. The main argument was that technological progress is not, in fact,exogenous but depends on a range of economic factors. Hence, it is endogenous, andso is economic growth, meaning that economic policy does matter after all, in exactlythe way that classical economists had argued for about 200 years....
Endogenous growth theory, as it is now called, identifies numerous factorsdetermining economic growth that depend on government policy. These factors areall to be found at the macroeconomic level. Among the most important appear to bethe following five factors:
• Free trade• Stable prices• Private enterprise• A well-educated and healthy labour force• Diversified exports without the dominance of a few primary products
Clearly, each of these factors is beyond the scope of any single sector of theeconomy. When looking therefore at a sector, such as fishing, the question is howbest can the sector contribute to macroeconomic goals in order to contribute toeconomic growth.
It must also be recognised that, whilst achieving economic growth is an importantmacroeconomic objective, governments are faced with other macroeconomicimperatives. In developing countries, these other imperatives may dominate thedebate (the need to provide livelihoods for the poor for instance) and the fisheriessector may be used in this way, rather than maximising its potential growthcontribution.
It is important to recognise however that in many countries, the current state of thefisheries sector is not due to a benign policy intended to help the poor, but rather tothe mismanagement of the sector which has resulted in the impoverishment ofotherwise wealthy fish resources and the creation of poverty traps for large numbersof poor fishers.
There appear to be very few examples of countries where the macroeconomic role ofthe fisheries sector has been evaluated and an appropriate policy determined. Instead,the history of fisheries management, by and large, is one of fire-fighting, withattempts to conserve the resource base being by far the dominant policy goal.

D-50
Policy reform and economic growth
It is the role of economic theory and empirical evidence to identify the factors thatdetermine economic growth. Assuming that growth is an objective, it is the role ofthe political process to implement the necessary policy reforms in order to generatethe growth. The record of countries is variable in this regard.
One reason for the different economic growth performance of different countries isperhaps related to knowledge of the factors determining growth. Following thecollapse of communism at the end of the 1980s and the beginning of the 1990s, therehas been general acceptance across the political spectrum of the importance ofmarket-based economic and institutional reform for growth.
Another reason for different performance is to do with politics. The case of Ugandais instructive. Idi Amin took power in 1971. Taking the level of real per capita GDPas 100 then, by the time that he was overthrown in 1979, after 8 years of economicmismanagement and conflict, the value had fallen to around 65, a decline of onethird. His departure did not make an immediate economic difference, and it was onlywhen Yoweri Museveni came to power in 1986 that things began to improve. By1995, real per capita GDP had reached a level of 87 (on the same index), still 13%below the level it had been in 1970 before Idi Amin took power. The potential forpoliticians to make a difference, at least negatively, is clearly immense.
Another difficulty is that many of the policies that promote economic growth areeffectively investments in the sense that they involve some sacrifice now in return fora gain in the future. But there are important differences. With a private investment, itis usually the same person who makes the sacrifice and reaps the gain. In the case ofeconomic growth, however, there is no guarantee that those who make the sacrificewill be those who reap the gain.
Macroeconomic growth policy may, for instance, involve unemployment in the shortrun associated with changes in economic structure. Since most governments havepolicies in place to deal with unemployment, they may be reluctant to adopt otherpolicies which will worsen their performance, even in the short run, particularlygiven the election cycle in democratic countries.
Governments are faced with the classic social welfare problem that some will gainand some will lose. Although in principle the gainers should be able to compensatethe losers, with there still being a net gain, everyone knows that in practicecompensation is hardly ever forthcoming. Moreover, in many cases, the losers are asmall identifiable group, each of whom stands to lose significantly, whereas thegainers are a large, often unidentifiable group, each of whom stands to make arelatively small gain. As a result, it is far more in the losers interest to organisethemselves into an effective lobby group to resist change.
Finally, there is the problem that politicians have their own welfare functions toconsider. The theory of public choice argues, in essence, that politicians are more

D-51
interested in pursuing policies that will enhance their own welfare than that of theirconstituents.
There are many reasons therefore why reform leading to increased economic growthmay be slow in coming, even if the factors leading to growth are widely recognised.
A2.3. ISSUES CONCERNING GROWTH AND THE FISHERIES SECTOR
Having looked at the issue of growth from the viewpoint of the macroeconomy, thissection looks at two issues concerning economic growth that have particularimplications for the fisheries sector. The first is the relationship betweenliberalisation and growth, and the second is the problem of dependence on naturalresources, like fish.
Relationship between free trade and growth in fisheries
A key issue for economic growth in general is liberalisation, in particular free tradein goods and services. Fishing however is something of a special case.
Whilst liberalisation may be a good thing per se, in the case of fishing perverseeffects may be encountered depending on the fishery management regime. The issueof liberalising trade in fish products and services has been extensively examined bythe OECD.
Hannesson's "most important conclusion […] is the critical role of fisheriesmanagement for the effect of market liberalisation, whether it be of trade in fishproducts, investment, or trade in fishing services" (2001, p.25).
The fisheries management system is important because the gains from trade,resulting from liberalisation in either processed or unprocessed fish, will be reflected,to a large extent, in increased (potential) resource rents. The impact of this increasein resource rent will be the same as if it had come from any other source. To beginwith, it will show up in the operating profits of the fishing industry, providing anincentive for existing fishers to increase fishing effort as well as for new entrants.The effect of this incentive will depend on the fishery management system. If there isno effective control on fishing effort then, in the usual way, such effort will increaseuntil resource rents are dissipated. If, however, an economically efficientmanagement system exists, then either the increase in resource rents can be extractedor it can be capitalised into the price of a use-right (or some combination of the two).Fishing effort will then increase only to the extent that it is economically rational forit to do so and the management system will thus result in a sustainable increase in thewealth that is generated by the fish resource, and hence a sustainable increasedcontribution to economic growth.
How exactly do the gains from trade liberalisation appear? If trade is to beliberalised, the implication is that there is currently some impediment to trade. Anobvious example is a tariff t, in which case fish exporters receive a price p, but fishimporters must pay a price p+t. Many other barriers to trade exist (e.g. quantitative

D-52
import restrictions, sanitary requirements etc) but it is possible to reduce any givenbarrier to its tariff equivalent. From an analytical point of view, it is sufficienttherefore to analyse what happens in the case of tariffs.
A tariff obviously opens up a price differential between fish exporters and fishimporters. Since exports become more expensive, domestic producers of the sameproduct (or service) are offered some protection, this being the primary purpose oftariffs (although at one time they also served as a revenue generating device forGovernments).
Trade liberalisation closes the price differential. Generally, it might be expected thatprices will rise somewhat in the exporting country and fall somewhat in theimporting country. Liberalisation will increase the gains from trade for bothimporting and exporting countries (the exact share of the gains will depend ondemand and supply curves and on other factors such as the relative sizes of thecountries).
In the case of fish, however, there is not necessarily a gain for the exporting country,if that country does not have an effective fishery management system in place. Thiscounter-intuitive result is not easy to generalise because much depends on thedetailed management arrangements in place in the trading countries.
Consider first, however, a quite typical case of a fish exporting country that haseither an open access fishery, or one which is poorly managed so that accessconditions approximate to open access (so-called regulated open access). Tradeliberalisation will increase export prices. We know from Appendix 1 that an openaccess fishery will be overexploited economically (overcapacity) and possibly alsobiologically (overfishing). The increase in prices will worsen the overcapacityproblem, and will also increase the exploitation level which may worsen or begin anoverfishing problem depending on the starting point. The fish exporting country islikely therefore to lose from trade liberalisation.
What happens in the fish importing country also depends on the fishery managementregime that it has in place. If it too operates under conditions of open access, then itwill obtain a double dividend. First, it will gain because it will have more fishavailable at a lower price. Second, it will gain because the lower price of fish willreduce the level of exploitation in its own overexploited fish stocks, enabling them torecover to some extent.
Similar results are obtained if the fish exporting country is managing its fishery usingan overall quota (TAC) system, without individual quotas. Once the TAC is caught,the fishery is simply closed. Such fisheries are well known for having overcapacity.If trade liberalisation occurs with such a fishery, once again the fish exportingcountry is likely to lose and the fish importing country gain. In this case, the totalcatch cannot change because it is constrained by the TAC. But the increase in fishprice will attract more labour and capital to the fishery in the fish exporting country.Such increases represent pure waste because no more fish can be landed (because of

D-53
the TAC limit). All that will happen therefore is that more fishers using more vesselswill land the same amount of fish in a shorter time.
In the fish importing country, the opposite impact will occur. Fish price reductionswill cause a reduction in fishing capacity (in the long run anyway) leading to theavailable TAC being caught with fewer resources. Once again the fish importingcountry will get a double dividend, this time in the form of more fish available at alower price, and a reduction in inputs devoted to fishing.
Only if both countries have an economically efficient management regime (eg ITQs,licences or taxation) will standard international trade theory results apply. Whereboth have efficient regimes, gains to the fish exporting country will come in the formof increased resource rents, because higher fish prices will drive up the price of ITQsor enable higher resource rentals to be levied. The opposite will occur in the fishimporting country. Those fishers who compete with the exporting country will findtheir rents reduced. The fish importing country will still gain from having more fishavailable at a lower price, but there will be no double dividend in this case.
Impact of natural resources and geography on economic growth
The importance of natural resources, such as fish, to a country is one of manygeographical and other natural factors that may impact upon economic growth. Somefactors, such as whether a country is landlocked or not, are clearly beyond the realmof policy, but others such as the extent to which, and the way in which, a countrydepends economically on natural resources are not.
Economic research suggests the following broad results:• Being situated in the tropics tends to reduce a country's annual rate of
economic growth per capita by more than 1 percentage point, ceterisparibus. The main problem seems to be the heat, but the concentration ofmalaria on tropical countries is also a factor, as is the AIDS pandemic insub-Saharan Africa. In any event, tropical countries tend to be poor
• Being landlocked also tends to reduce growth by about half a percentagepoint, ceteris paribus. The fact that there are some very wealthylandlocked states (Switzerland for instance) does not alter this generalconclusion
• Heavy dependence on natural resources (oil, minerals, fish, forests and soon) also reduces economic growth, regardless of how dependence ismeasured (eg share of the primary sector in total exports or in GDP).
The inverse relationship between natural resource abundance and economic growthis at first sight surprising. A number of factors may be put forward to explain it:
• First and foremost, many natural resources have a long history of poormanagement. This is certainly the case of fish resources. Although it ispossible to identify examples of successful management, the history offisheries management over the past 40 years or so is overwhelmingly oneof failure. This situation has occurred notwithstanding the widespread

D-54
move to extended fisheries jurisdiction (200 mile exclusive economiczones). In some natural resources, the problem (from an economicperspective) is one of excessive rent-seeking. In the case of fish, however,as argued in Appendix 1, the primary problem has been the failure toidentify resource rents as the main issue for management.
• Second, dependence on primary exports may keep the real exchange rateat a relatively high level, preventing the development of non-primaryexports and thereby hindering economic growth
• Third, heavy reliance on natural-resource-based activities (such asagriculture and fishing) tends to be associated with low levels of savingand investment and low levels of education. The reason is probably thatthe primary sector needs less human capital than the manufacturing andservice sectors.
These factors emphasise the need for the rational economic management of thefishery sector (and other natural resource sectors) if it is to make its full contributionto economic growth. The evidence suggests that economic growth is not to be foundin the fishing sector itself but in the use that can be made of the resource rentsavailable from a well-managed sector.
A related problem is that many countries have not bothered unduly aboutsustainability issues in the exploitation of their natural resources. For a while thisgives the impression that such resources are contributing substantially to economicgrowth and welfare, but eventually sustainability becomes a constraint.
In the measurement of national income, traditional measurement of economic growthtends to be too optimistic because it fails to take into account the way in whichnatural resources have been depleted in order to deliver the growth. In fisheries, thereis a need to develop accounting systems that take into account the sustainablemanagement of fish stocks (and the same is true of other natural resources).Doubtless the best way to do this would be to focus on resource rentals because asargued in Appendix 3, maximising sustainable resource rentals implies a veryconservative use of resources. However, it will always be possible to do better thansustainable rentals for a short period of time by running down the capital stock;hence the need for constant vigilance to prevent the "mining" of otherwise renewableresources.
Traditional evaluation methods underestimate the importance of environmentalresources that are not traded in markets. As a result the economic development ofmarket-based activities has dominated. For instance, the clearing of important habitatfor fish and other resources in order to build hotels or develop aquaculture facilitieshas arisen at least in part because the true economic value of the habitat is difficult toassess, and often has not been assessed at all.
In addition to the natural environment, the social and cultural environment alsomatters for economic growth. Studies highlight infrastructure and good governance(the quality of government institutions, including the absence of corruption) as beingimportant factors for growth.

D-55
In the case of fish resources and their exploitation, there is both a need forinfrastructure development and a potential contribution to it. Where it is sustainable,fishing can represent a core economic activity around which it is possible to developother economic activities. In Morocco for instance the government has adopted apolicy of concentrating small-scale fishing activities in fishing villages along theundeveloped southern Atlantic coast as a way of kick-starting economicdevelopment. This policy has led to major infrastructure development, includingvillages and roads. Clearly, to be successful in the long run, such a policy relies onthe sustainable management of the fish resource base, at least until the villages arewell enough established that other economic activities can drive them forward in theabsence of fishing.
Because well-managed fisheries often yield very high resource rents (relative to thecosts of fishing), there is scope for rent-seeking of all kinds, including corruption.The management system requires therefore careful institutional design, includingappropriate control systems and checks and balances, in order to minimise the impactof rent seeking. A number of countries (New Zealand and Australia for instance)have shown that it is possible to design such systems.
REFERENCES AND FURTHER READING
Aghion, P. and Howitt, P. (1998) Endogenous Growth Theory. Cambridge, Mass:MIT.
Barro, R. (1997) The Determinants of Economic Growth. Cambridge, Mass: MIT.
Chenery, H. (1960) Patterns of Industrial Growth. American Economic Review.September.
Fisher, A.G.B. (1939) Production: Primary, Secondary and Tertiary. EconomicJournal, June.
Hannesson R. (2001) "Effects of liberalising trade in fish, fishing services andinvestment in fishing vessels" OECD Papers Offprint No 8, OECD, Paris, France
Harrod, R. (1948) Towards a Dynamic Economics. London: Macmillan.
Keynes, J.M. (1963) Economic Possibilities for our Grandchildren. In his Essays inPersuasion. New York: WW Norton & Co.
Kuznets, S. (1965) Economic Growth and Structure. London: Heinnemann.
Lewis, A.W. (1954) Economic Development with Unlimited Supplies of Labour.Manchester School of Economic and Social Studies 22(2): 139-91.
Smith, A. (1976) An Inquiry into the Nature and Causes of the Wealth of Nations.Indianapolis: Liberty Classics.

D-56
Solow, R. (1956) A Contribution to the Theory of Economic Growth. QuarterlyJournal of Economics 70.

D-57
A3 FISHERIES DEVELOPMENT AND MANAGEMENT – KEY ISSUES
A3.1. INTRODUCTION AND OBJECTIVES
The purpose of this appendix is:• to explore the reasons why unmanaged fisheries are overexploited• to discuss the biological (overfishing and resource unsustainability) and
economic nature (overcapacity and economic waste) of overexploitation• to consider the options available for fisheries management and their
implications for overexploitation (focus on wealth generation anddistribution)
• to assess how fish resources might be used in the interests of the poor
A3.2. WHY ARE UNMANAGED FISHERIES OVEREXPLOITED?
A simple fisheries model
The problem of overexploitation can best be understood using a simple model(Figure 1) of a fishery that combines biological (fish resource) and economic aspects.When undertaking practical fisheries management, more detailed models are needed,but the insights from the simple model remain valid as the models become moredetailed.
The biological side of the model is described by a sustainable yield (SY) curve. Ifthere is no fishing, the fish stock will settle around its natural equilibrium level andits net growth will be zero. If the fish stock were smaller than this equilibrium levelfor some reason, then the fish stock would exhibit positive growth, pushing its sizeback towards the equilibrium level. It is this net growth feature of fish stocks thatoffers the possibility for sustainable fishing. If the amount of fish caught at a givenfish stock size equals the net growth, then the stock size will not change and thesituation will be sustainable.
As fishing effort increases, net growth, and hence SY, will increase but at adecreasing rate. Eventually a stock size will be reached giving the maximum SY(MSY). If fishing effort increases beyond this point, the fish stock size will bereduced to such an extent that the SY begins to fall, eventually declining to zero iffishing effort is increased sufficiently.
The SY curve is shown, in Figure 1, as an inverted parabola. This version of the SYcurve is usually called a Schaefer curve after the biologist MB Schaefer who firstapplied this model to fisheries. Other version of the SY curve are non-symmetrical,the right hand tail declining more slowly than in the case of a parabola, but this doesnot affect the bio-economic analysis significantly.
This SY curve can be used as the basis of a bio-economic model if the price of fishand the cost of catching them is added. To simplify, the price of fish is usuallyassumed to be constant, in the sense that it does not vary according to the amount of

D-58
fish caught, the assumption being that the fishery under consideration supplies only asmall part of the total market for this species.
In this case, the SY curve is easily transformed into a total revenue (TR), since totalrevenue is price times quantity. And given that the price is constant, it can bestandardised to one, so that the SY curve effectively doubles as a TR curve, showingthe way in which revenue generated by the fishery as a whole varies as fishing effortincreases.
Finally, exploitation cost must be added to the model. Again in the interest ofsimplicity, assume that fishing effort varies by standard vessels being added to orremoved from the fleet. The unit cost of fishing effort is then just the cost of onestandard vessel, and the total cost (TC) is the cost per vessel multiplied by thenumber of vessels. In Figure 1, TC is then shown as a straight line beginning at theorigin. If per vessel costs increase (decrease) the TC line will swing to the left (right).
One important point must be noted about the use of cost by economists in thesemodels. The TC line is assumed to include what is sometimes called "normal profit",which may be defined as the return that fishing enterprises must earn if they are toremain in this fishery. From an economic point of view, this level of profit isconsidered a cost because if it is not met, fishing will no longer occur (in the long runanyway), in the same way that if fishing enterprises do not pay for their fuel, theywill not be able to go fishing. This is an important point because it has been, andcontinues to be, the origin of much misunderstanding of the bio-economic analysis offisheries exploitation.
Figure 1
Fishing Effort
SY
, Rev
enue
, Cos
t
TC1
TR
MSY
Y1
f1 fMSY

D-59
Putting the TR and TC curves together in Figure 1 allows an analysis of whathappens in an unmanaged fishery. The key feature of an unmanaged fishery is thataccess to the (very valuable) fish resource is left free and open. If TR is more than(less than) TC, then fishing enterprises in the aggregate will earn more than (lessthan) normal profits, and fishing vessels will enter (leave) the fishery - on theassumption made here that fishing effort changes through changes in the number ofvessels. The equilibrium point occurs therefore where TR equals TC, with effortlevel f1 and sustainable yield Y1.
Economists often refer to this equilibrium point as the zero profit level but this is avery misleading use of terminology. It is correct from an economic point of viewbecause profits are defined as being returns over and above normal profits, which asdiscussed above are included in TC. What is meant therefore is that fishingenterprises are earning only normal profits.
Regrettably, those unfamiliar with economics have interpreted "zero profit" throughstandard usage of the word "profit" to mean the break-even point of the company. Asa result, the problem with the free and open access has often been, and continues tobe, misunderstood.
It would be better if the free and open access equilibrium were referred to as the zeroresource rent level (and not the zero profit level).
Resource rents and the nature of overexploitation
The fish resource is clearly a valuable asset upon which fishers rely, in the same wayas they rely on other assets, such as fishing capital, or fishing gear. Under conditionsof free and open access, there is a big difference between the different assetshowever. For assets such as outboard motors, fishers either own them or pay theowner in order to be able to use them. In the case of the fish stock, neither of thesesituations exists, fishers neither own the stock nor do they pay anyone to use it.Under such circumstances, it is hardly surprising that the fish stock is overexploited,but in what sense exactly?
Suppose that in Figure 1, costs are given by the line TC1. Under free and openaccess, equilibrium will occur with a fishing effort level f1 where TR equals TC. Itcan be seen however that for fishing effort levels between zero and f1 TR exceedsTC. The vertical difference between TR and TC at each level of fishing effort (andthe corresponding stock size) shows the implicit value of the fish stock. This value iscalled the resource rent.
If the fish stock were owned by someone who were leasing fishing rights to fishers(in the same way that some people own outboard motors that they lease to fishers),the resource rent is the amount that they could charge at each exploitation level.Alternatively if the fishers owned the resource themselves, the resource rent is thereturn that they would get from ownership.

D-60
Under free and open access, because no one owns the fish resource, it appears as afree good and the implicit resource rents appear to be excess profits to fishingenterprises. As a result, excess capacity is attracted into the fishery until all resourcerents are dissipated and the zero resource rent equilibrium emerges.
The economic nature of overexploitation is therefore the problem of overcapacity.
The point where the difference between TR and TC is maximised is called themaximum economic yield (MEY). In Figure 1, because of the parabolic shape of TR,the MEY level of fishing effort is half of the open access level. In this case thereforean unmanaged fishery will end up with twice the amount of capacity that it reallyneeds.
Another point may be noted about Figure 1. With the TC line TC1 the unmanagedfishery is exploited below the MSY level.
This is important because MSY has often been used to define biologicaloverexploitation. A fishery that is exploited with fishing effort in excess of the levelneeded for MSY is said to be over-fished. And whilst fishing effort remains belowthe MSY level, the fishery would be considered to be under-fished.
The biological view of overexploitation revolves therefore around the concept ofoverfishing.
In the case shown by Figure 1, there would be no biological need for management. Infact quite the opposite would occur. Attempts would be made to develop the fisheryso that exploitation levels would move towards MSY.
Quite why MSY is of such importance is difficult to fathom. It seems to be based ona misunderstanding of what constitutes waste in a society. If the fish stock isexploited below the MSY level, fish are somehow wasted because they are left in thesea.
Figure 2
Fishing Effort
SY
, Rev
enue
, Cos
t
TC2
TR
MSY
Y2
f2fMSY
D-61
In most fisheries, over time the gap between fishing revenues and costs has tended toincrease, for instance due to rising real demand for fish and improved fishingtechnology. As a result, many fisheries are described by Figure 2, with TC line TC2.In this case, free and open access leads to overexploitation on both economic andbiological definitions. From a management point of view, if the objective were toachieve MSY, the goal would be to reduce fishing effort from f2 to fMSY. If the goalwere to achieve the economic optimum, an even greater effort reduction would besought to fMEY (not shown on the diagram but equal to half of f2).
It will be noted that in severely overexploited fisheries, the level of resource rent atMSY and MEY is not very different so that aiming at MSY may not do mucheconomic damage. Nonetheless, in this model MEY will always be a moreconservative target than MSY (and in practice also, although in theory MEY couldexceed MSY in a dynamic version of the fisheries model if social discount rates werehigh enough).
In both Figures 1 and 2, it is clear that if fishing effort is reduced below the openaccess level, resource rents, which in Figure 2 are very substantial relative to fishingcosts, will be generated. Successful fisheries management will depend on whathappens to the resource rents. If they continue to be perceived as excess profits, thenfishing effort will inexorably drift back (or more likely rush back) towards the freeand open access level and the sacrifices which have been made in the name offisheries management will be lost (for instance, the often substantial financialresources devoted to capacity reduction programmes where the impact on resourcerents is not taken into consideration).
The principal conclusions are therefore that:• resource rents are at the heart of the overexploitation problem in
unmanaged (and also in poorly managed) fisheries• unmanaged fisheries will always be overexploited in an economic sense,
i.e. they will always have overcapacity• unmanaged fisheries may also be overexploited in a biological sense, i.e.
they may exhibit overfishing but this will depend on the economiccharacteristics of the fishery
• both overcapacity and overfishing are symptoms of the fundamentalproblem which is resource rent dissipation. Attempting therefore toresolve either overcapacity or overfishing problems without addressingthe resource rent issue is doomed to failure in the long run.
A3.3. OPTIONS AVAILABLE FOR FISHERIES MANAGEMENT
Fishery management measures may be introduced for a host of reasons. The mostcommon objective is to ensure fish stock conservation, but since overfishing is aconsequence of the fundamental resource rent dissipation problem, it is notsurprising that measures aiming only at conservation have had very limited success.
This section looks at fishery management measures that deal with the source of theproblem rather than its symptoms.

D-62
Before doing so, two important points might be noted. First, the simplest andcheapest way of dealing with overexploitation is to prevent it from occurring in thefirst place. Given that the economic dimension of overexploitation occurs from thevery beginning of a fishery, a fishery management and development plan should beimplemented as soon as possible with an explicit aims of preventing unnecessarycapacity development and preventing overfishing.
As overexploitation arises from resource rent dissipation due to free and open accessconditions, the development of a policy framework for fishery management requiresthat fisheries authorities simultaneously develop policies to limit and/or price access.
Second, before developing a policy to deal with overexploitation, an important stepis to ensure policy coherence by evaluating the impact of current policies, which maybe worsening the overexploitation problem in a number of ways. It must be stressedthat overexploitation arises at the aggregate (fishery) level as a result of perverseeconomic incentives perceived by fishers operating in the fishery.
A well-known source of perverse incentives is subsidies and other governmentfinancial transfers. Such financial support to the fishing industry generally, althoughnot always, results in increased fishing capacity, worsening the overexploitationproblem, other things being equal. Moreover, such support is almost always targetedat fishing capital, putting small scale fishers who depend more on labour at adisadvantage. From the perspectives of both overexploitation and poverty, reducingsubsidies in general to fishing is likely to have a positive effect.
Once policies designed to make the problems worse have been corrected, there are anumber of options available to fishery managers.
Catch-based use rights: individual transferable quotas
Individual quotas (IQs) systems have been developed in a number of countries overthe last decade.
Such systems are in principle very simple, although as always the devil is in thedetail. In essence, under an IQ system, the fisheries authorities set a Total AllowableCatch for the season (or other relevant period). This TAC is then divided amongstfishers on the basis of their percentage shares in the fishery. Multiplying the TAC bytheir percentage shares determines the quantity of fish that each fisher may land(legally) over the period under consideration.
Where they can be used, IQs have a number of advantages. The most important isthat they enable the resource rent to be capitalised into the price of the right IQ (theexact way in which this happens will depend on the detail of the system – length ofrights, transferability restrictions and so on). The resource rent will no longer driveoverexploitation of the fishery. And fishers will be given every incentive to avoidoverexploitation because it will reduce the value of their fishing rights.

D-63
IQs will remove the incentive to invest in excess capacity, and will provide anadjustment mechanism for the fishery. Through the transfer of IQs, a country will beable to get the maximum out of its fish resources since the most economicallyefficient operators can increase their shares by trading, giving the less economicallyefficient operators a means to leave the fishery.
An IQ system can be very flexible. One criticism levelled at IQs is that they enablelarge-scale operators to corner the market. The evidence on this point is mixed.Sometimes it is the large-scale operators who have the advantage, sometimes it issmall-scale fishers. In any event, if policy-makers which to protect poorer fishers, itis a simple matter within an IQ system to create classes of IQs. Holders of small-scale rights could for example only be permitted to trade with other small scalefishers or not at all. Careful consideration must be given however to the protectionthat such transfer restrictions really offer.
The use of IQs requires careful consideration of the characteristics of the fishery tobe managed. Clearly, a key consideration is whether fishers will comply, or can bemade to comply at reasonable cost, with the restrictions imposed by their catchrights. Even if they do comply, consideration must be given as to how they do so. Forinstance, if fishers meet their quotas by discarding large quantities of otherwisemarketable fish, then the system would appear to have a problem.
Where they can be used successfully, IQs give rise to very strong wealth effects. Theamounts involved often come as a surprise. For instance, it has been estimated thatpotential resource rents in the Moroccan octopus fishery are in excess of 200 millionUS dollars per annum. Estimating IQ prices is a tricky exercise but on theassumption of a discount rate of 10% and the expectation that the rents will continuead infinitum on a stable basis, the total capitalised value of IQs in this one small,although very valuable, fishery might be in the order of 2 billion US dollars.
Given the amounts involved, great care has to be taken in the design of the IQsystems. Many developed countries have chosen to give the wealth to fishers, but fordeveloping countries it seems important to consider explicitly the link between IQsand resource rental charges.
Input-based use rights: licences and limited entry
Licensing fishing vessels and restricting their number is a common management toolthat remains the main alternative to IQ systems. Licensing systems are relativelysimple to operate and there is some evidence, particularly in the form of high pricespaid for licences, that they can generate resource rents.
The big challenge with licensing systems is whether they can avoid rent-seekingbehaviour in the form of input substitution (colloquially known as "capital stuffing").In essence, the problem is that whatever is licensed (vessel, gear, horsepower etc) isbeing used as a proxy for fishing effort. Fishers will therefore seek to produce morefishing effort by substituting uncontrolled inputs for controlled ones. The extent towhich this is possible will depend on the nature of the fishing effort production

D-64
function. If the degree of flexibility is low, then the management problem is greatlysimplified since controlling one input will effectively control all others. On the otherhand, if flexibility is substantial then it may be impossible to use input-basedmanagement measures because as soon as one input is controlled it is replaced bymore of an uncontrolled one. There is a need, therefore, for technical work in supportof licensing to investigate the extent to which inputs may be substituted one for theother in the production function.
But even in the case where technology is very inflexible so that input proportions aredifficult to vary, it is important to recognise that this gives only a short respite to thefishery manager. Incentives will be established in both the fishery sector and thesectors servicing it to innovate so as to increase the flexibility of the productiontechnology. Input regulation in the inflexible technology case is likely to createdistortions outside of the fishery sector in terms of excessive inventive andinnovative behaviour.
Even apparently simple management measures will be subject to input substitution.For instance, restrictions on fishing time in the form of closed seasons or days at searestrictions will quickly lead fishers to utilise the fact that there are different kinds oftime. They are likely to attempt to reduce travel time (faster vessels, re-designedpropellers etc.) and gear manipulation time (mechanised gear handling etc) so as tobe able to increase fishing time within the constraint imposed by the closed season.
Co-management and community-based management
“Co-management” covers a wide range of possible systems involving the sharing ofmanagement responsibilities between the State and communities or moreconventional fisher organisations. If a co-management approach is to beimplemented, both research and extension work are likely to be required: the formerto consider how to create such groups, the latter to undertake training as to how theyshould operate. There will also be a need for a mechanism (such as an overall co-ordinating body) to deal with disputes between and within groups. Where there areoverlapping groups and/or stocks, a key issue will be how to change the allocation ofrights over time as relative efficiencies change. Also, consideration might have to begiven to the issue of what to do if the group no longer represents the bestmanagement alternative. How are rights to be transferred away from the group?
Where a co-management approach is to be used, the main issue will be to decideprecisely what rights and responsibilities are being transferred to each group. A keyquestion will be whether the group has property or use rights.
The group is likely to be interested in managing fishing capacity to ensure sustainedbenefits to all members. Its ability to do so will depend on a number of factors:
• Level of co-operation within the group. Note that this is required on a sustainablebasis – the State will have to monitor different groups to ensure that they donot break down over time, particularly because this has tended to be the fate ofmany traditional management systems.

D-65
• Exclusivity of access: a co-management system without exclusive access will beas vulnerable to increases in capacity from uncontrolled elements as aresystems such as ITQs or exclusive zone
• Security of rights: the group will not attempt to control fishing capacity if itcannot be sure that it will be able to reap the benefits.
• Objectives of the group: although controlling capacity will increase theprofitability of fishing, the group may have other goals which need to berecognized (e.g. employment) even if they prevent effective control andavoidance of excess capacity.
• The incentives at the individual level within the group may not be all thatdifferent to those existing under State management systems. In particular thegroup may find that input substitution undermines its capacity managementefforts. As is the case with the State, results will depend on managementmethods used by the group.
• Respect for the group's leadership by all members.
Community-based systems are compatible with a range of different instruments. Insmall-scale fisheries, it is common to allocate rights in terms of space. Such systemsdo work well in policing fishing practices and may be upgraded by the community toregulate capacity. With higher exploitation rates, however, they are vulnerable to thefact that the space may cover a fraction of the stocks and therefore adjacentcommunities will need to collaborate effectively. Otherwise, it may be preferable toallocate catch rights instead of or, at least, in addition to spatial rights. Provided thatthe community can be relied upon to ensure that in the aggregate its members do notexceed their catch allocation, such systems can be very effective.
Taxes and resource rental charges
Taxes may be used both to correct the fisheries exploitation problem and to ensure anappropriate sharing of wealth between stakeholders. In the first case, taxation can beused to force fishers to take account of the value of the valuable fish stock that theyare using in order to produce fish output, in the same way that they are forced to takeaccount of the cost of other inputs, such as oil, gear, labour and so on.
In the second case, taxes can be used to extract a return from the fish resource for thenation. In this view, the State plays the role of steward of the resource on behalf ofthe owner - i.e. all citizens of the country. The State therefore collects resource rentswhich it then uses for the benefit of all citizens. In this way everyone can derivesome benefit from the nation's fish resources, without necessarily having to become afisher. Many extractive industries are managed on this basis, through the payment ofroyalties for example.
If taxation is to be used, States will have to consider a number of issues:
• What to tax? The choice is generally between catch and effort. In theory the twoare equivalent but in practice it is almost always easier to tax the catch. Anumber of options exist for taxing catch: at the point of landing, at some point

D-66
in the processing chain or, in some cases, at the point of export. There is oftena presumption against export taxes but it needs to be made clear that thefisheries case is special in that such taxes are being used as a way of enhancingconservation and economically rational exploitation of the resource.
• What institutional arrangements are required? The system will only work if thereis compliance with it. As with all costs, there will be an incentive forenterprises to reduce their tax burden so far as possible. An appropriateinstitutional structure will have to be established to ensure compliance atreasonable cost. One of the key issues regarding the use of a taxation system iswhether it can be made to work without all, or most, of the benefits of reducedexploitation being used up as extra costs required to enforce the system.
• How to avoid rent-seeking behaviour within the tax system? Given the value offisheries resources, a taxation system can be expected to generate significantamounts of revenue. Depending on the precise institutional arrangements thatare established, such revenue might encourage rent-seeking behaviour ofvarious kinds, going from the exploitation of regulatory loopholes to illegalpractices. An appropriate system of checks and balances will be required toensure that rent-seeking behaviour does not use up a substantial portion of thebenefits of the system.
A common practical objection to taxation is its political acceptability. Some find itdifficult to see how taxation can be introduced in overexploited fisheries whenfishing enterprises are often in poor economic shape. However, this simply meansthat first, taxation must be introduced gradually on an opportunistic basis, takingadvantage of the variability of key economic parameters, such as fish prices, andsecond, that taxation is best used as part of a set of management measures.
Because of its importance in extracting wealth to fund Government policy, it isperhaps worth spending a little time considering how taxation (or resource rentalcharges) might be introduced, and analysing the impact. In order to do this, it isuseful to transform the basic fisheries model into a supply and demand model.Relating fishing costs and revenues directly to sustainable yield achieves this, andresults in a backward-bending supply curve (because supply declines as the fisheryexpands beyond MSY). This supply curve can be associated with standard demandcurves (either horizontal, implying that fish price is independent of quantity, ordownward sloping, implying that fish price must fall if more is to be sold).
This supply and demand model allows a range of cases to be considered. Here,because of its widespread relevance, we will consider the case of a fishery that isoverexploited both economically and biologically (i.e. beyond MSY). Figure 3considers the case where the demand curve is horizontal and Figure 4 the case whereit is downward sloping.
One criticism of taxation is the difficulty to introduce it. Here, we take a simpleexample. Looking first at the case shown by Figure 3, suppose that, for some reason,demand in the fishery rises substantially so that the demand curve shifts from D1 toD2. Suppose also that the Government sets the simple objective of neutralising the

D-67
demand increase so as to maintain the fishery in the condition it was in previously.What happens?
With the original demand curve D1 the fishery is in equilibrium producing an outputof Y1 at a price of P1. If the demand curve increases (shifts upwards) to D2 then, ifthe fishery is unmanaged, the ultimate result is to reduce output to Y2 whilstincreasing price to p2. If the Government now introduces a resource rental equal tothe difference between the two demand curves (i.e. t = p2 - p1), then the fishery willcontinue to produce Y1.
Table 1 below summarises the impact on consumers (C), producers (P) andGovernment (G).
Figure 3
Output (SY)
Pri
ce
S
D1
D2
p2
p1
Y1Y2
A
B

D-68
Table 1BEFORE AFTER EVALUATION
Unmanaged With resourcerentals Unmanaged With resource
rentalsC Y1 @ p1 Y2 @ p2 Y1 @ p2 -££ ↓Y and ↑p -£ ↔Y and ↑p
P Total Revenue =p1*Y1
p2*Y2 p1*Y1
? ∆TR small,could be +ve or-ve
0
G T = 0 T = 0 T = (p2-p1)*Y1 0 +££ ↑ T
Net
Increase indemand leads toa large loss forconsumers andlittle change(possibly adecrease) forproducers
Extraction of Tthroughavailability ofrents and sometransfer from Cto G. C betteroff than with nomanagement, Pno worse offthan before ↑D.
Table 1 shows that the main impact of taxation is on consumers and the Government.At least in the case shown, producers are left no worse off than they were previously.Consumers gain under taxation, compared to no management, because they can havethe same quantity of fish as previously, at the new higher price. Government clearlygains by the amount of taxation T.
Figure 4 presents the same analysis in the case of a fishery facing a downwardsloping demand curve. It is assumed that the Government objective remains thesame, to hold output at Y1.
Figure 4
Output (SY)
Pri
ce
S
D1
D2
p1
p2
p3A
B
Y1Y2

D-69
Table 2BEFORE AFTER EVALUATION
Unmanaged With resourcerentals Unmanaged With resource
rentals
C Y1 @ p1 Y2 @ p2 Y1 @ p3-£££↓Y and ↑↑p
-£ ↔Y and ↑p
P Total Revenue =p1*Y1
p2*Y2 p1*Y1
? ∆TR small,could be +ve or-ve
0
G T = 0 T = 0 T = (p3-p1)*Y1 0 +££ ↑ T
Net
Increase indemand leads toa large loss forconsumers andlittle change(possibly adecrease) forproducers
Extraction of Tthroughavailability ofrents and sometransfer from Cto G. C betteroff than with nomanagement, Pno worse offthan before ↑D.
In this case, in the absence of management, the existence of the downward slopingdemand curve will result in a sharper increase in price. Consumers will lose becausethey have less fish available at substantially higher prices. Once again producers willfind themselves more or less in the same position because their total revenue willhardly change (p1*Y1 being more or less equal to p2*Y2). The tax per unit will not beequal to (p2-p1) in this case. It can be seen from Figure 4 that in order to holdproduction at Y1, the per unit tax will have to be (p3-p1). So with a downward-sloping demand curve, taxation actually results in lower prices than would be thecase in an unmanaged fishery.
As summarised in table 2, the result is that both consumers and the Government arebetter off under taxation than where the fishery is left unmanaged, and producers areno worse off.
These results demonstrate first that taxation is worthy of far more consideration infisheries management than it has received to date, and second that, as emphasisedthroughout this report, management is fundamentally about the wealth that fishresources can generate.
A3.4. BENEFITS TO THE POOR OF FISH RESOURCES
The basic fisheries model highlights the importance of the inherent wealth of fishresources, in the form of resource rent, in driving exploitation patterns. This samewealth indicates the potential benefits that can be derived from such resources. Thissection considers how the poor in particular can benefit from fish resources.

D-70
Rather than considering wealth, fisheries policy around the world has often focusedon fish production. For many fishery ministries, the key indicator of policy success isthe physical amount of fish produced each year. Such an indicator is problematicwhen dealing with a renewable natural resource with a finite supply. To begin with,since there is clearly a limit to sustainable physical production, using physicalproduction as an indicator places an apparent, although artificial, upper bound onpolicy success. And having a physical production target adds to the overexploitationpressure which already exists in abundance in the fishery. Such problems mightappear self-evident but numerous countries continue to use a physical productionsuccess indicator, as do numerous international treaties, which often set MSY as theirgoal. As a consequence, it is generally easy to obtain data on the amount of fishproduced, somewhat more difficult to obtain data on prices and hence valuesproduced, and usually quite difficult to obtain cost data. The result is that fewcountries have much idea of the resource rents foregone in their current fisheriesexploitation systems.
The focus on production also tends to colour the way in which benefits from thefishing activity are perceived. Many of the benefits relate to the activity itself andresult from being a fisher, or being related directly to the fishing activity in someway.
The most obvious kind of benefit is where the fishery is used to provide employmentor livelihoods of last resort. Where the poor have no alternative occupation available,they can always go fishing. But this is a very curious employment of last resort.Unless they are doing an activity with no input other than their labour, the poor, likeeveryone else, are required to pay for their inputs. They do not usually get the boat orthe outboard motor or their fuel for free. It is only the fish resource that for somereason is chosen for special treatment.
Whilst the provision of employment, and still more livelihoods, of last resort shouldfavour the poor, where the provision relies on fishery management failure, the resultis to increase the risks faced by the poor and their vulnerability to external shocks.
This problem arises in part because the strategy tends to result in fish resources beingexploited beyond their sustainable limits. A major reason for this that in order tobenefit from fish resources, the poor have to be involved in the activity (or beeconomically related to someone who is), putting yet more upward pressure on thefish resource.
Another problem is that the "last resort" element is seldom the centrepiece of fisherydevelopment and management strategy. Many developing country governmentsrecognise only too well the wealth potential of their fish resources, but they do notknow how (or are politically unable) to extract this potential through domesticfishers, especially where these are considered to be poor.
As a result, many such governments have come to depend on selling fishing rights totechnologically-superior (and often subsidised) foreign fishers, as a way ofgenerating some of the wealth potential of their fish resources.

D-71
These fishing access agreements have come in for much criticism. One advantagethat they may have is that they generate wealth that in principle may be used tobenefit the country as a whole, or the poor in general. This contrasts with the lastresort strategy which favours only those poor who are involved in the fishing activity(or very closely associated with it in some way).
The combination of a policy of last resort for poor domestic fishers coupled withaccess agreements with foreign fishers may represent a way of "muddling through"in the sense that the poor receive benefits in two possible ways: either through theactivity (employment, income, food) or through the revenues generated by the accessagreement (depending of course on how these are spent).
The difficulty is that this approach appears to be unsustainable. As a result, there isnow intense pressure to improve fishery management systems world wide. Theproblem is that such improvements pose a significant threat to the poor because theirlivelihoods depend on the fishing activity itself, rather than on the wealth inherent inthe resource.
Although policies to use fish resources as an employer of last resort may bedemonstrated to be economically sub-optimal, they may be socially and politicallypreferred if there are problems with dealing with income and wealth distribution. If awell-managed fishery produces more wealth but this wealth is concentrated in thehands of an elite and wealthy group, then social welfare may be enhanced bychoosing an economic sub-optimum.
The best solution to this problem resides clearly in resolving distributional issues, butthis may be easier said than done. The economic and biological overexploitation ofsome fish resources may be the price that has to be paid for social justice.
Nonetheless, it is important to analyse why the fisheries sector is being asked to playthe last resort role. There is often an assumption that small scale fishers areeconomically inefficient and must therefore be protected in some way. For instance,DfID (2004, p.1) argues that among the ways in which natural resources cancontribute to support growth in developing countries is through the provision of asafety net, "helping the livelihoods of those who cannot play a central role in growthprocesses, e.g. artisanal fishing". This implicit assumption that artisanal fishing issomehow outside the main economy is widespread. Although in some cases it maydoubtless be representative, often the problem seems to arise from the way in whichfisheries are managed rather than any inherent characteristic associated with small-scale fishers. In particular, the general absence of adequate use right systems meansfirst that small-scale fishers have no way to protect their livelihoods againstencroachment from other users of the same resource, and second that there is nomechanism to facilitate adjustment in fish resource exploitation patterns when this isrequired. Moreover, the standard approach of attempting to manage the "small-scalefisheries sector" reinforces the bias against small-scale fishers because it tends toexclude them from fisheries-based management plans.

D-72
Putting into place a use rights system including small-scale fishers would enable thehypothesis that they require protection to be tested empirically. It is likely to turn outthat in some cases their technology is the most appropriate and in other cases it isnot. If the view is taken that such fisheries still require protection, use rights providea framework within which this may be implemented, for instance some use rightsmay be designated as small-scale and their transfer to other users may be banned.
A.3.5. THE CRUCIAL IMPORTANCE OF DISTINGUISHING BETWEENWEALTH AND INCOME
A key issue when attempting to use one sector of the economy, such as the fishingsector, to alleviate poverty is to clarify exactly what is feasible.
It is common to find the improvement of fishermen's incomes as an objective offisheries management systems, especially in the case of developing countries (e.g.Lawson, 1984), and this might seem a reasonable goal in a poverty reductionprogramme.
The difficulty is to analyse how such a goal might be achieved.
There has long been evidence that fishing incomes may be low in both developed (egMacKenzie, 1979) and developing countries (eg Panayotou, 1982). The key questionis "why?" or put differently "what determines fishers' incomes?".
One argument might be that incomes are low because fisheries are not managed, ornot managed well. As has been argued above, free and open access fisheries will beexploited in such a way that all resource rent is dissipated, but does this necessarilyimply low fishing incomes? The answer seems to be no.
The fundamental reasoning was well explained by MacKenzie (1979, p816, footnote5) who argued that "the received image of the poor fisherman is to be stood on itshead - he is a fisherman because he is poor, not the other way around". In otherwords, fishing incomes depend on opportunity incomes (that is to say, the amountfishers could earn in their next best alternative occupation).
Copes (1988) suggests six reasons why opportunity incomes may be low in small-scale fisheries. These are: (i) the isolation of many fishing communities resulting inpoor educational facilities and infrastructure links as well as few alternativeemployment opportunities, (ii) the existence of surplus labour due to productivitygains, (iii) capital asset fixity, (iv) lifestyle preferences, (v) highliner illusion and (vi)perverse assistance (i.e. welfare state measures designed to provide an income safetynet). Similar factors are advanced by Panayotou (1982) to explain labour immobilityalthough he adds caste restrictions, cultural factors and simple lack of knowledge ofalternative occupations.
The proposition that fishermen's incomes depend on opportunity incomes isreinforced by evidence presented by Panayotou (1982, p.30) who notes that someRed Sea and East African countries found it difficult to continue fisheries

D-73
exploitation in the face of more remunerative employment opportunities associatedwith the oil industry. A similar situation exists in the case of the Pacific island ofNauru where, in the past, the guano industry provided employment and wealth forthe island's population and attempts to develop fishing were unsuccessful.
Both standard economic theory and empirical evidence suggest therefore thatfishermen's incomes are determined by opportunity incomes rather than by anythingthat happens within the fishery itself, except perhaps in the short run. This view hasmajor policy implications for the way in which the goal of improved fishing incomescan be achieved.
Rational fisheries management is therefore (or at least should be) about wealthgeneration if the objective is to improve incomes. This wealth must then be investedin such a way as to benefit the poor so as to increase the opportunity cost of labour.An obvious possibility would be to use the fisheries wealth to educate fishers,thereby increasing their options in the labour market.
The fact that management is about wealth raises questions as to how to implementfishery management measures, particularly those of an economic nature. Considerfor instance ITQs.
It is fairly easy to demonstrate that ITQs will lead to economically efficient fisheries.But the consequences of this for poverty (and for many other things) depends on howthe ITQ rights are allocated, and the way in which they are supported by othermanagement measures. If, as is often the case, they are given free of charge to fisherson the basis of their historical fishing performance, then these fishers can beexpected to become wealthy as the value of their ITQs increases.
But such an approach raises at least two difficulties. First, it is likely to be perceivedas unfair (e.g. by future fishermen, particularly those who would have fished in thevery near future, or by non-fishers, especially those living in the same locality orcommunity as the fishers, or even by society in general if the view is taken that thegovernment is custodian of natural resources on behalf of society) and equity issuesmay undermine the management scheme over time. Second, the approach may haveserious economic consequences since the investment decisions that follow the privateaccumulation of wealth are likely to be different to those if public accumulation isinvolved. The major risk associated with operating via the private sector is that theinvestments made may not improve the situation in the relevantly-defined economyat all. For instance, recipients of fish resource rents in a developing country mightdecide that their best private option would be to invest them in a Swiss bank account.
One alternative would be to link ITQs to a system to extract resource rentals. Wheretaxes have been considered by economists for use in fisheries they have often beenrejected on grounds of impracticability. Sometimes taxation is simply considered tobe politically unacceptable. Sometimes the rejection seems to lie in a failure toconsider the necessary institutions. Perhaps most frequently however it results fromthe approach of fisheries economics which is almost exclusively to consider optimalsolutions. For instance, Arnasson (1991, p.410) argues that "... to calculate the

D-74
correct Pigovian tax, it is necessary to know practically everything about the fishery.... Clearly these requirements exceed the capabilities of any fisheries manager". Butthis statement confuses the desired result with the way to achieve it. A satisficingapproach to rent extraction could yield substantial amounts of rent to a governmentand, on a trial and error basis, could be expected to approach the maximum.
The main difficulty is to think of imaginative institutional arrangements that willallow the desired results to be achieved.
One question which comes to mind is: if the State is considered the resource owner,should the State not try to recover all resource rents? There may be something in thispoint of view. However, a mixed strategy of rights coupled with taxes appears likelyto give the best results. It will be difficult in practice to extract all rents (because ofthe variability associated with key parameters such as fish prices and input costs) buteven if it were possible it appears undesirable. The main problem is that it wouldremove the incentive for fishers to try to improve their fishing operations. Leavingthem with a share of the resource rents would, on the other hand, give them anincentive to try to increase prices and/or reduce costs because this will increase theprice of their fishing rights (whilst also increasing the return to the Exchequer).
In summary then the policy issues are:• to recognise that management cannot increase fishermen's incomes
directly. Incomes depend on alternative employment opportunities andtherefore specific policy measures to increase opportunity incomes will berequired.
• if opportunity incomes do increase in depressed coastal areas, why willthey not be eroded by movements of labour from elsewhere in theeconomy? Of course, there is no guarantee that they will not be. If labouris mobile then the policy debate is somewhat different. Essentially thedebate is about the relative position of fishers, in which case it will benecessary to adopt specific supply-side measures such as training toensure that the value of fishermen in the labour market is raised.However, the policy debate, in many cases, is more than this. It is adebate about the absolute condition of fishermen and fishingcommunities. These communities are poor because there is a lack ofinvestment providing alternative employment opportunities. Theadvantage that the fishery offers is a perennial source of funding based onregional wealth.
• in developing countries, there is a need to move beyond the idea offisheries development to a consideration of the role of fisheries within thedevelopment process of the economy as a whole. There is a need for workon institutions and methods of management, and particularly for ananalysis of alternatives and/or supplements to fishing rights such as ITQs.
• there is a need to clarify the role of the State in fisheries management andin resource wealth appropriation. Although State performance world-widemay not give grounds for unbridled optimism, the problem for developingcountries is that economically-efficient management methods that allowresource rents to be capitalised may simply result in their transfer out of

D-75
the country. In such cases the country may find itself facing some strangecapital flows where wealth generated by its fish resources is placed withbanks in the developed world from which it re-appears as loans or aid. Itseems a somewhat more sensible policy that the developing countryshould ensure that its resource wealth is used to develop its own economy.
• it is important that expectations of what economic management offisheries can achieve are realistic. Economic management will notsuddenly make everyone associated with the fishery much better off.Rather, the fishery can be a very important renewable source of capitalthat enables investments to occur (in productive activities, ininfrastructure, in health, in education ...) that gradually enable sustainableliving standards to improve.
REFERENCES AND FURTHER READING
Bailey, C. and Jentoft, S. (1990) Hard Choices in Fisheries Development. MarinePolicy, July, 333-344.
Bostock, T., Manning, P., Cunningham, S. Neiland, A.E. and Bennett, E. (2004)Good Management Practice in Sustainable Fisheries: Policy Briefs.(http://www.sifar.org/DFID_Keysheets/wb_index.htm)
Catanzano, J. and Mesnil, B. (1995) Economics and Biology Used in FisheriesResearch or When Social and Natural Sciences Try to Depict Together the Object oftheir Research. Aquatic Living Resources 8: 223-232.
Cunningham, S., Dunn, M.R. and Whitmarsh, D.J. (1985) Fisheries Economics: AnIntroduction. London and New York: Mansell.
DfID (2004) "Pro-poor growth: a guidance note to assess the contribution of naturalresources and the environment" Mimeo, 18p
FAO(2002) The State of the World Fisheries and Aquaculture. Rome: FAO.
Lawason, R. (1984) Economics of fisheries development (London, Frances Pinter)283p
Panayotou, T. (1982) Management Concepts for Small-Scale Fisheries: Economicand Social Aspects. FAO Fish Tech Pap. 228. Rome: FAO.
Platteau, J.P. (1989) The Dynamics of Fisheries Development in DevelopingCountries: A General Overview. Development and Change 20: 621-651.

D-76
A4. POLICY AND GOVERNANCE FOR DEVELOPMENT
A4.1. INTRODUCTION AND OBJECTIVES
In 1992, two decades after Robert MacNamara’s charge to the World Bank toattempt to reduce poverty, the incumbent president, Lewis Preston, still had toproclaim that “no task should command higher priority for the world’s policy makersthan that of reducing global poverty”. In many countries, the gains from growth havenot been reaching the poor, and the simple question is therefore ‘why not?’. Theanswers relate in part to three key dimensions:
- the rate of growth- the pattern of growth- the failure of government policies
It can be shown that given a particular economic structure and policy environment,rapid economic growth is better than slow growth in eradicating poverty. However,the pattern of growth also matters in determining who are the beneficiaries ofgrowth. The incidence of poverty can increase if the pattern of growth is urbanbiased, displaces unskilled labour, alters relative prices to the disadvantage of thepoor, creates a gender gap, deteriorates child welfare, and erodes traditionalentitlements that have served as safety nets (Lipton, 1976; Williamson, 1991). Inmost countries, economic structure and the policy environment do not remainconstant. Even with respectable rates of growth, the total number in poverty canincrease. And it has done so in many countries because of the adverse changes ineconomic structure and the absence of appropriate policies by government. In simpleterms, according to Meier (1995)
“Growth does not help the poor unless it reaches the poor. Nor does government helpunless the poor are the beneficiaries of public policies” (p.30)
In the following brief account, the nature and role of government policy-making andpolicies will be explored, with particular reference to poverty alleviation andeconomic growth. Particular emphasis will also be given to the relationship betweenpolicies for the management of natural resources and poverty alleviation. In effect,the primary objective is to provide a range of perspectives on the nature of the policyprocess in these important domains and which can help in our analysis of policyperformance.
There are four sections to follow. The first section presents a set of key definitionsand important concepts in three areas – policy, the policy process and governance –which are central to the analysis and discussion of natural resource management andpoverty alleviation strategies pursued by government. The second section presentsand highlights a range of key issues which have emerged recently as a result of on-going research in the field of natural resource management policy (NRM), withspecific examples from fisheries. A third section, identifies and discusses how theselatest research findings are helping to guide new strategies for policy development

D-77
relating to NRM and poverty alleviation, with particular reference to pro-poorgrowth.
A4.2. KEY DEFINITIONS AND CONCEPTS
From the outset, it is important to consider the definitions and concepts whichunderpin the analysis of the relationship between NRM and poverty alleviation inthree areas – policy, the policy process and governance.
First, policy can be defined as ‘a course of action proposed or adopted by those withresponsibility for a given area and expressed as formal statements or positions’. Inmost countries, the policy process, as undertaken by government, involves both thedevelopment and design of policy and its subsequent implementation across the fullrange of national sectors (e.g. industry, transport, health, agriculture, fisheries etc).Policy analysis attempts to provide a better understanding of the policy process. Forexample, by identifying the factors which have affected policy performance in thepast, it may be possible to improve policy performance in the future by addressingthese factors.
The linear (or rational) model is the most widely held view of the way
The linear (or rational) model is the most widely held view of the way in whichpolicy is made (Fig. 1). Policy-making is seen as a problem-solving process which isrational, balanced, objective and analytical. Decisions are made in a series ofsequential phases as follows:• Recognising and defining the nature of the issue to be dealt with;• Identifying the possible courses of action to deal with the issue;• Weighing up the advantages and disadvantages of each of these alternatives;• Choosing the option which offers the best solution;• Implementing the policy;• Possibly evaluating the outcome;
Fig. 1. The policy process: linear model
Reform Issue
AGENDA PHASE
Decision for reform
Not on
On agenda
DECISION PHASE
Decision against
IMPLEMENTATION PHASE
Successfully implemented
Fortify political will
Unsuccessful Strengthen institutions
Time
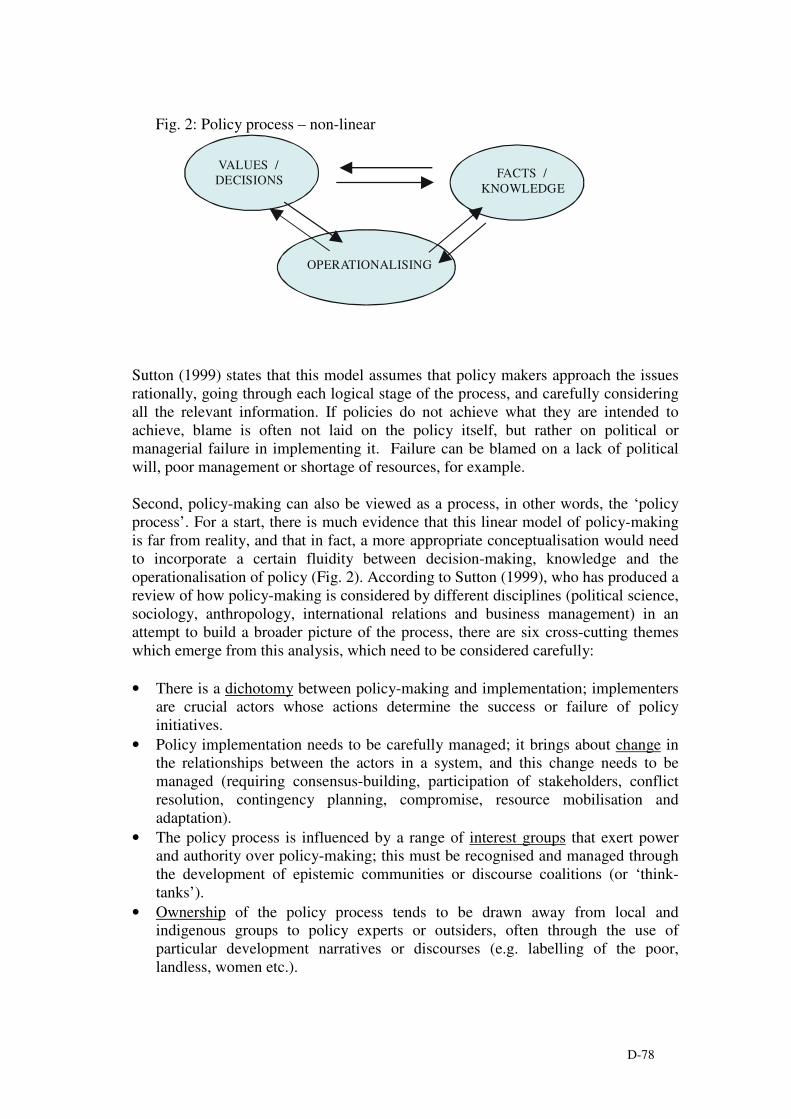
D-78
Sutton (1999) states that this model assumes that policy makers approach the issuesrationally, going through each logical stage of the process, and carefully consideringall the relevant information. If policies do not achieve what they are intended toachieve, blame is often not laid on the policy itself, but rather on political ormanagerial failure in implementing it. Failure can be blamed on a lack of politicalwill, poor management or shortage of resources, for example.
Second, policy-making can also be viewed as a process, in other words, the ‘policyprocess’. For a start, there is much evidence that this linear model of policy-makingis far from reality, and that in fact, a more appropriate conceptualisation would needto incorporate a certain fluidity between decision-making, knowledge and theoperationalisation of policy (Fig. 2). According to Sutton (1999), who has produced areview of how policy-making is considered by different disciplines (political science,sociology, anthropology, international relations and business management) in anattempt to build a broader picture of the process, there are six cross-cutting themeswhich emerge from this analysis, which need to be considered carefully:
• There is a dichotomy between policy-making and implementation; implementersare crucial actors whose actions determine the success or failure of policyinitiatives.
• Policy implementation needs to be carefully managed; it brings about change inthe relationships between the actors in a system, and this change needs to bemanaged (requiring consensus-building, participation of stakeholders, conflictresolution, contingency planning, compromise, resource mobilisation andadaptation).
• The policy process is influenced by a range of interest groups that exert powerand authority over policy-making; this must be recognised and managed throughthe development of epistemic communities or discourse coalitions (or ‘think-tanks’).
• Ownership of the policy process tends to be drawn away from local andindigenous groups to policy experts or outsiders, often through the use ofparticular development narratives or discourses (e.g. labelling of the poor,landless, women etc.).
Fig. 2. The policy process: a new look at the linear modelFig. 2: Policy process – non-linear
VALUES / DECISIONS
OPERATIONALISING
FACTS / KNOWLEDGE

D-79
• The simplification of issues (in order to promote understanding) can go too far;the drawback is that it can lead to a misrepresentation of the situation and falseinformation upon which to make decisions.
• Narrowing down of policy options (to allow choice of alternatives) can becounterproductive; it may restrict seeking out the best possible policy options.
Keeley and Scoones (1999) also highlight that policy is very difficult to define in asimple linear manner. In reality, the broad policy process tends to be non-linear, andpolicies generally consist of a broad course of action (or inaction, for that matter).These can also be conceptualised as a web of interrelated decisions which evolveover time during implementation. Policy also needs to be seen as an inherentlypolitical process, rather than simply the instrumental execution of rational decisions.
While the complex and often poorly understood nature of the policy process presentsa major challenge for policy analysis, one of the first ways of getting started is toexamine the performance of the current policy framework in a sector such asfisheries (assuming appropriate information exists). A simple 4-step approach topolicy analysis (ex-post) is shown in Box 1 below.
Clearly, this simple 4-step policy analysis procedure can provide a starting point forthe identification of future policy development opportunities. However, it should alsobe noted that the analysis often becomes progressively more complicated anddifficult from Step 1 to Step 4, and each situation needs to be considered on a case-by-case basis in the first instance.
Box 1: Policy analysis: 4 steps
Step 1: Identify policy profileWhat are the objectives of policy?What are the mandates related to and derived from this policy?Which organisations or institutions are responsible for policy design & implementation?What is the policy context?
Step 2: Assessment of policy performanceHave the stated objectives of policy been achieved?To what extent have they been achieved?What sources of information underpin the assessment?
Step 3: Evaluate policy performanceHow can the level of performance be explained?What influence have political interests had on performance?How has policy been influenced by actor-networks?How have policy approaches been shaped by particular development narratives?
Step 4: Identify options for policy change (new policy spaces)What opportunities currently exist for policy change?What opportunities might be anticipated in the future?What constraints does policy change face in general?How can these constraints be overcome?

D-80
The third concept is governance. It is also appropriate to consider how governanceand the policy context are inter-related, and this will be examined below.
Governance is a widely-used term, but in common with others (for example,‘sustainable development’ and ‘bio-diversity’), it is not often properly defined and isnot easy to quantify. There are a number of useful and accessible definitions whichcan be used as a starting point, as shown in Box 2 below:
The first definition from the World Bank is made with reference to the role ofgovernment, and in fact, for most people, “governance” is what governments do.However, the second definition from Kooiman (2001) reveals that the concept of
governance can be viewed in a much broader sense, and that all elements of society(for example, the state, market and civil society) have a joint and interactiveresponsibility for problem-solving and opportunity creation (Fig. 3). Kooiman alsoidentifies that the governance literature emphasises the need for all societalinstitutions to be involved in these activities, and for all relevant societal andinstitutional levels and inter-relations between them to be taken into account. Thisapproach assumes that problems and opportunities are embedded in broader societaland political contexts, and cannot be properly understood in isolation. The third andfourth definitions (Box 2) give emphasis to the role of power and authority, and tothe fact that these may be spread across different elements in society (bothgovernment and non-government).
The close association between ‘governance’ and ‘government’, in most people’sminds, is also an important entry-point for considering the role of government, thenature of the state and the impact of these two important elements on differentcountries throughout the world. It also focuses attention on the terms ‘goodgovernance’ and ‘strong and weak states’.
Box 2: Governance – 4 definitions
(1) ‘Governance is the manner in which power is exercised in the management of a country’seconomic and social resources’ (World Bank, 1997, p.7).
(2) ‘Governance is the totality of interactive activities and institutional arrangements, in whichpublic as well as private actors participate, which are aimed at solving societal problems, creatingsocietal opportunities, attending to the institutions within which these governing activities takeplace, and establishing a normative foundation for all those activities’. (Kooiman, 2001, p.3).
(3) ‘Governance may be defined as the capacity to get things done without necessarily having thelegal competence to command that they be done’. (modified from Czempiel, 1992).
(4) ‘Governance refers to the whole array of processes whereby elements in society (governmentand non-government) wield power and authority, and influence and enact policies and decisionsconcerning public life, and economic and social development’. (Governance Working Group of theInternational Institute of Administrative Sciences, 1996)

D-81
But why are these terms and the ideas behind them important? In simple terms, wehave to acknowledge that some countries can be classified as ‘Developed Countries’and some as ‘Developing Countries’. Reynolds (cited in Dethier 1999), aftersurveying more than a century of comparative development experience in 40developing countries proposed an explanation as shown in Box 3.
Box 3: Explaining development outcomes
‘the single most important explanatory variable [of development] is political organisationand the administrative competence of government.’ (Reynolds, 1999, p.3)
According to Dethier (1999) a proper use of public resources and donor transfers togovernments of developing and transition countries appears to be indicative of goodgovernance. Evidence links dismal growth and poverty to corruption, waste andauthoritarian practices in government. However, a government’s impact ondevelopment is not simply a function of fiscal resources, but also a more intangiblething which one can call the ‘quality of government’. The reason why a governmentis good or bad, is not always apparent.
It is also important to recognise the distinction between the terms ‘government’ and‘state’. As pointed out by Dreze and Sen (1995) ‘the state is in many ways a broaderconcept which includes the government but also the legislature that votes on publicrules, the political system that regulates elections, the role that is given to oppositionparties, and the basic rights that are upheld by the judiciary. A democratic statemakes it much harder for the ruling government to be unresponsive to the needs andvalues of the population at large’.

D-82
Returning once more to Kooiman’s definition and framework for governance, thestate (including government) is clearly a crucial element, along with the other twoprimary elements - markets and civil society. Within ‘strong states’, which arecharacterised by ‘good governance’, one would expect a responsive and responsiblegovernment, well-developed and active markets, and a civil society which is able tobenefit from both public (government) and private (market) actions andopportunities. By contrast, in ‘weak states’, with ‘weak governance’, the oppositewill almost certainly be the case, with significant evidence of both government andmarket failure.
It is important to consider the challenges which policy-makers and the policy processmust face up to in attempting to bring about changes within any sector, whether it isfisheries, agriculture, industry or public services. A good understanding of the policy
ig. 3. Governance: interactions of state, markets and civil society
Shifting role
Market
Competition
Civil Society
Negotiation
Government
Intervention
TRADITIONAL DIVISION OF INTERACTIONS
Market
Competition
Civil Society
Negotiation
Government
Intervention
INCREASING INTERACTION AND OVERLAP
Expanding role
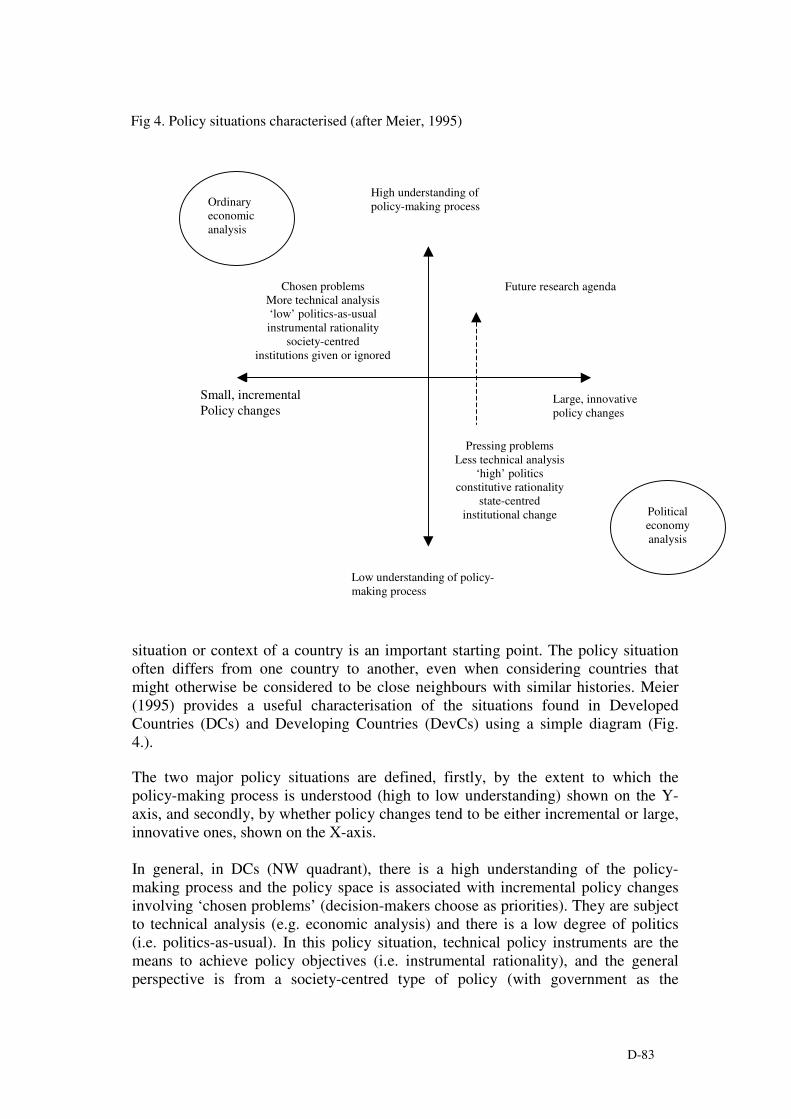
D-83
situation or context of a country is an important starting point. The policy situationoften differs from one country to another, even when considering countries thatmight otherwise be considered to be close neighbours with similar histories. Meier(1995) provides a useful characterisation of the situations found in DevelopedCountries (DCs) and Developing Countries (DevCs) using a simple diagram (Fig.4.).
The two major policy situations are defined, firstly, by the extent to which thepolicy-making process is understood (high to low understanding) shown on the Y-axis, and secondly, by whether policy changes tend to be either incremental or large,innovative ones, shown on the X-axis.
In general, in DCs (NW quadrant), there is a high understanding of the policy-making process and the policy space is associated with incremental policy changesinvolving ‘chosen problems’ (decision-makers choose as priorities). They are subjectto technical analysis (e.g. economic analysis) and there is a low degree of politics(i.e. politics-as-usual). In this policy situation, technical policy instruments are themeans to achieve policy objectives (i.e. instrumental rationality), and the generalperspective is from a society-centred type of policy (with government as the
Fig 4. Policy situations characterised (after Meier, 1995)
Future research agenda
High understanding ofpolicy-making process
Chosen problemsMore technical analysis‘low’ politics-as-usualinstrumental rationality
society-centredinstitutions given or ignored
Low understanding of policy-making process
Pressing problemsLess technical analysis
‘high’ politicsconstitutive rationality
state-centredinstitutional change
Large, innovativepolicy changes
Ordinaryeconomicanalysis
Politicaleconomyanalysis
Small, incrementalPolicy changes

D-84
clearing-house or broker amongst interest groups). Institutions are often given orignored.
By contrast, in DevCs (SE Quadrant), at the other end of the policy situationspectrum, there is a low understanding of the policy-making process and the policyspace is associated with large innovative policy changes. Here pressing problemspredominate. They are forced upon policy-makers through pressure from injured orinterested outside parties. Pressing problems are generally those in which aperception of crisis is apparent; the undertaking of policy reform involving largeinnovative changes tends to be induced by pressing problems. They are also highlypoliticised and tend not to be amenable to technical analysis. The rationality involvedis of a constitutive type i.e. decisions have to be made about how decisions are to bemade: a constitution is needed and an institutional context for decision-making has tobe established. The policy-making process is more state-centred, and institutionalstructures need to change.
Clearly, the policy situation outlined for DevCs can be characterised by both marketand non-market or government failures. It represents the Weak State. For the policyanalyst, in attempting to identify and recommend policy reform, there are a numberof major challenges including:
• Resistance to policy change may be significant (from powerful and elite groups);• Policy analysis needs to consider the winners and losers in policy reform;• Policy reform may require the creation of Win-Win outcomes, or the means to
compensate losers;• The creation of political competition and new constituencies may be the key to
policy reform in some situations;• New institutional arrangements will also be required to support policy reforms;• Policy-makers will need protection from rent-seekers and interest groups, in
order to focus on issues of national priority.
In effect, the policy situation of DevCs requires a much broader analysis than theconventional economic and technical analysis usually applied in the policy situationof DCs. Policy analysis and the giving of policy advice in DevCs must have a goodknowledge of the underlying political process. It must also be willing to grapple withdifficult and sensitive issues such as the power relations within a country, therelationship between state and society, and distribution of economic benefits.However, at the present time, this type of policy analysis is only starting to emergefor many DevC policy situations. At the same time, it is also important to recognisethat there exists a broad range of policy situations amongst DevCs – some countrieshave relatively good policy environments and processes, while at the other end of thespectrum, policy environments and processes are weak. Effective policy analyses andcomparisons must be able to deal with these differences.
Policy analysis is a difficult task in reality. Using some of the findings of a recentstudy in Bangladesh (Neiland et al. 2002), it is possible to highlight the challengewhich the policy analyst must face (analytic constraints), while at the same timehelping to guide the design of a study approach (analytical priorities). The following

D-85
key features are amongst the most important, with particular reference to theenvironment, natural resources and fisheries domains:
• A large number of policies have been produced over the last 30 years, coveringboth national and sectoral agenda; there is considerable overlap and lack ofcoherence between policies;
• Policy-making has been predominantly top-down originating from centralgovernment; the content of policy has favoured the priorities of powerful, elitegroups in Bangladeshi society, often at the expense of rural people;
• Policy implementation has been extremely variable, and constrained by a weakand bureaucratic institutional setting;
• The assessment of policy performance and policy evaluation has been limited,with minimal feedback into the policy-formation process. The weakness of theinstitutional setting and lack of fundamental data have been major constraints. Ingeneral, policy performance with respect to development outcomes is consideredto be weak, with significance poverty and lack of economic development still amajor feature of Bangladesh;
• Policy changes can and do take place, often under the influence of externalpressures, particularly from donor and lending organisations (e.g. WB), and fromNGOs operating within the country;
Of course, many of these findings can also apply to other DevCs, and while this sortof generalisation is worth keeping in mind, the important fact remains that theimprovement of policy performance for Bangladesh will depend on an improvedunderstanding of the specific factors or context which produce these outcomes in-country, and which may of course be different to other DevCs.
Barenstein (1994) provides an interesting analysis on the nature of policy andgovernment in Bangladesh (Fig. 5.). In attempting to explain the nature ofgovernance in Bangladesh, he developed a conceptual model that highlights theproblems of linkage and feedback between various stages of the policy process.Barenstein believes that the political process in Bangladesh can best be described asone of ‘fuzzy governance’ whereby the usual relations and tensions in the machineryof public policy and management are in such transition that their previous functionschange and become extremely hard to predict and understand. Whereas ‘badgovernance’ may be set on purpose (dictatorial government, for instance), ‘fuzzygovernance’ is the unplanned product of multiple factors in transition. Barensteindemonstrates how ‘fuzzy governance’ affects the policy process by creating policyfractures (Types 1-5) at all stages of the policy process, leading to an overallsituation of ‘policy dissonance’, as shown in Fig. 5.

D-86
Fig. 5. Policy dissonance in Bangladesh (after Barenstein, 1994)
��� ��������� �
�������� ���������� ��
�� ���������������
��������� �����
1
5
5
5
3 4
2
4
����� �����
�������������
Policy Declarations the ‘development objectives’ and mandates as stated by governmentEnacted Policies the passing of laws, approval of budgets, issuance of ordinances etc.Implemented Policies the establishment of suitable structures, staffing etc.Policy Outcomes the impact (if any) of policy
Type 1 policy fractures are not enacted due to issues of political culture, lacking accountability orsimply ineffective planning. Limitations often associated with new parliamentary democracies.Type 2 policy fractures are not implemented. This link requires the desegregation of policyobjectives into distinct programmes and projects so that the possibility of failure is multiplied. Itmay be related to bureaucratic resistance or managerial incapacity.Type 3 policy fractures result in unexpected outcomes in the short-run or do not lead tosustainability in the long-run resulting from poor policy declarations or implementation.Type 4 fractures occur due to lack of feedback between implementers and policy-makers.Type 5 fractures occur because outcomes (if known) are manipulated or disowned by implementersand policy-makers.
D-87
A4.3. KEY ISSUES BASED ON THEORETICAL AND EMPIRICALRESEARCH
The definitions and concepts presented above in the broad areas of - policy, thepolicy process and governance - provide an important underpinning of many of theresearch initiatives which are currently focusing on the relationship between naturalresources (or NR) (and their management or NRM) and livelihoods (and povertyalleviation). In this section, the objective is to highlight 9 key issues and findingswhich have emerged recently from research, both theoretical and empirical, andwhich are likely to affect future policy in this domain. Where appropriate, specificexamples from the fisheries sector have also been included.
(i) Recognition: is the value of NR recognised by policy-makers?
The extent to which the value (or importance) of NR is recognised by policy-makerswill affect the extent to which the sector is able to contribute to development. If agovernment does not value, or even recognise the role of NR, then the sector will bedenied support for policy design and implementation. According to DFID (2003,2004a, 2004b, 2004c), for most developing countries, NR provide foundations forgrowth sectors: agriculture, forestry, fisheries and tourism. It is vital that thecountry’s wealth is recognised and harnessed to its full potential to promote pro-poorgrowth. Some of the fundamental questions which need to be addressed are: Howmuch do the country’s main natural resource sectors (e.g. forestry, fisheries, wildlifetourism) contribute to economic growth? What percentage is this in terms of GDP?Does this take into account informal markets or illegal trade and how large are they?Is the importance of natural resources as inputs into other productive sectorsunderstood and appreciated (e.g. water abstraction for hydro-electricity generation orrice production?). The international literature indicates that the ‘value’ of naturalresources is not known well-known or recognised in many parts of the world(Neiland and Bennett, 2003). In the case of some NR systems the situation is veryserious. For example, the wetlands of the Mekong region of SE Asia are central tothe livelihoods of the majority of the rural people, but this ‘value’ is consistentlyunderestimated by development planners and the rural poor lose out (Ratner et al.2004).
(ii) Information/assessment: is this sufficient to support policy and managementdecisions and allow reaction and adaptation to change?
Recognition of the value of NR for development, and then decisions over how NRwill be utilised within a national policy framework and through an appropriate NRmanagement system requires a broad range of multi-disciplinary information. Thetype and quality of information will be determined by the assessment methods usedand applied and the effectiveness of their integration within the policy process andmanagement systems. In all the NR resource sub-sectors (forestry, fisheries, wateretc) there has been an increased use of information from both the natural and socialsciences, fundamentally to understand the bio-physical nature of NR, and the impactof human society on these systems directly through resource exploitation andindirectly through such effects as pollution. Approaches within the domains of

D-88
systems analysis, bio-economic modelling, ecological economics and environmentaleconomics are helping to provide an improved basis for NR assessment and decision-making. However, the relationship between information systems and assessment andthe nature and functioning of NR policy and management systems can be complex.For example, the case of the Peruvian anchovetta fishery (one of the largest fisheriesin the world) is instructive (Glantz, 1983). It shows that simply generating newinformation and assessments, and then making them available to policy-makers willnot be sufficient to ensure a high level of performance of a NR system (in this case amajor fishery). NRM decisions will be influenced by a wide range of factors –political, economic, social etc. In the case of Peru, while policy-makers did notignore the advice of scientists (whose information suggested an imminent fisherycollapse), ultimately this advice was overshadowed by larger political factors andissues, which made it difficult to take ‘hard decisions’ in the time available.
(iii) Policy narratives: do they include an appropriate conceptualisation of therelationship between NR and development (pathways, options)?
The type of NR policy and NRM approach used by government and the relationshipto development policy will be underpinned by a particular set of policy narratives.These narratives will be based upon a particular conceptualisation of the NR system,and will be used to describe key issues and how to deal with them. A goodunderstanding of the relationship between the environment and NRM and livelihoodsof people in both rural and urban areas is fundamental for policy development. Ingeneral, it is widely accepted that poor people in particular are highly dependent onNR (land, water, wood fuel and clean air) (DFID, 2004a). The state of theenvironment is therefore central to livelihoods, health and security of millions ofpeople living in poverty and therefore to pro-poor growth (DFID, 2004a). Clearly,within the context of national policy-making, it is important therefore to ask: Is therean explicit understanding of the poverty-environment links within a country (in otherwords for health, livelihoods and vulnerability?) (DFID, EC, UNDP, WB, 2002).
However, the relationship between NR and poverty reduction can be viewed from anumber of perspectives. In some countries, NR will support large numbers of poorpeople, through direct participation in resource exploitation. In other countries, NRwill contribute to livelihoods and poverty reduction indirectly, with indirect flows ofbenefits to society through taxation and re-distribution of NR activities. For example,in the case of fisheries, many countries have used policy narratives which emphasisethe maximisation of fisheries production through technical interventions to generatea wide range of benefits for society. Unfortunately, these narratives and relatedapproaches have underestimated the complexity of the fisheries development processand overall performance has been low (e.g. see the case of Mexican fisheries,Hernandez and Kempton, 2003). More recently, policy narratives which recognise abroad range of issues (technical, economic, social) have proved to be moresuccessful as a basis for effective fisheries development policy and fisheriesmanagement (e.g. see the case of fisheries in Mauritania, Toueilib, 2002).

D-89
(iv) Nature of the policy process: is it dynamic, active and willing to adapt andtake hard decisions? Is it transparent, evidence-based and accountable?
The nature of the policy process itself is an important issue affecting NRMperformance. The policy process includes both the design and implementation ofpolicy, and it can be influenced and shaped by a wide range of factors. These factorsinclude both the national policy context (is it supportive and enabling?), the abilityand willingness of stakeholders to compromise and cooperate (is power distributedsymmetrically?) and the effectiveness and credibility of decision-making processes(objective, transparent and accountable decision-making? Responsive andadaptable?).
An interesting comparison, with respect to the nature of the policy process and itsimpact on NRM (fisheries), can be made between the Pacific Fisheries ForumAgency (FFA) (Mueller, 2003) and the Estonian-Russian Fishery Commission(ERFC) (Vetemaa et al. 2001). In the former case, the governments of the statesinvolved recognise the economic importance of fisheries, and have been willing tocooperate and support the work of the FFA- the design and implementation of policyoperates within an enabling environment which allows stakeholders to cooperatewith one another, and to confidently put their trust in decision-making processes forthe benefit of all participants. By comparison, in the case of the ERFC, the politicaland policy context has undergone major and rapid change in recent years, and theenabling environment for the fisheries policy process has yet to emerge – newinstitutions and organisations are still forming and learning about their roles, thereare financial constraints to their operation associated with economic transition, andthe relationship between stakeholders is often confused when vestiges of oldinstitutions still remain in place.
With regards to NR and the poverty reduction strategy process (PRS) in general indeveloping countries, DFID (2004b) has set out a range of key questions whichshould be addressed at each stage of analysis, formulation and implementation.These include questions relating to information for policy decision-making and alsoquestions which focus on the nature of policy process itself. For example, at the PRSformulation process stage, the questions are asked: to what degree is the PRS processknown among civil society and what has been their participation and influence in thedevelopment of the PRS document? What were the obstacles in integratingreferences to ENR issues and what have been overlooked in the PRS? What can belearned for the future revisions of the PRS document and other PRS processes, andwhat are the key next steps to improve pro-poor environmental outcomes through thePRS? Clearly, this approach represents a step-forward in attempting to betterunderstand and manage the nature of the policy process.
(v) Participation: do all relevant stakeholders contribute to the policy process?
Globally, it is increasingly recognised that the effective management of naturalresources requires the appropriate participation of a full range of stakeholders in bothpolicy design and implementation. However, it is also recognised that in manycountries, policy is made and then handed-down by central government with only

D-90
limited involvement by other stakeholders. Under ideal circumstances, theparticipation of stakeholders in the relevant national policy process will take placethrough various processes of consultation and flows of information betweengovernment and representativeness of key constituencies (e.g. forestry communityorganisations, fishing organisations etc). Within strong States, with well-establishedgovernance and institutions, constituencies of stakeholders would expect to have a‘voice’ in national affairs relevant to their lives and work. However in weak States,the possibility for stakeholders to form constituencies and to have a ‘voice’ innational policy-making tends to be much reduced. In many situations, therefore thechallenge is two-fold: first, to encourage wider participation in the policy process,and second, to ensure that the participation is appropriate and effective. With regardsto a national poverty reduction strategy (PRS) process, DFID (2004b) asks to whatextent the views and concerns of different groups within civil society have beenconsidered at the initial analysis and planning stages, and what roles are these groupsplaying in PRS formulation and implementation.
With regards to the fisheries sector, a recent (albeit limited) survey of 50 case-studyfisheries from around the world, revealed that the participation of fishers and fisherorganizations is relatively limited (Neiland and Bene, 2003). In a majority ofcountries, fisheries are controlled and managed by a centralized governmentadministration which makes policy, and this is handed down to the local fisheriesadministration for implementation. However, there are some situations where thispattern is changing. For example, in Kerala, India, where coastal fisheries provideemployment for thousands of small-scale and semi-industrial fishers, local fisherorganisations and the National Federation of Fishworkers (NFF) have resisted policydecisions which impact adversely on their lives, and have established a ‘voice’within the policy process (Reeves et al. 1997). However, this represents only a‘partial’ success, since government does not have the full capacity or resources toalways implement the policy decisions agreed with fishers.
(vi) Laws: is there a well-established legal framework (as a basis for rights andactions)?
The laws of a country will define the rights of stakeholders in relation to theexploitation of NR, and help to guide the operation of a NRM system throughrelevant regulations. The successful implementation of NR policy will depend, inpart, on the right combination of regulatory tools, which must be appropriatelydefined (as rules or laws), implemented and enforced (with respect to the legalsystem of the country). However, there is much evidence to show that the definitionand enforcement of laws for NR, which are mainly common pool resources, is acomplex issue, with considerable variation in experience from different parts of theworld.
The importance of a well-designed and functional legal system to underpin fisheriespolicy and fisheries management can be illustrated by a comparison between Ugandaand Cambodia, countries where inland fisheries underpin the livelihoods ofthousands of rural households. The Government of Uganda has recognized andincorporated a series of amendments into its fisheries policy and fisheries laws to

D-91
facilitate and enable the development of a co-management approach to fisheriesmanagement (DFID, 2002). The legal amendments will pass the rights andresponsibilities for fisheries management to a partnership between local communitiesand local government. There are good indications that these arrangements will leadto an improved fisheries management performance, with particular reference topoverty alleviation. In Cambodia, the necessary development and strengthening ofthe legal system, in general, will require more time and assistance (Degen andThouk, 1998). For the time-being, the very large fisheries of the Tonle Sap and theMekong Basin, in general, are operating within the context of a weak policy andlegal environment. There is a significant asymmetrical economic and politicalrelationship between the licenced ‘owners’ of major inland fisheries (e.g. Tonle SapLake) and the local communities, which means that the wealth of the fisheries ismonopolised by relatively few individuals. In time, and with changes to the fisheriespolicy and law, there will be many possibilities for using the wealth from fisheriesfor economic development and poverty alleviation. The challenge remains as to howto bring this change about.
(vii) Institutions: is there an appropriate institutional framework (organisations andrules)?
The performance of a NRM system will be affected by the nature of the institutionalframework within which it must operate. Institutions represent the framework ofrules (both formal and informal) which define and govern the relationships betweendifferent stakeholders within the system (e.g. farmers-fishers-traders-governmentofficers), and between the stakeholders and the NR (e.g. property rights overparticular resources or benefit streams). Institutions are a fundamental part ofgovernance.
It is well-recognised that sustainable development and pro-poor growth will besupported or constrained by the institutional structures in-country (World Bank,2003; World Resources Report, 2004). According to DFID (2004), some of the keyissues which need to be addressed are: What access to NR do the more marginalizedgroups and those living in the vicinity have? How far is community ownership ofnatural resources the norm and/or encouraged? How is the issue of who collects andbenefits from the revenues from NR use resolved? How do poor people benefit? Isthere an indication of how this money going to government is to be reinvested intothe economy?
In the case of fisheries, there are a wide array of different institutional arrangementsdepending on the type of fishery, and the socio-economic, cultural and politicalcharacteristics of the associated stakeholders. The development of an appropriateinstitutional framework (or set of rules) for fisheries management will require theparticipation of all stakeholders. It must take into account existing institutionalframeworks, both modern and traditional, and be prepared to deal with the difficultyof trying to modify or replace institutions in the face of this type of complexity. Thisin turn may require a long and gradual process of persuasion and consensus-buildingguided by effective leaders.
D-92
The impact of institutional arrangements on the performance of fisheriesmanagement systems varies throughout the world. For example, in northern Nigeria,where inland fisheries are an important component of rural livelihoods, fisheriesmanagement is complicated by the existence and interaction of both traditional andmodern institutions, with new layers of institutions added over time as the nature ofthe State and the wider political context changes (Neiland et al., 2004). Within thislarge country and complex situation, it is difficult for the Fisheries Administration ofthe modern State of Nigeria, to impose a standard fisheries management approach,and to regulate the existing and diverse local fisheries management systems. Ineffect, therefore, the performance of fisheries management in northern Nigeria isdirectly related to local institutions – some of which perform well, and others whichdo not, in terms of poverty alleviation. By contrast, the institutional arrangements inmany Pacific Island fisheries, which also support thousands of livelihoods, arerelatively uncomplicated. For example, in the Cook Islands the managementapproach preferred by government is an ITQ system (Adams, 1998). Part of thereason for this relates to the role of the Aitutaki Island Council which has been ableto involve the local communities in the management system, and all of the fisherystakeholders can relate and understand the institutions which have emerged – asimple blend of modern and traditional rules which have been legitimized by theinvolvement of the Council and the communities working with government leadingto a successful fishery.
(viii) Management capacity: is there an appropriate capacity to manage the NR(technically, financially etc)?
The performance of NR management systems is related to the capacity of themanagement authority to make available the necessary management and technicalskills, and to provide other assets. The management bodies (or administrativeentities) have to operate within the context of agreed institutions or rules. They setobjectives for management, and apply the necessary technical, human and financial(or assets) to achieve these objectives. Clearly, if a management organisation lacksthis type of capacity, then the performance of the management system overall islikely to be impeded.
An assessment of management capacity is an essential part of introducing co-management initiatives or transfers of responsibilities within NR systems. Capacity-building also requires careful design and implementation, but can have immediateand positive effects on target organizations and other entities such as communitygroups.
(ix) Political will/desire: is there sufficient desire (incentives?) to manage NReffectively?
The performance of NR management systems are influenced by political will andleadership. In many ways, this is an issue which cuts across all of the other nineissues above. In fundamental terms, the term ‘political will’ expresses the extent andnature of support which government and its policy-makers provide for a NR sector inreal terms. Clearly, without the support of government and policy-makers to create
D-93
an enabling environment for policy design and implementation, the performance ofNR systems (e.g. fisheries management systems) will almost certainly beconstrained. However, creating an enabling environment is not sufficient, andeffective fisheries management for example also requires a champion to take forwardthe changes that are inevitably involved. Political will or support from governmentfor fisheries management is an essential prerequisite for the effective implementationof policy, and it most readily appears once the value of the fisheries is recognised.
4.4. POLICY ISSUES FOR THE FUTURE – A SUMMARY
In summary, therefore, effective and appropriate government policy-making isessential for poverty alleviation and economic growth. Within the domain of naturalresource management, and its role in development, it is important to understand theunderlying relationship between the policy process and governance. Theoretical andempirical research has shown that there are a range of related factors – information,participation, institutions, legal frameworks, management capacity - which impactultimately on the performance of natural resource management. However, in sectorssuch as fisheries, further research is needed to provide a better understanding of thesefactors, and how this might be used to improve policy design and implementation.
With the domain of the environment and natural resources in general, there are atleast three areas where a need for a better understanding and the application of newpolicy approaches for a better future appear to be given particular emphasis in theinternational literature, as follows:
(i) Role of environment and natural resources in development:
It has been noted that initiatives to improve growth – Poverty Reduction StrategyPapers (PRSPs), donor plans (e.g. DFID Country Assistance Plans) and otherplanning processes – have not always appreciated the environmental opportunitiesand risks for economic growth (DFID, 2004). To date, about 50 countries haveprepared interim and full PRSPs, but only 12 of the 28 full PRSPs present someinformation on the baselines and targets in line with the Millennium DevelopmentGoal (MDG) 7: Ensuring Environmental Sustainability; and none of the 22 interimPRSPs present discussion on the long-term perspective (Bojo and Reddy, 2003).Within the PRSPs that present targets aligned with MDG7, attention is almostexclusively focused on water and sanitation. Bojo and Reddy (2003) conclude that amajor effort is needed to raise the attention to MDG7 in the PRSPs.
In fisheries, there is a need to clarify the role of this sector in national developmentstrategies, and to understand the level and flow of benefits which can contribute todevelopment (and poverty alleviation).
(ii) Analysis and empirical work
Three important perspectives on analytical and empirical work are prominent in theliterature with reference to the role of natural resources (and environment) anddevelopment (and poverty alleviation):

D-94
First, there is still a great shortage of empirical work in all areas. For example, todocument the contribution of particular sectors to economies, and to undertakecomparisons with other sectors; to describe and value the contribution of NR tolivelihoods; and to devise appropriate indicators for incorporation in PRSPs relevantto environmental management.
Second, there is a need to develop an appropriate analytical framework linkingnatural resources to economic growth and poverty alleviation, which is holistic andwhich incorporates the political context and the nature of change over time. Steele(2004) has recently presented a draft framework which attempts to incorporate theseimportant dimensions, and this represents an important starting point for future work.Reed (2004) also presents an analytical approach for use by a full range ofstakeholders that ‘are seeking to change in fundamental ways, the dynamics ofpoverty and environmental degradation in rural areas of the developing world’. Theapproach is claimed to be distinguished from others (DFID – Livelihoods Approach,UNDP – Win-Win approach, and World Bank – PRSPs) by meeting three specificstandards: (i) it must analyse the complex dynamics between the rural poor and theenvironment in specific locations; (ii) it must interpret relations between the localpoverty-environment dynamics and policies and institutions at meso and macrolevels in each country; and (iii) it must analyse relations between economic policyand institutional arrangements at the three levels as they affect poverty-environmentdynamics.
Third, fisheries sector analysis and planning is still dominated by consideration of thesize of fish stocks and levels of production. There is a need to broaden the analysis toinclude a full range of cross-cutting and multi-disciplinary themes, with an emphasison the design and implementation of appropriate policies and management systems.
(iii) Policy and recommendations
First, in order to maximize the contribution of the environment and natural resourcesin general to economic growth and poverty alleviation, policy-makers must addressthe range of issues highlighted in Section 3(above), and attempt to overcome possibleconstraints through appropriate actions. DFID (2004) has identified the followingpolicy recommendations:
- better understand the links between NR, the environment and economic growth;- maximize the economic benefits from NR sectors;- greater spending on NR and the environment;- maximise government revenues from environmental fiscal reforms;- recognize the economic costs of poor management;- remove environmentally damaging subsidies;- promote wise re-investment in other forms of capital and good governance;- better participation of the poor in natural resource-based growth;
Second, for the fisheries sector, the central policy issue is that of improved fisheriesmanagement performance. For many countries, governments need to ensure thatappropriate fisheries management systems and authorities are encouraged to be

D-95
proactive in pursuing certain critical issues that if tackled can achieve this goalincluding improved fisheries governance, establishing rights and ending open-accessarrangements, developing an appropriate fisheries management authority, methods torealise wealth from a fishery, and dealing with transition (making explicit the costsand benefits of change) (World Bank/SIFAR, 2004).
4.5. REFERENCES AND ADDITIONAL READING
Barenstein, E. (1994) Overcoming Fuzzy Governance in Bangladesh. Dhaka:University Press Ltd.
Bojo, J. and Reddy, R.C. (2003) Poverty Reduction Strategies and the MillenniumDevelopment Goal on Environmental Sustainability. Opportunities for Alignment.Environmental Economics Series Paper No. 92. Washington DC: The World Bank.
Brown, M.B. (1995) Models in Political Economy. A Guide to the Arguments.London: Penguin.
Collier, P. and Gunning, J.W. (1999) Explaining African Economic Performance.Conference paper: Opening and Liberalisation of Markets in Africa.(http://www.dse.de/ef/papers/coll-gun.htm).
Degen, P. and Thuok, N. (1998) Inland Fishery Management in Cambodia: Is theFishing Lot System the Basis for Improved Management or Should it be Abolished?Crossing Boundaries, 7th Annual Conference of the International Association for theStudy of Common Property. Vancouver: IASCP.
Dethier, J.J. (1999) Governance and Economic Performance. A Survey. Center forDevelopment Research, University of Bonn. ZEF Discussion Papers on DevelopmentPolicy No. 5.
DFID (2003) Environmental Wealth Diagnostic. Report. London: DFID.
DFID (2004a) Pro-Poor Growth: A Guidance Note to Assess the Contribution ofNatural Resources and the Environment. London: DFID. Mimeo.
DFID (2004b) Contribution of the Environment and Natural Resources to Pro-PoorGrowth: A Checklist Examining these Issues within a Poverty Reduction Strategy.DFID How to Note. London: DFID.
DFID (2004c) Unlocking the Potential for Pro-Poor Growth: Natural Resources,Governance and Economic Development. London: DFID. Mimeo.
DFID, EC, UNDP and WB (2002) Linking Poverty Reduction and EnvironmentalManagement – Policy Challenges and Opportunities. Department for InternationalDevelopment (DFID), European Commission (EC), United Nations DevelopmentFund (UNDP) and the World Bank (WB), August 2002.

D-96
Dreze, J. and Sen, A (1995) India: Economic Development and Social Opportunity.Dehli: Oxford University Press.
Glantz, (1983) The Peruvian Anchovetta Fishery.
Hernandez, A. and Kempton, W. (2003) Changes in Fisheries Management inMexico: Effects of Increasing Scientific Input and Public Participation. Ocean andCoastal Management 46: 507-526.
Keeley, J. and Scoones, I. (1999) Understanding Environmental Policy Processes: AReview. IDS Working Paper No. 89. Brighton: Institute of Development Studies.
Kooiman, J. (2001) Fisheries Governance and Food Security. Paper for the EU-INCO Project FISHGOVFOOD. Brussels: European Union.
Hussain, I. (2004) (Project Leader) Pro-Poor Intervention Strategies in IrrigatedAgriculture in Asia: Issues, Lessons and Guidelines – Bangladesh, China, India,Indonesia, Pakistan and Vietnam. Report of the International Water ManagementInstitute (IWMI). (http://www.iwmi.org/propoor).
Lipton, M. (1976) Why Poor People Stay Poor.
Meier, G.M. (1995) Leading Issues in Economic Development. New York, Oxford:Oxford University Press.
MacNamara, R.S. (1972) Address to the Board of Governors, 25 September.Washington DC: The World Bank.
Neiland, A.E. and Bene, C. (2003) A Review of Fisheries Management Performancein Developing Countries, with Particular Reference to Issues of Policy andGovernance. Report prepared for UN FAO/SIFAR. Rome: FAO.
Neiland, A.E. and Bennett, E. (2003) Initiate the Learning Process: Legal,Institutional and Policy Issues Affecting Access to Common Pool Resources (CPR).Report for DFID/PASS.
Neiland A.E., Bennett, E., and Lewins, R. (2002) A Review of Fisheries Policy inBangladesh. Report for the DFID Bangladesh Fisheries Review. London:Department for International Development.
Neiland, A.E., Madakan, S.P. and Bene, C. (2005) Traditional Management Systems,Poverty and Change in the Arid Zone Fisheries of Northern Nigeria. J.AgrarianChange 5(1): 117-149.
Ratner, B., Dang Thanh Ha, Mam Kosal, Ayut Nissapa and SomphanhChanphengxay (2004) Undervalued and Overlooked: Sustaining Rural Livelihoodsthrough Better Governance of Wetlands. WorldFish Center Studies and Reviews No.28. Penang: WorldFish Center.

D-97
Reed, D. (2004) Analyzing the Political Economy of Poverty and EcologicalDisruption. Report. WWF Macroeconomics Program Office. Washington DC:WWF.
Reeves, P., Pokrant, B. and McGuire, J. (1997) The Right to the Sea: The Strugglefor Artisanal Fishers in Kerala since 1980.http: www.virginia.edu/soasia/symsem/kisan/papers/kerala.html
Steele, P. (2004) Pro-Poor Growth or Boom and Bust? Coalitions for Change toSustain and Increase the Contribution of Natural Resources to Pro-Poor Growth. Adraft framework prepared under the auspices of the OECD DAC ENVIRONET.
Sutton, R. (1999) The Policy Process: An Overview. Overseas Development Institute(ODI), Working Paper No. 118. London: ODI.
USAID (2004) Nature, Wealth and Power. Emerging Best Practice for RevitalisingRural Africa. Report by USAID in collaboration with Centre for InternationalForestry Research (CIFOR), WinRock International, WRI and IRG. Washington DC:USAID.
Williamson, J.G. (1991) Inequality, Poverty and History.
World Bank (1997) Governance. The World Bank’s Experience. Washington DC:The World Bank.