linear methods for classificationkti.mff.cuni.cz/~marta/su3a.pdf · 1 linear methods for...
TRANSCRIPT

1
Linear Methods for Classification●Linear and Logistic Regression, LDA, QDA,
●k-NN (k Nearest Neighbors)
● optimal separating hyperplane – will be later (SVM)
Some Figures from Elem. of Stat. Learning (advanced book), the rest from Introduction to SL.
2
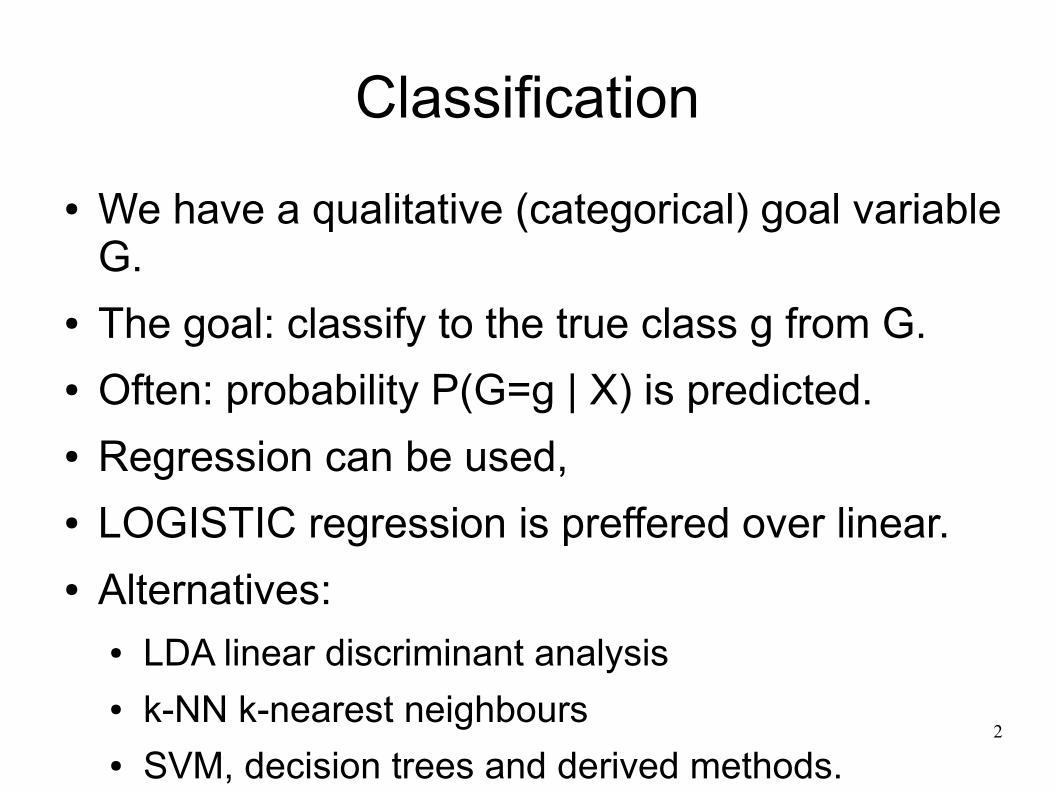
Classification● We have a qualitative (categorical) goal variable
G.● The goal: classify to the true class g from G.● Often: probability P(G=g | X) is predicted.● Regression can be used,● LOGISTIC regression is preffered over linear.● Alternatives:
● LDA linear discriminant analysis● k-NN k-nearest neighbours● SVM, decision trees and derived methods.

3
Example: Default Dataset● Goal:
● Will individual default on his/her payment?● Data:<Income, Balance, Student, G=Default>● Often displayed as color map.● Only a fraction of non-default individual
depicted.● Individuals with default
tend to have higher balances.

4
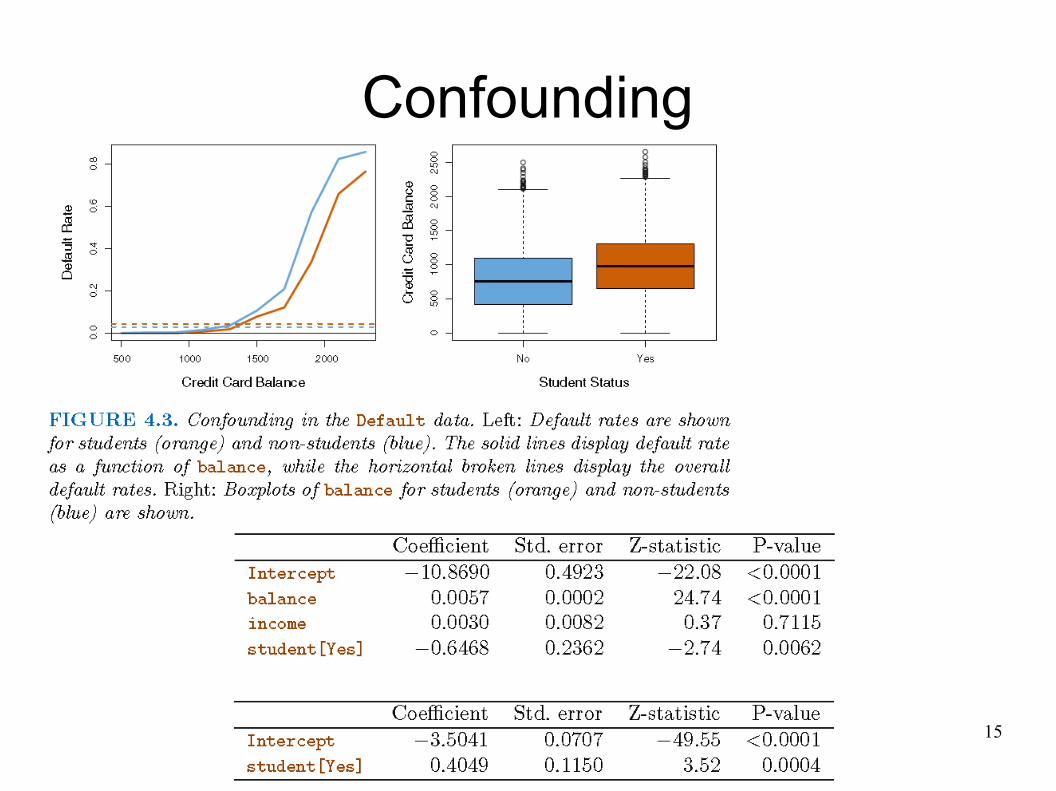
Remark: Notches● We are 95% sure medians differ.● We are not 95% individuum with default has
higher balance than individuum without default.

5
Why Not Linear Regression?● Really bad approach is to code diagnosis
numerically ● (since there is no ordering no scale).
● Different coding could lead to very different model.
● If G has natural ordering ● AND the gaps between values are similar the coding 1,2,3 would be reasonable.
6
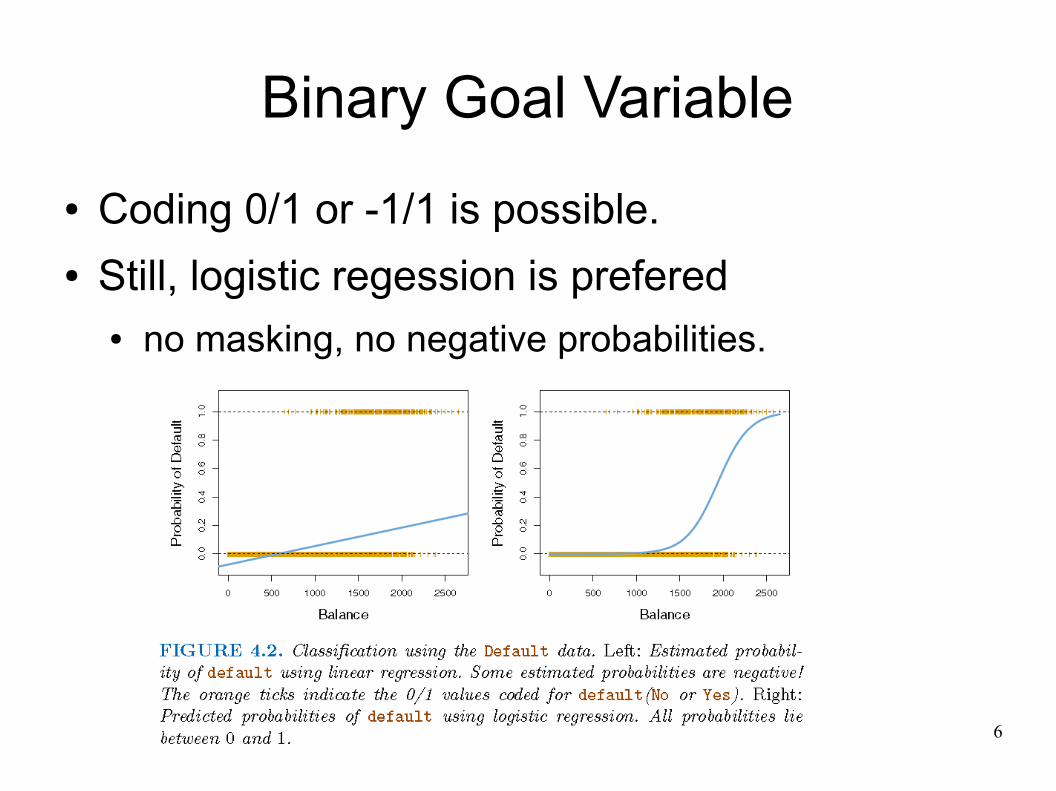
Binary Goal Variable● Coding 0/1 or -1/1 is possible.● Still, logistic regession is prefered
● no masking, no negative probabilities.

7
● We have three dummy variables Green, Blue, Orange, linear regression for each .
better model:● or even linear cuts are possible.
Masking in Linear Regression for G
P (g i / x)
8
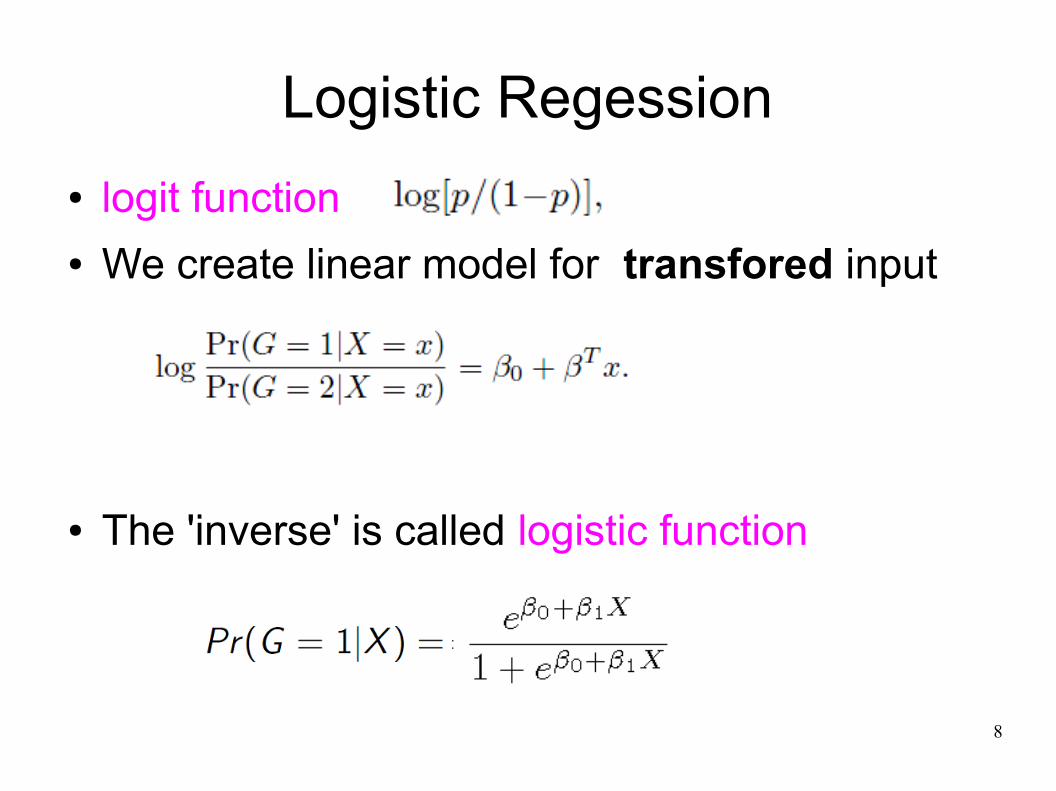
Logistic Regession● logit function● We create linear model for transfored input
● The 'inverse' is called logistic function

9
Fitting the Regression Coefficients● We search maximum likelihood coefficients.● Likelihood function:
● where
● Probability of the DATA given the model is called likelihood of the MODEL given the data.

10
(log) Likelihood
Train Data Predict likelihood loglikX G Pgreen Pblue Pyellow1 green 1/2 0 1/2 1/2 -12 green 1/3 1/3 1/3 1/3 -log33 blue 0 1 0 1 02 blue 1/3 1/3 1/3 1/3 -log31 yellow 1/2 0 1/2 1/2 -1
-2-2log3
Logistic regression predicts:
P column==green

11
Fitted Model
● therefore
● generally:
P (default /balance)= e−10.6513+0.0055balance
1+e−10.6513+0.0055balance
P (¬default /balance)= 11+e−10.6513+0.0055balance
fit.g=glm(default~balance, family='binomial',data=Wage)
12
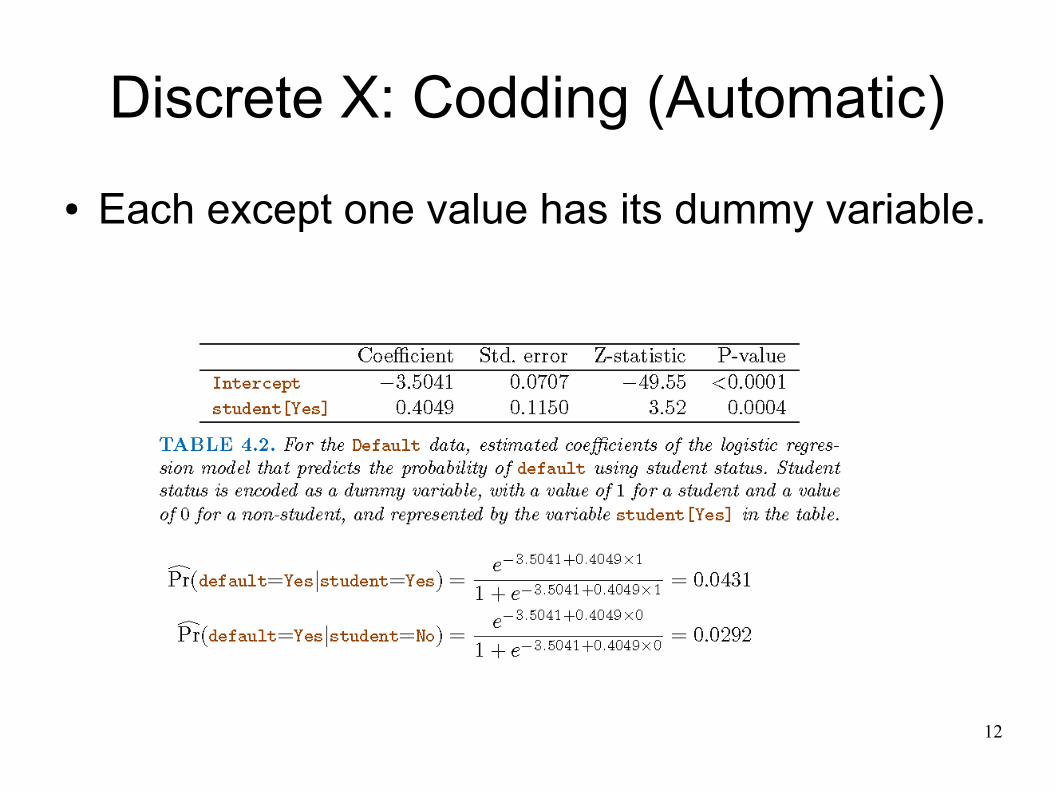
Discrete X: Codding (Automatic)● Each except one value has its dummy variable.

13
Multiple Logistic Regression
14
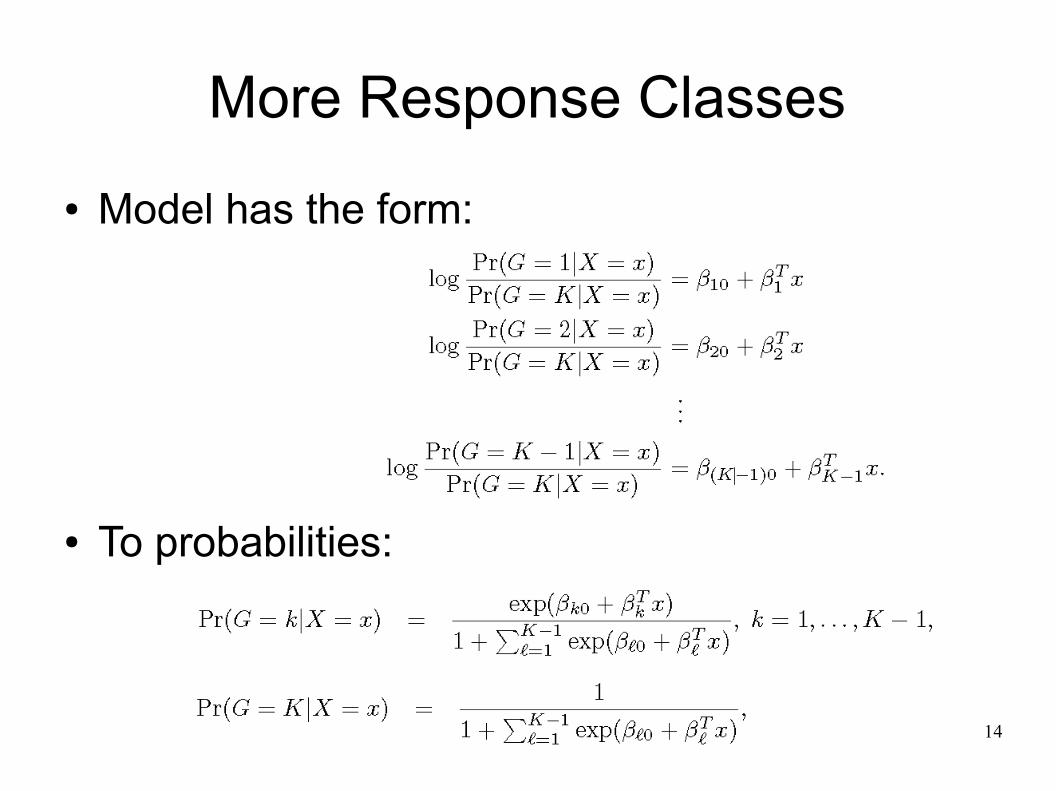
More Response Classes● Model has the form:
● To probabilities:
15
Confounding
16
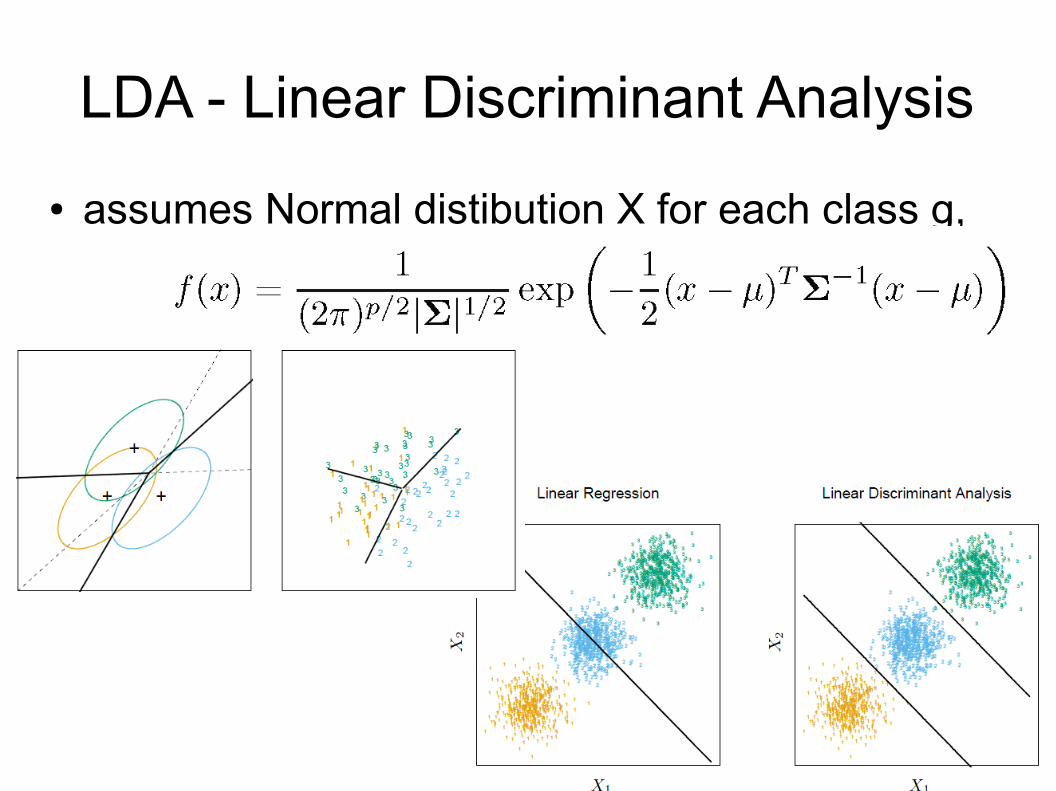
LDA - Linear Discriminant Analysis● assumes Normal distibution X for each class g,
17
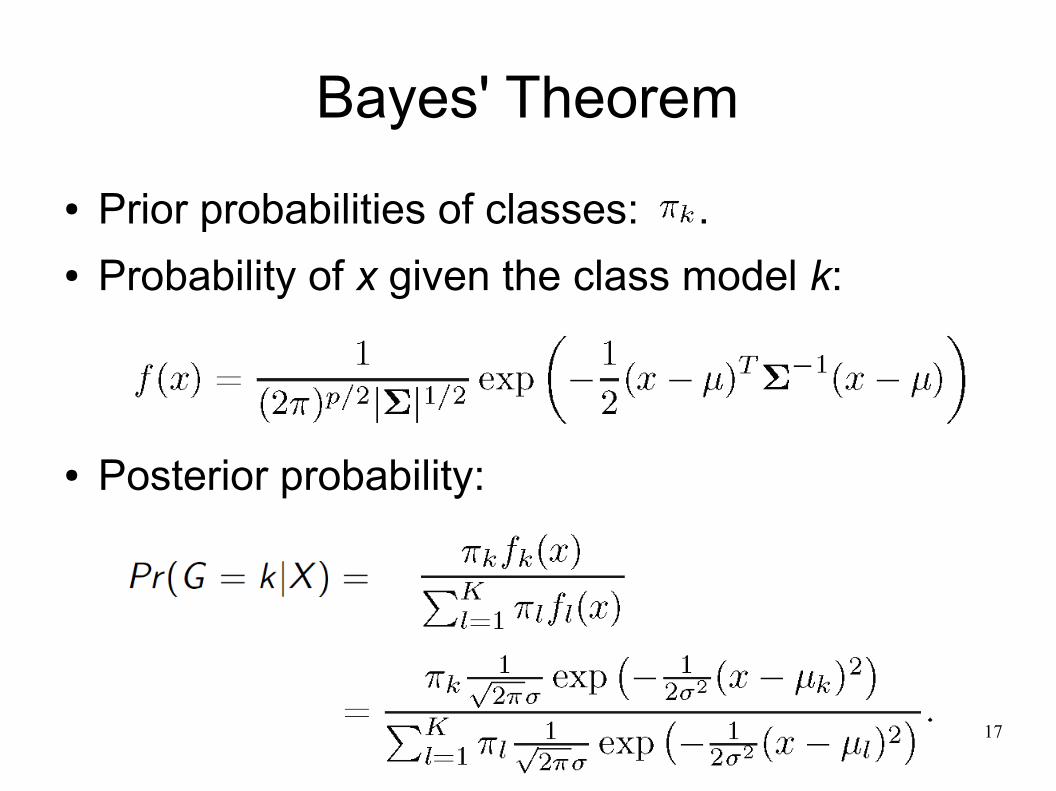
Bayes' Theorem● Prior probabilities of classes: .● Probability of x given the class model k:
● Posterior probability:
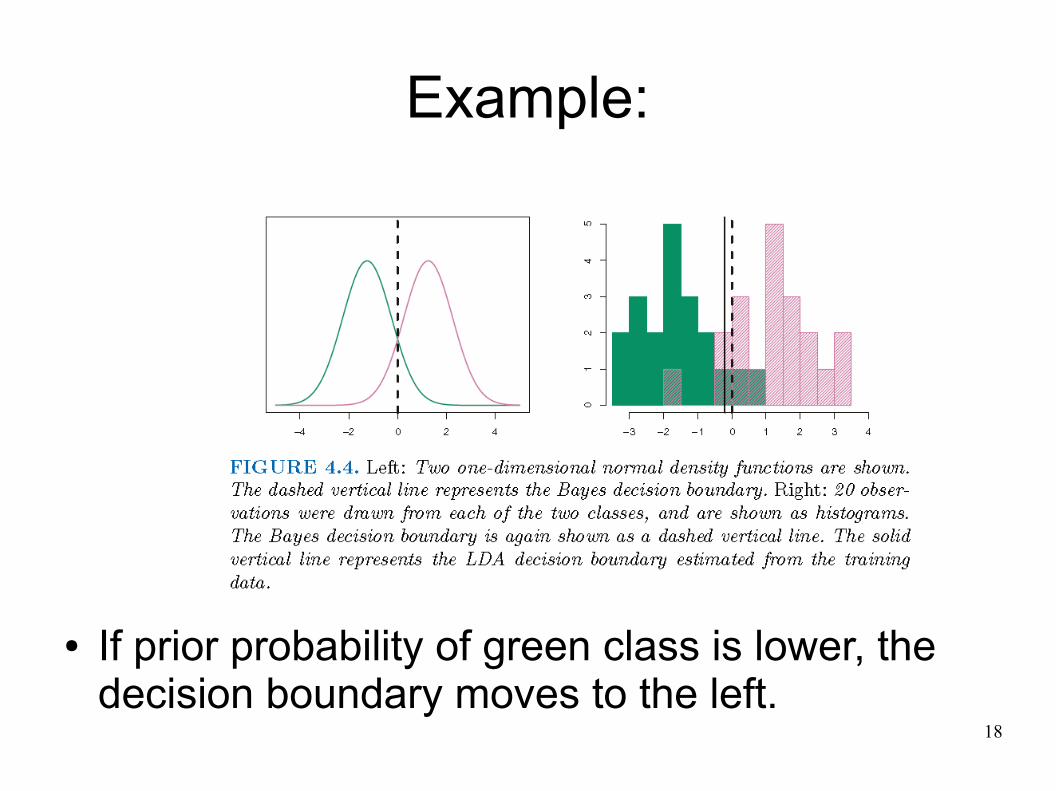
18
Example:
● If prior probability of green class is lower, the decision boundary moves to the left.
19
Bayes Boundary● Assume we know the true distribution of data.● For each x, predict the class g
j with the highest
P(G=gj|X=x).
● No better prediction can be made.● The error of such model is called Bayes error
this gives lower bound for our classifiers.
20
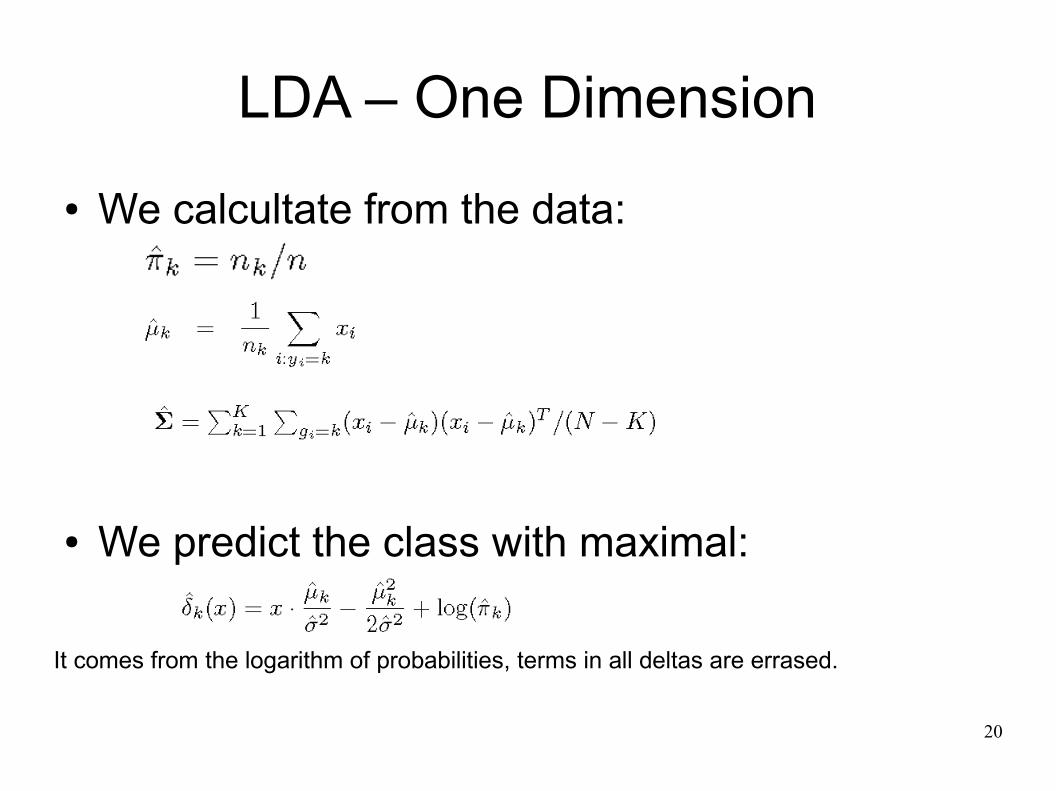
LDA – One Dimension● We calcultate from the data:
● We predict the class with maximal:
It comes from the logarithm of probabilities, terms in all deltas are errased.
21
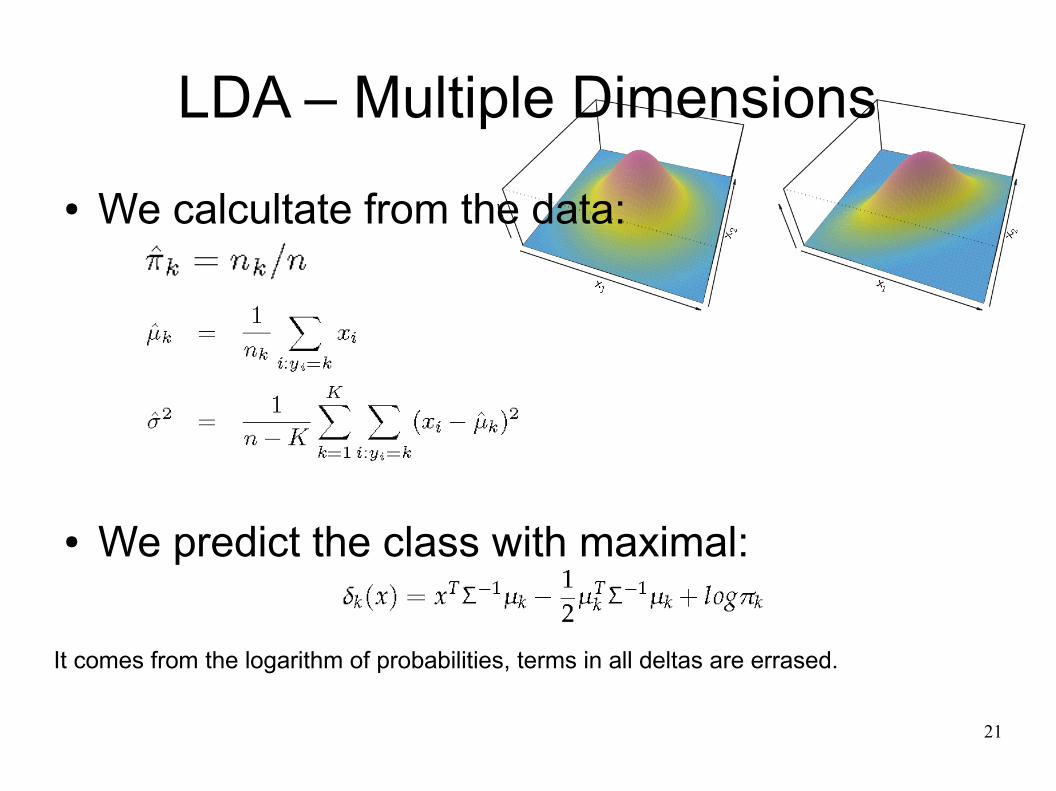
LDA – Multiple Dimensions● We calcultate from the data:
● We predict the class with maximal:
It comes from the logarithm of probabilities, terms in all deltas are errased.
22
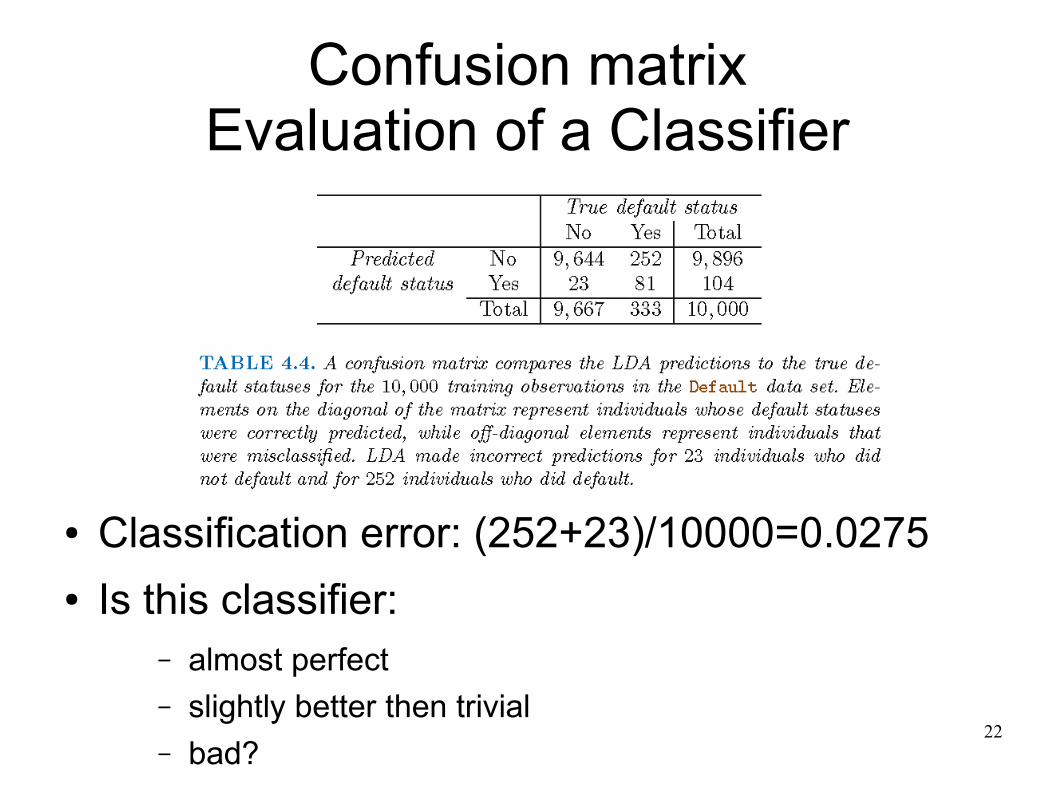
Confusion matrixEvaluation of a Classifier
● Classification error: (252+23)/10000=0.0275● Is this classifier:
– almost perfect– slightly better then trivial– bad?
23
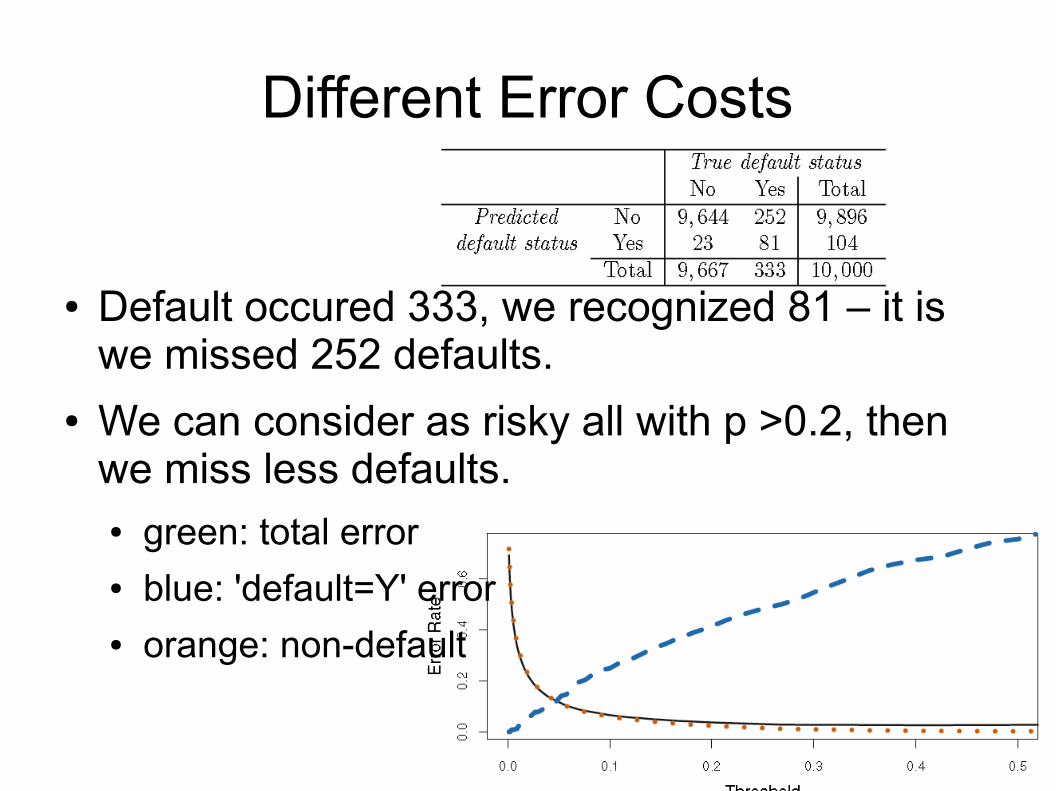
Different Error Costs
● Default occured 333, we recognized 81 – it is we missed 252 defaults.
● We can consider as risky all with p >0.2, then we miss less defaults.● green: total error● blue: 'default=Y' error● orange: non-default
24
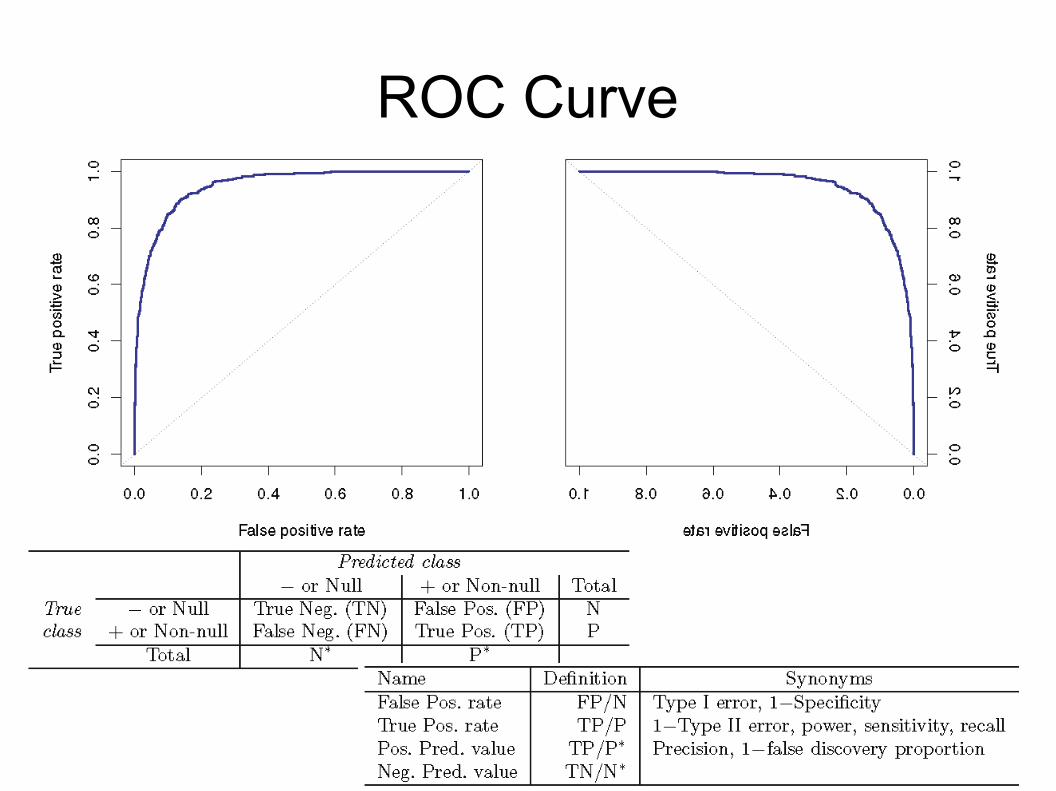
ROC Curve

25
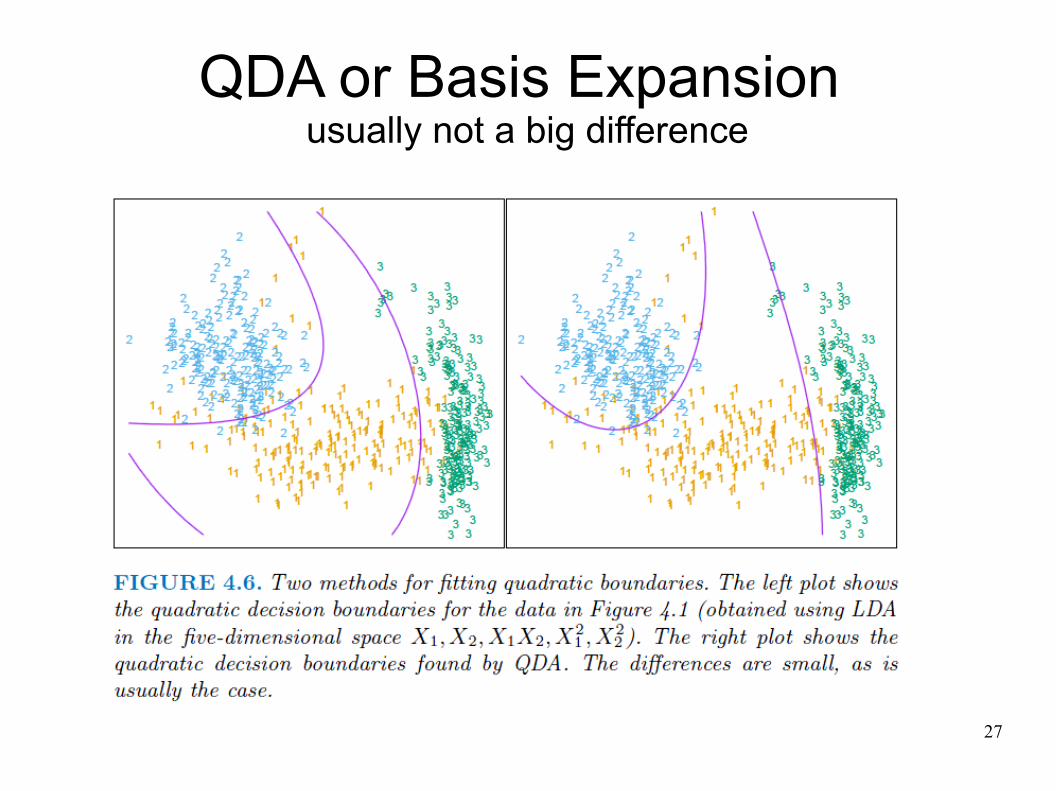
QDA – k Covariance Matrices
„Elipses may be different for each class“.● More parameters in the model.● Both LDA and QDA are often used.
26
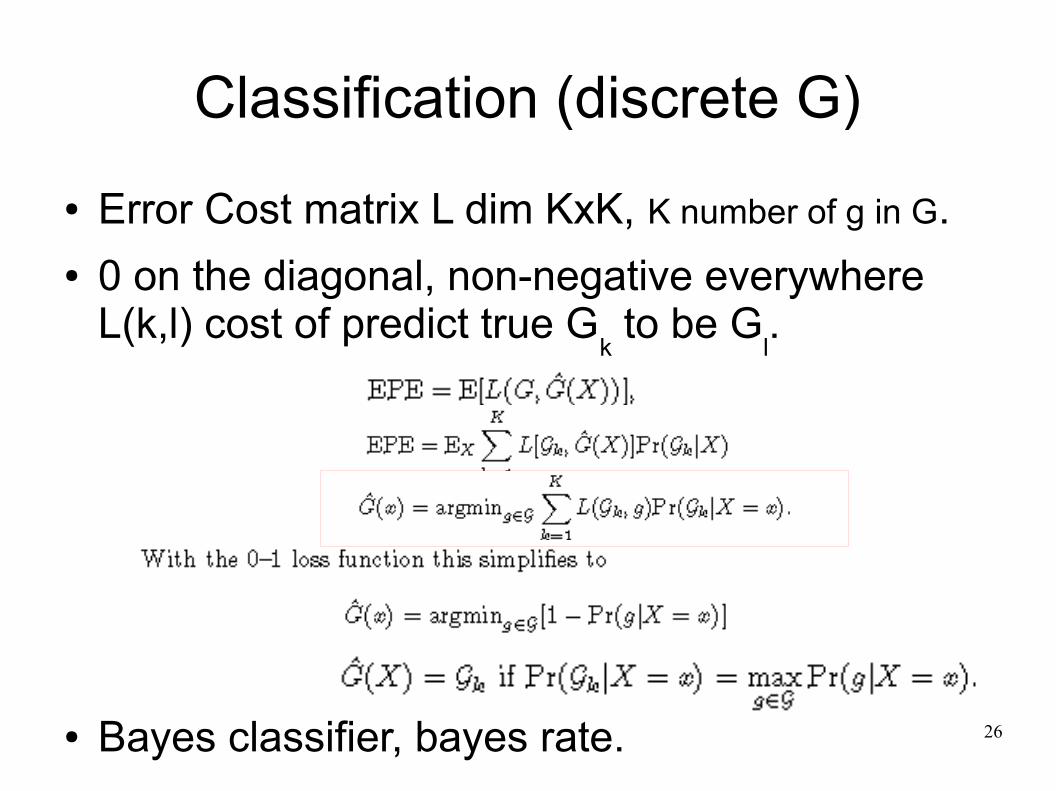
Classification (discrete G)● Error Cost matrix L dim KxK, K number of g in G.● 0 on the diagonal, non-negative everywhere
L(k,l) cost of predict true Gk to be G
l.
● Bayes classifier, bayes rate.
27
QDA or Basis Expansion usually not a big difference
28
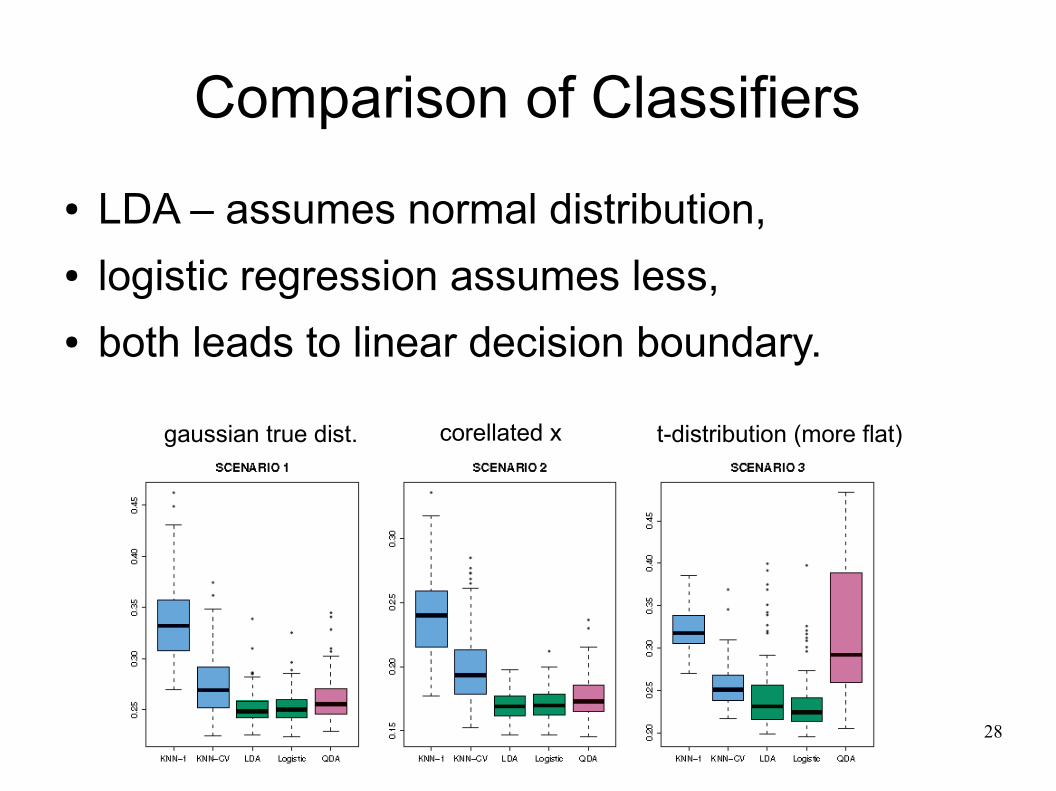
Comparison of Classifiers● LDA – assumes normal distribution,● logistic regression assumes less,● both leads to linear decision boundary.
gaussian true dist. corellated x t-distribution (more flat)

29
Comparison 2
● if assumptions are met – better prediction with fewer data,
● assumptions not met – often worst prediction.
gaussian,different covariances
gauss., non-corellgoal f. X
12,X
22,X
1X
2
gauss., non-corell.,complex goal function
30
Summary● Linear regression only for two-valued goal G.● LDA, if we assume two normal distributed
classes (it is mo stable),● logistic regression – usually simillar to LDA,● QDA – sometimes may be usefull,● k-NN can capure any non-linear decision
boundary. For simple boundaries may give worst predictions.

31
Ahead:

32
Optimal Separating Hyperplane
33
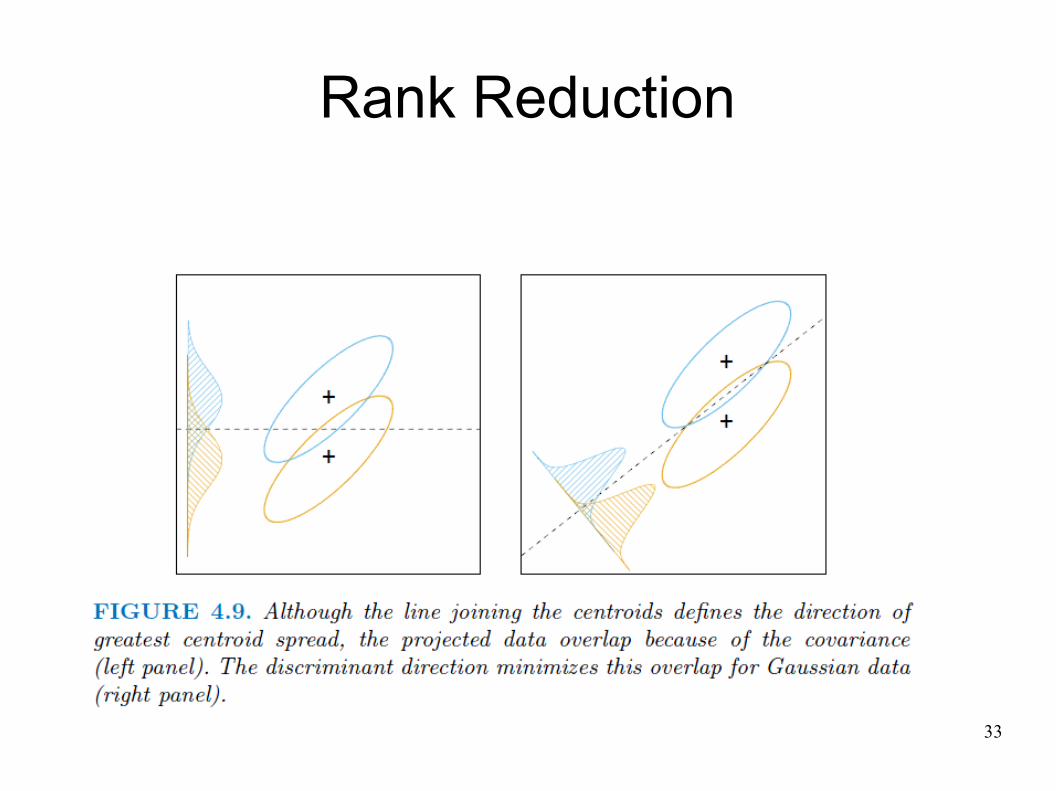
Rank Reduction