lincoln skills gap report - nebraska department of … report lincoln skills gap report prepared for...
TRANSCRIPT
Final Report
Lincoln Skills Gap Report
Prepared for the Nebraska Department of Labor
Prepared by Dr. Eric Thompson, Associate Professor of Economics and Director Bureau of Business Research
January 18, 2016 Bureau of Business Research
Department of Economics College of Business Administration
University of Nebraska—Lincoln Dr. Eric Thompson, Director
www.bbr.unl.edu
A Bureau of Business Research Report From the UNL College of Business Administration
i
Execut ive Summary
In the fall of 2014, the Nebraska Departments of Labor and Economic Development led efforts to conduct two surveys regarding the skills of workers and skill needs of employers: the Nebraska Metro Area Labor Availability Survey and the Make It Work for Lincoln Survey. The Association for Talent Development – Lincoln Chapter also contributed to the Make It Work for Lincoln Survey. The surveys further asked about training requirements and needs.
The current study utilizes the results of both surveys as well as secondary data about the Lincoln economy, to summarize information about job skills in the Lincoln area and whether a skills gap is found in particular occupations. A skills gap is present if it is difficult for a large share of employers to hire in a particular occupation and there is also a persistent gap between the demand for new workers and the number of individuals entering that occupation. Key questions include: In what part of the labor force, if any, is a skills gap present? And, is the skills gap the result of a lack of education and training opportunities, or are other factors at work? Results of the study suggest that the aggregate annual flow of individuals into the workforce in the Lincoln area is sufficient to meet annual needs of businesses due to net job growth and exits from the workforce. However, there are annual deficits of workers in many skilled blue collar occupations and lower skill service occupations, in part because a large share of entrants to the Lincoln labor force are college graduates. These annual deficits are only magnified by concerns employers expressed about job applicants in both segments of the work force. In particular, employers argue that a significant share of workers develop a work or personal history which makes them difficult to hire even when they have some of the requisite skills for an occupation. Problems include an inability to pass a background check or a poor work history (which typically means frequent job changes). Such problems imply even lower growth in the number of “hirable” skilled blue collar workers each year, and an even greater deficit with the annual number of new workers needed. Finally, there are also annual deficits in select technically-oriented professional fields, which require a college degree, such as computer and mathematical and workers. As suggested by the above, results indicate a need to prepare more Lincoln workers to enter careers in skilled, blue-collar occupations, as well as additional select occupations. In Chapter 4, the report identifies a group of specific, high demand occupations for which enhanced training, education, internship and (in some cases) apprenticeship opportunities are needed. These enhanced learning opportunities should be combined with additional efforts to inform secondary school students, and their parents, about the earnings and other opportunities afforded by these high demand occupations. The specific occupations are listed below, along with the standard occupation code from the U.S. Bureau of Labor Statistics:
Computer Systems Analysts (SOC CODE 15-1121)
Computer Programmers and Software Developers (SOC Code 15-1131, 15-1132, 15-1133)
Network and Computer Systems Administrators (SOC Code 15-1142)
Computer User Support Specialists (SOC CODES 15-1151)
Carpenters (SOC Code 47-2031)
Electricians (SOC Code 47-2111)
Industrial Machinery Mechanics (SOC Code 49-9041)
ii
Maintenance and Repair Workers, General (SOC Code 49-9071
Machinists (SOC Code 51-4041)
Welders, Cutters, Solderers and Brazers (SOC Code 51-4121)
Given this list, the report clearly supports the recent Career Academy initiative, which is a partnership of
the Lincoln Public Schools, Southeast Community College and the community at large. The Career Academy will develop a pipeline of students pursuing career and technical programs in order to directly address the gap between demand for qualified workers in technical fields and the availability of professionally trained workers. While the exact pattern of job placement after high school, community college or further post-secondary education is not yet known, graduates of The Career Academy should help mitigate some of the shortages noted in this report for the occupations listed above. Naturally, other steps also should be taken. A complementary expansion of training, certificate programs, degree programs, internships and, where appropriate, apprenticeship opportunities also are needed in these occupations. This will require even further collaboration between employers, training entities and other education institutions. Results of the research also support another potential initiative. In particular, many employers indicate that a poor work history or elements of worker’s personal history were often a factor in making it difficult to hire, especially in the occupations featured above. Discussions with employers revealed that a poor work history meant an inability to commit and fit in at work, leading to too-frequent job changes. To a large degree, workers in these occupations echoed the same concerns in their own survey responses in the Nebraska Metro Area Labor Availability Survey, in answers to questions pertaining to barriers to finding a new job. The bottom line is that there appears to be a group of workers in each of these occupations who may have some or all of the relevant occupation-specific skills, but who are still not appealing to employers due to work history or an inability to pass a background check. This raises two key questions: is there a subset of workers in these occupations with potential to change, that is, to become more committed to and a better team member at work? And, how would workers who are able to change be identified and separated from the others? To answer these questions, there should be extensive discussion with HR representatives and direct supervisors of workers in these key occupations regarding what practical steps workers can take, if any, over time, to change a poor work history into an adequate work history. Finally, results of the research did not find that the general level of wages in the Lincoln area was a significant issue for placing workers into jobs. Specifically, in nearly all occupations the wage requirements of individuals seeking work generally: 1) represented only a moderate increase over their current wages and 2) were within the prevailing wages found within the Lincoln area job market. The most notable, exception, however was the Personal Care and Service occupation (SOC 39). It is very difficult to find workers in this occupational group and that worker wage aspirations are well outside of the prevailing wages in the Lincoln area.
iii
Table of Contents
Executive Summary………………………………………………………………………………………………………………………………... i
1. Introduction………………………………………………………………………………………………………………………….……………. 1
2. Supply and Demand of Workers in Lincoln Occupations………………………………………..………………….………. 4
A. Supply versus Demand for Workers by Occupations……………………………………………………...….…. 4
B. Job Search among the Current Employed………………………………………….………………………………….12
3. Barriers to Employment and the Local Labor Market……...................................................................... 17
4. Detailed Evaluation of Select Occupation Groups ………………….…..……………………………………..…............ 26
iv
List of Figures and Tables
Table 2.1: Annual Net Openings and School Leavers by Occupation Group................................................ 7
Table 2.2: Annual Net Openings and Entrants by Occupation Group, Excluding Migrants………………………. 8
Table 2.3: Annual Net Openings and Entrants By Occupation, Including Migrants...............................…... 9
Table 2.4: Total Annual Exits and Entrants and Problems with Work History………………………..………....……10
Table 2.5: Number of Jobless Individuals Who Report Actively Searching For a New Job by Previous Occupation……………………………………………………………………..…………..…………………..……. 11
Table 2.6: Percent and Number of Employed Individuals Who Report Actively Searching For a Job by Occupation…….……………………………………………………………..………………...………….…… 13
Table 2.7: Relative Abundance of Employed Job Seekers by Occupation…….......................................……14
Table 2.8: Factors Influencing the Probability of Active Job Search by Employed Individuals……………….. 15
Table 3.1: Employer and Potential Worker Perceptions of Skill and Training………...............................……18
Table 3.2: Employer and Potential Worker Perceptions of Worker Background and History……………….…18
Table 3.3: Current and Desired Wages of All Potential Job Seekers by Education Attainment……………….20
Table 3.4: Current and Desired Wages of All Potential Job Seekers by Occupation Group....................... 21
Table 3.5: Average Desired and Actual Wages of All Potential Job Seekers by Occupation Group………... 22 Table 3.6: Share of Business Respondents in Make It Work For Lincoln Survey Reporting It Was Difficult to Find Workers, By Selected Occupation?.............................................................……24 Figure 4A.1: Percent of Employers Indicating It is Difficult to Hire, Installation, Maintenance and
Repair Occupations?.........................................................................................................……26 Figure 4A.2: Reasons Why It Was Difficult to Hire, Installation, Maintenance and Repair Occupations….27 Figure 4A.3: Ratio of Annual Net Openings to Entrants, Installation, Maintenance and Repair Occupations.......................................................................................................................……27 Figure 4A.4: Applicants with Background Factors That May Influence Hiring, Installation, Maintenance and Repair Occupations..............................................................................……28 Figure 4A.5: Share of Employed Workers with Potential to Take or Actively Search For a New Job Installation, Maintenance and Repair Occupations versus All Occupations……………………..…29
v
Figure 4A.6: Share of Workers Not Currently Employed with Potential to Take or Actively Search For a New Job Installation, Maintenance and Repair Occupations versus All Occupations……….29
Figure 4A.7: Share of Installation, Maintenance and Repair Workers Citing an Obstacle to Changing Jobs or Reentering the Workforce …………………………………………………………….………………….…..30 Figure 4A.8: Types of Training Provided to Newly Hired Installation, Maintenance and Repair Workers.31 Figure 4A.9: Willingness to Train among Installation, Maintenance and Repair Workers....................……32 Figure 4B.1: Percent of Employers Indicating It is Difficult to Hire Personal Care and Service Occupations?.......................................................................................................................…33 Figure 4B.2: Reasons Why It Was Difficult to Hire, Personal Care and Service Occupations………………..…33 Figure 4B.3: Ratio of Annual Net Openings to Entrants, Personal Care and Service Occupations………..…34 Figure 4B.4: Applicants with Background Factors That May Influence Hiring, Personal Care, and Service Occupations..........................................................................................................……35 Figure 4B.5: Share of Employed Workers with Potential to Take or Actively Search For a New Job Personal Care and Service Occupations versus All Occupations……………………………….………..35 Figure 4B.6: Share of Workers Not Currently Employed with Potential to Take or Actively Search For a New Job Personal Care and Service Occupations versus All Occupations………………….…….36 Figure 4B.7: Share of Personal Care and Service Workers Citing an Obstacle to Changing Jobs or Reentering the Workforce ……………………………………………………………………..…………………….…..37 Figure 4B.8: Types of Training Provided to Newly Hired Personal Care and Service Workers………………...38 Figure 4B.9: Willingness to Train among Personal Care and Service Workers......................................……38 Figure 4C.1: Percent of Employers Indicating It is Difficult to Hire Transportation and Material Moving Occupations?.....................................................................................................................……40 Figure 4C.2: Reasons Why It Was Difficult to Hire, Transportation and Material Moving Occupations.….41 Figure 4C.3: Ratio of Annual Net Openings to Entrants, Transportation and Material
Moving Occupations……………………………………………………………………………………………………………41 Figure 4C.4: Applicants with Background Factors That May Influence Hiring, Transportation and Material Moving Occupations.........................................................................................................……42 Figure 4C.5: Share of Employed Workers with Potential to Take or Actively Search For a New Job Transportation and Material Moving Occupations versus All Occupations…………………….…..43
vi
Figure 4C.6: Share of Workers Not Currently Employed with Potential to Take or Actively Search For a New Job Transportation and Material Moving versus All Occupations……………………….….43 Figure 4C.7: Share of Transportation and Material Moving Workers Citing an Obstacle to Changing Jobs or Reentering the Workforce ………………………………………………………….…………………….…..44 Figure 4C.8: Types of Training Provided to Newly Hired Transportation and Material Moving Workers…45 Figure 4C.9: Willingness to Train among Transportation and Material Moving Workers.....................……46 Figure 4D.1: Percent of Employers Indicating It is Difficult to Hire Construction and Extraction Occupations?.....................................................................................................................……47 Figure 4D.2: Reasons Why It Was Difficult to Hire, Construction and Extraction Occupations……………….48 Figure 4D.3: Ratio of Annual Net Openings to Entrants, Construction and Extraction Occupations…….…48 Figure 4D.4: Applicants with Background Factors That May Influence Hiring, Construction and Extraction Occupations.....................................................................................................……49 Figure 4D.5: Share of Employed Workers with Potential to Take or Actively Search For a New Job Construction and Extraction Occupations versus All Occupations…………………….…………..…..50 Figure 4D.6: Share of Workers Not Currently Employed with Potential to Take or Actively Search For a New Job Construction and Extraction Occupations versus All Occupations………..……….….50 Figure 4D.7: Share of Construction and Extraction Workers Citing an Obstacle to Changing Jobs or Reentering the Workforce ………………………………………….………………………….…………………….…..51 Figure 4D.8: Types of Training Provided to Newly Hired Construction and Extraction Workers……………..52 Figure 4D.9: Willingness to Train among Construction and Extraction Workers..................................……52 Figure 4E.1: Percent of Employers Indicating It is Difficult to Hire, Production Occupations...............……54 Figure 4E.2: Reasons Why It Was Difficult to Hire, Production Occupations………………………………….……….55 Figure 4E.3: Ratio of Annual Openings to Entrants, Production Occupations………………..…………………….…55 Figure 4E.4: Applicants with Background Factors That May Influence Hiring, Production Occupations.…56 Figure 4E.5: Share of Employed Workers with Potential to Take or Actively Search For a New Job Production Occupations versus All Occupations……………………………………………….…………..…..57 Figure 4E.6: Share of Workers Not Currently Employed with Potential to Take or Actively Search For a New Job Production Occupations versus All Occupations…………………………………..……….….57
vii
Figure 4E.7: Share of Production Workers Citing an Obstacle to Changing Jobs or Reentering the Workforce …………………………………………………………………..………………………….…………………….…..58 Figure 4E.8: Types of Training Provided to Newly Hired Production Workers………………………………………..59 Figure 4E.9: Willingness to Train among Production Workers..............................................................……59 Figure 4F.1: Percent of Employers Indicating It is Difficult to Hire, Computer and Mathematical Occupations.......................................................................................................................……61 Figure 4F.2: Reasons Why It Was Difficult to Hire, Computer and Mathematical Occupations………..…….62 Figure 4F.3: Ratio of Annual Net Openings to Entrants, Computer and Mathematical Occupations…...…62 Figure 4F.4: Applicants with Background Factors That May Influence Hiring, Computer and
Mathematical Occupations…………………………………………………………………………………………………63 Figure 4F.5: Share of Employed Workers with Potential to Take or Actively Search For a New Job Computer and Mathematical Occupations versus All Occupation….……………………………..…..64 Figure 4F.6: Share of Workers Not Currently Employed with Potential to Take or Actively Search For a New Job Computer and Mathematical Occupations versus All Occupations……………….….64 Figure 4F.7: Share of Computer and Mathematical Workers Citing an Obstacle to Changing Jobs or Reentering the Workforce ……………………………………………………………….…….…………………….…..65 Figure 4F.8: Types of Training Provided to Newly Hired Computer and Mathematical Workers………..…..66 Figure 4F.9: Willingness to Train among Computer and Mathematical Workers....................................…66
1
1. Introduction
In the fall of 2014, the Nebraska Departments of Labor and Economic Development led efforts to survey both households and businesses in the Lincoln, Nebraska region to examine the skills and work preferences of regional residents and the skill needs and training practices of local employers. These surveys were the Lincoln Labor Availability Report and the Make It Work for Lincoln Survey. The latter survey also was produced with participation of the Association for Talent Development (ATD) – Lincoln Chapter. The surveys also were used to evaluate whether there is a skills gap present within the Lincoln area labor market. Such a skills gap would be present if a high share of employers find that it is difficult to hire workers for an occupation and there is a persistent gap between the demand for workers and the number of workers entering that occupation.
The reports identified a significant list of occupations where such a skills gap may be present, including key manufacturing occupations such as production workers and installation, maintenance and repair workers as well as service occupations such as computer and mathematical occupations. The reports also provided evidence that such skills gap have potential to limit growth of the Lincoln economy in the years to come. In particular, 18.5 percent of respondents to the Make It Work for Lincoln Survey indicated that a (hypothetical) major expansion project by their company in the Lincoln area could be delayed or scuttled by an inability to find workers for key positions. The share was even higher, at 30.5 percent, for goods producing businesses such as agricultural processors, other manufacturers and construction businesses. Such potential impacts on economic growth provide another motivation to identify and remedy the skills gap in the Lincoln area. Key questions include: In what part of the labor force is a skills gap present? And, is the skills gap the result of a lack of education and training opportunities, or are other factors at work? Measuring the skills gap will be challenging. After all, both businesses and workers are likely to cite difficulties in the labor market with some frequency. For employers, finding and maintaining a productive work force is one of the key challenges of running a business, after developing a customer base. Likewise, finding and keep meaningful employment is one of the key career challenges faced by workers. Sure enough, survey results showed that these were key concerns. For example, the Nebraska Metro Area Labor Availability Survey queried workers about whether it was difficult to find work and 61.5 percent reported that it was difficult to find jobs in their chosen occupations. At the same time, the Make It Work for Lincoln Survey queried employers about whether it was difficult to find workers in their three top occupations for hiring, and 62.5 percent of employers reported that it was difficult to find workers. Do these survey responses mean that a broad-based skills gap is present in the Lincoln area economy? Not necessarily. After all, as noted above, we would anticipate a certain level of concern by business and people given the rigor of the labor market. A more interesting question is: for which occupations is it most difficult to find a worker, or to find a job? Further, to identify a skills gap in a particular occupation, we also must identify factors which are causing a lingering shortfall in the number of qualified and employable workers available to employers.
2
There a many potential reasons why a skills gap could develop within an occupation. Structural change – Structural change refers to changes in technology, customer demand, or international competition which expand that demand for workers in select occupations (and reduce the demand in others). Time may be required for workers to prepare for these emerging occupations, either through retraining for existing workers or by providing appropriate degree and certificate programs for college, community college and high school students. Education and Training Programs – Appropriate degree and certificate programs are needed to help workers build skills required in the economy. Local education institutions, many of which are part of the public sector, may struggle to identify needed programs or change program offerings to meet the needs of students and employers. Degree and certificate programs also must be sufficiently rigorous to prepare students to meet employer needs. Appeal of Occupations – Even when adequate degree and training programs are available, occupations may fail to attract workers at prevailing wages. The combination of wages, benefits and working conditions at a particular occupation may fail to attract workers relative to other work options available within the economy. Such conditions can arise or grow worse as the economy evolves and can also occur because potential workers have inadequate information about the benefits of a particular occupation, or are steered away from occupations by family members, mentors, or public perception. At the same time, competitive conditions may prevent local employers from raising pay and benefits in order to enhance the appeal of a particular occupation. Taxes on Middle Class Workers – At prevailing wages, taxes may discourage workers from making investments in their skills through education and training programs. Such monetary investments may not be appealing if too large a share of incremental earnings go to federal, state and local government (either directly through income taxes or indirectly through sales and property taxes) rather than the worker themselves. In other words, if the tax burden is too high, workers may not choose to enter skilled occupations where work opportunities are abundant, even when local education and training opportunities are adequate. Career Destruction – A portion of workers at all skill levels may engage in behavior which reduces their employment potential. These workers may have adequate skill and experience for an occupation, but still not appeal to employers. For example, worker may have a criminal record, or fail to pass a drug test or may have a poor work history, as evidenced by frequent job changes or other indicators of an inability to fit into the workplace. In these cases, a skill gap can arise because worker skills cannot or will not be utilized by employers, rather than a lack of skill. Social Safety Net – Public benefits such as Medicaid, TANF or Social Security Disability Income may create a significant disincentive for some workers, particularly lower skills workers, to fully participate in the workforce. This may make it very challenging for employers in some occupations to find an adequate workforce. Net Outmigration – While workers are constantly moving in and out of cities, some cities develop a pattern of sustained net outmigration of workers (the difference between in-migrants and out-migrants) in a wide variety of occupations. Net outmigration may be especially severe in those skilled occupations

3
which are typically filled with younger workers (for example, computer and mathematical occupations), given that younger, educated workers are also the most mobile. These phenomena can limit the local supply of workers in selected skill groups, leaving employers to note a lack of adequately trained workers, or workers who have a poor work history or wage demands which are too high. This report will utilize data from a variety of sources to identify where a skills gap may be presented, including data from the Lincoln Labor Availability Report, the Make It Work for Lincoln Survey, and data on projected job openings, the flow of graduates and prevailing wages. We began by comparing the annual job openings generated in each occupation, due to retirements and other exits and net job growth, with the potential annual supply of new workers to the occupation, due to local graduates, local residents who are not currently working, and net migration. We also consider the share of existing employed workers who are open to or pursuing a change in jobs, and compare their wage requirements with prevailing market wages. Such “churn” in the labor market is important to provide employers with the best match of experienced, skilled workers. Lastly, the study evaluates the post-hire training practices of employers and the willingness of workers to participate in training.
4
2. Supply and Demand for Workers in Lincoln Occupations The most basic measure of the balance between supply and demand in an occupation is whether there is a gap of between the number of workers being prepared for a certain occupation each year versus the annual need for new workers to enter that occupation. Over time, the annual flow into and out of the occupation will influence how scarce, and difficult to find, workers become. This chapter compares the number of individuals joining an occupation each year after leaving school (either as a graduate or a non-graduate) or net in-migration with the number of net openings in an occupation each year due to net job growth or individuals exiting the occupation. This chapter also examines the potential for individuals who are not working to reenter the labor force. This provides an additional source of potential new workers for Lincoln area employers. This chapter also examines the level of “churn” among the existing workers within each occupation. A level of churn is critical since jobs within a single occupation can differ in terms of requirements for skill and experience. An abundance of new graduates can help fill entry level positions but existing, more experienced workers (i.e. former entry level workers) are also needed to fill some openings. We estimate the percent and number of experienced workers within each occupation who are searching for employment, and what factors influence the probability of active job search by employed workers. A. Supply Versus Demand for Workers By Occupation The first step is to compare the annual net openings and new entrants to each major occupation group within the Lincoln MSA. Net openings in an occupation is a function of net job growth in that occupation and openings created by individuals leaving the occupation. In most occupations, individuals primarily leave because of retirement but other causes include death, disability or changing occupations. Changing occupations is a large share of exit in the case of a handful of lower wage occupations including food preparation and serving related occupations and sales and related occupations. New entrants to an occupation come from local individuals who are leaving schooling and net migration to the Lincoln area. Individuals who leave schooling include both graduates and non-graduates. Graduates are high school graduates (GED completers), community college graduates or college/university graduates (including graduate students) each year. Non-graduates include individuals who drop out of high school, college, or community college. College and community college graduates are assigned to occupations based on their major field of study. High school graduates and non-graduates are assigned to occupations which do not require an education based on the number of annual openings. Analysis also should consider the share of graduates and non-graduates who are likely to be active participants in the labor force in any given year. This will provide the best estimate of how many “workers” are being added in the community per year. Net openings in the Lincoln labor market are based on projections developed by the Office of Labor Market Information (LMI) unit of the Nebraska Department of Labor. Specifically, the Nebraska LMI generates projections of the demand for additional workers in an occupation based on net job growth and replacement openings, as part of its Nebraska 2012-2022 Long-Term Occupational & Industry Projections publication, for which projections area currently available on-line. In that publication, replacement openings refer to individuals permanently leaving an occupation due to retirements as well as death, disability or changing occupations. Projections are cumulative for 10 years. The annual new
5
jobs or replacement openings were estimated by taking one-tenth of the 10 year projection. This estimate of the annual growth in demand is shown in Table 2.1 below. Table 2.1 specifically estimates the number of local individuals finishing college or community college in a given year with a potential match to each occupation. Individuals completing a degree at an area university, college or community college were assigned to a particular occupation based on the match between their degree program and the occupation. The number of graduates by degree was obtained from the College Navigator data base maintained by the U.S. Department of Education for the following schools: University of Nebraska-Lincoln, Concordia, Doane, Kaplan, Union, and Wesleyan. There were 8,830 graduates from these sources in 2013-14, the most recent year for which data is available through College Navigator.1 Most of these college or community college graduates are expected to participate in the labor force in any given year while they are in the prime working age of 25 to 64. In particular, data from the National Center for Education Statistics found that in 2014 87.0 percent of 25 to 64 year olds who completed a Bachelor’s degree2 were in the formal labor market. The share was 72.6 percent for individuals who completed an Associate’s Degree. These rates were combined with the 8,830 graduates estimate to estimate that 7,490 of these university, college and community college graduates would be available to participate in the labor force during a given year. The next question is how many non-graduates leave school each year and how many of them participate in the labor force in a given year- based on their labor force participation rates. These non-graduates entering the labor force are divided into three distinct categories: individuals leaving college, those finishing high school and those dropping out of high school. The annual number of each type of school leaver is estimated for the Lincoln area, as described below. High School Graduates. The number of high school graduates in the Lincoln area (Lancaster and Seward County) is estimated based on the annual number of high school graduates in Nebraska (22,350) reported in the 2014 Nebraska High Education Progress Report from the Nebraska’s Coordinating Commission on Postsecondary Education, and the share of Nebraska’s 18-year olds who live in Lancaster and Seward County (21.1%), based on data from the United States Census. The estimated annual number of high school graduates in the Lincoln area is approximately 3,330. How many of those individuals decided not to attend college? According to the Commission report 65.1 percent of those students attended a degree-granting institution (either in-state or out-of-state) within one-year of completing high school. Therefore, the annual flow of individuals who potentially enter the job market as high school graduates is approximately 34.9 percent of 3,330, or 1,160. A portion of these individuals will participate in the labor force in a given year. The National Center for Education Statistics found that 72.0% of 25 to 64 year olds those who completed high school but did not participate in post-secondary education were in the labor market in 2014. This is 72 percent is applied to 1,160 to yield 840 in additional labor force participants with a high school degree only.
1 We assume that 250 graduates of SECC will go on to attend 4-year college each year, since this was the number of graduates from life, physical and social sciences. These graduates are excluded as they were assumed to be captured in the number of college graduates. 2 Institute for Education Sciences, 2015. “Employment Rates and Unemployment Rates by Educational Attainment,” National Center for Education Statistics, U.S. Department of Education (May). Accessed at nces.ed.gov/programs/coe/indicator_cbc.asp
6
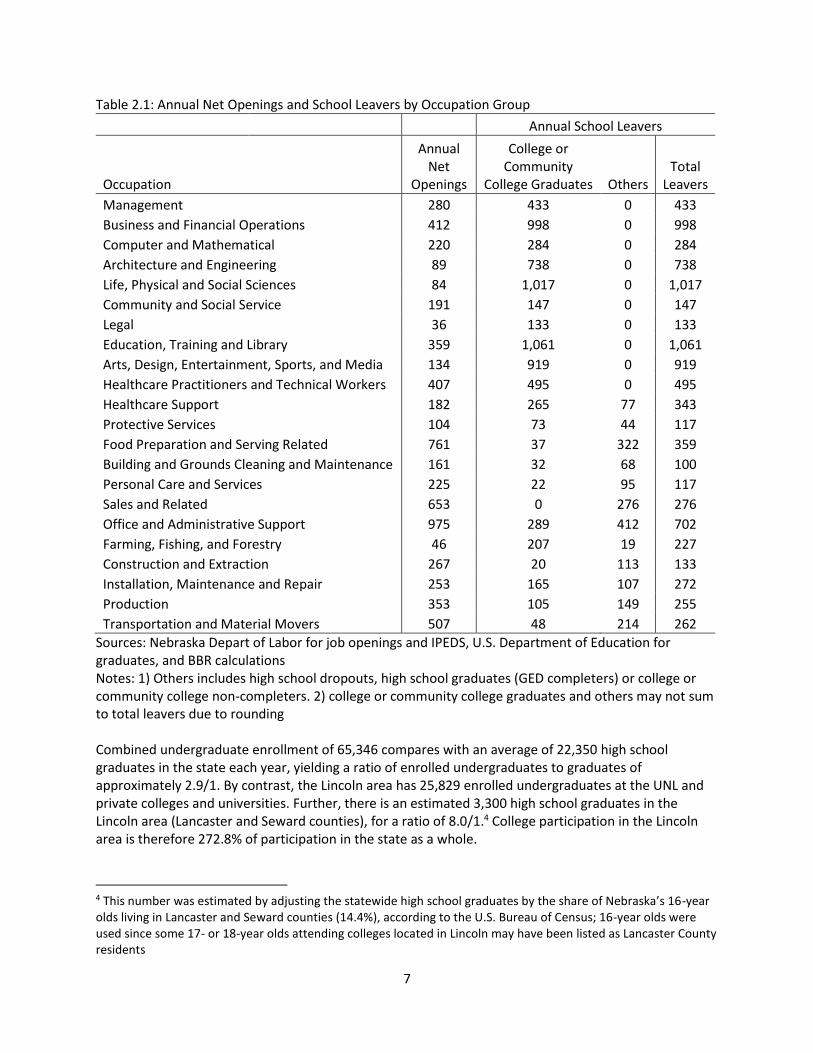
High School Dropouts. The Nebraska Higher Education Progress Report from the Nebraska’s Coordinating Commission on Postsecondary Education Commission indicated that Nebraska has a four-year high school graduation rate of 90 percent. This graduation rate implies that there is one non-completer for each nine high school graduates. This yields an estimate of approximately 370 dropouts potentially joining the Lincoln area labor market in any particular year (although some of these individuals will ultimately obtain a GED). The National Center for Education Statistics report found that 59.9 percent of those who did not complete high school were participating in the labor market in 2014. Applying this rate to the population of 370 indicates that high school dropouts contribute 220 additional labor force participants each year. College and Community College Non-Completers. The Nebraska Higher Education Progress Report indicates that overall graduation rate from Post-Secondary institutions in Nebraska is approximately 50% in a typical year. Applying this rate to the 65.1 percent of 3,330 high school graduates who attend college yields an estimate that 1,080 individuals will potentially enter the local labor market each year without a completing a post-secondary degree. The National Center for Education Statistics report indicates that 77.6 percent of these will enter the labor force, implying 840 additional labor force participants each year.3 Altogether, approximately 1,900 high school only completers, high school dropouts, and college dropouts enter the labor market in the Lincoln area each year. These individuals do not have specific community college or college degree’s to match with any particular occupation, so the individuals are distributed among the occupations which do not require a college or community college degree (although workers may have a degree) including: healthcare support; protective services; food preparing and serving; building and grounds; personal care and services; sales, office and administrative support; farming, fishing and forestry; construction and extraction; installation, maintenance and repair; production; and transportation and material moving occupations. The 1,900 individuals are allocated to these occupations based on the share of annual openings in each occupation. Results in Table 2.1 show that there is an abundance of school leavers relative to annual net openings in many occupations. Abundance is present in the case of white collar jobs or other jobs which require a college degree (with the exception of community and social service occupations), which are listed at the top of the Table. This might be expected given the concentration of college students in Lincoln. Abundance is less assured for many other occupations, in particular food preparation and serving related, personal care and services, sales and related, construction and extraction, production, and transportation and material movers. These occupations draw more heavily on individuals who did not pursue or did not complete a postsecondary degree. Even the evidence of abundance among occupations which require a college degree must be interpreted with caution, however. This is because some of the graduates from colleges in Lincoln will find work elsewhere. Table 2.1, therefore, needs to be adjusted. This is done in Table 2.2. Specifically, in 2012, there were 50,178 undergraduates enrolled at Nebraska public colleges, and an estimated 15,168 enrolled in private colleges in Nebraska according to College Navigator data maintained by the National Center for Education Statistics. This suggests a combined undergraduate enrollment of 65,346.
3 This estimate assumes that individuals who fail to complete a college or community college degree at a Lincoln
area institution will return to the community where they completed high school. Similarly, Lincoln high school graduates who attend post-secondary education in another city would return to Lincoln.
7
Table 2.1: Annual Net Openings and School Leavers by Occupation Group
Annual School Leavers
Occupation
Annual Net
Openings
College or Community
College Graduates Others Total
Leavers
Management 280 433 0 433
Business and Financial Operations 412 998 0 998
Computer and Mathematical 220 284 0 284
Architecture and Engineering 89 738 0 738
Life, Physical and Social Sciences 84 1,017 0 1,017
Community and Social Service 191 147 0 147
Legal 36 133 0 133
Education, Training and Library 359 1,061 0 1,061
Arts, Design, Entertainment, Sports, and Media 134 919 0 919
Healthcare Practitioners and Technical Workers 407 495 0 495
Healthcare Support 182 265 77 343
Protective Services 104 73 44 117
Food Preparation and Serving Related 761 37 322 359
Building and Grounds Cleaning and Maintenance 161 32 68 100
Personal Care and Services 225 22 95 117
Sales and Related 653 0 276 276
Office and Administrative Support 975 289 412 702
Farming, Fishing, and Forestry 46 207 19 227
Construction and Extraction 267 20 113 133
Installation, Maintenance and Repair 253 165 107 272
Production 353 105 149 255
Transportation and Material Movers 507 48 214 262
Sources: Nebraska Depart of Labor for job openings and IPEDS, U.S. Department of Education for graduates, and BBR calculations Notes: 1) Others includes high school dropouts, high school graduates (GED completers) or college or community college non-completers. 2) college or community college graduates and others may not sum to total leavers due to rounding Combined undergraduate enrollment of 65,346 compares with an average of 22,350 high school graduates in the state each year, yielding a ratio of enrolled undergraduates to graduates of approximately 2.9/1. By contrast, the Lincoln area has 25,829 enrolled undergraduates at the UNL and private colleges and universities. Further, there is an estimated 3,300 high school graduates in the Lincoln area (Lancaster and Seward counties), for a ratio of 8.0/1.4 College participation in the Lincoln area is therefore 272.8% of participation in the state as a whole.
4 This number was estimated by adjusting the statewide high school graduates by the share of Nebraska’s 16-year olds living in Lancaster and Seward counties (14.4%), according to the U.S. Bureau of Census; 16-year olds were used since some 17- or 18-year olds attending colleges located in Lincoln may have been listed as Lancaster County residents
8
Table 2.2: Annual Net Openings and Entrants by Occupation Group, Excluding Migrants
Annual Entrants
Occupation
Annual Net
Openings
College or Community
College Graduates Others Total
Entrants
Management 280 177 0 177
Business and Financial Operations 412 407 0 407
Computer and Mathematical 220 148 0 148
Architecture and Engineering 89 357 0 357
Life, Physical and Social Sciences 84 414 0 414
Community and Social Service 191 95 0 95
Legal 36 54 0 54
Education, Training and Library 359 432 0 432
Arts, Design, Entertainment, Sports, and Media 134 384 0 384
Healthcare Practitioners and Technical Workers 407 237 0 237
Healthcare Support 182 227 77 304
Protective Services 104 59 44 103
Food Preparation and Serving Related 761 37 322 359
Building and Grounds Cleaning and Maintenance 161 13 68 81
Personal Care and Services 225 22 95 117
Sales and Related 653 0 276 276
Office and Administrative Support 975 289 412 702
Farming, Fishing, and Forestry 46 84 19 104
Construction and Extraction 267 18 113 131
Installation, Maintenance and Repair 253 165 107 272
Production 353 89 149 239
Transportation and Material Movers 507 48 214 262
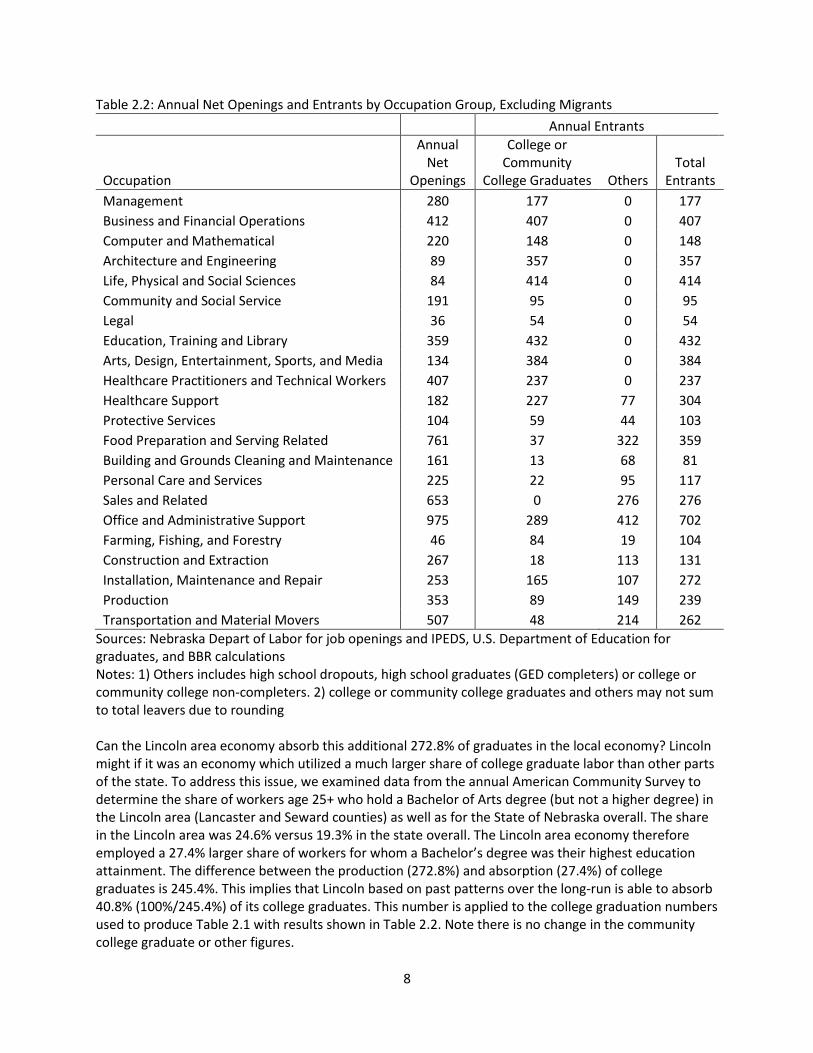
Sources: Nebraska Depart of Labor for job openings and IPEDS, U.S. Department of Education for graduates, and BBR calculations Notes: 1) Others includes high school dropouts, high school graduates (GED completers) or college or community college non-completers. 2) college or community college graduates and others may not sum to total leavers due to rounding Can the Lincoln area economy absorb this additional 272.8% of graduates in the local economy? Lincoln might if it was an economy which utilized a much larger share of college graduate labor than other parts of the state. To address this issue, we examined data from the annual American Community Survey to determine the share of workers age 25+ who hold a Bachelor of Arts degree (but not a higher degree) in the Lincoln area (Lancaster and Seward counties) as well as for the State of Nebraska overall. The share in the Lincoln area was 24.6% versus 19.3% in the state overall. The Lincoln area economy therefore employed a 27.4% larger share of workers for whom a Bachelor’s degree was their highest education attainment. The difference between the production (272.8%) and absorption (27.4%) of college graduates is 245.4%. This implies that Lincoln based on past patterns over the long-run is able to absorb 40.8% (100%/245.4%) of its college graduates. This number is applied to the college graduation numbers used to produce Table 2.1 with results shown in Table 2.2. Note there is no change in the community college graduate or other figures.
9
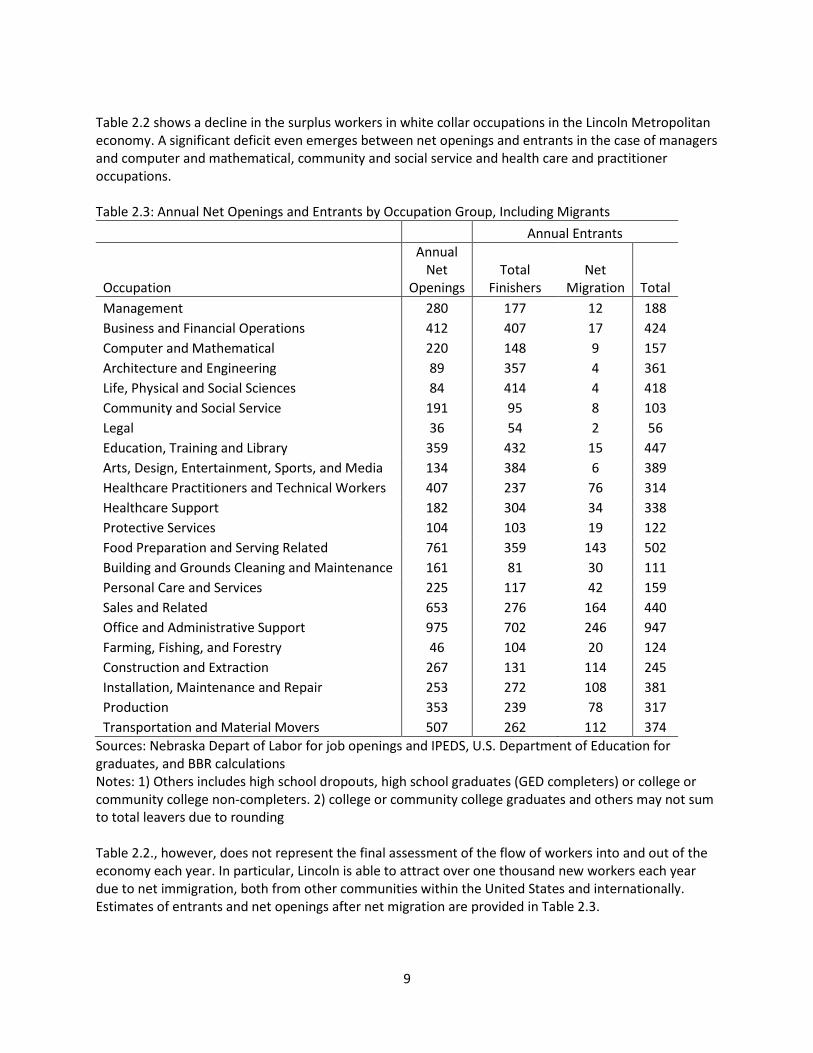
Table 2.2 shows a decline in the surplus workers in white collar occupations in the Lincoln Metropolitan economy. A significant deficit even emerges between net openings and entrants in the case of managers and computer and mathematical, community and social service and health care and practitioner occupations. Table 2.3: Annual Net Openings and Entrants by Occupation Group, Including Migrants
Annual Entrants
Occupation
Annual Net
Openings Total
Finishers Net
Migration Total
Management 280 177 12 188
Business and Financial Operations 412 407 17 424
Computer and Mathematical 220 148 9 157
Architecture and Engineering 89 357 4 361
Life, Physical and Social Sciences 84 414 4 418
Community and Social Service 191 95 8 103
Legal 36 54 2 56
Education, Training and Library 359 432 15 447
Arts, Design, Entertainment, Sports, and Media 134 384 6 389
Healthcare Practitioners and Technical Workers 407 237 76 314
Healthcare Support 182 304 34 338
Protective Services 104 103 19 122
Food Preparation and Serving Related 761 359 143 502
Building and Grounds Cleaning and Maintenance 161 81 30 111
Personal Care and Services 225 117 42 159
Sales and Related 653 276 164 440
Office and Administrative Support 975 702 246 947
Farming, Fishing, and Forestry 46 104 20 124
Construction and Extraction 267 131 114 245
Installation, Maintenance and Repair 253 272 108 381
Production 353 239 78 317
Transportation and Material Movers 507 262 112 374
Sources: Nebraska Depart of Labor for job openings and IPEDS, U.S. Department of Education for graduates, and BBR calculations Notes: 1) Others includes high school dropouts, high school graduates (GED completers) or college or community college non-completers. 2) college or community college graduates and others may not sum to total leavers due to rounding Table 2.2., however, does not represent the final assessment of the flow of workers into and out of the economy each year. In particular, Lincoln is able to attract over one thousand new workers each year due to net immigration, both from other communities within the United States and internationally. Estimates of entrants and net openings after net migration are provided in Table 2.3.
10
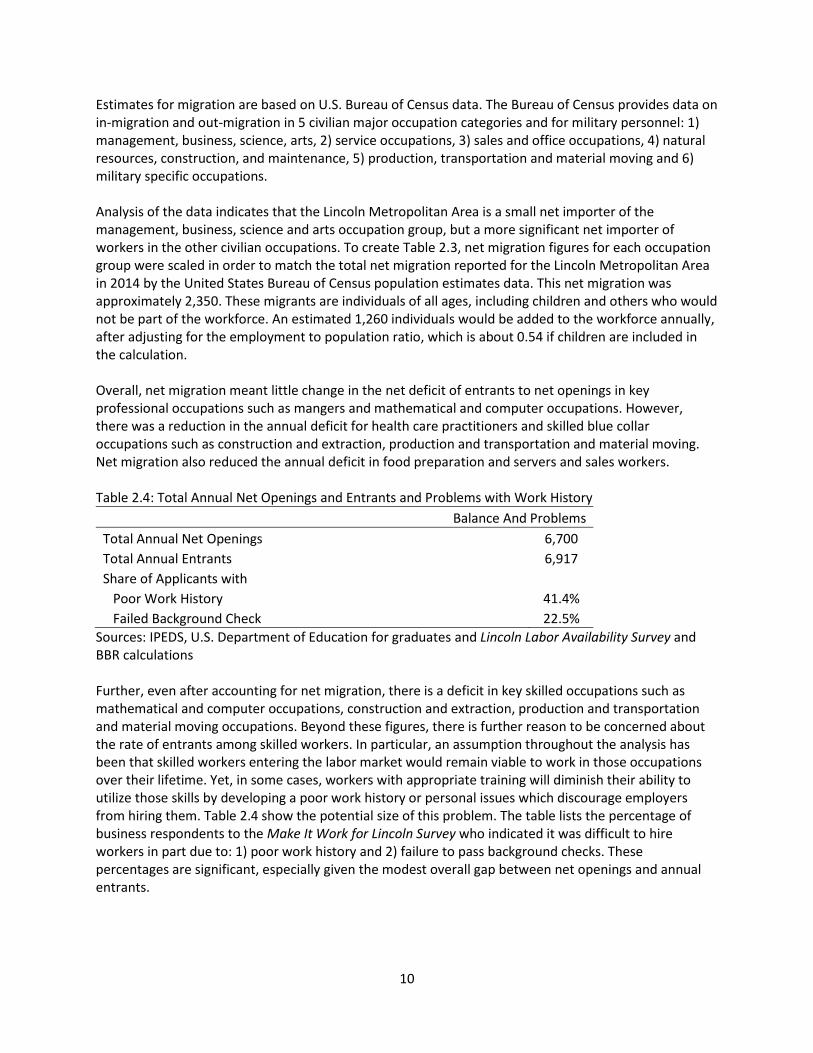
Estimates for migration are based on U.S. Bureau of Census data. The Bureau of Census provides data on in-migration and out-migration in 5 civilian major occupation categories and for military personnel: 1) management, business, science, arts, 2) service occupations, 3) sales and office occupations, 4) natural resources, construction, and maintenance, 5) production, transportation and material moving and 6) military specific occupations. Analysis of the data indicates that the Lincoln Metropolitan Area is a small net importer of the management, business, science and arts occupation group, but a more significant net importer of workers in the other civilian occupations. To create Table 2.3, net migration figures for each occupation group were scaled in order to match the total net migration reported for the Lincoln Metropolitan Area in 2014 by the United States Bureau of Census population estimates data. This net migration was approximately 2,350. These migrants are individuals of all ages, including children and others who would not be part of the workforce. An estimated 1,260 individuals would be added to the workforce annually, after adjusting for the employment to population ratio, which is about 0.54 if children are included in the calculation. Overall, net migration meant little change in the net deficit of entrants to net openings in key professional occupations such as mangers and mathematical and computer occupations. However, there was a reduction in the annual deficit for health care practitioners and skilled blue collar occupations such as construction and extraction, production and transportation and material moving. Net migration also reduced the annual deficit in food preparation and servers and sales workers. Table 2.4: Total Annual Net Openings and Entrants and Problems with Work History
Balance And Problems
Total Annual Net Openings 6,700
Total Annual Entrants 6,917
Share of Applicants with
Poor Work History 41.4%
Failed Background Check 22.5%
Sources: IPEDS, U.S. Department of Education for graduates and Lincoln Labor Availability Survey and BBR calculations Further, even after accounting for net migration, there is a deficit in key skilled occupations such as mathematical and computer occupations, construction and extraction, production and transportation and material moving occupations. Beyond these figures, there is further reason to be concerned about the rate of entrants among skilled workers. In particular, an assumption throughout the analysis has been that skilled workers entering the labor market would remain viable to work in those occupations over their lifetime. Yet, in some cases, workers with appropriate training will diminish their ability to utilize those skills by developing a poor work history or personal issues which discourage employers from hiring them. Table 2.4 show the potential size of this problem. The table lists the percentage of business respondents to the Make It Work for Lincoln Survey who indicated it was difficult to hire workers in part due to: 1) poor work history and 2) failure to pass background checks. These percentages are significant, especially given the modest overall gap between net openings and annual entrants.
11
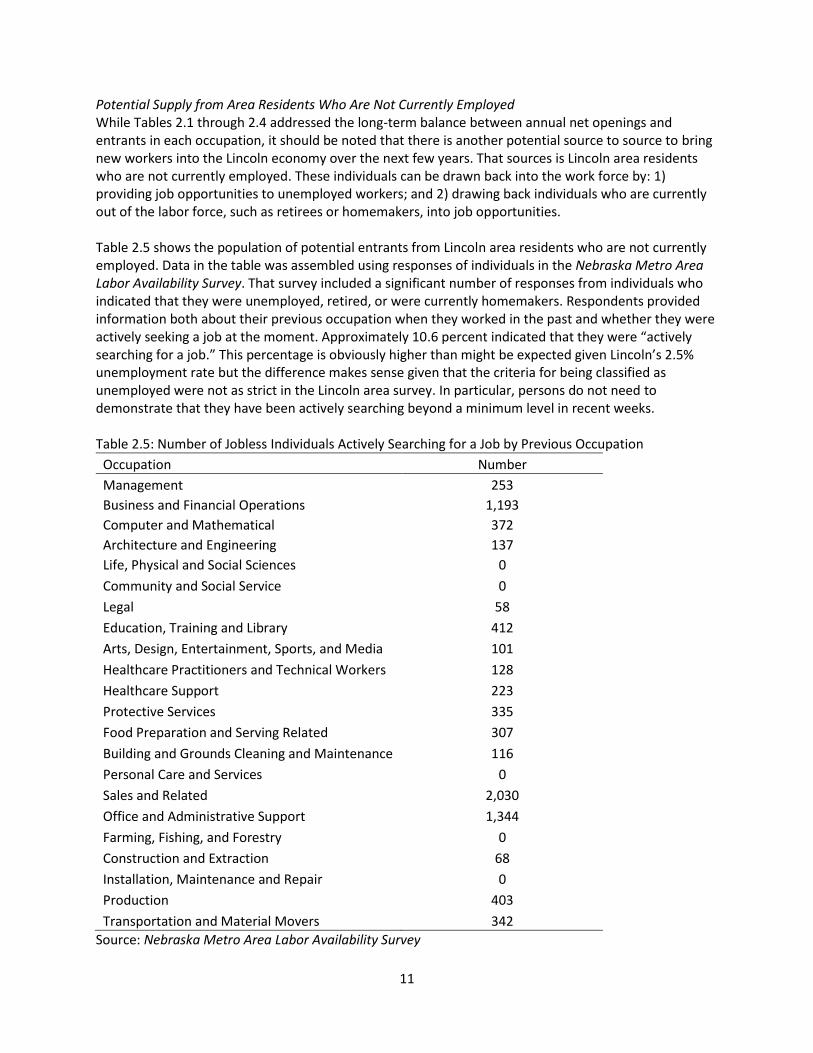
Potential Supply from Area Residents Who Are Not Currently Employed While Tables 2.1 through 2.4 addressed the long-term balance between annual net openings and entrants in each occupation, it should be noted that there is another potential source to source to bring new workers into the Lincoln economy over the next few years. That sources is Lincoln area residents who are not currently employed. These individuals can be drawn back into the work force by: 1) providing job opportunities to unemployed workers; and 2) drawing back individuals who are currently out of the labor force, such as retirees or homemakers, into job opportunities. Table 2.5 shows the population of potential entrants from Lincoln area residents who are not currently employed. Data in the table was assembled using responses of individuals in the Nebraska Metro Area Labor Availability Survey. That survey included a significant number of responses from individuals who indicated that they were unemployed, retired, or were currently homemakers. Respondents provided information both about their previous occupation when they worked in the past and whether they were actively seeking a job at the moment. Approximately 10.6 percent indicated that they were “actively searching for a job.” This percentage is obviously higher than might be expected given Lincoln’s 2.5% unemployment rate but the difference makes sense given that the criteria for being classified as unemployed were not as strict in the Lincoln area survey. In particular, persons do not need to demonstrate that they have been actively searching beyond a minimum level in recent weeks. Table 2.5: Number of Jobless Individuals Actively Searching for a Job by Previous Occupation
Occupation Number
Management 253
Business and Financial Operations 1,193
Computer and Mathematical 372
Architecture and Engineering 137
Life, Physical and Social Sciences 0
Community and Social Service 0
Legal 58
Education, Training and Library 412
Arts, Design, Entertainment, Sports, and Media 101
Healthcare Practitioners and Technical Workers 128
Healthcare Support 223
Protective Services 335
Food Preparation and Serving Related 307
Building and Grounds Cleaning and Maintenance 116
Personal Care and Services 0
Sales and Related 2,030
Office and Administrative Support 1,344
Farming, Fishing, and Forestry 0
Construction and Extraction 68
Installation, Maintenance and Repair 0
Production 403
Transportation and Material Movers 342
Source: Nebraska Metro Area Labor Availability Survey
12
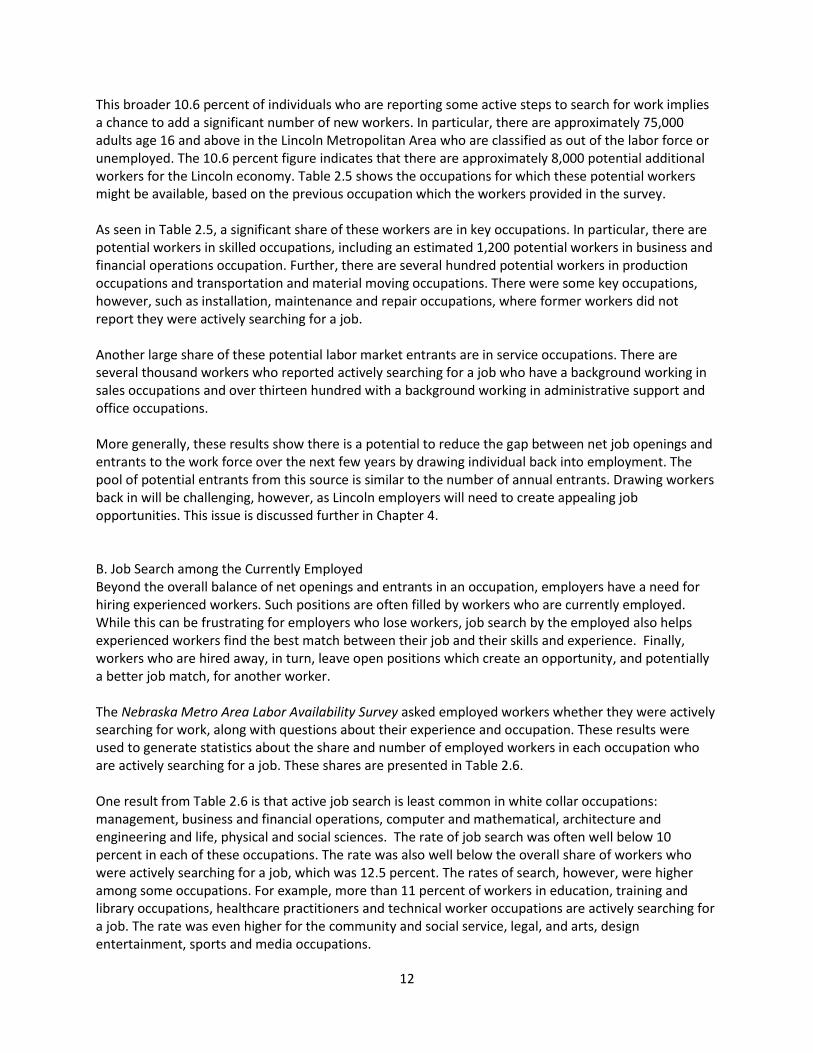
This broader 10.6 percent of individuals who are reporting some active steps to search for work implies a chance to add a significant number of new workers. In particular, there are approximately 75,000 adults age 16 and above in the Lincoln Metropolitan Area who are classified as out of the labor force or unemployed. The 10.6 percent figure indicates that there are approximately 8,000 potential additional workers for the Lincoln economy. Table 2.5 shows the occupations for which these potential workers might be available, based on the previous occupation which the workers provided in the survey. As seen in Table 2.5, a significant share of these workers are in key occupations. In particular, there are potential workers in skilled occupations, including an estimated 1,200 potential workers in business and financial operations occupation. Further, there are several hundred potential workers in production occupations and transportation and material moving occupations. There were some key occupations, however, such as installation, maintenance and repair occupations, where former workers did not report they were actively searching for a job. Another large share of these potential labor market entrants are in service occupations. There are several thousand workers who reported actively searching for a job who have a background working in sales occupations and over thirteen hundred with a background working in administrative support and office occupations. More generally, these results show there is a potential to reduce the gap between net job openings and entrants to the work force over the next few years by drawing individual back into employment. The pool of potential entrants from this source is similar to the number of annual entrants. Drawing workers back in will be challenging, however, as Lincoln employers will need to create appealing job opportunities. This issue is discussed further in Chapter 4. B. Job Search among the Currently Employed Beyond the overall balance of net openings and entrants in an occupation, employers have a need for hiring experienced workers. Such positions are often filled by workers who are currently employed. While this can be frustrating for employers who lose workers, job search by the employed also helps experienced workers find the best match between their job and their skills and experience. Finally, workers who are hired away, in turn, leave open positions which create an opportunity, and potentially a better job match, for another worker. The Nebraska Metro Area Labor Availability Survey asked employed workers whether they were actively searching for work, along with questions about their experience and occupation. These results were used to generate statistics about the share and number of employed workers in each occupation who are actively searching for a job. These shares are presented in Table 2.6. One result from Table 2.6 is that active job search is least common in white collar occupations: management, business and financial operations, computer and mathematical, architecture and engineering and life, physical and social sciences. The rate of job search was often well below 10 percent in each of these occupations. The rate was also well below the overall share of workers who were actively searching for a job, which was 12.5 percent. The rates of search, however, were higher among some occupations. For example, more than 11 percent of workers in education, training and library occupations, healthcare practitioners and technical worker occupations are actively searching for a job. The rate was even higher for the community and social service, legal, and arts, design entertainment, sports and media occupations.
13
Rates of active search for a job are as high as or even higher than above in many service and blue collar occupations. Nearly 11 percent of health care support workers are actively searching for a job, which implies that nearly 500 workers are searching at one time. There was a much higher rate of search among most other service occupations. For example, 27.4 percent of food preparation and serving related workers were actively searching for work. This is over 4,000 workers at any time. There were nearly 1,200 personal care and service workers searching for work, for a 21.3 percent rate. A somewhat smaller share of sales and related (18.7%) and office and administrative support (17.7%) workers were actively searching for a job. These rates from the survey yielded an estimate of over 3,200 sales and related workers actively searching for work at a time and nearly 5,700 office and administrative source workers. Table 2.6: Percent and Number of Employed Individuals Who Report Actively Searching for a Job By Occupation
Occupation
% Actively Searching For A
Job
# Actively Searching For A
Job
Management 5.9% 523
Business and Financial Operations 5.9% 691
Computer and Mathematical 9.0% 545
Architecture and Engineering 4.6% 125
Life, Physical and Social Sciences 5.0% 99
Community and Social Service 15.7% 763
Legal 19.0% 263
Education, Training and Library 11.2% 1,355
Arts, Design, Entertainment, Sports, and Media 15.7% 646
Healthcare Practitioners and Technical Workers 11.8% 1,277
Healthcare Support 10.9% 486
Protective Services 31.6% 939
Food Preparation and Serving Related 27.4% 4,034
Building and Grounds Cleaning and Maintenance 5.0% 282
Personal Care and Services 21.3% 1,171
Sales and Related 18.7% 3,245
Office and Administrative Support 17.7% 5,692
Farming, Fishing, and Forestry 0.0% 0
Construction and Extraction 6.0% 481
Installation, Maintenance and Repair 7.8% 557
Production 15.6% 1,803
Transportation and Material Movers 35.2% 5,193
Source: Nebraska Metro Area Labor Availability Survey Among blue collar occupations, the rate of active job search is lower for construction and extraction (6.0%) and installation, maintenance and repair occupations (7.8%). However, even at these rates of search there are approximately 500 workers searching for work in each occupational group at any
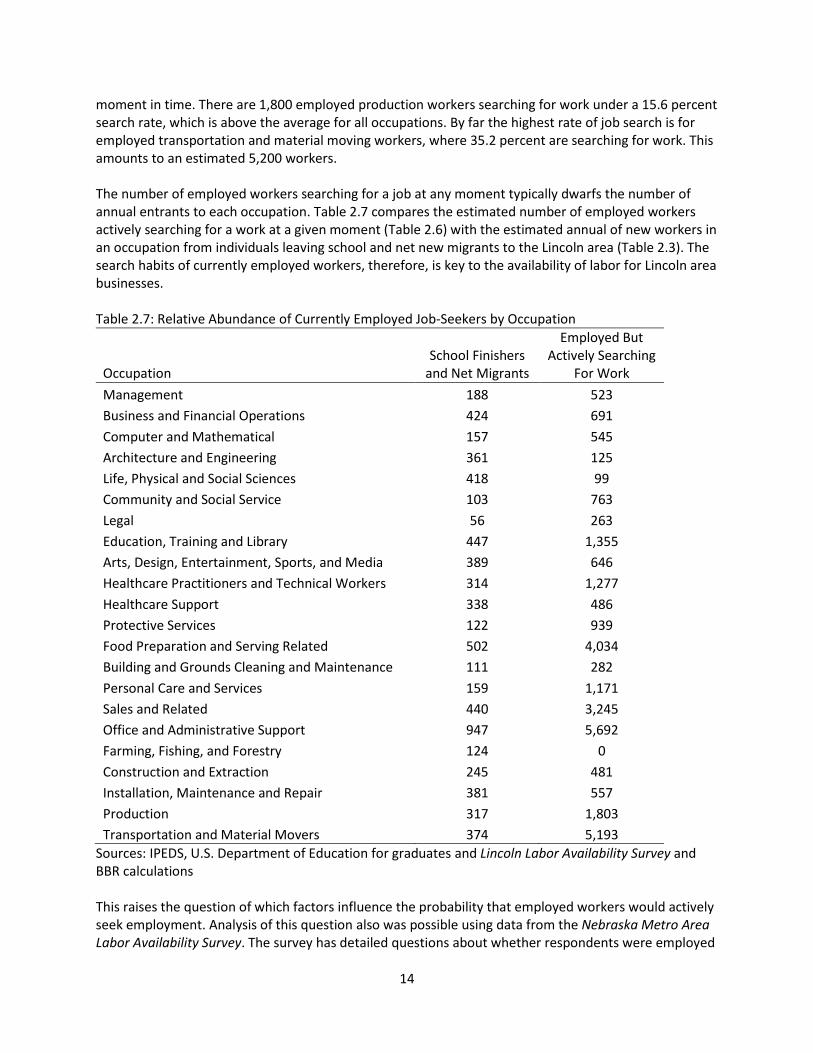
14
moment in time. There are 1,800 employed production workers searching for work under a 15.6 percent search rate, which is above the average for all occupations. By far the highest rate of job search is for employed transportation and material moving workers, where 35.2 percent are searching for work. This amounts to an estimated 5,200 workers. The number of employed workers searching for a job at any moment typically dwarfs the number of annual entrants to each occupation. Table 2.7 compares the estimated number of employed workers actively searching for a work at a given moment (Table 2.6) with the estimated annual of new workers in an occupation from individuals leaving school and net new migrants to the Lincoln area (Table 2.3). The search habits of currently employed workers, therefore, is key to the availability of labor for Lincoln area businesses. Table 2.7: Relative Abundance of Currently Employed Job-Seekers by Occupation
Occupation School Finishers
and Net Migrants
Employed But Actively Searching
For Work
Management 188 523
Business and Financial Operations 424 691
Computer and Mathematical 157 545
Architecture and Engineering 361 125
Life, Physical and Social Sciences 418 99
Community and Social Service 103 763
Legal 56 263
Education, Training and Library 447 1,355
Arts, Design, Entertainment, Sports, and Media 389 646
Healthcare Practitioners and Technical Workers 314 1,277
Healthcare Support 338 486
Protective Services 122 939
Food Preparation and Serving Related 502 4,034
Building and Grounds Cleaning and Maintenance 111 282
Personal Care and Services 159 1,171
Sales and Related 440 3,245
Office and Administrative Support 947 5,692
Farming, Fishing, and Forestry 124 0
Construction and Extraction 245 481
Installation, Maintenance and Repair 381 557
Production 317 1,803
Transportation and Material Movers 374 5,193
Sources: IPEDS, U.S. Department of Education for graduates and Lincoln Labor Availability Survey and BBR calculations This raises the question of which factors influence the probability that employed workers would actively seek employment. Analysis of this question also was possible using data from the Nebraska Metro Area Labor Availability Survey. The survey has detailed questions about whether respondents were employed
15
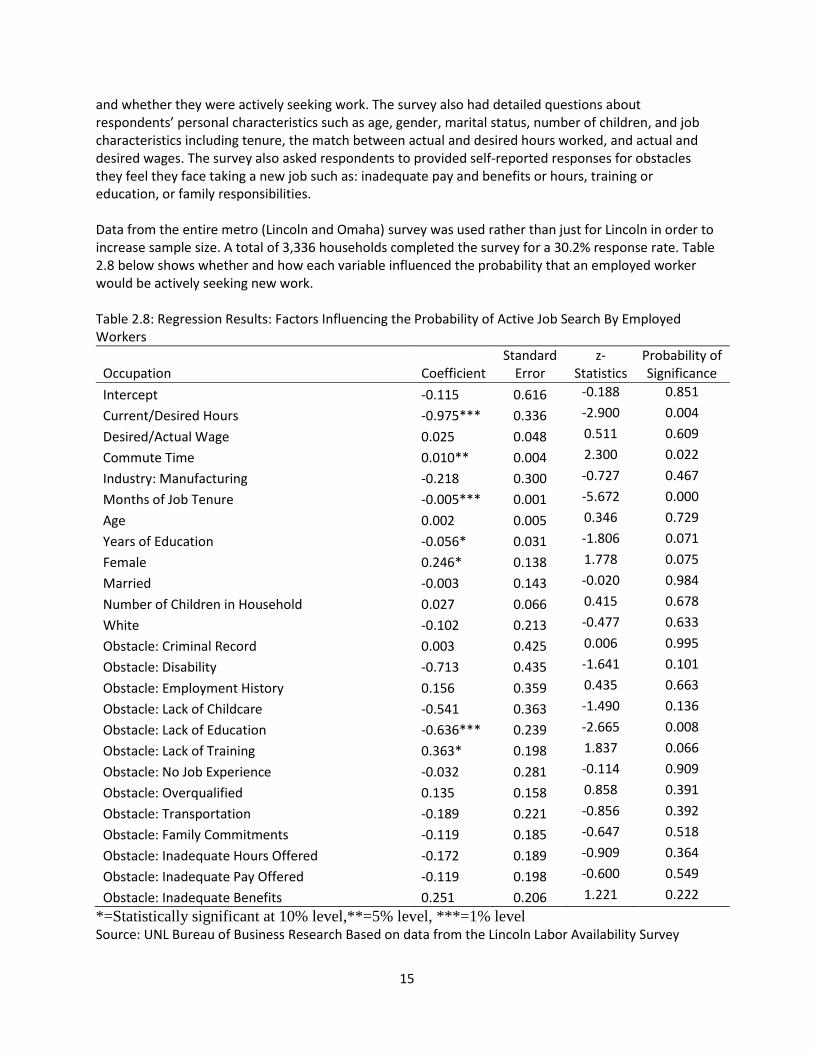
and whether they were actively seeking work. The survey also had detailed questions about respondents’ personal characteristics such as age, gender, marital status, number of children, and job characteristics including tenure, the match between actual and desired hours worked, and actual and desired wages. The survey also asked respondents to provided self-reported responses for obstacles they feel they face taking a new job such as: inadequate pay and benefits or hours, training or education, or family responsibilities. Data from the entire metro (Lincoln and Omaha) survey was used rather than just for Lincoln in order to increase sample size. A total of 3,336 households completed the survey for a 30.2% response rate. Table 2.8 below shows whether and how each variable influenced the probability that an employed worker would be actively seeking new work.
Table 2.8: Regression Results: Factors Influencing the Probability of Active Job Search By Employed Workers
Occupation Coefficient Standard
Error z-
Statistics Probability of Significance
Intercept -0.115 0.616 -0.188 0.851
Current/Desired Hours -0.975*** 0.336 -2.900 0.004
Desired/Actual Wage 0.025 0.048 0.511 0.609
Commute Time 0.010** 0.004 2.300 0.022
Industry: Manufacturing -0.218 0.300 -0.727 0.467
Months of Job Tenure -0.005*** 0.001 -5.672 0.000
Age 0.002 0.005 0.346 0.729
Years of Education -0.056* 0.031 -1.806 0.071
Female 0.246* 0.138 1.778 0.075
Married -0.003 0.143 -0.020 0.984
Number of Children in Household 0.027 0.066 0.415 0.678
White -0.102 0.213 -0.477 0.633
Obstacle: Criminal Record 0.003 0.425 0.006 0.995
Obstacle: Disability -0.713 0.435 -1.641 0.101
Obstacle: Employment History 0.156 0.359 0.435 0.663
Obstacle: Lack of Childcare -0.541 0.363 -1.490 0.136
Obstacle: Lack of Education -0.636*** 0.239 -2.665 0.008
Obstacle: Lack of Training 0.363* 0.198 1.837 0.066
Obstacle: No Job Experience -0.032 0.281 -0.114 0.909
Obstacle: Overqualified 0.135 0.158 0.858 0.391
Obstacle: Transportation -0.189 0.221 -0.856 0.392
Obstacle: Family Commitments -0.119 0.185 -0.647 0.518
Obstacle: Inadequate Hours Offered -0.172 0.189 -0.909 0.364
Obstacle: Inadequate Pay Offered -0.119 0.198 -0.600 0.549
Obstacle: Inadequate Benefits 0.251 0.206 1.221 0.222
*=Statistically significant at 10% level,**=5% level, ***=1% level Source: UNL Bureau of Business Research Based on data from the Lincoln Labor Availability Survey
16
There are several phenomena of note from the results. First, the (Current Hours/Desired Hours) category shows how far the employee’s desired hours per week were from their actual hours worked. This had a strong relationship, indicating that workers whose desired hours were close to current hours were less likely to actively search for work. However, there was no correlation between the desired wages/actual wages variable and the probability of active job search.
Commute time also showed a strong correlation with the probability of search. Workers with a longer commute time were more likely to actively search for a new job.
Months of Job Tenure was negatively correlated with job searches, indicating that employees who had been in a position for several years showed less intent to search for a new job.
People who cited a lack of education as an obstacle to new employment were less likely to be searching for work when they were already employed. Interestingly, years of education was also negatively correlated with job search. These two facts could indicate that more education leads to less desire to switch jobs, while having less education leads to being unable to find a new job. Other variables that showed relationships of note were: being female increased the probability of job search, citing a Disability as an Obstacle decreased the probability of job search, and citing a Lack of Childcare decreased the probability as well. It is uncertain what the overall probability of job search is for females who cite a Lack of Childcare. Overall, results showed that a lack of education, lack of childcare, or a disability were obstacles which decreased the probability of job search. Results also showed that job search was used as a way to find employment with a better match in terms of commute time and available hours of work. A gap between desired and actual wages, however, was not found to influence the probability of job search.
17
3. Barriers to Employment and the Local Labor Market The preceding chapter found that there are a significant group of currently employed workers with the potential to seek a new job, or who are actively looking for new work. In many occupations, there are also workers who are not currently working who expressed potential to seek work, or who are actively looking for new work. These potential workers represent an important potential skill resource for employers in the Lincoln area. Two questions about these workers come to mind. First, what challenges or barriers do these potential workers foresee in seeking new employment? Second, do these challenges appear to represent a skills gap? These two questions are discussed below. Research in the Lincoln Labor Availability Report showed the types of barriers which potential workers perceive in finding employment (among those not currently employed), or finding new employment (among those currently employed). The various criteria fall into categories including working conditions, suitability for employment, work schedule, and compensation. More than three in five potential job seekers (61.5%) cite a lack of job opportunities in the area. This result is perhaps surprising given that job growth has been solid in Lincoln in recent years. The result may instead be interpreted to mean that potential workers perceive a lack of appropriate job opportunities, that is, job opportunities which match their skills and their ambitions. This perspective is bolstered by the finding that nearly one in three potential workers (30.9%) reported facing a barrier to finding new employment because they felt overqualified for positions. Potential seekers also perceive that their own background may limit their potential to find employment or new employment. Nearly one in three (30.5%) cite a lack of training while 28.2 percent cite a lack of education. No job experience is cited by 14.1 percent of workers, a factor which is likely to be critical for new or recent graduates who are entering the (full-time) labor force. Besides skill, workers also are concerned about elements of their work history or personal history which create a perceived barrier. Poor credit history is noted by 13.3 percent of workers. Credit history is sometimes used as a screen by potential employers. A criminal record is cited as a barrier by 7.6 percent of workers. However, the most common obstacles perceived by potential job seekers relate to compensation and work hours available from local employers. Nearly two in three potential workers (64.4%) cite “inadequate pay offered by local employers” as an obstacle to potential job seekers. Inadequate benefits are cited by 55.5% of potential job seekers. Inadequate hours are cited by 46.2 percent. Results also showed that family considerations create a barrier for some workers with a lack of childcare noted by 11.8 percent of potential workers and family commitments noted by 26.1 percent of potential workers. Currently employed workers may have found a position which can accommodate their family commitments, a feature which binds them to that position. For others, family commitments may keep them out of the workforce. Do these obstacles suggest the presence of a skills gap in the Lincoln area? Potentially so, if potential job seekers perceive they have inadequate education or training, or have a life history such as a criminal record which will dissuade employers from utilizing their skills, or if employers offer inadequate wages to attract potential job seekers into the new jobs where their skills are needed.
18
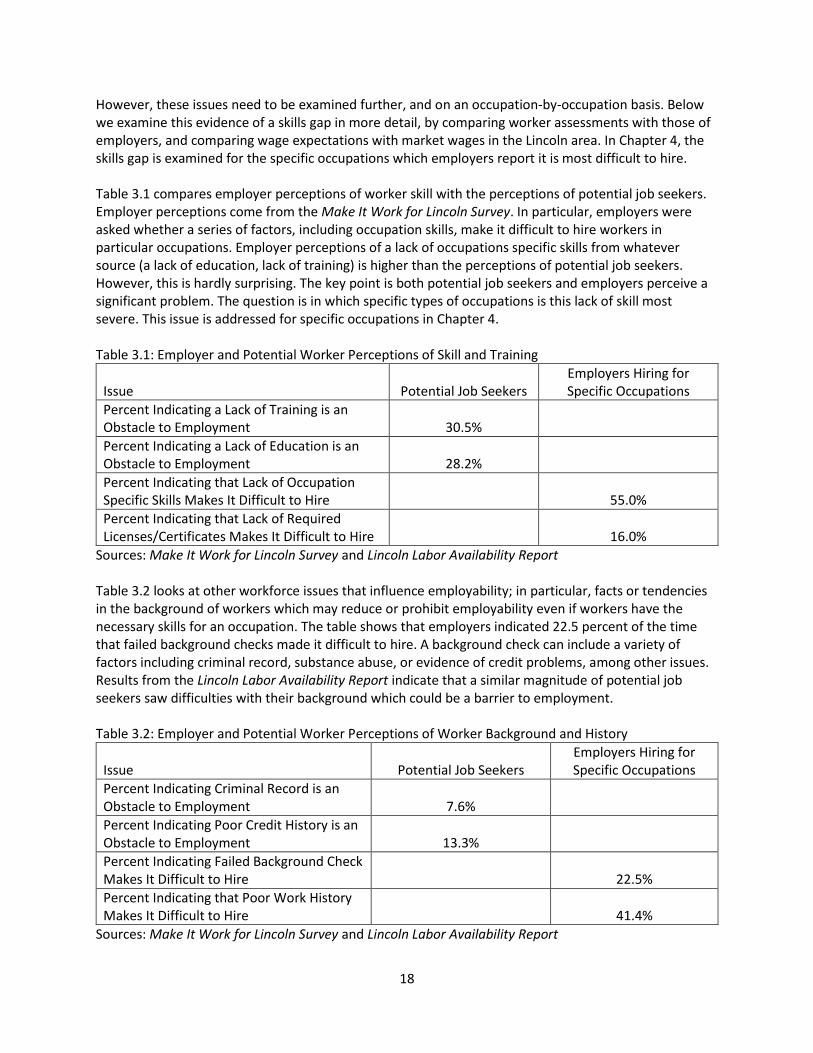
However, these issues need to be examined further, and on an occupation-by-occupation basis. Below we examine this evidence of a skills gap in more detail, by comparing worker assessments with those of employers, and comparing wage expectations with market wages in the Lincoln area. In Chapter 4, the skills gap is examined for the specific occupations which employers report it is most difficult to hire. Table 3.1 compares employer perceptions of worker skill with the perceptions of potential job seekers. Employer perceptions come from the Make It Work for Lincoln Survey. In particular, employers were asked whether a series of factors, including occupation skills, make it difficult to hire workers in particular occupations. Employer perceptions of a lack of occupations specific skills from whatever source (a lack of education, lack of training) is higher than the perceptions of potential job seekers. However, this is hardly surprising. The key point is both potential job seekers and employers perceive a significant problem. The question is in which specific types of occupations is this lack of skill most severe. This issue is addressed for specific occupations in Chapter 4. Table 3.1: Employer and Potential Worker Perceptions of Skill and Training
Issue
Potential Job Seekers
Employers Hiring for Specific Occupations
Percent Indicating a Lack of Training is an Obstacle to Employment
30.5%
Percent Indicating a Lack of Education is an Obstacle to Employment
28.2%
Percent Indicating that Lack of Occupation Specific Skills Makes It Difficult to Hire
55.0%
Percent Indicating that Lack of Required Licenses/Certificates Makes It Difficult to Hire
16.0%
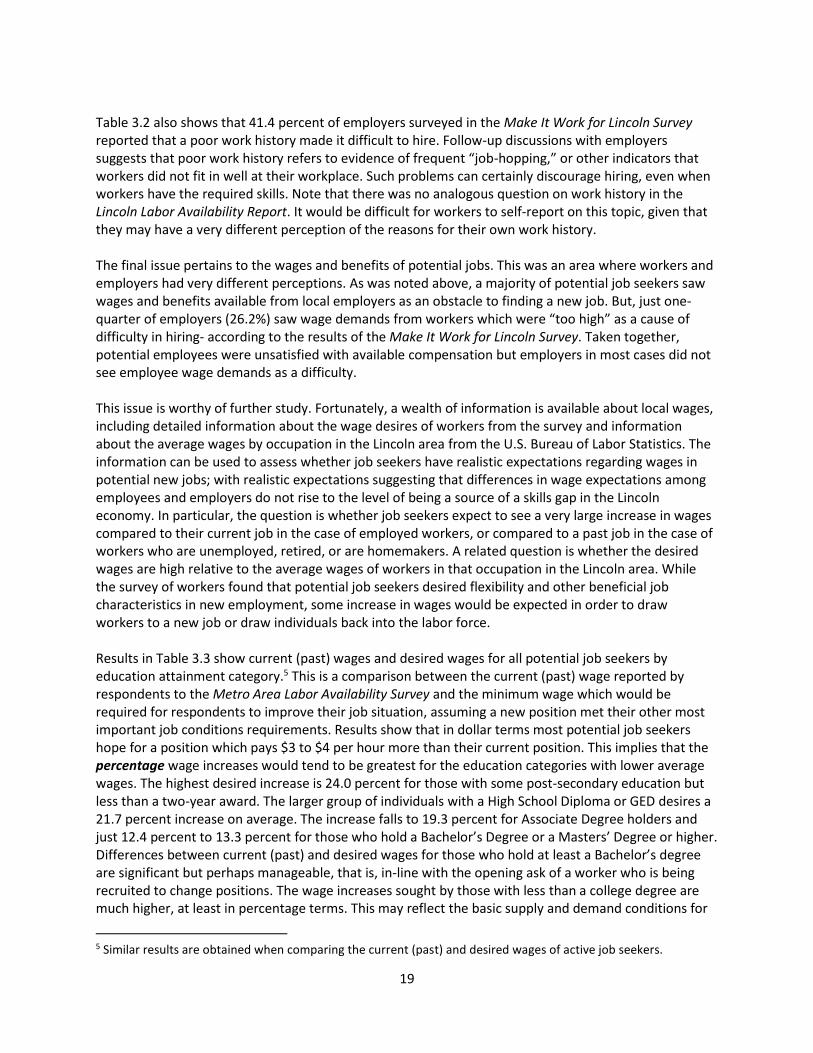
Sources: Make It Work for Lincoln Survey and Lincoln Labor Availability Report Table 3.2 looks at other workforce issues that influence employability; in particular, facts or tendencies in the background of workers which may reduce or prohibit employability even if workers have the necessary skills for an occupation. The table shows that employers indicated 22.5 percent of the time that failed background checks made it difficult to hire. A background check can include a variety of factors including criminal record, substance abuse, or evidence of credit problems, among other issues. Results from the Lincoln Labor Availability Report indicate that a similar magnitude of potential job seekers saw difficulties with their background which could be a barrier to employment. Table 3.2: Employer and Potential Worker Perceptions of Worker Background and History
Issue
Potential Job Seekers
Employers Hiring for Specific Occupations
Percent Indicating Criminal Record is an Obstacle to Employment
7.6%
Percent Indicating Poor Credit History is an Obstacle to Employment
13.3%
Percent Indicating Failed Background Check Makes It Difficult to Hire
22.5%
Percent Indicating that Poor Work History Makes It Difficult to Hire
41.4%
Sources: Make It Work for Lincoln Survey and Lincoln Labor Availability Report
19
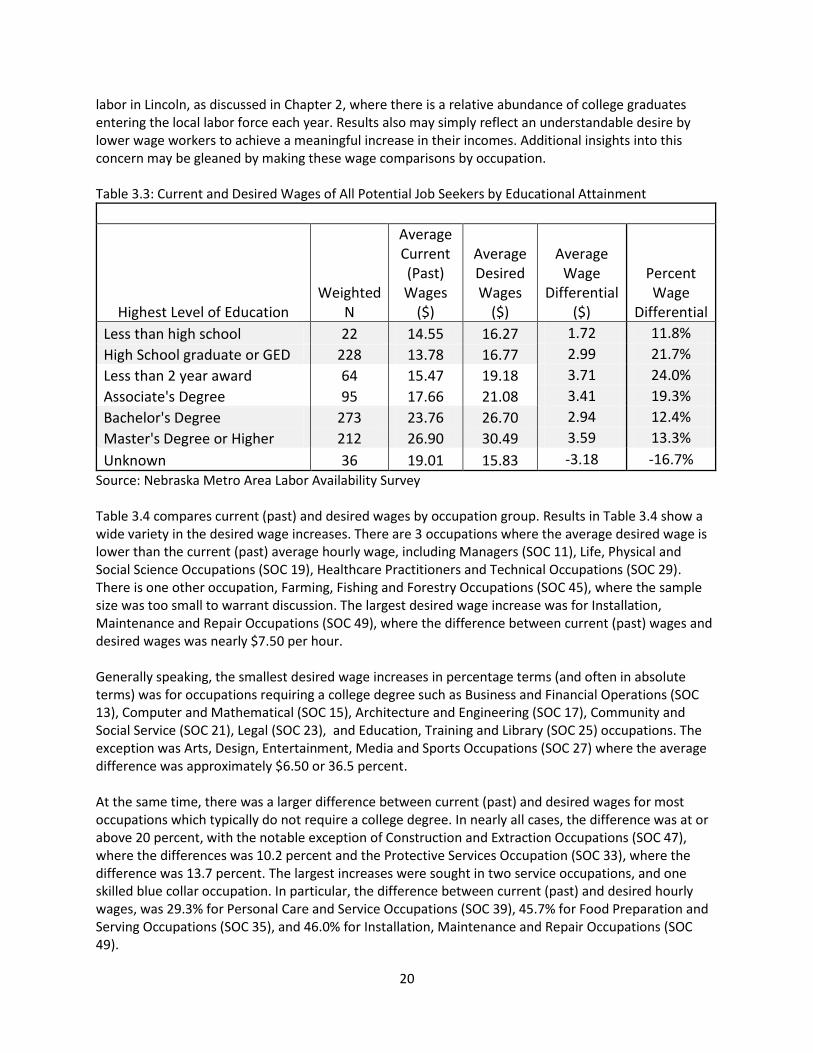
Table 3.2 also shows that 41.4 percent of employers surveyed in the Make It Work for Lincoln Survey reported that a poor work history made it difficult to hire. Follow-up discussions with employers suggests that poor work history refers to evidence of frequent “job-hopping,” or other indicators that workers did not fit in well at their workplace. Such problems can certainly discourage hiring, even when workers have the required skills. Note that there was no analogous question on work history in the Lincoln Labor Availability Report. It would be difficult for workers to self-report on this topic, given that they may have a very different perception of the reasons for their own work history. The final issue pertains to the wages and benefits of potential jobs. This was an area where workers and employers had very different perceptions. As was noted above, a majority of potential job seekers saw wages and benefits available from local employers as an obstacle to finding a new job. But, just one-quarter of employers (26.2%) saw wage demands from workers which were “too high” as a cause of difficulty in hiring- according to the results of the Make It Work for Lincoln Survey. Taken together, potential employees were unsatisfied with available compensation but employers in most cases did not see employee wage demands as a difficulty. This issue is worthy of further study. Fortunately, a wealth of information is available about local wages, including detailed information about the wage desires of workers from the survey and information about the average wages by occupation in the Lincoln area from the U.S. Bureau of Labor Statistics. The information can be used to assess whether job seekers have realistic expectations regarding wages in potential new jobs; with realistic expectations suggesting that differences in wage expectations among employees and employers do not rise to the level of being a source of a skills gap in the Lincoln economy. In particular, the question is whether job seekers expect to see a very large increase in wages compared to their current job in the case of employed workers, or compared to a past job in the case of workers who are unemployed, retired, or are homemakers. A related question is whether the desired wages are high relative to the average wages of workers in that occupation in the Lincoln area. While the survey of workers found that potential job seekers desired flexibility and other beneficial job characteristics in new employment, some increase in wages would be expected in order to draw workers to a new job or draw individuals back into the labor force. Results in Table 3.3 show current (past) wages and desired wages for all potential job seekers by education attainment category.5 This is a comparison between the current (past) wage reported by respondents to the Metro Area Labor Availability Survey and the minimum wage which would be required for respondents to improve their job situation, assuming a new position met their other most important job conditions requirements. Results show that in dollar terms most potential job seekers hope for a position which pays $3 to $4 per hour more than their current position. This implies that the percentage wage increases would tend to be greatest for the education categories with lower average wages. The highest desired increase is 24.0 percent for those with some post-secondary education but less than a two-year award. The larger group of individuals with a High School Diploma or GED desires a 21.7 percent increase on average. The increase falls to 19.3 percent for Associate Degree holders and just 12.4 percent to 13.3 percent for those who hold a Bachelor’s Degree or a Masters’ Degree or higher. Differences between current (past) and desired wages for those who hold at least a Bachelor’s degree are significant but perhaps manageable, that is, in-line with the opening ask of a worker who is being recruited to change positions. The wage increases sought by those with less than a college degree are much higher, at least in percentage terms. This may reflect the basic supply and demand conditions for
5 Similar results are obtained when comparing the current (past) and desired wages of active job seekers.
20
labor in Lincoln, as discussed in Chapter 2, where there is a relative abundance of college graduates entering the local labor force each year. Results also may simply reflect an understandable desire by lower wage workers to achieve a meaningful increase in their incomes. Additional insights into this concern may be gleaned by making these wage comparisons by occupation. Table 3.3: Current and Desired Wages of All Potential Job Seekers by Educational Attainment
Highest Level of Education Weighted
N
Average Current (Past) Wages
($)
Average Desired Wages
($)
Average Wage
Differential ($)
Percent Wage
Differential
Less than high school 22 14.55 16.27 1.72 11.8%
High School graduate or GED 228 13.78 16.77 2.99 21.7%
Less than 2 year award 64 15.47 19.18 3.71 24.0%
Associate's Degree 95 17.66 21.08 3.41 19.3%
Bachelor's Degree 273 23.76 26.70 2.94 12.4%
Master's Degree or Higher 212 26.90 30.49 3.59 13.3%
Unknown 36 19.01 15.83 -3.18 -16.7%
Source: Nebraska Metro Area Labor Availability Survey Table 3.4 compares current (past) and desired wages by occupation group. Results in Table 3.4 show a wide variety in the desired wage increases. There are 3 occupations where the average desired wage is lower than the current (past) average hourly wage, including Managers (SOC 11), Life, Physical and Social Science Occupations (SOC 19), Healthcare Practitioners and Technical Occupations (SOC 29). There is one other occupation, Farming, Fishing and Forestry Occupations (SOC 45), where the sample size was too small to warrant discussion. The largest desired wage increase was for Installation, Maintenance and Repair Occupations (SOC 49), where the difference between current (past) wages and desired wages was nearly $7.50 per hour. Generally speaking, the smallest desired wage increases in percentage terms (and often in absolute terms) was for occupations requiring a college degree such as Business and Financial Operations (SOC 13), Computer and Mathematical (SOC 15), Architecture and Engineering (SOC 17), Community and Social Service (SOC 21), Legal (SOC 23), and Education, Training and Library (SOC 25) occupations. The exception was Arts, Design, Entertainment, Media and Sports Occupations (SOC 27) where the average difference was approximately $6.50 or 36.5 percent. At the same time, there was a larger difference between current (past) and desired wages for most occupations which typically do not require a college degree. In nearly all cases, the difference was at or above 20 percent, with the notable exception of Construction and Extraction Occupations (SOC 47), where the differences was 10.2 percent and the Protective Services Occupation (SOC 33), where the difference was 13.7 percent. The largest increases were sought in two service occupations, and one skilled blue collar occupation. In particular, the difference between current (past) and desired hourly wages, was 29.3% for Personal Care and Service Occupations (SOC 39), 45.7% for Food Preparation and Serving Occupations (SOC 35), and 46.0% for Installation, Maintenance and Repair Occupations (SOC 49).

21
Table 3.4: Current and Desired Wages of All Potential Job Seekers by Occupation Group
SOC Job Code Weighted N
Average Current (Past) Wages
($)
Average Desired Wages
($)
Average Wage
Differential ($)
Percent Wage
Differential
11 – Management 52 41.51 41.19 -0.32 -0.8%
13 – Business & Financial 99 22.27 25.36 3.10 13.9%
15 – Computer and Math 38 29.38 33.09 3.71 12.6%
17 – Engineering 27 23.86 26.05 2.20 9.2%
19 – Science 18 19.37 19.36 -0.01 0.0%
21 – Social Service 18 15.48 17.23 1.75 11.3%
23 – Legal 15 30.36 32.60 2.24 7.4%
25 – Education 77 20.10 23.28 3.18 15.8%
27 – Arts and Design 18 17.85 24.36 6.52 36.5%
29 – Health Practitioners 58 34.68 32.38 -2.30 -6.6%
31 – Health Support 25 12.02 15.00 2.98 24.8%
33 – Protective 18 20.74 23.59 2.85 13.7%
35 – Food Preparation 34 9.42 13.71 4.30 45.7%
37 – Building & Grounds 12 12.72 13.27 0.55 4.3%
39 – Personal Care 23 12.79 16.55 3.75 29.3%
41 – Sales & Related 112 18.62 22.46 3.84 20.6%
43 – Office & Admin 138 15.17 18.92 3.75 24.7%
45 – Farming 2 10.29 7.98 -2.31 -22.4%
47 – Construction 20 24.40 26.90 2.50 10.2%
49 – Installation 35 16.30 23.80 7.49 46.0%
51 – Production 37 15.77 19.16 3.39 21.5%
53 – Transportation 38 14.80 17.73 2.93 19.8% Source: Nebraska Metro Area Labor Availability Survey Such large desired increases in select occupations suggest that wage expectations could be a source of mismatch in the labor market. Before reaching this interpretation, however, it is worthwhile to examine how desired wages compare with the actual wages found in various occupation groups within the Lincoln area labor market. The difference between the desired wages in each occupation group and the average hourly wage in that occupation in Lincoln, according to U.S. Bureau of Labor Statistics, can be observed in Table 3.5.
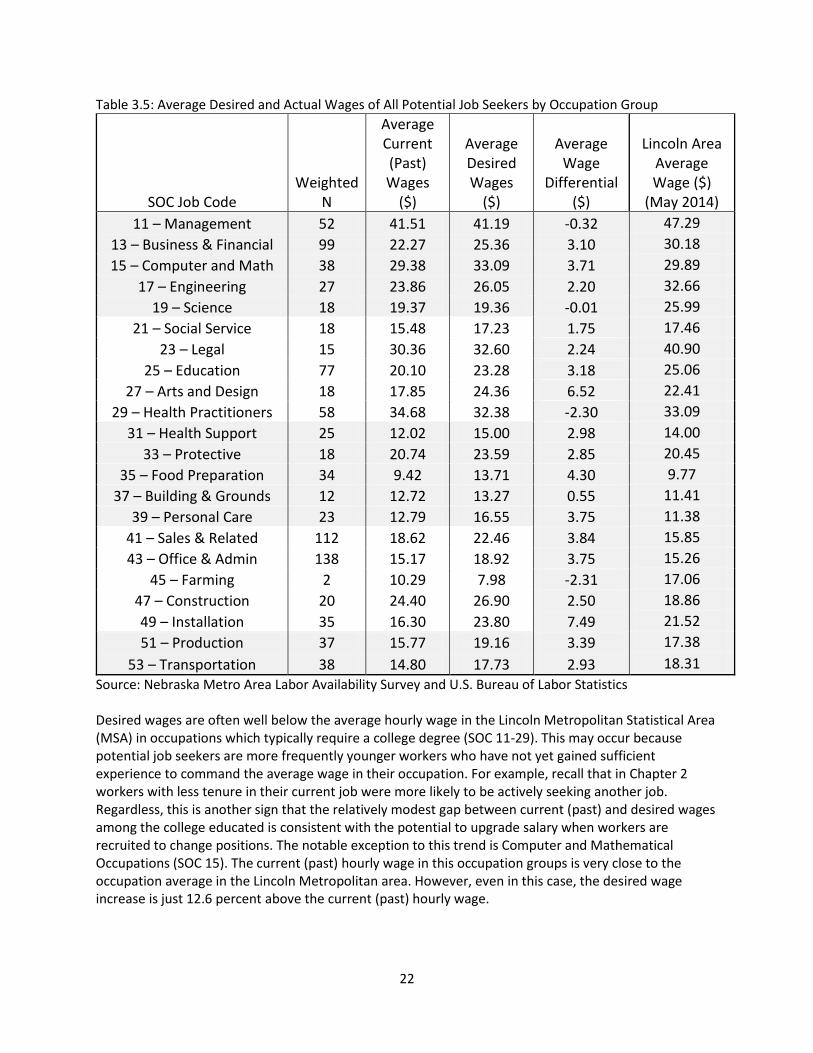
22
Table 3.5: Average Desired and Actual Wages of All Potential Job Seekers by Occupation Group
SOC Job Code Weighted
N
Average Current (Past) Wages
($)
Average Desired Wages
($)
Average Wage
Differential ($)
Lincoln Area Average Wage ($)
(May 2014)
11 – Management 52 41.51 41.19 -0.32 47.29
13 – Business & Financial 99 22.27 25.36 3.10 30.18
15 – Computer and Math 38 29.38 33.09 3.71 29.89
17 – Engineering 27 23.86 26.05 2.20 32.66
19 – Science 18 19.37 19.36 -0.01 25.99
21 – Social Service 18 15.48 17.23 1.75 17.46
23 – Legal 15 30.36 32.60 2.24 40.90
25 – Education 77 20.10 23.28 3.18 25.06
27 – Arts and Design 18 17.85 24.36 6.52 22.41
29 – Health Practitioners 58 34.68 32.38 -2.30 33.09
31 – Health Support 25 12.02 15.00 2.98 14.00
33 – Protective 18 20.74 23.59 2.85 20.45
35 – Food Preparation 34 9.42 13.71 4.30 9.77
37 – Building & Grounds 12 12.72 13.27 0.55 11.41
39 – Personal Care 23 12.79 16.55 3.75 11.38
41 – Sales & Related 112 18.62 22.46 3.84 15.85
43 – Office & Admin 138 15.17 18.92 3.75 15.26
45 – Farming 2 10.29 7.98 -2.31 17.06
47 – Construction 20 24.40 26.90 2.50 18.86
49 – Installation 35 16.30 23.80 7.49 21.52
51 – Production 37 15.77 19.16 3.39 17.38
53 – Transportation 38 14.80 17.73 2.93 18.31
Source: Nebraska Metro Area Labor Availability Survey and U.S. Bureau of Labor Statistics Desired wages are often well below the average hourly wage in the Lincoln Metropolitan Statistical Area (MSA) in occupations which typically require a college degree (SOC 11-29). This may occur because potential job seekers are more frequently younger workers who have not yet gained sufficient experience to command the average wage in their occupation. For example, recall that in Chapter 2 workers with less tenure in their current job were more likely to be actively seeking another job. Regardless, this is another sign that the relatively modest gap between current (past) and desired wages among the college educated is consistent with the potential to upgrade salary when workers are recruited to change positions. The notable exception to this trend is Computer and Mathematical Occupations (SOC 15). The current (past) hourly wage in this occupation groups is very close to the occupation average in the Lincoln Metropolitan area. However, even in this case, the desired wage increase is just 12.6 percent above the current (past) hourly wage.
23
Results indicate a consistent gap between the desired hourly wage and the actual wage in the Lincoln area for occupations which do not typically require a college degree (SOC 31-53). However, even for these occupations, there is not necessarily a large gap between desired and actual wages. For example, in one case, Transportation and Material Moving Occupations (SOC 53), desired wages remained below the average wage for the occupation. In another case, Building and Grounds Cleaning and Maintenance Occupations (SOC 37), the gap between current (past) wages and the desired wage is quite small. Another common occurrence is that potential job seekers were making well below the occupation average, and their desired wage increases, while sometimes quite large, still lead to desired wages which were only a few dollars per hour above the occupation average. This occurs in the case of Health Care Support (SOC 31), Installation, Maintenance and Repair (SOC 49), and Production (SOC 51) occupations. For two other occupation groups, current (past) wages are at or above the average wage in the Lincoln Metropolitan area, but desired wages are just a few dollars (10 to 14 percent) above current (past) wages. These are the Protective Service (SOC 33) and Construction and Extraction (SOC 47) Occupations. The remaining occupations are of note. For these service occupations, potential job seekers already are at or above their occupation’s average hourly wage, but seek significant wage increases, at least in percentage terms. These are the Food Preparation and Serving Related (SOC 35), Personal Care and Service (SOC 39), Sales and Related (SOC 41), and Office and Administrative Support (SOC 43) occupations. The gap between desired and actual wages in these occupations may make it especially difficult for employers to find needed workers.6 But, are employers having difficulty? In other words, are these the occupations where employers note that it is most difficult to find workers? This question is addressed in Table 3.6. Table 3.6 lists the four occupations and business survey results from the Make It Work For Lincoln Survey; in particular, results regarding the percentage of employers who found that it was difficult to hire workers for each occupation and the percentage of employers who felt that wage demands were “too high” among workers in each occupation. Employers reported that it was less difficult than average (62.5%) to find workers in the Food Preparation and Serving Related (SOC 35), Sales and Related (SOC 41), and Office and Administrative Support (SOC 43) occupations. Further, in the case of Food Preparation and Serving Related workers, only 9 percent of employers felt that wage demands were “too high.” By contrast, 82.4 percent of employers reported it was difficult to hire workers in Personal Care and Service Occupations (nearly 20% above the all occupation average), and 43 percent of employers (17% above the average) reported that wage demands were “too high.” Personal Care and Service occupations appear to be the case where a significant gap between desired wages and prevailing wages is creating significant difficulty in hiring.
6 Recall from Chapter 2 that these also were some of the same occupations where the annual flow of new high school graduates for the occupation was less than anticipated annual net openings. Unmet demand could be met with college graduates unable to find work in their field of study, but again this would suggest dissatisfaction with current wages.
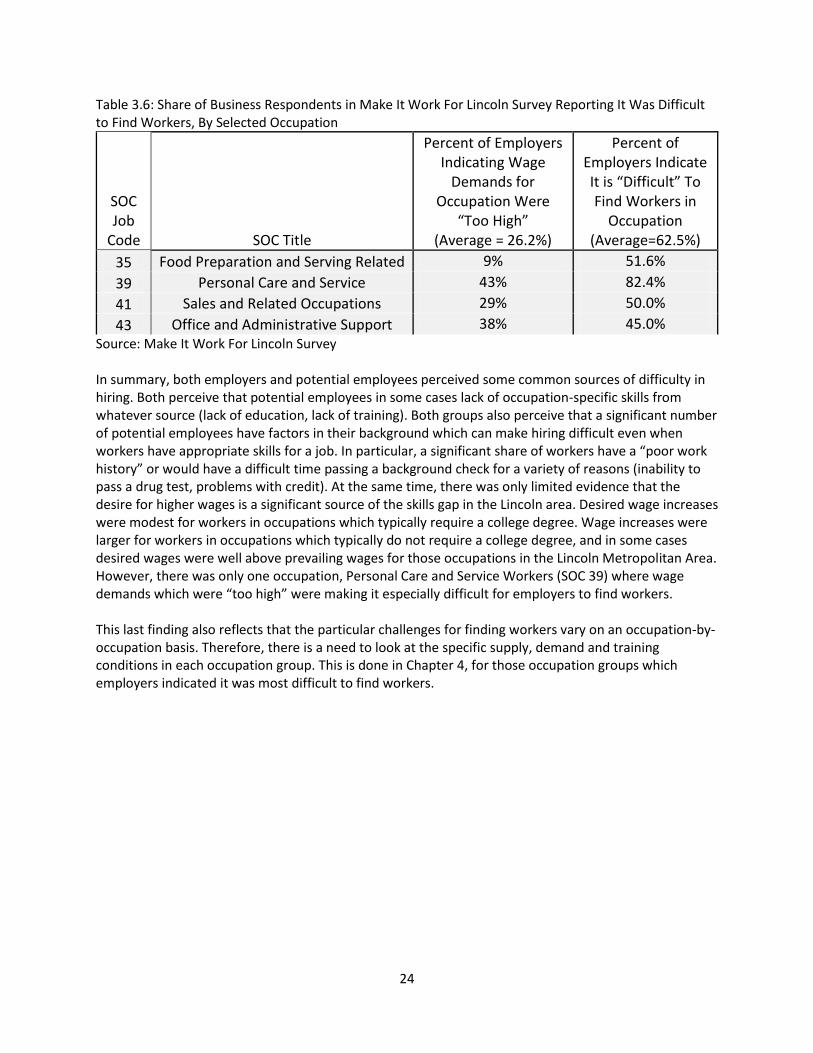
24
Table 3.6: Share of Business Respondents in Make It Work For Lincoln Survey Reporting It Was Difficult to Find Workers, By Selected Occupation
Source: Make It Work For Lincoln Survey In summary, both employers and potential employees perceived some common sources of difficulty in hiring. Both perceive that potential employees in some cases lack of occupation-specific skills from whatever source (lack of education, lack of training). Both groups also perceive that a significant number of potential employees have factors in their background which can make hiring difficult even when workers have appropriate skills for a job. In particular, a significant share of workers have a “poor work history” or would have a difficult time passing a background check for a variety of reasons (inability to pass a drug test, problems with credit). At the same time, there was only limited evidence that the desire for higher wages is a significant source of the skills gap in the Lincoln area. Desired wage increases were modest for workers in occupations which typically require a college degree. Wage increases were larger for workers in occupations which typically do not require a college degree, and in some cases desired wages were well above prevailing wages for those occupations in the Lincoln Metropolitan Area. However, there was only one occupation, Personal Care and Service Workers (SOC 39) where wage demands which were “too high” were making it especially difficult for employers to find workers. This last finding also reflects that the particular challenges for finding workers vary on an occupation-by-occupation basis. Therefore, there is a need to look at the specific supply, demand and training conditions in each occupation group. This is done in Chapter 4, for those occupation groups which employers indicated it was most difficult to find workers.
SOC Job
Code SOC Title
Percent of Employers Indicating Wage
Demands for Occupation Were
“Too High” (Average = 26.2%)
Percent of Employers Indicate It is “Difficult” To Find Workers in
Occupation (Average=62.5%)
35 Food Preparation and Serving Related 9% 51.6%
39 Personal Care and Service 43% 82.4%
41 Sales and Related Occupations 29% 50.0%
43 Office and Administrative Support 38% 45.0%
25
4. Detailed Evaluation of Select Occupation Groups This section compares information from the employer and household surveys and secondary data from government sources to develop a profile of skill supply and demand in specific occupation groups. Analysis should reveal the nature of the skills gap, if any, found in different occupations. Further, given this focus on the skills gap, a detailed analysis is provided only for those occupational groups where employers reported that it was most difficult to find workers, in particular:
Installation, Maintenance and Repair Occupations (SOC CODE 49) Personal Care and Service Workers Occupations (SOC CODE 39) Transportation and Material Moving Occupations (SOC CODE 53) Construction and Extraction Occupations (SOC CODE 47) Production Occupations (SOC CODE 51) Computer and Mathematical Workers (SOC CODE 15)
For each of these occupations, the percentage of employers who reported difficulty hiring was above the all-occupation average (62.5%), and often well above it. Two other occupation groups, Management occupations (SOC CODE 11) and Architecture and Engineering occupations (SOC CODE 21) also were ranked high in terms of the share of employers reporting it was difficult to hire. However, these two occupation groups were not deemed to be appropriate for more detailed analysis. For management occupations, many managers are promoted from the professional ranks or other leadership roles within a business without specific management training. Indeed, in the Make It Work for Lincoln Survey, a large share of businesses indicated they invested heavily in post-hire training for managers. For Architecture and Engineering occupations, analysis in Chapter 2 indicated that potential entrants to those professions, in the form of graduates from local universities, far outpace the annual exits and net growth in the occupations. Professional architects and engineers also are highly mobile geographically, so challenges lie in recruiting and retaining talent, and matching local programs to employer needs, more than in building programs to attract more students into these professions. Thus, there is not a specific analysis below of the Management or Architecture and Engineering occupations. Further, a detailed analysis is not provided for other occupations where the difficulty in finding workers was less severe. Information regarding the skills gap in these occupations was provided earlier in this report.
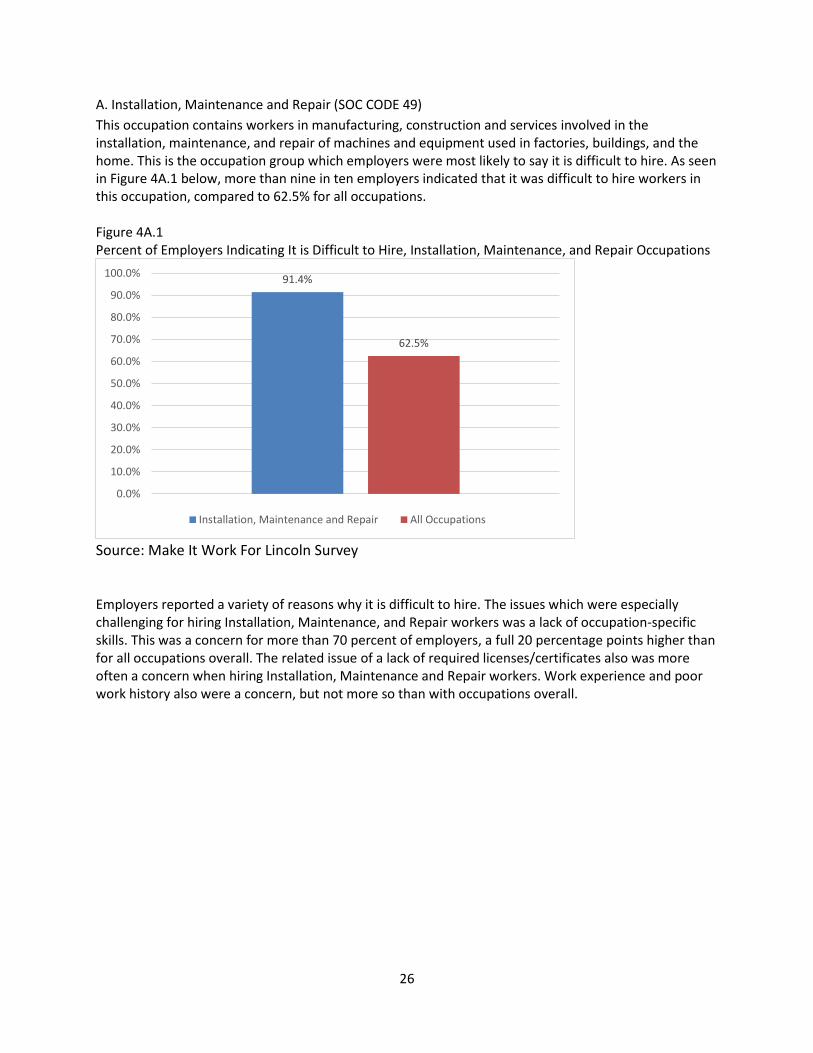
26
A. Installation, Maintenance and Repair (SOC CODE 49)
This occupation contains workers in manufacturing, construction and services involved in the installation, maintenance, and repair of machines and equipment used in factories, buildings, and the home. This is the occupation group which employers were most likely to say it is difficult to hire. As seen in Figure 4A.1 below, more than nine in ten employers indicated that it was difficult to hire workers in this occupation, compared to 62.5% for all occupations. Figure 4A.1 Percent of Employers Indicating It is Difficult to Hire, Installation, Maintenance, and Repair Occupations
Source: Make It Work For Lincoln Survey Employers reported a variety of reasons why it is difficult to hire. The issues which were especially challenging for hiring Installation, Maintenance, and Repair workers was a lack of occupation-specific skills. This was a concern for more than 70 percent of employers, a full 20 percentage points higher than for all occupations overall. The related issue of a lack of required licenses/certificates also was more often a concern when hiring Installation, Maintenance and Repair workers. Work experience and poor work history also were a concern, but not more so than with occupations overall.
91.4%
62.5%
0.0%
10.0%
20.0%
30.0%
40.0%
50.0%
60.0%
70.0%
80.0%
90.0%
100.0%
Installation, Maintenance and Repair All Occupations
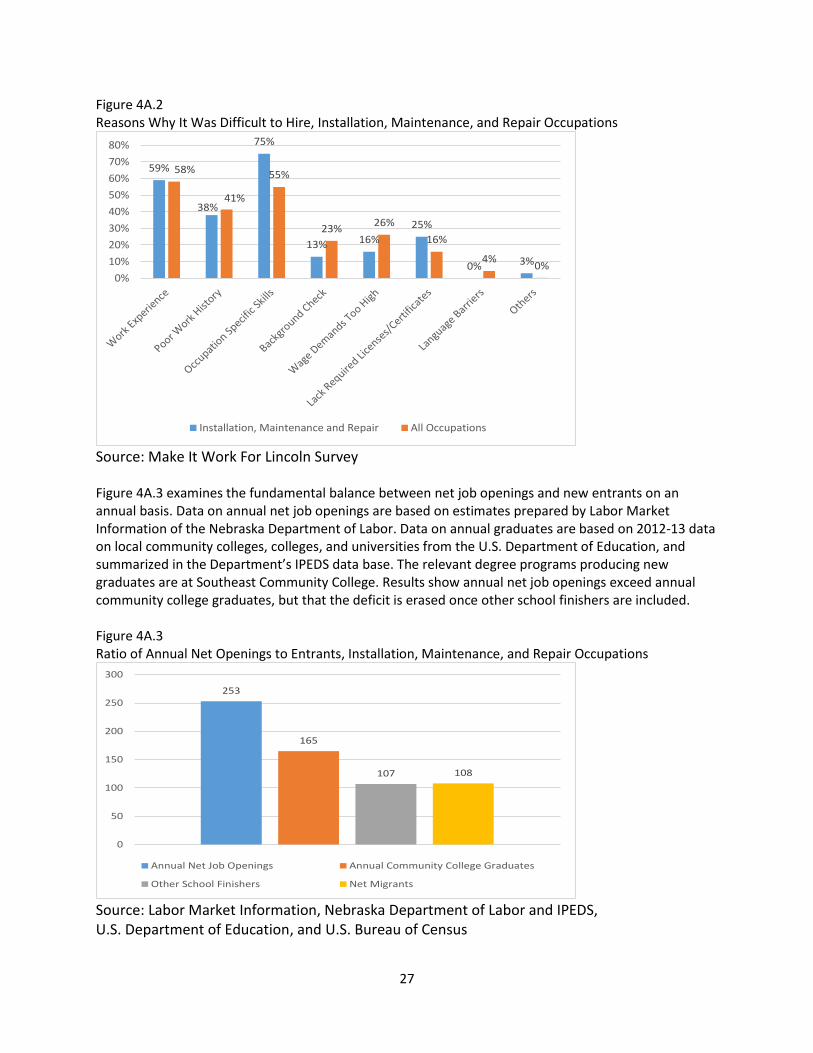
27
Figure 4A.2 Reasons Why It Was Difficult to Hire, Installation, Maintenance, and Repair Occupations
Source: Make It Work For Lincoln Survey Figure 4A.3 examines the fundamental balance between net job openings and new entrants on an annual basis. Data on annual net job openings are based on estimates prepared by Labor Market Information of the Nebraska Department of Labor. Data on annual graduates are based on 2012-13 data on local community colleges, colleges, and universities from the U.S. Department of Education, and summarized in the Department’s IPEDS data base. The relevant degree programs producing new graduates are at Southeast Community College. Results show annual net job openings exceed annual community college graduates, but that the deficit is erased once other school finishers are included. Figure 4A.3 Ratio of Annual Net Openings to Entrants, Installation, Maintenance, and Repair Occupations
Source: Labor Market Information, Nebraska Department of Labor and IPEDS, U.S. Department of Education, and U.S. Bureau of Census
59%
38%
75%
13% 16%
25%
0% 3%
58%
41%
55%
23%26%
16%
4%0%
0%
10%
20%
30%
40%
50%
60%
70%
80%
Installation, Maintenance and Repair All Occupations
253
165
107 108
0
50
100
150
200
250
300
Annual Net Job Openings Annual Community College Graduates
Other School Finishers Net Migrants
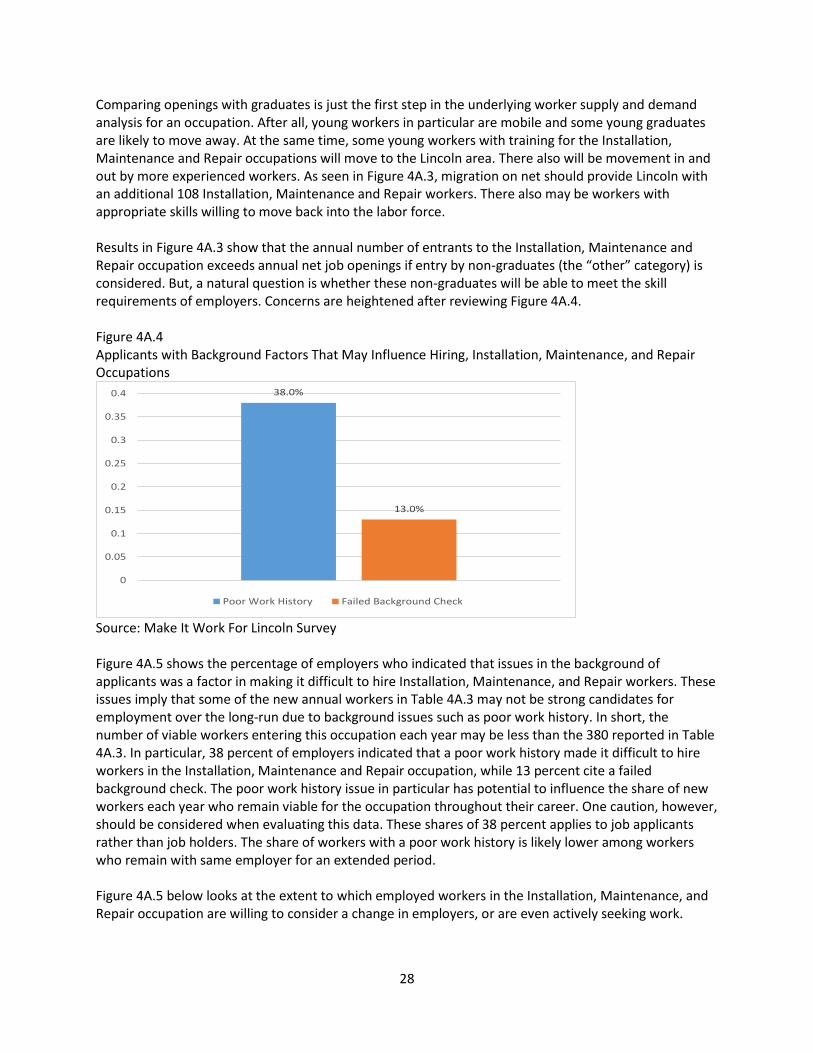
28
Comparing openings with graduates is just the first step in the underlying worker supply and demand analysis for an occupation. After all, young workers in particular are mobile and some young graduates are likely to move away. At the same time, some young workers with training for the Installation, Maintenance and Repair occupations will move to the Lincoln area. There also will be movement in and out by more experienced workers. As seen in Figure 4A.3, migration on net should provide Lincoln with an additional 108 Installation, Maintenance and Repair workers. There also may be workers with appropriate skills willing to move back into the labor force. Results in Figure 4A.3 show that the annual number of entrants to the Installation, Maintenance and Repair occupation exceeds annual net job openings if entry by non-graduates (the “other” category) is considered. But, a natural question is whether these non-graduates will be able to meet the skill requirements of employers. Concerns are heightened after reviewing Figure 4A.4. Figure 4A.4 Applicants with Background Factors That May Influence Hiring, Installation, Maintenance, and Repair Occupations
Source: Make It Work For Lincoln Survey Figure 4A.5 shows the percentage of employers who indicated that issues in the background of applicants was a factor in making it difficult to hire Installation, Maintenance, and Repair workers. These issues imply that some of the new annual workers in Table 4A.3 may not be strong candidates for employment over the long-run due to background issues such as poor work history. In short, the number of viable workers entering this occupation each year may be less than the 380 reported in Table 4A.3. In particular, 38 percent of employers indicated that a poor work history made it difficult to hire workers in the Installation, Maintenance and Repair occupation, while 13 percent cite a failed background check. The poor work history issue in particular has potential to influence the share of new workers each year who remain viable for the occupation throughout their career. One caution, however, should be considered when evaluating this data. These shares of 38 percent applies to job applicants rather than job holders. The share of workers with a poor work history is likely lower among workers who remain with same employer for an extended period. Figure 4A.5 below looks at the extent to which employed workers in the Installation, Maintenance, and Repair occupation are willing to consider a change in employers, or are even actively seeking work.
38.0%
13.0%
0
0.05
0.1
0.15
0.2
0.25
0.3
0.35
0.4
Poor Work History Failed Background Check
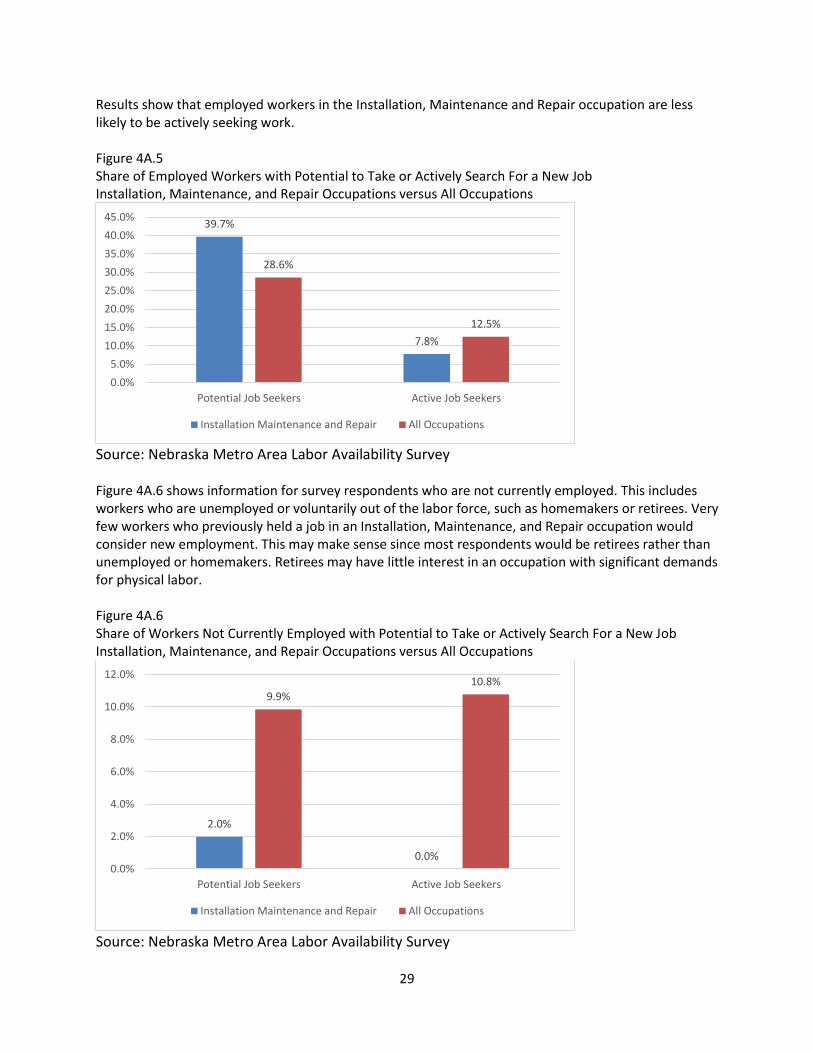
29
Results show that employed workers in the Installation, Maintenance and Repair occupation are less likely to be actively seeking work. Figure 4A.5 Share of Employed Workers with Potential to Take or Actively Search For a New Job Installation, Maintenance, and Repair Occupations versus All Occupations
Source: Nebraska Metro Area Labor Availability Survey Figure 4A.6 shows information for survey respondents who are not currently employed. This includes workers who are unemployed or voluntarily out of the labor force, such as homemakers or retirees. Very few workers who previously held a job in an Installation, Maintenance, and Repair occupation would consider new employment. This may make sense since most respondents would be retirees rather than unemployed or homemakers. Retirees may have little interest in an occupation with significant demands for physical labor. Figure 4A.6 Share of Workers Not Currently Employed with Potential to Take or Actively Search For a New Job Installation, Maintenance, and Repair Occupations versus All Occupations
Source: Nebraska Metro Area Labor Availability Survey
39.7%
7.8%
28.6%
12.5%
0.0%
5.0%
10.0%
15.0%
20.0%
25.0%
30.0%
35.0%
40.0%
45.0%
Potential Job Seekers Active Job Seekers
Installation Maintenance and Repair All Occupations
2.0%
0.0%
9.9%10.8%
0.0%
2.0%
4.0%
6.0%
8.0%
10.0%
12.0%
Potential Job Seekers Active Job Seekers
Installation Maintenance and Repair All Occupations
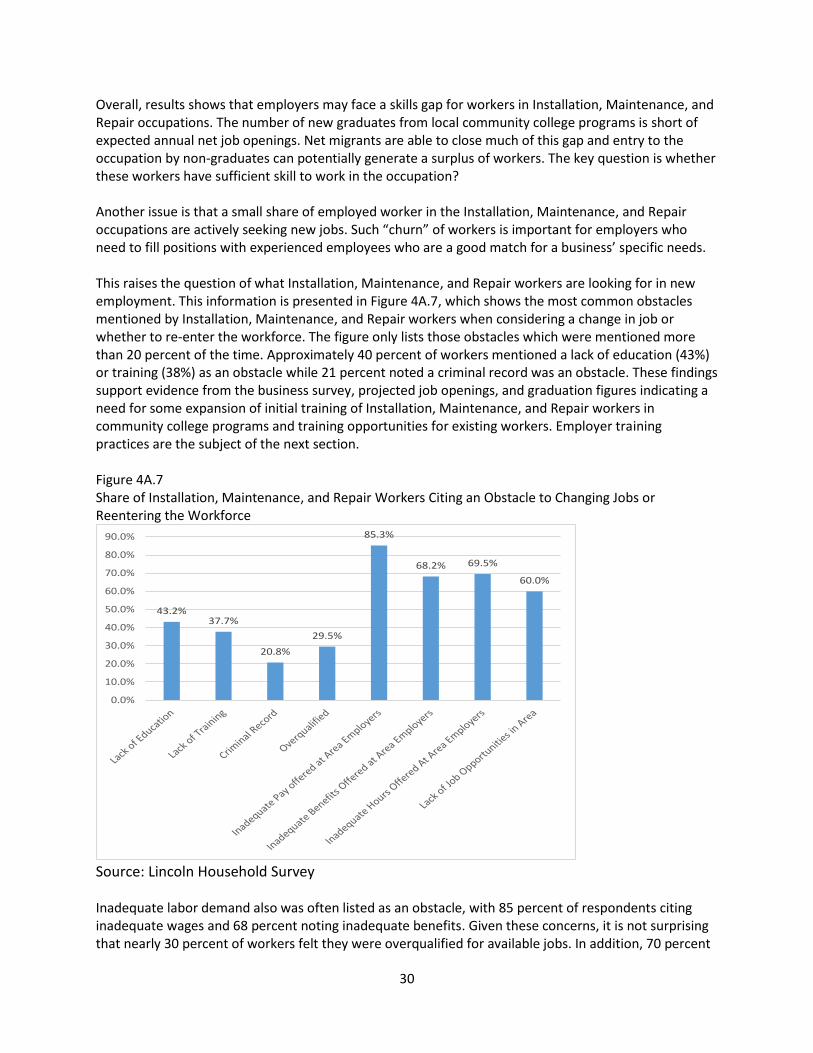
30
Overall, results shows that employers may face a skills gap for workers in Installation, Maintenance, and Repair occupations. The number of new graduates from local community college programs is short of expected annual net job openings. Net migrants are able to close much of this gap and entry to the occupation by non-graduates can potentially generate a surplus of workers. The key question is whether these workers have sufficient skill to work in the occupation? Another issue is that a small share of employed worker in the Installation, Maintenance, and Repair occupations are actively seeking new jobs. Such “churn” of workers is important for employers who need to fill positions with experienced employees who are a good match for a business’ specific needs. This raises the question of what Installation, Maintenance, and Repair workers are looking for in new employment. This information is presented in Figure 4A.7, which shows the most common obstacles mentioned by Installation, Maintenance, and Repair workers when considering a change in job or whether to re-enter the workforce. The figure only lists those obstacles which were mentioned more than 20 percent of the time. Approximately 40 percent of workers mentioned a lack of education (43%) or training (38%) as an obstacle while 21 percent noted a criminal record was an obstacle. These findings support evidence from the business survey, projected job openings, and graduation figures indicating a need for some expansion of initial training of Installation, Maintenance, and Repair workers in community college programs and training opportunities for existing workers. Employer training practices are the subject of the next section. Figure 4A.7 Share of Installation, Maintenance, and Repair Workers Citing an Obstacle to Changing Jobs or Reentering the Workforce
Source: Lincoln Household Survey Inadequate labor demand also was often listed as an obstacle, with 85 percent of respondents citing inadequate wages and 68 percent noting inadequate benefits. Given these concerns, it is not surprising that nearly 30 percent of workers felt they were overqualified for available jobs. In addition, 70 percent
43.2%37.7%
20.8%
29.5%
85.3%
68.2% 69.5%
60.0%
0.0%
10.0%
20.0%
30.0%
40.0%
50.0%
60.0%
70.0%
80.0%
90.0%
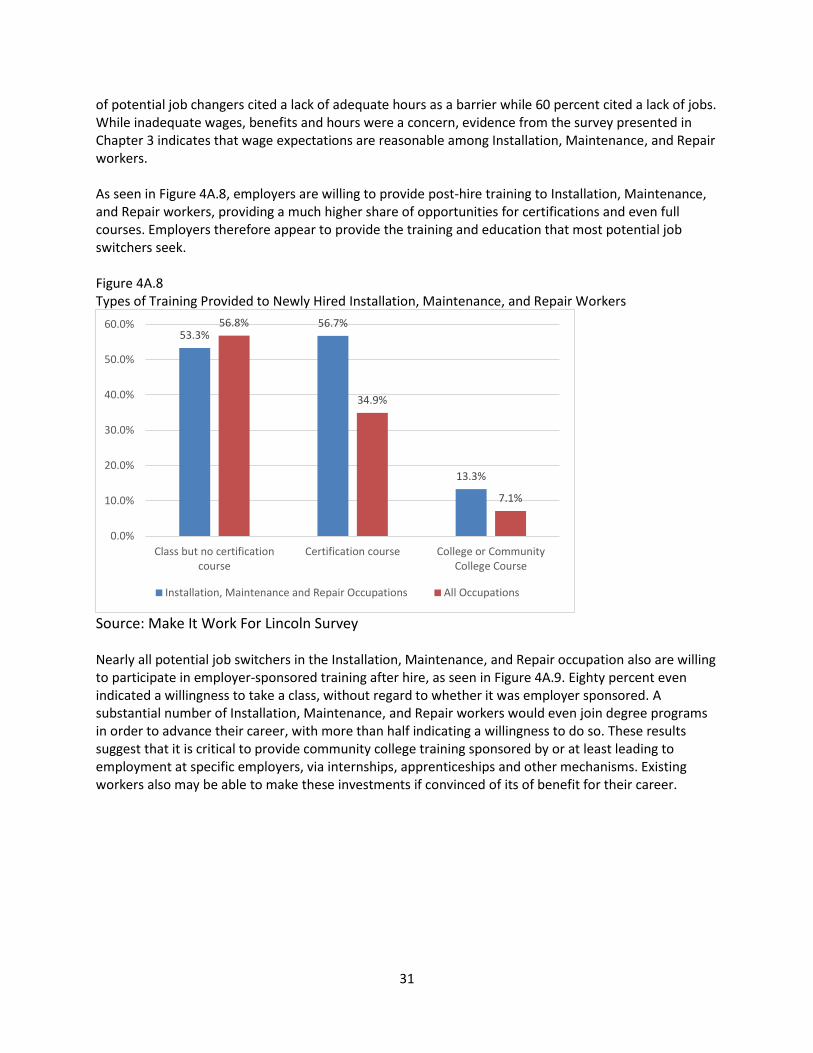
31
of potential job changers cited a lack of adequate hours as a barrier while 60 percent cited a lack of jobs. While inadequate wages, benefits and hours were a concern, evidence from the survey presented in Chapter 3 indicates that wage expectations are reasonable among Installation, Maintenance, and Repair workers. As seen in Figure 4A.8, employers are willing to provide post-hire training to Installation, Maintenance, and Repair workers, providing a much higher share of opportunities for certifications and even full courses. Employers therefore appear to provide the training and education that most potential job switchers seek. Figure 4A.8 Types of Training Provided to Newly Hired Installation, Maintenance, and Repair Workers
Source: Make It Work For Lincoln Survey Nearly all potential job switchers in the Installation, Maintenance, and Repair occupation also are willing to participate in employer-sponsored training after hire, as seen in Figure 4A.9. Eighty percent even indicated a willingness to take a class, without regard to whether it was employer sponsored. A substantial number of Installation, Maintenance, and Repair workers would even join degree programs in order to advance their career, with more than half indicating a willingness to do so. These results suggest that it is critical to provide community college training sponsored by or at least leading to employment at specific employers, via internships, apprenticeships and other mechanisms. Existing workers also may be able to make these investments if convinced of its of benefit for their career.
53.3%56.7%
13.3%
56.8%
34.9%
7.1%
0.0%
10.0%
20.0%
30.0%
40.0%
50.0%
60.0%
Class but no certificationcourse
Certification course College or CommunityCollege Course
Installation, Maintenance and Repair Occupations All Occupations
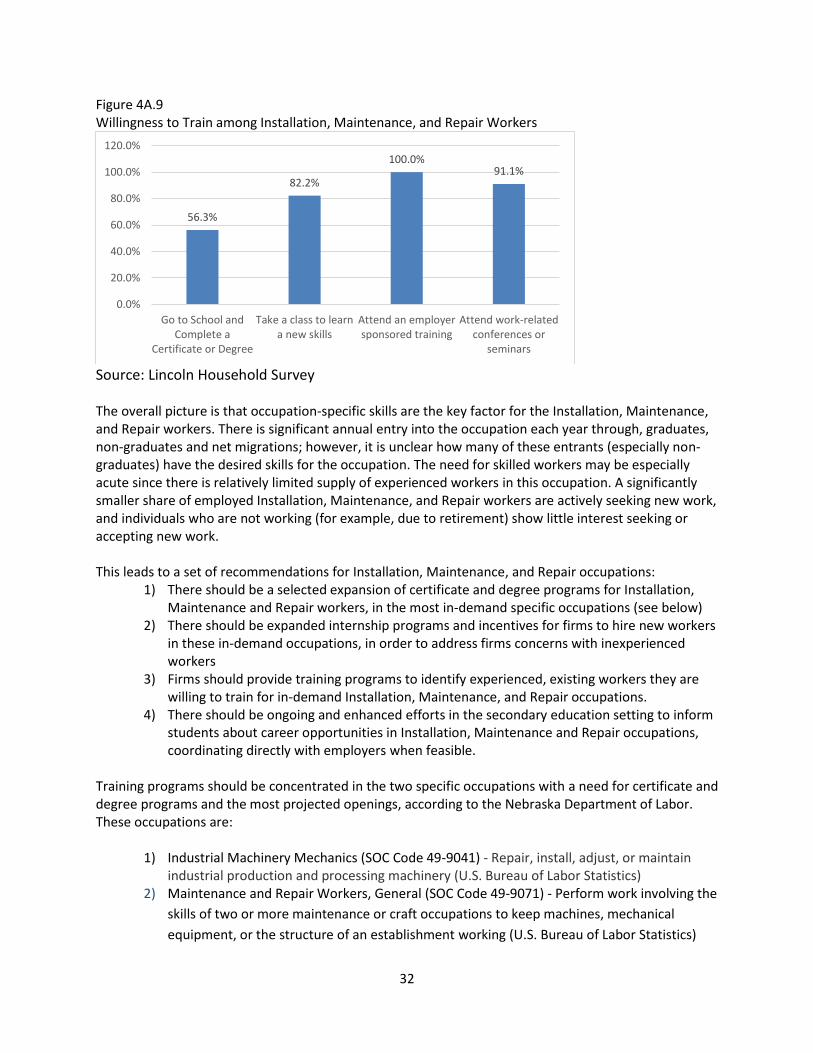
32
Figure 4A.9 Willingness to Train among Installation, Maintenance, and Repair Workers
Source: Lincoln Household Survey The overall picture is that occupation-specific skills are the key factor for the Installation, Maintenance, and Repair workers. There is significant annual entry into the occupation each year through, graduates, non-graduates and net migrations; however, it is unclear how many of these entrants (especially non-graduates) have the desired skills for the occupation. The need for skilled workers may be especially acute since there is relatively limited supply of experienced workers in this occupation. A significantly smaller share of employed Installation, Maintenance, and Repair workers are actively seeking new work, and individuals who are not working (for example, due to retirement) show little interest seeking or accepting new work. This leads to a set of recommendations for Installation, Maintenance, and Repair occupations:
1) There should be a selected expansion of certificate and degree programs for Installation, Maintenance and Repair workers, in the most in-demand specific occupations (see below)
2) There should be expanded internship programs and incentives for firms to hire new workers in these in-demand occupations, in order to address firms concerns with inexperienced workers
3) Firms should provide training programs to identify experienced, existing workers they are willing to train for in-demand Installation, Maintenance, and Repair occupations.
4) There should be ongoing and enhanced efforts in the secondary education setting to inform students about career opportunities in Installation, Maintenance and Repair occupations, coordinating directly with employers when feasible.
Training programs should be concentrated in the two specific occupations with a need for certificate and degree programs and the most projected openings, according to the Nebraska Department of Labor. These occupations are:
1) Industrial Machinery Mechanics (SOC Code 49-9041) - Repair, install, adjust, or maintain industrial production and processing machinery (U.S. Bureau of Labor Statistics)
2) Maintenance and Repair Workers, General (SOC Code 49-9071) - Perform work involving the
skills of two or more maintenance or craft occupations to keep machines, mechanical
equipment, or the structure of an establishment working (U.S. Bureau of Labor Statistics)
56.3%
82.2%
100.0%91.1%
0.0%
20.0%
40.0%
60.0%
80.0%
100.0%
120.0%
Go to School andComplete a
Certificate or Degree
Take a class to learna new skills
Attend an employersponsored training
Attend work-relatedconferences or
seminars
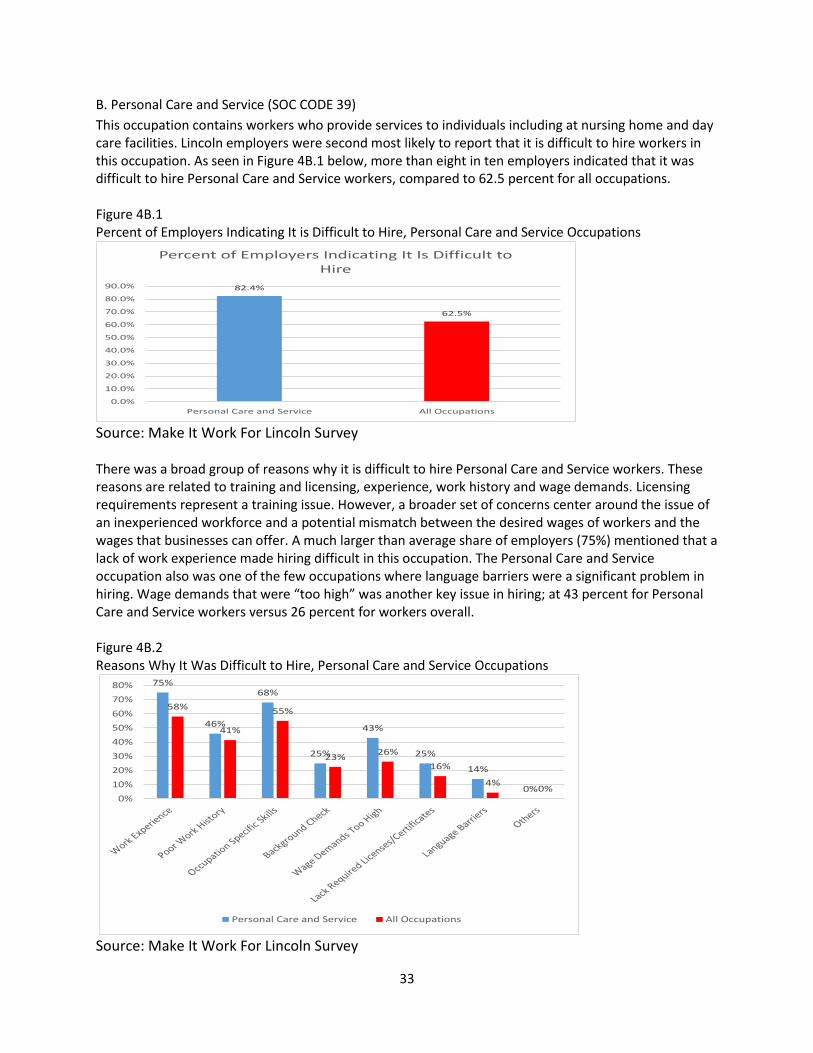
33
B. Personal Care and Service (SOC CODE 39)
This occupation contains workers who provide services to individuals including at nursing home and day care facilities. Lincoln employers were second most likely to report that it is difficult to hire workers in this occupation. As seen in Figure 4B.1 below, more than eight in ten employers indicated that it was difficult to hire Personal Care and Service workers, compared to 62.5 percent for all occupations. Figure 4B.1 Percent of Employers Indicating It is Difficult to Hire, Personal Care and Service Occupations
Source: Make It Work For Lincoln Survey There was a broad group of reasons why it is difficult to hire Personal Care and Service workers. These reasons are related to training and licensing, experience, work history and wage demands. Licensing requirements represent a training issue. However, a broader set of concerns center around the issue of an inexperienced workforce and a potential mismatch between the desired wages of workers and the wages that businesses can offer. A much larger than average share of employers (75%) mentioned that a lack of work experience made hiring difficult in this occupation. The Personal Care and Service occupation also was one of the few occupations where language barriers were a significant problem in hiring. Wage demands that were “too high” was another key issue in hiring; at 43 percent for Personal Care and Service workers versus 26 percent for workers overall. Figure 4B.2 Reasons Why It Was Difficult to Hire, Personal Care and Service Occupations
Source: Make It Work For Lincoln Survey
82.4%
62.5%
0.0%
10.0%
20.0%
30.0%
40.0%
50.0%
60.0%
70.0%
80.0%
90.0%
Personal Care and Service All Occupations
Percent of Employers Indicating It Is Difficult to Hire
75%
46%
68%
25%
43%
25%
14%
0%
58%
41%
55%
23%26%
16%
4%0%
0%
10%
20%
30%
40%
50%
60%
70%
80%
Personal Care and Service All Occupations
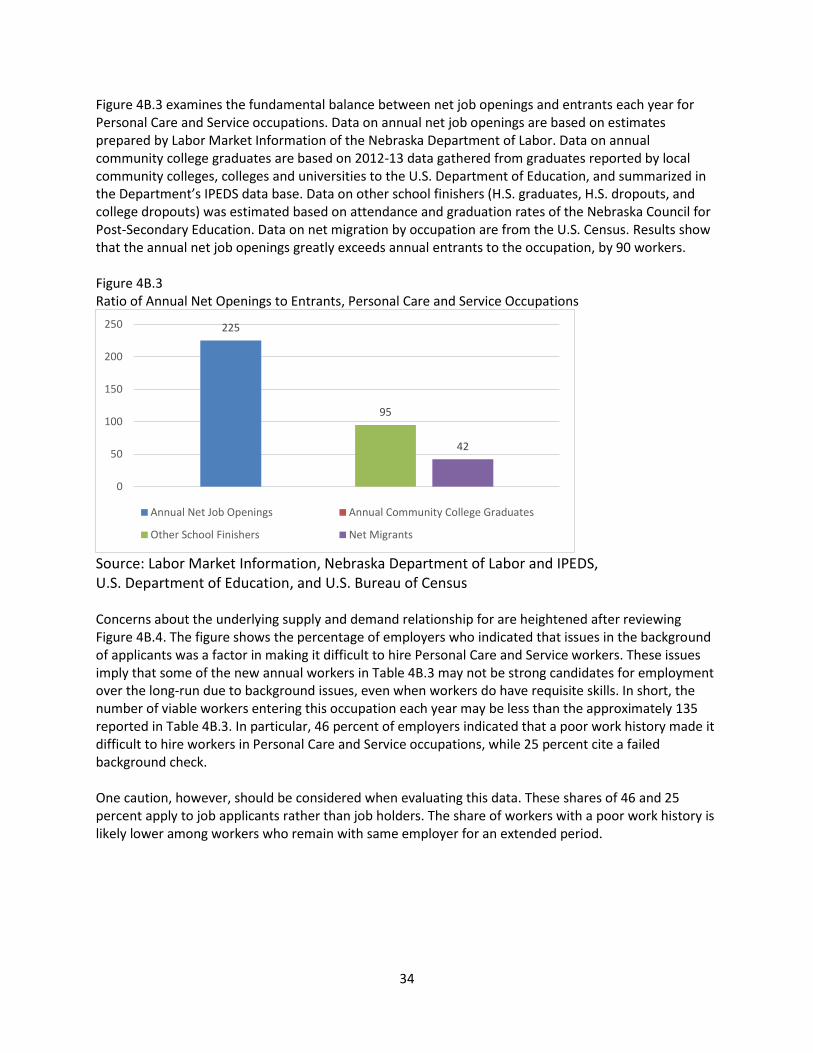
34
Figure 4B.3 examines the fundamental balance between net job openings and entrants each year for Personal Care and Service occupations. Data on annual net job openings are based on estimates prepared by Labor Market Information of the Nebraska Department of Labor. Data on annual community college graduates are based on 2012-13 data gathered from graduates reported by local community colleges, colleges and universities to the U.S. Department of Education, and summarized in the Department’s IPEDS data base. Data on other school finishers (H.S. graduates, H.S. dropouts, and college dropouts) was estimated based on attendance and graduation rates of the Nebraska Council for Post-Secondary Education. Data on net migration by occupation are from the U.S. Census. Results show that the annual net job openings greatly exceeds annual entrants to the occupation, by 90 workers. Figure 4B.3 Ratio of Annual Net Openings to Entrants, Personal Care and Service Occupations
Source: Labor Market Information, Nebraska Department of Labor and IPEDS, U.S. Department of Education, and U.S. Bureau of Census Concerns about the underlying supply and demand relationship for are heightened after reviewing Figure 4B.4. The figure shows the percentage of employers who indicated that issues in the background of applicants was a factor in making it difficult to hire Personal Care and Service workers. These issues imply that some of the new annual workers in Table 4B.3 may not be strong candidates for employment over the long-run due to background issues, even when workers do have requisite skills. In short, the number of viable workers entering this occupation each year may be less than the approximately 135 reported in Table 4B.3. In particular, 46 percent of employers indicated that a poor work history made it difficult to hire workers in Personal Care and Service occupations, while 25 percent cite a failed background check. One caution, however, should be considered when evaluating this data. These shares of 46 and 25 percent apply to job applicants rather than job holders. The share of workers with a poor work history is likely lower among workers who remain with same employer for an extended period.
225
95
42
0
50
100
150
200
250
Annual Net Job Openings Annual Community College Graduates
Other School Finishers Net Migrants

35
Figure 4B.4 Applicants with Background Factors That May Influence Hiring, Personal Care and Service Occupations
Source: Make It Work For Lincoln Survey Figure 4C.5 looks at the extent to which employed workers in Personal Care and Service occupations are willing to consider a change in employers, or are even actively seeking work. The Figure also compares these shares of workers with the average for all occupations. Employed workers in Personal Care and Service occupations are much more likely to be actively seeking new work. Figure 4B.5 Share of Employed Workers with Potential to Take or Actively Search For a New Job Personal Care and Service Occupations versus All Occupations
Source: Lincoln Household Survey Figure 4B.6 shows information for survey respondents who are not currently employed. This includes whether they are unemployed or voluntarily out of the labor force, such as homemakers or retirees. More than one in five individuals who previously worked in a Personal Care and Service occupation
46.0%
25.0%
0.0%
5.0%
10.0%
15.0%
20.0%
25.0%
30.0%
35.0%
40.0%
45.0%
50.0%
Poor Work History Failed Background Check
33.3%
21.3%
28.6%
12.5%
0.0%
5.0%
10.0%
15.0%
20.0%
25.0%
30.0%
35.0%
Potential Job Seekers Active Job Seekers
Personal Care and Service All Occupations
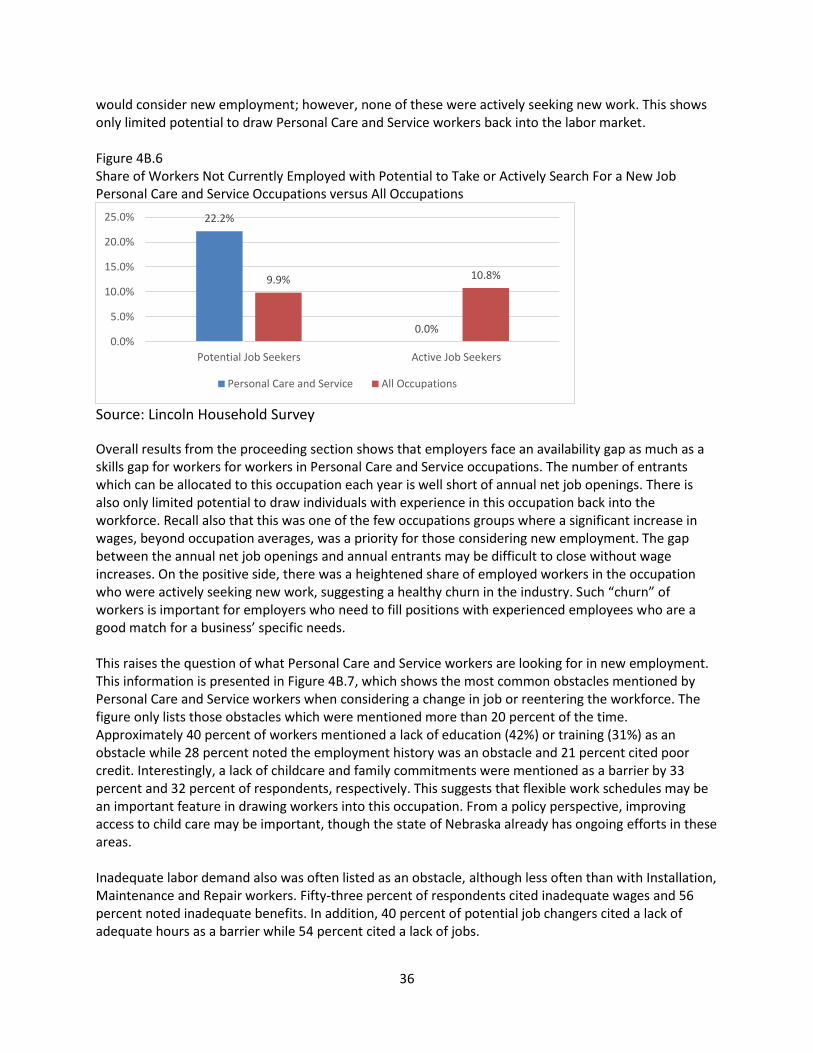
36
would consider new employment; however, none of these were actively seeking new work. This shows only limited potential to draw Personal Care and Service workers back into the labor market. Figure 4B.6 Share of Workers Not Currently Employed with Potential to Take or Actively Search For a New Job Personal Care and Service Occupations versus All Occupations
Source: Lincoln Household Survey
Overall results from the proceeding section shows that employers face an availability gap as much as a skills gap for workers for workers in Personal Care and Service occupations. The number of entrants which can be allocated to this occupation each year is well short of annual net job openings. There is also only limited potential to draw individuals with experience in this occupation back into the workforce. Recall also that this was one of the few occupations groups where a significant increase in wages, beyond occupation averages, was a priority for those considering new employment. The gap between the annual net job openings and annual entrants may be difficult to close without wage increases. On the positive side, there was a heightened share of employed workers in the occupation who were actively seeking new work, suggesting a healthy churn in the industry. Such “churn” of workers is important for employers who need to fill positions with experienced employees who are a good match for a business’ specific needs. This raises the question of what Personal Care and Service workers are looking for in new employment. This information is presented in Figure 4B.7, which shows the most common obstacles mentioned by Personal Care and Service workers when considering a change in job or reentering the workforce. The figure only lists those obstacles which were mentioned more than 20 percent of the time. Approximately 40 percent of workers mentioned a lack of education (42%) or training (31%) as an obstacle while 28 percent noted the employment history was an obstacle and 21 percent cited poor credit. Interestingly, a lack of childcare and family commitments were mentioned as a barrier by 33 percent and 32 percent of respondents, respectively. This suggests that flexible work schedules may be an important feature in drawing workers into this occupation. From a policy perspective, improving access to child care may be important, though the state of Nebraska already has ongoing efforts in these areas. Inadequate labor demand also was often listed as an obstacle, although less often than with Installation, Maintenance and Repair workers. Fifty-three percent of respondents cited inadequate wages and 56 percent noted inadequate benefits. In addition, 40 percent of potential job changers cited a lack of adequate hours as a barrier while 54 percent cited a lack of jobs.
22.2%
0.0%
9.9% 10.8%
0.0%
5.0%
10.0%
15.0%
20.0%
25.0%
Potential Job Seekers Active Job Seekers
Personal Care and Service All Occupations
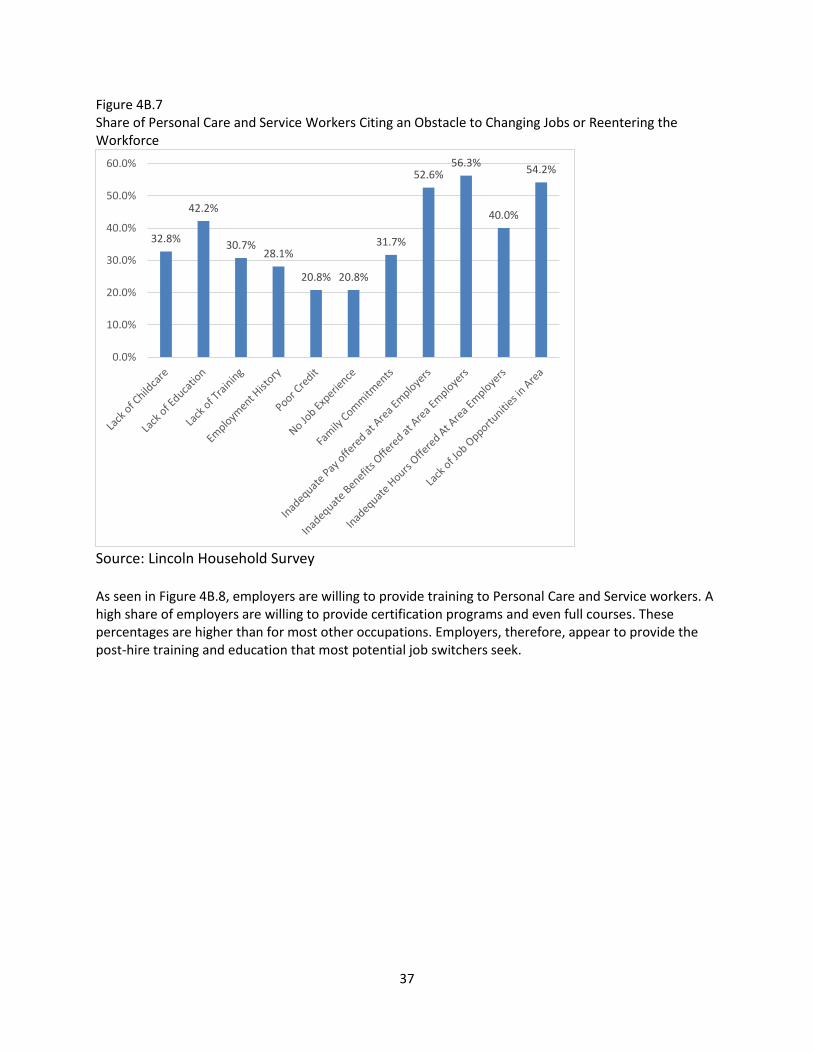
37
Figure 4B.7 Share of Personal Care and Service Workers Citing an Obstacle to Changing Jobs or Reentering the Workforce
Source: Lincoln Household Survey As seen in Figure 4B.8, employers are willing to provide training to Personal Care and Service workers. A high share of employers are willing to provide certification programs and even full courses. These percentages are higher than for most other occupations. Employers, therefore, appear to provide the post-hire training and education that most potential job switchers seek.
32.8%
42.2%
30.7%28.1%
20.8% 20.8%
31.7%
52.6%56.3%
40.0%
54.2%
0.0%
10.0%
20.0%
30.0%
40.0%
50.0%
60.0%
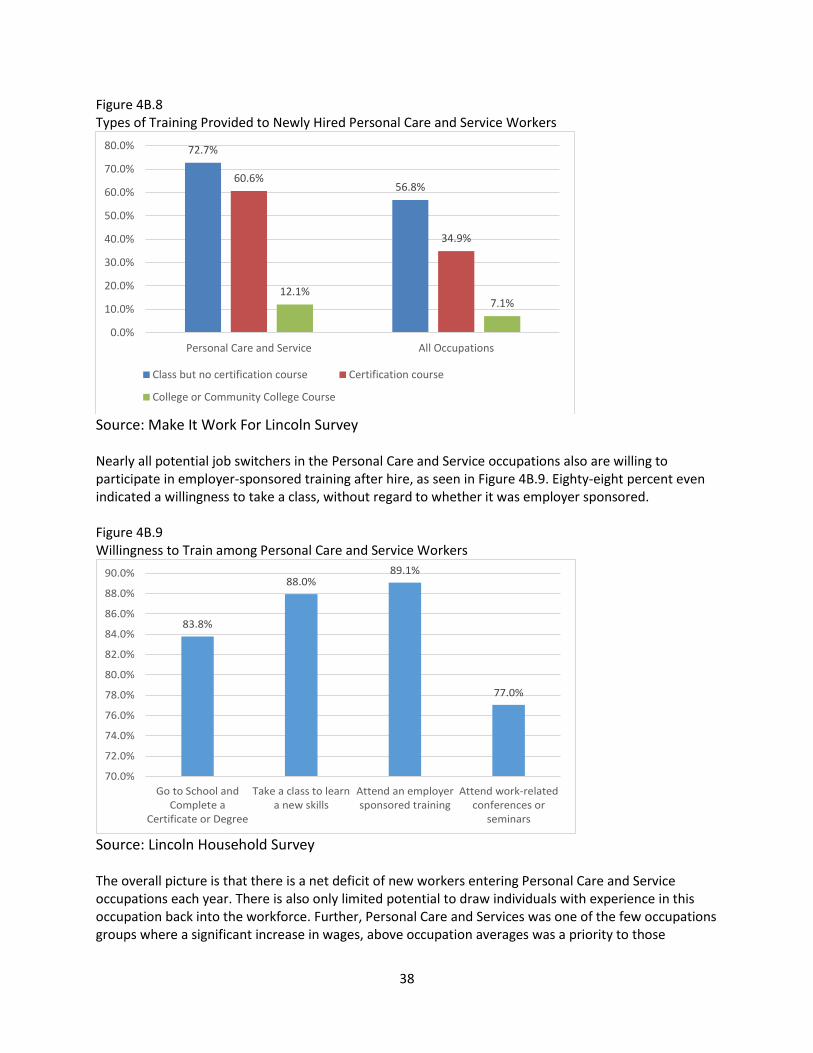
38
Figure 4B.8 Types of Training Provided to Newly Hired Personal Care and Service Workers
Source: Make It Work For Lincoln Survey Nearly all potential job switchers in the Personal Care and Service occupations also are willing to participate in employer-sponsored training after hire, as seen in Figure 4B.9. Eighty-eight percent even indicated a willingness to take a class, without regard to whether it was employer sponsored. Figure 4B.9 Willingness to Train among Personal Care and Service Workers
Source: Lincoln Household Survey The overall picture is that there is a net deficit of new workers entering Personal Care and Service occupations each year. There is also only limited potential to draw individuals with experience in this occupation back into the workforce. Further, Personal Care and Services was one of the few occupations groups where a significant increase in wages, above occupation averages was a priority to those
72.7%
56.8%60.6%
34.9%
12.1%7.1%
0.0%
10.0%
20.0%
30.0%
40.0%
50.0%
60.0%
70.0%
80.0%
Personal Care and Service All Occupations
Class but no certification course Certification course
College or Community College Course
83.8%
88.0%89.1%
77.0%
70.0%
72.0%
74.0%
76.0%
78.0%
80.0%
82.0%
84.0%
86.0%
88.0%
90.0%
Go to School andComplete a
Certificate or Degree
Take a class to learna new skills
Attend an employersponsored training
Attend work-relatedconferences or
seminars
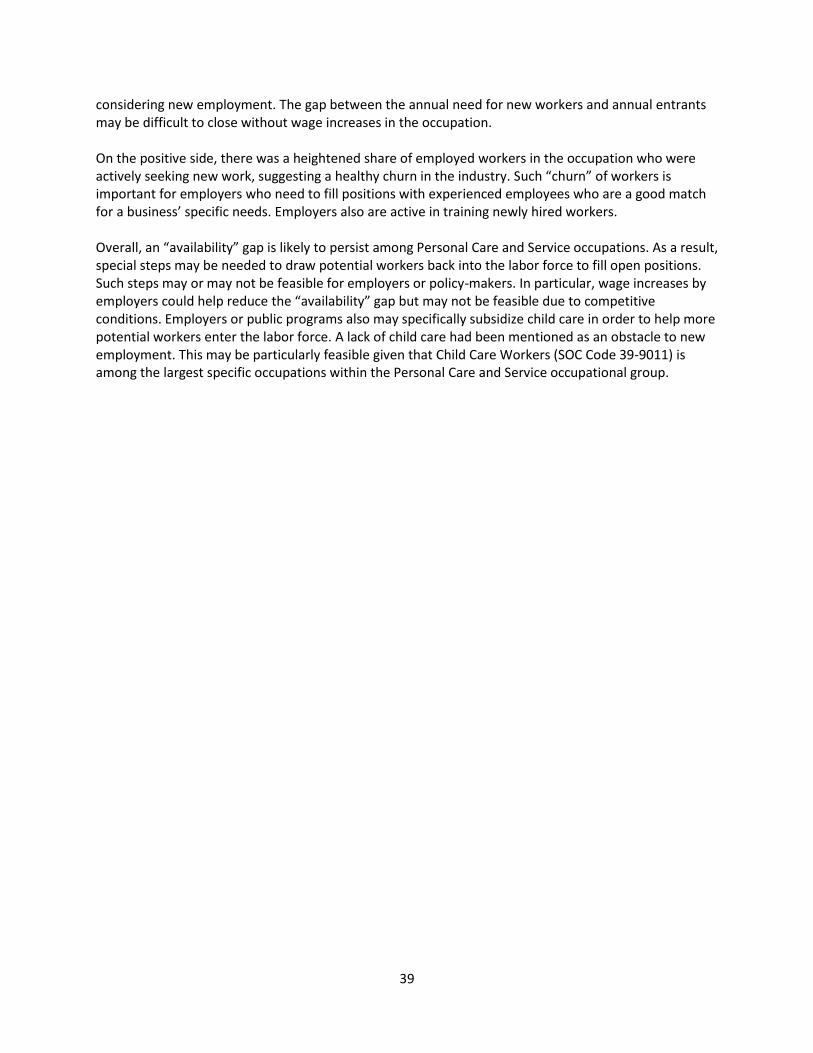
39
considering new employment. The gap between the annual need for new workers and annual entrants may be difficult to close without wage increases in the occupation. On the positive side, there was a heightened share of employed workers in the occupation who were actively seeking new work, suggesting a healthy churn in the industry. Such “churn” of workers is important for employers who need to fill positions with experienced employees who are a good match for a business’ specific needs. Employers also are active in training newly hired workers. Overall, an “availability” gap is likely to persist among Personal Care and Service occupations. As a result, special steps may be needed to draw potential workers back into the labor force to fill open positions. Such steps may or may not be feasible for employers or policy-makers. In particular, wage increases by employers could help reduce the “availability” gap but may not be feasible due to competitive conditions. Employers or public programs also may specifically subsidize child care in order to help more potential workers enter the labor force. A lack of child care had been mentioned as an obstacle to new employment. This may be particularly feasible given that Child Care Workers (SOC Code 39-9011) is among the largest specific occupations within the Personal Care and Service occupational group.
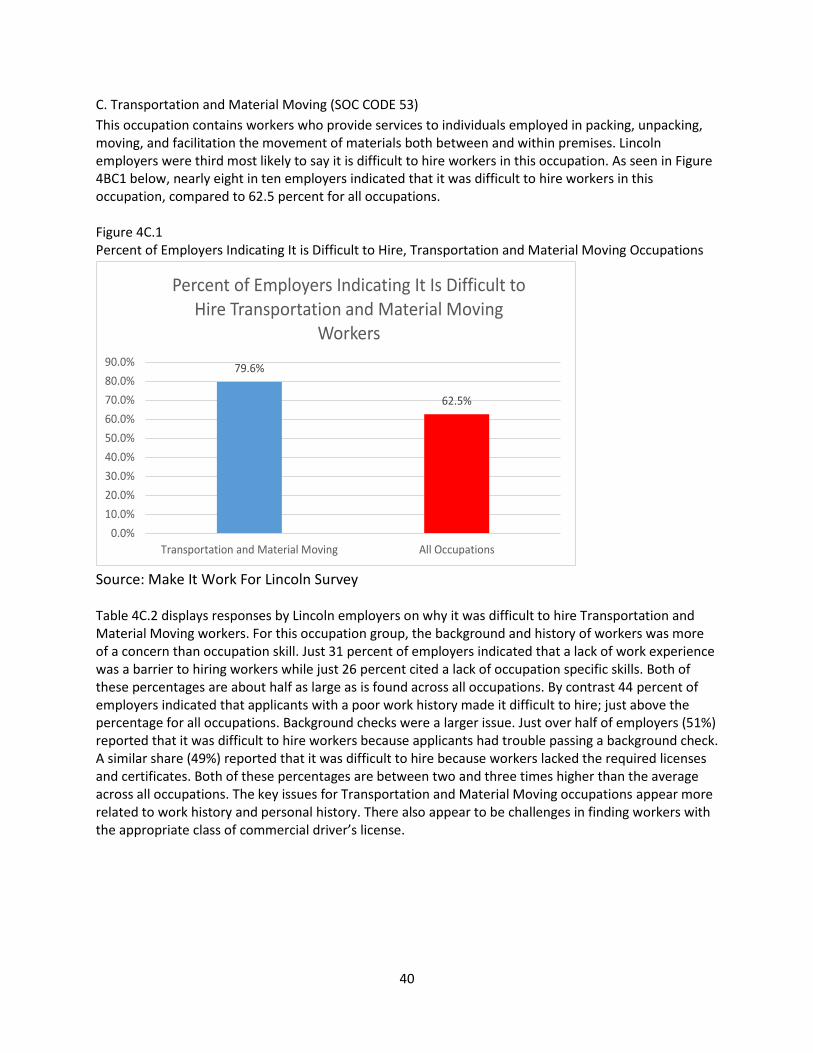
40
C. Transportation and Material Moving (SOC CODE 53)
This occupation contains workers who provide services to individuals employed in packing, unpacking, moving, and facilitation the movement of materials both between and within premises. Lincoln employers were third most likely to say it is difficult to hire workers in this occupation. As seen in Figure 4BC1 below, nearly eight in ten employers indicated that it was difficult to hire workers in this occupation, compared to 62.5 percent for all occupations. Figure 4C.1 Percent of Employers Indicating It is Difficult to Hire, Transportation and Material Moving Occupations
Source: Make It Work For Lincoln Survey Table 4C.2 displays responses by Lincoln employers on why it was difficult to hire Transportation and Material Moving workers. For this occupation group, the background and history of workers was more of a concern than occupation skill. Just 31 percent of employers indicated that a lack of work experience was a barrier to hiring workers while just 26 percent cited a lack of occupation specific skills. Both of these percentages are about half as large as is found across all occupations. By contrast 44 percent of employers indicated that applicants with a poor work history made it difficult to hire; just above the percentage for all occupations. Background checks were a larger issue. Just over half of employers (51%) reported that it was difficult to hire workers because applicants had trouble passing a background check. A similar share (49%) reported that it was difficult to hire because workers lacked the required licenses and certificates. Both of these percentages are between two and three times higher than the average across all occupations. The key issues for Transportation and Material Moving occupations appear more related to work history and personal history. There also appear to be challenges in finding workers with the appropriate class of commercial driver’s license.
79.6%
62.5%
0.0%
10.0%
20.0%
30.0%
40.0%
50.0%
60.0%
70.0%
80.0%
90.0%
Transportation and Material Moving All Occupations
Percent of Employers Indicating It Is Difficult to Hire Transportation and Material Moving
Workers
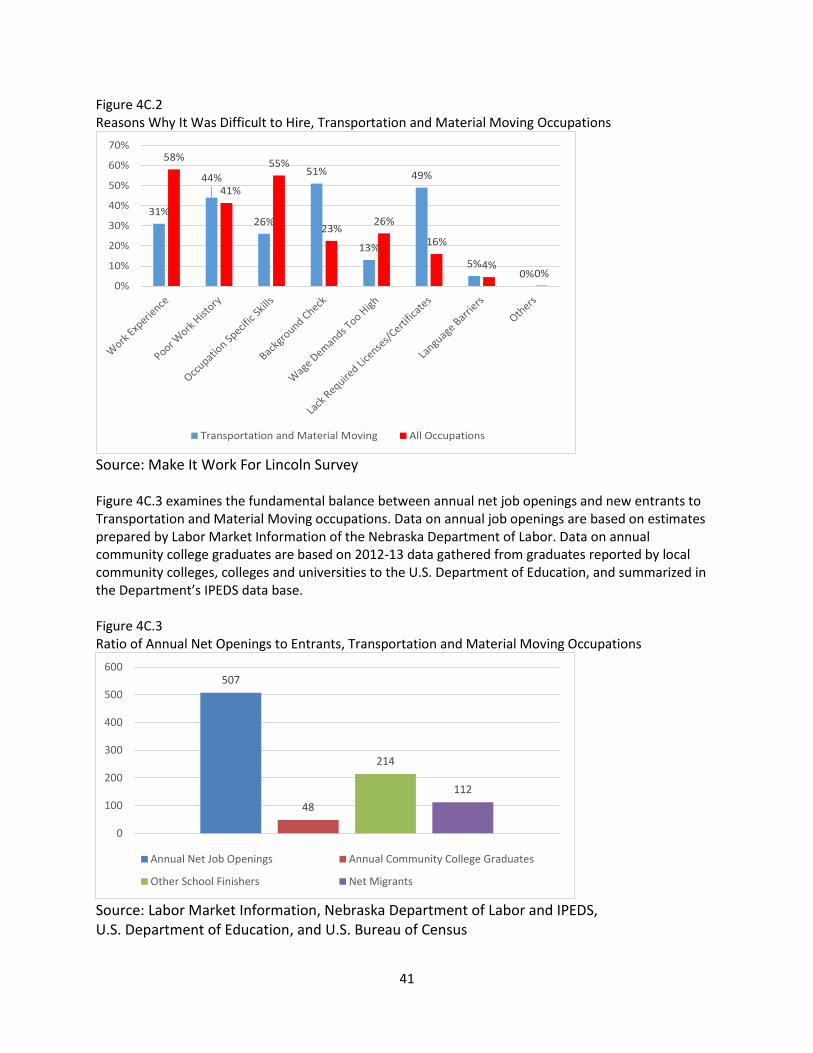
41
Figure 4C.2 Reasons Why It Was Difficult to Hire, Transportation and Material Moving Occupations
Source: Make It Work For Lincoln Survey Figure 4C.3 examines the fundamental balance between annual net job openings and new entrants to Transportation and Material Moving occupations. Data on annual job openings are based on estimates prepared by Labor Market Information of the Nebraska Department of Labor. Data on annual community college graduates are based on 2012-13 data gathered from graduates reported by local community colleges, colleges and universities to the U.S. Department of Education, and summarized in the Department’s IPEDS data base. Figure 4C.3 Ratio of Annual Net Openings to Entrants, Transportation and Material Moving Occupations
Source: Labor Market Information, Nebraska Department of Labor and IPEDS, U.S. Department of Education, and U.S. Bureau of Census
31%
44%
26%
51%
13%
49%
5%0%
58%
41%
55%
23%26%
16%
4%0%
0%
10%
20%
30%
40%
50%
60%
70%
Transportation and Material Moving All Occupations
507
48
214
112
0
100
200
300
400
500
600
Annual Net Job Openings Annual Community College Graduates
Other School Finishers Net Migrants
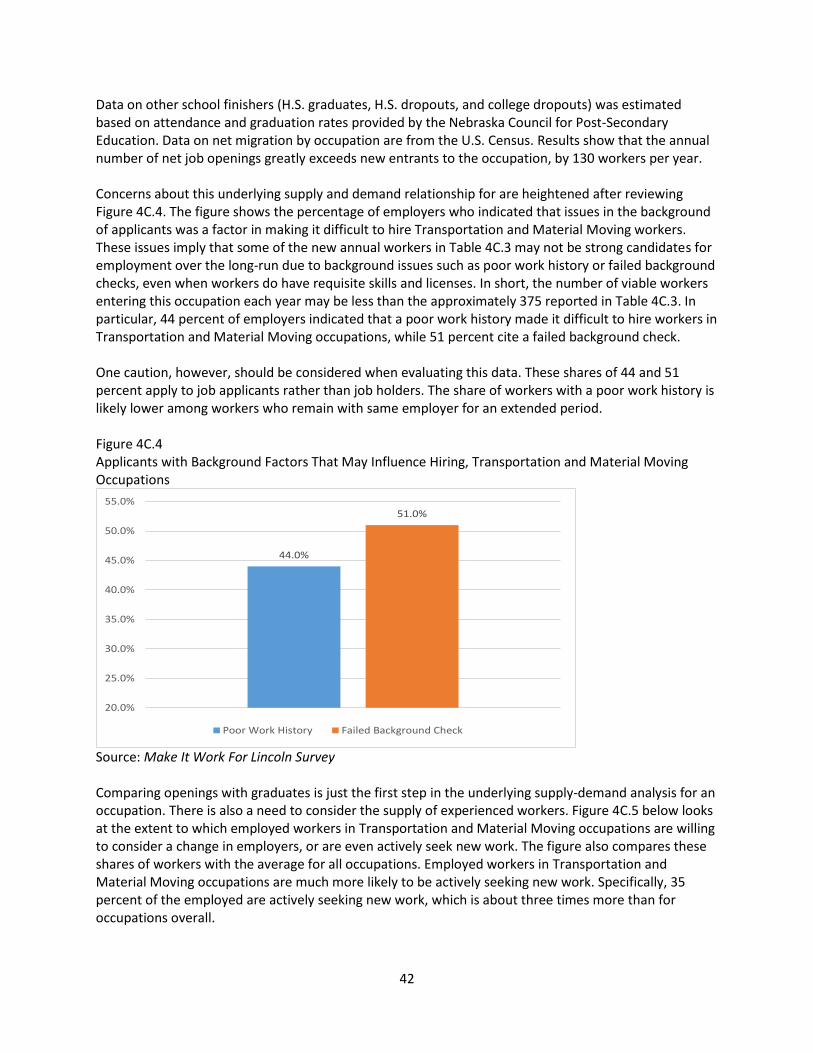
42
Data on other school finishers (H.S. graduates, H.S. dropouts, and college dropouts) was estimated based on attendance and graduation rates provided by the Nebraska Council for Post-Secondary Education. Data on net migration by occupation are from the U.S. Census. Results show that the annual number of net job openings greatly exceeds new entrants to the occupation, by 130 workers per year. Concerns about this underlying supply and demand relationship for are heightened after reviewing Figure 4C.4. The figure shows the percentage of employers who indicated that issues in the background of applicants was a factor in making it difficult to hire Transportation and Material Moving workers. These issues imply that some of the new annual workers in Table 4C.3 may not be strong candidates for employment over the long-run due to background issues such as poor work history or failed background checks, even when workers do have requisite skills and licenses. In short, the number of viable workers entering this occupation each year may be less than the approximately 375 reported in Table 4C.3. In particular, 44 percent of employers indicated that a poor work history made it difficult to hire workers in Transportation and Material Moving occupations, while 51 percent cite a failed background check. One caution, however, should be considered when evaluating this data. These shares of 44 and 51 percent apply to job applicants rather than job holders. The share of workers with a poor work history is likely lower among workers who remain with same employer for an extended period. Figure 4C.4 Applicants with Background Factors That May Influence Hiring, Transportation and Material Moving Occupations
Source: Make It Work For Lincoln Survey Comparing openings with graduates is just the first step in the underlying supply-demand analysis for an occupation. There is also a need to consider the supply of experienced workers. Figure 4C.5 below looks at the extent to which employed workers in Transportation and Material Moving occupations are willing to consider a change in employers, or are even actively seek new work. The figure also compares these shares of workers with the average for all occupations. Employed workers in Transportation and Material Moving occupations are much more likely to be actively seeking new work. Specifically, 35 percent of the employed are actively seeking new work, which is about three times more than for occupations overall.
44.0%
51.0%
20.0%
25.0%
30.0%
35.0%
40.0%
45.0%
50.0%
55.0%
Poor Work History Failed Background Check
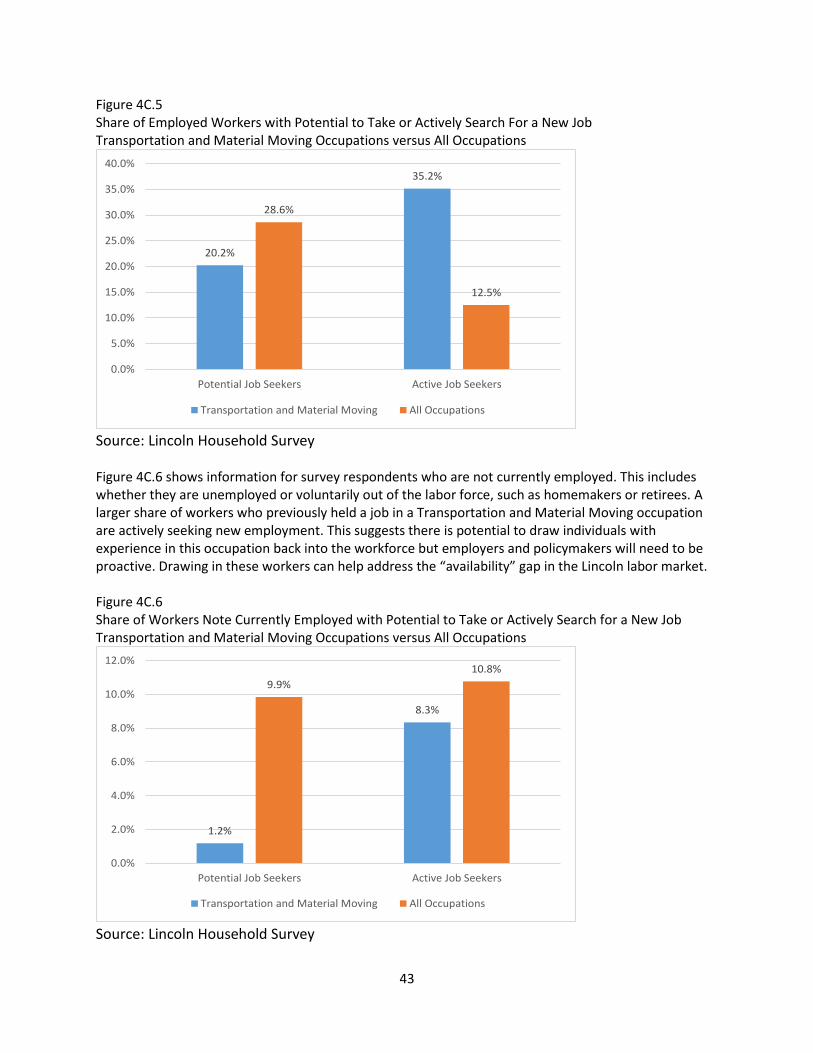
43
Figure 4C.5 Share of Employed Workers with Potential to Take or Actively Search For a New Job Transportation and Material Moving Occupations versus All Occupations
Source: Lincoln Household Survey Figure 4C.6 shows information for survey respondents who are not currently employed. This includes whether they are unemployed or voluntarily out of the labor force, such as homemakers or retirees. A larger share of workers who previously held a job in a Transportation and Material Moving occupation are actively seeking new employment. This suggests there is potential to draw individuals with experience in this occupation back into the workforce but employers and policymakers will need to be proactive. Drawing in these workers can help address the “availability” gap in the Lincoln labor market. Figure 4C.6 Share of Workers Note Currently Employed with Potential to Take or Actively Search for a New Job Transportation and Material Moving Occupations versus All Occupations
Source: Lincoln Household Survey
20.2%
35.2%
28.6%
12.5%
0.0%
5.0%
10.0%
15.0%
20.0%
25.0%
30.0%
35.0%
40.0%
Potential Job Seekers Active Job Seekers
Transportation and Material Moving All Occupations
1.2%
8.3%
9.9%
10.8%
0.0%
2.0%
4.0%
6.0%
8.0%
10.0%
12.0%
Potential Job Seekers Active Job Seekers
Transportation and Material Moving All Occupations
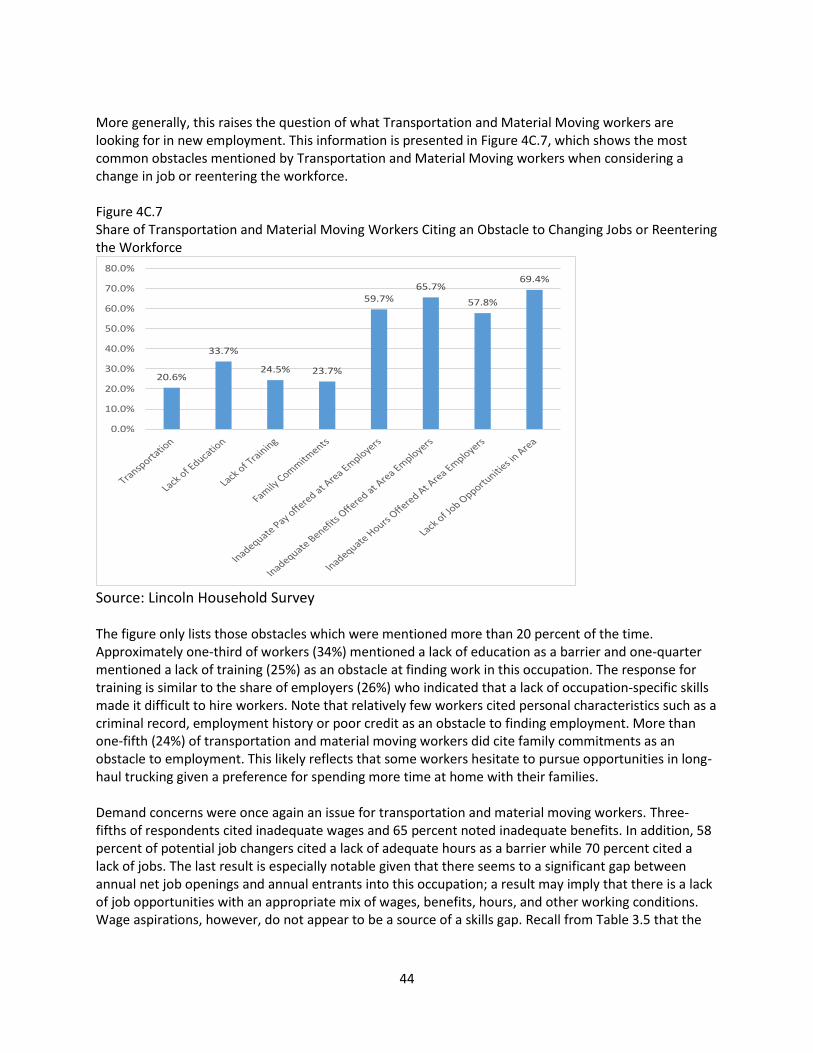
44
More generally, this raises the question of what Transportation and Material Moving workers are looking for in new employment. This information is presented in Figure 4C.7, which shows the most common obstacles mentioned by Transportation and Material Moving workers when considering a change in job or reentering the workforce. Figure 4C.7 Share of Transportation and Material Moving Workers Citing an Obstacle to Changing Jobs or Reentering the Workforce
Source: Lincoln Household Survey The figure only lists those obstacles which were mentioned more than 20 percent of the time. Approximately one-third of workers (34%) mentioned a lack of education as a barrier and one-quarter mentioned a lack of training (25%) as an obstacle at finding work in this occupation. The response for training is similar to the share of employers (26%) who indicated that a lack of occupation-specific skills made it difficult to hire workers. Note that relatively few workers cited personal characteristics such as a criminal record, employment history or poor credit as an obstacle to finding employment. More than one-fifth (24%) of transportation and material moving workers did cite family commitments as an obstacle to employment. This likely reflects that some workers hesitate to pursue opportunities in long-haul trucking given a preference for spending more time at home with their families. Demand concerns were once again an issue for transportation and material moving workers. Three-fifths of respondents cited inadequate wages and 65 percent noted inadequate benefits. In addition, 58 percent of potential job changers cited a lack of adequate hours as a barrier while 70 percent cited a lack of jobs. The last result is especially notable given that there seems to a significant gap between annual net job openings and annual entrants into this occupation; a result may imply that there is a lack of job opportunities with an appropriate mix of wages, benefits, hours, and other working conditions. Wage aspirations, however, do not appear to be a source of a skills gap. Recall from Table 3.5 that the
20.6%
33.7%
24.5% 23.7%
59.7%65.7%
57.8%
69.4%
0.0%
10.0%
20.0%
30.0%
40.0%
50.0%
60.0%
70.0%
80.0%
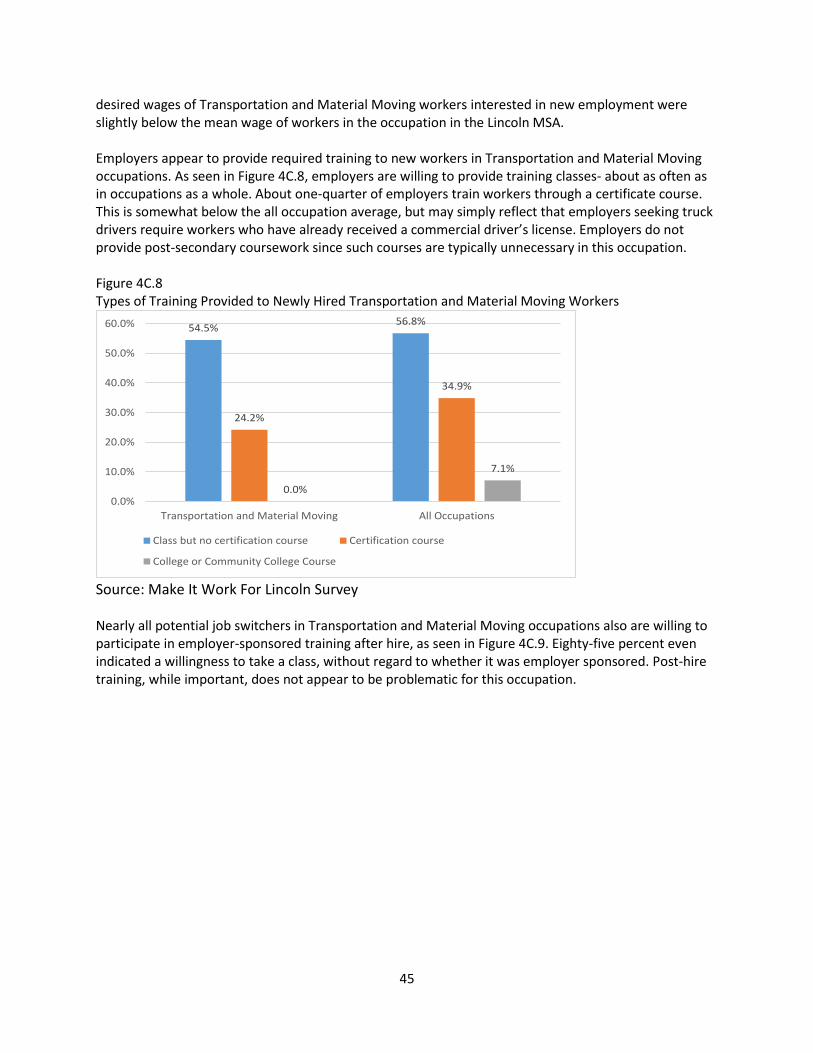
45
desired wages of Transportation and Material Moving workers interested in new employment were slightly below the mean wage of workers in the occupation in the Lincoln MSA. Employers appear to provide required training to new workers in Transportation and Material Moving occupations. As seen in Figure 4C.8, employers are willing to provide training classes- about as often as in occupations as a whole. About one-quarter of employers train workers through a certificate course. This is somewhat below the all occupation average, but may simply reflect that employers seeking truck drivers require workers who have already received a commercial driver’s license. Employers do not provide post-secondary coursework since such courses are typically unnecessary in this occupation. Figure 4C.8 Types of Training Provided to Newly Hired Transportation and Material Moving Workers
Source: Make It Work For Lincoln Survey Nearly all potential job switchers in Transportation and Material Moving occupations also are willing to participate in employer-sponsored training after hire, as seen in Figure 4C.9. Eighty-five percent even indicated a willingness to take a class, without regard to whether it was employer sponsored. Post-hire training, while important, does not appear to be problematic for this occupation.
54.5%56.8%
24.2%
34.9%
0.0%
7.1%
0.0%
10.0%
20.0%
30.0%
40.0%
50.0%
60.0%
Transportation and Material Moving All Occupations
Class but no certification course Certification course
College or Community College Course
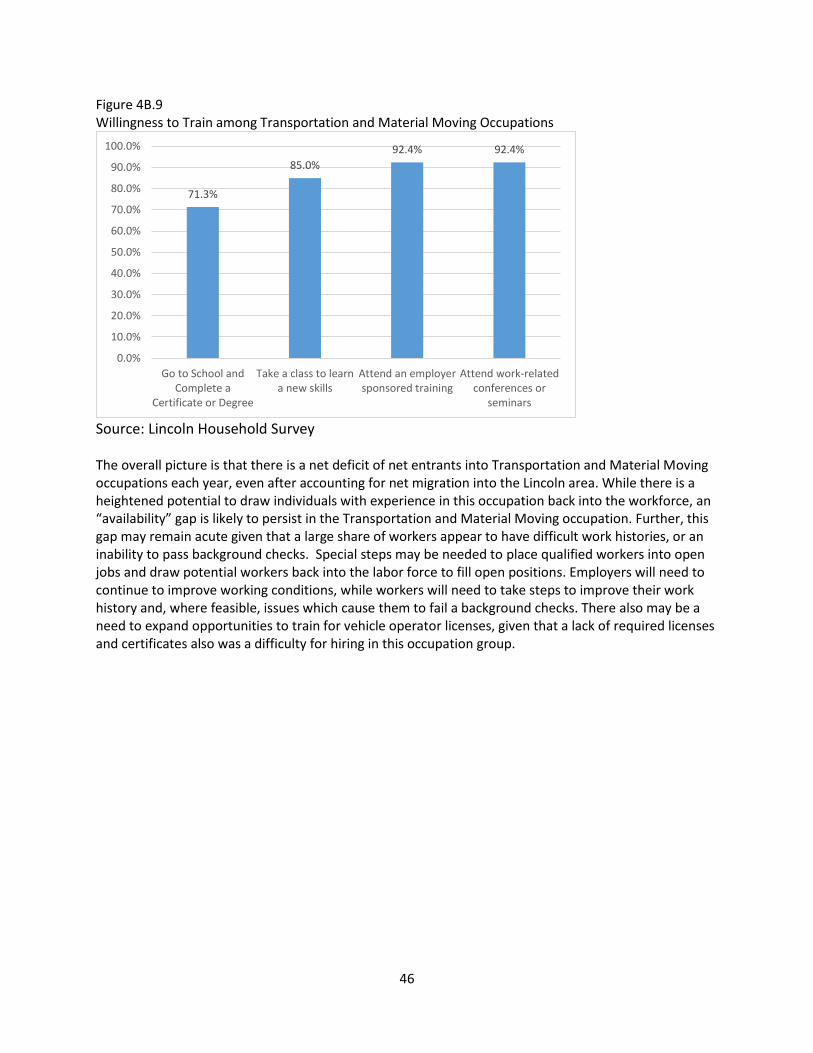
46
Figure 4B.9 Willingness to Train among Transportation and Material Moving Occupations
Source: Lincoln Household Survey The overall picture is that there is a net deficit of net entrants into Transportation and Material Moving occupations each year, even after accounting for net migration into the Lincoln area. While there is a heightened potential to draw individuals with experience in this occupation back into the workforce, an “availability” gap is likely to persist in the Transportation and Material Moving occupation. Further, this gap may remain acute given that a large share of workers appear to have difficult work histories, or an inability to pass background checks. Special steps may be needed to place qualified workers into open jobs and draw potential workers back into the labor force to fill open positions. Employers will need to continue to improve working conditions, while workers will need to take steps to improve their work history and, where feasible, issues which cause them to fail a background checks. There also may be a need to expand opportunities to train for vehicle operator licenses, given that a lack of required licenses and certificates also was a difficulty for hiring in this occupation group.
71.3%
85.0%
92.4% 92.4%
0.0%
10.0%
20.0%
30.0%
40.0%
50.0%
60.0%
70.0%
80.0%
90.0%
100.0%
Go to School andComplete a
Certificate or Degree
Take a class to learna new skills
Attend an employersponsored training
Attend work-relatedconferences or
seminars

47
D. Construction and Extraction (SOC CODE 47)
This occupation contains workers employed in the construction trade or in the operating, driving and maneuvering of heavy construction machinery. Lincoln employers were fourth most likely to say that it is difficult to hire workers in this occupation. As seen in Figure 4D.1 below, just over three in four employers indicated that it was difficult to hire workers in the Construction and Extraction occupation, compared to 62.5 percent for all occupations.
Figure 4D.1 Percent of Employers Indicating It is Difficult to Hire, Construction and Extraction Occupations
Source: Make It Work For Lincoln Survey Table 4D.2 displays responses by Lincoln employers on why it was difficult to hire Construction and Extraction workers. There is a broad group of challenges for this occupation group. Employers are concerned about the experience and skill of applicants as well as their background and history. Sixty-eight percent of employers indicated that a lack of work experience was a barrier to hiring workers in this occupations and 62 percent cited a lack of occupation-specific skills. These percentages are seven to ten percentage points higher than the all occupation average. In addition, 62 percent of employers indicated that applicants with a poor work history made it difficult to hire; this is well above average and the fourth highest rate among any occupation group. Background checks were mentioned 35 percent of the time.
77.3%
62.5%
0.0%
10.0%
20.0%
30.0%
40.0%
50.0%
60.0%
70.0%
80.0%
90.0%
Construction and Extraction All Occupations
Percent of Employers Indicating It Is Difficult to Hire Construction and Extraction Workers
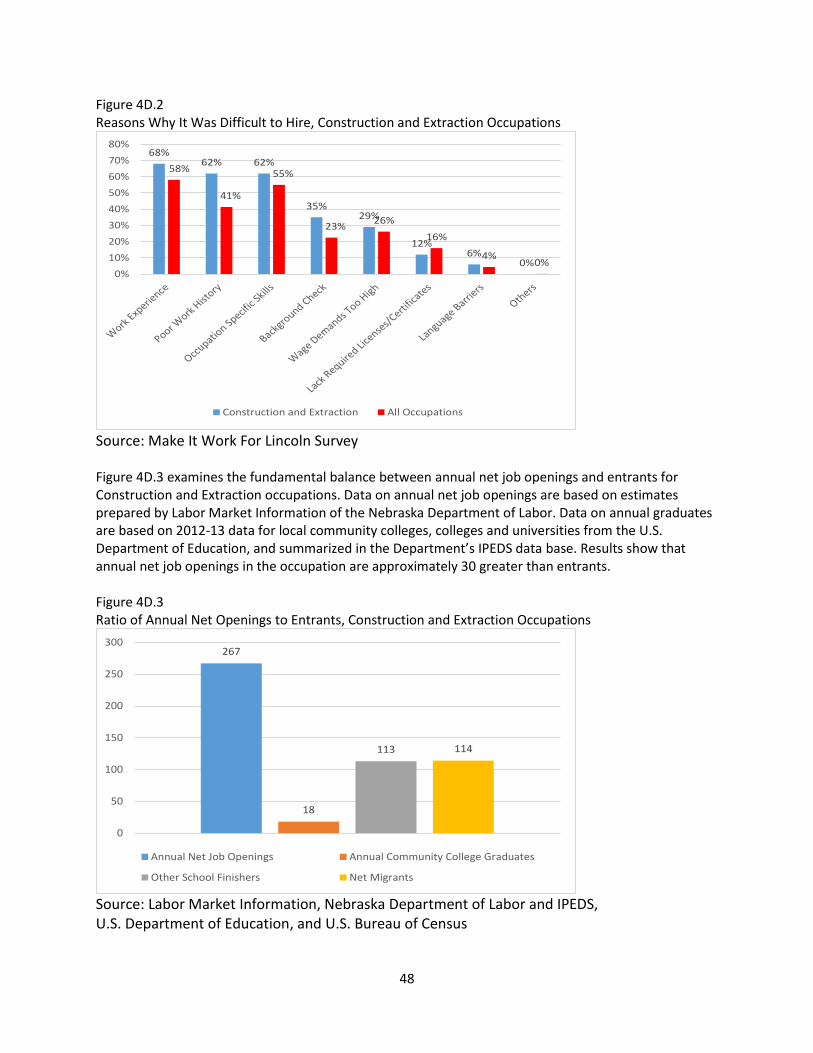
48
Figure 4D.2 Reasons Why It Was Difficult to Hire, Construction and Extraction Occupations
Source: Make It Work For Lincoln Survey Figure 4D.3 examines the fundamental balance between annual net job openings and entrants for Construction and Extraction occupations. Data on annual net job openings are based on estimates prepared by Labor Market Information of the Nebraska Department of Labor. Data on annual graduates are based on 2012-13 data for local community colleges, colleges and universities from the U.S. Department of Education, and summarized in the Department’s IPEDS data base. Results show that annual net job openings in the occupation are approximately 30 greater than entrants. Figure 4D.3 Ratio of Annual Net Openings to Entrants, Construction and Extraction Occupations
Source: Labor Market Information, Nebraska Department of Labor and IPEDS, U.S. Department of Education, and U.S. Bureau of Census
68%62% 62%
35%29%
12%6%
0%
58%
41%
55%
23%26%
16%
4%0%
0%
10%
20%
30%
40%
50%
60%
70%
80%
Construction and Extraction All Occupations
267
18
113 114
0
50
100
150
200
250
300
Annual Net Job Openings Annual Community College Graduates
Other School Finishers Net Migrants
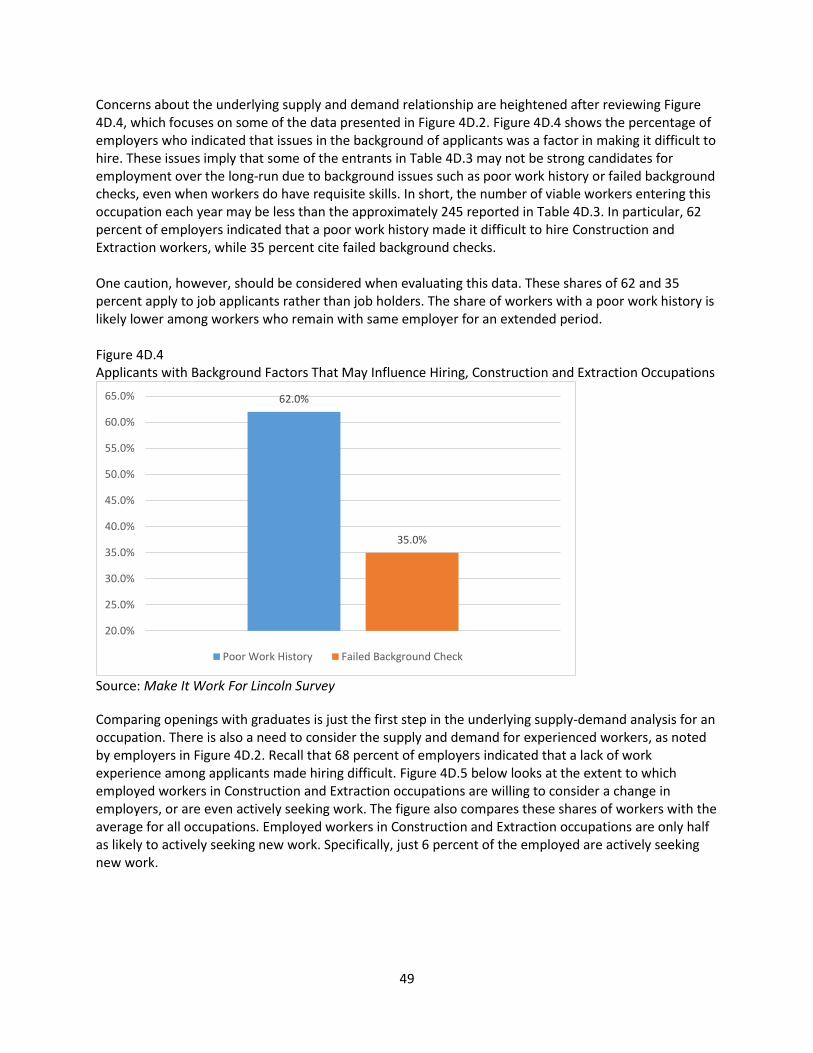
49
Concerns about the underlying supply and demand relationship are heightened after reviewing Figure 4D.4, which focuses on some of the data presented in Figure 4D.2. Figure 4D.4 shows the percentage of employers who indicated that issues in the background of applicants was a factor in making it difficult to hire. These issues imply that some of the entrants in Table 4D.3 may not be strong candidates for employment over the long-run due to background issues such as poor work history or failed background checks, even when workers do have requisite skills. In short, the number of viable workers entering this occupation each year may be less than the approximately 245 reported in Table 4D.3. In particular, 62 percent of employers indicated that a poor work history made it difficult to hire Construction and Extraction workers, while 35 percent cite failed background checks. One caution, however, should be considered when evaluating this data. These shares of 62 and 35 percent apply to job applicants rather than job holders. The share of workers with a poor work history is likely lower among workers who remain with same employer for an extended period. Figure 4D.4 Applicants with Background Factors That May Influence Hiring, Construction and Extraction Occupations
Source: Make It Work For Lincoln Survey
Comparing openings with graduates is just the first step in the underlying supply-demand analysis for an occupation. There is also a need to consider the supply and demand for experienced workers, as noted by employers in Figure 4D.2. Recall that 68 percent of employers indicated that a lack of work experience among applicants made hiring difficult. Figure 4D.5 below looks at the extent to which employed workers in Construction and Extraction occupations are willing to consider a change in employers, or are even actively seeking work. The figure also compares these shares of workers with the average for all occupations. Employed workers in Construction and Extraction occupations are only half as likely to actively seeking new work. Specifically, just 6 percent of the employed are actively seeking new work.
62.0%
35.0%
20.0%
25.0%
30.0%
35.0%
40.0%
45.0%
50.0%
55.0%
60.0%
65.0%
Poor Work History Failed Background Check
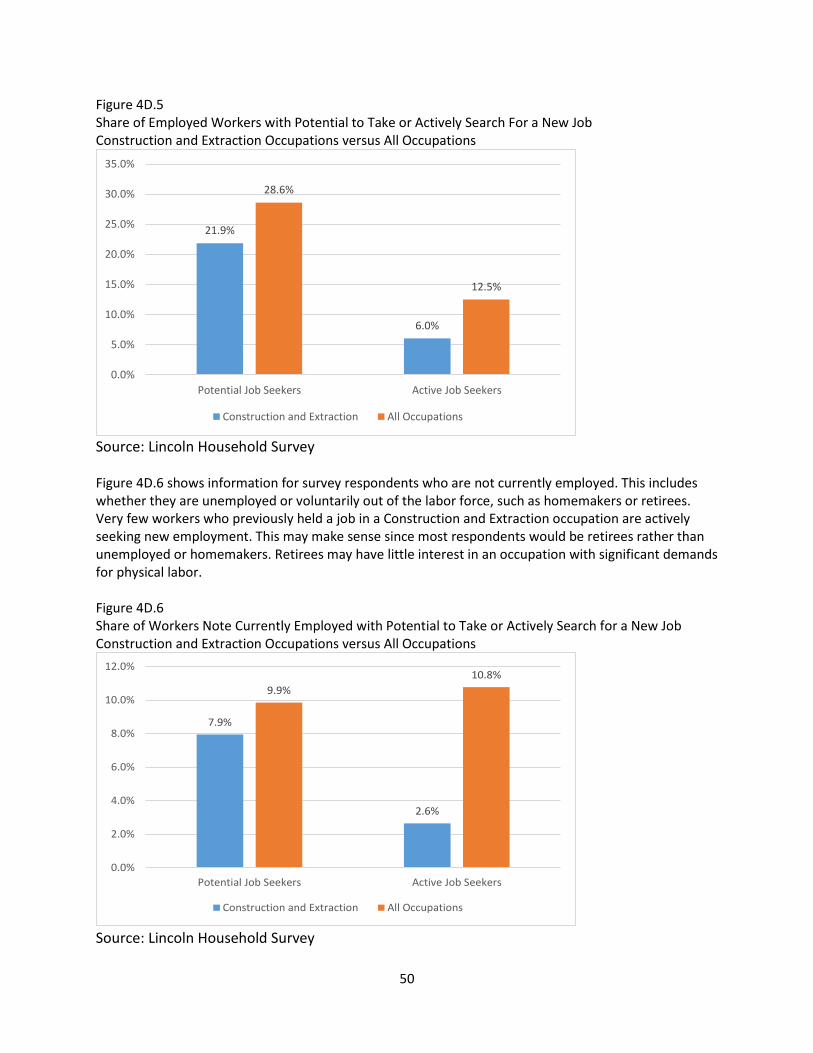
50
Figure 4D.5 Share of Employed Workers with Potential to Take or Actively Search For a New Job Construction and Extraction Occupations versus All Occupations
Source: Lincoln Household Survey Figure 4D.6 shows information for survey respondents who are not currently employed. This includes whether they are unemployed or voluntarily out of the labor force, such as homemakers or retirees. Very few workers who previously held a job in a Construction and Extraction occupation are actively seeking new employment. This may make sense since most respondents would be retirees rather than unemployed or homemakers. Retirees may have little interest in an occupation with significant demands for physical labor. Figure 4D.6 Share of Workers Note Currently Employed with Potential to Take or Actively Search for a New Job Construction and Extraction Occupations versus All Occupations
Source: Lincoln Household Survey
21.9%
6.0%
28.6%
12.5%
0.0%
5.0%
10.0%
15.0%
20.0%
25.0%
30.0%
35.0%
Potential Job Seekers Active Job Seekers
Construction and Extraction All Occupations
7.9%
2.6%
9.9%
10.8%
0.0%
2.0%
4.0%
6.0%
8.0%
10.0%
12.0%
Potential Job Seekers Active Job Seekers
Construction and Extraction All Occupations
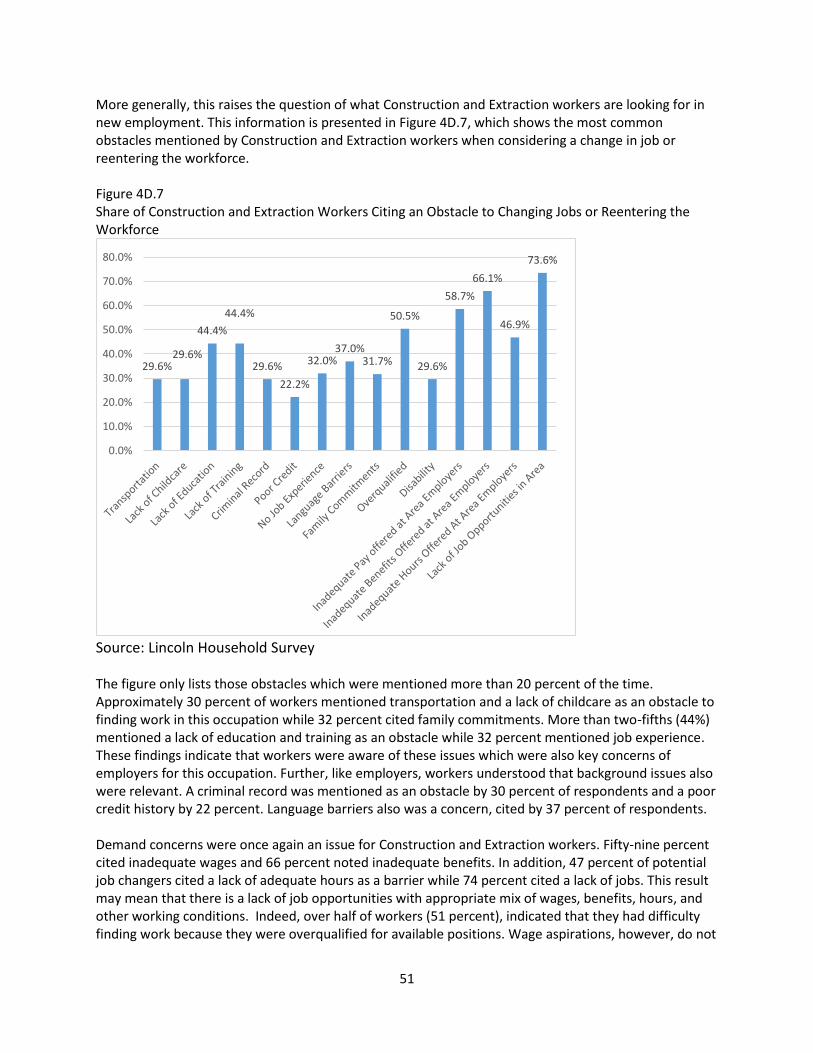
51
More generally, this raises the question of what Construction and Extraction workers are looking for in new employment. This information is presented in Figure 4D.7, which shows the most common obstacles mentioned by Construction and Extraction workers when considering a change in job or reentering the workforce. Figure 4D.7 Share of Construction and Extraction Workers Citing an Obstacle to Changing Jobs or Reentering the Workforce
Source: Lincoln Household Survey The figure only lists those obstacles which were mentioned more than 20 percent of the time. Approximately 30 percent of workers mentioned transportation and a lack of childcare as an obstacle to finding work in this occupation while 32 percent cited family commitments. More than two-fifths (44%) mentioned a lack of education and training as an obstacle while 32 percent mentioned job experience. These findings indicate that workers were aware of these issues which were also key concerns of employers for this occupation. Further, like employers, workers understood that background issues also were relevant. A criminal record was mentioned as an obstacle by 30 percent of respondents and a poor credit history by 22 percent. Language barriers also was a concern, cited by 37 percent of respondents. Demand concerns were once again an issue for Construction and Extraction workers. Fifty-nine percent cited inadequate wages and 66 percent noted inadequate benefits. In addition, 47 percent of potential job changers cited a lack of adequate hours as a barrier while 74 percent cited a lack of jobs. This result may mean that there is a lack of job opportunities with appropriate mix of wages, benefits, hours, and other working conditions. Indeed, over half of workers (51 percent), indicated that they had difficulty finding work because they were overqualified for available positions. Wage aspirations, however, do not
29.6%29.6%
44.4%
44.4%
29.6%
22.2%
32.0%37.0%
31.7%
50.5%
29.6%
58.7%
66.1%
46.9%
73.6%
0.0%
10.0%
20.0%
30.0%
40.0%
50.0%
60.0%
70.0%
80.0%
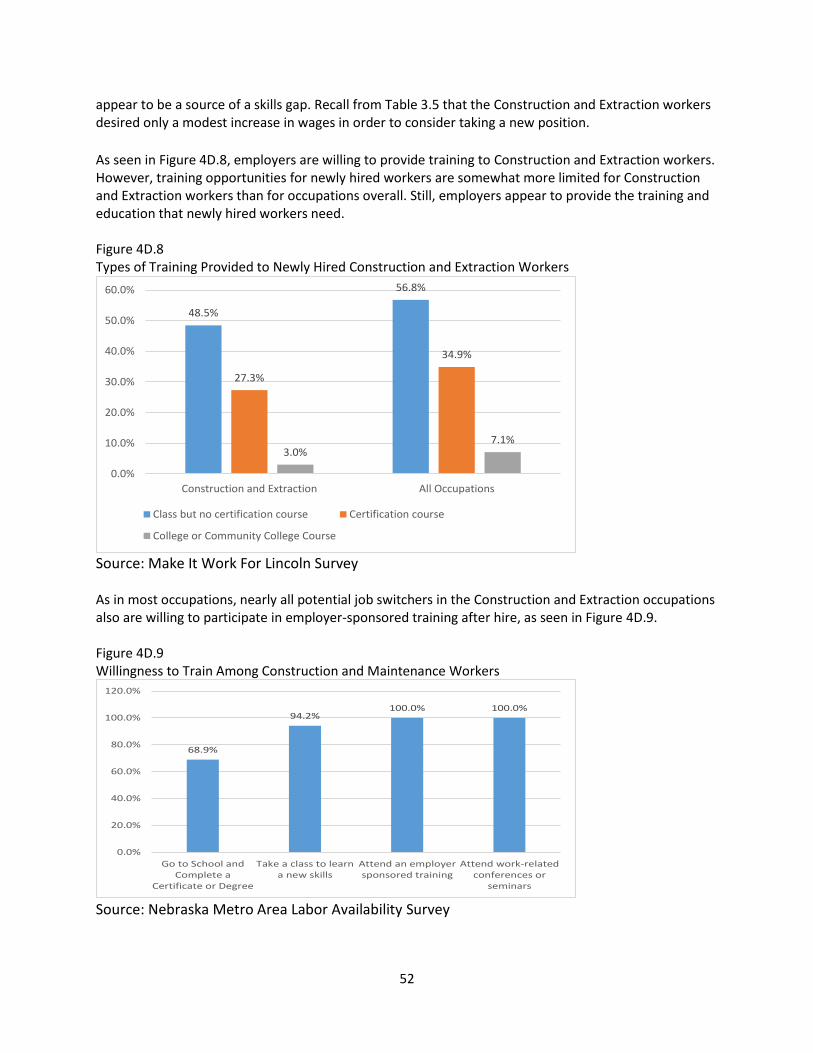
52
appear to be a source of a skills gap. Recall from Table 3.5 that the Construction and Extraction workers desired only a modest increase in wages in order to consider taking a new position. As seen in Figure 4D.8, employers are willing to provide training to Construction and Extraction workers. However, training opportunities for newly hired workers are somewhat more limited for Construction and Extraction workers than for occupations overall. Still, employers appear to provide the training and education that newly hired workers need. Figure 4D.8 Types of Training Provided to Newly Hired Construction and Extraction Workers
Source: Make It Work For Lincoln Survey As in most occupations, nearly all potential job switchers in the Construction and Extraction occupations also are willing to participate in employer-sponsored training after hire, as seen in Figure 4D.9. Figure 4D.9 Willingness to Train Among Construction and Maintenance Workers
Source: Nebraska Metro Area Labor Availability Survey
48.5%
56.8%
27.3%
34.9%
3.0%7.1%
0.0%
10.0%
20.0%
30.0%
40.0%
50.0%
60.0%
Construction and Extraction All Occupations
Class but no certification course Certification course
College or Community College Course
68.9%
94.2%100.0% 100.0%
0.0%
20.0%
40.0%
60.0%
80.0%
100.0%
120.0%
Go to School andComplete a
Certificate or Degree
Take a class to learna new skills
Attend an employersponsored training
Attend work-relatedconferences or
seminars
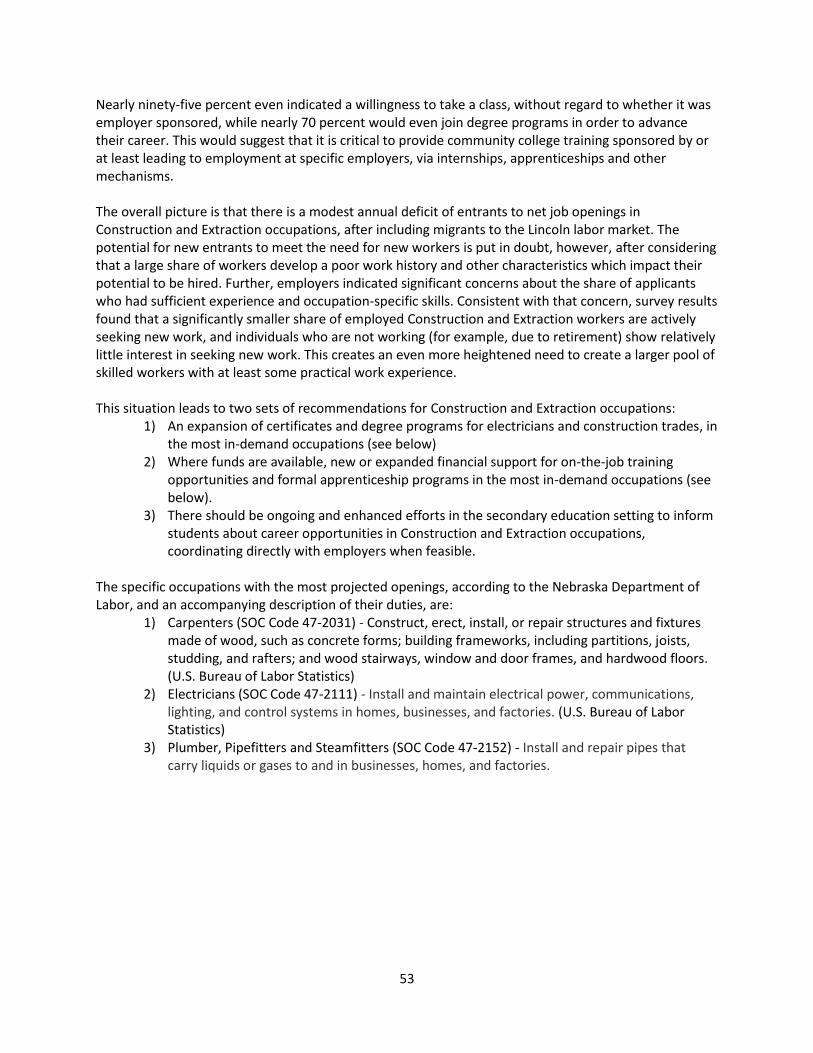
53
Nearly ninety-five percent even indicated a willingness to take a class, without regard to whether it was employer sponsored, while nearly 70 percent would even join degree programs in order to advance their career. This would suggest that it is critical to provide community college training sponsored by or at least leading to employment at specific employers, via internships, apprenticeships and other mechanisms. The overall picture is that there is a modest annual deficit of entrants to net job openings in Construction and Extraction occupations, after including migrants to the Lincoln labor market. The potential for new entrants to meet the need for new workers is put in doubt, however, after considering that a large share of workers develop a poor work history and other characteristics which impact their potential to be hired. Further, employers indicated significant concerns about the share of applicants who had sufficient experience and occupation-specific skills. Consistent with that concern, survey results found that a significantly smaller share of employed Construction and Extraction workers are actively seeking new work, and individuals who are not working (for example, due to retirement) show relatively little interest in seeking new work. This creates an even more heightened need to create a larger pool of skilled workers with at least some practical work experience. This situation leads to two sets of recommendations for Construction and Extraction occupations:
1) An expansion of certificates and degree programs for electricians and construction trades, in the most in-demand occupations (see below)
2) Where funds are available, new or expanded financial support for on-the-job training opportunities and formal apprenticeship programs in the most in-demand occupations (see below).
3) There should be ongoing and enhanced efforts in the secondary education setting to inform students about career opportunities in Construction and Extraction occupations, coordinating directly with employers when feasible.
The specific occupations with the most projected openings, according to the Nebraska Department of Labor, and an accompanying description of their duties, are:
1) Carpenters (SOC Code 47-2031) - Construct, erect, install, or repair structures and fixtures made of wood, such as concrete forms; building frameworks, including partitions, joists, studding, and rafters; and wood stairways, window and door frames, and hardwood floors. (U.S. Bureau of Labor Statistics)
2) Electricians (SOC Code 47-2111) - Install and maintain electrical power, communications, lighting, and control systems in homes, businesses, and factories. (U.S. Bureau of Labor Statistics)
3) Plumber, Pipefitters and Steamfitters (SOC Code 47-2152) - Install and repair pipes that carry liquids or gases to and in businesses, homes, and factories.
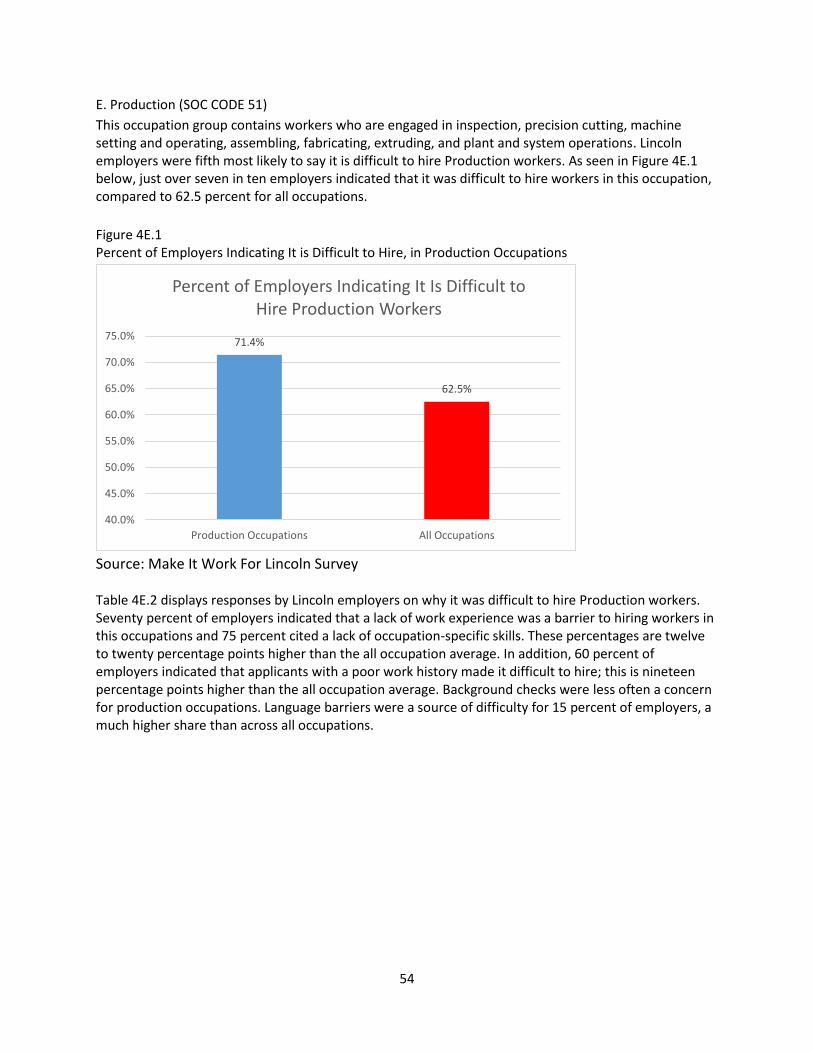
54
E. Production (SOC CODE 51)
This occupation group contains workers who are engaged in inspection, precision cutting, machine setting and operating, assembling, fabricating, extruding, and plant and system operations. Lincoln employers were fifth most likely to say it is difficult to hire Production workers. As seen in Figure 4E.1 below, just over seven in ten employers indicated that it was difficult to hire workers in this occupation, compared to 62.5 percent for all occupations.
Figure 4E.1 Percent of Employers Indicating It is Difficult to Hire, in Production Occupations
Source: Make It Work For Lincoln Survey Table 4E.2 displays responses by Lincoln employers on why it was difficult to hire Production workers. Seventy percent of employers indicated that a lack of work experience was a barrier to hiring workers in this occupations and 75 percent cited a lack of occupation-specific skills. These percentages are twelve to twenty percentage points higher than the all occupation average. In addition, 60 percent of employers indicated that applicants with a poor work history made it difficult to hire; this is nineteen percentage points higher than the all occupation average. Background checks were less often a concern for production occupations. Language barriers were a source of difficulty for 15 percent of employers, a much higher share than across all occupations.
71.4%
62.5%
40.0%
45.0%
50.0%
55.0%
60.0%
65.0%
70.0%
75.0%
Production Occupations All Occupations
Percent of Employers Indicating It Is Difficult to Hire Production Workers
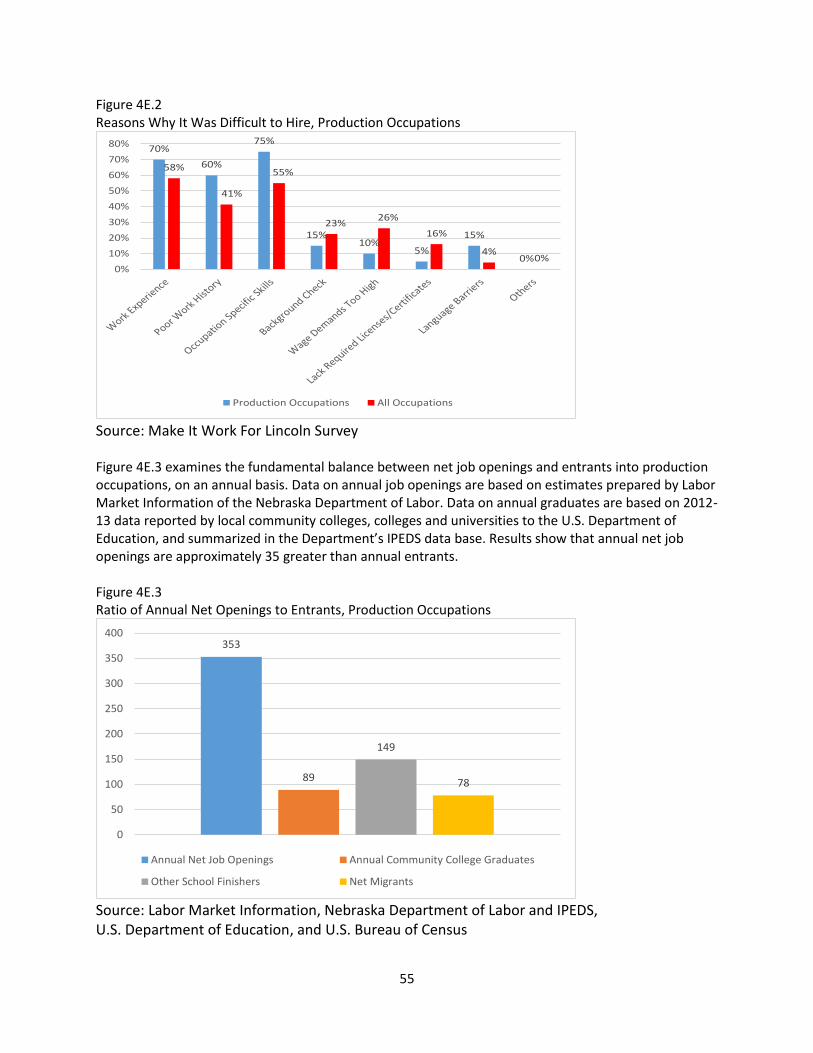
55
Figure 4E.2 Reasons Why It Was Difficult to Hire, Production Occupations
Source: Make It Work For Lincoln Survey Figure 4E.3 examines the fundamental balance between net job openings and entrants into production occupations, on an annual basis. Data on annual job openings are based on estimates prepared by Labor Market Information of the Nebraska Department of Labor. Data on annual graduates are based on 2012-13 data reported by local community colleges, colleges and universities to the U.S. Department of Education, and summarized in the Department’s IPEDS data base. Results show that annual net job openings are approximately 35 greater than annual entrants. Figure 4E.3 Ratio of Annual Net Openings to Entrants, Production Occupations
Source: Labor Market Information, Nebraska Department of Labor and IPEDS, U.S. Department of Education, and U.S. Bureau of Census
70%
60%
75%
15%10%
5%
15%
0%
58%
41%
55%
23%26%
16%
4%0%
0%
10%
20%
30%
40%
50%
60%
70%
80%
Production Occupations All Occupations
353
89
149
78
0
50
100
150
200
250
300
350
400
Annual Net Job Openings Annual Community College Graduates
Other School Finishers Net Migrants
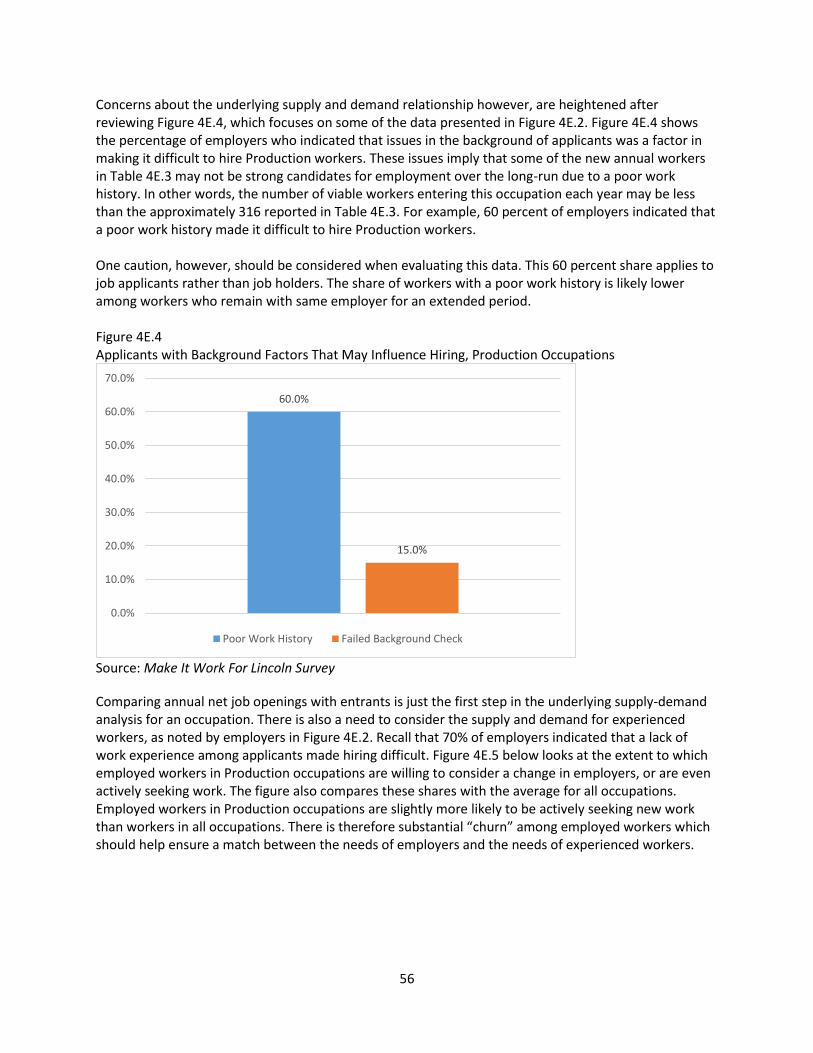
56
Concerns about the underlying supply and demand relationship however, are heightened after reviewing Figure 4E.4, which focuses on some of the data presented in Figure 4E.2. Figure 4E.4 shows the percentage of employers who indicated that issues in the background of applicants was a factor in making it difficult to hire Production workers. These issues imply that some of the new annual workers in Table 4E.3 may not be strong candidates for employment over the long-run due to a poor work history. In other words, the number of viable workers entering this occupation each year may be less than the approximately 316 reported in Table 4E.3. For example, 60 percent of employers indicated that a poor work history made it difficult to hire Production workers. One caution, however, should be considered when evaluating this data. This 60 percent share applies to job applicants rather than job holders. The share of workers with a poor work history is likely lower among workers who remain with same employer for an extended period. Figure 4E.4 Applicants with Background Factors That May Influence Hiring, Production Occupations
Source: Make It Work For Lincoln Survey
Comparing annual net job openings with entrants is just the first step in the underlying supply-demand analysis for an occupation. There is also a need to consider the supply and demand for experienced workers, as noted by employers in Figure 4E.2. Recall that 70% of employers indicated that a lack of work experience among applicants made hiring difficult. Figure 4E.5 below looks at the extent to which employed workers in Production occupations are willing to consider a change in employers, or are even actively seeking work. The figure also compares these shares with the average for all occupations. Employed workers in Production occupations are slightly more likely to be actively seeking new work than workers in all occupations. There is therefore substantial “churn” among employed workers which should help ensure a match between the needs of employers and the needs of experienced workers.
60.0%
15.0%
0.0%
10.0%
20.0%
30.0%
40.0%
50.0%
60.0%
70.0%
Poor Work History Failed Background Check
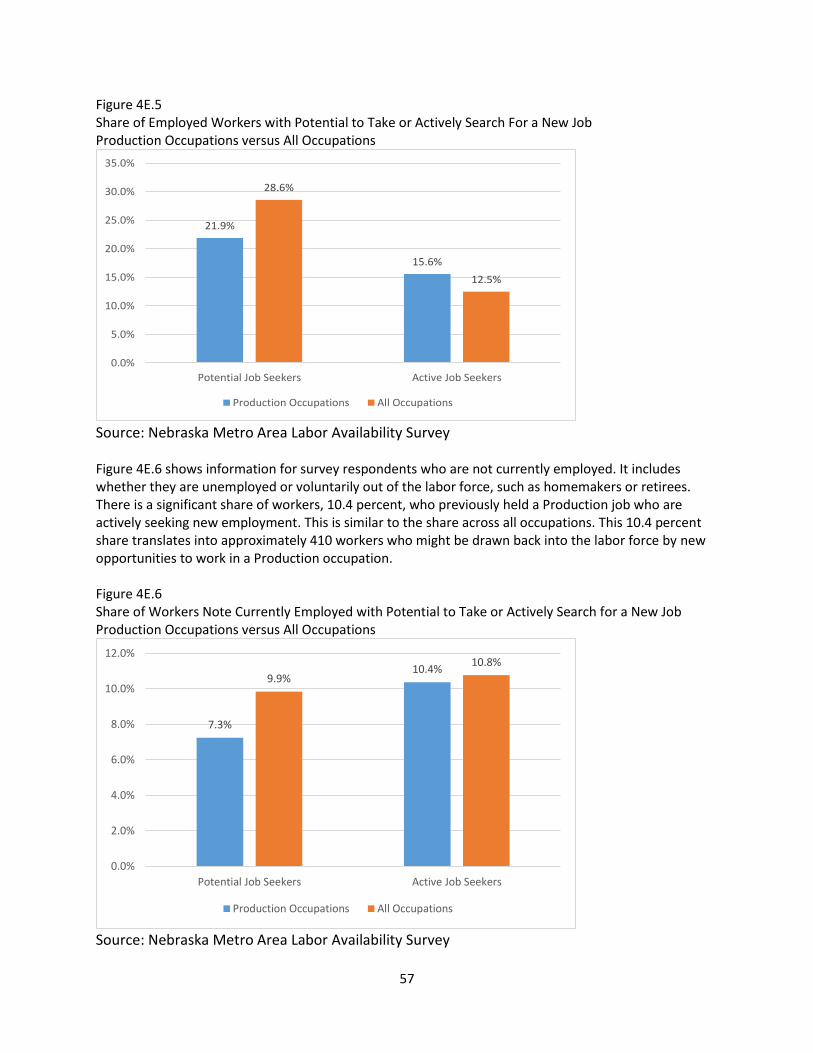
57
Figure 4E.5 Share of Employed Workers with Potential to Take or Actively Search For a New Job Production Occupations versus All Occupations
Source: Nebraska Metro Area Labor Availability Survey Figure 4E.6 shows information for survey respondents who are not currently employed. It includes whether they are unemployed or voluntarily out of the labor force, such as homemakers or retirees. There is a significant share of workers, 10.4 percent, who previously held a Production job who are actively seeking new employment. This is similar to the share across all occupations. This 10.4 percent share translates into approximately 410 workers who might be drawn back into the labor force by new opportunities to work in a Production occupation. Figure 4E.6 Share of Workers Note Currently Employed with Potential to Take or Actively Search for a New Job Production Occupations versus All Occupations
Source: Nebraska Metro Area Labor Availability Survey
21.9%
15.6%
28.6%
12.5%
0.0%
5.0%
10.0%
15.0%
20.0%
25.0%
30.0%
35.0%
Potential Job Seekers Active Job Seekers
Production Occupations All Occupations
7.3%
10.4%9.9%
10.8%
0.0%
2.0%
4.0%
6.0%
8.0%
10.0%
12.0%
Potential Job Seekers Active Job Seekers
Production Occupations All Occupations
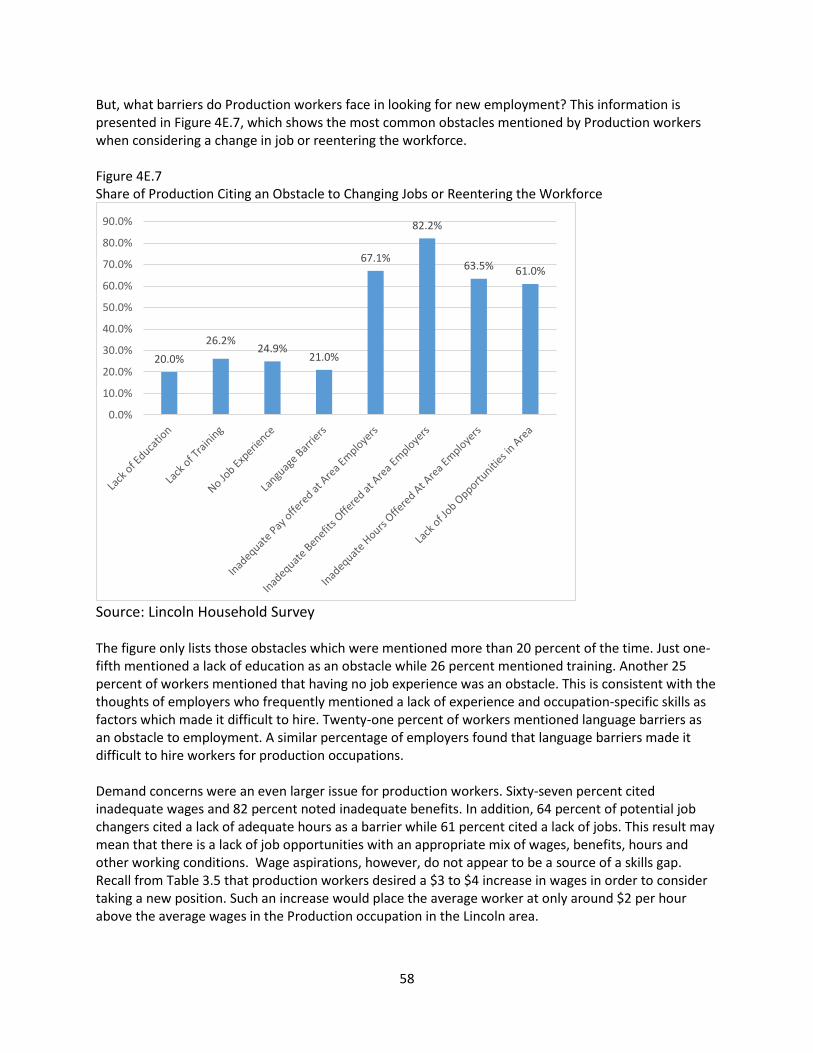
58
But, what barriers do Production workers face in looking for new employment? This information is presented in Figure 4E.7, which shows the most common obstacles mentioned by Production workers when considering a change in job or reentering the workforce. Figure 4E.7 Share of Production Citing an Obstacle to Changing Jobs or Reentering the Workforce
Source: Lincoln Household Survey The figure only lists those obstacles which were mentioned more than 20 percent of the time. Just one-fifth mentioned a lack of education as an obstacle while 26 percent mentioned training. Another 25 percent of workers mentioned that having no job experience was an obstacle. This is consistent with the thoughts of employers who frequently mentioned a lack of experience and occupation-specific skills as factors which made it difficult to hire. Twenty-one percent of workers mentioned language barriers as an obstacle to employment. A similar percentage of employers found that language barriers made it difficult to hire workers for production occupations. Demand concerns were an even larger issue for production workers. Sixty-seven percent cited inadequate wages and 82 percent noted inadequate benefits. In addition, 64 percent of potential job changers cited a lack of adequate hours as a barrier while 61 percent cited a lack of jobs. This result may mean that there is a lack of job opportunities with an appropriate mix of wages, benefits, hours and other working conditions. Wage aspirations, however, do not appear to be a source of a skills gap. Recall from Table 3.5 that production workers desired a $3 to $4 increase in wages in order to consider taking a new position. Such an increase would place the average worker at only around $2 per hour above the average wages in the Production occupation in the Lincoln area.
20.0%
26.2%24.9%
21.0%
67.1%
82.2%
63.5% 61.0%
0.0%
10.0%
20.0%
30.0%
40.0%
50.0%
60.0%
70.0%
80.0%
90.0%
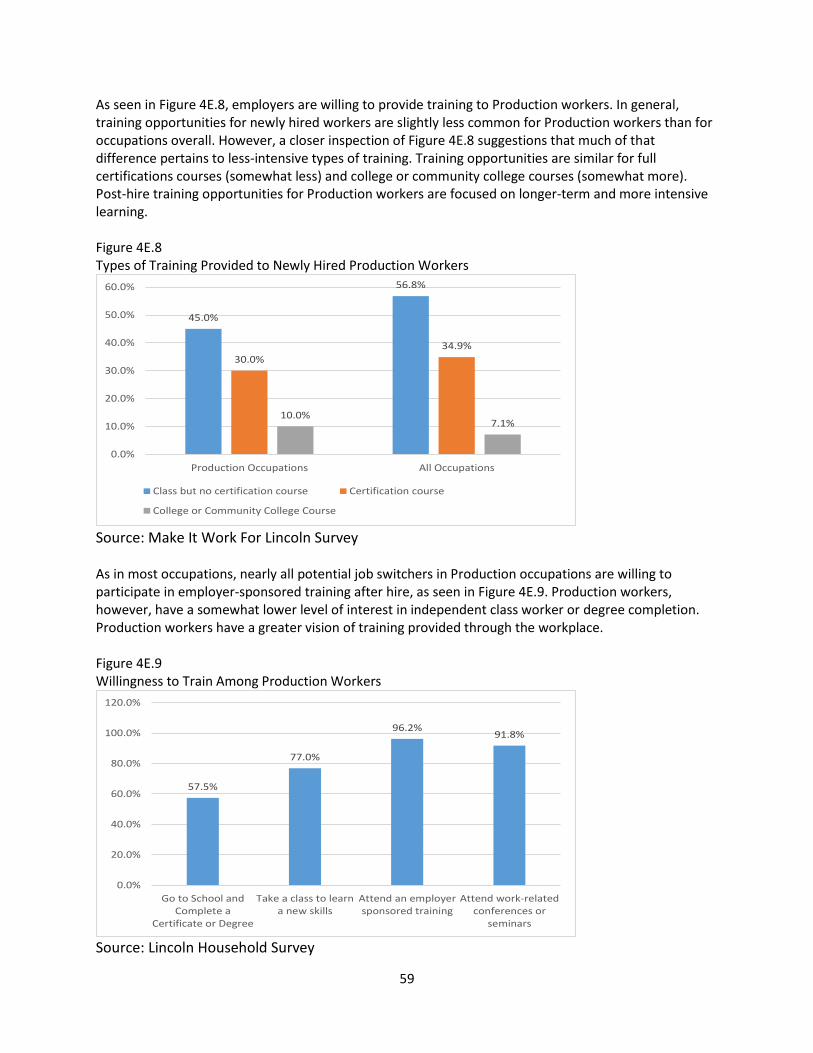
59
As seen in Figure 4E.8, employers are willing to provide training to Production workers. In general, training opportunities for newly hired workers are slightly less common for Production workers than for occupations overall. However, a closer inspection of Figure 4E.8 suggestions that much of that difference pertains to less-intensive types of training. Training opportunities are similar for full certifications courses (somewhat less) and college or community college courses (somewhat more). Post-hire training opportunities for Production workers are focused on longer-term and more intensive learning. Figure 4E.8 Types of Training Provided to Newly Hired Production Workers
Source: Make It Work For Lincoln Survey As in most occupations, nearly all potential job switchers in Production occupations are willing to participate in employer-sponsored training after hire, as seen in Figure 4E.9. Production workers, however, have a somewhat lower level of interest in independent class worker or degree completion. Production workers have a greater vision of training provided through the workplace. Figure 4E.9 Willingness to Train Among Production Workers
Source: Lincoln Household Survey
45.0%
56.8%
30.0%
34.9%
10.0%7.1%
0.0%
10.0%
20.0%
30.0%
40.0%
50.0%
60.0%
Production Occupations All Occupations
Class but no certification course Certification course
College or Community College Course
57.5%
77.0%
96.2%91.8%
0.0%
20.0%
40.0%
60.0%
80.0%
100.0%
120.0%
Go to School andComplete a
Certificate or Degree
Take a class to learna new skills
Attend an employersponsored training
Attend work-relatedconferences or
seminars
60
The overall picture once again is that there is a deficit of annual entrants relative to net job openings for Production occupations, even after considering migrants to the Lincoln labor market. Further, the potential for new entrants to meet the need for workers is even greater doubt after considering that a large share of workers develop a poor work history which impacts their potential to be hired. On the positive side, there appears to be significant “churn” among employed workers in Production occupations, suggesting that there is ongoing improvement in the match between workers and employers. This situation leads to four sets of recommendations for Production occupations:
1) There should be a selected expansion of certificate and degree programs for production workers, especially in the most in-demand occupations (see below)
2) There should be expanded internship, registered apprenticeship programs and incentives for firms to hire new workers in these in-demand occupations, in order to address firms concerns with inexperienced workers.
3) Firms should further emphasize training programs to identify experienced, existing workers that are willing to train for in-demand Production occupations.
4) There should be ongoing and enhanced efforts in the secondary education setting to inform students about career opportunities in Production occupations, coordinating directly with employers when feasible.
We do not recommend specific training programs, other than on-the-job-training, for several of the most in demand production occupations; specifically, production helpers, team assemblers, and meat cutters and trimmers. However, training programs, degree programs, internship and apprenticeships should be encouraged in several other in demand Production occupations. These occupations, and an accompanying description of their duties, are:
1) Machinist (SOC Code 51-4041) - Set up and operate a variety of machine tools to produce precision parts and instruments. Includes precision instrument makers who fabricate, modify, or repair mechanical instruments. (U.S. Bureau of Labor Statistics)
2) Welders, Cutters, Solderers and Brazers (SOC Code 51-4121) - weld or join metal parts and fill holes, indentions, or seams of metal products, using hand-held metal joining equipment (U.S. Bureau of Labor Statistics)
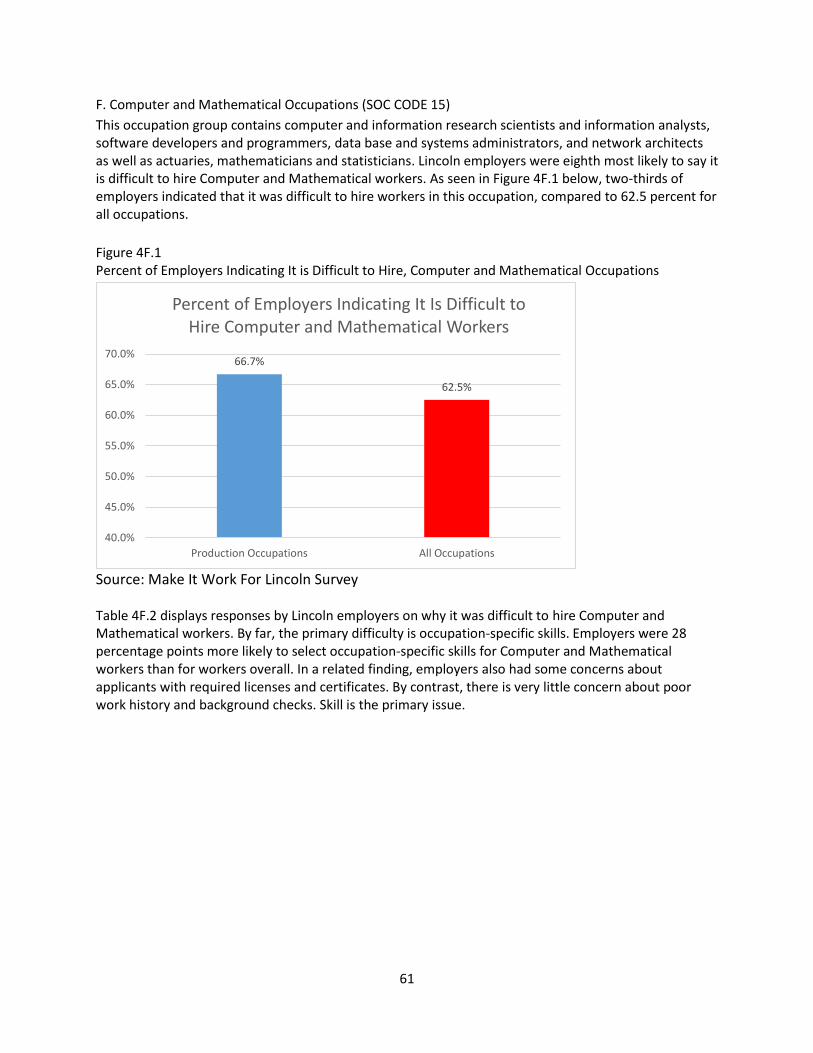
61
F. Computer and Mathematical Occupations (SOC CODE 15)
This occupation group contains computer and information research scientists and information analysts, software developers and programmers, data base and systems administrators, and network architects as well as actuaries, mathematicians and statisticians. Lincoln employers were eighth most likely to say it is difficult to hire Computer and Mathematical workers. As seen in Figure 4F.1 below, two-thirds of employers indicated that it was difficult to hire workers in this occupation, compared to 62.5 percent for all occupations.
Figure 4F.1 Percent of Employers Indicating It is Difficult to Hire, Computer and Mathematical Occupations
Source: Make It Work For Lincoln Survey Table 4F.2 displays responses by Lincoln employers on why it was difficult to hire Computer and Mathematical workers. By far, the primary difficulty is occupation-specific skills. Employers were 28 percentage points more likely to select occupation-specific skills for Computer and Mathematical workers than for workers overall. In a related finding, employers also had some concerns about applicants with required licenses and certificates. By contrast, there is very little concern about poor work history and background checks. Skill is the primary issue.
66.7%
62.5%
40.0%
45.0%
50.0%
55.0%
60.0%
65.0%
70.0%
Production Occupations All Occupations
Percent of Employers Indicating It Is Difficult to Hire Computer and Mathematical Workers
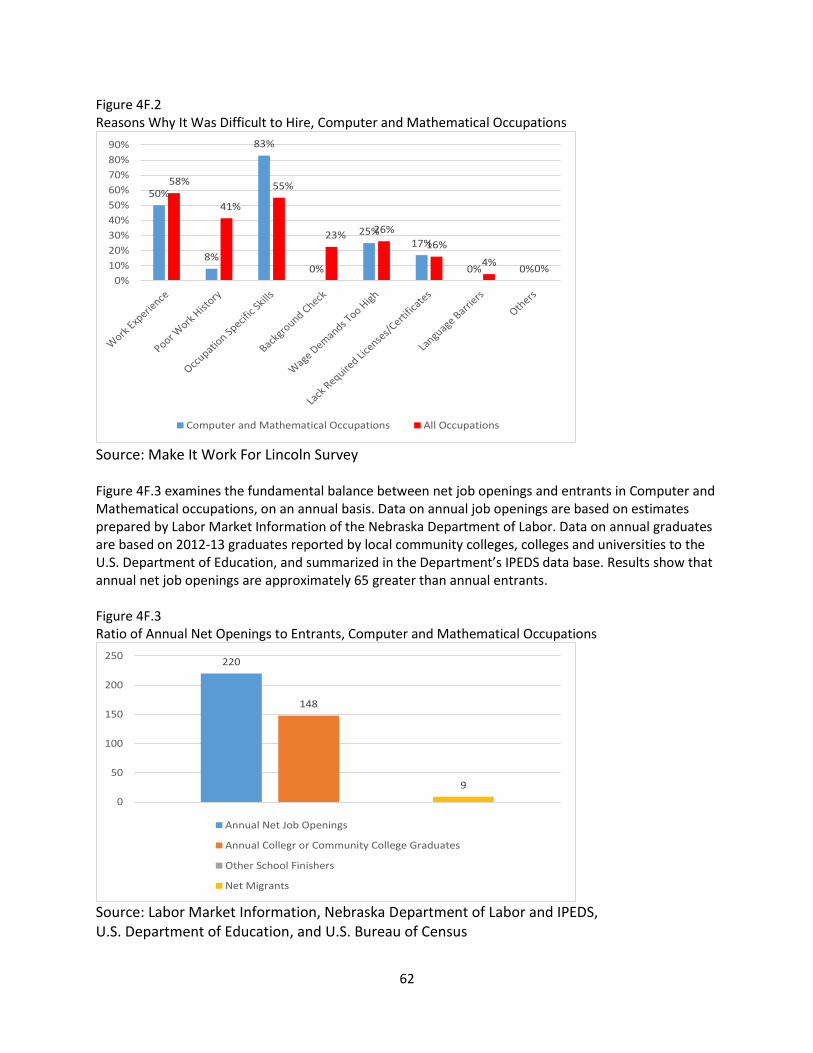
62
Figure 4F.2 Reasons Why It Was Difficult to Hire, Computer and Mathematical Occupations
Source: Make It Work For Lincoln Survey Figure 4F.3 examines the fundamental balance between net job openings and entrants in Computer and Mathematical occupations, on an annual basis. Data on annual job openings are based on estimates prepared by Labor Market Information of the Nebraska Department of Labor. Data on annual graduates are based on 2012-13 graduates reported by local community colleges, colleges and universities to the U.S. Department of Education, and summarized in the Department’s IPEDS data base. Results show that annual net job openings are approximately 65 greater than annual entrants. Figure 4F.3 Ratio of Annual Net Openings to Entrants, Computer and Mathematical Occupations
Source: Labor Market Information, Nebraska Department of Labor and IPEDS, U.S. Department of Education, and U.S. Bureau of Census
50%
8%
83%
0%
25%17%
0% 0%
58%
41%
55%
23%26%
16%
4%0%
0%
10%
20%
30%
40%
50%
60%
70%
80%
90%
Computer and Mathematical Occupations All Occupations
220
148
9
0
50
100
150
200
250
Annual Net Job Openings
Annual Collegr or Community College Graduates
Other School Finishers
Net Migrants
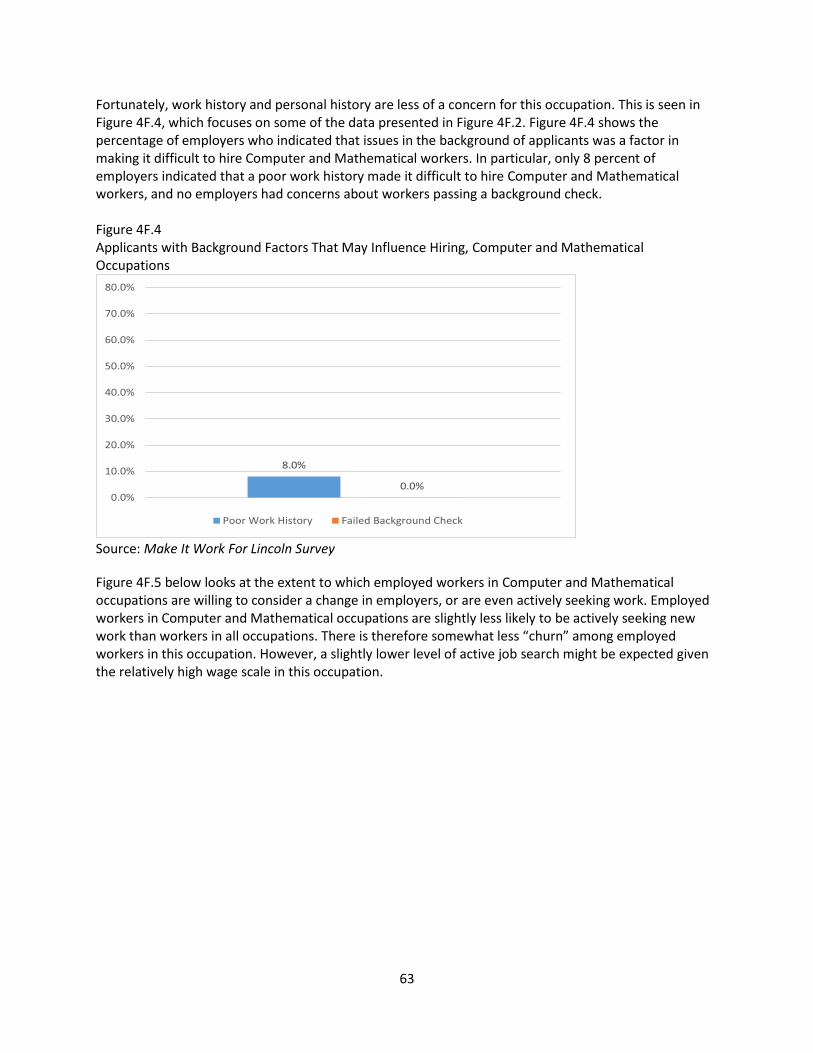
63
Fortunately, work history and personal history are less of a concern for this occupation. This is seen in Figure 4F.4, which focuses on some of the data presented in Figure 4F.2. Figure 4F.4 shows the percentage of employers who indicated that issues in the background of applicants was a factor in making it difficult to hire Computer and Mathematical workers. In particular, only 8 percent of employers indicated that a poor work history made it difficult to hire Computer and Mathematical workers, and no employers had concerns about workers passing a background check. Figure 4F.4 Applicants with Background Factors That May Influence Hiring, Computer and Mathematical Occupations
Source: Make It Work For Lincoln Survey
Figure 4F.5 below looks at the extent to which employed workers in Computer and Mathematical occupations are willing to consider a change in employers, or are even actively seeking work. Employed workers in Computer and Mathematical occupations are slightly less likely to be actively seeking new work than workers in all occupations. There is therefore somewhat less “churn” among employed workers in this occupation. However, a slightly lower level of active job search might be expected given the relatively high wage scale in this occupation.
8.0%
0.0%0.0%
10.0%
20.0%
30.0%
40.0%
50.0%
60.0%
70.0%
80.0%
Poor Work History Failed Background Check
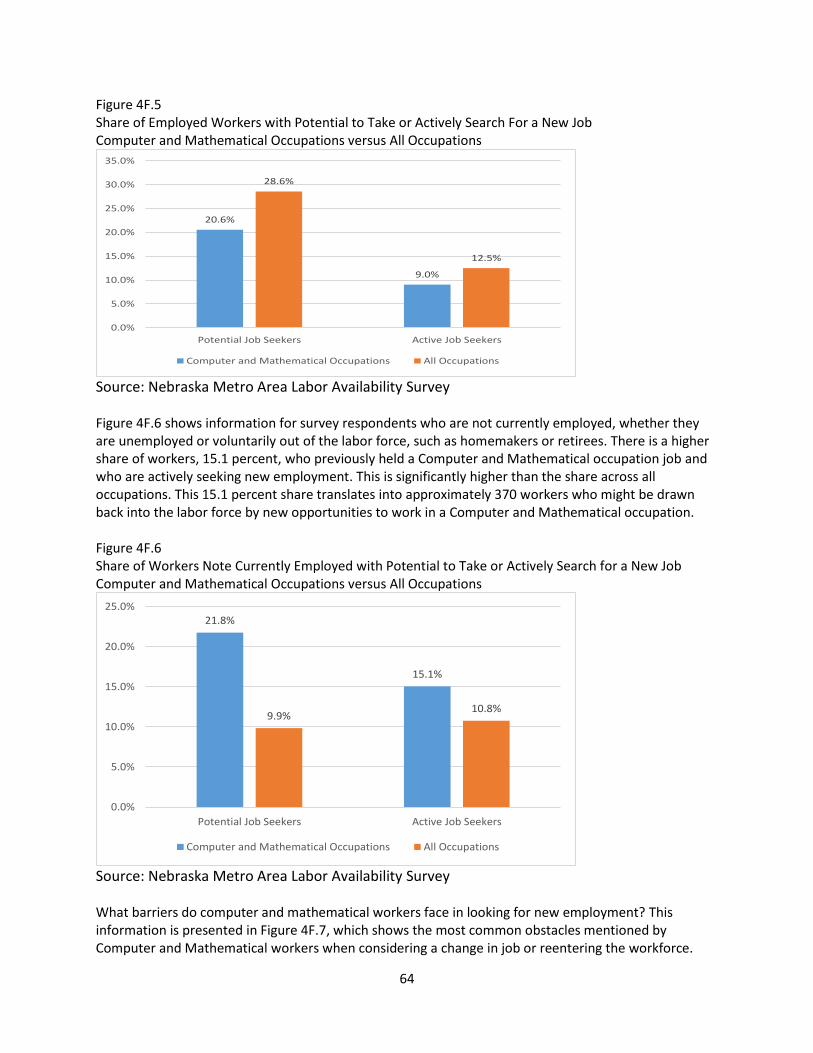
64
Figure 4F.5 Share of Employed Workers with Potential to Take or Actively Search For a New Job Computer and Mathematical Occupations versus All Occupations
Source: Nebraska Metro Area Labor Availability Survey Figure 4F.6 shows information for survey respondents who are not currently employed, whether they are unemployed or voluntarily out of the labor force, such as homemakers or retirees. There is a higher share of workers, 15.1 percent, who previously held a Computer and Mathematical occupation job and who are actively seeking new employment. This is significantly higher than the share across all occupations. This 15.1 percent share translates into approximately 370 workers who might be drawn back into the labor force by new opportunities to work in a Computer and Mathematical occupation. Figure 4F.6 Share of Workers Note Currently Employed with Potential to Take or Actively Search for a New Job Computer and Mathematical Occupations versus All Occupations
Source: Nebraska Metro Area Labor Availability Survey What barriers do computer and mathematical workers face in looking for new employment? This information is presented in Figure 4F.7, which shows the most common obstacles mentioned by Computer and Mathematical workers when considering a change in job or reentering the workforce.
20.6%
9.0%
28.6%
12.5%
0.0%
5.0%
10.0%
15.0%
20.0%
25.0%
30.0%
35.0%
Potential Job Seekers Active Job Seekers
Computer and Mathematical Occupations All Occupations
21.8%
15.1%
9.9%10.8%
0.0%
5.0%
10.0%
15.0%
20.0%
25.0%
Potential Job Seekers Active Job Seekers
Computer and Mathematical Occupations All Occupations
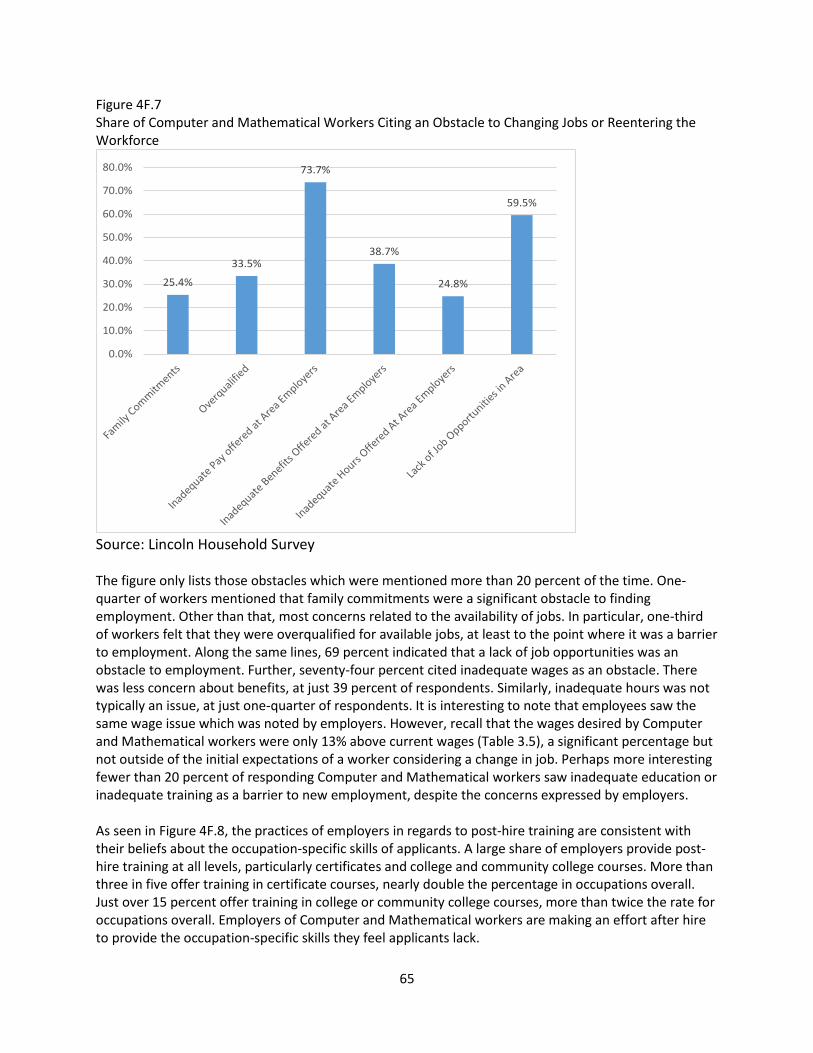
65
Figure 4F.7 Share of Computer and Mathematical Workers Citing an Obstacle to Changing Jobs or Reentering the Workforce
Source: Lincoln Household Survey The figure only lists those obstacles which were mentioned more than 20 percent of the time. One-quarter of workers mentioned that family commitments were a significant obstacle to finding employment. Other than that, most concerns related to the availability of jobs. In particular, one-third of workers felt that they were overqualified for available jobs, at least to the point where it was a barrier to employment. Along the same lines, 69 percent indicated that a lack of job opportunities was an obstacle to employment. Further, seventy-four percent cited inadequate wages as an obstacle. There was less concern about benefits, at just 39 percent of respondents. Similarly, inadequate hours was not typically an issue, at just one-quarter of respondents. It is interesting to note that employees saw the same wage issue which was noted by employers. However, recall that the wages desired by Computer and Mathematical workers were only 13% above current wages (Table 3.5), a significant percentage but not outside of the initial expectations of a worker considering a change in job. Perhaps more interesting fewer than 20 percent of responding Computer and Mathematical workers saw inadequate education or inadequate training as a barrier to new employment, despite the concerns expressed by employers. As seen in Figure 4F.8, the practices of employers in regards to post-hire training are consistent with their beliefs about the occupation-specific skills of applicants. A large share of employers provide post-hire training at all levels, particularly certificates and college and community college courses. More than three in five offer training in certificate courses, nearly double the percentage in occupations overall. Just over 15 percent offer training in college or community college courses, more than twice the rate for occupations overall. Employers of Computer and Mathematical workers are making an effort after hire to provide the occupation-specific skills they feel applicants lack.
25.4%
33.5%
73.7%
38.7%
24.8%
59.5%
0.0%
10.0%
20.0%
30.0%
40.0%
50.0%
60.0%
70.0%
80.0%
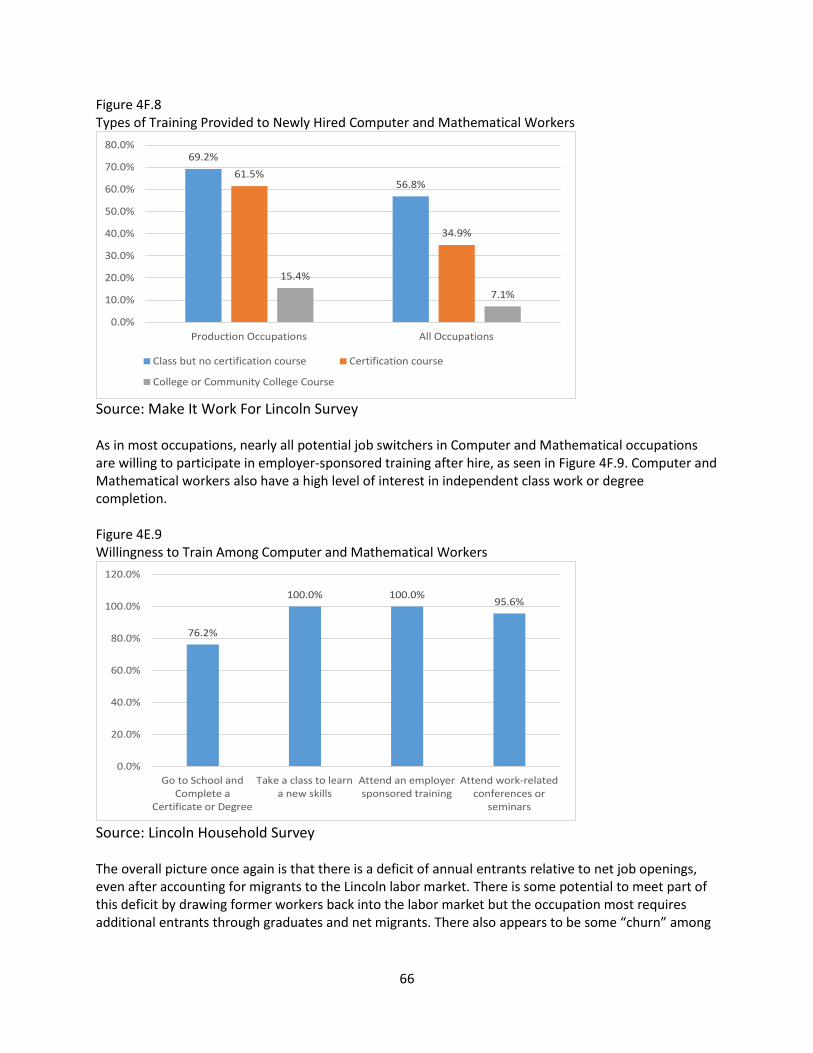
66
Figure 4F.8 Types of Training Provided to Newly Hired Computer and Mathematical Workers
Source: Make It Work For Lincoln Survey As in most occupations, nearly all potential job switchers in Computer and Mathematical occupations are willing to participate in employer-sponsored training after hire, as seen in Figure 4F.9. Computer and Mathematical workers also have a high level of interest in independent class work or degree completion. Figure 4E.9 Willingness to Train Among Computer and Mathematical Workers
Source: Lincoln Household Survey The overall picture once again is that there is a deficit of annual entrants relative to net job openings, even after accounting for migrants to the Lincoln labor market. There is some potential to meet part of this deficit by drawing former workers back into the labor market but the occupation most requires additional entrants through graduates and net migrants. There also appears to be some “churn” among
69.2%
56.8%61.5%
34.9%
15.4%
7.1%
0.0%
10.0%
20.0%
30.0%
40.0%
50.0%
60.0%
70.0%
80.0%
Production Occupations All Occupations
Class but no certification course Certification course
College or Community College Course
76.2%
100.0% 100.0%95.6%
0.0%
20.0%
40.0%
60.0%
80.0%
100.0%
120.0%
Go to School andComplete a
Certificate or Degree
Take a class to learna new skills
Attend an employersponsored training
Attend work-relatedconferences or
seminars
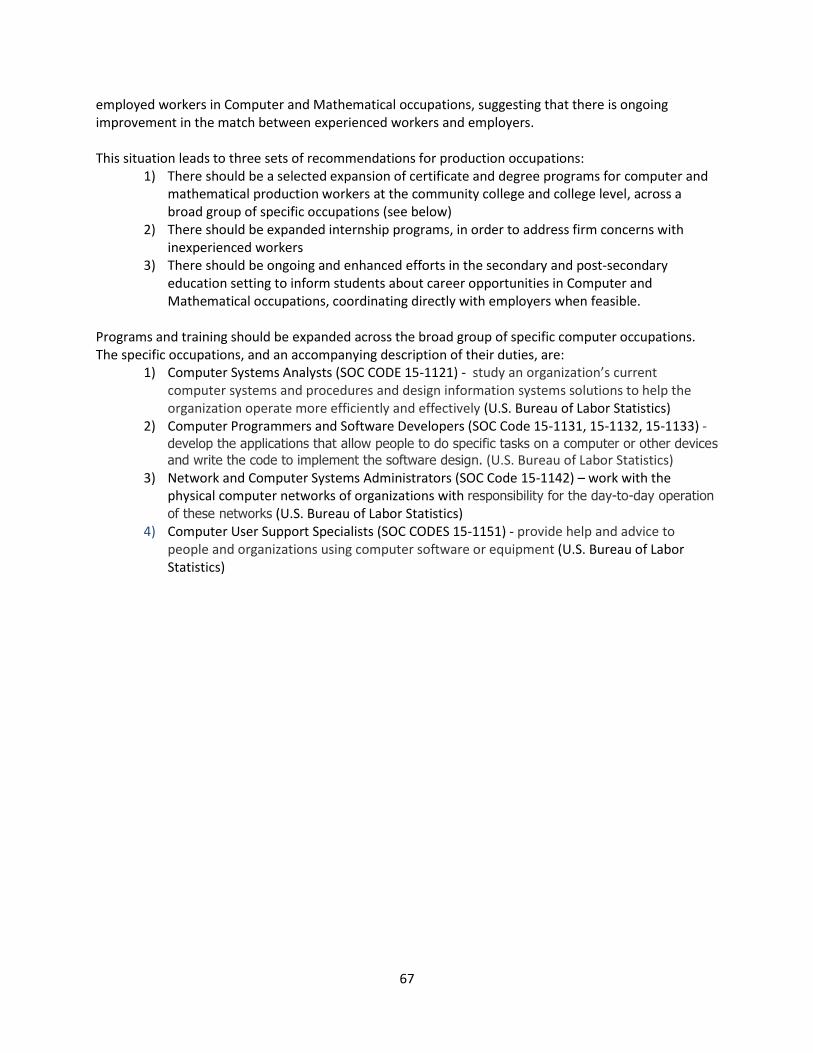
67
employed workers in Computer and Mathematical occupations, suggesting that there is ongoing improvement in the match between experienced workers and employers. This situation leads to three sets of recommendations for production occupations:
1) There should be a selected expansion of certificate and degree programs for computer and mathematical production workers at the community college and college level, across a broad group of specific occupations (see below)
2) There should be expanded internship programs, in order to address firm concerns with inexperienced workers
3) There should be ongoing and enhanced efforts in the secondary and post-secondary education setting to inform students about career opportunities in Computer and Mathematical occupations, coordinating directly with employers when feasible.
Programs and training should be expanded across the broad group of specific computer occupations. The specific occupations, and an accompanying description of their duties, are:
1) Computer Systems Analysts (SOC CODE 15-1121) - study an organization’s current computer systems and procedures and design information systems solutions to help the organization operate more efficiently and effectively (U.S. Bureau of Labor Statistics)
2) Computer Programmers and Software Developers (SOC Code 15-1131, 15-1132, 15-1133) - develop the applications that allow people to do specific tasks on a computer or other devices
and write the code to implement the software design. (U.S. Bureau of Labor Statistics) 3) Network and Computer Systems Administrators (SOC Code 15-1142) – work with the
physical computer networks of organizations with responsibility for the day-to-day operation
of these networks (U.S. Bureau of Labor Statistics) 4) Computer User Support Specialists (SOC CODES 15-1151) - provide help and advice to
people and organizations using computer software or equipment (U.S. Bureau of Labor Statistics)