light-duty diesel market potential in north americalight-duty diesel market potential in north...
TRANSCRIPT
Light-Duty Diesel MarketPotential in North America
Diesel Engine EmissionsReduction Conference
August 22, 2005Chicago
Charles E. Freese, VExecutive Director, Diesel EngineeringGeneral Motors Corporation
GM’s Long Term Vision
Remove the automobile from the energy & environmental equation

ReducedVehicle
Emissionsand
IncreasedVehicle
FuelEconomy
Near-Term Mid-Term Long-Term
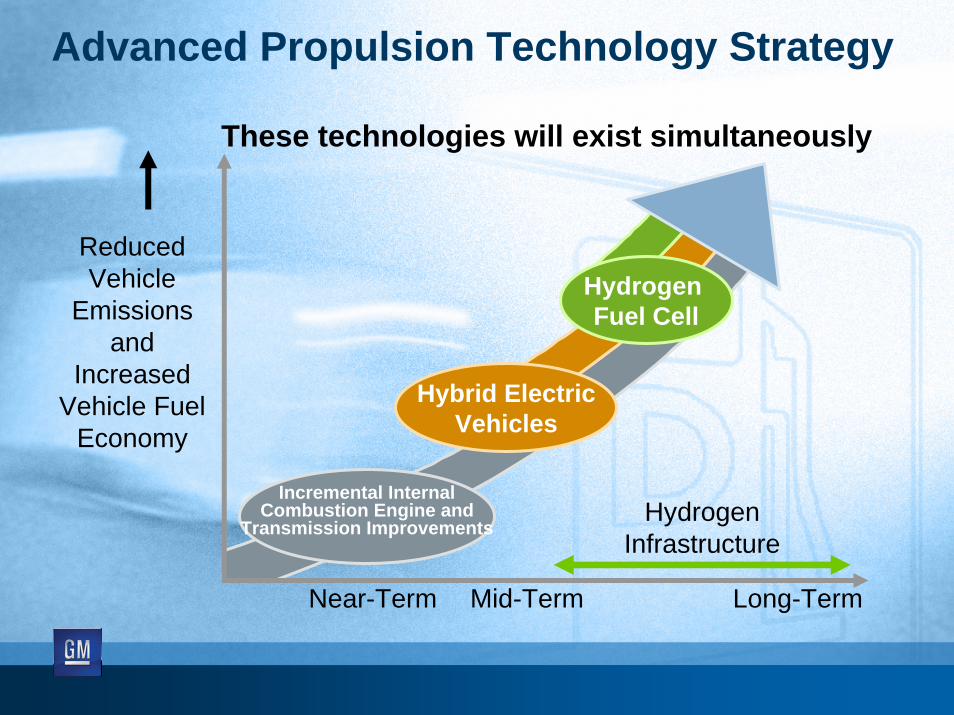
Hybrid ElectricVehicles
Incremental InternalCombustion Engine and
Transmission Improvements
Hydrogen Fuel Cell
Advanced Propulsion Technology Strategy
HydrogenInfrastructure
HydrogenInfrastructure
Incremental InternalCombustion Engine and
Transmission Improvements
Hybrid ElectricVehicles
Hydrogen Fuel Cell
ReducedVehicle
Emissionsand
IncreasedVehicle Fuel
Economy
Near-Term Mid-Term Long-Term
Advanced Propulsion Technology Strategy
These technologies will exist simultaneously
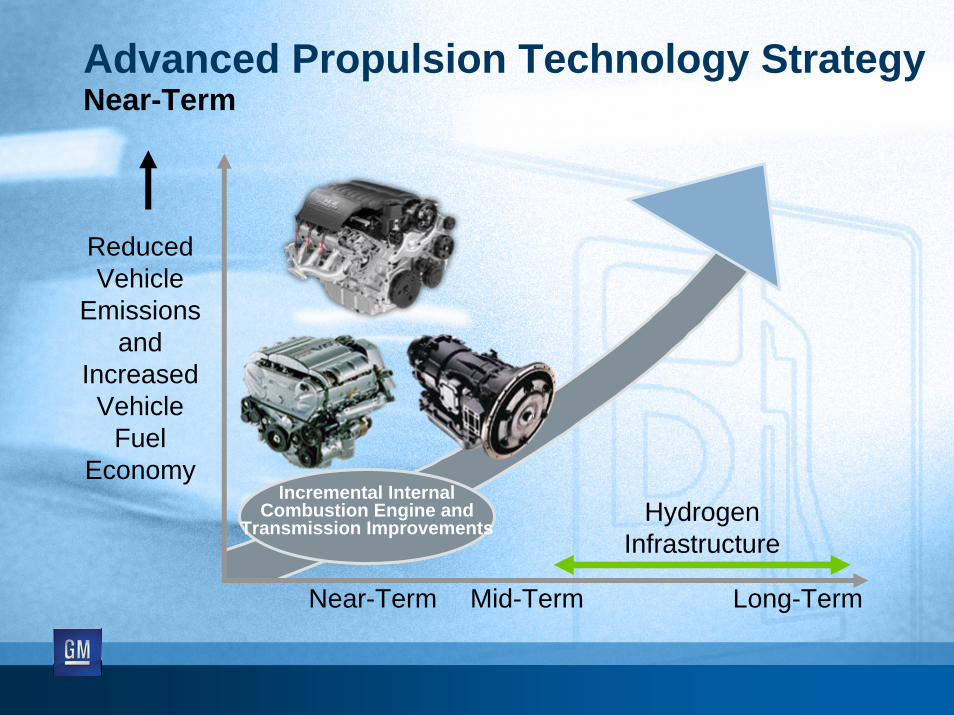
ReducedVehicle
Emissionsand
IncreasedVehicle
FuelEconomy
Near-Term Mid-Term Long-Term
Incremental InternalCombustion Engine and
Transmission Improvements
Advanced Propulsion Technology StrategyNear-Term
HydrogenInfrastructure
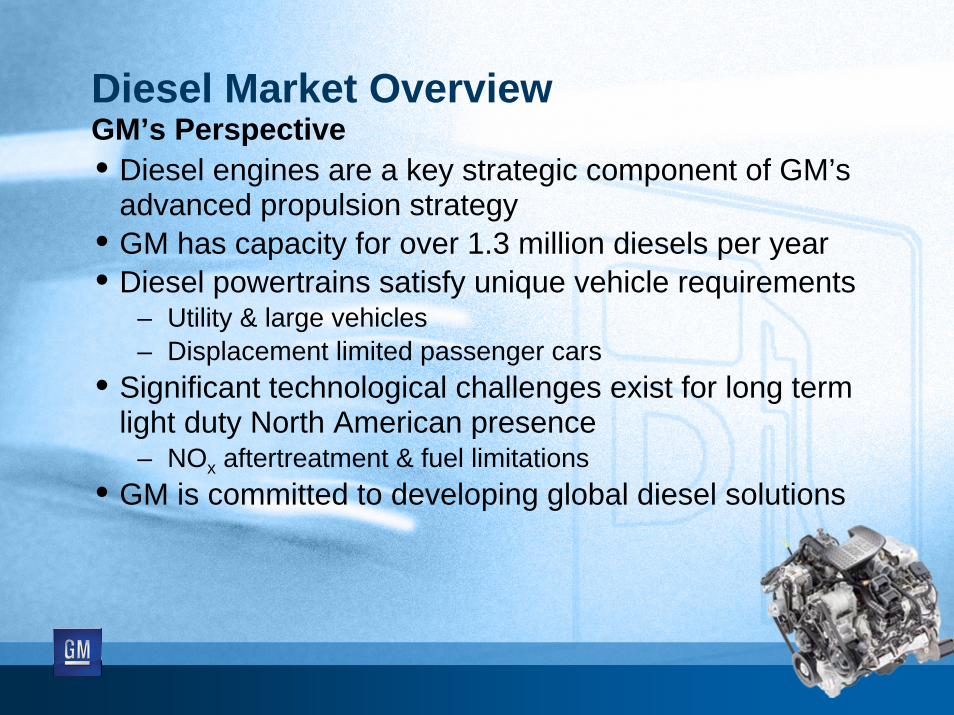
Diesel Market OverviewGM’s Perspective• Diesel engines are a key strategic component of GM’s
advanced propulsion strategy• GM has capacity for over 1.3 million diesels per year• Diesel powertrains satisfy unique vehicle requirements
– Utility & large vehicles– Displacement limited passenger cars
• Significant technological challenges exist for long term light duty North American presence
– NOx aftertreatment & fuel limitations• GM is committed to developing global diesel solutions
Dut
yC
ycle
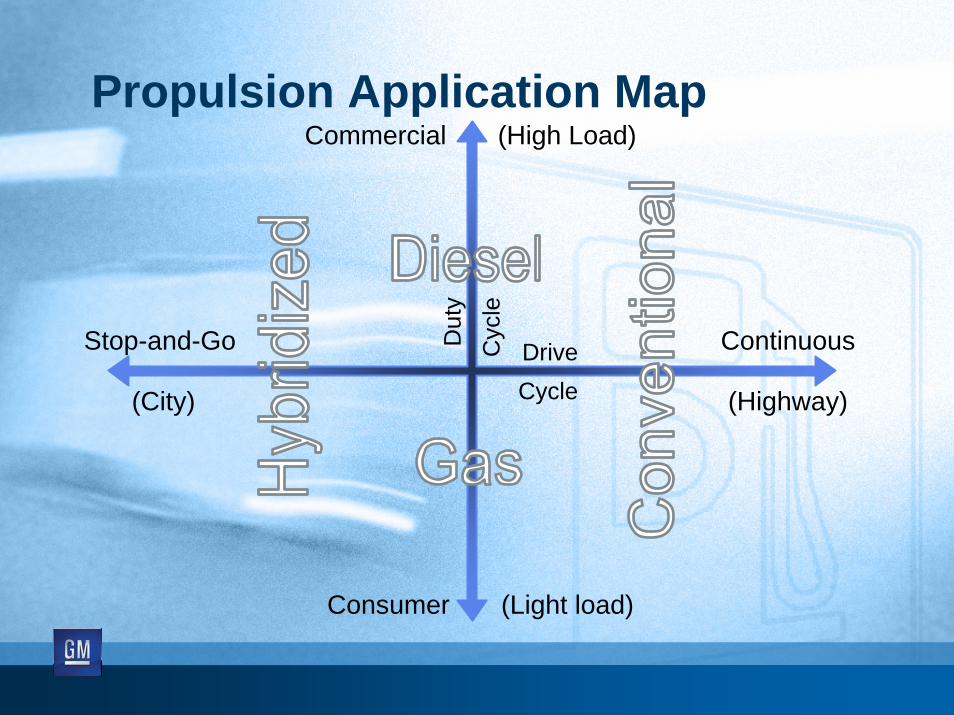
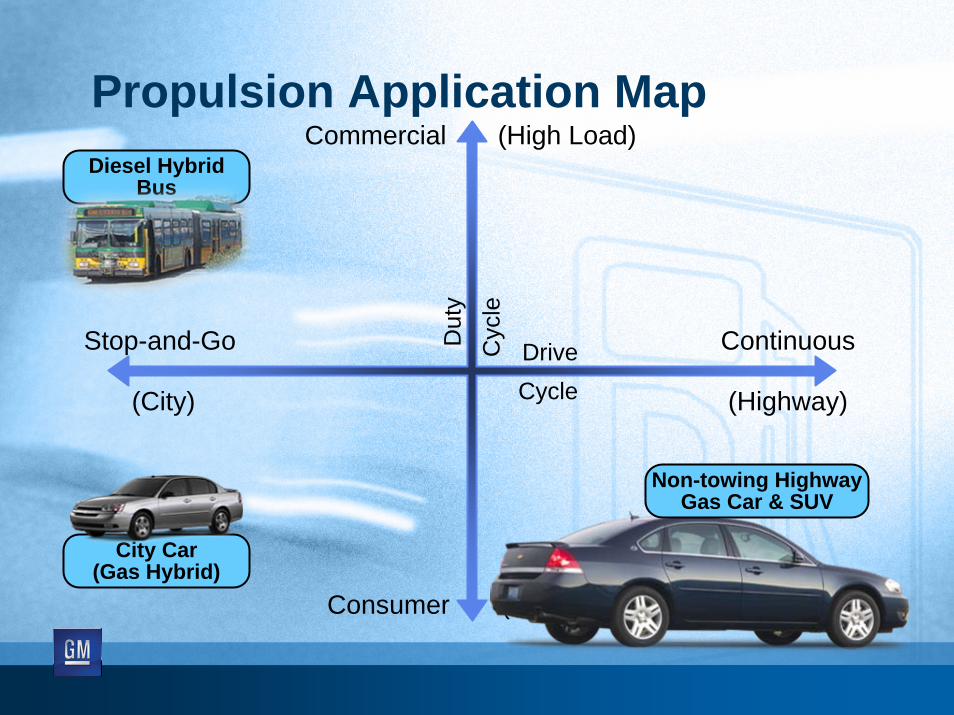
Commercial (High Load)
Consumer (Light load)
DriveCycle
Stop-and-Go
(City)
Continuous
(Highway)
Propulsion Application Map
Dut
yC
ycle
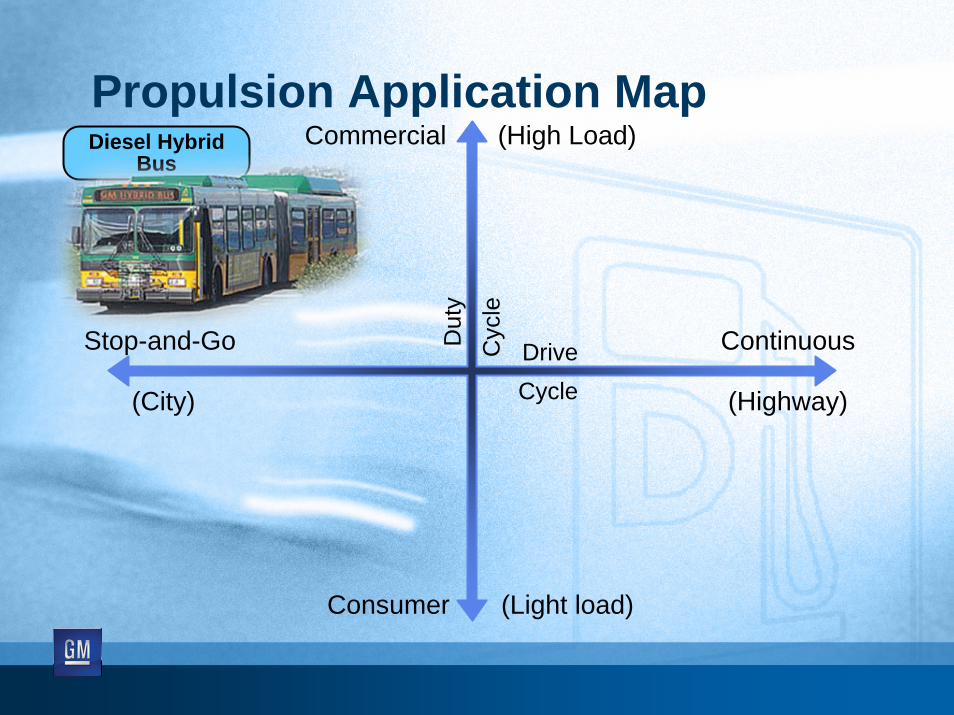
Commercial (High Load)
Consumer (Light load)
DriveCycle
Stop-and-Go
(City)
Continuous
(Highway)
Propulsion Application MapDiesel Hybrid
Bus
Dut
yC
ycle
Commercial (High Load)
Consumer (Light load)
DriveCycle
Stop-and-Go
(City)
Continuous
(Highway)
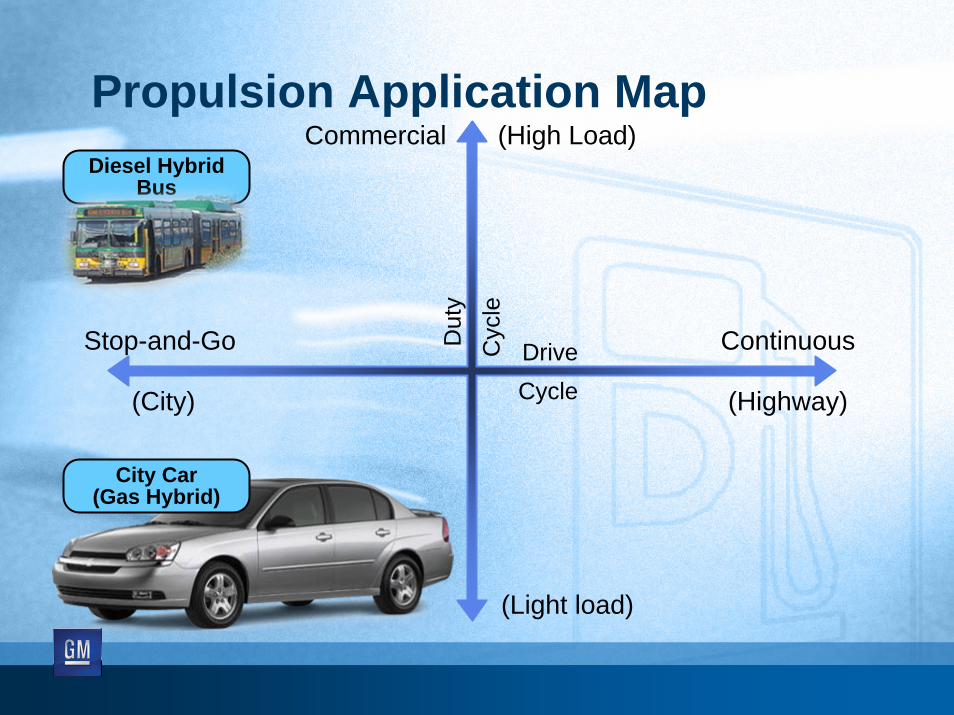
Propulsion Application MapDiesel Hybrid
Bus
City Car(Gas Hybrid)
Dut
yC
ycle
Commercial (High Load)
Consumer (Light load)
DriveCycle
Stop-and-Go
(City)
Continuous
(Highway)
Propulsion Application Map
City Car(Gas Hybrid)
Diesel HybridBus
Non-towing HighwayGas Car & SUV

Commercial (High Load)
Consumer (Light load)
Dut
yC
ycle
DriveCycle
Stop-and-Go
(City)
Continuous
(Highway)
City Car(Gas Hybrid)
Non-towing HighwayGas Car & SUV
Diesel HybridBus
Propulsion Application Map Over the RoadTruck
Dut
yC
ycle
Commercial (High Load)
Consumer (Light load)
DriveCycle
Stop-and-Go
(City)
Continuous
(Highway)
City Car(Gas Hybrid)
Over the RoadTruck
Non-towing HighwayGas Car & SUV
Diesel HybridBus
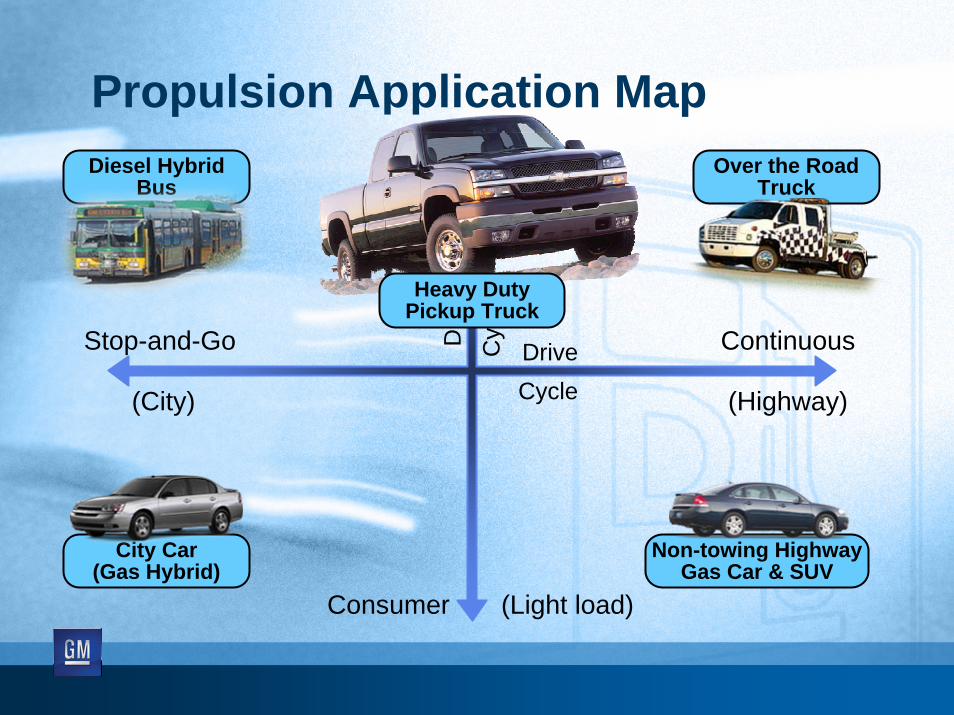
Propulsion Application Map
Heavy DutyPickup Truck
Dut
yC
ycle
Commercial (High Load)
Consumer (Light load)
DriveCycle
Stop-and-Go
(City)
Continuous
(Highway)
Propulsion Application Map
City Car(Gas Hybrid)
Over the RoadTruck
Non-towing HighwayGas Car & SUV
Diesel HybridBus
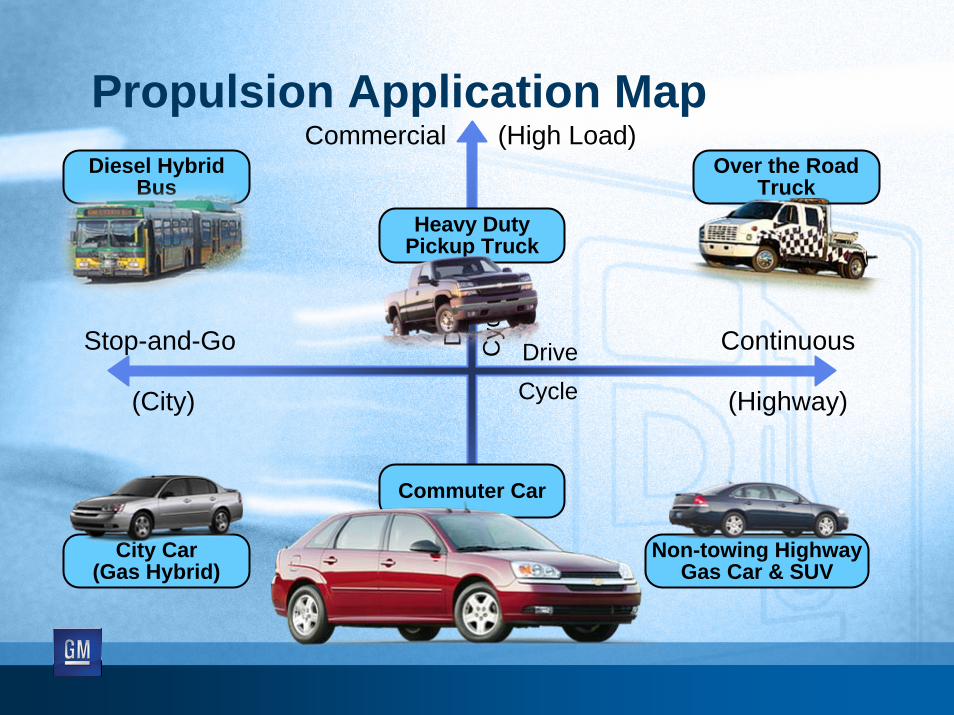
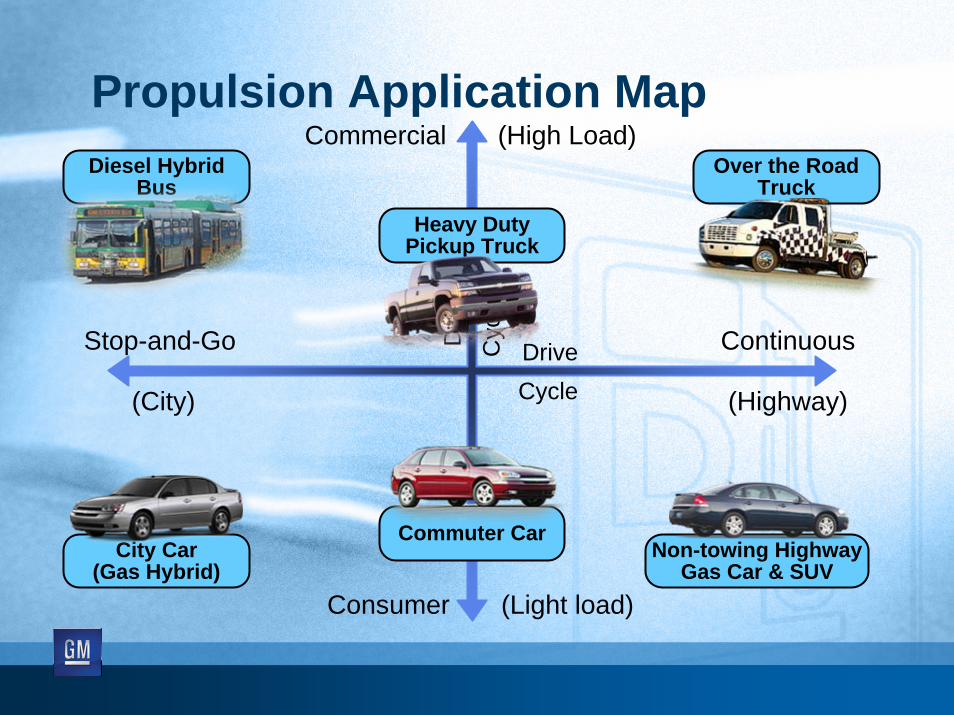
Commuter Car
Heavy DutyPickup Truck
Dut
yC
ycle
Commercial (High Load)
Consumer (Light load)
DriveCycle
Stop-and-Go
(City)
Continuous
(Highway)
Propulsion Application Map
Commuter CarCity Car
(Gas Hybrid)
Over the RoadTruck
Non-towing HighwayGas Car & SUV
Diesel HybridBus
Heavy DutyPickup Truck
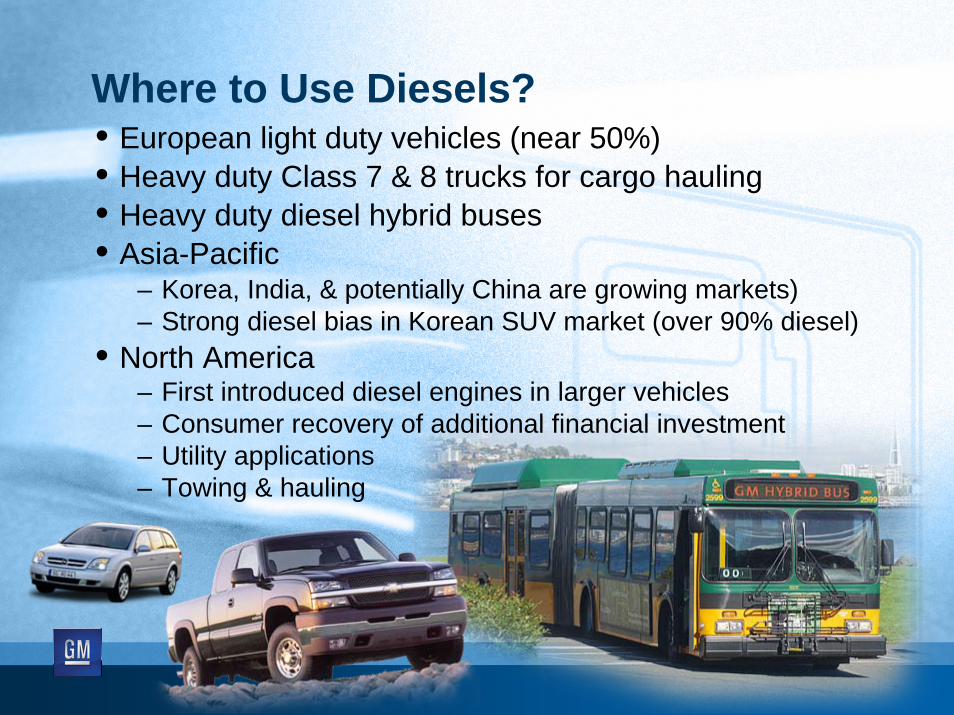
Where to Use Diesels?• European light duty vehicles (near 50%)• Heavy duty Class 7 & 8 trucks for cargo hauling• Heavy duty diesel hybrid buses• Asia-Pacific
– Korea, India, & potentially China are growing markets)– Strong diesel bias in Korean SUV market (over 90% diesel)
• North America– First introduced diesel engines in larger vehicles– Consumer recovery of additional financial investment– Utility applications– Towing & hauling
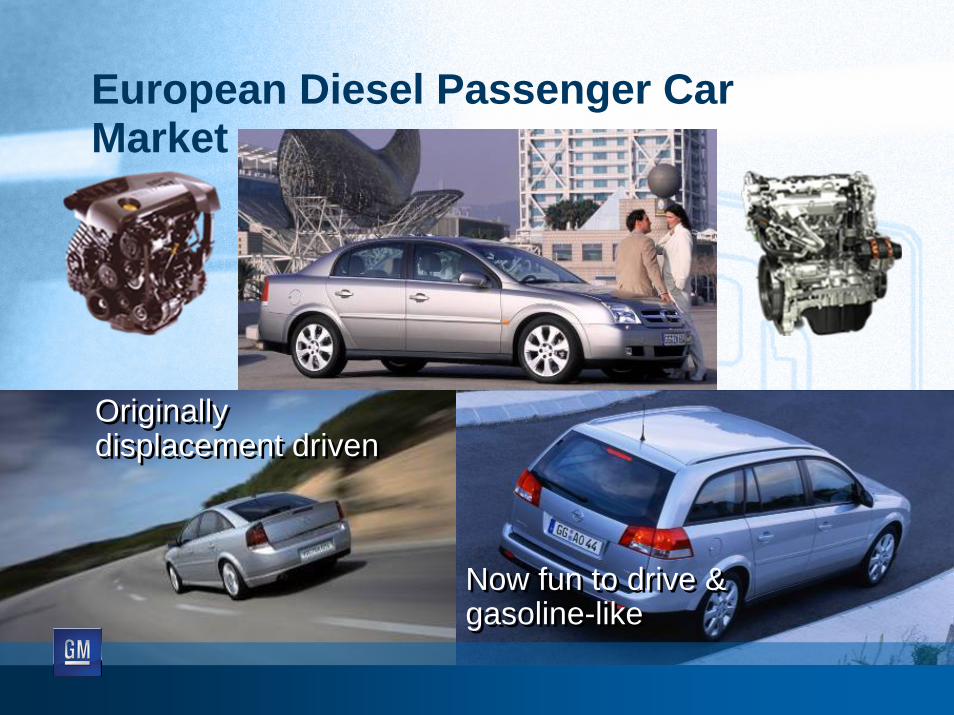
European Diesel Passenger Car Market
Originallydisplacement driven Originallydisplacement driven
Now fun to drive &gasoline-likeNow fun to drive &gasoline-like
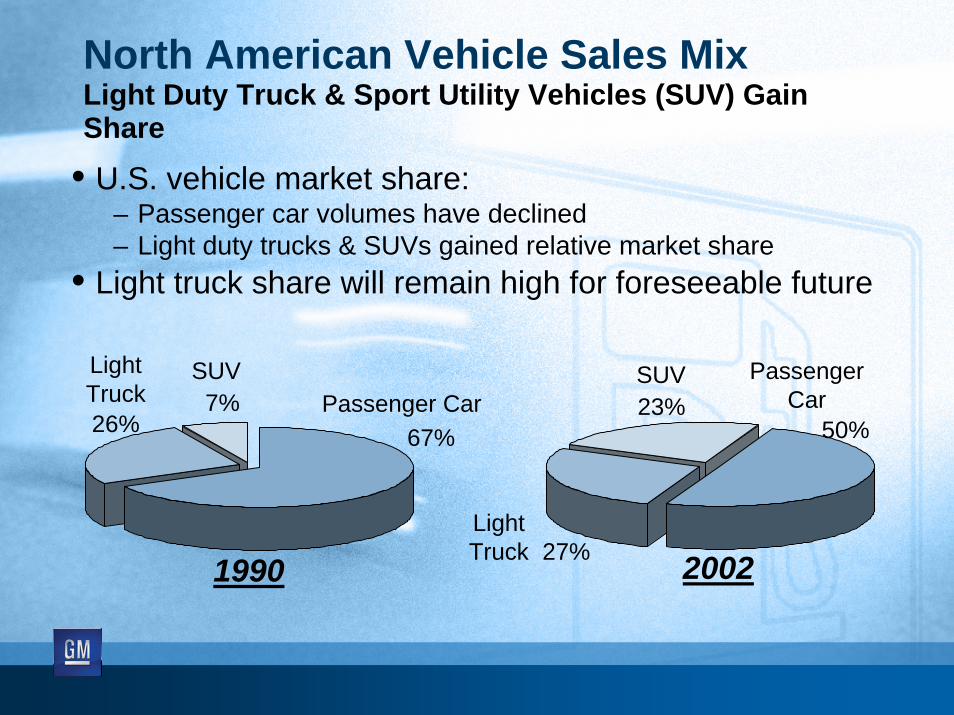
North American Vehicle Sales MixLight Duty Truck & Sport Utility Vehicles (SUV) Gain Share
• U.S. vehicle market share:– Passenger car volumes have declined– Light duty trucks & SUVs gained relative market share
• Light truck share will remain high for foreseeable future
SUV7%
LightTruck26%
Passenger Car67%
1990 27%
SUV23%
50%
2002
PassengerCar
LightTruck
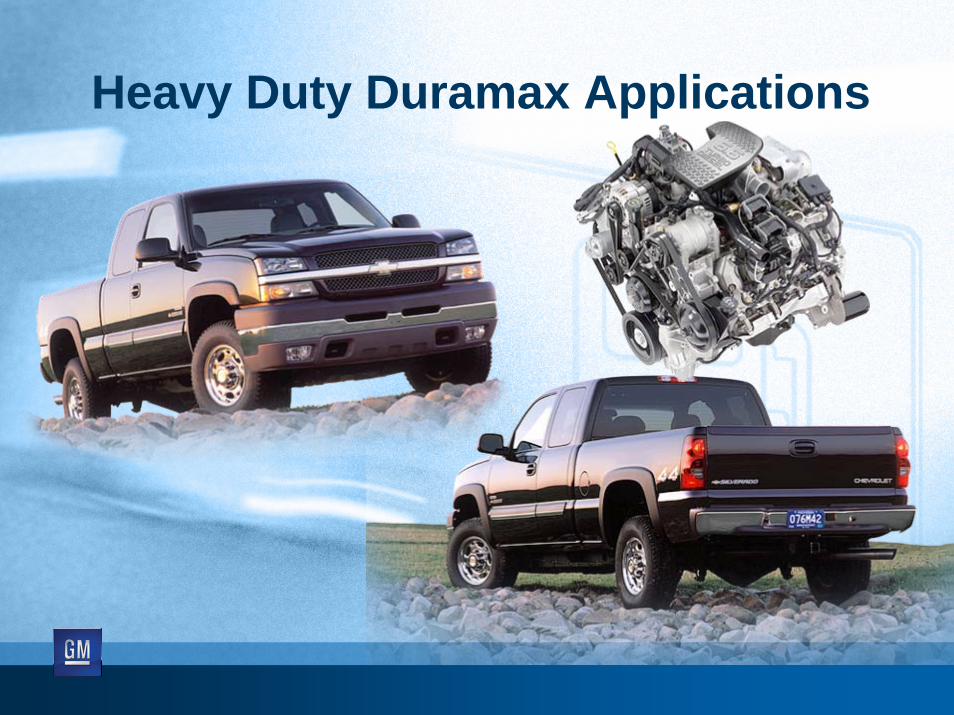
Heavy Duty Duramax Applications
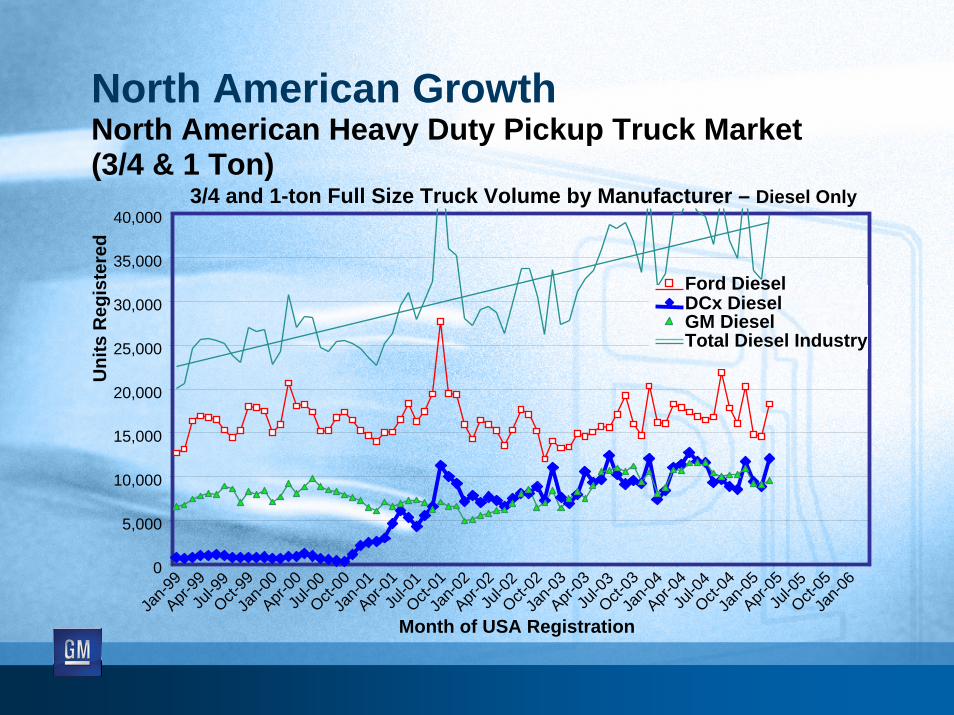
North American GrowthNorth American Heavy Duty Pickup Truck Market(3/4 & 1 Ton)
Month of USA Registration
0
5,000
10,000
15,000
20,000
25,000
30,000
35,000
40,000
Jan-9
9Apr-
99Ju
l-99
Oct-99
Jan-0
0Apr-
00Ju
l-00
Oct-00
Jan-0
1Apr-
01Ju
l-01
Oct-01
Jan-0
2Apr-
02Ju
l-02
Oct-02
Jan-0
3Apr-
03Ju
l-03
Oct-03
Jan-0
4Apr-
04Ju
l-04
Oct-04
Jan-0
5Apr-
05Ju
l-05
Oct-05
Jan-0
6
3/4 and 1-ton Full Size Truck Volume by Manufacturer – Diesel Only
Uni
ts R
egis
tere
d
Ford Diesel
GM DieselDCx Diesel
Total Diesel Industry
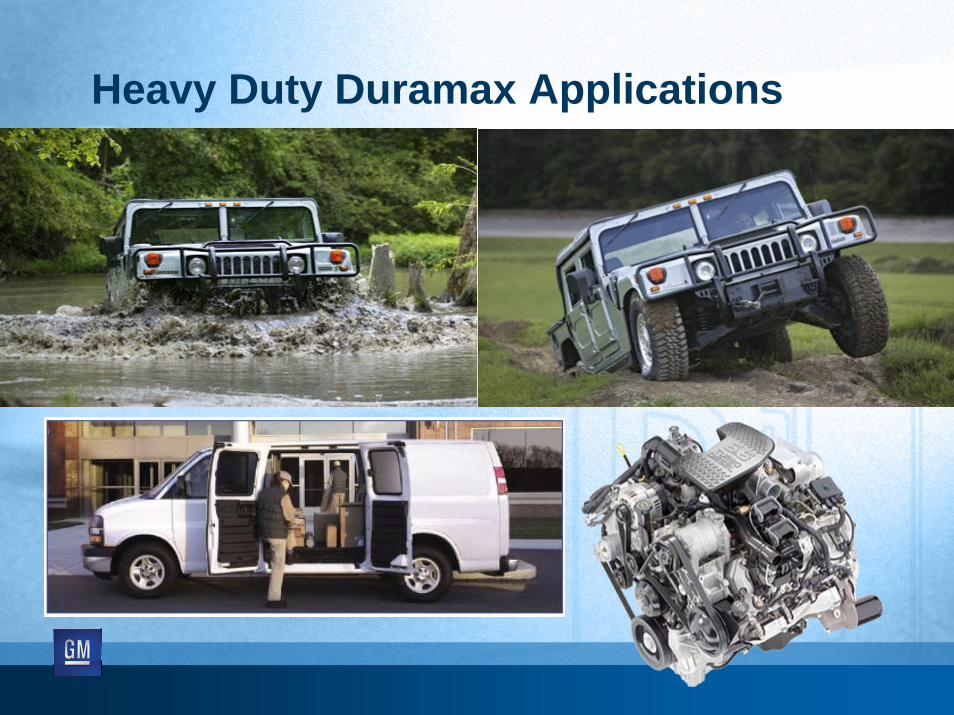
Heavy Duty Duramax Applications
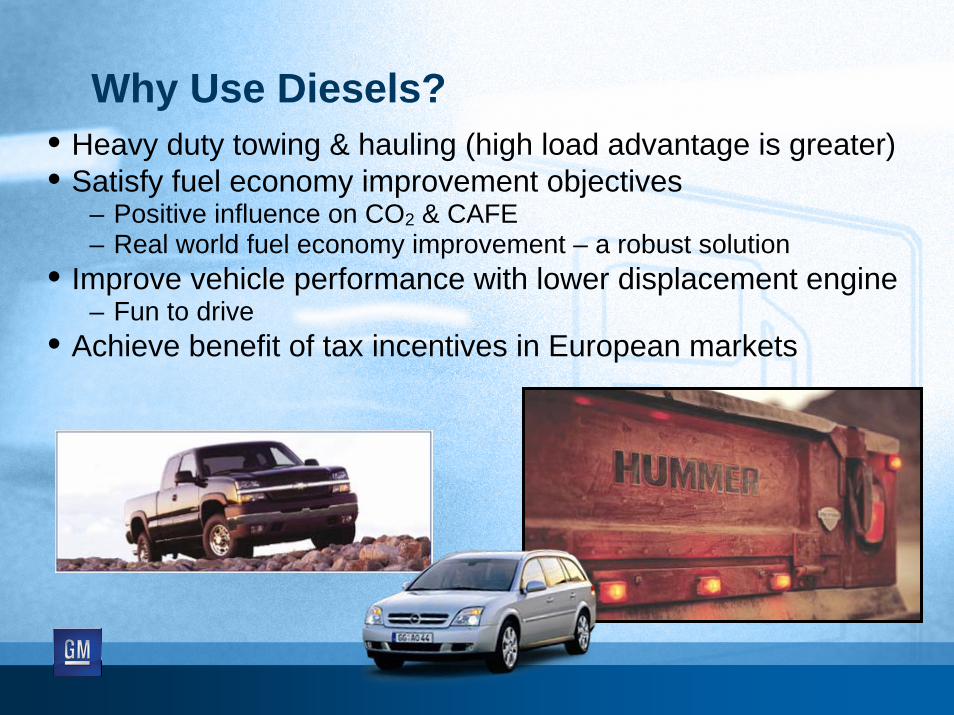
Why Use Diesels?• Heavy duty towing & hauling (high load advantage is greater)• Satisfy fuel economy improvement objectives
– Positive influence on CO2 & CAFE– Real world fuel economy improvement – a robust solution
• Improve vehicle performance with lower displacement engine– Fun to drive
• Achieve benefit of tax incentives in European markets
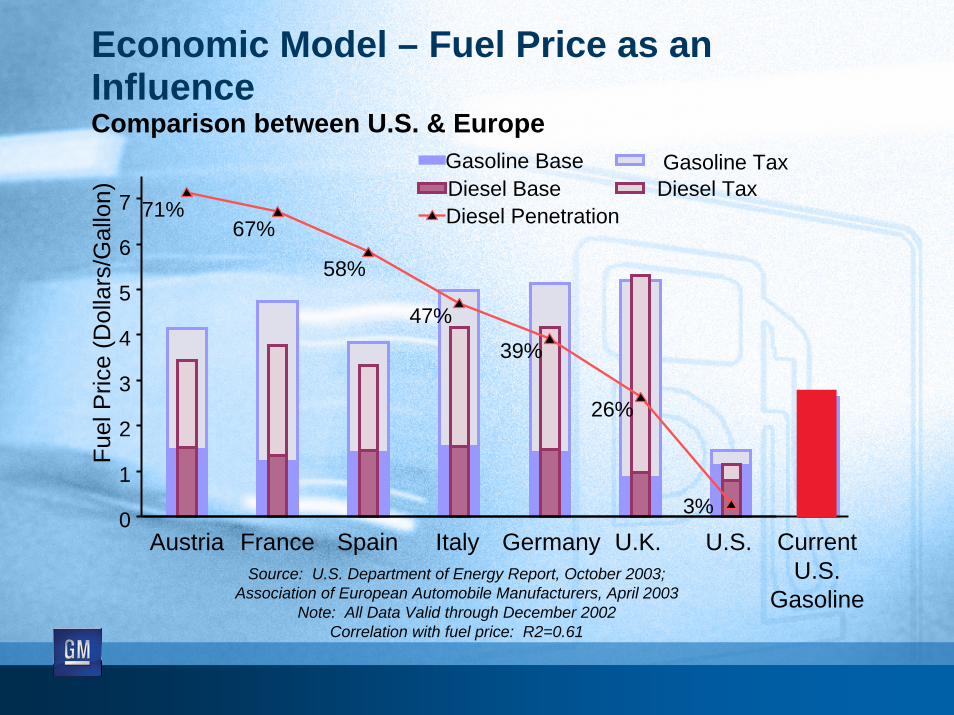
Economic Model – Fuel Price as an InfluenceComparison between U.S. & Europe
Fuel
Pric
e (D
olla
rs/G
allo
n) 71%67%
58%
47%39%
26%
3%0
1
2
3
4
5
6
7
Austria France Spain Italy Germany U.K. U.S.
Gasoline BaseDiesel Base
Gasoline TaxDiesel Tax
Diesel Penetration
Source: U.S. Department of Energy Report, October 2003;Association of European Automobile Manufacturers, April 2003
Note: All Data Valid through December 2002Correlation with fuel price: R2=0.61
CurrentU.S.
Gasoline

Economic ModelComparison between U.S. and Europe – Diesel Break-Even Point
0
50,000
100,000
150,000
200,000
250,000
300,000
350,000
400,000
0 1,000 2,000 3,000 4,000 5,0000
50,000
100,000
150,000
200,000
250,000
300,000
350,000
400,000
0 1,000 2,000 3,000 4,000 5,000
Vehi
cle
Mile
age
(mile
s)
Initial Purchase Price ($ U.S.)
35 MPG
30 MPG
25 MPG
20 MPG
Gas=15 MPG
Gas=35 MPG30252015
North AmericaGas=Diesel=$2.50/Gal
North AmericaGas=Diesel=$2.50/Gal
Europe:Gas = $6/Gal
Diesel = $5/Gal
Europe:Gas = $6/Gal
Diesel = $5/Gal
Vehicle Mileage Required to Recover Diesel Engine Cost
Chart Assumptions:• 20,000 Annual Vehicle Miles• Diesel Efficiency Advantage:
Europe 30%, Bin 5 North America 25%• 6% Annual Finance Rate Available

Diesel Engine Technology Trends –Europe
Spe
cific
Pow
er (k
W/l)
Future HSDIDiesel Engines
Spe
cific
Pow
er (h
p/l)
Turbo ChargedSI Engines
4V-SI Engines
80
60
20
0
40
100
60
20
0
40
80
2V-SIEngines
1930 1940 1950 1960 1970 1980 1990 2000 2010
Diesel EnginesNaturally AspiratedTurbocharged (TC)TC-Intercooled
Model Year
Benchmark trends to help predict requirements
Source: FEV Data

Western EuropeRicardo Forecast Diesel Passenger Car Sales & Market Penetration to 2006
Diesel Sales Volume
0
1,000,000
2,000,000
3,000,000
4,000,000
5,000,000
6,000,000
7,000,000
8,000,000
9,000,000
1978
1979
1980
1981
1982
1983
1984
1985
1986
1987
1988
1989
1990
1991
1992
1993
1994
1995
1996
1997
1998
1999
2000
2001
2002
2003
2004
2005
2006
0%
10%
20%
30%
40%
50%
60%Diesel Penetration
North AmericanPC Market Share
Introduction ofDI technology
Introduction ofCommon Rail
and VGT
Diesel GrowthWestern Europe & North America
Diesel Car Sales
Forecast Diesel Car SalesDiesel Penetration

Western EuropeRicardo Forecast Diesel Passenger Car Sales & Market Penetration to 2006
Diesel Sales Volume
0
1,000,000
2,000,000
3,000,000
4,000,000
5,000,000
6,000,000
7,000,000
8,000,000
9,000,000
1978
1979
1980
1981
1982
1983
1984
1985
1986
1987
1988
1989
1990
1991
1992
1993
1994
1995
1996
1997
1998
1999
2000
2001
2002
2003
2004
2005
2006
0%
10%
20%
30%
40%
50%
60%Diesel Penetration
Diesel Car Sales
Forecast Diesel Car SalesDiesel Penetration
North AmericanPC Market Share
2nd OilCrisis
GlobalRecessions Introduction of
DI technology
NorthAmerican
Class 2 TruckMarket Share
Introduction ofCommon Rail
and VGT
Introduction of true high performance diesel
engines
$24 $20$57 $37 $15$22 $44 $25 Crude Oil Price (1995$/barrel)
$70+?
Diesel GrowthWestern Europe & North America

Europe vs. U.S. Tier 2 FTP-75 EmissionsLight-Duty
Emission = Emission Index X Fuel Consumption(g/mile) (g/kg fuel) (kg fuel/mile)
Standard NOx PMBin 10 0.60 g/mile 0.080 g/mile
Bin 5 0.07 g/mile 0.010 g/mile
Euro 4 0.25 g/km 0.025 g/kmEuro 5 (TBD)
0.08-0.20 g/km 0.0025-0.010 g/km
Bin 8 0.20 g/mile 0.020 g/mile
Bin 4 0.04 g/mile 0.010 g/mileEuro 3 0.50 g/km 0.050 g/km
NOx (g/km)
Bin 10
Euro 4
Euro 3
0.1 0.2 0.3 0.4 0.5 0.6
PM (g
/mile
)
PM
(g/k
m)
0.02
0.05
0.06
0.04
0.02
0
Bin 8
NOx (g/mile)1.00.90.80.70.60.50.40.30.2
0.10
0.080.05
0.03
0.01
0.09
0.070.06
0.040.03
0.01
Euro 5 (TBD)Bin 5

Global Emissions (Europe vs. U.S. Applications)Light-Duty
1.7L I-4 6.6L V-8
Chevrolet SilveradoOpel Astra

Offsetting Diesel NOx Emissions – Tier 2
Moving to a lower bin adds incremental cost to gasoline off-set
vehicles
Option 1 – Bin 4 offset
0.07 NOx Fleet2008 MY +
1 - Bin 8Diesel
0.20g NOx/mile
Diesel penetration19% of fleet
0.04 NOx
0.04 NOx 0.04 NOx
0.04 NOx
4.33 – Bin 4 Gasto Offset

FTP Emissions Test Driving CycleSpeed vs. Time
30
01020
40506070
0 300 600 900 1200 1500 1800 2100 2400Test Time (sec)
Spee
d (M
PH)
City Driving Cycle
US06 Aggressive Driving Emissions Test Cycle
Speed vs. Time
0
20
40
60
80
100
0 60 120 180 240 300 360 420 480 540 600Test Time (Sec)
Spee
d (M
PH)
Highway Driving Cycle
NEDC = New European Drive Cycle
FTP–75 & NEDC are similar• Produce similar emissions
Supplemental FTP (SFTP) includes:• US-06• SC-03 (accessory load)
USO6 is more challenging• US-only• Higher load • Higher speed• Higher NOx• 50% to 150% more NOx
than FTP-75
FTP-75 versus US-06 Drive Cycles

US-06NMHC+NOx
FTP Bin 8(@120K)
NMHC+NOx
FTP Bin 5 (@120K)
NMHC+NOx
0.140 g/mile 0.325 0.160
0.250 0.325 0.160
0.400 0.325 0.160
0.600 0.325 0.160
LDT3
LDT2
PC/LDT1
LDT4
Light Duty Supplemental Emissions Test CyclesUS-06 Emissions Limits versus FTP-75
More difficult US-06 test has lower standard than FTP

DPF, SCR & LNTAftertreatment
HCCIHomogeneous
Combustion
PCCIPre-Mixed
Charge Comb.
VVT / VVA
Advanced EGR Systems
Reduced Compression
Ratio
Advanced Boost Configurations
Enhanced EGR Cooling
Low Temp / Low soot
Combustion
Diesel EngineEnabling Technology Development

PCCI Combustion

DPF, SCR & LNTAftertreatment
HCCIHomogeneous
Combustion
PCCIPre-Mixed
Charge Comb.
VVT / VVA
Advanced EGR Systems
Reduced Compression
Ratio
Advanced Boost Configurations
Enhanced EGR Cooling
Low Temp / Low soot
Combustion
Diesel EngineEnabling Technology Development

Homogeneous Charge Compression Ignition(convergence of gasoline and diesel technologies)

DPF, SCR & LNTAftertreatment
HCCIHomogeneous
Combustion
PCCIPre-Mixed
Charge Comb.
VVT / VVA
Advanced EGR Systems
Reduced Compression
Ratio
Advanced Boost Configurations
Enhanced EGR Cooling
Low Temp / Low soot
Combustion
Diesel EngineEnabling Technology Development

Advanced EGR Cooling

DPF, SCR & LNTAftertreatment
HCCIHomogeneous
Combustion
PCCIPre-Mixed
Charge Comb.
VVT / VVA
Advanced EGR Systems
Reduced Compression
Ratio
Advanced Boost Configurations
Enhanced EGR Cooling
Low Temp / Low soot
Combustion
Diesel EngineEnabling Technology Development

Advanced Boosting

DPF, SCR & LNTAftertreatment
HCCIHomogeneous
Combustion
PCCIPre-Mixed
Charge Comb.
VVT / VVA
Advanced EGR Systems
Reduced Compression
Ratio
Advanced Boost Configurations
Enhanced EGR Cooling
Low Temp / Low soot
Combustion
Diesel EngineEnabling Technology Development

NOx Aftertreatment

Aftertreatment SystemsBalancing the requirements of FTP with US06
NO
xC
o nve
rsio
n E
ffici
e ncy
(%)
0
20
40
60
80
100
0 100 200 300 400 500 600
SCR Effective Range
LNT Effective Range
Typical ThermalOperating “Windows”
Catalyst Operating Temperature (degrees C)
Light Duty Diesel US06
Catalyst TempsLight Duty Diesel FTP
Catalyst Temps

European versus U.S. Tier 2 FTP-75 EmissionsLight-Duty
Test NOx PMLNT Fresh 0.06 g/mile 0.015 g/mile
LNT Aged, Seq.
0.35 g/mile 0.020 g/mileLNT Aged 0.10 g/mile 0.020 g/mile
SCR-Urea Fresh
0.04 g/mile 0.009 g/mile
NOx (g/km)0.07
Bin 10
Euro 4
Euro 3
0.1 0.2 0.3 0.4 0.5 0.6
PM (g
/mile
)PM
(g/k
m)
0.02
0.05
0.06
0.04
0.02
0
Bin 8
NOx (g/mile)Bin 5 1.00.90.80.70.60.50.40.30.2
0.10
0.080.05
0.03
0.01
0.09
0.070.06
0.040.03
0.01Euro 5*
SCR-Urea LNTFresh
LNTAged
LNTAged, Sequential Tests

Internal Combustion Engine (ICE)Technology Continuum
SIDI-HCCISI CIDICIDI-Low TCIDI-HCCISIDISI-EGR CI-IDI
Gas Diesel
CIDI-EGR
PFI
9 211817161412 158 10
DieselGas6
Atkinson Cycle
4-Valve2-Valve Charge CooledVNTBoostedDieselGas
StagedElectronic-VNT
Stag
ed V
NT
Open LoopElectronic
ModelBased
Controls
ElectronicActuators
FeedForwardModels
Mec
hani
cal
ClosedLoop
Sensors
Adv.Sensors
VirtualSensors
ECUSpeed
DieselDieselGas

SummaryAdvanced Propulsion Solutions
• Portfolio approach is required for advanced powertrain strategies
– Market, vehicle, & customer requirements influence powertrain usage
• Diesel engines are critical to GM’s global product portfolio• Emission regulations, fuel price, taxation based on engine
displacement and fuel consumption largely dictate markets where diesels are popular today
– Voluntary 140 g/km CO2 commitment is a European driver • Increased fuel prices may encourage additional diesel
penetration

SummaryTechnology Driven Trends• Diesel technological advancements over past 15 years
have radically changed public perception of diesels– High performance (torque)– Fun to drive– Refined– Significant penetration in European luxury vehicle segments
• Diesel & gasoline technologies are converging– boost, direct injection, controls, & HCCI
• Must retain fuel economy advantages while meeting new emissions standards
• Diesel must overcome cost disadvantages

SummaryMarket Factors in North America• GM continues to apply North American diesel engines
where they maximize customer benefits:– Large vehicles– Towing & hauling utility applications
• U.S. market, with its larger vehicles, could benefit from diesel technology introduction
• Growing large truck diesel market share implies improved U.S. consumer acceptance of diesel engines
• Must address North American NOx standards(one sixth that of Europe)at an acceptable cost


Diesel Powertrain TechnologyAdvantages• Improved high load fuel economy versus alternatives• Improved low speed torque capacity• Consistent performance
– Robust fuel economy advantages are relatively insensitive to driving cycle
– Consistent utility attributes (gradeability, altitude performance)
• Fun to drive (even with small displacement powertrains)• Image powertrain for utility vehicles (customer willing to
pay premium)• Favorable taxation & fuel prices in specific markets

Diesel Powertrain TechnologyDisadvantages
• Higher cost than gasoline alternatives
• Poor diesel fuel quality in some regions
• Emissions & NVH are more challenging than for gasoline applications