lifetime costs of lung transplantation: estimation of incremental costs
TRANSCRIPT
ECONOMIC EVALUATION
LIFETIME COSTS OF LUNGTRANSPLANTATION: ESTIMATION OF
INCREMENTAL COSTS
PETRA J. VAN ENCKEVORT1*, MARC A. KOOPMANSCHAP2, ELISABETH M. TENVERGERT1,ALBERT GEERTSMA1, WIM VAN DER BIJ3, WIM J. DE BOER4 AND FRANS F. H. RUTTEN2
1Office for Medical Technology Assessment, University Hospital Groningen, The Netherlands2Institute for Medical Technology Assessment, Erasmus University Rotterdam, The Netherlands
3Department of Internal Medicine, University Hospital Groningen, The Netherlands4Department of Thoracic Surgery, University Hospital Groningen, The Netherlands
SUMMARY
Despite an expanding number of centres which provide lung transplantation, information about the incrementalcosts of lung transplantation is scarce. From 1991 until 1995, in The Netherlands a technology assessment wasperformed which provided information about the incremental costs of lung transplantation. Costs in the situationwith and without a transplantation programme were compared from a lifetime perspective. Becauserandomization was ethically inadmissible, only costs in the situation with the programme were observed. Bothconventional treatment costs and costs of the transplantation programme were registered. Costs in the situationwithout the programme were based on the conventional treatment costs in the situation with the programme. Dueto the study period of four years, long term follow-up costs were estimated. The total incremental costs pertransplanted patient were estimated at Dfl 466 767 (5% discounted costs). The main part of these costs was causedby the high costs during the lifetime follow-up of the patients. © 1997 by John Wiley & Sons, Ltd.
Health Econ. 6: 479–489 (1997)
No. of Figures: 2. No. of Tables: 5. No. of References: 16.
KEY WORDS — lung transplantation; incremental costs
INTRODUCTION
In 1983, the first successful single-lung trans-plantation was performed at the University ofToronto and in 1986 the Toronto team performedthe first double-lung transplantation. Theseresults stimulated an expanding number of cen-tres to resume clinical lung transplantations dur-
ing the second half of the 1980s. Between 1983and 1994, worldwide more than 100 centres wereproviding lung transplantation and 3836 single-and double lung transplants were performed.1
Despite various clinical studies2–4 and registrydata attesting to the improved survival rates forlung transplantation, important informationabout long-term quality of life after lung trans-plantation, costs and cost-effectiveness is still
*Correspondence to: P.J. van Enckevort, University Hospital Groningen, Office for Medical Technology Assessment, CMC4 Y2,P.O. Box 30.001, 9700 RB Groningen, The Netherlands. Tel. + 31 50 361 1148/ + 31 50 361 2152; fax + 31 50 361 1738; [email protected] grant sponsor: Fund of Investigational Medicine of the Dutch National Health Insurances Board; Contract grantnumber: OG 91-093
HEALTH ECONOMICS, VOL. 6: 479–489 (1997)
CCC 1057–9230/97/050479–11 $17.50 Received 6 September 1996© 1997 by John Wiley & Sons, Ltd. Accepted 14 March 1997

scarce. Evidence on costs and cost-effectivenesswas provided by Ramsey et al.5 in a 1995 pilotstudy. However, the sample size in this study wassmall and, among others, screening costs were leftout of the study. Therefore, the results wereconsidered as preliminary and further analyseswere encouraged by the authors.
In 1991, the Dutch National Health InsurancesBoard initiated a technology assessment (TA),which should provide information on costs, clin-ical effectiveness, quality of life, cost-effective-ness, the need for lung transplantation (Lgtx) andthe supply of donors. The Lgtx programme wascarried out by one centre only, the UniversityHospital Groningen (UHG). In the TA, the 5-yearexperience (1990–95) of the Lgtx programme inthis hospital was investigated. The results of theTA will be used by the Board in the decisionprocess on the incorporation of lung transplanta-tion in the Dutch benefits package.
For the assessment of the cost-effectiveness oflung transplantation, a comparison was madebetween the situation with and without an Lgtxprogramme. Both incremental costs per life yeargained and incremental costs per QualityAdjusted Life Year (QALY) gained wereassessed.6
In view of the expected positive effects of Lgtx,it was considered ethically inadmissible to per-form a randomized clinical trial. Consequently,only costs and effects in the situation with theprogramme were observed and costs and effectsin the situation without the programme wereestimated (on base of pre-transplantationevidence).
In this paper, the method and the results of theincremental cost assessment are described. Thismethod is not only relevant for the GroningenLgtx programme. Other transplantation pro-grammes and other health care programmeslacking an appropriate experimental controlgroup can also use this method.
PATIENTS AND PROGRAMME
In The Netherlands lung transplantation has beenperformed in the University Hospital Groningensince November 1990. The TA was based on datacollected between November 1990 and April1995.
Selection criteria for lung transplant recipients
in the Groningen programme are the presence ofirreversible, progressively disabling end-stage pul-monary or cardiopulmonary disease with a pre-dicted life-expectancy of less than 12–18months.7
Flowchart analysis was used to describe thepatients’ flow through the different phases of thetransplantation programme (Fig. 1). The followingprogramme phases were distinguished: applica-tion, outpatient screening, inpatient screening,pre-transplantation, waiting list, transplantation(perioperative and intensive care), inpatient fol-low-up and outpatient follow-up.
In the application phase, potential candidateswere identified on the basis of written informationof the referring physician. In the outpatientscreening phase patients visited the outpatientclinic for an initial screening. Once beyond thisinitial screening, the acceptable patients wereinvited for an inpatient screening. After formalinpatient screening, a final decision was takenabout acceptance of the patient for transplanta-tion. After acceptance, the patient entered thepre-transplantation phase. When the patient isregistered on the waiting list of Eurotransplant,the patient entered the waiting list phase. Patientsdropped out of the programme when they died,withdrew from the programme or did not contactthe lung transplant team for more than 12months.8
During the study period a total of 425 patientswere referred to the programme. Of those 425patients, 303 and 179 patients were accepted forthe outpatient and the inpatient screening, respec-tively. After complete screening 120 patients wereput on the waiting list. Finally, 57 patientsreceived a transplantation and 55 and 54 patientsentered the inpatient follow-up and the out-patient follow-up phase, respectively.
METHODS
In the cost-effectiveness analyses, the incrementalcosts per transplanted patient were assessed.Incremental costs are the differential costsbetween two alternatives,9 in this case the differ-ence in costs between the situation with andwithout transplantation. The incremental costswere assessed from a societal viewpoint and alifetime perspective. Hence both health care costsand costs outside the healthcare sector were
P. J. VAN ENCKEVORT ET AL.480
Health Econ., 6, 479–489 (1997) © 1997 by John Wiley & Sons, Ltd.

Fig. 1 Flowchart of the Groningen lung transplantation programme (1 July 1990 to 1 April 1995).
LIFETIME COSTS OF LUNG TRANSPLANTATION 481
© 1997 by John Wiley & Sons, Ltd. Health Econ., 6, 479–489 (1997)
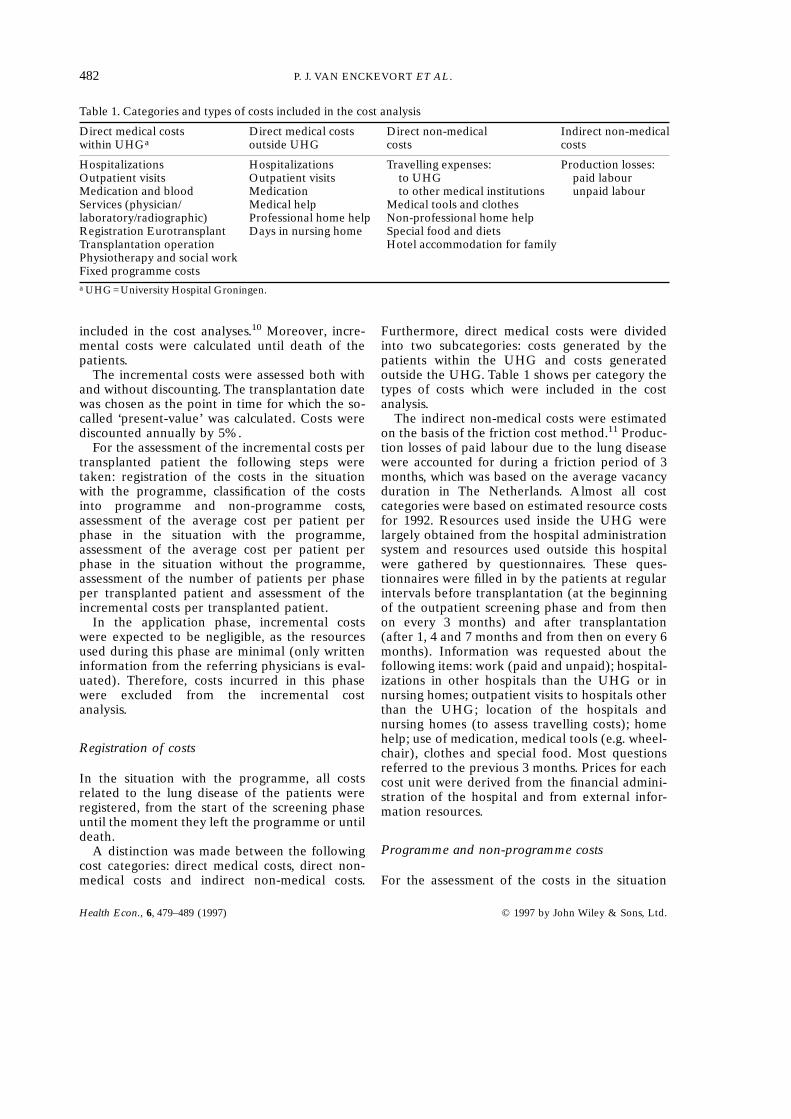
Table 1. Categories and types of costs included in the cost analysis
Direct medical costs Direct medical costs Direct non-medical Indirect non-medicalwithin UHGa outside UHG costs costs
Hospitalizations Hospitalizations Travelling expenses: Production losses:Outpatient visits Outpatient visits to UHG paid labourMedication and blood Medication to other medical institutions unpaid labourServices (physician/ Medical help Medical tools and clotheslaboratory/radiographic) Professional home help Non-professional home helpRegistration Eurotransplant Days in nursing home Special food and dietsTransplantation operation Hotel accommodation for familyPhysiotherapy and social workFixed programme costsa UHG=University Hospital Groningen.
included in the cost analyses.10 Moreover, incre-mental costs were calculated until death of thepatients.
The incremental costs were assessed both withand without discounting. The transplantation datewas chosen as the point in time for which the so-called ‘present-value’ was calculated. Costs werediscounted annually by 5%.
For the assessment of the incremental costs pertransplanted patient the following steps weretaken: registration of the costs in the situationwith the programme, classification of the costsinto programme and non-programme costs,assessment of the average cost per patient perphase in the situation with the programme,assessment of the average cost per patient perphase in the situation without the programme,assessment of the number of patients per phaseper transplanted patient and assessment of theincremental costs per transplanted patient.
In the application phase, incremental costswere expected to be negligible, as the resourcesused during this phase are minimal (only writteninformation from the referring physicians is eval-uated). Therefore, costs incurred in this phasewere excluded from the incremental costanalysis.
Registration of costs
In the situation with the programme, all costsrelated to the lung disease of the patients wereregistered, from the start of the screening phaseuntil the moment they left the programme or untildeath.
A distinction was made between the followingcost categories: direct medical costs, direct non-medical costs and indirect non-medical costs.
Furthermore, direct medical costs were dividedinto two subcategories: costs generated by thepatients within the UHG and costs generatedoutside the UHG. Table 1 shows per category thetypes of costs which were included in the costanalysis.
The indirect non-medical costs were estimatedon the basis of the friction cost method.11 Produc-tion losses of paid labour due to the lung diseasewere accounted for during a friction period of 3months, which was based on the average vacancyduration in The Netherlands. Almost all costcategories were based on estimated resource costsfor 1992. Resources used inside the UHG werelargely obtained from the hospital administrationsystem and resources used outside this hospitalwere gathered by questionnaires. These ques-tionnaires were filled in by the patients at regularintervals before transplantation (at the beginningof the outpatient screening phase and from thenon every 3 months) and after transplantation(after 1, 4 and 7 months and from then on every 6months). Information was requested about thefollowing items: work (paid and unpaid); hospital-izations in other hospitals than the UHG or innursing homes; outpatient visits to hospitals otherthan the UHG; location of the hospitals andnursing homes (to assess travelling costs); homehelp; use of medication, medical tools (e.g. wheel-chair), clothes and special food. Most questionsreferred to the previous 3 months. Prices for eachcost unit were derived from the financial admini-stration of the hospital and from external infor-mation resources.
Programme and non-programme costs
For the assessment of the costs in the situation
P. J. VAN ENCKEVORT ET AL.482
Health Econ., 6, 479–489 (1997) © 1997 by John Wiley & Sons, Ltd.
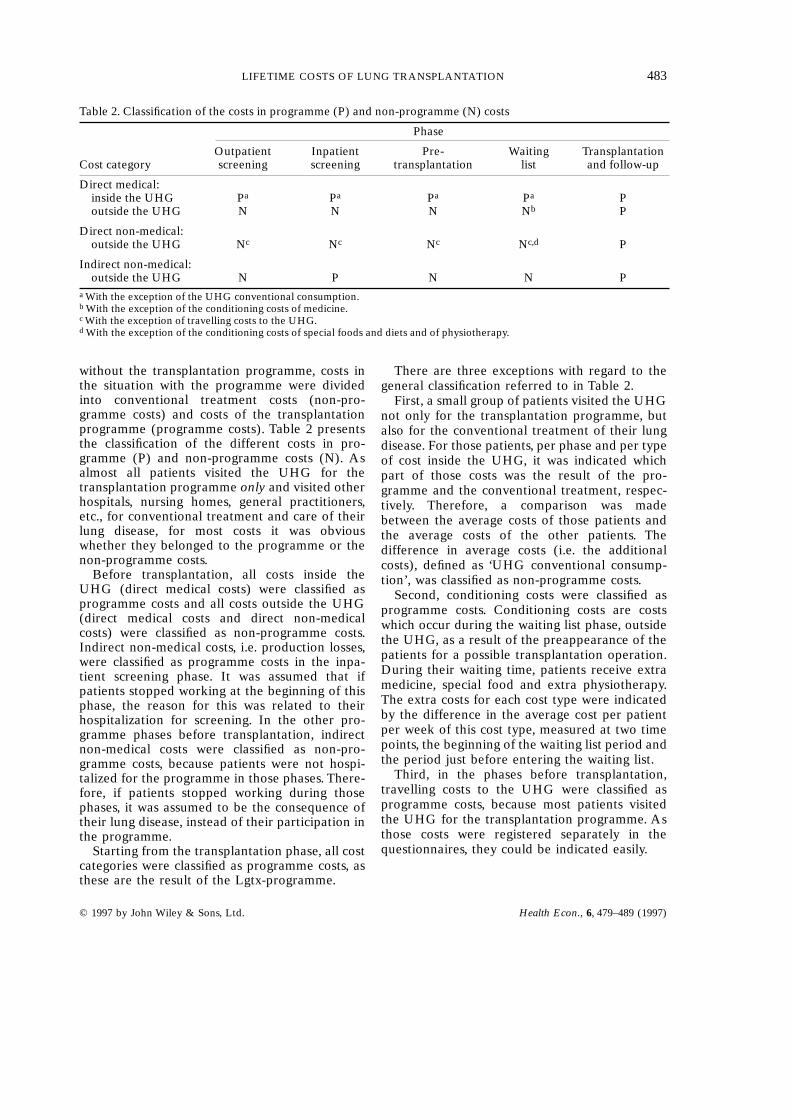
Table 2. Classification of the costs in programme (P) and non-programme (N) costs
Phase
Outpatient Inpatient Pre- Waiting TransplantationCost category screening screening transplantation list and follow-up
Direct medical:inside the UHG Pa Pa Pa Pa Poutside the UHG N N N Nb P
Direct non-medical:outside the UHG Nc Nc Nc Nc,d P
Indirect non-medical:outside the UHG N P N N P
a With the exception of the UHG conventional consumption.b With the exception of the conditioning costs of medicine.c With the exception of travelling costs to the UHG.d With the exception of the conditioning costs of special foods and diets and of physiotherapy.
without the transplantation programme, costs inthe situation with the programme were dividedinto conventional treatment costs (non-pro-gramme costs) and costs of the transplantationprogramme (programme costs). Table 2 presentsthe classification of the different costs in pro-gramme (P) and non-programme costs (N). Asalmost all patients visited the UHG for thetransplantation programme only and visited otherhospitals, nursing homes, general practitioners,etc., for conventional treatment and care of theirlung disease, for most costs it was obviouswhether they belonged to the programme or thenon-programme costs.
Before transplantation, all costs inside theUHG (direct medical costs) were classified asprogramme costs and all costs outside the UHG(direct medical costs and direct non-medicalcosts) were classified as non-programme costs.Indirect non-medical costs, i.e. production losses,were classified as programme costs in the inpa-tient screening phase. It was assumed that ifpatients stopped working at the beginning of thisphase, the reason for this was related to theirhospitalization for screening. In the other pro-gramme phases before transplantation, indirectnon-medical costs were classified as non-pro-gramme costs, because patients were not hospi-talized for the programme in those phases. There-fore, if patients stopped working during thosephases, it was assumed to be the consequence oftheir lung disease, instead of their participation inthe programme.
Starting from the transplantation phase, all costcategories were classified as programme costs, asthese are the result of the Lgtx-programme.
There are three exceptions with regard to thegeneral classification referred to in Table 2.
First, a small group of patients visited the UHGnot only for the transplantation programme, butalso for the conventional treatment of their lungdisease. For those patients, per phase and per typeof cost inside the UHG, it was indicated whichpart of those costs was the result of the pro-gramme and the conventional treatment, respec-tively. Therefore, a comparison was madebetween the average costs of those patients andthe average costs of the other patients. Thedifference in average costs (i.e. the additionalcosts), defined as ‘UHG conventional consump-tion’, was classified as non-programme costs.
Second, conditioning costs were classified asprogramme costs. Conditioning costs are costswhich occur during the waiting list phase, outsidethe UHG, as a result of the preappearance of thepatients for a possible transplantation operation.During their waiting time, patients receive extramedicine, special food and extra physiotherapy.The extra costs for each cost type were indicatedby the difference in the average cost per patientper week of this cost type, measured at two timepoints, the beginning of the waiting list period andthe period just before entering the waiting list.
Third, in the phases before transplantation,travelling costs to the UHG were classified asprogramme costs, because most patients visitedthe UHG for the transplantation programme. Asthose costs were registered separately in thequestionnaires, they could be indicated easily.
LIFETIME COSTS OF LUNG TRANSPLANTATION 483
© 1997 by John Wiley & Sons, Ltd. Health Econ., 6, 479–489 (1997)

Situation with Lgtx: average costs
Except for the follow-up phase, average costs perpatient per phase were calculated by dividing thetotal costs measured in that phase (programmeand non-programme costs) by the number ofpatients in that phase during the study period.Patients for whom at the end of the study periodno decision had been taken yet in a particularphase were excluded from the analysis.
In the follow-up phase, average costs perpatient were calculated 3-monthly, as follows:average costs per quarter = (%survivors 3 aver-age costs per survived patient) + (%decease-d 3 average costs per deceased patient). Thesurvival percentages were based on the estimated(lifetime) survival curve of the transplantedpatients.12 The average costs per deceased patientrefer to the costs incurred by the deceasedpatients during the last 3 months they still werealive.
In the first 3 years of the follow-up phase, theaverage costs per patient were based on the costdata collected during the study period; the aver-age costs from the fourth follow-up year werebased on an extrapolation of the average costs perweek at the end of the third follow-up year.
The costs in the situation with the Lgtx pro-gramme are presented graphically in Fig. 2(A).Before transplantation there are programme andnon-programme costs. In the phases after trans-plantation there are only programme costs. Rela-tively high costs were expected in the phases inwhich patients are hospitalized according to thetreatment protocol.7
Situation without Lgtx: average costs
Costs in the situation without the Lgtx pro-gramme were derived from cost data in thesituation with the Lgtx programme. It wasassumed that in the period before transplantationthe conventional treatment of the patients wasnot influenced by the existence of the transplanta-tion programme. Therefore, the costs of theconventional treatment ( = non-programmecosts) in the situation with Lgtx were assigned tothe situation without it. The assignment is pre-sented graphically in Fig. 2(B) by the left area,which is the same as the shaded area in Fig. 2(A).The moment of transplantation shown in Fig. 2(B)is fictitious, as no transplantation operation is
performed in the situation withouttransplantation.
With the assignment of the costs, not all costs inthe situation without the Lgtx programme weredetermined. After all, if not transplanted, thepatients would also have lived for a certain periodfrom the fictitious moment of transplantation. Forthe period from ‘transplantation’ until death,average costs were calculated per quarter, in thesame way as in the follow-up phase in thesituation with the programme. The survival per-centages were based on the estimated (lifetime)survival curve of the patients on the waiting list.12
The average costs were based on an extrapolationof the average costs per patient per week in theperiod before ‘transplantation’. In Fig. 2(B) theestimated costs are shown by the right area.
Number of patients per transplanted patient
With the exception of the follow-up phase, thenumber of patients per phase per transplantedpatient was determined on the basis of therelationship between the number of patients whoentered a phase, the number of patients who weretransferred to another phase and the number oftransplanted patients. In the follow-up phase, thenumber of patients per transplanted patient weredetermined on the basis of the estimated survivalfigures.
Incremental costs
Incremental costs per transplanted patient werecalculated as follows: incremental costs per trans-planted patient = (average costs per patient perphase in the situation with Lgtx — average costsper patient per phase in the situation withoutLgtx) 3 number of patients per transplantedpatient. Finally, total incremental costs weredetermined by summing the incremental costs perphase.
RESULTS
Costs during the study period
For each phase the average costs per patient percost category, based on empirical data, are pre-sented in Table 3 (1 Dfl ø US $0·6). Table 4 gives
P. J. VAN ENCKEVORT ET AL.484
Health Econ., 6, 479–489 (1997) © 1997 by John Wiley & Sons, Ltd.

some additional information about the averagecosts per patient of the following cost types: UHGconventional consumption, conditioning costs andtravelling costs to the UHG.
Situation with Lgtx: average costs
The first column of Table 5 presents the totalaverage costs per patient per phase in thesituation with the transplantation programme. Inthe follow-up phase average costs per patient perphase were partly based on the measured costs
Fig. 2 Expected costs in the situations (A) with and (B) without the Lgtx programme.
LIFETIME COSTS OF LUNG TRANSPLANTATION 485
© 1997 by John Wiley & Sons, Ltd. Health Econ., 6, 479–489 (1997)
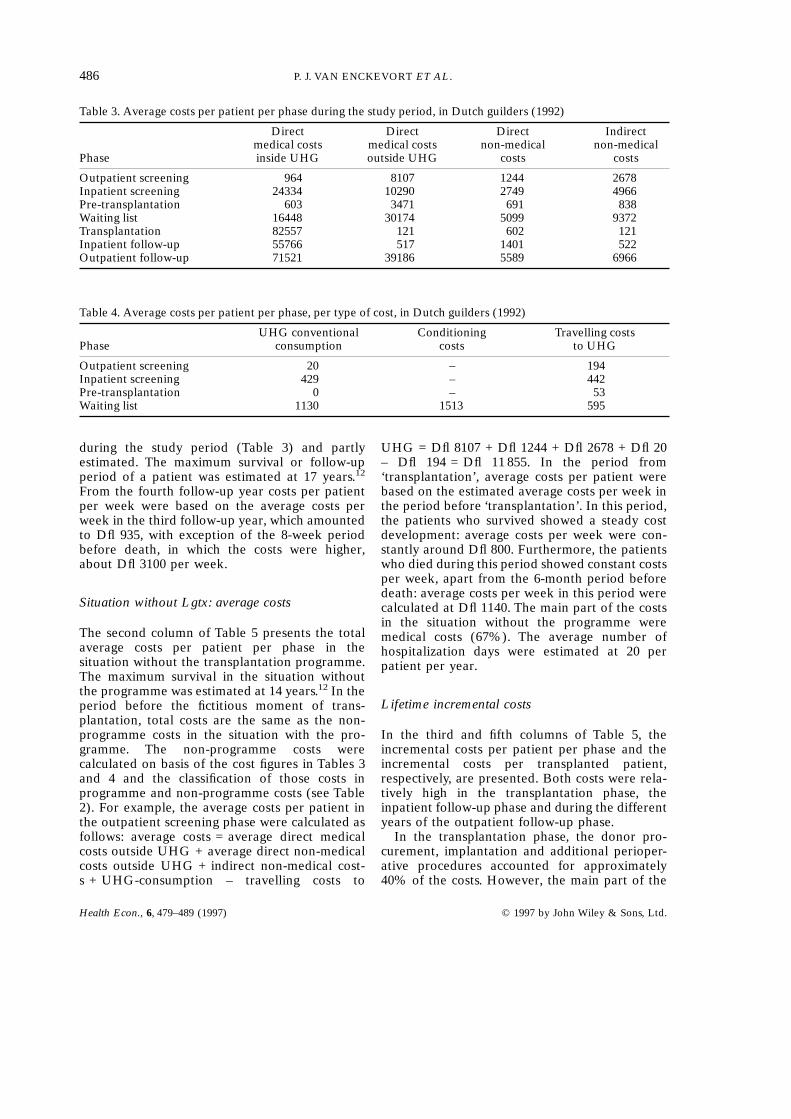
Table 3. Average costs per patient per phase during the study period, in Dutch guilders (1992)
Direct Direct Direct Indirectmedical costs medical costs non-medical non-medical
Phase inside UHG outside UHG costs costs
Outpatient screening 964 8107 1244 2678Inpatient screening 24334 10290 2749 4966Pre-transplantation 603 3471 691 838Waiting list 16448 30174 5099 9372Transplantation 82557 121 602 121Inpatient follow-up 55766 517 1401 522Outpatient follow-up 71521 39186 5589 6966
Table 4. Average costs per patient per phase, per type of cost, in Dutch guilders (1992)
UHG conventional Conditioning Travelling costsPhase consumption costs to UHG
Outpatient screening 20 – 194Inpatient screening 429 – 442Pre-transplantation 0 – 53Waiting list 1130 1513 595
during the study period (Table 3) and partlyestimated. The maximum survival or follow-upperiod of a patient was estimated at 17 years.12
From the fourth follow-up year costs per patientper week were based on the average costs perweek in the third follow-up year, which amountedto Dfl 935, with exception of the 8-week periodbefore death, in which the costs were higher,about Dfl 3100 per week.
Situation without Lgtx: average costs
The second column of Table 5 presents the totalaverage costs per patient per phase in thesituation without the transplantation programme.The maximum survival in the situation withoutthe programme was estimated at 14 years.12 In theperiod before the fictitious moment of trans-plantation, total costs are the same as the non-programme costs in the situation with the pro-gramme. The non-programme costs werecalculated on basis of the cost figures in Tables 3and 4 and the classification of those costs inprogramme and non-programme costs (see Table2). For example, the average costs per patient inthe outpatient screening phase were calculated asfollows: average costs = average direct medicalcosts outside UHG + average direct non-medicalcosts outside UHG + indirect non-medical cost-s + UHG-consumption – travelling costs to
UHG = Dfl 8107 + Dfl 1244 + Dfl 2678 + Dfl 20– Dfl 194 = Dfl 11 855. In the period from‘transplantation’, average costs per patient werebased on the estimated average costs per week inthe period before ‘transplantation’. In this period,the patients who survived showed a steady costdevelopment: average costs per week were con-stantly around Dfl 800. Furthermore, the patientswho died during this period showed constant costsper week, apart from the 6-month period beforedeath: average costs per week in this period werecalculated at Dfl 1140. The main part of the costsin the situation without the programme weremedical costs (67%). The average number ofhospitalization days were estimated at 20 perpatient per year.
Lifetime incremental costs
In the third and fifth columns of Table 5, theincremental costs per patient per phase and theincremental costs per transplanted patient,respectively, are presented. Both costs were rela-tively high in the transplantation phase, theinpatient follow-up phase and during the differentyears of the outpatient follow-up phase.
In the transplantation phase, the donor pro-curement, implantation and additional perioper-ative procedures accounted for approximately40% of the costs. However, the main part of the
P. J. VAN ENCKEVORT ET AL.486
Health Econ., 6, 479–489 (1997) © 1997 by John Wiley & Sons, Ltd.

Table 5. Lifetime incremental costs of lung transplantation, in Dutch guilders (1992)
Average Averagecosts per costs per Incremental Patients/ Costs/patient patient costs transplanted transplanted
with Lgtx without Lgtx per patient patient patient
Before transplantation:Outpatient screening 12993 11855 1138 2.50 2845Inpatient screening 42339 13026 29313 1.72 50418Pre-transplantation 5603 4946 657 1.46 958Waiting list 61093 43667 17426 1.42 24745Fixed programme costs 23802 23802
From transplantation:Situation with Lgtx:Transplantation 83402 83402 1.00 83402Inpatient follow-up 58748 58748 0.96 56398Follow-up:
year 1 79937 79937 0.96 76740year 2 65365 65365 0.85 55553year 3 59914 59914 0.76 45535years 4–17 249965
Situation without Lgtx:Transplantation until death:
year 1 38870 –38870 1.00 –38870year 2 38074 –38074 0.75 –28556year 3 37461 –37461 0.55 –20604years 4–14 –46393
Total incremental cost per transplanted patient: 535937
costs (60%) occurred after the operation, duringthe hospitalization on the intensive care (averagenumber of IC-days = 11). In the outpatient fol-low-up, about half of the costs were costs ofhospitalization, due to control visits and theoccurrence of infection and rejection episodes.About one third of the costs were costs ofimmunosuppression and other drugs.
Costs per transplanted patient were also high inthe inpatient screening phase, owing to a combi-nation of high costs per patient and a high numberof patients per transplanted patient.
The lifetime incremental costs per transplantedpatient were Dfl 535 937. About 65% of thosecosts were incurred during the outpatient follow-up phase. If discounted at 5%, the lifetimeincremental costs per transplanted patient wereDfl 466 767.
DISCUSSION
Until now, evidence on incremental costs of lungtransplantation was provided by Ramsey et al.5 in
a 1995 pilot study. In this study, the incrementalcosts were based on a comparison between thecosts of 25 transplanted patients and 24 patientson the waiting list. However, this study had somelimitations. First, because of the cross-sectionalstudy design, the characteristics of the patients inthe control group (patients on the waiting list)could differ from the research group (trans-planted patients) and therefore selection bias waspossible. Second, pre-transplantation costs (e.g.costs of screening) and indirect costs were notincluded and, as a result, incremental cost couldbe underestimated. Third, the sample size wassmall. Accordingly, the results were considered aspreliminary and further analyses were encour-aged by the authors.
In this paper, the method of the incrementalcost assessment of the Dutch lung transplantationprogramme was presented. For the assessment ofthe incremental costs, a comparison was madebetween the costs in the situation with andwithout the transplantation programme. Becauseno randomized clinical trial could be performed, aspecial method was used for the estimation of thecosts in the situation without the programme. The
LIFETIME COSTS OF LUNG TRANSPLANTATION 487
© 1997 by John Wiley & Sons, Ltd. Health Econ., 6, 479–489 (1997)

essence of this method was that costs in thesituation without the programme were based onthe measured costs of the conventional treatmentin the situation with the programme. Hence thepatients acted as their own control group. Inher-ent to the situation without an experimentalcontrol group, an unbiased estimate of the costs inthe situation without the programme was impos-sible. First, the classification of the costs intoprogramme and non-programme costs is some-what arbitrary for the indirect non-medical costs.For instance, in the inpatient screening phase, theproduction losses were assumed to be totally theresult of the programme, because the patients arehospitalized for screening. However, if not hospi-talized for screening, the patients could also havestopped working, because of their lung disease.Consequently, part of the indirect non-medicalcosts could be assigned to an incorrect costcategory (programme or non-programme costs),implying a certain bias in the costs of the situationwithout the programme. However, as mostpatients had already stopped working in theperiod before their participation in the pro-gramme, production losses are small according tothe friction cost method and therefore this biascould only have a minor effect on the totalincremental costs. Second, the non-programmecosts in the situation with the programme couldbe slightly influenced by the programme. Forexample, patients are prepared for the potentialtransplantation operation during their stay on thewaiting list. As a result, the condition of thepatients may, at least temporarily, be improved.This can lead to a decrease in the non-programmecosts, which would not occur in the situationwithout the programme. Consequently, non-pro-gramme costs in the situation without the pro-gramme could be slightly underestimated. How-ever, we expect this bias to be very small, as nosignificant change in the costs of the conventionaltreatment was shown during the waiting listperiod.
We think the method described could be veryuseful for the evaluation of other transplantationprogrammes lacking an experimental controlgroup. Compared with the methods used byothers for the evaluation of transplantation pro-grammes, e.g. Ramsey et al.,5 Buxton et al.,13
Bonsel et al.14 and van Hout et al.,15 we think themethod described in this paper gives a moreaccurate estimation of the incremental costs of atransplantation programme. In the method
described, (1) the control group is the same as theresearch group (contrary to Ramsey et al.’smethod), (2) pre-transplantation costs areincluded (contrary to Ramsey et al.’s method), (3)more cost categories are included (compared withall other methods) and (4) the classification of thecosts is based on medical foundations instead ofmathematical assumptions (compared with vanHout et al.’s method).
CONCLUSIONS
From the results, it can be concluded that lungtransplantation is rather expensive: lifetime incre-mental costs were estimated at about half amillion Dutch guilders. The main part of the costsof lung transplantation occurred after trans-plantation, during the lifetime follow-up of thepatients. An important part of the follow-up costsis caused by rehospitalizations of the patients andlifetime use of immunosuppression and otherdrugs.
In the future, if no additional restrictionsregarding the number of screened patients areimplemented, the incremental costs will probablybecome even higher. The number of patients onthe waiting list will grow and, therefore, thechance of dying on the waiting list will increase.This will lead to a situation in which morepatients, while generating costs during the screen-ing and the waiting list phase, will not receive atransplant. As a consequence, incremental costsper transplanted patient in those phases willincrease and therefore also total incrementalcosts.16
ACKNOWLEDGEMENT
This work was supported by grant OG 91-093 from the Fundof Investigational Medicine of the Dutch National HealthInsurances Board.
REFERENCES
1. St. Louis International Lung Transplant Registry,Report, April 1995.
P. J. VAN ENCKEVORT ET AL.488
Health Econ., 6, 479–489 (1997) © 1997 by John Wiley & Sons, Ltd.
2. de Hoyos, A. L., Patterson, G. A., Maurer, J. R.,Ramirez, J. C., Miller, J. D,, Winton, T. L. and theToronto Lung Transplant Group. Pulmonary trans-plantation; early and late results. Journal of Tho-racic and Cardiovascular Surgery 1992; 103:295–306.
3. Griffith, B. P., Hardesty, R. L., Armitage, J. M.,Hattler, B. G., Pharm, S. M., Keenan, R. J. andParadis, I. A decade of lung transplantation. Annalsof Surgery 1993; 218: 310–320.
4. Cooper, J. D., Patterson, A., Trulock, E. P. and theWashington University Lung Transplant Group.Results of single and bilateral lung transplantationin 131 consecutive recipients. Journal of Thoracicand Cardiovascular Surgery 1994; 107: 460–471.
5. Ramsey, S. D., Patrich, D. L., Albert, R. K., Larson,E. B., Douglas, E. W. and Raghu, G. The cost-effectiveness of lung transplantation; a pilot study.Chest 1995; 108: 1594–1601.
6. TenVergert, E. M., Geertsma, A., van Enckevort, P.J., van der Bij, W., de Boer, W. J., Koopmanschap,M. A. and Rutten, F. F. H. The cost-effectiveness ofthe Dutch lung transplantation programme. Euro-pean Respiratory Journal. In press.
7. de Boer, W. J. and Mannes, G. P. M. Behandeling-sprotocol Longtransplantieprogramma. Groningen,1993.
8. Geertsma, A., Mannes, G., van der Bij, W., de Boer,W. J. and TenVergert, E. M. Lung transplantation inThe Netherlands: first results of the medical tech-nology assessment. Transplantation Proceedings1995; 27: 3486–3487.
9. Drummond, M. F., Stoddart, G. L. and Torrance, G.W. Methods for the Economic Evaluation of HealthCare Programmes. Oxford: Oxford UniversityPress, 1987.
10. Gold, M. R., Siegel, J. E., Russell, L. B. andWeinstein, M. C. Cost-Effectiveness in Health andMedicine. Oxford: Oxford University Press, 1996.
11. Koopmanschap, M. A., Rutten, F. F. H., vanIneveld, B. M. and van Roijen, L. The friction costmethod for estimating the indirect costs of disease.Journal of Health Economics 1995; 14: 171–189.
12. van Enckevort, P. J., TenVergert, E. M., Bonsel, G.J., van der Bij, W., de Boer, W. J., Koopmanschap,M. A., Al, M. J. and Rutten, F. F. H. Technologyassessment of the Dutch lung transplantation pro-gram (1990–1995). International Journal of Technol-ogy Assessment in Health Care. In press.
13. Buxton, M. R., Acheson, R., Caine, N., Gibson, S.and O’Brien, B. Costs and Benefits of the HeartTransplantation Programmes at Harefield and Pap-worth Hospitals. London: HMSO, 1985.
14. Bonsel, G. J., Klompmaker, I. J., Essink-Bot, M. L.,Habbema, J. D. F. and Slooff, M. J. H. Cost-effectiveness analysis of the Dutch liver trans-plantation programme. Transplantation Proceed-ings 1990; 22: 1481–1484.
15. van Hout, B. A., Bonsel, G., Habbema, D., van derMaas, P. and De Charro, F. Heart transplantation inThe Netherlands; costs, effects and scenarios. Jour-nal of Health Economics 1993; 12: 73–93.
16. Al, M. J., Koopmanschap, M. A., Van Enckevort, P.J., Geertsma, A., Tenvergert, E. M., van der Bij, W.,de Boer, W. J. and Rutten, F. F. H. Cost-effective-ness of lung transplantation in the Netherlands; ascenario-analysis. Chest. In press.
LIFETIME COSTS OF LUNG TRANSPLANTATION 489
© 1997 by John Wiley & Sons, Ltd. Health Econ., 6, 479–489 (1997)