life cycle inventories of hydroelectric power...
TRANSCRIPT

Uster,
ESU-services Ltd. Kanzleistrasse 4 CH - 8610 UsterRolf Frischknecht T +41 44 940 61 91 [email protected] Jungbluth T +41 44 940 61 32 [email protected] Büsser T +41 44 940 61 35 [email protected] Karin Flury T +41 44 940 61 02 [email protected] René Itten T +41 44 940 61 38 [email protected] Salome Schori T +41 44 940 61 35 [email protected] Stucki T +41 44 940 67 94 [email protected] F +41 44 940 61 94
Life Cycle Inventories of Hydroelectric Power Generation
Karin Flury, Rolf Frischknecht
commissioned by
Öko-Institute e.V.

Imprint
Title Life Cycle Inventories of Hydroelectric Power Generation
Authors Karin Flury;Rolf Frischknecht
ESU-services Ltd., fair consulting in sustainability
Kanzleistr. 4, CH-8610 Uster
www.esu-services.ch
Phone +41 44 940 61 02, Fax +41 44 940 61 94
[email protected]; [email protected]
Commissioner Öko-Institute e.V.
About us ESU-services Ltd. has been founded in 1998. Its core objectives are consulting, coaching, training
and research in the fields of Life Cycle Assessment (LCA), carbon footprints, water footprint in the
sectors energy, civil engineering, basic minerals, chemicals, packaging, telecommunication, food
and lifestyles. Fairness, independence and transparency are substantial characteristics of our con-
sulting philosophy. We work issue-related and accomplish our analyses without prejudice. We
document our studies and work transparency and comprehensibly. We offer a fair and competent
consultation, which makes it for the clients possible to control and continuously improve their envi-
ronmental performance. The company worked and works for various national and international
companies, associations and authorities. In some areas, team members of ESU-services per-
formed pioneering work such as development and operation of web based LCA databases or quan-
tifying environmental impacts of food and lifestyles.
Copyright All content provided in this report is copyrighted, except when noted otherwise. Such information
must not be copied or distributed, in whole or in part, without prior written consent of ESU-services
Ltd. or the customer. This report is provided on the website www.esu-services.ch and/or the web-
site of the customer. A provision of this report or of files and information from this report on other
websites is not permitted. Any other means of distribution, even in altered forms, require the written
consent. Any citation naming ESU-services Ltd. or the authors of this report shall be provided to the
authors before publication for verification.
Liability Statement Information contained herein have been compiled or arrived from sources believed to be reliable.
Nevertheless, the authors or their organizations do not accept liability for any loss or damage aris-
ing from the use thereof. Using the given information is strictly your own responsibility.
Version Flury-2012-hydroelectric-power-generation.docx, 10/07/2012 10:28:00

Zusammenfassung
Life Cycle Inventories of Hydroelectric Power Generation - i - ESU-services Ltd.
Zusammenfassung In der vorliegenden Studie werden die Ökobilanzen der Stromerzeugung mit Was¬serkraft
dokumentiert. Es handelt sich hierbei um eine umfassende Aktualisierung und Erweiterung
der Sachbilanzdaten des ecoinvent Datenbestandes v2.2, welche auf den Mitte der neunziger
Jahre an der ETH Zürich erarbeiteten Ökobilanzdaten (Ökoinventare von Energiesystemen)
basieren.
Neben Speicher- und Flusskraftwerken wurden neu auch Kleinwasserkraftwerke bilanziert,
wobei unterschieden wird zwischen Kraftwerken, die in Anlagen der Wasserversorgung (Be-
wässerung, Trinkwasserbereitstellung) eingebunden sind, und alleinstehenden Kraftwerken.
Die Grösse der bilanzierten Kraftwerke entspricht dem produktionsgewichteten Durchschnitt
aller Speicher- beziehungsweise Laufwasser- oder Kleinwasserkraftwerke der Schweiz.
Daten zum Materialbedarf von Wasserkraftanlagen wurden revidiert und zum Teil mit Infor-
mationen aus neuen Publikationen ergänzt. Beton, Kies und Zement sind die massenmässig
wichtigsten Baustoffe, wobei bei den bilanzierten Kraftwerken oftmals entweder die Menge
Beton, oder die Mengen Zement und Kies bekannt sind. Im Weiteren werden Stahl in unter-
schiedlichen Qualitäten, Kupfer (neu in die Bilanzen aufgenommen) und weitere, hier nicht
aufgeführte Baustoffe und Materialien eingesetzt.
Gemäss aktuellen Forschungserkenntnissen liegen die direkten Treibhausgas-Emissionen pro
kWh Strom aus alpinen europäischen Speicherseen bei rund 1.4 g CO2-eq/kWh, bei Speicher-
kraftwerken in gemässigten Zonen gehen wir von rund 12 g CO2-eq/kWh aus. Bei den Lauf-
wasserkraftwerken spielt es eine Rolle, ob diese einen Stausee aufweisen oder nicht. Bei
Laufwasserkraftwerken mit Stausee liegen die Methan-Emissionen bei 0.67 g pro kWh
(knapp 13.4 g CO2-eq/kWh).
Ein weiterer wichtiger Aspekt stellt die Modellierung des Strombedarfs der Speicherpumpen
dar. Hierbei handelt es sich um diejenigen Pumpen, welche einem Stausee Wasser aus einem
anderen Einzugsgebiet oder aus tieferen Lagen zuführen.1 Neu wird dieser Netzstrombedarf
als Aufwand verbucht und nicht beim produzierten Wasserkraftstrom in Abzug gebracht.
Die Treibhausgas-Emissionen der Bereitstellung von Strom mit Wasserkraftwerken sind ver-
gleichsweise tief und schwanken zwischen 2 g CO2-eq/kWh ab Klemme integrierter Klein-
wasserkraftwerke, 3.8 g CO2-eq/kWh ab Klemme Laufwasserkraftwerk, 5.9 g CO2-eq/kWh
ab Klemme alpinem Speicherkraftwerk (netto, ohne Zulieferpumpen), und rund 16.6 g CO2-
eq/kWh ab Klemme Speicherkraftwerk in gemässigten Zonen.
Werden die hier bereitgestellten Sachbilanzdaten zu Flusswasserkraftwerken auf Anlagen
grösserer Leistung angewendet, dürften die Aufwendungen und damit auch die kumulierten
Emissionen tendenziell überschätzt werden. Dies entspricht einer konservativen Vorgehens-
weise.
Die in diesem Bericht beschriebenen Sachbilanzdaten sind in Übereinstimmung mit den Qua-
litätsrichtlinien des ecoinvent Datenbestands v2.2 erhoben und modelliert und werden im Da-
tenformat EcoSpold 1 zur Verfügung gestellt.
1 Speicherpumpen sind nicht zu verwechseln mit den Pumpspeicherpumpen, welche dazu dienen, zu Niederta-
rifzeiten Wasser aus einem tiefer liegenden Becken in ein höher gelegenes zu pumpen, um es zu einem späte-
ren Zeitpunkt (Hochtarif) wieder zu turbinieren.

Summary
Life Cycle Inventories of Hydroelectric Power Generation - ii - ESU-services Ltd.
Summary The aim of this study is to describe the environmental impacts of construction, operation and
deconstruction of hydroelectric power stations. The main focus is on power plants and their
conditions in Switzerland. The LC inventories are then extrapolated to alpine and non-alpine
regions of Europe and, in the case of storage power stations, to Brazil. Storage and pumped
storage power stations, run-of-river power stations with and without reservoirs and their mix
as well as small hydropower stations are covered in this report. Small hydropower stations are
differentiated between stations that are integrated in existing waterworks infrastructures and
standalone small hydropower stations. The inventory is composed of the three life cycle phas-
es construction, operation and deconstruction. The following inputs are examined: consump-
tion of cement, explosive agents, steel, copper, gravel, energy consumption of the construc-
tion, transport services (road and rail), land use, useful capacity of the reservoirs, turbined
water, particle emissions during construction, oil spill to water and soil and the emissions of
greenhouse gases from construction machines as well as from reservoirs (CO2, CH4, N2O) and
from electrical devices (SF6) emitted during the operation. All life cycle inventory datasets
established in this study are in compliance with the quality guidelines of ecoinvent data v2.2.
They are provided in the EcoSpold v1 data format.

Content
Life Cycle Inventories of Hydroelectric Power Generation - iii - ESU-services Ltd.
Content
ZUSAMMENFASSUNG I
SUMMARY II
CONTENT III
1 INTRODUCTION 1
1.1 Scope of the study ............................................................................................................................ 1
1.2 State of the hydropower production ................................................................................................. 1 1.2.1 Switzerland ............................................................................................................................. 1 1.2.2 Europe .................................................................................................................................... 2 1.2.3 World ...................................................................................................................................... 4
2 CHARACTERISATION AND DESCRIPTION OF THE SYSTEM 5
2.1 Power stations .................................................................................................................................. 5 2.1.1 Storage power stations .......................................................................................................... 5 2.1.2 Pumped storage power station .............................................................................................. 6 2.1.3 Run-of-river power stations .................................................................................................... 6
2.2 Small hydropower stations ............................................................................................................... 7
2.3 Specific properties of the alpine storage hydropower stations ......................................................... 7
2.4 Temporal focus ................................................................................................................................. 7
2.5 Expected useful life .......................................................................................................................... 8
2.6 Efficiency .......................................................................................................................................... 9
2.7 Functional unit ................................................................................................................................10
2.8 Hydrological and biological aspects ...............................................................................................11 2.8.1 Introduction ..........................................................................................................................11 2.8.2 Storage power stations ........................................................................................................11 2.8.3 Run-of-river hydropower stations .........................................................................................12
3 CONSTRUCTION OF HYDROELECTRIC POWER STATIONS 13
3.1 Introduction .....................................................................................................................................13
3.2 Storage power station ....................................................................................................................13 3.2.1 Cement, gravel and water ....................................................................................................13 3.2.2 Steel .....................................................................................................................................14 3.2.3 Copper .................................................................................................................................14 3.2.4 Explosives ............................................................................................................................14 3.2.5 Transport ..............................................................................................................................14 3.2.6 Construction energy .............................................................................................................15 3.2.7 Particle emissions ................................................................................................................16
3.3 Run-of-river power station ..............................................................................................................16 3.3.1 Cement, gravel and water ....................................................................................................16 3.3.2 Steel .....................................................................................................................................16 3.3.3 Copper .................................................................................................................................16 3.3.4 Explosives ............................................................................................................................17 3.3.5 Transport ..............................................................................................................................17 3.3.6 Construction energy .............................................................................................................17 3.3.7 Particle emissions ................................................................................................................17
3.4 Small hydropower stations .............................................................................................................17 3.4.1 Small hydropower stations integrated in waterworks ...........................................................18 3.4.2 Standalone small hydropower stations ................................................................................19
3.5 Data quality ....................................................................................................................................20

Content
Life Cycle Inventories of Hydroelectric Power Generation - iv - ESU-services Ltd.
3.6 Life Cycle inventories of the construction of hydropower plants ....................................................21
4 OPERATION OF THE HYDROELECTRIC POWER STATIONS 25
4.1 Storage power station ....................................................................................................................25 4.1.1 Land use ..............................................................................................................................25 4.1.2 Useful capacity of the reservoirs ..........................................................................................25 4.1.3 Water use and consumption ................................................................................................26 4.1.4 Electricity use .......................................................................................................................26 4.1.5 Use of lubricating oil .............................................................................................................26 4.1.6 Greenhouse gas emissions .................................................................................................27 4.1.7 SF6 emissions ......................................................................................................................27 4.1.8 Operation of certified storage hydropower stations .............................................................28
4.2 Pumped storage power station ......................................................................................................28 4.2.1 Land use, material input and emissions...............................................................................28 4.2.2 Electricity use .......................................................................................................................28
4.3 Run-of-river power station ..............................................................................................................28 4.3.1 Land use ..............................................................................................................................28 4.3.2 Useful capacity of the reservoirs ..........................................................................................30 4.3.3 Water use and consumption ................................................................................................30 4.3.4 Use of lubricating oil .............................................................................................................30 4.3.5 Greenhouse gas emissions .................................................................................................30
4.4 Small hydropower stations .............................................................................................................30
4.5 Data quality ....................................................................................................................................31
4.6 Life Cycle inventories of the operation of hydropower plants ........................................................32
5 DECONSTRUCTION OF THE HYDROPOWER STATIONS 36
5.1 Storage power stations ...................................................................................................................36
5.2 Run-of-river power stations ............................................................................................................36
5.3 Small hydropower stations .............................................................................................................37 5.3.1 Small hydropower plant in waterworks infrastructure ..........................................................37 5.3.2 Standalone small hydropower plant .....................................................................................37
5.4 Data quality ....................................................................................................................................37
6 LIFE CYCLE INVENTORY DATA OF HYDROPOWER STATIONS IN OTHER COUNTRIES 38
6.1 European hydropower stations ......................................................................................................38 6.1.1 Storage and pumped storage hydropower stations .............................................................38 6.1.2 Run-of-river ..........................................................................................................................39 6.1.3 Small hydropower ................................................................................................................39
6.2 Brazil ...............................................................................................................................................39
6.3 Life Cycle inventories of the operation of hydropower stations in other countries .........................40
7 CUMULATIVE RESULTS AND INTERPRETATION 50
7.1 Cumulative Energy Demand ..........................................................................................................50
7.2 Greenhouse gas emissions ............................................................................................................52
REFERENCES 42
APPENDIX 48

1. Introduction
Life Cycle Inventories of Hydroelectric Power Generation - 1 - ESU-services Ltd.
1 Introduction
1.1 Scope of the study
Hydropower is widely perceived as a clean energy source as it is renewable and, until recent-
ly, it is assumed that the operation of hydropower stations causes hardly any emissions of
pollutants. In this study the environmental impacts of electricity from hydroelectric power
stations in each stage of their life cycle (construction, operation, dismantling) are quantified.
The first environmental impacts occur during the construction of the power stations. This in-
cludes the activities of the construction itself and the production and transport of the materials
used (e.g. cement). Furthermore, there are hydrological aspects. The construction and opera-
tion of hydropower stations influences the spatial and temporal patterns of the water flow.
The aim is to describe the most important aspects of the environmental impacts of hydropow-
er stations in Switzerland. The following parameters are considered: consumption of cement,
explosive agents, steel, copper, gravel, energy consumption of the construction, transport ser-
vices (road and rail), land use, useful capacity of the reservoirs, turbined water, particle emis-
sions during construction, oil spill to water and soil and the emissions of greenhouse gases
from construction machines as well as from reservoirs (CO2, CH4, N2O) and from electrical
devices (SF6) emitted during the operation.
Storage and pumped storage hydropower stations, run-of-river hydropower stations and small
hydropower stations are analysed. It is not the intention to characterise single hydropower
stations but to find average data representing the hydropower mix in Switzerland and other
European and non-European countries.
The main part of the study is the identification and quantification of the material and energy
demand and the emissions caused and the waste produced. The total material and energy de-
mand is applied to the net electricity production. It is difficult and, if at all possible, very
sumptuous to access original data. Most of the Swiss hydropower stations have been con-
structed decades ago. The enormous labour was divided between different contractors which
had sub-contractors themselves. Therefore it is nearly impossible to access all the information
needed, if it is stored at all. The data used in this study are based on earlier studies (Bolliger &
Bauer 2007; Frischknecht et al. 1996) and their sources. Additional information is gained
from new publications such as from Vattenfall (2008) and Axpo (2008). The data sets on
small hydropower stations are based on the students thesis of Jean-Baptiste and Konersmann
(2000) and on Baumgartner and Doka (1998). Statistical data on the electricity production and
the installed capacity are gained from up to date statistical publications of the BFE (2010a, b,
2011b).
1.2 State of the hydropower production
1.2.1 Switzerland
Hydropower is the most important renewable energy source in Switzerland. In 2010
37.5 TWh of hydroelectricity were produced, which is 56.5 % of the total electricity genera-
tion in Switzerland in 2010. 24.2 % is generated from run-of-river hydropower stations,
32.3 % from storage hydropower stations. In the electricity statistics of the Swiss Federal Of-
fice of Energy, the pumped storage hydropower stations (i.e. basic water flow plants) are not

1. Introduction
Life Cycle Inventories of Hydroelectric Power Generation - 2 - ESU-services Ltd.
registered as electricity production sites because they show a net electricity consumption.
(BFE 2011a).
According to the hydropower statistics of 2010 (BFE 2011c) the Swiss hydropower stations
have an expected electricity production volume of 35.6 TWh. As shown in Tab. 1.1, over half
of it is generated in storage hydropower stations and the run-of-river hydropower stations con-
tribute 47 %. The total installed capacity is 13.3 GW (BFE 2011a, c). In 2008, small hydro-
power stations (<300 kW) had a production volume of 3’400 GWh, which is around 10 % of
the total annual hydropower electricity production. The capacity of small hydropower stations
is 760 MW2.
Tab. 1.1: Expected production volumes of the hydropower stations in Switzerland, including hydropower stations with an installed capacity of >300 kW. Pumped storage hydro-power plants are not included in total (BFE 2011c).
Power station Production
volume
(GWh)
Percentage Capacity
(MW)
Percentage
Run-of-river hydropower stations 16’611 46.7 % 3’707 27.5 %
Storage power stations 18’991 53.3 % 70.2 %
Mostly natural water supply 17’397 48.9 % 8’073 59.9 %
Partly pumped water supply 1’593 4.5 % 1’384 10.3 %
Pumped storage power stations 1’326 0‘316
Total (excl. pumped storage) 35’602 100.0 % 13’338 100.0 %
The capacity potential of hydropower in Switzerland is nearly exploited. The outlook of the
Swiss Academy of Engineering Sciences (SATW) states that the hydroelectricity production
of large-scale hydropower stations (>300 kW) will increase by 6% until 2050 (Berg & Real
2006). In future it is mainly the extension of existing power stations and the improvement of
the technology that will lead to a growth in the production volume. At the same time, regula-
tions of the residual flow will decrease the production potential (Frischknecht et al. 1996).
Compared to the large-scale hydropower, the growth potential of the electricity production
from small hydropower stations is still significant. The Swiss Academy of Engineering Sci-
ences (SATW) projects the amount of electricity produced in 2050 to be four times as much
as today’s generation. According to their roadmap, the number of small hydropower stations
will double till then (Berg & Real 2006).
1.2.2 Europe
In Europe, hydropower is an important energy source too. In the EU-27 countries, the electric-
ity generated from hydropower has a share of 10 % of the total net electricity production
(EUROSTAT 2010). In Austria and Norway the hydroelectricity accounts for even more than
half of the net electricity production (see Tab. 1.2).
2 Bundesamt für Energie, April 2011:
http://www.bfe.admin.ch/themen/00490/00491/00493/index.html?lang=de

1. Introduction
Life Cycle Inventories of Hydroelectric Power Generation - 3 - ESU-services Ltd.
Tab. 1.2: Hydropower electricity production and capacity in EU-27 countries (without pumped storage). Data are missing from Iceland, no hydropower generation in Malta and Cy-prus (EUROSTAT 2010).
Country <1 MW >1 MW -
<10 MW
>10 MW Share of total net
electricity production
Austria Production (GWh) 1'637 3'179 33'129 60.5 %
Capacity (MW) 454 725 7'040
Belgium Production (GWh) 26 207 176 0.5 %
Capacity (MW) 9 50 52
Bulgaria Production (GWh) 108 417 2'299 6.9 %
Capacity (MW) 39 191 1'890
Croatia Production (GWh) 1 94 5'121 44.2 %
Capacity (MW) 1 32 1'749
Czech Republic Production (GWh) 492 475 1'057 2.6 %
Capacity (MW) 151 141 753
Denmark Production (GWh) 12 14 - 0.1 %
Capacity (MW) 5 4 -
Estonia Production (GWh) 28 - - 0.3 %
Capacity (MW) 5 - -
Finland Production (GWh) 167 1'449 15'496 23.0 %
Capacity (MW) 31 285 2'786
France Production (GWh) 1'582 5'342 56'802 11.6 %
Capacity (MW) 455 1'604 18'823
Germany Production (GWh) 2'060 5'286 13'596 3.5 %
Capacity (MW) 561 842 2'104
Greece Production (GWh) 117 207 2'987 5.6 %
Capacity (MW) 44 114 2'319
Hungary Production (GWh) 16 34 163 0.6 %
Capacity (MW) 4 10 37
Ireland Production (GWh) 47 85 836 3.4 %
Capacity (MW) 23 20 196
Italy Production (GWh) 1'770 7'390 32'464 13.6 %
Capacity (MW) 437 2'105 11'190
Latvia Production (GWh) 64 6 3'038 61.1 %
Capacity (MW) 24 1 1511
Lithuania Production (GWh) 51 22 329 3.1 %
Capacity (MW) 17 8 90
Luxembourg Production (GWh) 7 126 - 3.8 %
Capacity (MW) 2 38 -
Netherland Production (GWh) - - 102 0.1 %
Capacity (MW) - - 37
Norway Production (GWh) 235 5'402 133'917 98.6 %
Capacity (MW) 48 1'048 27'150
Poland Production (GWh) 290 605 1'257 1.5 %
Capacity (MW) 74 183 672
Portugal Production (GWh) 67 670 6'060 15.2 %
Capacity (MW) 31 361 3'634
Romania Production (GWh) 99 549 1'6547 28.6 %
Capacity (MW) 61 292 6009
Slovakia Production (GWh) 58 108 3'874 15.2 %
Capacity (MW) 25 65 1'542
Slovenia Production (GWh) 264 193 3'561 26.2 %
Capacity (MW) 117 37 873

1. Introduction
Life Cycle Inventories of Hydroelectric Power Generation - 4 - ESU-services Ltd.
Spain Production (GWh) 674 2'357 20'469 7.8 %
Capacity (MW) 267 1'605 11'232
Sweden Production (GWh) 601 3'188 65'280 47.2 %
Capacity (MW) 101 815 15'436
Turkey Production (GWh) 38 472 32'760 17.5 %
Capacity (MW) 16 231 13'582
United Kingdom Production (GWh) 57 511 4'600 1.4 %
Capacity (MW) 65 108 1'456
1.2.3 World
The worldwide hydroelectricity generation amounts to 3.29 PWh (Tab. 1.4). Worldwide it is
mainly North and South America with a high share on total electricity production (see Tab.
1.3 and Tab. 1.4) while, for example, the Middle East, with its dry climate, has a hydroelec-
tricity production of a bit more than 1% of its total electricity production.
Tab. 1.3: Net electricity generation from hydropower and percentage of the total electricity pro-duction in different OECD countries of the world in 2010. Including pumped storage power production (IEA 2011).
Country Electricity production
from hydropower (GWh)
Percentage to the total
electricity production
Australia 15'070 6.60 %
Brazil3 369'556 79.75 %
Canada 348'392 58.15 %
Japan 88'189 8.61 %
Korea 6'215 1.33 %
Mexico 36'109 14.67 %
New Zealand 24'765 58.13 %
United States 281'739 6.75 %
Tab. 1.4: Hydroelectricity generation and its percentage of the total electricity production in different regions of the world in 2008, including pumped storage power production
3.
Region Electricity production
from hydropower (GWh)
Percentage to the total
electricity production
Africa 98’153 15.73 %
Asia excl. China 252’091 13.72 %
China 585’187 16.74 %
Latin America 673’862 63.02 %
Middle East 8’887 1.15 %
World 3'287’554 16.23 %
3 International Energy Agency, IEA, April 2011:
http://www.iea.org/stats/prodresult.asp?PRODUCT=Electricity/Heat

2. Characterisation and description of the system
Life Cycle Inventories of Hydroelectric Power Generation - 5 - ESU-services Ltd.
2 Characterisation and description of the system
2.1 Power stations
2.1.1 Storage power stations
Storage power stations are power plants with an appreciable reservoir. Depending on the drop
height it is distinguished between low, medium and high pressure power stations. The main
focus in this study is on the latter ones.
The pumped storage power stations are a special type of storage power stations. While con-
ventional storage power stations use water that comes from natural catchment areas higher up,
the pumped storage power stations pump water up to reuse it. The share of pumped water to
turbined water can reach up to 100 % (basic water flow plants). In this case the power plant
has no natural supply of water. Often, storage hydropower stations are a mix of both, storage
hydropower plants and pumped storage hydropower plants. Generally the different kinds of
power plants differ more in the way they are operated than in the way they are built. There-
fore the construction and deconstruction of storage hydropower stations and pumped storage
hydropower stations are modelled identically, while the operation of storage and pumped
storage hydropower plants is modelled separately. In this study, storage hydropower stations
include all hydropower stations with a share of pumped water to turbined water of less than
100 % (see Tab. 2.1). Consequently it includes also hydropower stations that are commonly
called pumped hydropower stations. The pumped storage hydropower stations modelled in
this study only include basic water flow plants though. These are plants with no natural water
supply. Following the two terms storage hydropower station and pumped storage hydropower
station are used according to this definition.
Tab. 2.1: Classification of the hydropower stations.
Common nam-
ing
Storage hydropower
stations
Pumped storage hydro-
power stations
Basic water flow plants
Share of pumped
water to turbined
water
0 %, only basic operation < 100% 100%
Categories in this
study Storage hydropower station Pumped storage hydro-
power station
The capacity of the reservoirs differs between the storage power stations: It can range from
the storage capacity of water for a whole year down to only one day. Strictly speaking, even
the run-of-river power stations have a small reservoir where the water is hold back. In this
study the definition of storage power stations is made according to Frischknecht et al. (1996):
Power stations with dams higher than 30 meters are classified as storage hydropower stations.
This includes also a couple of high and medium pressure run-of-river power stations (BFE
2010b). Either are they part of clusters of power stations which are dominated by storage
power plants or they are power stations with a small storage capacity (e.g. Amsteg, Croix).
The first group of stations is left in the list of storage power plants, as it is not practical to
separate single power stations from the cluster. The other group of run-of-river power stations
could be added to the run-of-river power stations, but due to their construction they are more
similar to storage power plants than to run-of-river hydropower stations.
The sample of storage hydropower stations (including pumped storage hydropower stations)
considered in this study consists of 30 different groups with 52 dams. They are all situated in

2. Characterisation and description of the system
Life Cycle Inventories of Hydroelectric Power Generation - 6 - ESU-services Ltd.
Switzerland with an installed capacity of 8’565 MW and an expected net production of
16’639 GWh/a (BFE 2011c).
An average storage hydropower station is modelled in this study. It has a capacity of 95 MW
and the expected net production is 190 GWh/a. The expected lifespan of 150 years is speci-
fied in Subchapter 2.5. Efficiencies are discussed in Subchapter 2.6. Detailed information
about the storage hydropower stations is listed in Tab. 0.1 in the attachment.
2.1.2 Pumped storage power station
Pumped storage describes the circulation of water between a lower and an upper reservoir. It
can run in a closed circuit where the water is pumped up in the hours with low electricity
costs and turbined again when the demand and the costs for electricity are high. Pumped stor-
age is also on hand, if the water is pumped up to a hydropower station to increase the inflow
or for seasonal storage. In this study, only the hydropower stations with a closed circuit are
considered as pumped storage hydropower stations. The others are included in the storage
hydropower stations due to their similarities.
Depending on the altitude ratio of the pumping and the turbination of the water, there is either
no net electricity generation (altitude ratio > 0.7) or the amount of net produced electricity
corresponds to the difference between the electricity needed for pumping and the total elec-
tricity produced (altitude ratio < 0.7).
In the statistics of the hydropower stations the pumped storage power stations with a closed
water circulation and no net electricity generation are not considered (BFE 2010b), the pro-
duced electricity is included in the statistics of electricity production though (BFE 2010a).
The expected annual electricity generation of pumped storage is roughly 1’300 GWh (BFE
2011a, c), which represents 3.5 % of the total gross hydropower production in Switzerland.
The yearly electricity consumption of the pumps is 1’657 GWh (BFE 2011a, c). This results
in an efficiency of 0.8 (BFE 2011a). The pumping electricity stems partly from the hydro-
power stations themselves. However, the main part is drawn from the Swiss electricity mix.
This is considered in the inventory in Section 4.2.2.
There are no standalone pumped storage power stations but they normally are integrated in a
group of hydro power stations (storage and run-of-river power stations) sharing reservoirs and
other infrastructures. Therefore it is not feasible to establish a separate inventory of the con-
struction of pumped storage power stations. The inventory of the construction and deconstruc-
tion of the reservoirs is the same for storage power stations and the pumped storage power
stations. The operation is inventoried separately.
2.1.3 Run-of-river power stations
The run-of-river power stations can also be divided into high, medium and low pressure pow-
er stations. The last category is the most common one including the power plants in rivers and
canals.
As already mentioned above, some high pressure run-of-river hydropower stations are already
taken into account in the list of the storage hydropower stations. The set of run-of-river power
stations considered in this study is therefore mainly based on low pressure power plants.
Run-of-river power stations in Switzerland with an installed capacity of 3707 MW are consid-
ered. They have an expected annual net production of 16’611 GWh (BFE 2011c). The ex-
pected life span of the infrastructure and the machines is described in Subchapter 2.5. The
efficiency of the run-of-river power stations is specified in Subchapter 2.6. The average run-

2. Characterisation and description of the system
Life Cycle Inventories of Hydroelectric Power Generation - 7 - ESU-services Ltd.
of-river hydropower station modelled in this study has a capacity of 8.6 MW and the expected
net production is 38.5 GWh/a.
2.2 Small hydropower stations
The category of small hydropower stations includes all the hydropower stations with a capaci-
ty below 300 kW (BFE 2010b). In other definitions hydropower stations with a capacity up to
1 MW are included4. A lot of them have been constructed during the industrialisation. First
they were used as mechanical driving mechanism later they were converted to generate elec-
tricity. When the larger power stations were built and the production cost fell, the small hy-
dropower stations were abandoned (Programm Kleinwasserkraftwerke 2010).
Due to action programmes of the Swiss Federal Office of Energy (SFOE) promoting renewa-
ble energy, the small hydropower stations have come back5. In 2008 small hydropower sta-
tions with a capacity of 760 MW and an annual production of 3’400 GWh were in operation6.
They are situated in rivers and ravines but also in infrastructures such as drinking water sup-
ply systems, waste water treatment facilities, tunnels and the infrastructure for the production
of artificial snow (Programm Kleinwasserkraftwerke 2010).
The small hydropower stations under study have a total capacity of 1.2 MW and a net produc-
tion of 6.8 GWh/a (Baumgartner & Doka 1998; Jean-Baptiste & Konersmann 2000). They are
located in rivers, in a drinking water supply system, in small ravines and in an irrigation sys-
tem. The sample is divided into two groups: the power stations integrated in waterworks in-
frastructures and standalone hydropower stations (e.g. in rivers). This allows accounting for
the differences in material consumption. The average small hydropower station modelled (in
both groups) has a capacity of 193 MW and the expected net production is 1.1 GWh/a.
2.3 Specific properties of the alpine storage hydropower stations
Due to topographical, geological, climatic and hydrological differences as well as their state
of technology, the hydropower plants in Switzerland are different from each other. There are
no standards and each one has its own characteristics. In this study, a sample of 52 storage
power stations is examined. The most important information is collected for all of them,
whereas some specific aspects are investigated only on a few power stations and then extrapo-
lated to the whole sample.
2.4 Temporal focus
The aim of this study is to analyse the environmental impacts of the Swiss hydroelectricity
mix of today. Most of the Swiss hydro power stations have been erected between 1945 and
1970. As they still produce most of the hydropower electricity, it is not the latest technology
that is described but the actual hydropower production mix.
4 Programm Kleinwasserkraftwerke, BFE, April 2011:
http://www.bfe.admin.ch/kleinwasserkraft/index.html?lang=de 5 Programm Kleinwasserkraftwerke, BFE, April 2011:
http://www.bfe.admin.ch/kleinwasserkraft/index.html?lang=de 6 Bundesamt für Energie, April 2011:
http://www.bfe.admin.ch/themen/00490/00491/00493/index.html?lang=de

2. Characterisation and description of the system
Life Cycle Inventories of Hydroelectric Power Generation - 8 - ESU-services Ltd.
The life cycle inventory of hydropower is modelled as if its infrastructure is continuously re-
placed. Each kWh of electricity produced asks for a tiny fraction of the erection of the power
plant.
It is assumed that in the early phase of hydropower development in Switzerland the most con-
venient locations have been used to build a power station (Frischknecht et al. 1996). Later
projects are forced to use less accessible or less suited locations. There, the constructions are
more complex and most often more material consuming. On the other hand, with the devel-
opment of technologies, less material is used and more energy is generated. Those two trends
tend to compensate each other, depending on the project.
2.5 Expected useful life
A decisive factor in quantifying the environmental impacts per kWh electricity is the technical
lifespan of the power stations. The technical lifespan is assumed to be between the economic
pay-back time and the actual lifespan. In Tab. 2.2, the approximated values of the economic
and the technical lifespan are given for different parts in a hydropower station.
Tab. 2.2: Approximate values of the pay-back time and technical lifespan in years of different parts in a hydropower station (Engel et al. 1985).
Station/function unit Pay-back
time
Technical
lifespan Aspects to be considered
Construction
Dams, tubes, tunnels, caverns, reservoirs,
artificial lakes, surge chambers 60-80 80-150
Duration of water rights, quality,
decay, security, losses
Buildings, 40-50 50-80 General conditions, wear, quality,
state of the art, security, corrosion,
maintenance Water catchment, weir, pressure pipes,
streets, bridges 40-50 40-60
Mechanical parts
Kaplan turbine 30-40 30-60
Security, losses, cavitation, erosion,
corrosion, fatigue, reduction in effi-
ciency, state of the art, quality, wear,
load, construction
Pelton turbine 40-50 40-70
Pump turbine 25-33 25-40
Storage turbine 25-33 25-40
Valves 25-40 25-50
Cranes, other mechanical parts 20-40 25-50
Electrical parts
Generators 25-40 30-60
Condition of the parts, cleanness,
wear, security, quality, maintenance
Transformers, high voltage facilities, other
electrical facilities, monitoring system, 20-25 30-40
Batteries 10-20 15-30
The listed values tend to be conservative. This could result in an underestimation of the
lifespans (Frischknecht et al. 1996): It is not expected that a reservoir shows major damages
after 80-150 years of use (Sinniger et al. 1991). The outer layers of the dam might get minor
damages due to frost and corrosion but it is possible to renovate them. The degradation of
concrete is hardly severe enough to damage a dam severely. Earthquakes, flooding and glaci-
ers are more capable to destroy a dam. The probability of these things to happen is, depending
on the region, quite low though.

2. Characterisation and description of the system
Life Cycle Inventories of Hydroelectric Power Generation - 9 - ESU-services Ltd.
However, there is another factor to be considered: the siltation. While this can happen fast in
small lakes (see e.g. artificial lake of Solis, completed in 19867), big reservoirs are assumed to
be fully functional for hundreds of years (Frischknecht et al. 1996).
In galleries, the concrete can be damaged too after a while depending on the water properties
and composition of the concrete. In this case a renovation is needed. The service life of galler-
ies can be longer than the one of reservoirs. In this case it is possible to turn a storage power
plant with a reservoir where for example the process of siltation is already very advanced or
even finished into an alpine run-of-river power station.
Depending on the type of turbine, their lifespan can be up to 300 years and more. This refers
to the low-speed motors of run-of river power stations. Pelton turbines on the other hand can
be worn by sand and the variations in the loading can lead to symptoms of fatigue. It can be
cost-effective to change a turbine already before the end of its lifespan in order to improve the
efficiency and by that the electricity production.
The above mentioned lifespans are summarised and averaged. The resulting values are shown
in Tab. 2.3. All calculations in this study are based on these values.
Tab. 2.3: Average lifespan in years of different parts of a storage and run-of-river power sta-tions (Frischknecht et al. 1996).
Parameter Storage power
station
Run-of-river
power station
Concrete 200 80
Reinforcing steel 150 80
Steel (rest) 80 40
Copper 1508 80
8
Explosives 250 100
Transport 150 60
Construction energy 150 80
2.6 Efficiency
There are different possible causes and places for losses in hydropower stations: Unused drop
height, friction in the galleries and tubes and inefficiencies in the turbines.
The losses due to frictions are estimated to 5 % on average (Bischof 1992) while the turbines
cause losses between 9 and 13 %, depending on their age. The efficiency of the generators has
not increased very much: Modern generators reach 98 % and is only 2 % higher than the aver-
age of all the Swiss hydropower plants (König 1985). We assume that today the average effi-
ciency of generators operated in hydroelectric power stations is 97 %.
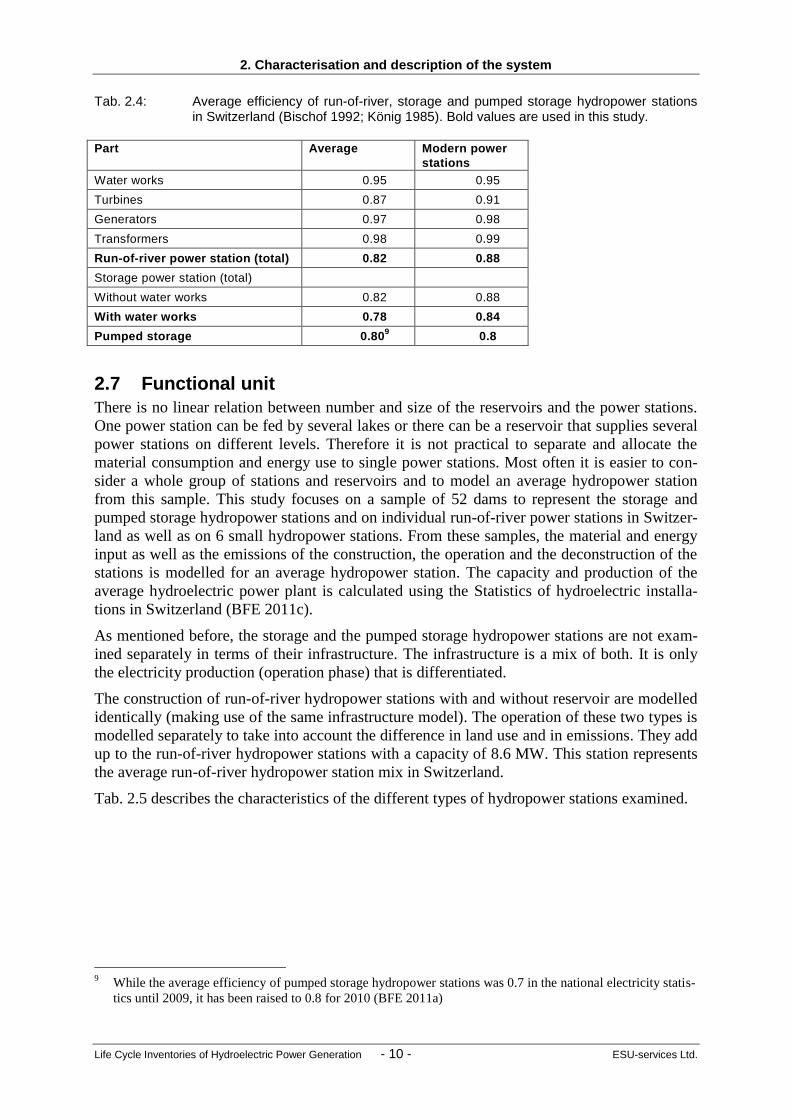
Tab. 2.4 summarises the estimated efficiencies of modern power stations as well as of today’s
portfolio of hydropower stations in Switzerland.
7 http://www.stadt-zuerich.ch/solis, access on November 9, 2011
8 Own assumption
2. Characterisation and description of the system
Life Cycle Inventories of Hydroelectric Power Generation - 10 - ESU-services Ltd.
Tab. 2.4: Average efficiency of run-of-river, storage and pumped storage hydropower stations in Switzerland (Bischof 1992; König 1985). Bold values are used in this study.
Part Average Modern power
stations
Water works 0.95 0.95
Turbines 0.87 0.91
Generators 0.97 0.98
Transformers 0.98 0.99
Run-of-river power station (total) 0.82 0.88
Storage power station (total)
Without water works 0.82 0.88
With water works 0.78 0.84
Pumped storage 0.809 0.8
2.7 Functional unit
There is no linear relation between number and size of the reservoirs and the power stations.
One power station can be fed by several lakes or there can be a reservoir that supplies several
power stations on different levels. Therefore it is not practical to separate and allocate the
material consumption and energy use to single power stations. Most often it is easier to con-
sider a whole group of stations and reservoirs and to model an average hydropower station
from this sample. This study focuses on a sample of 52 dams to represent the storage and
pumped storage hydropower stations and on individual run-of-river power stations in Switzer-
land as well as on 6 small hydropower stations. From these samples, the material and energy
input as well as the emissions of the construction, the operation and the deconstruction of the
stations is modelled for an average hydropower station. The capacity and production of the
average hydroelectric power plant is calculated using the Statistics of hydroelectric installa-
tions in Switzerland (BFE 2011c).
As mentioned before, the storage and the pumped storage hydropower stations are not exam-
ined separately in terms of their infrastructure. The infrastructure is a mix of both. It is only
the electricity production (operation phase) that is differentiated.
The construction of run-of-river hydropower stations with and without reservoir are modelled
identically (making use of the same infrastructure model). The operation of these two types is
modelled separately to take into account the difference in land use and in emissions. They add
up to the run-of-river hydropower stations with a capacity of 8.6 MW. This station represents
the average run-of-river hydropower station mix in Switzerland.
Tab. 2.5 describes the characteristics of the different types of hydropower stations examined.
9 While the average efficiency of pumped storage hydropower stations was 0.7 in the national electricity statis-
tics until 2009, it has been raised to 0.8 for 2010 (BFE 2011a)

2. Characterisation and description of the system
Life Cycle Inventories of Hydroelectric Power Generation - 11 - ESU-services Ltd.
Tab. 2.5: Characteristics for each type of hydropower station under study.
Hydropower station Capacity (MW) Expected annual net
production (GWh)
Lifespan
Storage hydropower, electricity 95 190 150
Pumped storage hydropower, electricity
Run-of-river hydropower 8.6 38.5 80
Small hydropower (integrated) 0.19 1.2 70
Small hydropower (standalone) 0.18 1.1 70
2.8 Hydrological and biological aspects
2.8.1 Introduction
This chapter describes the environmental impacts of the hydrological changes due to the con-
struction and operation of hydropower plants. This text was initially written by Hans Müller-
Lemans, Tergeso AG, Sargans and published in 1994 (Frischknecht et al. 1994).
The system is complex and the quantification and description of all processes and impacts is
either an enormous effort or it leads to a biased picture, if only parts are considered. Even if it
was possible to quantify all the influences, the focus on the hydrological implications of hy-
dropower stations hinders the comparison with other energy systems where the focus lies on
the material and energy demand and on the emissions caused by the energy and material sup-
ply and from the reservoirs.
As a consequence the hydrological and biological aspects are discussed only qualitatively in
the following paragraphs. In order to include at least a couple of factors the following ones are
quantified in the Sections 4.1.1-4.1.3 and 4.3.1-4.3.3: land use, useful capacity of the reservoir
and turbined water.
2.8.2 Storage power stations
The storage power stations influence the natural system mainly at two points: the reservoir
and the water catchment.
The reservoirs disrupt the natural flow of the water and, depending on the size of the reser-
voir, hold it back for a certain amount of time. Furthermore they are barriers for the actively
migrating fishes and invertebrates and the organisms that are transported passively from up-
stream regions. Depending on the type of the water catchment, special constructions for the
ascent of fishes and even invertebrates are available, but this kind of water catchments is not
very common among the Swiss storage power stations. The construction of storage hydro-
power stations results in the flooding of pastures, forests, moors and rubble fields that can be
part of valuable biotopes. The fluctuation of the water level inhibits the development of river-
ine vegetation and disfigures the landscape. Furthermore, the expanse of water can present a
barrier for the migration of animals. They need to find new routes, often in impassable terrain.
The water courses above the reservoirs are cut from those below. For the storage power
stations considered in this study, this concerns an area of 6’865 km2 (Schweizerisches
Talsperrenkomitee 2011).
The residual flow reach is highly influenced by the catchment and storage of the water. The
amount of water released just beneath the dam is mainly given by the amount of water statuto-
rily defined. Further downstream more factors influence the amount of water flowing: weath-
er, geology, topography. The quality of the residual flow does not only depend on the amount

2. Characterisation and description of the system
Life Cycle Inventories of Hydroelectric Power Generation - 12 - ESU-services Ltd.
of water but also on the properties of the streambed. The interrupt of the migration of fishes
and invertebrates described above has an impact on the residual flow reach too. The storage
power stations also interrupt the flow of coarse and fine grained organic substances that serve
as nutrients downstream. The reduced peaks of the outflow lower the capacity of the water to
transport the bed load. This might cause accumulations of rubble in the river bed. In sum-
mary, the storage power stations disturb the balance of solid matter in the river bed. This con-
cerns mostly the temporal distribution as well as the grading of the solid matter transported.
The stream after the backflow of the turbined water is exposed to fluctuations in the volume
of water due to temporal fluctuations in the electricity production. Fluctuations occur in a nat-
ural environment too. The biocoenosis is probably better adapted to fluctuations following
natural rhythms and patterns than to artificial ones though.
2.8.3 Run-of-river hydropower stations
The dams of run-of-river hydropower stations disrupt the flowing waters. The consequences
for fishes and invertebrates are described above. Depending on the type of dam, passage ways
are available. Generally, the dams of run-of-river power stations are more easily conquerable
than those of storage power stations. The transport of solid matter is mainly influenced by the
spillway. The overflow is less favourable than the release at the bottom. Further impacts of
the slack flow due to the dams are the following: The flow velocity decreases and this leads to
the sedimentation of solid matter. The decomposition of the sediments consumes the oxygen
and creates anoxic conditions. This process is supported by warmer water temperatures and a
longer retention time of the water. Due to the sedimentation of particles the gravel in the riv-
erbed is covered, which is unfavourable for species depending on gravel as spawning ground.
The parallel arrangement of the dams inhibits the settlement of a diverse biocoenosis. Only
the availability of a wide range of biotopes enables the settlement of a wide range of biocoe-
nosis.
Fishes can end up in the turbined water and get injured or killed. There are more or less suc-
cessful ways to avoid that.
Residual flow reach is mainly found in run-of-river power stations built in channels. The
problems of residual flow reaches are discussed above. They are influenced by the amount of
water statutorily defined, the interactions between the ground water and the river and the
structure of the river bed. In general, the problems of the residual flow reaches of run-of-river
power stations are less severe than those of storage power stations.
In the sector of the tail water, erosion can be a consequence of the sedimentation above the
dam. This leads to the recess of the riverbed. This can be avoided by the construction of bar-
rages in the tail water. It is a general fact, that run-of-river hydropower stations disturb the
transport of solid matter.
The area around a run-of-river power station is mainly influenced by the disruption due to
the dam as well as by the consequent adjustments of the confluences of inflows. This affects
the network of rivers and ravines and hinders fishes to use inflows as spawning grounds or as
shelter during high water. The dams inhibit the overflow of biotopes that are dependent on the
flooding with water and nutrients (e.g. floodplain forest). These biotopes have already been
destroyed in earlier years by the measures of flood prevention though. The separation of the
groundwater from the river has no immediate consequences, but it is an interference with the
natural flow of the water bodies.

3. Construction of hydroelectric power stations
Life Cycle Inventories of Hydroelectric Power Generation - 13 - ESU-services Ltd.
3 Construction of hydroelectric power stations
3.1 Introduction
In this Chapter the efforts and emissions related to the construction of the power stations are
described. The main focus lies on the most important building materials such as cement, steel
and explosives as well as on the transport and construction energy. In addition, the consump-
tion of copper is quantified, which has been neglected in previous studies.
The demand in material and energy needed to construct power stations is related to the annual
electricity produced. The system analysed includes the reservoirs, the dams and the associated
buildings and the transformer. The distribution of the electricity is modelled in separate da-
tasets.
3.2 Storage power station
In this Subchapter the life cycle inventory of the construction of an average storage hydro-
power station in Switzerland is described. The infrastructure is used for the generation of elec-
tricity by storage and pumped storage hydroelectric power plants. The term “plant” refers to
the average hydropower station with the characteristics described in Tab. 2.5.
3.2.1 Cement, gravel and water
In terms of mass, gravel and cement are the most important building materials used in hydro-
power stations. They are used for the dams, the injections (cement only), the galleries and
tunnels, the water catchment, the equalising reservoir, the buildings and the transport infra-
structure.
The most prominent part of a storage power station is the dam. There are two different types
of dams: the (concrete) dam and the barrage. As there are only few barrages in Switzerland,
this study concentrates on the dams.
There are several types of dams and all of them can be found in Switzerland. Depending on
the construction of those dams, the fraction of cement in the concrete varies from 140 to
300 kg/m3. The average concentration of cement in concrete in the present sample is
230 kg/m3 (see Tab. 0.1 in the Annex). Concrete is also used for injections into the under-
ground of the dams for the sealing and contact of the construction. These injections mainly
consist of concrete but there can also be additions of clay, smectite (bentonite), phosphate,
aluminate and silicate. Additionally a considerable amount of concrete is used in galleries and
tunnels. Depending on the function and construction of the tunnels, the amount of cement
used per meter varies considerably. There are not much data available about the cement con-
sumption in tunnels, neither about the construction of the buildings. Due to lack of data a
rough estimation is done: With the available data of a few power stations an average ratio
between the cement consumption in dams and the total amount of cement consumed is estab-
lished. This ratio is applied to all other power stations of the sample and, based on their ce-
ment consumption for the dams, their total cement consumption is estimated. The resulting
cement consumption is shown in Tab. 0.1 in the Annex.
Information sources used to quantify the cement consumption in storage hydropower stations
are: Aegina (1965), Bertschinger (1959), Biedermann et al. (1985), DesMeules (1961), Gicot
(1956), KVR (1968), Link (1970), Meyer (1960), Morf (1962), Salanfe (1951), Schnitter
(1961, 1971), Stucky (1962), Töndury (1956, 1964), Walther & Fetz (1963, 1971), Weber et
al. (1965, 1970), Zingg (1961).

3. Construction of hydroelectric power stations
Life Cycle Inventories of Hydroelectric Power Generation - 14 - ESU-services Ltd.
The total cement consumption and the average lifespan of 150 years for dams and 100 years
for galleries and tunnels result in a cement consumption of 1.02*108 kg/plant (3.42 g/kWh).
Concrete is made using cement, gravel and water. 1 m3 of concrete consists of 0.8 m
3 gravel,
0.127 m3 water and 0.073 m
3 cement which is equivalent to 2’000 kg, 127 kg and 230 kg re-
spectively (Bolliger & Bauer 2007). This results in a consumption of 5.65*107 kg/plant
(1.89 g/kWh) of water and 8.89*108 kg/plant (29.8 g/kWh) of gravel.
3.2.2 Steel
Steel (construction steel, reinforcing steel and stainless steel) is the second most important
material in terms of mass. Here, iron and cast iron is included in the total steel demand. Steel
has a wide range of applications: Reinforcement, rock anchors, armoured tubes, pressure
pipes, generators, transformers, turbines. Furthermore it is found in buildings and in the
transport infrastructure.
The steel consumption varies even more between the different power stations and only few
data are available. Information sources are Bertschinger (1959), Condrau (1962), KVR
(1968), Salanfe (1951), Walther und Fetz (1963, 1971), Weber (1965, 1971) and other
sources. A lifespan of 150 years is used for reinforcing steel and 80 years for the rest. The
specific steel consumption is about 0.26 g/kWh. A specific amount of 0.06 g/kWh is allotted
to reinforcing steel, 0.06 g/kWh to the machines and 0.14 g/kWh to the tubes and anchors etc.
The consumption of the whole plant is 1.74*106 kg/plant of reinforcing steel,
1.82*106 kg/plant of chromium steel and 4.07*10
6 kg/plant of low-alloyed steel.
3.2.3 Copper
Copper is part of the turbines and generators as well as electric cables. According to Vatten-
fall (2008), the copper consumption in the infrastructure of a Swedish storage hydropower
plant is 9.9*10-3
g/kWh. Applied on the power stations considered, this is a total amount of
2.96*105 kg/plant.
3.2.4 Explosives
Explosives are mainly used for the excavation of the fundament of the dam. Until 1970 also
the galleries and tunnels have been blasted. Nowadays electric drilling machines are used.
As the consumption of explosives are approximately proportional to the amount of excava-
tion, the measurement of the length and diameter of all the tunnels could be a basis to quantify
the amount of explosives used. This is laborious though. The consumption of explosives is
estimated based on the few data available (see Tab. 0.1). Information sources are Béguin et al.
(1963), Bertschinger (1959), Blenio Kraftwerke (1968), Condrau (1962), KVR (1963, 1968),
Töndury (1956, 1964), Weber et al. (1965) and other unpublished sources.
The average specific consumption of explosives is about 2*10-2
g/kWh. In total, it results in
5.95*105 kg/plant.
3.2.5 Transport
Most of the materials necessary to build the power stations need to be transported to the site.
In Switzerland, transports are done by train as far as possible. The tonnage is dominated by
the cement followed by the mass of the other materials: armoured tubes, reinforcing steel,
construction machines etc. To be cost efficient, sand and gravel were gained from quarries as

3. Construction of hydroelectric power stations
Life Cycle Inventories of Hydroelectric Power Generation - 15 - ESU-services Ltd.
close to the site as possible. In some cases long distance transports were necessary. Further
transports were caused by the excavated material.
From the closest railway station the transport was done by lorries. Often the streets leading to
the construction site had to be built or expanded first. In some cases, the location of the site
was inaccessible by road and a cableway was erected.
The transport is distinguished between the public transport network and the rest of the
transport to the construction site. In the first case the transport itself is analysed and generic
data are used to model the transport services. The second part is described via the energy con-
sumption (fuel for lorries, electricity for cableways). This has two reasons: Firstly, the as-
sessment of the wear of the streets and the noise does not have an effect outside of the public
transport network. Secondly, it is assumed that the emission factors of the lorries do not apply
under the conditions found on the routes leading to the construction site due to the steepness
and impassibility of the streets.
Due to their locations and accessibility, the transport figures vary a lot between the power
stations. The Bergeller Kraftwerke are analysed in a case study. The figures of the transport
on the public transport network in Tab. 3.1 are based on the data of Bertschinger (1959):
Tab. 3.1: Transport services required during the construction of storage hydropower stations.
Material Specific transport distances Total transport distances
Train Cement 7.40*10-4
tkm/kWh 2.21*107 tkm/plant
Other materials 1.33*10-4
tkm/kWh 3.98*106 tkm/plant
Total 8.73*10-4
tkm/kWh 2.61*107 tkm/plant
Lorry Cement 1.13*10-4
tkm/kWh 3.39*106 tkm/plant
Gravel and sand 3.33*10-5
tkm/kWh 9.96*105 tkm/plant
Other materials 1.33*10-5
tkm/kWh 3.98*105 tkm/plant
Total 1.60*10-4
tkm/kWh 4.78*106 tkm/plant
The material is transported 2.61*107 tkm/plant by train and 4.78*10
6 tkm/plant by lorry.
3.2.6 Construction energy
The construction of hydropower stations is energy intensive. Energy is used in construction
machines as well as for the transport of the material from the public transport network to the
construction site (see also Section 3.2.5). In the following the consumption of electricity and
fuel is described.
The electricity consumption sampled at the two sites Biasca and Linthal (Limmern) (see Tab.
0.1) amounts to an average specific value of 9.13*10-4
kWh/kWh. This results in the total
electricity consumption of 2.73*107 kWh/plant.
The specific use of fuel (mainly diesel) is around 4.67*10-2
g/kWh (Frischknecht et al. 1996).
It is assumed that the diesel is used in average building machines. Applying an average calo-
rific value of 42 MJ/kg this results in a total diesel consumption of 5.97*107 MJ/plant.
More detailed information about the energy consumption for the construction of hydropower
stations can be found in the following sources: Bertschinger (1959), Blenio Kraftwerke
(1968), KVR (1968), Töndury (1964), Walther und Fetz (1963), Weber et al. (1965), BFE
(1992) and other sources.

3. Construction of hydroelectric power stations
Life Cycle Inventories of Hydroelectric Power Generation - 16 - ESU-services Ltd.
3.2.7 Particle emissions
Due to raised dust from blasting, excavations, vehicles on non-asphaltic streets and the prepa-
ration of concrete considerable amounts of particle emissions may be caused from the con-
struction site of a hydropower station.
There is no specific information and data available about particle emissions during the con-
struction of a storage hydropower station. As an approximation, the amount of the emissions
is calculated according to the emission factors of general construction sites in Switzerland
(BUWAL 2001, 2003). According to this source, an average of 500 kg PM10 is emitted per
hectare, of which 15 % are PM2.5 emissions. The total amount of dust is 2’000 kg/ha. As a
first approach, twice the area covered with the dam and other infrastructure (see Subchapter
4.1), 1.4 ha is considered. This results in total emissions of 103 kg PM2.5, 2’063 kg PM>10
and 584 kg 2.5<PM<10. The construction of the storage power station emits a total amount of
2750 kg dust. This equals to 3.62*10-6
g of PM2.5, 6.90*10-5
g of PM>10 and 1.96*10-5
g of
2.5<PM<10 per kWh electricity produced.
3.3 Run-of-river power station
This Subchapter describes the construction of an average run-of-river hydropower station in
Switzerland. Its characteristics are described in Tab. 2.5. The term “plant” refers to this hy-
dropower station described.
3.3.1 Cement, gravel and water
It is expected that the average consumption of cement is lower for the run-of-river power sta-
tions than for the storage power station. As presented in Baumann (1949), Brux (1983), Her-
beck und Reismann (1977), NOK (1956), Radag (1979) and others, the average is around
1.88 g/kWh. It results in a total consumption of 5.78*106 kg/plant. The consumption of grav-
el amounts to 5.03*107 kg/plant (16.3 g/kWh) and 3.19*10
6 kg/plant (1.04 g/kWh) of water
is used.
3.3.2 Steel
Steel is to be found in different parts of a run-of-river power station. Apart from the use in
generators and transformers, steel is also consumed for reinforcement, bulkheads, stop logs,
screens, cranes and others.
The literature gives an average steel consumption of 30 g/(kWh/a) (Aegerter et al. 1954;
Baumann 1949; Brux 1983; Erbiste 1984; Herbeck & Reismann 1977; NOK 1956; Radag
1979; Stambach 1944; Wunderle 1984). The power station Wildegg-Brugg (NOK 1956) sug-
gests the following fractions for the different types of steel: 41 % reinforcing steel, 55 % low
alloyed steel (tubes, anchors…) and 4 % chromium steel (machines). Averaged over a
lifespan of 80 years for reinforcing steel and 40 years for the rest, the specific steel consump-
tion is 0.6 g/kWh. The total amount of reinforcing steel in the run-of-river hydropower station
is 4.73*105 kg/plant (0.15 g/kWh). The consumption of low-alloyed steel is
1.27*106 kg/plant (0.41 g/kWh) and of chromium steel it is 9.23*10
4 kg/plant (0.03 g/kWh).
3.3.3 Copper
Copper is used for turbines and generators as well as electric cables. It is assumed that the
specific copper consumption of 9.9*10-3
g/kWh specified by Vattenfall (2008), is also valid
for run-of-river hydropower stations. This results in a total amount of 3.05*104 kg/plant.

3. Construction of hydroelectric power stations
Life Cycle Inventories of Hydroelectric Power Generation - 17 - ESU-services Ltd.
3.3.4 Explosives
Even though there are no tunnels to be built for run-of-river power stations, there are other
purposes for which explosives are used: deepening of the river channel, removing big rocks
and mining of boulders. The amount used is estimated based on Bolliger and Bauer (2007),
where the specific consumption for the construction of the power station Wildegg-Brugg is
reported to be 6.3*10-4
g/kWh. Applied on the average power plant under study, this is
1.94*103 kg/plant.
3.3.5 Transport
There are hardly any data available for the transport services required to ship the material to
the site. Estimations based on Frischknecht et al. (1996) give values around 1.90*10-4
tkm/kWh for the transport by lorry as well as by train. This results in transport services of
5.84*105 tkm/unit.
3.3.6 Construction energy
Energy is needed to run the different construction machines as well as for the transport of the
construction materials and the excavated material. On-site, the transport is often carried out by
trucks. In earlier years steam locomotives with coal fuel firing were used.
Information about the electricity and fuel consumption is found in Baumann (1949), NOK
(1956) and Wunderle (1984). The specific energy consumption is 5.0*10-4
kWh/kWh of elec-
tricity and 0.11 g/kWh of diesel. Applied on the whole plant, it results in a electricity con-
sumption of 1.54*106 kWh/plant. The consumption of diesel amounts to 1.45*10
7 MJ/plant.
3.3.7 Particle emissions
There is not information on the particle emissions due to the construction of run-of-river pow-
er stations in Switzerland. It can be assumed that, in comparison to the storage power stations,
the emissions are lower as parts of the excavation work is taking place under water and as the
dams are smaller.
As an approximation, the amount of the emissions is calculated according to the emission
factors of general construction sites in Switzerland (BUWAL 2001, 2003). It is specified that
per hectare of area under construction a total amount of 2’000 kg dust is emitted. 500 kg of it
is PM10. Of the total PM10 emissions another 15 % is classified as PM2.5. For the applica-
tion of these factors to the run-of-river power stations under study, a total construction area of
0.34 ha is assumed. This corresponds to twice the area classified as “industrial area, built up”
(see Section 4.3.1). The particle emissions amount to: 2.58*101 kg/plant PM<2.5,
5.17*102 kg/plant PM>10 and 1.46*10
2 kg/plant 2.5<PM<10. Per kWh of produced electric-
ity the dust emissions consist of 8.40*10-9
kg PM<2.5, 1.68*10-7
kg PM>10 and 4.76*10-8
kg
2.5<PM<10.
3.4 Small hydropower stations
This Subchapter describes the construction of two types of small hydropower stations in
Switzerland. One station is integrated in waterworks infrastructure the other one is a
standalone small hydropower station. The term “plant” refers to the respective hydropower
station as described in Tab. 2.5.

3. Construction of hydroelectric power stations
Life Cycle Inventories of Hydroelectric Power Generation - 18 - ESU-services Ltd.
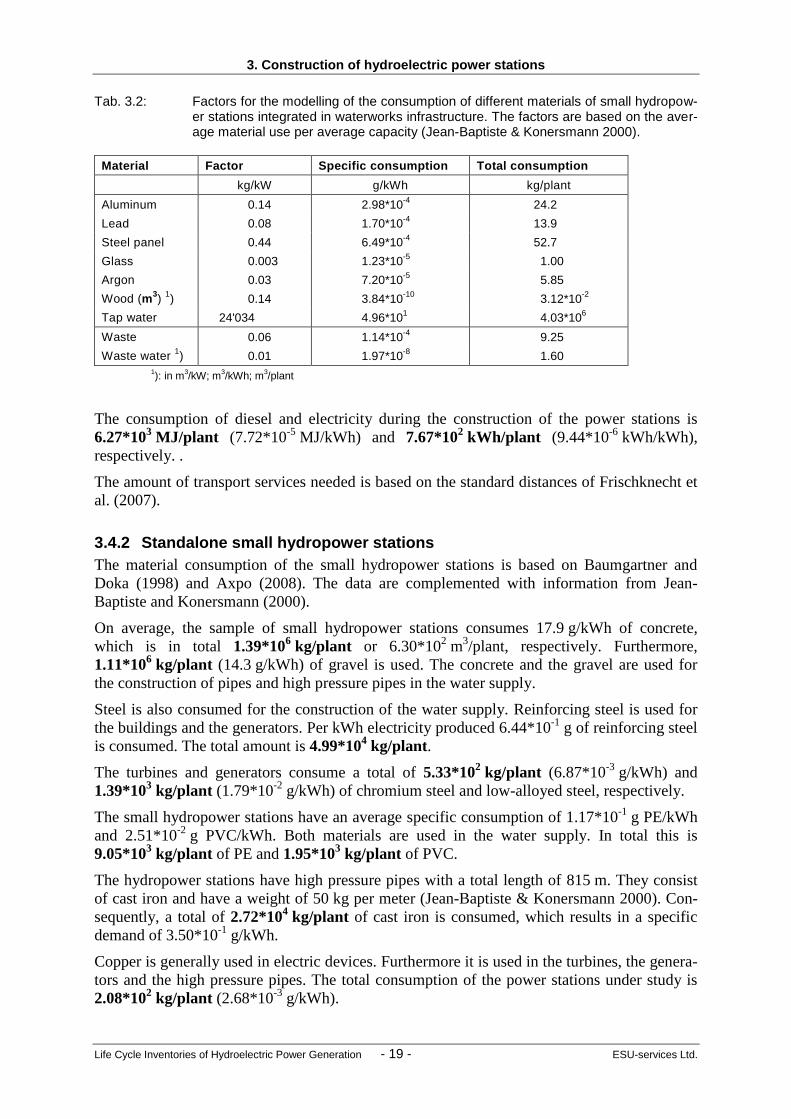
3.4.1 Small hydropower stations integrated in waterworks
The material consumption figures of the small hydropower stations integrated in waterworks
infrastructures are based on Baumgartner and Doka (1998) and on Jean-Baptiste and Koners-
mann (2000).
The sample of small hydropower stations integrated in waterworks infrastructure has an aver-
age specific consumption of 1.49 g/kWh of concrete, which is in total 1.21*105 kg/plant or
55.2 m3/plant, respectively. Additionally 5.21*10
5 kg/plant (6.41 g/kWh) gravel is used. Both
materials are mainly used for the pipes and high pressure pipes for the water supply.
The construction of the water supply consumes steel as well. Reinforcing steel is also used for
the buildings and the generators. The total amount consumed is 2.12*103 kg/plant (2.60*10
-2
g/kWh).
1.01*103 kg/plant and 1.31*10
3 kg/plant of chromium steel and low-alloyed steel, respec-
tively, are used in the turbines and the generators. This is based on the average specific con-
sumption of 1.24*10-2
g/kWh of chromium steel and 1.62*10-2
g/kWh of low-alloyed steel.
Polyethylene (PE) and polyvinylchloride (PVC) are further materials used in the construction
of the water supply. The small hydropower stations integrated in waterworks infrastructures
have a total consumption of 8.52*103 kg/plant (1.05*10
-1 g/kWh) of PE and
1.24*103 kg/plant (1.52*10
-2 g/kWh) of PVC.
High pressure pipes consist of cast iron. With an average weight of 50 kg per meter of pipe
(Jean-Baptiste & Konersmann 2000) and 2’290 m of length, the total amount of cast iron used
is 4.67*104 kg/plant (5.74*10
-1 g/kWh).
The total copper consumption amounts to 2.18*102 kg/plant (2.68*10
-3 g/kWh). Copper is
used in the turbines, generators, the electric devices as well as in the high pressure pipes.
In the material inventory of the hydropower stations described by Baumgartner and Doka
(1998), there is a category “miscellaneous”. No further information on this category is availa-
ble. Based on the study of Jean-Baptiste and Konersmann (2000), the consumption of alumin-
ium, lead, steel panel, glass, argon and wood as well as the amount of waste and waste water
is modelled based on the ratio of the average material use per average capacity (kW) of the
power station. The factors are only applied to the power stations described by Baumgartner
and Doka (1998). The original data are used to model the power stations of Jean-Baptiste and
Konersmann (2000). In Tab. 3.2 the modelling factors as well as the resulting average and
total consumptions are listed.
3. Construction of hydroelectric power stations
Life Cycle Inventories of Hydroelectric Power Generation - 19 - ESU-services Ltd.
Tab. 3.2: Factors for the modelling of the consumption of different materials of small hydropow-er stations integrated in waterworks infrastructure. The factors are based on the aver-age material use per average capacity (Jean-Baptiste & Konersmann 2000).
Material Factor Specific consumption Total consumption
kg/kW g/kWh kg/plant
Aluminum 0.14 2.98*10-4
24.2
Lead 0.08 1.70*10-4
13.9
Steel panel 0.44 6.49*10-4
52.7
Glass 0.003 1.23*10-5
1.00
Argon 0.03 7.20*10-5
5.85
Wood (m3)
1) 0.14 3.84*10
-10 3.12*10
-2
Tap water 24'034 4.96*101 4.03*10
6
Waste 0.06 1.14*10-4
9.25
Waste water 1) 0.01 1.97*10
-8 1.60
1): in m
3/kW; m
3/kWh; m
3/plant
The consumption of diesel and electricity during the construction of the power stations is
6.27*103 MJ/plant (7.72*10
-5 MJ/kWh) and 7.67*10
2 kWh/plant (9.44*10
-6 kWh/kWh),
respectively. .
The amount of transport services needed is based on the standard distances of Frischknecht et
al. (2007).
3.4.2 Standalone small hydropower stations
The material consumption of the small hydropower stations is based on Baumgartner and
Doka (1998) and Axpo (2008). The data are complemented with information from Jean-
Baptiste and Konersmann (2000).
On average, the sample of small hydropower stations consumes 17.9 g/kWh of concrete,
which is in total 1.39*106 kg/plant or 6.30*10
2 m
3/plant, respectively. Furthermore,
1.11*106 kg/plant (14.3 g/kWh) of gravel is used. The concrete and the gravel are used for
the construction of pipes and high pressure pipes in the water supply.
Steel is also consumed for the construction of the water supply. Reinforcing steel is used for
the buildings and the generators. Per kWh electricity produced 6.44*10-1
g of reinforcing steel
is consumed. The total amount is 4.99*104 kg/plant.
The turbines and generators consume a total of 5.33*102 kg/plant (6.87*10
-3 g/kWh) and
1.39*103 kg/plant (1.79*10
-2 g/kWh) of chromium steel and low-alloyed steel, respectively.
The small hydropower stations have an average specific consumption of 1.17*10-1
g PE/kWh
and 2.51*10-2
g PVC/kWh. Both materials are used in the water supply. In total this is
9.05*103 kg/plant of PE and 1.95*10
3 kg/plant of PVC.
The hydropower stations have high pressure pipes with a total length of 815 m. They consist
of cast iron and have a weight of 50 kg per meter (Jean-Baptiste & Konersmann 2000). Con-
sequently, a total of 2.72*104 kg/plant of cast iron is consumed, which results in a specific
demand of 3.50*10-1
g/kWh.
Copper is generally used in electric devices. Furthermore it is used in the turbines, the genera-
tors and the high pressure pipes. The total consumption of the power stations under study is
2.08*102 kg/plant (2.68*10
-3 g/kWh).

3. Construction of hydroelectric power stations
Life Cycle Inventories of Hydroelectric Power Generation - 20 - ESU-services Ltd.
The category “miscellaneous” in the inventory of Baumgartner and Doka (1998) is not further
specified. Therefore, the consumption of aluminium, lead, steel panel, glass, argon and wood
as well as the amount of waste and waste water is modelled based on the ratio of the average
material use per average capacity (kW) of the power station in the study of Jean-Baptiste and
Konersmann (2000). In Tab. 3.3 the modelling factors as well as the resulting average and
total consumptions are listed.
Tab. 3.3: Factors for the modelling of the consumption of different materials of standalone small hydropower stations. The factors are based on the average material use per average capacity (Jean-Baptiste and Konersmann 2000).
Material Factor Specific consumption Total consumption
unit kg/kW g/kWh kg/plant
Aluminum 0.14 3.45*10-4
26.8
Lead 0.08 2.09*10-4
16.2
Steel panel 0.44 1.09*10-3
84.5
Glass 0.003 7.26*10-6
0.56
Argon 0.03 8.67*10-5
6.73
Wood (m3)
1) 0.14 4.63*10
-10 3.59*10
-2
Tap water 24'034 5.97*101 4.63*10
6
Waste 0.06kg/kW 1.37*10-4
10.6
Waste water 1) 0.01m3/kW 2.37*10
-8 1.84
1): in m
3/kW; m
3/kWh; m
3/plant
The consumption of diesel and electricity during the construction of the power stations is
5.33*104 MJ/plant (6.87*10
-4 MJ/kWh), and 1.02*10
3 kWh/plant (1.31*10
-5 kWh/kWh),
respectively.
The amount of transport services needed is based on the standard distances of Frischknecht et
al. (2007).
3.5 Data quality
For the storage power stations, most of the data are based on information of the whole or parts
of the sample under study. The temporal and geographic correlation is good. The technology
described is the same as well. As the original data of the construction of the storage power
stations are not directly accessible, a basic uncertainty is given. It is increased due to missing
data and, for some inputs and emissions, the limited number of data samples. Information on
the copper consumption is derived from other power stations that are not part of the sample
under study. It can be assumed though that the technology is similar and that the geographic
differences do not influence the specific demand significantly. The modelling of the particle
emissions is not based on the same application and neither on the same geographic conditions,
which adds to the uncertainty. In general, the quality of the data is good. The data are well
suited to describe the system under study. More detailed investigations are mainly needed for
the construction energy (electricity and diesel) and the transport services required as well as
the particle emissions.
Specific figures necessary for the modelling of the construction phase of the run-of-river
power station are adopted from earlier studies (Bolliger & Bauer 2007; Frischknecht et al.
1996) and the original information sources are not available. This leads to a significant uncer-
tainty. The data are derived from some power stations under study and this provides a satisfy-
ing correlation in terms of geography, temporal aspects and technology though. On the other

3. Construction of hydroelectric power stations
Life Cycle Inventories of Hydroelectric Power Generation - 21 - ESU-services Ltd.
hand, the data-sets do not describe the whole set of power stations under study, therefore the
data-sets are not complete and the necessary extrapolations increase the general uncertainty.
The particle emissions are modelled based on data from another application (general construc-
tion sites), which leads to uncertainties. In general, the data are well suited to describe the
system under study.
The original data of the small hydropower stations integrated in existing waterworks infra-
structure are very detailed and accurate. The sample size of the small hydropower stations for
both groups is rather small though and possible outliers get more weight. This leads to a ra-
ther high uncertainty. There is a good correlation regarding technology, geography as well as
temporal aspects though. Certain assumptions were needed for the standalone small hydro-
power stations, which increases the uncertainties. Further investigations on the material re-
quirements and the construction efforts of small hydropower stations are recommended.
3.6 Life Cycle inventories of the construction of hydropower plants
In this Subchapter the unit process raw data of the construction of the hydropower plants are
presented.

3. Construction of hydroelectric power stations
Life Cycle Inventories of Hydroelectric Power Generation - 22 - ESU-services Ltd.
Tab. 3.4: Unit process raw data of reservoir hydropower plant/CH.
Name
Lo
ca
tio
n
Un
it
reservoir
hydropower
plant
Un
ce
rta
inty
Typ
e
Sta
nd
ard
De
via
tio
n9
5%
GeneralComment
Location CH
InfrastructureProcess 1
Unit unit
product reservoir hydropower plant CH unit 1
technosphere chromium steel 18/8, at plant RER kg 1.82E+6 1 1.24
(4,3,1,1,1,4,BU:1.05); Turbines and generators; recalculated based
on Bertschinger (1959), Condrau (1962), KVR (1968), Salanfe (1951),
Walther und Fetz (1963; 1971), Weber (1965; 1971) and other
sources.
diesel, burned in building machine GLO MJ 5.97E+7 1 1.24(4,3,1,1,1,4,BU:1.05); Fuel for construction machines; based on
Frischknecht et al. (1996)
explosives, tovex, at plant CH kg 5.95E+5 1 1.24
(4,3,1,1,1,4,BU:1.05); Tunnels and galleries; recalculated based on
Béguin et al. 1963, Bertschinger 1959, Blenio Kraftwerke 1968,
Condrau 1962, KVR 1963; 1968, Töndury 1956; 1964, Weber et al.
1965 and other sources.
gravel, round, at mine CH kg 8.89E+8 1 1.24
(3,5,1,1,1,2,BU:1.05); Concrete for dams, buildings and other
infrastructure; recalculated based on Aegina (1965), Bertschinger
(1959), Biedermann et al. (1985), DesMeules (1961), Gicot (1956),
KVR (1968), Link(1970), Meyer (1960), Morf (1962), Salanfe (1951),
Schnitter (1961; 1971), Stucky (1962), Töndury (1956; 1964), Walther
& Fetz (1963; 1971), Weber et al. (1965; 1970), Zingg(1961).
cement, unspecified, at plant CH kg 1.02E+8 1 1.24
(3,5,1,1,1,2,BU:1.05); Concrete for dams, buildings and other
infrastructure; recalculated based on Aegina (1965), Bertschinger
(1959), Biedermann et al. (1985), DesMeules (1961), Gicot (1956),
KVR (1968), Link(1970), Meyer (1960), Morf (1962), Salanfe (1951),
Schnitter (1961; 1971), Stucky (1962), Töndury (1956; 1964), Walther
& Fetz (1963; 1971), Weber et al. (1965; 1970), Zingg(1961).
reinforcing steel, at plant RER kg 1.74E+6 1 1.24
(4,3,1,1,1,4,BU:1.05); Buildings and other infrastructure; recalculated
based on Bertschinger (1959), Condrau (1962), KVR (1968), Salanfe
(1951), Walther und Fetz (1963; 1971), Weber (1965; 1971) and other
sources.
steel, low-alloyed, at plant RER kg 4.07E+6 1 1.24
(4,3,1,1,1,4,BU:1.05); Tubes and pipes; recalculated based on
recalculated based on Bertschinger (1959), Condrau (1962), KVR
(1968), Salanfe (1951), Walther und Fetz (1963; 1971), Weber (1965;
1971) and other sources.
copper, at regional storage RER kg 2.96E+5 1 1.34 (3,5,1,5,1,5,BU:1.05); Electric cables; Vattenfall (2008)
tap water, at user CH kg 5.65E+7 1 1.24
(3,5,1,1,1,2,BU:1.05); Concrete for dams, buildings and other
infrastructure; recalculated based on Aegina (1965), Bertschinger
(1959), Biedermann et al. (1985), DesMeules (1961), Gicot (1956),
KVR (1968), Link(1970), Meyer (1960), Morf (1962), Salanfe (1951),
Schnitter (1961; 1971), Stucky (1962), Töndury (1956; 1964), Walther
& Fetz (1963; 1971), Weber et al. (1965; 1970), Zingg(1961).
electricity, medium voltage, at grid CH kWh 2.73E+7 1 1.24
(4,3,1,1,1,4,BU:1.05); Electricity supply for the construction;
recalculated based on Bertschinger (1959), Blenio Kraftwerke (1968),
KVR (1968), Töndury (1964), Walther und Fetz (1963), Weber et al.
(1965), BFE (1992) and other sources.
disposal, building, reinforced
concrete, to recyclingCH kg 5.79E+7 1 1.24
(4,3,1,1,1,4,BU:1.05); Recycling of reinforced infrastructure; based on
Frischknecht (1996), assumed recycling rate: 100%
disposal, building, concrete, not
reinforced, to final disposalCH kg 9.36E+8 1 1.24
(4,3,1,1,1,4,BU:1.05); Non-inforced infrastructure left on-site at the
end of the use phase of the power station (especially the dams,
tunnels, galleries); based on Frischknecht et al. (1996)
disposal, building, reinforcement
steel, to recyclingCH kg 5.88E+6 1 1.24
(4,3,1,1,1,4,BU:1.05); Recycling of turbines, generators, tubes and
pipes; assumed recycling rate: 100%
transport, lorry 20-28t, fleet average CH tkm 4.78E+6 1 2.09(4,5,na,na,na,na,BU:2); Transport of materials to the construction site;
based on Bertschinger (1959)
transport, freight, rail CH tkm 2.61E+7 1 2.09(4,5,na,na,na,na,BU:2); Transport of materials to the construction site;
based on Bertschinger (1959)
emission air, low
population Heat, waste - MJ 9.82E+7 1 1.24 (4,3,1,1,1,4,BU:1.05); From electricity
Particulates, < 2.5 um - kg 1.03E+2 1 3.61(4,5,5,5,4,5,BU:3); Particle emissions during the construction; based
on BUWAL (2001, 2003)
Particulates, > 10 um - kg 2.06E+3 1 2.17(4,5,5,5,4,5,BU:1.5); Particle emissions during the construction;
based on BUWAL (2001, 2003)
Particulates, > 2.5 um, and < 10um - kg 5.84E+2 1 2.61(4,5,5,5,4,5,BU:2); Particle emissions during the construction; based
on BUWAL (2001, 2003)

3. Construction of hydroelectric power stations
Life Cycle Inventories of Hydroelectric Power Generation - 23 - ESU-services Ltd.
Tab. 3.5: Unit process raw data of run-of-river hydropower plant/CH.
Name
Lo
ca
tio
n
Un
it
run-of-river
hydropower
plant
Un
ce
rta
inty
Typ
e
Sta
nd
ard
De
via
tio
n9
5%
GeneralComment
Location CH
InfrastructureProcess 1
Unit unit
product run-of-river hydropower plant CH unit 1
technosphere chromium steel 18/8, at plant RER kg 9.23E+4 1 1.27
(4,3,3,1,1,4,BU:1.05); Turbines and
generators; based on Frischknecht et al.
(1996) and Bauer et al. (2007)
diesel, burned in building
machineGLO MJ 1.45E+7 1 1.40
(4,5,3,1,1,5,BU:1.05); Fuel for building
machines; recalculated based on
Frischknecht et al. (1996)
explosives, tovex, at plant CH kg 1.94E+3 1 1.40(4,5,3,1,1,5,BU:1.05); Tunnels and galleries;
based on Bauer et al. (2007)
gravel, round, at mine CH kg 5.03E+7 1 1.27
(4,3,3,1,1,4,BU:1.05); Concrete for buildings
and other infrastructure; recalculated based
on Frischknecht et al. (1996)
cement, unspecified, at plant CH kg 5.78E+6 1 1.27
(4,3,3,1,1,4,BU:1.05); Concrete for buildings
and other infrastructure; recalculated based
on Frischknecht et al. (1996)
reinforcing steel, at plant RER kg 4.73E+5 1 1.27
(4,3,3,1,1,4,BU:1.05); Buildings and other
infrastructure; based on Frischknecht et al.
(1996) and Bauer et al. (2007)
steel, low-alloyed, at plant RER kg 1.27E+6 1 1.27
(4,3,3,1,1,4,BU:1.05); Tubes and pipes; based
on Frischknecht et al. (1996) and Bauer et al.
(2007)
copper, at regional storage RER kg 3.05E+4 1 1.52(4,5,4,5,3,5,BU:1.05); Electric cables;
calculated based on Vattenfall (2008)
tap water, at user CH kg 3.19E+6 1 1.27
(4,3,3,1,1,4,BU:1.05); Concrete for buildings
and other infrastructure; recalculated based
on Frischknecht et al. (1996)
electricity, medium voltage, at grid CH kWh 1.54E+6 1 1.40
(4,5,3,1,1,5,BU:1.05); Electricity supply for the
construction; recalculated based on
Frischknecht et al. (1996)
disposal, building, reinforced
concrete, to recyclingCH kg 1.58E+7 1 1.27
(4,3,3,1,1,4,BU:1.05); Recycling of reinforced
infrastructure (especially buildings);
recalculated based on Frischknecht et al.
(1996), assumed recycling rate: 100%
disposal, building, reinforcement
steel, to recyclingCH kg 1.36E+6 1 1.27
(4,3,3,1,1,4,BU:1.05); Recycling of turbines,
generators, tubes and pipes; recalculated
based Frischknecht et al. (1996), assumed
recycling rate: 100%
disposal, building, concrete, not
reinforced, to final disposalCH kg 4.08E+7 1 1.27
(4,3,3,1,1,4,BU:1.05); Recycling of turbines,
generators, tubes and pipes; recalculated
based Frischknecht et al. (1996), assumed
recycling rate: 100%
transport, lorry 20-28t, fleet
averageCH tkm 5.84E+5 1 2.09
(4,5,na,na,na,na,BU:2); Transport of materials
to the construction site; Based on
Frischknecht et al. (1996)
transport, freight, rail CH tkm 5.84E+5 1 2.09
(4,5,na,na,na,na,BU:2); Transport of materials
to the construction site; based on
Frischknecht et al. (1996)
emission air, low
population
density
Heat, waste - MJ 5.54E+6 1 1.40(4,5,3,1,1,5,BU:1.05); From electricity; based
on Frischknecht et al. (1996)
Particulates, < 2.5 um - kg 2.58E+1 1 3.61
(4,5,5,5,4,5,BU:3); Particle emissions during
the construction; based on BUWAL (2001,
2003)
Particulates, > 10 um - kg 5.17E+2 1 2.17
(4,5,5,5,4,5,BU:1.5); Particle emissions during
the construction; based on BUWAL (2001,
2003)
Particulates, > 2.5 um, and <
10um- kg 1.46E+2 1 2.61
(4,5,5,5,4,5,BU:2); Particle emissions during
the construction; based on BUWAL (2001,
2003)

3. Construction of hydroelectric power stations
Life Cycle Inventories of Hydroelectric Power Generation - 24 - ESU-services Ltd.
Tab. 3.6: Unit process raw data of small hydropower plant, in waterworks infrastructure/CH and small hydropower plant/CH.
Name
Lo
ca
tio
n
Un
it
small
hydropower
plant, in
waterworks
infrastructure
small
hydropower
plant
Un
ce
rta
inty
Typ
e
Sta
nd
ard
De
via
tio
n9
5%
GeneralComment
Location CH CH
InfrastructureProcess 1 1
Unit unit unit
product small hydropower plant, in waterworks infrastructure CH unit 1 0
349-006 small hydropower plant CH unit 0 1
technosphere concrete, normal, at plant CH m3 5.52E+1 6.30E+2 1 1.24(4,1,3,1,1,3,BU:1.05);
Infrastructure; literature
gravel, round, at mine CH kg 5.21E+5 1.11E+6 1 1.24(4,1,3,1,1,3,BU:1.05);
Infrastructure; literature
reinforcing steel, at plant RER kg 2.12E+3 4.99E+4 1 1.24(4,1,3,1,1,3,BU:1.05);
Infrastructure; literature
chromium steel 18/8, at plant RER kg 1.01E+3 6.18E+2 1 1.24(4,1,3,1,1,3,BU:1.05); Turbines,
generator, switchboard; literature
steel, low-alloyed, at plant RER kg 1.31E+3 1.39E+3 1 1.24(4,1,3,1,1,3,BU:1.05); Turbines,
generator; literature
copper, at regional storage RER kg 2.18E+2 2.08E+2 1 1.24
(4,1,3,1,1,3,BU:1.05); Turbine,
generatior and switchboard;
literature
polyethylene, HDPE, granulate, at plant RER kg 8.52E+3 9.05E+3 1 1.24(4,1,3,1,1,3,BU:1.05); Water pipes;
literature
polyvinylchloride, at regional storage RER kg 1.24E+3 1.95E+3 1 1.24(4,1,3,1,1,3,BU:1.05); Water pipes;
literature
cast iron, at plant RER kg 4.67E+4 2.72E+4 1 1.24(4,1,3,1,1,3,BU:1.05); Water pipes;
literature
aluminium, production mix, at plant RER kg 2.42E+1 2.68E+1 1 1.24(4,1,3,1,1,3,BU:1.05);
Switchboard; literature
lead, at regional storage RER kg 1.39E+1 1.62E+1 1 1.24(4,1,3,1,1,3,BU:1.05);
Switchboard; literature
flat glass, uncoated, at plant RER kg 9.96E-1 5.63E-1 1 1.24(4,1,3,1,1,3,BU:1.05);
Switchboard; literature
argon, liquid, at plant RER kg 5.85E+0 6.73E+0 1 1.24(4,1,3,1,1,3,BU:1.05); Turbines;
literature
sawn timber, softwood, raw, plant-debarked, u=70%, at plant RER m3 3.12E-2 3.59E-2 1 1.24(4,1,3,1,1,3,BU:1.05); Turbines;
literature
tap water, at user CH kg 4.03E+6 4.63E+6 1 1.24(4,1,3,1,1,3,BU:1.05); Turbiens;
literature
diesel, burned in building machine GLO MJ 6.27E+3 5.33E+4 1 1.24(4,1,3,1,1,3,BU:1.05); Turbines;
literature
electricity, medium voltage, at grid CH kWh 7.67E+2 1.02E+3 1 1.24(4,1,3,1,1,3,BU:1.05); Turbines;
literature
transport, lorry 20-28t, fleet average CH tkm 1.59E+4 5.45E+4 1 2.09(4,5,na,na,na,na,BU:2); Transport
of materials and waste
transport, freight, rail CH tkm 3.28E+4 4.98E+4 1 2.09(4,5,na,na,na,na,BU:2); Transport
of materials and waste
disposal, municipal solid waste, 22.9% water, to municipal
incinerationCH kg 9.25E+0 1.06E+1 1 1.24
(4,1,3,1,1,3,BU:1.05); From
turbines; literature
treatment, sewage, to wastewater treatment, class 3 CH m3 1.60E+0 1.84E+0 1 1.24(4,1,3,1,1,3,BU:1.05); From
turbines; literature
disposal, building, reinforced concrete, to recycling CH kg 7.05E+4 1.43E+6 1 1.24(4,1,3,1,1,3,BU:1.05); From
infrastructure; literature
disposal, building, concrete, not reinforced, to final disposal CH kg 5.31E+4 1 1.24(4,1,3,1,1,3,BU:1.05); From
infrastructure; literature
disposal, building, concrete gravel, to final disposal CH kg 5.21E+5 1.11E+6 1 1.24(4,1,3,1,1,3,BU:1.05); From
infrastructure; literature
disposal, building, reinforcement steel, to recycling CH kg 2.32E+3 9.05E+3 1 1.24
(4,1,3,1,1,3,BU:1.05); From
turbines, generators,
switchboards; literature
disposal, polyethylene, 0.4% water, to municipal incineration CH kg 8.52E+3 9.05E+3 1 1.24(4,1,3,1,1,3,BU:1.05); From water
pipes; literature
disposal, polyvinylchloride, 0.2% water, to municipal
incinerationCH kg 1.24E+3 1.95E+3 1 1.24
(4,1,3,1,1,3,BU:1.05); From water
pipes; literature
disposal, building, bulk iron (excluding reinforcement), to
sorting plantCH kg 4.67E+4 2.72E+4 1 1.24
(4,1,3,1,1,3,BU:1.05); From water
pipes; literature
disposal, glass, 0% water, to municipal incineration CH kg 9.96E-1 5.63E-1 1 1.24(4,1,3,1,1,3,BU:1.05); From
switchboards; literature
disposal, wood untreated, 20% water, to municipal
incinerationCH kg 2.39E+1 2.75E+1 1 1.24
(4,1,3,1,1,3,BU:1.05); From
turbines; literature
emission air, low
population densityHeat, waste - MJ 7.67E+2 1.02E+3 1 1.24
(4,1,3,1,1,3,BU:1.05); From
electricity

4. Operation of the hydroelectric power stations
Life Cycle Inventories of Hydroelectric Power Generation - 25 - ESU-services Ltd.
4 Operation of the hydroelectric power stations In this Chapter the emissions, working material consumption during the operation of the dif-
ferent hydroelectric power stations are described. The specifications “per plant” refer to the
operation of one plant over its lifespan.
The potential energy of the water is calculated from the efficiency of the generators (0.97) and
transformators (0.98) and amounts to 3.79 MJ/kWh. It is the same for all types of hydropower
stations described. The exceptions are the pumped storage hydropower stations where the
potential energy is not considered.
4.1 Storage power station
4.1.1 Land use
The largest part of the land use of storage power stations is due to the reservoirs. The water
floods pastures, swamps, rocks etc. and transforms them to water courses and artificial lakes.
The average reservoir of the storage power stations in the sample covers a total area of
1.16*106 m
2/plant
10. This results in a land transformation of 2.41*10
-5 m
2/kWh electricity
produced. The reservoir of the average storage hydropower station modelled in this study co-
vers a total of 7.21*105 m
2. This corresponds to a land occupation of the water bodies of
3.62*10-3
m2a/kWh.
These values correspond to the surface area of the reservoirs. Considering the ground area
being larger than its surface, the actual amount of land and biotopes covered by the reservoirs
is even higher. There is no information about the ground area available though, further inves-
tigations would be needed.
The area covered by buildings and other infrastructures is minor compared to the reservoirs.
This is especially true, as they are often built into the rocks and therefore they do not use sur-
face area. Following Frischknecht et al. (1996), 1 % of the area covered by the reservoirs is
added and assigned to the dams, streets, buildings etc.
The initial state of the area used is characterised as “unknown” because of the variety be-
tween the different sites: moorlands, pastures, forests, rocky ravines and even small villages.
Due to the lack of data it is impossible to model the exact initial state and the ecological value
of each flooded area.
The state of the flooded area during the operation of the power stations is characterised as
“water bodies, artificial”. The infrastructure around the reservoirs (dams, buildings etc.) is
modelled as “industrial area, built up”.
4.1.2 Useful capacity of the reservoirs
The volume of the reservoirs is not only important for the water management but also because
of ecological aspects. Reservoirs withdraw the water from its natural circulation for a certain
amount of time. The volume influences the water discharge in terms of the amount as well as
the time of the release, depending on the type of reservoir.
10
Schweizerische Talsperrenkomitee, March 2011:
http://www.swissdams.ch/Dams/damList/default_d.asp?Sort=NomAsc

4. Operation of the hydroelectric power stations
Life Cycle Inventories of Hydroelectric Power Generation - 26 - ESU-services Ltd.
The fluctuation of the water level and the exposed stripes of land on the water’s edge are in-
fluenced by the volume of the reservoir too. The fluctuation of the water level might be of
climatic relevance especially in the tropics as the climatic conditions favour a rapid plant cov-
er of the stripes. When the stripes are flooded again, the biomass is decomposed under rela-
tively warm and often anaerobic conditions in shallow waters which can lead to emissions of
greenhouse gases, especially methane (dos Santos et al. 2006; Fearnside 2004). Greenhouse
gas emissions are discussed and quantified in Section 4.1.6.
On average, a storage hydropower station has a total reservoir volume of 3.27*107 m
3.11
This
results in a specific volume of 1.09*10-3
m3/kWh.
4.1.3 Water use and consumption
The amount of turbined water equals the amount of water withdrawn from its natural circula-
tion minus losses. The specific amount of turbined water (1.40 m3/kWh) gives no direct in-
formation about its ecological impact though. It is rather a physical relationship between the
head and the volume of the water. Nevertheless it gives an indication of the amount of water
temporarily withdrawn from the natural environment.
The average storage power station turbines a total amount of 4.19*1010
m3 water during its
lifespan (Tab. 0.1) (BWW 1973).
While the turbined water is released back to the original watershed after the use, water that
evaporates from the reservoir is lost to the ecosystem. This is defined as water consumption.
The water evaporated from reservoirs is estimated based on an average annual evaporation in
Switzerland. It amounts to 484 mm (Spreafico & Weingartner 2005). In combination with the
specific reservoir surface area of 2.41*10-5
m2/kWh, this results in a specific evaporation of
1.75 kg/kWh. It is listed as air emission “water, CH”.
4.1.4 Electricity use
Pumps are not only used in pumped storage hydropower stations but also in storage power
stations (e.g. as loader). Of the total annual pump electricity consumption of 2’494 GWh
(BFE 2011a), 573 GWh are used in Swiss storage hydropower stations for such pumps and
263 GWh are used in hydropower plants that partly operate as pumped storage hydropower
stations (BFE 2011c). This is an annual electricity consumption of storage hydropower sta-
tions of 835 GWh. The rest, 1’657 GWh, is consumed in pumped storage hydropower stations
(basic water flow plants only). With an annual electricity production of 18’991 GWh by stor-
age hydropower stations (BFE 2011c), 0.044 GWh electricity is used per GWh electricity
produced.
4.1.5 Use of lubricating oil
A study of Vattenfall (2008) indicates that their storage hydropower stations emit 2.27*10-5
g/kWh lubricating oil to the water and 9.76*10-6
g/kWh to the ground. Applied to the aver-
age power plant under study, this results in a loss of 6.78*102 kg/plant to the water and
2.92*102 kg/plant to the ground over the whole lifespan. The same amounts are included as
material input to the operation of the storage hydropower station.
11
Schweizerische Talsperrenkomitee, March 2011:
http://www.swissdams.ch/Dams/damList/default_d.asp?Sort=NomAsc
4. Operation of the hydroelectric power stations
Life Cycle Inventories of Hydroelectric Power Generation - 27 - ESU-services Ltd.
4.1.6 Greenhouse gas emissions
Measurements and studies on various reservoirs have shown that artificial lakes emit a sub-
stantial amount of greenhouse gases (Diem et al. 2008) . There are several processes that may
lead to the emission of those gases from reservoirs: The aerobic and anaerobic decomposition
of organic matter that is flooded due to the construction of a reservoir, the nutrient inflow
from upstream, plants and plankton growing in the water, vegetation that quickly grows on
exposed land around the shore, when the water level is low, and is flooded again when the
water rises (Fearnside 2004; Mäkinen & Khan 2010).
To get an accurate estimation of the net emissions from reservoirs, the measurement of the
emissions before and after the flooding of natural (aquatic) ecosystems is required as natural
ecosystems cause emissions too (Mäkinen & Khan 2010). The amount and type of emitted
greenhouse gases depend on the climatic conditions, the surface area, the depth of the water
and its topography (Mäkinen & Khan 2010). The tropical reservoirs offer a range of factors
that are favourable for the emission of large amounts of greenhouse gases: high temperatures,
high levels of organic material, naturally productive carbon cycles and the combination of
large surface areas with relatively shallow depth (Mäkinen & Khan 2010; Soumis et al. 2005).
Alpine reservoirs on the other side are expected to have low emissions due to low water tem-
peratures and a low input of nutrient12
.
Diem et al. (2008) have conducted the first measurements of greenhouse gas emissions of
Swiss reservoirs. The measurements include several reservoirs across an altitude gradient in
the Swiss Alps and calculations were done for the diffusive fluxes of CO2, CH4 and N2O from
the surface concentrations at different times of the year as well as losses at the turbine.
It is shown that only low land reservoirs (27 % of the total surface in Switzerland) are a
source of N2O while the subalpine and alpine reservoirs are in equilibrium with the atmos-
pheric concentration. While there is no significant difference in the range of methane emis-
sions due to diffusion between the different elevation levels, the altitude of the reservoirs
seems to play a role regarding the emissions in the turbine. However this finding is strongly
linked to the fact that in alpine power stations the head of the water is higher and therefore the
gases have more time to outgas.
The results of measurements show an average emission of 1’030 mg CO2/m2d, 0.2 mg
CH4/m2d and 72 µg N2O/m
2d. With an average surface area of 7.21*10
5 m
2 this results in spe-
cific greenhouse gas emissions of 1.36 g CO2/kWh, 2.64*10-4
g CH4/kWh and 2.56*10-5
g
N2O/kWh. The latter considers only emissions from four reservoirs in the lowlands. Nearly
30% of the total area of the reservoirs of storage hydropower stations is located in the low-
lands of Switzerland.
4.1.7 SF6 emissions
SF6 is applied in electric insulations, and switches. Considerable amounts of SF6 emissions
are only to be expected due to accidents and breakdowns (Vattenfall 2008). Vattenfall states
that under normal conditions there is a continuous emission of 3.40*10-7
g/kWh (2008). The
same amounts are included as material input to the operation of the storage hydropower sta-
tion.
12
Eawag (2010): Stauseen als heimliche Klimasünder? Medienmitteilung vom 11. Oktober 2010

4. Operation of the hydroelectric power stations
Life Cycle Inventories of Hydroelectric Power Generation - 28 - ESU-services Ltd.
4.1.8 Operation of certified storage hydropower stations
The operation of certified storage hydropower stations is modelled similarly to the storage
hydropower station described above.
Certified hydroelectric power only covers electricity produced with natural inflows. Hence,
the amount of certified electricity is the net production of the hydropower plant (Bratrich &
Truffer 2001). This is the total electricity produced minus the electricity consumed by the
pumps. Consequently, the dataset reflecting the production of certified electricity from storage
hydropower stations does not include an input of grid electricity.
4.2 Pumped storage power station
4.2.1 Land use, material input and emissions
Because it is difficult to separate the two types of hydropower stations, the pumped storage
hydropower station and the storage hydropower station are modelled similarly. The infrastruc-
ture as well as the land use, material input and the emissions caused during the operation are
the same. The only difference in the operation is the additional electricity consumption of the
pumps used in pumped storage power stations.
4.2.2 Electricity use
The pumps of the Swiss pumped storage hydropower stations have an annual electricity con-
sumption of 1657 GWh in 2010 (BFE 2011a, c). The average efficiency of the pumps is 0.8
(BFE 2011a), which results in 1326 GWh electricity produced per year in 2010. 1.25 kWh of
electricity is needed to generate 1 kWh of electricity produced in basic water flow plants.
4.3 Run-of-river power station
As mentioned before, run-of-river hydropower stations are generally defined as hydropower
stations without reservoirs. Among the run-of-river hydropower stations not included in the
storage hydropower stations there are exceptions though.
The study of Del Sontro et al. (2010) has shown that reservoirs of run-of-river hydropower
stations do not only lead to more land use but also to an increased amount of methane emis-
sions. Consequently, two types of run-of-river hydropower stations are differentiated in the
modelling of the operation phase: stations with and without a reservoir. While the land use,
the water volume and the methane emissions are specific for these two types, the rest of inputs
and emissions of the average run-of-river hydropower station modelled are the same.
For both types, the production of 1 kWh of electricity is modelled. The combination of the
two types results in the modelled average run-of-river hydropower station. The run-of-river
hydropower stations without reservoirs contribute 98 % to the total electricity production with
run-of-river power stations.
4.3.1 Land use
It is difficult to determine the area of land used due to the construction and operation of run-
of-river power stations without a reservoir. The first difficulty is to decide on the initial posi-
tion: Run-of-river power stations are mostly constructed in stretches that are already obstruct-
ed due to flood protection and preservation of cultivated land. Is this the point of reference or
is it the river before any modifications have taken place, close to nature? The latter leads to
4. Operation of the hydroelectric power stations
Life Cycle Inventories of Hydroelectric Power Generation - 29 - ESU-services Ltd.
the question how the land transformations should be allocated to the power generation, the
flood control and other modifications.
The second difficulty is to describe the impact of the land transformation. In Central Europe
each river and its surrounding has its own characteristics, they are unique. It is often difficult
to find the same or similar ecosystem a second time. If a considerable stretch is transformed
due to flooding and disconnected from its natural cycles, it is lost.
Frischknecht et al. (1996) suggest taking the situation just before the construction of the pow-
er station (incl. earlier modifications). This gives not only a clear picture of the initial position
but it also avoids the allocation problem. Further they suggest not examining the power sta-
tions individually but in the whole context. This means to consider the scarcity of the affected
biotopes.
Generally the used area is quite small due to the geometry of the channel. The area itself is not
a good measure though. Biologically wide and open river beds are more valuable than con-
ventional ones, but they use more land.
The identification of land use due to run-of-river power stations faces various methodological
difficulties. Frischknecht et al. (1996) have chosen a pragmatic approach which is followed
for the run-of-river hydropower stations without reservoir as well. In a first step the area cov-
ered by the used stretch is determined by the product of the length (from the beginning of the
slack flow to the dam) times the average width according to the map. The resulting area is not
to be used as an absolute value but as an index. This index further includes that the run-of-
river power station influences the biocoenosis in the affected stretches as well as the disturb-
ance of the ground water flows as they are most often disconnected from the river due to the
necessary sealing of the river. Frischknecht et al. (1996) determine a specific land transfor-
mation of 5.6*10-5
m2/kWh for run-of-river hydropower stations without a reservoir. Large
rivers tend to have a lower value while smaller rivers have a higher one. According to the
approach used for the storage power stations 1 % is added to the land use for buildings and
additional infrastructure of the power station (1.72*103 m
2/plant, resulting in a land transfor-
mation of 5.60*10-7
m2/kWh). This leads to total values of 1.74*10
5 m
2/plant or a land trans-
formation of 5.66*10-5
m2/kWh. The occupation of the land is 4.52*10
-3 m
2a per kWh elec-
tricity produced with equals a total of 1.11*109 m
2a over the lifespan of 80 years.
The land transformation due to the reservoir is 1.48*10-4
m2/kWh produced in stations with a
reservoir13
. The total land transformation for power stations with a reservoir is therefore
2.04*10-4
m2/kWh of water courses. The area covered by the infrastructure is the same as for
the stations without a reservoir. The total land occupation amounts to 1.63*10-2
m2a per kWh
electricity produced which corresponds to 4.02*109 m
2a over the lifespan of a run-of-river
hydropower station.
According to Frischknecht et al. (1996), the initial state of the area before the construction of
the run-of-river hydropower station is characterised as half “shrub land, sclerophyllous” and
half “pasture and meadow”. This accounts for the fact that most of the Swiss rivers have
been modified due to flood protection and preservation of cultivated land. Because it is not
allowed to fertilise land next to the river, it is assumed to be grown over with bushes and trees
and, where this is not the case, it is used as pasture. The land is then transformed to “water
courses, artificial” and “industrial area, built up”.
13
Schweizerischer Wasserwirtschaftsverband, March 2011: http://www.swv.ch/de/statistik.cfm

4. Operation of the hydroelectric power stations
Life Cycle Inventories of Hydroelectric Power Generation - 30 - ESU-services Ltd.
4.3.2 Useful capacity of the reservoirs
The run-of-river power stations without reservoir are characterised by having no or only a
small storage capacity. The specific capacity is therefor set to null.
The power stations with a reservoir have a storage capacity of 4.52*106 m
3/plant; the storage
capacity per kWh is 1.03*10-3
m3.14
4.3.3 Water use and consumption
As it is already discussed in Section 4.1.3, the amount of turbined water correlates with the
amount of produced electricity and the head. The ecological impact of the turbined water con-
sists of the withdrawal of the water from its natural environment for a certain period of time.
The typical head of a run-of-river power station is 10 m (Frischknecht et al. 1996). This re-
sults in a specific amount of turbined water of 45 m3/kWh (1.38*10
11 m
3/plant) for the mod-
elled run-of-river hydropower station (Frischknecht et al. 1996).
The water evaporated from reservoirs is estimated based on an average annual evaporation in
Switzerland. It amounts to 484 mm (Spreafico & Weingartner 2005). In combination with the
specific reservoir surface area of 1.48*10-4
m2/kWh, this results in a specific evaporation of
5.71 kg/kWh. It is listed as air emission “water, CH”.
4.3.4 Use of lubricating oil
A total loss of 9.33*10-4
g/kWh oil to the water and 9.49*10-4
g/kWh to the soil is specified
over the whole life cycle of the hydropower station Wildegg-Brugg (Axpo 2008). Assuming a
similar pattern of oil losses as for the power stations of Vattenfall (2008), 9 % of the total spill
to the water and 4 % of the spill to the soil comes from the power station itself. Applied to the
modelled run-of-river hydropower station this amounts in 8.40*10-5
g/kWh oil to the water
and 3.80*10-5
g/kWh to the soil. Over the whole lifespan of the run-of-river hydropower sta-
tion 2.58*102 kg oil is spilled to the water and 1.17*10
2 kg to the soil. The same amounts are
included as material input to the operation of the power stations.
4.3.5 Greenhouse gas emissions
While the storage power stations store huge quantities of water in reservoirs, the run-of-river
power stations do not require a large impoundment of water. Consequently there is no flood-
ing of large areas of land necessary and it is assumed that run-of-river power stations without
a reservoir do not emit greenhouse gases.
Del Sontro et al. (2010) have conducted measurements of the methane emissions in one of the
reservoirs belonging to the sample of run-of-river hydropower stations under study, the lake
of Wohlen. It is shown that the lake is a significant source of methane (156 mg CH4/m2d). It is
assumed that all run-of-river power stations with a reservoir emit equal amounts of methane.
This leads to an emission of 0.67 g CH4/kWh produced in run-of-river hydropower stations
with reservoir (2.07*106 kg CH4/plant).
4.4 Small hydropower stations
There are no data available for specific working material consumption and emissions during
the operation of small hydropower stations.
14
Schweizerischer Wasserwirtschaftsverband, March 2011: http://www.swv.ch/de/statistik.cfm

4. Operation of the hydroelectric power stations
Life Cycle Inventories of Hydroelectric Power Generation - 31 - ESU-services Ltd.
4.5 Data quality
The operation of the storage hydropower stations is described well. Data describing the oil
spill and the SF6 emissions are derived from power stations not included in the sample under
study. It is assumed though that the technology is the same and that the geographic differ-
ences are not significant. The greenhouse gas emissions are based on a study done on a signif-
icant share of the sample investigated. The geographic and technological correlation is good.
The quantification of the land use and the volume of the reservoirs are based on current data.
They do not only cover the same geography, the same technology and the same temporal as-
pects but the information is also available for the whole set of storage power stations under
study. In general, the operation of the storage hydropower stations is described well and with
low uncertainties.
The data of the operation of the run-of-river hydropower station on the other hand have more
uncertainties. The factors for the land use of the stations without reservoir were adopted from
earlier studies (Frischknecht et al. 1996) as no other data are available. This is also the case
for the amount of turbined water and the volume of the water bodies. The methane emissions
are based on one recent study conducted on one large run-of-river power station. This power
station is part of the sample of this study but the emission factor might differ from the emis-
sions of other run-of-river power stations. This leads to a relatively high uncertainty. In gen-
eral, the operation of the run-of-river hydropower stations is described well. Further meas-
urements of greenhouse gas emissions from reservoirs of run-of-river hydropower stations are
needed (and currently on-going).
No information is available about the operation of small hydropower stations. This part of the
life cycle is not well described.

4. Operation of the hydroelectric power stations
Life Cycle Inventories of Hydroelectric Power Generation - 32 - ESU-services Ltd.
4.6 Life Cycle inventories of the operation of hydropower plants Tab. 4.1: Unit process raw data of electricity, hydropower, at reservoir power plant/CH and
electricity, hydropower, net, at reservoir power plant/CH.
Name
Lo
ca
tio
n
Un
it
electricity,
hydropower,
at reservoir
power plant
electricity,
hydropower,
net, at
reservoir
power plant
Un
ce
rta
inty
Typ
e
Sta
nd
ard
De
via
tio
n9
5%
GeneralComment
Location CH CH
InfrastructureProcess 0 0
Unit kWh kWh
productelectricity, hydropower, at
reservoir power plantCH kWh 1
electricity, hydropower, net, at
reservoir power plantCH kWh 1
technosphere reservoir hydropower plant CH unit 3.35E-11 3.35E-11 1 3.05(4,1,1,1,1,2,BU:3); Infrastructure of the storage power
station producing the electricity
sulphur hexafluoride, liquid, at
plantRER kg 3.40E-10 3.40E-10 1 1.40
(4,5,1,5,1,5,BU:1.05); In electric insulation (e.g.
switches); based on Vattenfall (2008)
lubricating oil, at plant RER kg 3.24E-8 3.24E-8 1 1.40(4,5,1,5,1,5,BU:1.05); Turbines; based on Vattenfall
(2008)
electricity, high voltage, at grid CH kWh 4.40E-2 1 1.12(3,1,1,1,1,2,BU:1.05); Electricity consumption for the
pumps (excl. pumped storage)
resource, land Transformation, from unknown - m2 2.44E-5 2.44E-5 1 2.01
(3,1,1,1,1,1,BU:2); Original area before the construction
of the power station; recalculated based on
Frischknecht et al. (1996) and Schweizerisches
Talsperrenkomitee (2011)
Transformation, to water bodies,
artificial- m2 2.41E-5 2.41E-5 1 2.01
(3,1,1,1,1,1,BU:2); Area covered by the reservoir;
recalculated based on Frischknecht et al. (1996) and
Schweizerisches Talsperrenkomitee (2011)
Transformation, to industrial
area, built up- m2 2.41E-7 2.41E-7 1 2.05
(4,1,1,1,1,1,BU:2); Area covered by infrastructures other
than held-back river; recalculated based on
Frischknecht et al. (1996) and Schweizerisches
Talsperrenkomitee (2011)
Occupation, water bodies,
artificial- m2a 3.62E-3 3.62E-3 1 1.52
(3,1,1,1,1,1,BU:1.5); Area occupied by the reservoir;
recalculated based on Frischknecht et al. (1996) and
Schweizerisches Talsperrenkomitee (2011)
Occupation, industrial area, built
up- m2a 3.62E-5 3.62E-5 1 1.56
(4,1,1,1,1,1,BU:1.5); Area occupied by the
infrastructure; recalculated based on Frischknecht et
al. (1996) and Schweizerisches Talsperrenkomitee
(2011)
resource, in water Volume occupied, reservoir - m3a 1.64E-1 1.64E-1 1 1.11
(3,1,1,1,1,1,BU:1.05); Volume occupied by the
reservoir; based on Schweizerisches
Talsperrenkomitee (2011)
Water, turbine use, unspecified
natural origin- m3 1.40E+0 1.40E+0 1 1.11
(3,1,1,1,1,1,BU:1.05); Amount of water turbined for the
generation of electricity; based on BWW (1973)
Energy, potential (in hydropower
reservoir), converted- MJ 3.79E+0 3.79E+0 1 1.11 (3,1,1,1,1,1,BU:1.05); Potential energy of the water
emission air, low
population densityDinitrogen monoxide - kg 2.56E-8 2.56E-8 1 1.58
(4,3,2,3,1,4,BU:1.5); Nitrous oxide emissions due to
the biomass in the reservoirs; calculated based on
Diem et al. (2008)
Methane, biogenic - kg 2.64E-7 2.64E-7 1 1.57
(4,3,2,3,1,3,BU:1.5); Methane emissions due to the
biomass in the reservoirs; calculated based on Diem
et al. (2008)
Carbon dioxide, land
transformation- kg 1.36E-3 1.36E-3 1 1.48
(4,3,2,3,1,3,BU:1.4); Carbon dioxide emissions due to
the biomass in the reservoirs; calculated based on
Diem et al. (2008)
Sulfur hexafluoride - kg 3.40E-10 3.40E-10 1 1.69(4,5,1,5,1,5,BU:1.5); From electric insulations (e.g.
switches); based on Vattenfall (2008)
Heat, waste - MJ 1.58E-1 1.58E-1 1 1.12 (3,1,1,1,1,2,BU:1.05); Waste heat
emission air,
unspecifiedWater, CH - kg 1.75E+0 1.75E+0 1 1.89
(4,3,3,2,4,5,BU:1.5); Water evaporated from reservoir;
calculated based on Spreafico & Weingartner (2005)
emission water,
riverOils, unspecified - kg 2.27E-8 2.27E-8 1 1.69
(4,5,1,5,1,5,BU:1.5); From turbines; based on Vattenfall
(2008)
emission soil,
industrialOils, unspecified - kg 9.76E-9 9.76E-9 1 1.69
(4,5,1,5,1,5,BU:1.5); From turbines; based on Vattenfall
(2008)

4. Operation of the hydroelectric power stations
Life Cycle Inventories of Hydroelectric Power Generation - 33 - ESU-services Ltd.
Tab. 4.2: Unit process raw data of electricity, hydropower, at pumped storage power plant/CH.
Name
Lo
ca
tio
n
Un
it
electricity,
hydropower,
at pumped
storage
power plant
Un
ce
rta
inty
Typ
e
Sta
nd
ard
De
via
tio
n9
5%
GeneralComment
Location CH
InfrastructureProcess 0
Unit kWh
productelectricity, hydropower, at pumped storage
power plantCH kWh 1
technosphere lubricating oil, at plant RER kg 3.24E-8 1 1.40(4,5,1,5,1,5,BU:1.05); Turbines; based on
Vattenfall (2008)
reservoir hydropower plant CH unit 3.35E-11 1 3.05(4,1,1,1,1,2,BU:3); Infrastructure of the storage
power station producing the electricity
sulphur hexafluoride, liquid, at plant RER kg 3.40E-10 1 1.40(4,5,1,5,1,5,BU:1.05); In electric insulation (e.g.
switches); based on Vattenfall (2008)
electricity, high voltage, at grid CH kWh 1.25E+0 1 1.22(4,1,1,1,1,3,BU:1.05); For the pumping of the
water; bfe (2010)
resource, land Transformation, from unknown - m2 2.44E-5 1 2.01
(3,1,1,1,1,1,BU:2); Original area before the
construction of the power station; recalculated
based on Frischknecht et al. (1996) and
Schweizerisches Talsperrenkomitee (2011)
Transformation, to water bodies, artificial - m2 2.41E-5 1 2.01
(3,1,1,1,1,1,BU:2); Area covered by the reservoir;
recalculated based on Frischknecht et al. (1996)
and Schweizerisches Talsperrenkomitee (2011)
Transformation, to industrial area, built up - m2 2.41E-7 1 2.05
(4,1,1,1,1,1,BU:2); Area covered by infrastructures
other than held-back river; recalculated based on
Frischknecht et al. (1996) and Schweizerisches
Talsperrenkomitee (2011)
Occupation, water bodies, artificial - m2a 3.62E-3 1 1.52
(3,1,1,1,1,1,BU:1.5); Area occupied by the
reservoir; recalculated based on Frischknecht et
al. (1996) and Schweizerisches
Talsperrenkomitee (2011)
Occupation, industrial area, built up - m2a 3.62E-5 1 1.56
(4,1,1,1,1,1,BU:1.5); Area occupied by the
infrastructure; recalculated based on
Frischknecht et al. (1996) and Schweizerisches
Talsperrenkomitee (2011)
resource, in water Volume occupied, reservoir - m3a 1.64E-1 1 1.11
(3,1,1,1,1,1,BU:1.05); Volume occupied by the
reservoir; based on Schweizerisches
Talsperrenkomitee (2011)
Water, turbine use, unspecified natural
origin- m3 1.40E+0 1 1.11
(3,1,1,1,1,1,BU:1.05); Amount of water turbined for
the generation of electricity; based on BWW
(1973)
emission air, low
population densityDinitrogen monoxide - kg 2.56E-8 1 1.58
(4,3,2,3,1,4,BU:1.5); Nitrous oxide emissions due
to the biomass in the reservoirs; calculated
based on Diem et al. (2008)
Methane, biogenic - kg 2.64E-7 1 1.57
(4,3,2,3,1,3,BU:1.5); Methane emissions due to
the biomass in the reservoirs; calculated based
on Diem et al. (2008)
Carbon dioxide, land transformation - kg 1.36E-3 1 1.48
(4,3,2,3,1,3,BU:1.4); Carbon dioxide emissions
due to the biomass in the reservoirs; calculated
based on Diem et al. (2008)
Sulfur hexafluoride - kg 3.40E-10 1 1.69(4,5,1,5,1,5,BU:1.5); From electric insulations
(e.g. switches); based on Vattenfall (2008)
emission air,
unspecifiedWater, CH - kg 1.75E+0 1 1.89
(4,3,3,2,4,5,BU:1.5); Water evaporated from
reservoir; calculated based on Spreafico &
Weingartner (2005)
emission water,
riverOils, unspecified - kg 2.27E-8 1 1.69
(4,5,1,5,1,5,BU:1.5); From turbines; based on
Vattenfall (2008)
emission soil,
industrialOils, unspecified - kg 9.76E-9 1 1.69
(4,5,1,5,1,5,BU:1.5); From turbines; based on
Vattenfall (2008)
emission air, low
population densityHeat, waste - MJ 9.00E-1 1 1.22 (4,1,1,1,1,3,BU:1.05); Heat emissions

4. Operation of the hydroelectric power stations
Life Cycle Inventories of Hydroelectric Power Generation - 34 - ESU-services Ltd.
Tab. 4.3: Unit process raw data of electricity, hydropower, at run-of-river power plant with res-ervoir/CH, electricity, at run-of-river power station without reservoir/CH and electricity, hydropower, at run-of-river power plant, mix/CH.
Name
Lo
ca
tio
n
Un
it
electricity,
hydropower, at
run-of-river
power plant
with reservoir
electricity,
hydropower, at
run-of-river
power plant
without
reservoir
electricity,
hydropower, at
run-of-river
power plant
Un
ce
rta
inty
Typ
e
Sta
nd
ard
De
via
tio
n9
5%
GeneralComment
Location CH CH CH
InfrastructureProcess 0 0 0
Unit kWh kWh kWh
productelectricity, hydropower, at run-of-river
power plant with reservoirCH kWh 1
electricity, hydropower, at run-of-river
power plant without reservoirCH kWh 1
electricity, hydropower, at run-of-river
power plantCH kWh 1
technosphereelectricity, hydropower, at run-of-river
power plant with reservoirCH kWh 1.98E-2 1 1.27
(4,3,3,1,1,4,BU:1.05); Proportion of
hydropower from run-of-river
hydropower stations with reservoir
electricity, hydropower, at run-of-river
power plant without reservoirCH kWh 9.80E-1 1 1.27
(4,3,3,1,1,4,BU:1.05); Proportion of
hydropower from run-of-river
hydropower stations without reservoir
run-of-river hydropower plant CH unit 3.25E-10 3.25E-10 1 3.07
(4,3,3,1,1,4,BU:3); Infrastructure of
the run-of-river power station
producing the electricity
lubricating oil, at plant RER kg 1.22E-7 1.22E-7 1 1.48
(4,5,3,5,3,5,BU:1.05); In turbines;
based on Axpo (2008) and Vattenfall
(2008)
resource, land Transformation, to industrial area, built up - m2 5.60E-7 5.60E-7 1 2.11
(4,3,3,1,1,5,BU:2); Area covered by
infrastructures, not the river; based
on Frischknecht et al. (1996)
Transformation, from shrub land,
sclerophyllous- m2 1.02E-4 2.83E-5 1 2.11
(4,3,3,1,1,5,BU:2); Original area
before the construction of the power
station; recalculated based on
Frischknecht et al. (1996)
Transformation, from pasture and
meadow- m2 1.02E-4 2.83E-5 1 1.40
(4,3,3,1,1,5,BU:1.2); Original area
before the construction of the power
station; recalculated based on
Frischknecht et al. (1996)
Transformation, to water courses, artificial - m2 2.04E-4 5.60E-5 1 2.11
(4,3,3,1,1,5,BU:2); Area covered by
the river; recalculated based on
Frischknecht et al. (1996)
Occupation, water courses, artificial - m2a 1.63E-2 4.48E-3 1 1.64
(4,3,3,1,1,5,BU:1.5); Area occupied
due to the run-of-river hydropower
station; recalculated based on
Frischknecht et al. (1996)
Occupation, industrial area, built up - m2a 4.48E-5 4.48E-5 1 1.64
(4,3,3,1,1,5,BU:1.5); Area occupied
due to the run-of-river hydropower
station; recalculated based on
Frischknecht et al. (1996)
resource, in
waterVolume occupied, reservoir - m3a 8.24E-2 1 1.33
(4,3,3,1,1,5,BU:1.05); Volume
occupied due to the run-of-river
hydropower station; recalculated
based on Frischknecht et al. (1996)
Water, turbine use, unspecified natural
origin- m3 4.50E+1 4.50E+1 1 1.33
(4,3,3,1,1,5,BU:1.05); Amount of
water turbined for the generation of
electricity; based on Frischknecht et
al. (1996)
Energy, potential (in hydropower reservoir),
converted- MJ 3.79E+0 3.79E+0 1 1.11
(3,1,1,1,1,1,BU:1.05); Potential
energy of the water
emission air,
unspecifiedWater, CH - kg 5.71E+0 1 1.89
(4,3,3,2,4,5,BU:1.5); Water
evaporated from reservoir; calculated
based on Spreafico & Weingartner
(2005)
emission
water, riverOils, unspecified - kg 8.40E-8 8.40E-8 1 1.75
(4,5,3,5,3,5,BU:1.5); From turbines;
based on Axpo (2008) and Vattenfall
(2008)
emission soil,
industrialOils, unspecified - kg 3.80E-8 3.80E-8 1 1.75
(4,5,3,5,3,5,BU:1.5); From turbines;
based on Axpo (2008) and Vattenfall
(2008)
emission air,
low population
density
Methane, biogenic - kg 6.72E-4 1 1.64
(4,3,3,3,1,5,BU:1.5); Methane
emissions due to the held-back river;
DelSontro et al. (2010)

4. Operation of the hydroelectric power stations
Life Cycle Inventories of Hydroelectric Power Generation - 35 - ESU-services Ltd.
Tab. 4.4: Unit process raw data of electricity, hydropower, at small hydropower plant, in water-works infrastructure/CH and electricity, hydropower, at small hydropower plant/CH.
Name
Lo
ca
tio
n
Un
it
electricity,
hydropower, at
small
hydropower
plant, in
waterworks
infrastructure
electricity,
hydropower, at
small
hydropower
plant
Un
ce
rta
inty
Typ
e
Sta
nd
ard
De
via
tio
n9
5%
GeneralComment
Location CH CH
InfrastructureProcess 0 0
Unit kWh kWh
productelectricity, hydropower, at small hydropower plant, in
waterworks infrastructureCH kWh 1 0
electricity, hydropower, at small hydropower plant CH kWh 0 1
technosphere small hydropower plant, in waterworks infrastructure CH unit 1.23E-8 1 3.11(4,3,3,3,3,3,BU:3);
literature
small hydropower plant CH unit 1.29E-8 1 3.11(4,3,3,3,3,3,BU:3);
literature
resource, in
water
Energy, potential (in hydropower reservoir),
converted- MJ 3.79E+0 3.79E+0 1 1.33
(4,3,3,3,3,3,BU:1.05);
Potenzielle Energie
Wasser; literature

5. Deconstruction of the hydropower stations
Life Cycle Inventories of Hydroelectric Power Generation - 36 - ESU-services Ltd.
5 Deconstruction of the hydropower stations There is no long-term experience with hydropower stations at the end of their lifespan and
consequently nothing is known about the handling of such hydropower stations. It is assumed,
that the dams will not be deconstructed but they will be abandoned (Frischknecht et al. 1996).
Furthermore it seems probable that the other parts of storage power stations as well as of run-
of-river power stations are replaced by new plants at the end of their lifetime (Frischknecht et
al. 1996; Vattenfall 2008). The old parts will be deconstructed to give space to new ones,
while the dams are continuously maintained. The deconstructed material needs to be trans-
ported and handled accurately. For the new power station no excavation is needed anymore
and other energy intense parts of the construction might fall away too. The exact allocation
between the two generations of power stations is an open question.
With the replacement of the hydropower station, there is neither a re-cultivation nor a land
transformation to be considered. The complete abandoning of the dams on the other hand
would lead to a siltation of the lake with a gradual re-cultivation. However, there is no cer-
tainty that the same vegetation, typical for this habitat, establishes again. This does not per se
mean a decline in the quality of the fauna as the arising areas might offer niches for rare spe-
cies.
In this study it is assumed that the hydropower stations are replaced. This applies not only to
the storage and run-of-river hydropower stations, but also for both types of small hydropower
stations. The disposal activities are included in the infrastructure datasets (construction of
hydroelectric power stations, see Chapter 3).
5.1 Storage power stations
As described above, it is assumed that the dam is not deconstructed at the end of its lifespan.
Therefore the handling of the non-reinforced concrete is modelled as “to final disposal”. The
amount of non-reinforced concrete is defined as follows: It is assumed that the total amount of
reinforcing steel is used in the product “reinforced concrete”. One kilo of reinforced concrete
consists of 0.03 kg reinforcing steel and 0.97 kg concrete (Doka 2009). With an amount of
1.74*106 kg reinforcing steel a total of 5.79*10
7 kg reinforced concrete can be produced. The
remaining 9.36*108 kg of concrete which is not used in the product “reinforced concrete” is
treated as non-reinforced concrete. After 150 years, the reinforced concrete goes to recycling,
the non-reinforced concrete goes to the final disposal, as already mentioned.
For the end-of-life treatment of other metals a recycling rate of 100% is assumed.
5.2 Run-of-river power stations
The treatment of the concrete (reinforced and non-reinforced) is modelled as described above:
the reinforced concrete is recycled, the non-reinforced one goes “to final disposal”. At the end
of the lifetime of the run-of-river hydropower stations there is a total of 1.58*107 kg rein-
forced concrete (to recycling) and 4.08*107 kg non-reinforced concrete (to final disposal).
For the end-of-life treatment of other metals than the reinforcing steel a recycling rate of
100 % is assumed.

5. Deconstruction of the hydropower stations
Life Cycle Inventories of Hydroelectric Power Generation - 37 - ESU-services Ltd.
5.3 Small hydropower stations
5.3.1 Small hydropower plant in waterworks infrastructure
It is assumed that the total amount of reinforcing steel (2.12*103 kg) is used to reinforce con-
crete. The resulting 7.05*104 kg reinforced concrete is recycled at the end of its lifetime. The
remaining 5.31*104 kg of concrete (non-reinforced concrete) is assumed to remain on-site,
which is modelled as “to final disposal”.
The gravel is left within the remaining infrastructure of the dams and in the ditch of the pipes.
Therefore it goes “to final disposal” too.
The plastics (PE and PVC) and the wood as well as glass and the other non-metals are as-
sumed to be incinerated in a municipal waste incineration plant.
For the remaining metals a recycling rate of 100 % is assumed.
5.3.2 Standalone small hydropower plant
For this type of hydropower plants the ratio between the concrete and the reinforcing steel is
reversed. A total amount of 1.43*106 kg reinforced concrete is used (1.39*10
6 kg concrete
plus 4.29*104 kg reinforcing steel). Both, the reinforced concrete and the remaining
7.05*103 kg of reinforcing steel are recycled at the end of the use phase.
The gravel is left on-site, which is modelled as “to final disposal”. All the non-metallic mate-
rials (plastics, wood, glass etc.) are assumed to be incinerated in a municipal waste incinera-
tion plant. For the remaining metals a recycling rate of 100 % is assumed.
5.4 Data quality
As there is no experience with the handling of hydropower stations at the end of use, it is on
the one hand difficult to model this phase, but it is also difficult to evaluate the data. The
quantities of the materials to be deposited and of the corresponding uncertainties are based on
the data of the construction phase. Predictions of the treatment of the materials leads to rela-
tively high uncertainties, as it is not possible to know yet how the power stations will be han-
dled at the end of their useful life.
6. Life Cycle Inventory data of hydropower stations in other countries
Life Cycle Inventories of Hydroelectric Power Generation - 38 - ESU-services Ltd.
6 Life Cycle Inventory data of hydropower stations in other countries
6.1 European hydropower stations
6.1.1 Storage and pumped storage hydropower stations
It is assumed that there is no significant difference between the infrastructure of storage pow-
er stations in Switzerland and the alpine regions of Europe. Therefore the same data are used.
Where available, the processes are adapted to European processes (RER). As the data in the
inventory are representative for Switzerland, storage power stations that lay outside of the
alpine area get an increased uncertainty by factor 1.25 (Bolliger & Bauer 2007). This is due to
other geologic and hydrologic characteristics. Furthermore, the technology might vary.
The operation of the storage hydropower stations in Europe is based on the data set of the
Swiss storage power stations too. The consumption of lubricating oil and SF6 as well as their
emissions remain the same. The uncertainty is adapted according to the pattern described
above. In Subchapter 6.3 the unit process raw data of the electricity production in Europe
(RER) is presented.
The electricity mix for the operation of the pumped storage hydropower stations in other
countries is adapted. The following countries are considered: Austria, Bosnia and Herze-
govina, Belgium, Serbia and Montenegro, Czech Republic, Germany, Spain, France, the
United Kingdom, Greece, Croatia, Ireland, Italy, Luxemburg, Macedonia, Norway, Poland,
Portugal, Sweden, Slovenia and Slovakia as well as Australia, Canada, India, Japan, Korea,
Malaysia, South Africa and the United States. In Subchapter 6.3 only the unit process raw
data of the electricity production in Europe (RER) is presented as an example. The datasets of
the operation of pumped storage hydropower station in other countries are not shown.
It is assumed that the geographic and climatic conditions are the same for storage power sta-
tions operating in the alpine regions of Europe. Therefore the land transformation and the
amount of water turbined and evaporated remains the same for these power stations. This ap-
plies for the greenhouse gas emissions too as it can be further assumed that the climatic condi-
tions do not vary much within the alpine area. In case of the water evaporated, the elementary
flow of the air emissions is adapted to the respective regional reference.
The topographic conditions are different outside the alpine regions though. While the reser-
voirs in the Alps are most often located in steep narrow valleys, the landscape in the non-
alpine regions is flatter. This leads to more shallow reservoirs with a larger area covered. To
take this into account, their land use is assumed to be ten times higher than for the alpine res-
ervoirs (Bolliger & Bauer 2007). The volume of the water bodies is multiplied with the same
factor as well as the amount of turbined water. The water evaporated from the reservoirs is
calculated from the global average of 25 kg/kWh specified by Pfister et al. (2011). The ele-
mentary flow is adapted according to the respective regional reference.
As the N2O emission factors apply for lowland reservoirs only, they are also valid for non-
alpine regions. The area is larger though, which leads to higher N2O emissions (9.51*10-
4 g/kWh). For the other greenhouse gas emissions other factors are needed. In literature, an
average emission factor of about 820 mg CO2/m2d and 3.6 mg CH4/m
2d is given for temperate
regions (Soumis et al. 2005). The larger area covered leads to CO2 emissions of 10.8 g/kWh
and specific CH4 emissions of 4.8*10-2
g/kWh.

6. Life Cycle Inventory data of hydropower stations in other countries
Life Cycle Inventories of Hydroelectric Power Generation - 39 - ESU-services Ltd.
6.1.2 Run-of-river
The construction of the run-of-river stations in Europe is assumed to be the same as in Swit-
zerland. As far as possible the processes are adapted to European processes (RER). The fac-
tors of the methane emissions from run-of-river hydropower stations with reservoirs are the
same as there are no significant geographic or climatic differences.
The water evaporated from the reservoirs is calculated from the global average of 25 kg/kWh
specified by Pfister et al. (2011). The elementary flow is adapted according to the respective
regional reference.
The uncertainties are increased by a factor of 1.2 to account for differences. For the same rea-
son the uncertainty of the data set describing the operation of the European hydropower sta-
tions is increased too. There are no further differences to the Swiss data sets.
6.1.3 Small hydropower
The construction of the small hydropower stations is modelled in the same way as the Swiss
power stations. European processes (RER) are used where they are available.
The differences between the two regions are considered by increasing the uncertainties by a
factor of 1.2. This is done for the infrastructure as well as for the operation of the small hy-
dropower stations. There are no further differences to the Swiss data sets.
6.2 Brazil
An average Brazilian storage hydropower is modelled based on information from the Itaipu
hydropower station (Binacional 2000) and completed with data from non-alpine storage hy-
dropower stations. The dataset describes this specific hydropower station and not an average
Brazilian station.
The construction consumes a total of 3.90*106 m
3/plant concrete (Binacional 2000). The
weight of the turbines and generators is 7.00*106 kg (Binacional 2000). In a first approach it
is assumed that the turbines and generators consist primarily of steel. Due to missing data, the
amount of reinforcing steel and low-alloyed steel for the construction of the stations is mod-
elled according to the proportions of the storage power stations in Europe, including a lifespan
of 150 years for reinforcing steel and 80 years for the other types: 1.26*107 kg/plant reinforc-
ing steel, 5.51*107 kg/plant steel low-alloyed and 1.31*10
7 kg/plant of chromium steel. The
consumption of all the other materials as well as the transports during the construction are
based on the specific values of the European storage hydropower stations and adjusted to the
production figures of the Itaipu hydropower station too. The particle emissions are based on
the emission factors of general construction sites in Switzerland (BUWAL 2001, 2003). The
area of the construction site is assumed to be twice the area of the dam and other infrastruc-
tures (1 % of the area of the reservoir), see also Section 4.1.1. The resulting unit process raw
data of an average storage hydropower station in Brazil is shown in Tab. 6.9.
The specific land use and the volume of the reservoir is derived from the Itaipu hydropower
station (Binacional 2000), whereas the use and emission of oil and SF6 as well as the electrici-
ty consumption are based on the specific data of the electricity production in non-alpine hy-
dropower stations in Europe. The area covered by the hydropower station is 1.35*109 m
2. The
transformation is modelled as “from tropical rain forest” to “water bodies, artificial” and “in-
dustrial area, built up”. The latter is an additional 1 % of the area covered by the reservoir.

6. Life Cycle Inventory data of hydropower stations in other countries
Life Cycle Inventories of Hydroelectric Power Generation - 40 - ESU-services Ltd.
The water evaporated from the reservoirs is calculated from the global average of 25 kg/kWh
specified by Pfister et al. (2011). The elementary flow is adapted according to the respective
regional reference.
The greenhouse gas emission factors are a widely discussed matter. Many publications on this
subject are available (dos Santos et al. 2006; Lima 2005; Rosa et al. 2003; Rosa et al. 2004
and more). Nevertheless no official factors are available yet. The emission factors vary widely
from source to source (Tab. 6.1).
Tab. 6.1: Greenhouse gas emissions of Brazilian storage hydropower stations. The values are derived from different literature sources.
Reservoir CO2 (mg/m2d) CH4 (mg/m
2d)
Diem et al. 2008 Tucurui - 13.82
Samuel - 71.19
St.Louis et al. 2009 Tropical reservoirs 3'500 300
Rosa et al. 2003 Tucurui
8'088
5'350
183.6
209.2
Samuel 10'433
6'516
24.4
14.6
dos Santos et al. 2006 Miranda 4'980 262.4
Tres marias -142 328.2
Barra 6'434 19.2
Bonita 4'789 9.9
Segredo 9'837 29.99
Xingo 8'087 183.6
Tucurui 10'433 205.4
Itaipu 1'205 12.9
Serra da Mesa 1'316 121
For this study an average of 7.6 g CO2/m2d and 86 mg CH4/m
2d is implemented (Lima 2005;
Rosa et al. 2003). This leads to emissions of 31 g CO2/kWh and 0.56 g CH4/kWh. The varia-
tion in literature and the many open questions regarding the origin of the gases and the devel-
opment over time leads to high uncertainties. Therefore the uncertainty factor of these emis-
sion factors is set to 2 for the CO2 emissions and 4 for the CH4 emissions.
This data set is generally afflicted with high uncertainties as the raw data are based on one
single Brazilian storage hydropower station and European data, which are adopted without
further adaptions to the Brazilian conditions.
6.3 Life Cycle inventories of the operation of hydropower stations in other countries
The operation of the hydropower stations in other countries is described in the Subchapters
6.1 and 6.2.

6. Life Cycle Inventory data of hydropower stations in other countries
Life Cycle Inventories of Hydroelectric Power Generation - 41 - ESU-services Ltd.
Tab. 6.2: Unit process raw data of reservoir hydropower plant, alpine/RER and reservoir hydro-power plant, non-alpine/RER.
Name
Lo
ca
tio
n
Un
it
reservoir
hydropower
plant, alpine
region
Sta
nd
ard
De
via
tio
n9
5%
reservoir
hydropower
plant, non
alpine regions
Un
ce
rta
inty
Typ
e
Sta
nd
ard
De
via
tio
n9
5%
GeneralComment
Location RER RER
InfrastructureProcess 1 1
Unit unit unit
productreservoir hydropower plant, alpine
regionRER unit 1
reservoir hydropower plant, non
alpine regionsRER unit 1
technosphere chromium steel 18/8, at plant RER kg 1.82E+6 1.24 1.82E+6 1 1.55
(4,3,1,3,1,4,BU:1.05); Turbines and generators; recalculated
based on Bertschinger (1959), Condrau (1962), KVR (1968),
Salanfe (1951), Walther und Fetz (1963; 1971), Weber (1965;
1971) and other sources.
diesel, burned in building machine GLO MJ 5.97E+7 1.24 5.97E+7 1 1.55(4,3,1,3,1,4,BU:1.05); Fuel for construction machines; based on
Frischknecht et al. (1996)
explosives, tovex, at plant CH kg 5.95E+5 1.24 5.95E+5 1 1.55
(4,3,1,3,1,4,BU:1.05); Tunnels and galleries; recalculated based
on Béguin et al. 1963, Bertschinger 1959, Blenio Kraftwerke
1968, Condrau 1962, KVR 1963; 1968, Töndury 1956; 1964,
Weber et al. 1965 and other sources.
gravel, round, at mine CH kg 8.89E+8 1.24 8.89E+8 1 1.55
(3,5,1,3,1,2,BU:1.05); Concrete for dams, buildings and other
infrastructure; recalculated based on Aegina (1965),
Bertschinger (1959), Biedermann et al. (1985), DesMeules
(1961), Gicot (1956), KVR (1968), Link(1970), Meyer (1960), Morf
(1962), Salanfe (1951), Schnitter (1961; 1971), Stucky (1962),
Töndury (1956; 1964), Walther & Fetz (1963; 1971), Weber et al.
(1965; 1970), Zingg(1961).
cement, unspecified, at plant CH kg 1.02E+8 1.24 1.02E+8 1 1.55
(3,5,1,3,1,2,BU:1.05); Concrete for dams, buildings and other
infrastructure; recalculated based on Aegina (1965),
Bertschinger (1959), Biedermann et al. (1985), DesMeules
(1961), Gicot (1956), KVR (1968), Link(1970), Meyer (1960), Morf
(1962), Salanfe (1951), Schnitter (1961; 1971), Stucky (1962),
Töndury (1956; 1964), Walther & Fetz (1963; 1971), Weber et al.
(1965; 1970), Zingg(1961).
reinforcing steel, at plant RER kg 1.74E+6 1.24 1.74E+6 1 1.55
(4,3,1,3,1,4,BU:1.05); Buildings and other infrastructure;
recalculated based on Bertschinger (1959), Condrau (1962),
KVR (1968), Salanfe (1951), Walther und Fetz (1963; 1971),
Weber (1965; 1971) and other sources.
steel, low-alloyed, at plant RER kg 4.07E+6 1.24 4.07E+6 1 1.55
(4,3,1,3,1,4,BU:1.05); Tubes and pipes; recalculated based on
recalculated based on Bertschinger (1959), Condrau (1962),
KVR (1968), Salanfe (1951), Walther und Fetz (1963; 1971),
Weber (1965; 1971) and other sources.
copper, at regional storage RER kg 2.96E+5 1.34 2.96E+5 1 1.68 (3,5,1,5,1,5,BU:1.05); Electric cables; Vattenfall (2008)
tap water, at user RER kg 5.65E+7 1.24 5.65E+7 1 1.55
(3,5,1,3,1,2,BU:1.05); Concrete for dams, buildings and other
infrastructure; recalculated based on Aegina (1965),
Bertschinger (1959), Biedermann et al. (1985), DesMeules
(1961), Gicot (1956), KVR (1968), Link(1970), Meyer (1960), Morf
(1962), Salanfe (1951), Schnitter (1961; 1971), Stucky (1962),
Töndury (1956; 1964), Walther & Fetz (1963; 1971), Weber et al.
(1965; 1970), Zingg(1961).
electricity, medium voltage, production
ENTSO, at gridENTSO kWh 2.73E+7 1.24 2.73E+7 1 1.55
(4,3,1,3,1,4,BU:1.05); Electricity supply for the construction;
recalculated based on Bertschinger (1959), Blenio Kraftwerke
(1968), KVR (1968), Töndury (1964), Walther und Fetz (1963),
Weber et al. (1965), BFE (1992) and other sources.
disposal, building, reinforced
concrete, to recyclingCH kg 5.79E+7 1.24 5.79E+7 1 1.55
(4,3,1,3,1,4,BU:1.05); Recycling of reinforced infrastructure;
based on Frischknecht (1996), assumed recycling rate: 100%
disposal, building, concrete, not
reinforced, to final disposalCH kg 9.36E+8 1.24 9.36E+8 1 1.55
(4,3,1,3,1,4,BU:1.05); Non-inforced infrastructure left on-site at
the end of the use phase of the power station (especially the
dams, tunnels, galleries); based on Frischknecht et al. (1996)
disposal, building, reinforcement
steel, to recyclingCH kg 5.88E+6 1.24 5.88E+6 1 1.55
(4,3,1,3,1,4,BU:1.05); Recycling of turbines, generators, tubes
and pipes; assumed recycling rate: 100%
transport, lorry >16t, fleet average RER tkm 4.78E+6 2.09 4.78E+6 1 2.62(4,5,na,na,na,na,BU:2); Transport of materials to the
construction site; based on Bertschinger (1959)
transport, freight, rail RER tkm 2.61E+7 2.09 2.61E+7 1 2.62(4,5,na,na,na,na,BU:2); Transport of materials to the
construction site; based on Bertschinger (1959)
emission air, low
population densityHeat, waste - MJ 9.82E+7 1.24 9.82E+7 1 1.55 (4,3,1,3,1,4,BU:1.05); From electricity
Particulates, < 2.5 um - kg 1.03E+2 3.61 1.03E+2 1 4.51(4,5,5,5,4,5,BU:3); Particle emissions during the construction;
based on BUWAL (2001, 2003)
Particulates, > 10 um - kg 2.06E+3 2.17 2.06E+3 1 2.72(4,5,5,5,4,5,BU:1.5); Particle emissions during the construction;
based on BUWAL (2001, 2003)
Particulates, > 2.5 um, and < 10um - kg 5.84E+2 2.61 5.84E+2 1 3.26(4,5,5,5,4,5,BU:2); Particle emissions during the construction;
based on BUWAL (2001, 2003)
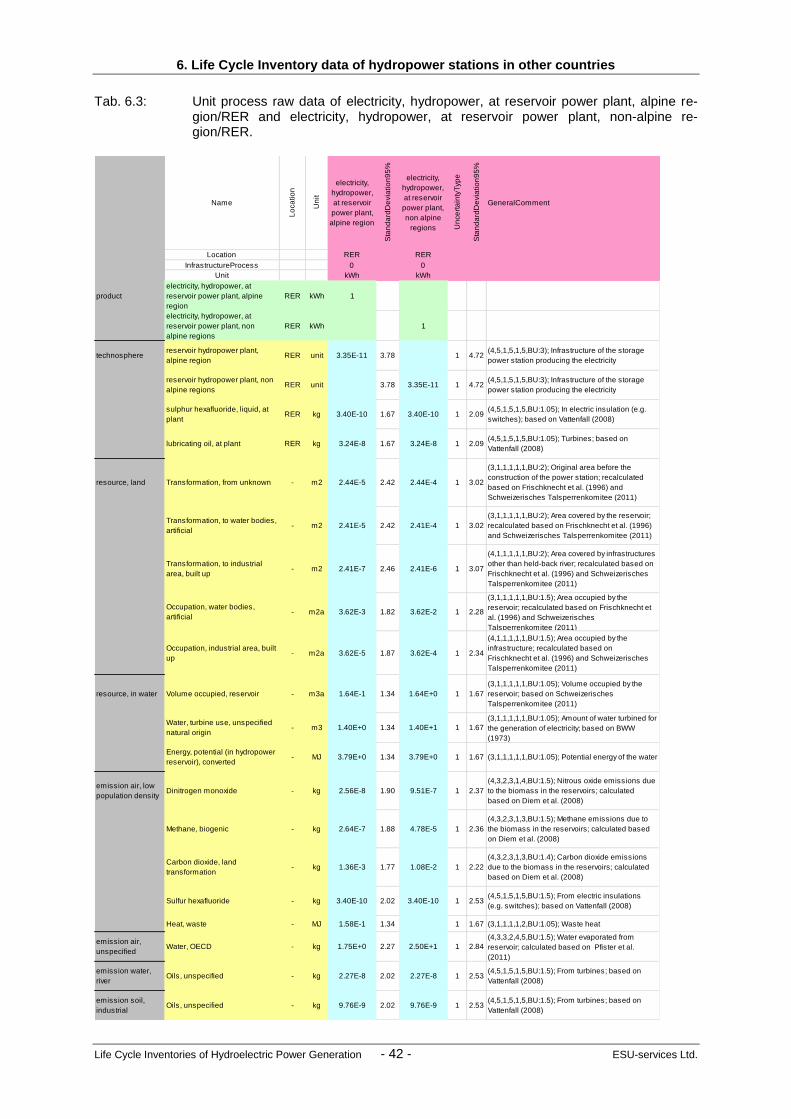
6. Life Cycle Inventory data of hydropower stations in other countries
Life Cycle Inventories of Hydroelectric Power Generation - 42 - ESU-services Ltd.
Tab. 6.3: Unit process raw data of electricity, hydropower, at reservoir power plant, alpine re-gion/RER and electricity, hydropower, at reservoir power plant, non-alpine re-gion/RER.
Name
Lo
ca
tio
n
Un
it
electricity,
hydropower,
at reservoir
power plant,
alpine region
Sta
nd
ard
De
via
tio
n9
5%
electricity,
hydropower,
at reservoir
power plant,
non alpine
regions Un
ce
rta
inty
Typ
e
Sta
nd
ard
De
via
tio
n9
5%
GeneralComment
Location RER RER
InfrastructureProcess 0 0
Unit kWh kWh
product
electricity, hydropower, at
reservoir power plant, alpine
region
RER kWh 1
electricity, hydropower, at
reservoir power plant, non
alpine regions
RER kWh 1
technospherereservoir hydropower plant,
alpine regionRER unit 3.35E-11 3.78 1 4.72
(4,5,1,5,1,5,BU:3); Infrastructure of the storage
power station producing the electricity
reservoir hydropower plant, non
alpine regionsRER unit 3.78 3.35E-11 1 4.72
(4,5,1,5,1,5,BU:3); Infrastructure of the storage
power station producing the electricity
sulphur hexafluoride, liquid, at
plantRER kg 3.40E-10 1.67 3.40E-10 1 2.09
(4,5,1,5,1,5,BU:1.05); In electric insulation (e.g.
switches); based on Vattenfall (2008)
lubricating oil, at plant RER kg 3.24E-8 1.67 3.24E-8 1 2.09(4,5,1,5,1,5,BU:1.05); Turbines; based on
Vattenfall (2008)
resource, land Transformation, from unknown - m2 2.44E-5 2.42 2.44E-4 1 3.02
(3,1,1,1,1,1,BU:2); Original area before the
construction of the power station; recalculated
based on Frischknecht et al. (1996) and
Schweizerisches Talsperrenkomitee (2011)
Transformation, to water bodies,
artificial- m2 2.41E-5 2.42 2.41E-4 1 3.02
(3,1,1,1,1,1,BU:2); Area covered by the reservoir;
recalculated based on Frischknecht et al. (1996)
and Schweizerisches Talsperrenkomitee (2011)
Transformation, to industrial
area, built up- m2 2.41E-7 2.46 2.41E-6 1 3.07
(4,1,1,1,1,1,BU:2); Area covered by infrastructures
other than held-back river; recalculated based on
Frischknecht et al. (1996) and Schweizerisches
Talsperrenkomitee (2011)
Occupation, water bodies,
artificial- m2a 3.62E-3 1.82 3.62E-2 1 2.28
(3,1,1,1,1,1,BU:1.5); Area occupied by the
reservoir; recalculated based on Frischknecht et
al. (1996) and Schweizerisches
Talsperrenkomitee (2011)
Occupation, industrial area, built
up- m2a 3.62E-5 1.87 3.62E-4 1 2.34
(4,1,1,1,1,1,BU:1.5); Area occupied by the
infrastructure; recalculated based on
Frischknecht et al. (1996) and Schweizerisches
Talsperrenkomitee (2011)
resource, in water Volume occupied, reservoir - m3a 1.64E-1 1.34 1.64E+0 1 1.67
(3,1,1,1,1,1,BU:1.05); Volume occupied by the
reservoir; based on Schweizerisches
Talsperrenkomitee (2011)
Water, turbine use, unspecified
natural origin- m3 1.40E+0 1.34 1.40E+1 1 1.67
(3,1,1,1,1,1,BU:1.05); Amount of water turbined for
the generation of electricity; based on BWW
(1973)
Energy, potential (in hydropower
reservoir), converted- MJ 3.79E+0 1.34 3.79E+0 1 1.67 (3,1,1,1,1,1,BU:1.05); Potential energy of the water
emission air, low
population densityDinitrogen monoxide - kg 2.56E-8 1.90 9.51E-7 1 2.37
(4,3,2,3,1,4,BU:1.5); Nitrous oxide emissions due
to the biomass in the reservoirs; calculated
based on Diem et al. (2008)
Methane, biogenic - kg 2.64E-7 1.88 4.78E-5 1 2.36
(4,3,2,3,1,3,BU:1.5); Methane emissions due to
the biomass in the reservoirs; calculated based
on Diem et al. (2008)
Carbon dioxide, land
transformation- kg 1.36E-3 1.77 1.08E-2 1 2.22
(4,3,2,3,1,3,BU:1.4); Carbon dioxide emissions
due to the biomass in the reservoirs; calculated
based on Diem et al. (2008)
Sulfur hexafluoride - kg 3.40E-10 2.02 3.40E-10 1 2.53(4,5,1,5,1,5,BU:1.5); From electric insulations
(e.g. switches); based on Vattenfall (2008)
Heat, waste - MJ 1.58E-1 1.34 1 1.67 (3,1,1,1,1,2,BU:1.05); Waste heat
emission air,
unspecifiedWater, OECD - kg 1.75E+0 2.27 2.50E+1 1 2.84
(4,3,3,2,4,5,BU:1.5); Water evaporated from
reservoir; calculated based on Pfister et al.
(2011)
emission water,
riverOils, unspecified - kg 2.27E-8 2.02 2.27E-8 1 2.53
(4,5,1,5,1,5,BU:1.5); From turbines; based on
Vattenfall (2008)
emission soil,
industrialOils, unspecified - kg 9.76E-9 2.02 9.76E-9 1 2.53
(4,5,1,5,1,5,BU:1.5); From turbines; based on
Vattenfall (2008)

6. Life Cycle Inventory data of hydropower stations in other countries
Life Cycle Inventories of Hydroelectric Power Generation - 43 - ESU-services Ltd.
Tab. 6.4: Unit process raw data of electricity, hydropower, at pumped storage power plant/RER.
Name
Lo
ca
tio
n
Un
it
electricity,
hydropower,
at pumped
storage
power plant
Un
ce
rta
inty
Typ
e
Sta
nd
ard
De
via
tio
n9
5%
GeneralComment
Location RER
InfrastructureProcess 0
Unit kWh
productelectricity, hydropower, at pumped storage
power plantRER kWh 1
technosphere lubricating oil, at plant RER kg 3.24E-8 1 1.67(4,5,1,5,1,5,BU:1.05); Turbines; based on
Vattenfall (2008)
reservoir hydropower plant, alpine region RER unit 3.35E-11 1 3.78(4,5,1,5,1,5,BU:3); Infrastructure of the
storage power station producing the electricity
sulphur hexafluoride, liquid, at plant RER kg 3.40E-10 1 1.67(4,5,1,5,1,5,BU:1.05); In electric insulation
(e.g. switches); based on Vattenfall (2008)
electricity, high voltage, production ENTSO,
at gridENTSO kWh 1.25E+0 1 1.97
(5,5,2,5,1,5,BU:1.05); For the pumping of the
water; bfe (2010)
resource, land Transformation, from unknown - m2 2.44E-5 1 2.42
(3,1,1,1,1,1,BU:2); Original area before the
construction of the power station; recalculated
based on Frischknecht et al. (1996) and
Schweizerisches Talsperrenkomitee (2011)
Transformation, to water bodies, artificial - m2 2.41E-5 1 2.42
(3,1,1,1,1,1,BU:2); Area covered by the
reservoir; recalculated based on Frischknecht
et al. (1996) and Schweizerisches
Talsperrenkomitee (2011)
Transformation, to industrial area, built up - m2 2.41E-7 1 2.46
(4,1,1,1,1,1,BU:2); Area covered by
infrastructures other than held-back river;
recalculated based on Frischknecht et al.
(1996) and Schweizerisches
Talsperrenkomitee (2011)
Occupation, water bodies, artificial - m2a 3.62E-3 1 1.82
(3,1,1,1,1,1,BU:1.5); Area occupied by the
reservoir; recalculated based on Frischknecht
et al. (1996) and Schweizerisches
Talsperrenkomitee (2011)
Occupation, industrial area, built up - m2a 3.62E-5 1 1.87
(4,1,1,1,1,1,BU:1.5); Area occupied by the
infrastructure; recalculated based on
Frischknecht et al. (1996) and
Schweizerisches Talsperrenkomitee (2011)
resource, in water Volume occupied, reservoir - m3a 1.64E-1 1 1.34
(3,1,1,1,1,1,BU:1.05); Volume occupied by the
reservoir; based on Schweizerisches
Talsperrenkomitee (2011)
Water, turbine use, unspecified natural
origin- m3 1.40E+0 1 1.34
(3,1,1,1,1,1,BU:1.05); Amount of water
turbined for the generation of electricity;
based on BWW (1973)
emission air, low
population densityDinitrogen monoxide - kg 2.56E-8 1 1.90
(4,3,2,3,1,4,BU:1.5); Nitrous oxide emissions
due to the biomass in the reservoirs;
calculated based on Diem et al. (2008)
Methane, biogenic - kg 2.64E-7 1 1.88
(4,3,2,3,1,3,BU:1.5); Methane emissions due
to the biomass in the reservoirs; calculated
based on Diem et al. (2008)
Carbon dioxide, land transformation - kg 1.36E-3 1 1.77
(4,3,2,3,1,3,BU:1.4); Carbon dioxide
emissions due to the biomass in the
reservoirs; calculated based on Diem et al.
(2008)
Sulfur hexafluoride - kg 3.40E-10 1 2.02(4,5,1,5,1,5,BU:1.5); From electric insulations
(e.g. switches); based on Vattenfall (2008)
emission air,
unspecifiedWater, OECD - kg 1.75E+0 1 2.27
(4,3,3,2,4,5,BU:1.5); Water evaporated from
reservoir; calculated based on Spreafico &
Weingartner (2005)
emission water,
riverOils, unspecified - kg 2.27E-8 1 2.02
(4,5,1,5,1,5,BU:1.5); From turbines; based on
Vattenfall (2008)
emission soil,
industrialOils, unspecified - kg 9.76E-9 1 2.02
(4,5,1,5,1,5,BU:1.5); From turbines; based on
Vattenfall (2008)
emission air, low
population densityHeat, waste - MJ 9.00E-1 1 1.46 (4,1,1,1,1,3,BU:1.05); Heat emissions
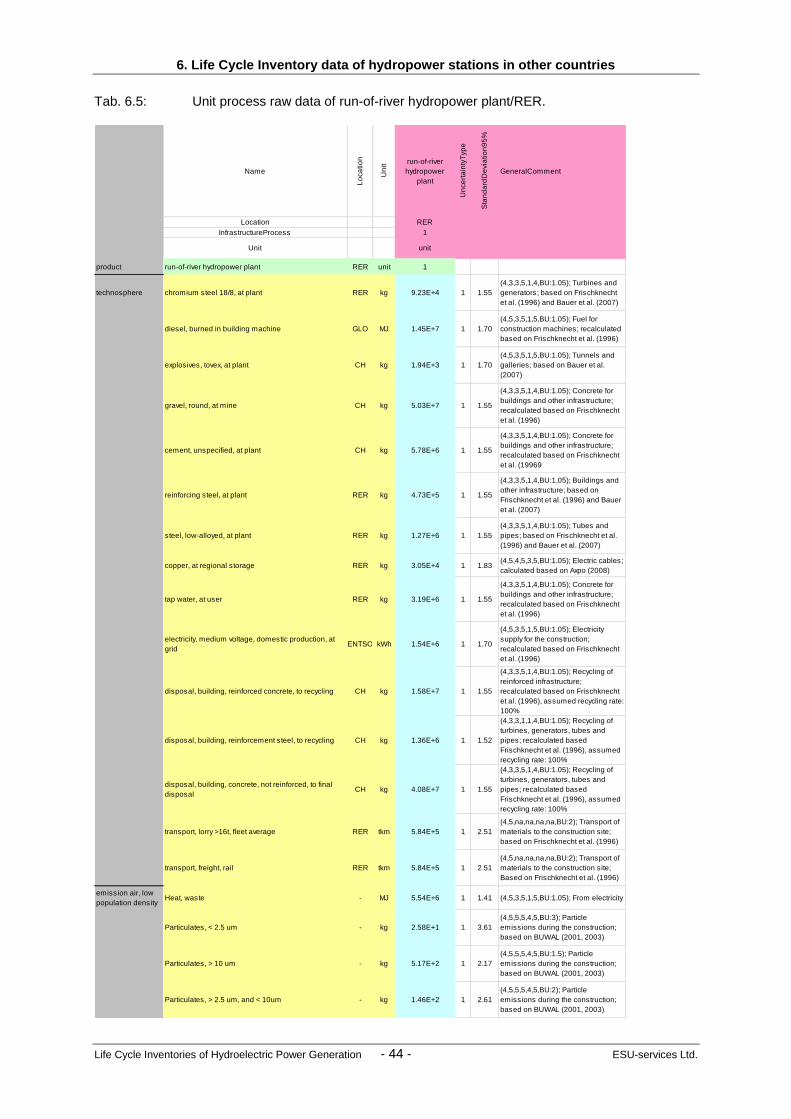
6. Life Cycle Inventory data of hydropower stations in other countries
Life Cycle Inventories of Hydroelectric Power Generation - 44 - ESU-services Ltd.
Tab. 6.5: Unit process raw data of run-of-river hydropower plant/RER.
Name
Lo
ca
tio
n
Un
it
run-of-river
hydropower
plant
Un
ce
rta
inty
Typ
e
Sta
nd
ard
De
via
tio
n9
5%
GeneralComment
Location RER
InfrastructureProcess 1
Unit unit
product run-of-river hydropower plant RER unit 1
technosphere chromium steel 18/8, at plant RER kg 9.23E+4 1 1.55
(4,3,3,5,1,4,BU:1.05); Turbines and
generators; based on Frischknecht
et al. (1996) and Bauer et al. (2007)
diesel, burned in building machine GLO MJ 1.45E+7 1 1.70
(4,5,3,5,1,5,BU:1.05); Fuel for
construction machines; recalculated
based on Frischknecht et al. (1996)
explosives, tovex, at plant CH kg 1.94E+3 1 1.70
(4,5,3,5,1,5,BU:1.05); Tunnels and
galleries; based on Bauer et al.
(2007)
gravel, round, at mine CH kg 5.03E+7 1 1.55
(4,3,3,5,1,4,BU:1.05); Concrete for
buildings and other infrastructure;
recalculated based on Frischknecht
et al. (1996)
cement, unspecified, at plant CH kg 5.78E+6 1 1.55
(4,3,3,5,1,4,BU:1.05); Concrete for
buildings and other infrastructure;
recalculated based on Frischknecht
et al. (19969
reinforcing steel, at plant RER kg 4.73E+5 1 1.55
(4,3,3,5,1,4,BU:1.05); Buildings and
other infrastructure; based on
Frischknecht et al. (1996) and Bauer
et al. (2007)
steel, low-alloyed, at plant RER kg 1.27E+6 1 1.55
(4,3,3,5,1,4,BU:1.05); Tubes and
pipes; based on Frischknecht et al.
(1996) and Bauer et al. (2007)
copper, at regional storage RER kg 3.05E+4 1 1.83(4,5,4,5,3,5,BU:1.05); Electric cables;
calculated based on Axpo (2008)
tap water, at user RER kg 3.19E+6 1 1.55
(4,3,3,5,1,4,BU:1.05); Concrete for
buildings and other infrastructure;
recalculated based on Frischknecht
et al. (1996)
electricity, medium voltage, domestic production, at
gridENTSO kWh 1.54E+6 1 1.70
(4,5,3,5,1,5,BU:1.05); Electricity
supply for the construction;
recalculated based on Frischknecht
et al. (1996)
disposal, building, reinforced concrete, to recycling CH kg 1.58E+7 1 1.55
(4,3,3,5,1,4,BU:1.05); Recycling of
reinforced infrastructure;
recalculated based on Frischknecht
et al. (1996), assumed recycling rate:
100%
disposal, building, reinforcement steel, to recycling CH kg 1.36E+6 1 1.52
(4,3,3,1,1,4,BU:1.05); Recycling of
turbines, generators, tubes and
pipes; recalculated based
Frischknecht et al. (1996), assumed
recycling rate: 100%
disposal, building, concrete, not reinforced, to final
disposalCH kg 4.08E+7 1 1.55
(4,3,3,5,1,4,BU:1.05); Recycling of
turbines, generators, tubes and
pipes; recalculated based
Frischknecht et al. (1996), assumed
recycling rate: 100%
transport, lorry >16t, fleet average RER tkm 5.84E+5 1 2.51
(4,5,na,na,na,na,BU:2); Transport of
materials to the construction site;
based on Frischknecht et al. (1996)
transport, freight, rail RER tkm 5.84E+5 1 2.51
(4,5,na,na,na,na,BU:2); Transport of
materials to the construction site;
Based on Frischknecht et al. (1996)
emission air, low
population densityHeat, waste - MJ 5.54E+6 1 1.41 (4,5,3,5,1,5,BU:1.05); From electricity
Particulates, < 2.5 um - kg 2.58E+1 1 3.61
(4,5,5,5,4,5,BU:3); Particle
emissions during the construction;
based on BUWAL (2001, 2003)
Particulates, > 10 um - kg 5.17E+2 1 2.17
(4,5,5,5,4,5,BU:1.5); Particle
emissions during the construction;
based on BUWAL (2001, 2003)
Particulates, > 2.5 um, and < 10um - kg 1.46E+2 1 2.61
(4,5,5,5,4,5,BU:2); Particle
emissions during the construction;
based on BUWAL (2001, 2003)

6. Life Cycle Inventory data of hydropower stations in other countries
Life Cycle Inventories of Hydroelectric Power Generation - 45 - ESU-services Ltd.
Tab. 6.6: Unit process raw data of electricity, hydropower, at run-of-river power plant, with res-ervoir/RER, electricity, hydropower, at run-of-river power plant, without reservoir/RER and electricity, hydropower, at run-of-river power plant, mix/RER.
Name
Lo
ca
tio
n
Un
it
electricity,
hydropower, at
run-of-river
power plant with
reservoir
electricity,
hydropower, at
run-of-river
power plant
without reservoir
electricity,
hydropower, at
run-of-river
power plant
Un
ce
rta
inty
Typ
e
Sta
nd
ard
De
via
tio
n9
5%
GeneralComment
Location RER RER RER
InfrastructureProcess 0 0 0
Unit kWh kWh kWh
productelectricity, hydropower, at run-of-river
power plant with reservoirRER kWh 1
electricity, hydropower, at run-of-river
power plant without reservoirRER kWh 1
electricity, hydropower, at run-of-river
power plantRER kWh 1
technosphereelectricity, hydropower, at run-of-river
power plant with reservoirRER kWh 1.98E-2 1 1.55
(4,3,3,5,1,4,BU:1.05); Proportion of
hydropower from run-of-river hydropower
stations with reservoir
electricity, hydropower, at run-of-river
power plant without reservoirRER kWh 9.80E-1 1 1.55
(4,3,3,5,1,4,BU:1.05); Proportion of
hydropower from run-of-river hydropower
stations without reservoir
run-of-river hydropower plant RER unit 3.25E-10 3.25E-10 1 3.70
(4,3,3,5,1,4,BU:3); Infrastructure of the
run-of-river power station producing the
electricity
lubricating oil, at plant RER kg 1.22E-7 1.22E-7 1 1.78(4,5,3,5,3,5,BU:1.05); In turbines; based
on Axpo (2008) and Vattenfall (2008)
resource, land Transformation, to industrial area, built up - m2 5.60E-7 5.60E-7 1 2.53
(4,3,3,1,1,5,BU:2); Area covered by
infrastructures, not the river; based on
Frischknecht et al. (1996)
Transformation, from shrub land,
sclerophyllous- m2 1.02E-4 2.83E-5 1 2.53
(4,3,3,1,1,5,BU:2); Original area before
the construction of the power station;
recalculated based on Frischknecht et
al. (1996)
Transformation, from pasture and
meadow- m2 1.02E-4 2.83E-5 1 1.67
(4,3,3,1,1,5,BU:1.2); Original area before
the construction of the power station;
recalculated based on Frischknecht et
al. (1996)
Transformation, to water courses, artificial - m2 2.04E-4 5.60E-5 1 2.53
(4,3,3,1,1,5,BU:2); Area covered by the
river; recalculated based on
Frischknecht et al. (1996)
Occupation, water courses, artificial - m2a 1.63E-2 4.48E-3 1 1.96
(4,3,3,1,1,5,BU:1.5); Area occupied due
to the run-of-river hydropower station;
recalculated based on Frischknecht et
al. (1996)
Occupation, industrial area, built up - m2a 4.48E-5 4.48E-5 1 1.96
(4,3,3,1,1,5,BU:1.5); Area occupied due
to the run-of-river hydropower station;
recalculated based on Frischknecht et
al. (1996)
resource, in
waterVolume occupied, reservoir - m3a 8.24E-2 1 1.59
(4,3,3,1,1,5,BU:1.05); Volume occupied
due to the run-of-river hydropower
station; recalculated based on
Frischknecht et al. (1996)
Water, turbine use, unspecified natural
origin- m3 4.50E+1 4.50E+1 1 1.59
(4,3,3,1,1,5,BU:1.05); Amount of water
turbined for the generation of electricity;
based on Frischknecht et al. (1996)
Energy, potential (in hydropower reservoir),
converted- MJ 3.79E+0 3.79E+0 1 1.34
(3,1,1,1,1,1,BU:1.05); Potential energy of
the water
emission air,
unspecifiedWater, OECD - kg 2.50E+1 1 2.27
(4,3,3,2,4,5,BU:1.5); Water evaporated
from reservoir; calculated based on
Pfister et al. (2011)
emission
water, riverOils, unspecified - kg 8.40E-8 8.40E-8 1 2.10
(4,5,3,5,3,5,BU:1.5); From turbines;
based on Axpo (2008) and Vattenfall
(2008)
emission soil,
industrialOils, unspecified - kg 3.80E-8 3.80E-8 1 2.10
(4,5,3,5,3,5,BU:1.5); From turbines;
based on Axpo (2008) and Vattenfall
(2008)
emission air,
low population
density
Methane, biogenic - kg 6.72E-4 1 1.96
(4,3,3,3,1,5,BU:1.5); Methane emissions
due to the held-back river; DelSontro et
al. (2010)

6. Life Cycle Inventory data of hydropower stations in other countries
Life Cycle Inventories of Hydroelectric Power Generation - 46 - ESU-services Ltd.
Tab. 6.7: Unit process raw data of small hydropower plant, in waterworks infrastructure/RER and small hydropower plant/RER.
Name
Lo
ca
tio
n
Un
it
small
hydropower
plant, in
waterworks
infrastructure
small
hydropower
plant
Un
ce
rta
inty
Typ
e
Sta
nd
ard
De
via
tio
n9
5%
GeneralComment
Location RER RER
InfrastructureProcess 1 1
Unit unit unit
product small hydropower plant, in waterworks infrastructure RER unit 1 0
349-022 small hydropower plant RER unit 0 1
technosphere concrete, normal, at plant CH m3 5.52E+1 6.30E+2 1 1.49(4,1,3,1,1,3,BU:1.05);
Infrastructure; literature
gravel, round, at mine CH kg 5.21E+5 1.11E+6 1 1.49(4,1,3,1,1,3,BU:1.05);
Infrastructure; literature
reinforcing steel, at plant RER kg 2.12E+3 4.99E+4 1 1.49(4,1,3,1,1,3,BU:1.05);
Infrastructure; literature
chromium steel 18/8, at plant RER kg 1.01E+3 6.18E+2 1 1.49(4,1,3,1,1,3,BU:1.05); Turbines,
generator, switchboard; literature
steel, low-alloyed, at plant RER kg 1.31E+3 1.39E+3 1 1.49(4,1,3,1,1,3,BU:1.05); Turbines,
generator; literature
copper, at regional storage RER kg 2.18E+2 2.08E+2 1 1.49
(4,1,3,1,1,3,BU:1.05); Turbine,
generatior and switchboard;
literature
polyethylene, HDPE, granulate, at plant RER kg 8.52E+3 9.05E+3 1 1.49(4,1,3,1,1,3,BU:1.05); Water pipes;
literature
polyvinylchloride, at regional storage RER kg 1.24E+3 1.95E+3 1 1.49(4,1,3,1,1,3,BU:1.05); Water pipes;
literature
cast iron, at plant RER kg 4.67E+4 2.72E+4 1 1.49(4,1,3,1,1,3,BU:1.05); Water pipes;
literature
aluminium, production mix, at plant RER kg 2.42E+1 2.68E+1 1 1.49(4,1,3,1,1,3,BU:1.05);
Switchboard; literature
lead, at regional storage RER kg 1.39E+1 1.62E+1 1 1.49(4,1,3,1,1,3,BU:1.05);
Switchboard; literature
flat glass, uncoated, at plant RER kg 9.96E-1 5.63E-1 1 1.49(4,1,3,1,1,3,BU:1.05);
Switchboard; literature
argon, liquid, at plant RER kg 5.85E+0 6.73E+0 1 1.49(4,1,3,1,1,3,BU:1.05); Turbines;
literature
sawn timber, softwood, raw, plant-debarked, u=70%, at plant RER m3 3.12E-2 3.59E-2 1 1.49(4,1,3,1,1,3,BU:1.05); Turbines;
literature
tap water, at user RER kg 4.03E+6 4.63E+6 1 1.49(4,1,3,1,1,3,BU:1.05); Turbiens;
literature
diesel, burned in building machine GLO MJ 6.27E+3 5.33E+4 1 1.49(4,1,3,1,1,3,BU:1.05); Turbines;
literature
electricity, medium voltage, production ENTSO, at grid ENTSO kWh 7.67E+2 1.02E+3 1 1.49(4,1,3,1,1,3,BU:1.05); Turbines;
literature
transport, lorry >16t, fleet average RER tkm 1.59E+4 5.45E+4 1 2.51(4,5,na,na,na,na,BU:2); Transport
of materials and waste
transport, freight, rail RER tkm 3.28E+4 4.98E+4 1 2.51(4,5,na,na,na,na,BU:2); Transport
of materials and waste
disposal, municipal solid waste, 22.9% water, to municipal
incinerationCH kg 9.25E+0 1.06E+1 1 1.49
(4,1,3,1,1,3,BU:1.05); From
turbines; literature
treatment, sewage, to wastewater treatment, class 3 CH m3 1.60E+0 1.84E+0 1 1.49(4,1,3,1,1,3,BU:1.05); From
turbines; literature
disposal, building, reinforced concrete, to recycling CH kg 7.05E+4 1.43E+6 1 1.49(4,1,3,1,1,3,BU:1.05); From
infrastructure; literature
disposal, building, concrete, not reinforced, to final disposal CH kg 5.31E+4 1 1.49(4,1,3,1,1,3,BU:1.05); From
infrastructure; literature
disposal, building, concrete gravel, to final disposal CH kg 5.21E+5 1.11E+6 1 1.49(4,1,3,1,1,3,BU:1.05); From
infrastructure; literature
disposal, building, reinforcement steel, to recycling CH kg 2.32E+3 9.05E+3 1 1.49
(4,1,3,1,1,3,BU:1.05); From
turbines, generators,
switchboards; literature
disposal, polyethylene, 0.4% water, to municipal incineration CH kg 8.52E+3 9.05E+3 1 1.49(4,1,3,1,1,3,BU:1.05); From water
pipes; literature
disposal, polyvinylchloride, 0.2% water, to municipal
incinerationCH kg 1.24E+3 1.95E+3 1 1.49
(4,1,3,1,1,3,BU:1.05); From water
pipes; literature
disposal, building, bulk iron (excluding reinforcement), to
sorting plantCH kg 4.67E+4 2.72E+4 1 1.49
(4,1,3,1,1,3,BU:1.05); From water
pipes; literature
disposal, glass, 0% water, to municipal incineration CH kg 9.96E-1 5.63E-1 1 1.49(4,1,3,1,1,3,BU:1.05); From
switchboards; literature
disposal, wood untreated, 20% water, to municipal
incinerationCH kg 2.39E+1 2.75E+1 1 1.49
(4,1,3,1,1,3,BU:1.05); From
turbines; literature
emission air, low
population densityHeat, waste - MJ 7.67E+2 1.02E+3 1 1.49
(4,1,3,1,1,3,BU:1.05); From
electricity

6. Life Cycle Inventory data of hydropower stations in other countries
Life Cycle Inventories of Hydroelectric Power Generation - 47 - ESU-services Ltd.
Tab. 6.8: Unit process raw data of electricity, hydropower, at small hydropower plant, in water-works infrastructure/RER and electricity, hydropower, at small hydropower plant/RER.
Name
Lo
ca
tio
n
Un
it
electricity,
hydropower, at
small
hydropower
plant, in
waterworks
infrastructure
electricity,
hydropower, at
small
hydropower
plant
Un
ce
rta
inty
Typ
e
Sta
nd
ard
De
via
tio
n9
5%
GeneralComment
Location RER RER
InfrastructureProcess 0 0
Unit kWh kWh
electricity, hydropower, at small hydropower plant, in
waterworks infrastructureRER kWh 1
electricity, hydropower, at small hydropower plant RER kWh 1
small hydropower plant, in waterworks infrastructure RER unit 1.23E-8 1 3.73 (4,3,3,3,3,3,BU:3); literature
small hydropower plant RER unit 1.29E-8 1 3.73 (4,3,3,3,3,3,BU:3); literature
resource, in
water
Energy, potential (in hydropower reservoir),
converted- MJ 3.79E+0 3.79E+0 1 1.60
(4,3,3,3,3,3,BU:1.05); Potenzielle Energie
Wasser; literature

6. Life Cycle Inventory data of hydropower stations in other countries
Life Cycle Inventories of Hydroelectric Power Generation - 48 - ESU-services Ltd.
Tab. 6.9: Unit process raw data of reservoir hydropower plant/BR.
Name
Lo
ca
tio
n
Un
it
reservoir
hydropower
plant
Un
ce
rta
inty
Typ
e
Sta
nd
ard
De
via
tio
n9
5%
GeneralComment
Location BR
InfrastructureProcess 1
Unit unit
product reservoir hydropower plant BR unit 1
technosphere chromium steel 18/8, at plant RER kg 1.31E+7 1 1.65(5,5,4,5,1,4,BU:1.05); Turbines and generators;
based on data of the Itaipu
excavation, hydraulic digger RER m3 2.36E+7 1 1.26(4,4,1,3,1,4,BU:1.05); Excavation; based on data of
the Itaipu
explosives, tovex, at plant CH kg 2.24E+8 1 1.69
(5,5,4,5,1,5,BU:1.05); Tunnels and galleries;
recalculated based on Béguin et al. 1963,
Bertschinger 1959, Blenio Kraftwerke 1968,
Condrau 1962, KVR 1963; 1968, Töndury 1956;
1964, Weber et al. 1965 and other sources.
concrete, normal, at plant CH m3 3.90E+6 1 1.26(4,4,1,3,1,4,BU:1.05); Concrete for dams, buildings
and other infrastructure; based on data of the Itaipu
reinforcing steel, at plant RER kg 1.26E+7 1 1.65
(5,5,4,5,1,4,BU:1.05); Buildings and other
infrastructure; recalculated based on Bertschinger
(1959), Condrau (1962), KVR (1968), Salanfe
(1951), Walther und Fetz (1963; 1971), Weber
(1965; 1971) and other sources.
steel, low-alloyed, at plant RER kg 5.51E+7 1 1.65
(5,5,4,5,1,4,BU:1.05); Tubes and pipes;
recalculated based on recalculated based on
Bertschinger (1959), Condrau (1962), KVR (1968),
Salanfe (1951), Walther und Fetz (1963; 1971),
Weber (1965; 1971) and other sources.
copper, at regional storage RER kg 1.11E+8 1 1.65(5,5,4,5,1,4,BU:1.05); Electric cables; Vattenfall
(2008)
electricity, medium voltage, at grid BR kWh 1.03E+10 1 1.65
(5,5,4,5,1,4,BU:1.05); Electricity supply for the
construction; recalculated based on Bertschinger
(1959), Blenio Kraftwerke (1968), KVR (1968),
Töndury (1964), Walther und Fetz (1963), Weber et
al. (1965), BFE (1992) and other sources.
disposal, building, reinforced
concrete, to recyclingCH kg 4.19E+8 1 1.65
(5,5,4,5,1,4,BU:1.05); Recycling of reinforced
infrastructure; based on Frischknecht (1996),
assumed recycling rate: 100%
disposal, building, concrete, not
reinforced, to final disposalCH kg 8.17E+9 1 1.65
(5,5,4,5,1,4,BU:1.05); Non-inforced infrastructure
left on-site at the end of the use phase of the power
station (especially the dams, tunnels, galleries);
based on Frischknecht et al. (1996)
disposal, building, reinforcement
steel, to recyclingCH kg 6.83E+7 1 1.65
(5,5,4,5,1,4,BU:1.05); Recycling of turbines,
generators, tubes and pipes; assumed recycling
rate: 100%
transport, lorry >32t, EURO3 RER tkm 1.80E+9 1 2.09(4,5,na,na,na,na,BU:2); Transport of materials to
the construction site; based on Bertschinger (1959)
transport, freight, rail RER tkm 9.83E+9 1 2.09(4,5,na,na,na,na,BU:2); Transport of materials to
the construction site; based on Bertschinger (1959)
emission air, low
population Heat, waste - MJ 3.70E+10 1 1.65 (5,5,4,5,1,4,BU:1.05); From electricity
Particulates, < 2.5 um - kg 2.03E+5 1 3.83(4,5,3,5,5,5,BU:3); Particle emissions during the
construction; based on BUWAL (2001, 2003)
Particulates, > 10 um - kg 4.05E+6 1 2.39(4,5,3,5,5,5,BU:1.5); Particle emissions during the
construction; based on BUWAL (2001, 2003)
Particulates, > 2.5 um, and < 10um - kg 1.15E+6 1 2.83(4,5,3,5,5,5,BU:2); Particle emissions during the
construction; based on BUWAL (2001, 2003)

6. Life Cycle Inventory data of hydropower stations in other countries
Life Cycle Inventories of Hydroelectric Power Generation - 49 - ESU-services Ltd.
Tab. 6.10: Unit process raw data of electricity, hydropower, at reservoir power plant/BR.
Name
Lo
ca
tio
n
Un
it
electricity,
hydropower,
at reservoir
power plant
Un
ce
rta
inty
Typ
e
Sta
nd
ard
De
via
tio
n9
5%
GeneralComment
Location BR
InfrastructureProcess 0
Unit kWh
productelectricity, hydropower, at
reservoir power plantBR kWh 1
technospherereservoir hydropower
plantBR unit 8.89E-14 1 3.15
(4,5,3,3,1,5,BU:3); Infrastructure of the
storage power station producing the
electricity
sulphur hexafluoride,
liquid, at plantRER kg 3.40E-13 1 1.65
(5,5,3,5,1,5,BU:1.05); In electric
insulation (e.g. switches); based on
Vattenfall (2008)
lubricating oil, at plant RER kg 3.24E-8 1 1.65(5,5,3,5,1,5,BU:1.05); Turbines; based
on Vattenfall (2008)
resource, landTransformation, from
tropical rain forest- m2 1.21E-4 1 2.10
(4,1,1,3,1,5,BU:2); Original area before
the construction of the power station;
based on data of the Itaipu
Transformation, to water
bodies, artificial- m2 1.20E-4 1 2.10
(4,1,1,3,1,5,BU:2); Area covered by the
reservoir; based on data of the Itaipu
Transformation, to
industrial area, built up- m2 1.20E-6 1 2.10
(4,1,1,3,1,5,BU:2); Area covered by
infrastructures other than held-back
river; recalculated based on
Frischknecht et al. (1996)
Occupation, water
bodies, artificial- m2a 1.80E-2 1 1.62
(4,1,1,3,1,5,BU:1.5); Area occupied by
the reservoir; based on data of the
Itaipu
Occupation, industrial
area, built up- m2a 1.80E-4 1 1.62
(4,1,1,3,1,5,BU:1.5); Area occupied by
the infrastructure; based on data of the
Itaipu
resource, in waterVolume occupied,
reservoir- m3a 2.53E-1 1 1.30
(4,1,1,3,1,5,BU:1.05); Volume occupied
by the reservoir; ; based on data of the
Itaipu
Water, turbine use,
unspecified natural origin- m3 2.90E-1 1 1.30
(4,1,1,3,1,5,BU:1.05); Amount of water
turbined for the generation of electricity;
based on data of the Itaipu
Energy, potential (in
hydropower reservoir),
converted
- MJ 3.79E+0 1 1.11(3,1,1,1,1,1,BU:1.05); Potential energy
of the water
emission air, low
population densityMethane, biogenic - kg 5.56E-4 1 4.00
(4,3,3,3,1,3,BU:1.5); Methane
emissions due to the biomass in the
reservoirs; calculated based on Diem
et al. (2008)
Carbon dioxide, land
transformation- kg 3.09E-2 1 2.00
(4,3,3,3,1,3,BU:1.4); Carbon dioxide
emissions due to the biomass in the
reservoirs; calculated based on Diem
et al. (2008)
Sulfur hexafluoride - kg 3.40E-13 1 1.90
(5,5,3,5,1,5,BU:1.5); From electric
insulations (e.g. switches); based on
Vattenfall (2008)
emission water,
riverOils, unspecified - kg 2.27E-8 1 1.90
(5,5,3,5,1,5,BU:1.5); From turbines;
based on Vattenfall (2008)
emission soil,
industrialOils, unspecified - kg 9.76E-9 1 1.90
(5,5,3,5,1,5,BU:1.5); From turbines;
based on Vattenfall (2008)

7. Cumulative results and interpretation
Life Cycle Inventories of Hydroelectric Power Generation - 50 - ESU-services Ltd.
7 Cumulative results and interpretation
7.1 Cumulative Energy Demand
The CED of the electricity generated in storage hydropower stations is around 4.22 MJ/kWh.
Most of the energy demand is covered by renewable energy sources. This is due to the poten-
tial energy of the water itself. It amounts to 3.79 MJ/kWh. 10.7 % of the CED of electricity
from storage hydropower stations derives from the electricity used for the operation of pumps
that supply additional water to the reservoir. The dataset “storage hydropower station, CH,
net” does not include the electricity consumption of pumps as an input. The electricity con-
sumption of the pumps is subtracted from the gross electricity production of the storage hy-
dropower plant.
Due to missing information, the electricity consumption of pumps is not considered for the
European storage hydropower stations.
With around 1.1 %, the infrastructure makes only a small contribution.
The CED of the electricity generated in Swiss run-of-river hydropower stations equals
3.83 MJ/kWh and is nearly completely covered by the potential energy of the water turbined.
The infrastructure contributes very little (1.1 %) to the CED.
The CED of the electricity generated in small hydropower stations is mainly covered by the
potential energy of the water too (Tab. 7.2). The contribution of the infrastructure to the total
CED amounts to 0.8 % for small hydropower stations that are integrated in waterworks infra-
structures and 1.5 % for standalone hydropower stations.
The electricity generated in pumped storage hydropower stations in Switzerland and Europe
has the highest cumulative energy demand (Fig. 7.1). Compared to the other types of hydroe-
lectricity generation it is more than three times higher (Tab. 7.1). Nearly 100 % of the CED is
due to the electricity consumption of the pumps.
There is no significant difference in the CED between Switzerland and Europe for the other
types of hydroelectricity generation.

7. Cumulative results and interpretation
Life Cycle Inventories of Hydroelectric Power Generation - 51 - ESU-services Ltd.
Fig. 7.1: Cumulative energy demand of the electricity generated in Swiss and European stor-age and run-of-river hydropower stations. CH net: electricity consumption of pumps is subtracted from gross electricity produc-tion.
Tab. 7.1: Cumulative energy demand (in MJ oil-eq/kWh) of the storage, pumped storage and run-of-river hydroelectricity generated in Switzerland and Europe. In comparison, the total cumulative energy demand according to the ecoinvent v2.2 datasets (Bolliger & Bauer 2007). CH net: electricity consumption of pumps is subtracted from gross electricity produc-tion.
Storage Pumped
storage
Run-of-river
CH CH net Europe
alpine
Europe
non-
alpine
CH Europe CH Europe
Fossil 0.100 0.033 0.037 0.037 1.931 7.595 0.033 0.035
Nuclear 0.325 0.012 0.008 0.008 8.903 4.581 0.008 0.006
Renewable 3.858 3.794 3.793 3.793 1.843 1.253 3.792 3.792
Total 4.283 3.838 3.838 3.838 12.677 13.428 3.833 3.833
Total
ecoinvent
v2.2
3.848 3.850 3.850 14.04 3.834 3.835
Change +11 % 0 % 0 % -10 % 0 % 0 %
Tab. 7.2: Cumulative energy demand (in MJ oil-eq/kWh) of the hydroelectricity generated small hydropower stations in Switzerland and Europe.
Small standalone Small integrated
CH Europe CH Europe
Fossil 0.050 0.049 0.026 0.027
Nuclear 0.007 0.007 0.003 0.003
Renewable 3.792 3.792 3.791 3.791
Total 3.849 3.848 3.821 3.821

7. Cumulative results and interpretation
Life Cycle Inventories of Hydroelectric Power Generation - 52 - ESU-services Ltd.
Hydroelectricity produced in the Brazilian storage hydropower station has a total CED of
3.8 MJ/kWh. Nearly all is covered by renewable energy sources, most of it by the potential
energy of the water turbined. The infrastructure accounts for 0.2 %.
In comparison with electricity from hydropower according to the current ecoinvent data sets
(Bolliger & Bauer 2007), the CED of the electricity from Swiss storage hydropower stations
increases by 11 %. This is mainly due to the additional consideration of the electricity con-
sumption of various pumps (excluding pumped storage pumps). This is supported by the CED
of electricity from storage hydropower stations where only the net production and hence no
electricity consumption is considered. Their CED is similar to the ecoinvent data modelled by
Bolliger & Bauer (2007).
As the electricity consumption of the pumps is not considered for European storage hydro-
power stations, their CED does not change. The material consumption per hydropower station
is lower than in the existing data sets as the hydropower stations are smaller (lower capacity).
On the other hand, less electricity is generated in these plants. The material consumption per
kWh electricity produced is therefore about the same. The average run-of-river hydropower
station modelled in this study is smaller too. However the material intensity per kWh elec-
tricity produced remains about the same.
7.2 Greenhouse gas emissions
In Fig. 7.2 the greenhouse gas emissions of different types of hydroelectricity generation in
Switzerland and Europe are compared. The electricity from pumped storage hydropower sta-
tions is omitted due to its high emission factors and a better readability of the figure. All the
greenhouse gas emissions and other impact category indicator results are listed in Tab. 7.3.
Electricity generated in storage hydropower stations in Switzerland causes emissions of
10.8 g CO2-eq/kWh. 50 % of these emissions are caused by the electricity consumption in
pumps during the operation of the station. The emissions from the reservoirs cover 12.8 % of
the total emissions. The rest is contributed by the construction of the stations. The importance
of the electricity is apparent if the storage hydropower stations are compared to the storage
hydropower stations where only the net production is considered. Their greenhouse gas emis-
sions are half as high.
Due to the larger surface area of the non-alpine reservoirs as well as a different climate, the
greenhouse gas emissions are significantly higher than from alpine reservoirs. The emissions
from the reservoirs contribute 73 % to the total greenhouse gas emissions.
The greenhouse gas emissions of the electricity generation in pumped storage hydropower
stations are strongly dominated by the electricity generation of the pumps. In Switzerland, this
is 96.6 %, in Europe it is 99.1 %. The emissions from the reservoirs account for 0.9 % of the
greenhouse gas emissions from Swiss pumped storage hydropower stations and for 0.2 %
from the European ones.
The greenhouse gas emissions of 1 kWh electricity produced in run-of-river hydropower sta-
tions are dominated by the infrastructure (92 %). The rest stems from the emissions from the
reservoirs.
The electricity from small hydropower stations causes greenhouse gas emissions of 4.9 g
CO2-eq/kWh and 1.9 g CO2-eq/kWh for stand-alone and integrated small hydropower, respec-
tively (Tab. 7.4). All emissions derive from the infrastructure. Consequently, the electricity
from small hydropower stations integrated in existing waterworks infrastructures causes fewer
emissions than the electricity from standalone small hydropower stations.
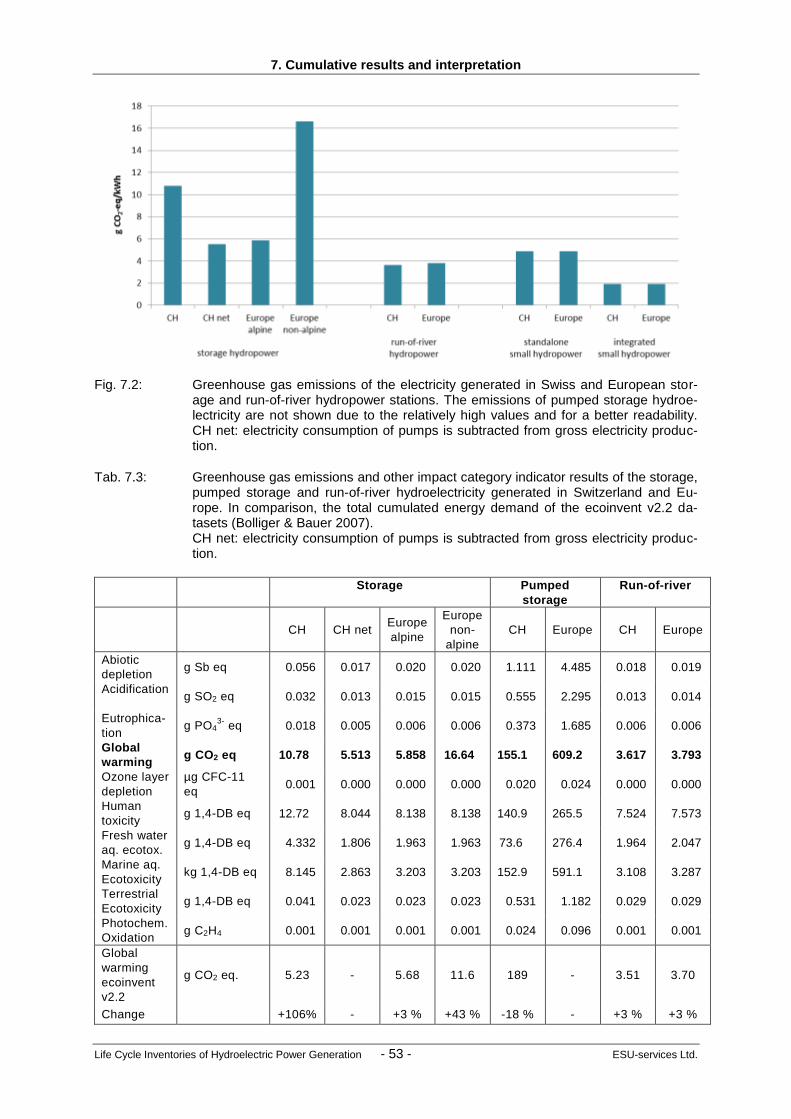
7. Cumulative results and interpretation
Life Cycle Inventories of Hydroelectric Power Generation - 53 - ESU-services Ltd.
Fig. 7.2: Greenhouse gas emissions of the electricity generated in Swiss and European stor-age and run-of-river hydropower stations. The emissions of pumped storage hydroe-lectricity are not shown due to the relatively high values and for a better readability. CH net: electricity consumption of pumps is subtracted from gross electricity produc-tion.
Tab. 7.3: Greenhouse gas emissions and other impact category indicator results of the storage, pumped storage and run-of-river hydroelectricity generated in Switzerland and Eu-rope. In comparison, the total cumulated energy demand of the ecoinvent v2.2 da-tasets (Bolliger & Bauer 2007). CH net: electricity consumption of pumps is subtracted from gross electricity produc-tion.
Storage Pumped
storage
Run-of-river
CH CH net Europe
alpine
Europe
non-
alpine
CH Europe CH Europe
Abiotic
depletion g Sb eq 0.056 0.017 0.020 0.020 1.111 4.485 0.018 0.019
Acidification
g SO2 eq 0.032 0.013 0.015 0.015 0.555 2.295 0.013 0.014
Eutrophica-
tion g PO4
3- eq 0.018 0.005 0.006 0.006 0.373 1.685 0.006 0.006
Global
warming g CO2 eq 10.78 5.513 5.858 16.64 155.1 609.2 3.617 3.793
Ozone layer
depletion
µg CFC-11
eq 0.001 0.000 0.000 0.000 0.020 0.024 0.000 0.000
Human
toxicity g 1,4-DB eq 12.72 8.044 8.138 8.138 140.9 265.5 7.524 7.573
Fresh water
aq. ecotox. g 1,4-DB eq 4.332 1.806 1.963 1.963 73.6 276.4 1.964 2.047
Marine aq.
Ecotoxicity kg 1,4-DB eq 8.145 2.863 3.203 3.203 152.9 591.1 3.108 3.287
Terrestrial
Ecotoxicity g 1,4-DB eq 0.041 0.023 0.023 0.023 0.531 1.182 0.029 0.029
Photochem.
Oxidation g C2H4 0.001 0.001 0.001 0.001 0.024 0.096 0.001 0.001
Global
warming
ecoinvent
v2.2
g CO2 eq. 5.23 - 5.68 11.6 189 - 3.51 3.70
Change +106% - +3 % +43 % -18 % - +3 % +3 %

7. Cumulative results and interpretation
Life Cycle Inventories of Hydroelectric Power Generation - 54 - ESU-services Ltd.
Tab. 7.4: Greenhouse gas emissions and other impact category indicator results of the hydroe-lectricity generated in small hydropower stations in Switzerland and Europe.
Small standalones Small integrated
CH Europe CH Europe
Abiotic
depletion g Sb eq 0.027 0.027 0.015 0.015
Acidification
g SO2 eq 0.014 0.014 0.006 0.006
Eutrophica-
tion g PO4
3- eq 0.006 0.006 0.003 0.003
Global
warming g CO2 eq 4.888 4.876 1.918 1.928
Ozone layer
depletion µg CFC-11 eq 0.000 0.000 0.000 0.000
Human
toxicity g 1,4-DB eq 2.950 2.952 2.525 2.529
Fresh water
aq. ecotox. g 1,4-DB eq 1.957 1.969 1.538 1.548
Marine aq.
Ecotoxicity kg 1,4-DB eq 2.777 2.802 2.074 2.094
Terrestrial
Ecotoxicity g 1,4-DB eq 0.048 0.048 0.043 0.043
Photochem.
Oxidation g C2H4 0.001 0.001 0.001 0.001
While the greenhouse gas emissions of the electricity produced in storage hydropower sta-
tions in Switzerland is dominated by the electricity consumption, the emissions from the res-
ervoirs contribute 99 % to the total greenhouse gas emissions of electricity produced in Bra-
zilian storage hydropower stations (43 g CO2-eq/kWh). The infrastructure contributes 1 %.
A comparison with the current ecoinvent data sets (Bolliger & Bauer 2007) shows an increase
in greenhouse gas emissions of the electricity produced in Swiss storage hydropower stations.
This increase is based on the implementation of the electricity consumption during the opera-
tion of the power stations. Otherwise the greenhouse gas emissions remain constant. The sig-
nificant increase in the greenhouse gas emissions of the European non-alpine electricity pro-
duction from storage hydropower plants is due to the implementation of CO2- and N2O-
emissions from the reservoir.
The level of greenhouse gas emissions from pumped storage hydropower stations is slightly
lower.
The greenhouse gas emissions of the electricity generated in run-of-river hydropower stations
increase slightly. This is due to the consideration of greenhouse gas emissions from reser-
voirs.
Environmental impacts caused by electricity generation in small hydropower stations cannot
be compared to respective ecoinvent datasets as there are no data are about the electricity gen-
eration in small hydropower stations available.

References
Life Cycle Inventories of Hydroelectric Power Generation - 42 - ESU-services Ltd.
References Aegerter et al. 1954 Aegerter et al. (1954) Das Kraftwerk Birsfelden. In: Wasser- und
Energiewirtschaft, 46(5-7), pp. 165-176.
Aegina 1965 Aegina (1965) Die Anlagen der Kraftwerk Aegina AG, mitgeteilt von
der Ingenieurgemeinschaft Schweiz, Aluminium-Industrie AG und
Maggia-Kraftwerke AG. In: Kraftwerkbau, 9(3-4), pp. 1-20.
Axpo 2008 Axpo (2008) Umweltdeklaration: Niederdruckwasserkraftwerk
Wildegg-Brugg.
Baumann 1949 Baumann (1949) Kraftwerk Rupperswil-Auenstein. Verlag Kraftwerk
Rupperswil-Auenstein A.G., Rupperswil.
Baumgartner & Doka 1998 Baumgartner W. and Doka G. (1998) Energiebilanzen von
Klein-Wasserkraftwerken; Energierückzahldauern -
Energieerntefaktoren. 2. Auflage, DIANE 10 Klein-
Wasserkraftwerke, ITECO Ingenieurunternehmung AG, Affoltern am
Albis.
Béguin & Jeanneret 1963 Béguin and Jeanneret (1963) Aménagement de la Dranse
d'Entremont. In: Wasser- und Energiewirtschaft, 55(8), pp. 265-274.
Berg & Real 2006 Berg M. and Real M. (2006) Road Map Erneuerbare Energien
Schweiz. SATW-Schrift Nr. 39. Schweizerische Akademie der
Technischen Wissenschaften, SATW, Zürich, retrieved from:
www.satw.ch.
Bertschinger 1959 Bertschinger (1959) Versorgungs- und Transportprobleme beim Bau
der Bergeller Kraftwerke der Stadt Zürich. In: Wasser- und
Energiewirtschaft, 51(7), pp. 191-198.
BFE 1992 BFE (1992) Schweizerische Gesamtenergiestatistik 1991. In: Bulletin
SEV/VSE, Vol. 12 (ed. Elektrizitätswerke V. S.). Bundesamt für
Energie, Bern, CH.
BFE 2010a BFE (2010a) Schweizerische Elektrizitätsstatistik 2009. Bundesamt
für Energie, Bern, CH, retrieved from:
http://www.bfe.admin.ch/themen/00526/00541/00542/00630/index.ht
ml?lang=de&dossier_id=04840.
BFE 2010b BFE (2010b) Statistik der Wasserkraftanlagen der Schweiz (ed.
UVEK), Bern.
BFE 2011a BFE (2011a) Schweizerische Elektrizitätsstatistik 2010. Bundesamt
für Energie, Bern, CH, retrieved from:
http://www.bfe.admin.ch/themen/00526/00541/00542/00630/index.ht
ml?lang=de&dossier_id=04840.
BFE 2011b BFE (2011b) Gesamte Erzeugung und Abgabe Elektrischer Energie in
der Schweiz 2010.
BFE 2011c BFE (2011c) Statistik der Wasserkraftanlagen der Schweiz (ed.
UVEK), Bern.

References
Life Cycle Inventories of Hydroelectric Power Generation - 43 - ESU-services Ltd.
Biedermann et al. 1985 Biedermann et al. (1985) Barrages Suisses, Swiss Dams. In: 15e
Congrès International des Grands Barrages 1985 à Lausanne. Comité
National Suisse des Grands Barrages, Zürich.
Binacional 2000 Binacional I. (2000) Itaipu: Eines der Sieben Wunder der Neuzeit (ed.
Binacional I.), retrieved from: www.itaipu.gov.py.
Bischof 1992 Bischof (1992) Modernisierungspotential bie bestehenden
Wasserkraftwerken. In: Vortrag beim Schweiz. Technischen Verband,
Sektion Graubünden, Churwalden.
Blenio Kraftwerke 1968 Blenio Kraftwerke (1968) Der Ausbau der Blenio Kraftwerke,
Mitteilung der Geschäftsleitung der Blenio Kraftwerke AG. In:
Wasser- und Energiewirtschaft, 60(7-8), pp. 211-216.
Bolliger & Bauer 2007 Bolliger R. and Bauer C. (2007) Wasserkraft. In: Sachbilanzen von
Energiesystemen: Grundlagen für den ökologischen Vergleich von
Energiesystemen und den Einbezug von Energiesystemen in
Ökobilanzen für die Schweiz, Vol. ecoinvent report No. 6-VIII, v2.0
(Ed. Dones R.). Paul Scherrer Institut Villigen, Swiss Centre for Life
Cycle Inventories, Dübendorf, CH retrieved from:
www.ecoinvent.org.
Bratrich & Truffer 2001 Bratrich C. and Truffer B. (2001) Ökostrom-Zertifizierung für
Wasserkraftanlagen.
Brux 1983 Brux (1983) Das Donaukraftwerk Greifenstein. In: Wasser, Energie,
Luft, 75(1-2), pp. 11-13.
BUWAL 2001 BUWAL (2001) Massnahmen zur Reduktion der PM10-Emissionen.
Umwelt-Materialien Nr. 136. Bundesamt für Umwelt, Wald und
Landschaft (BUWAL), Bern.
BUWAL 2003 BUWAL (2003) Modelling of PM10 and PM2.5 ambient
concentrations in Switzerland 2000 and 2010. Environmental
Documentation No. 169. Bundesamt für Umwelt, Wald und
Landschaft (BUWAL), Bern.
BWW 1973 BWW (1973) Statistik der Wasserkraftanlagen der Schweiz auf 1.
Januar 1973. Eidg. Amt für Wasserwirtschaft, Bern.
Condrau 1962 Condrau (1962) Die Kraftwerke Vorderrhein. In: Terra Grischuna,
21(5), pp. 352-355.
DelSontro et al. 2010 DelSontro, McGinnis, Sobek, Ostrovsky and Wehrli (2010) Extreme
Methane Emissions from a Swiss Hydropower Reservoir:
Contribution from Bubbling Sediments. In: Environ Sci. Technol., 44,
pp. 2419-2425.
DesMeules 1961 DesMeules (1961) Barrage-poids de la Grande Dixence. In: Wasser-
und Energiewirtschaft, 53(6-7), pp. 177-182.
Diem et al. 2008 Diem, Koch, Schwarzenbach, Wehrli and Schubert (2008)
Greenhouse gas emissions (CO2, CH4 and N2O) from peri-alpine and
alpine hydropower reservoirs. In: Biogeosciences Discuss., 5, pp.
3699-3736, 10.5194/bgd-5-3699-2008.

References
Life Cycle Inventories of Hydroelectric Power Generation - 44 - ESU-services Ltd.
Doka 2009 Doka G. (2009) Life Cycle Inventories of Waste Treatment Services.
ecoinvent report No. 13, v2.1. EMPA St. Gallen, Swiss Centre for
Life Cycle Inventories, Dübendorf, CH, retrieved from:
www.ecoinvent.org.
dos Santos et al. 2006 dos Santos M. A., Rosa L. P., Sikar B., Sikar E. and dos Santos E. O.
(2006) Gross greenhouse gas fluxes from hydro-power reservoir
compared to thermo-power plants. In: Energy Policy, 34, pp. 481-488.
Engel et al. 1985 Engel, Fehle and Hartman (1985) Ein altes Wasserkraftwerk, was
nun? In: Bulletin des Schweizerischen Elektrotechnischen Vereins
(SEV) und des Verbandes Schweizerischer Elektrizitätswerke (VSE),
76(22), pp. 1358-1363.
Erbiste 1984 Erbiste (1984) Estimating gate weights. In: Water Power & Dam
Construction, 36(5), pp. 18-23.
EUROSTAT 2010 EUROSTAT (2010) Energy - Yearly statistics 2008.
Fearnside 2004 Fearnside (2004) Greenhouse Gas Emissions from Hydroelectric
Dams: Controversies Provide a Springboard for Rethinking a
Supposedly "clean" Energy Source. In: Climatic Change, pp.
Frischknecht et al. 1994 Frischknecht R., Hofstetter P., Knoepfel I., Dones R. and
Zollinger E. (1994) Ökoinventare für Energiesysteme. Grundlagen für
den ökologischen Vergleich von Energiesystemen und den Einbezug
von Energiesystemen in Ökobilanzen für die Schweiz. 1. Gruppe
Energie - Stoffe - Umwelt (ESU), Eidgenössische Technische
Hochschule Zürich und Sektion Ganzheitliche Systemanalysen, Paul
Scherrer Institut Villigen, Bundesamt für Energie (Hrsg.), Bern.
Frischknecht et al. 1996 Frischknecht R., Bollens U., Bosshart S., Ciot M., Ciseri L.,
Doka G., Dones R., Gantner U., Hischier R. and Martin A. (1996)
Ökoinventare von Energiesystemen: Grundlagen für den ökologischen
Vergleich von Energiesystemen und den Einbezug von
Energiesystemen in Ökobilanzen für die Schweiz. 3. Gruppe Energie -
Stoffe - Umwelt (ESU), Eidgenössische Technische Hochschule
Zürich und Sektion Ganzheitliche Systemanalysen, Paul Scherrer
Institut, Villigen, Bundesamt für Energie (Hrsg.), Bern, CH, retrieved
from: www.energieforschung.ch.
Frischknecht et al. 2007 Frischknecht R., Jungbluth N., Althaus H.-J., Doka G., Dones
R., Heck T., Hellweg S., Hischier R., Nemecek T., Rebitzer G. and
Spielmann M. (2007) Overview and Methodology. ecoinvent report
No. 1, v2.0. Swiss Centre for Life Cycle Inventories, Dübendorf, CH,
retrieved from: www.ecoinvent.org.
Gicot 1956 Gicot (1956) Le comportement du barrage de Rossens durant les
premières années d'exploitation. In: Wasser- und Energiewirtschaft,
48(7-9), pp. 280-285.
Herbeck & Reismann 1977 Herbeck and Reismann (1977) Die Bauausführung grosser
Talsperren und Staustufen. In: Österreichische Wasserwirtschaft,
29(9-10), pp. 243-264.
IEA 2011 IEA (2011) Monthly Electricity Statistics (ed. OECD), Paris.
References
Life Cycle Inventories of Hydroelectric Power Generation - 45 - ESU-services Ltd.
Jean-Baptiste & Konersmann 2000 Jean-Baptiste D. and Konersmann L. (2000) Lokale und
globale Umweltauswirkungen der Wasserkraftanlage Guarda.
semester thesis. ETH Zürich, Zürich.
König 1985 König (1985) Bau von Wasserkraftanlagen. C.F. Müller, Karlsruhe.
KVR 1963 KVR (1963) Die Kraftwerke Vorderrhein im Bündner Oberland, Hg.
von der Kraftwerke Vorderrhein AG Disentis zur Einweihung am 27.
Juni 1963.
KVR 1968 KVR (1968) Die Kraftwerke Vorderrhein im Bünder Oberland. In:
Kraftwerkbau, 13(1), pp. 5-30.
Lima 2005 Lima (2005) Biogeochemical distinction of methane releases from two
Amazon hydroreservoirs. In: Chemosphere, 59(11), pp. 1697-1702.
Link 1970 Link (1970) Die Speicherseen der Alpen. In: Wasser- und
Energiewirtschaft, 62(9), pp. 241-358.
Mäkinen & Khan 2010 Mäkinen and Khan (2010) Policy Considerations for Greenhouse Gas
Emissions from Freshwater Reservoirs. In: Water Alternatives, 3(2),
pp. 91-105.
Meyer 1960 Meyer E. (1960) Erfahrungen beim Bau der Misoxer Kraftwerke. In:
Kraftwerkbau, 5(Nov.-Dez.), pp. 85-105.
Morf 1962 Morf (1962) Kraftwerke Linth-Limmern. In: Kraftwerkbau, 7(1), pp.
11-24.
NOK 1956 NOK (1956) Das Kraftwerk Wildegg-Brugg. In: Schweizerische
Bauzeitung, 74(4;5;5;7;8;10;12), pp. 47-52;63-67;83-88;93-99;111-
116;145-147;167-172.
Pfister et al. 2011 Pfister S., Saner D. and Koehler A. (2011) The environmental
relevance of freshwater consumption in global power production. In:
Int J LCA, pp. 1-12.
Programm Kleinwasserkraftwerke 2010 Programm Kleinwasserkraftwerke (2010)
Pressemappe Kleinwasserkraftwerk.
Radag 1979 Radag (1979) 50 Jahre Rheinkraftwerk Albbruck-Dogern
Aktiengesellschaft, 1929-1979.
Rosa et al. 2003 Rosa et al. (2003) Biogenic gas production from major Amazon
reservoirs, Brazil. In: Hydrological Processes, 17(7), pp. 1443-1450.
Rosa et al. 2004 Rosa L. P., dos Santos M. A., Matvienko B., dos Santos E. O. and
Sikar E. (2004) Greenhouse gases emissions by hydroeletric reservoirs
in tropical regions. In: Climatic Change, 66(1-2), pp. 9-21.
Salanfe 1951 Salanfe (1951) Das Speicherkraftwerk Salanfe-Miéville. In:
Schweizerische Bauzeitung, 69(52), pp. 735-744.
Schnitter 1961 Schnitter (1961) Zervreila Arch Dam. In: Water Power, 13(4), pp.
129-138.
Schnitter 1971 Schnitter (1971) Staumauer und Machinenhaus Ova Spin der
Engadiner Kraftwerke AG. In: Schweizerische Bauzeitung, 89(33), pp.
811-816.

References
Life Cycle Inventories of Hydroelectric Power Generation - 46 - ESU-services Ltd.
Schweizerisches Talsperrenkomitee 2011 Schweizerisches Talsperrenkomitee (2011)
Verzeichnis der Schweizer Talsperren retrieved from:
http://www.swissdams.ch/Dams/damList/default_d.asp?Sort=Hauteur
Desc.
Sinniger et al. 1991 Sinniger et al. (1991) Ageing of dams - Swiss experience. In
proceedings from: Commission Internationale des Grands Barrages,
Dix-septième Congrès des Grands Barrages, Vienna.
Soumis et al. 2005 Soumis, Lucotte, Canuel, Weissenberger, Houel, Larose and
Duchemin (2005) Hydroelectric reservoirs as anthropogenic sources
of greenhouse gases. In: Water Encyclopedia, 1-4, pp. 203-210.
Spreafico & Weingartner 2005 Spreafico M. and Weingartner R. (2005) Hydrologie der
Schweiz - Ausgewählte Aspekte und Resultate. Bundesamt für Wasser
und Geologie (BWG), Bern.
St.Louis et al. 2009 St.Louis V., Kelly C. A., Duchemin E., Rudd J. W. M. and Rosenberg
D. M. (2009) Reservoir Surfaces as Sources of Greenhouse Gases to
the Atmosphere: A Global Estimate. In: BioScience, 50(9), pp. 766-
775.
Stambach 1944 Stambach (1944) Über die Entwicklung der schweizerischen
Niederdruck-Wasserkraftanlagen in den letzten 50 Jahren. In:
Schweizerische Bauzeitung, 124 125(25 26), pp. 321-325 336-340.
Stucky 1962 Stucky (1962) L'aménagement hydro-électrique de la Gougra. Les
barrages de Moiry et de Tourtemagne, A. Le barrage de Moiry. In:
Schweizerische Bauzeitung, 80(20, 21), pp. 335-342, 353-356.
Töndury 1956 Töndury (1956) Besuch bei den Bergeller Kraftwerken der Stadt
Zürich. In: Wasser- und Energiewirtschaft, 48(12), pp. 356-363.
Töndury 1964 Töndury (1964) Einweihung der Kraftwerkgruppe Blenio. In: Wasser-
und Energiewirtschaft, 56(12), pp. 398-403.
Vattenfall 2008 Vattenfall (2008) Certified Environmental Product Declaration of
Electricity from Vattenfalls's Nordic Hydropower, retrieved from:
www.vattenfall.com.
Walther & Fetz 1963 Walther and Fetz (1963) Sondernummer zur Einweihung der
Kraftwerkanlagen Hinterrhein-Valle di Lei. In: Terra Grischuna,
22(4), pp. 153-348.
Walther & Fetz 1971 Walther and Fetz (1971) Engadiner Kraftwerke. In: Terra Grischuna,
30(4), pp. 159-216.
Weber et al. 1965 Weber et al. (1965) Die Kraftwerke Linth-Limmern. In:
Kraftwerkbau, 10(2-3), pp. 1-23.
Weber et al. 1970 Weber et al. (1970) Kraftwerkbau am Vorderrhein. In: Wasser- und
Energiewirtschaft, 62(7-8), pp. 199-218.
Weber et al. 1971 Weber et al. (1971) Kraftwerkbau am Vorderrhein. In: Wasser- und
Energiewirtschaft, 62(7-8), pp. 199-218.

References
Life Cycle Inventories of Hydroelectric Power Generation - 47 - ESU-services Ltd.
Wunderle 1984 Wunderle (1984) Der elektro-maschinelle Bereich in 30 Jahren
Donauausbau - bewährte Strukturen und neue Techniken. In:
Österreichische Zeitschrift für Elektrizitätswirtschaft, 37(5-6), pp.
142-150.
Zingg 1961 Zingg (1961) Die Bergeller Kraftwerke der Stadt Zürich. In: Terra
Grischuna, 20(4), pp. 233-258.

Appendix
Life Cycle Inventories of Hydroelectric Power Generation - 48 - ESU-services Ltd.
Appendix Tab. 0.1 Some data of the storage power stations considered (Aegina 1965; Béguin &
Jeanneret 1963; Bertschinger 1959; BFE 1992; Biedermann et al. 1985; Blenio Kraftwerke 1968; BWW 1973; Condrau 1962; DesMeules 1961; Gicot 1956; KVR 1963, 1968; Link 1970; Meyer 1960; Morf 1962; Salanfe 1951; Schnitter 1961, 1971; Stucky 1962; Töndury 1956, 1964; Walther & Fetz 1963, 1971; Weber et al. 1965, 1970; Zingg 1961).

Appendix
Life Cycle Inventories of Hydroelectric Power Generation - 49 - ESU-services Ltd.
Name of dam Name of s tation Name of group
Length of
damm
Catchment
area
Length of
reservoir Surface area
Volume of
reservoir Height of dam
Net drop
height
Insta l led
capaci ty
Net
production
Cement for
injection etc.
m km2 km ha mio m3 m m MW GWh 1000 kg
Albigna Bondo Bergel l 759 20.5 2 126 71 115 271 6.7 19.06 3700
Bergel l 711
Bergel l
Bergel l 345
Bergel l 662
Bergel l 543
Bergel l
Bergel l
Gebidem Bitsch (Biel Bi tsch 327 150.3 1.4 21 9.2 122 683 340 556 2724
Malvagl ia Biasca Blenio 292 61.3 1.1 19 4.6 92 644 324 688 210
Carass ina Luzzone Blenio 115 16.5 0.6 3 0.31 39 141 20 26.8
Luzzone Ol ivone Blenio 600 36.74 3.1 144 108 225 479 102 210.1
Mol ina Sassel lo Calancasca 93 135 0.5 7 0.81 54 389 20.8 89.4
Les Toules Orières Drance d'E. 460 37.6 2 61 20.15 86 364 1850
Pal lazui t Drance d'E. 432 33.4 107
Ts i Drance d'E.
Vieux Emosson Châtelard-Barberine I+II Emosson 125 0.2 2.2 0.25 33 112 148
Emosson Châtelard-Val lorcine Emosson 555 34.91 4 327 227 180 260.5 410 11465
La Bâtiaz Emosson 170 415
usw. Emosson
Punt da l Gal l Ova spin Engadin 540 295 9 471 164.6 130 120 54 87.4 8600
Ova Spin-Dotierzentra le Engadin 40 0.47 1.57
Ova Spin Pradel la Engadin 130 385 4 36 7.4 73 463 300 1020 725
Punt da l Gal l Engadin 59 2.8 5.45
Vasasca Guimagl io Guimagl io 107 14 0.4 1.5 0.4 69 340 8.94 25.3 1050
Göschenenreuss Paffensprung Göschenen 70 49.8 0.2 0.1 36 58 290
usw. Göschenen 164.8 431.8
Chippis (Navisence) Gougra 569 99.84 553
Moiry Mottec Gougra 610 29 2.4 140 78 148 607 4854
Turtmann Mottec Gougra 110 28.1 0.2 10 0.8 32 71 135
Vissoie Gougra 426 50 210
Vissoie Gougra 426 0.68 0
Cleuson Chandol ine Grande Dixence 420 16 1.4 50 20 87
Grande Dixence Chandol ine Grande Dixence 695 43.6 5.3 430 401 285 150 115
Fionnay Grande Dixence 306 370
Mauvois in Fionnay Grande Dixence 520 113.5 4.9 208 211.5 250 140 275.8 9600
Bieudron Grande Dixence 1285 1235
Nendaz Grande Dixence 392 455
Chanrion Grande Dixence 30 72
Riddes Grande Dixence 258 667.8
Z'Mutt Z'Mutt Grande Dixence 144 56.4 0.6 4 0.85 74
Cleuson Grande Dixence
Stafel Grande Dixence
Ferpercle Grande Dixence
Arol la Grande Dixence
Roggiasca Grono Grono 177 11.7 0.3 3 0.52 68 602 37.5 93.96
Rossens Hauterive Hauterive 320 954 13.5 960 220 83 83 60 205
Sufers Bärenburg Hinterrhein 125 194 2.2 94 17.5 58 306 220 491 948
Bärenburg Hinterrhein 40 0.76 2.8
Val le di Lei Ferrera I Hinterrhein 690 46.5 7.7 410 197 141 460 180 308 3930
Ferrera II Hinterrhein 45 4.4 2.5
Bärenburg Si l s (KHR) Hinterrhein 110 460 0.8 7.5 1 64 383 247 646 368
Hongrin Veytaux Hongrin 325 45.6 2.7 160 53.2 125 823 240 186
Châtelot Le Châtelot Le Châtelot 150 911 3.3 69 20.6 74 75 32.6 106.35
Les Clées Les Clées Les Clées 100 288 1.4 8 0.74 32 141 30 103
Chamarin Lienne 320 1.9 0.6
Zeuzier Croix Lienne 256 18.7 1.3 85 51 156 766 66 147 1860
St. Léonard Lienne 393 36 93
Linthal (Limmern) Linth-Limmern 125 34.4 81.1
Tierfehd (Hintersand) Linth-Limmern 470 42 83
Limmern Tierfehd (Limmern) Linth-Limmern 375 17.8 3 136 93 146 963 261 283.7 16000
Lucendro Airolo Lucendro 269 7.05 1.4 54 25 73 938 60 102.3 242
Sel la Airolo Lucendro 334 6.7 1.4 45 9.2 36 1.93 2.9 309
Tremola/Sel la Lucendro
Gries Alts tafel Maggia 400 10.6 0.9 55.5 18.6 60 371 9.67 21.6
Robiei Bavona Maggia 360 1.52 0.5 24 6.7 68 854 140 324.3
Zöt Bavona Maggia 145 9.5 0.5 13 1.65 36
Cavergno Maggia 482 114 397.7
Sambuco Peccia (Sambuco) Maggia 363 29.75 3 111 63 130 359 54 85.4
Cavagnol i Robiei Maggia 320 5.05 0.9 46 29 111 352 173 37.4
Naret I+II Robiei Maggia 700 4.05 1.1 73 31.6 125
Palagnedra Verbano I Maggia 207 137.7 2.2 25 4.26 72 253 119 346.3
Verbano II Maggia 272 62 160.4
Soazza Mesolcina 698 83 245.1
Isola Spina (Isola) Mesolcina 290 43 2 39 6.5 45 392 20.9 62.8 145
Carmena Morobbia Morobbia 100 23 0.4 2.4 0.3 40 351 15.5 42.4
Oberaar Grimsel I (Oberarr) Oberhas l i 526 19.4 2.8 146 61 100 35.3 48.2
Räterichsboden Handeck II Oberhas l i 456 130.2 1.7 67 27 94 136 370
Handeck II I Oberhas l i 55 55.4
Handeck I Oberhas l i 100 51
Innerkirchen I Oberhas l i 239.5 784.1
Hopflauenen Oberhas l i 91.4 276.1
usw. Oberhas l i
Clusanfe Salanfe
Giétroz du Fond Salanfe
Salanfe Miévi l le Sa lanfe 616 18.4 2 185 40 52 1332 60 110.4
Sanetsch Innergsteig Sanetsch 215 10.7 0.9 29 2.8 42 825 19.6 38.1
Schi ffenen Schi ffenen Schi ffenen 417 1400 12.7 425 65 47 43 71 139
Contra Gordola Verzasca 380 233 5.5 168 105 220 227 132.5 215
Tenero Verzasca 247 4.25 12
Curnera Sedrun Vorderrhein 350 24.1 2 81 41.1 153 150 261.4 1092
Nalps Sedrun Vorderrhein 480 22.3 2 91 45 127 0.75 2.9 707
Sta. Maria Sedrun Vorderrhein 560 27.1 3 177 67.3 117 539 547
Runcahez Tavanasa Vorderrhein 182 54.8 0.5 5 0.48 33 453 180 563.4
Rothenbrunnen Zervrei la 631 44 204.57
Safien Platz Zervrei la 399 90 162.3
Zervrei la Zervrei la Zervrei la 504 63.9 4 161 100.5 151 79 22 25.7 3799
Egschi Realta Zervrei la 80 107.7 0.6 7 0.4 40 510 26 38.8
Tota l 17554 6860.07 131.5 6023.1 2731.92 5049 25316 8565 16639 74725

Appendix
Life Cycle Inventories of Hydroelectric Power Generation - 50 - ESU-services Ltd.
Name of dam Name of s tation Name of group Volume dam
Injection/
volume dam
Cement in
concrete min
Cement in
concrete max
Cement in
concrete avg
Cement for
dam
Zement dam +
injection
Cement f. dam
+ inj. of group
Cement tot.
incl . tunnels
Cement
dam/tota l
Remeining
cement
1000m3 kg/m3 kg/m3 kg/m3 kg/m3 Mio kg Mio kg Mio kg Mio. kg Mio kg
Albigna Bondo Bergel l 926 3.996 140 250 172 159.272 162.972 162.972 220 74% 57.028
Bergel l
Bergel l
Bergel l
Bergel l
Bergel l
Bergel l
Bergel l
Gebidem Bitsch (Biel Bi tsch 228 11.947 200 250 233 53.124 55.848 55.848 79 71% 23.152
Malvagl ia Biasca Blenio 162 1.296 200 250 233 37.746 37.956 349.846 440 80% 90.154
Carass ina Luzzone Blenio 9 2 2
Luzzone Ol ivone Blenio 1330 200 250 233 309.89 309.89
Mol ina Sassel lo Calancasca 14 3 3 3 5 60% 2
Les Toules Orières Drance d'E. 235 7.872 250 300 250 58.75 60.6 60.6 85 71% 24.4
Pal lazui t Drance d'E.
Ts i Drance d'E.
Vieux Emosson Châtelard-Barberine I+II Emosson
Emosson Châtelard-Val lorcine Emosson 1090 10.518 160 250 198 215.82 227.285
La Bâtiaz Emosson
usw. Emosson
Punt da l Gal l Ova spin Engadin 776 11.082 180 250 227 176.152 184.752 192.227 320 60% 127.773
Ova Spin-Dotierzentra le Engadin
Ova Spin Pradel la Engadin 27 26.852 250 250 250 6.75 7.475
Punt da l Gal l Engadin
Vasasca Guimagl io Guimagl io 21 50.000 250 250 257 5.397 6.447 6.447 9 72% 2.553
Göschenenreuss Paffensprung Göschenen 11 3 3 3 4 75% 1
usw. Göschenen
Chippis (Navisence) Gougra 180.961 255 71% 74.039
Moiry Mottec Gougra 815 5.956 160 260 215 175.225 180.079
Turtmann Mottec Gougra 3 250 300 294 0.882 0.882
Vissoie Gougra
Vissoie Gougra
Cleuson Chandol ine Grande Dixence 400 92 92 1596.81 2251 71% 654.19
Grande Dixence Chandol ine Grande Dixence 6000 140 250 178 1068 1068
Fionnay Grande Dixence
Mauvois in Fionnay Grande Dixence 2030 4.729 175 250 207 420.21 429.81
Bieudron Grande Dixence
Nendaz Grande Dixence
Chanrion Grande Dixence
Riddes Grande Dixence
Z'Mutt Z'Mutt Grande Dixence 32 7 7
Cleuson Grande Dixence
Stafel Grande Dixence
Ferpercle Grande Dixence
Arol la Grande Dixence
Roggiasca Grono Grono 32 7 7 7 10 70% 3
Rossens Hauterive Hauterive 255 250 250 250 63.75 63.75 63.75 90 71% 26.25
Sufers Bärenburg Hinterrhein 22 43.091 250 250 250 5.5 6.448 234.631 359 65% 124.369
Bärenburg Hinterrhein
Val le di Lei Ferrera I Hinterrhein 862 4.559 230 275 250 212.5 216.43
Ferrera II Hinterrhein
Bärenburg Si l s (KHR) Hinterrhein 55 6.691 170 280 207 11.385 11.753
Hongrin Veytaux Hongrin 235 250 250 250 58.75 58.75 58.75 83 71% 24.25
Châtelot Le Châtelot Le Châtelot 48 270 300 280 13.44 13.44 13.44 19 71% 5.56
Les Clées Les Clées Les Clées 21 5 5 5 7 71% 2
Chamarin Lienne 68.76 97 71% 28.24
Zeuzier Croix Lienne 300 6.200 170 250 223 66.9 68.76
St. Léonard Lienne
Linthal (Limmern) Linth-Limmern 144.849 240 60% 95.151
Tierfehd (Hintersand) Linth-Limmern
Limmern Tierfehd (Limmern) Linth-Limmern 553 28.933 200 250 233 128.849 144.849
Lucendro Airolo Lucendro 154 1.571 230 270 258 39.732 39.974 57.007 63 90% 5.993
Sel la Airolo Lucendro 74 4.176 226 16.724 17.033
Tremola/Sel la Lucendro
Gries Alts tafel Maggia 251 200 280 220 55.22 55.22 428.861 1203 36% 774.139
Robiei Bavona Maggia 180 41 41
Zöt Bavona Maggia 16 4 4
Cavergno Maggia
Sambuco Peccia (Sambuco) Maggia 775 170 260 230 178.25 178.25
Cavagnol i Robiei Maggia 223 200 250 217 48.391 48.391
Naret I+II Robiei Maggia 372 85 85
Palagnedra Verbano I Maggia 73 17 17
Verbano II Maggia
Soazza Mesolcina 17.395 25 70% 7.605
Isola Spina (Isola) Mesolcina 75 1.933 190 250 230 17.25 17.395
Carmena Morobbia Morobbia 9 2 2 2 3 67% 1
Oberaar Grimsel I (Oberarr) Oberhas l i 453 160 280 200 90.6 90.6 150.027 212 71% 61.973
Räterichsboden Handeck II Oberhas l i 279 180 280 213 59.427 59.427
Handeck II I Oberhas l i
Handeck I Oberhas l i
Innerkirchen I Oberhas l i
Hopflauenen Oberhas l i
usw. Oberhas l i
Clusanfe Salanfe 42.09 59 71% 16.91
Giétroz du Fond Salanfe
Salanfe Miévi l le Sa lanfe 230 150 250 183 42.09 42.09
Sanetsch Innergsteig Sanetsch 37 9 9 9 12 75% 3
Schi ffenen Schi ffenen Schi ffenen 185 250 250 250 46.25 46.25 46.25 65 71% 18.75
Contra Gordola Verzasca 660 200 250 233 153.78 153.78 153.78 217 71% 63.22
Tenero Verzasca
Curnera Sedrun Vorderrhein 562 1.943 200 250 233 130.946 132.038 434.398 600 72% 165.602
Nalps Sedrun Vorderrhein 594 1.190 180 250 227 134.838 135.545
Sta. Maria Sedrun Vorderrhein 654 0.836 200 270 242 158.268 158.815
Runcahez Tavanasa Vorderrhein 33 8 8
Rothenbrunnen Zervrei la 147.893 230 64% 82.107
Safien Platz Zervrei la
Zervrei la Zervrei la Zervrei la 626 6.069 200 280 219 137.094 140.893
Egschi Realta Zervrei la 30 7 7
Summe 23037 241.4421429 7055 9135 8271 4849.152 4923.877 4696.592 7262 2565.408

Appendix
Life Cycle Inventories of Hydroelectric Power Generation - 51 - ESU-services Ltd.
Name of dam Name of s tation Name of group
Steel for
tunnels
Steel for
machines
Reinforcing
s teel Steel tota l
Turbined
water
Construction
energy
kg kg kg kg Mio. m3/a GWh
Albigna Bondo Bergel l 31
Bergel l 170
Bergel l
Bergel l 27
Bergel l 88
Bergel l 26
Bergel l
Bergel l
Gebidem Bitsch (Biel Bi tsch 334
Malvagl ia Biasca Blenio 481 100
Carass ina Luzzone Blenio 120
Luzzone Ol ivone Blenio 212
Mol ina Sassel lo Calancasca 102
Les Toules Orières Drance d'E. 168
Pal lazui t Drance d'E. 87
Ts i Drance d'E.
Vieux Emosson Châtelard-Barberine I+II Emosson
Emosson Châtelard-Val lorcine Emosson
La Bâtiaz Emosson
usw. Emosson
Punt da l Gal l Ova spin Engadin 5710000 5710000 320
Ova Spin-Dotierzentra le Engadin 17
Ova Spin Pradel la Engadin 985
Punt da l Gal l Engadin 43
Vasasca Guimagl io Guimagl io 43
Göschenenreuss Paffensprung Göschenen
usw. Göschenen
Chippis (Navisence) Gougra 134
Moiry Mottec Gougra 103
Turtmann Mottec Gougra
Vissoie Gougra 208
Vissoie Gougra 4
Cleuson Chandol ine Grande Dixence
Grande Dixence Chandol ine Grande Dixence
Fionnay Grande Dixence
Mauvois in Fionnay Grande Dixence
Bieudron Grande Dixence
Nendaz Grande Dixence
Chanrion Grande Dixence
Riddes Grande Dixence
Z'Mutt Z'Mutt Grande Dixence
Cleuson Grande Dixence
Stafel Grande Dixence
Ferpercle Grande Dixence
Arol la Grande Dixence
Roggiasca Grono Grono 74
Rossens Hauterive Hauterive 1140
Sufers Bärenburg Hinterrhein 2670000 2670000 754
Bärenburg Hinterrhein 31
Val le di Lei Ferrera I Hinterrhein 317
Ferrera II Hinterrhein 31
Bärenburg Si l s (KHR) Hinterrhein 772
Hongrin Veytaux Hongrin 113
Châtelot Le Châtelot Le Châtelot 612
Les Clées Les Clées Les Clées 325
Chamarin Lienne 1
Zeuzier Croix Lienne 78
St. Léonard Lienne 97
Linthal (Limmern) Linth-Limmern 1660000 3102000 4100000 8862000 220 88
Tierfehd (Hintersand) Linth-Limmern 71
Limmern Tierfehd (Limmern) Linth-Limmern 122
Lucendro Airolo Lucendro 48
Sel la Airolo Lucendro
Tremola/Sel la Lucendro
Gries Alts tafel Maggia 21
Robiei Bavona Maggia 148
Zöt Bavona Maggia
Cavergno Maggia 378
Sambuco Peccia (Sambuco) Maggia 110
Cavagnol i Robiei Maggia 61
Naret I+II Robiei Maggia
Palagnedra Verbano I Maggia 845
Verbano II Maggia 196
Soazza Mesolcina 163
Isola Spina (Isola) Mesolcina 70
Carmena Morobbia Morobbia 57
Oberaar Grimsel I (Oberarr) Oberhas l i
Räterichsboden Handeck II Oberhas l i
Handeck II I Oberhas l i
Handeck I Oberhas l i
Innerkirchen I Oberhas l i
Hopflauenen Oberhas l i
usw. Oberhas l i
Clusanfe Salanfe 3000000 3000000
Giétroz du Fond Salanfe
Salanfe Miévi l le Sa lanfe 44
Sanetsch Innergsteig Sanetsch 22
Schi ffenen Schi ffenen Schi ffenen 1481
Contra Gordola Verzasca 434
Tenero Verzasca 22
Curnera Sedrun Vorderrhein 30000000 3100000 7000000 40100000
Nalps Sedrun Vorderrhein
Sta. Maria Sedrun Vorderrhein 215
Runcahez Tavanasa Vorderrhein 538
Rothenbrunnen Zervrei la 241
Safien Platz Zervrei la 178
Zervrei la Zervrei la Zervrei la 138
Egschi Realta Zervrei la 36
Summe 43040000 6202000 11100000 60342000 13907 188