“lies, damned lies and ...” a guide to dodgy data neil sheldon royal statistical society
DESCRIPTION
“Lies, damned lies and ...” a guide to dodgy data Neil Sheldon Royal Statistical Society Centre for Statistical Education Manchester Grammar School. - PowerPoint PPT PresentationTRANSCRIPT

“Lies, damned lies and ...”a guide to dodgy data
Neil Sheldon Royal Statistical Society
Centre for Statistical Education
Manchester Grammar School
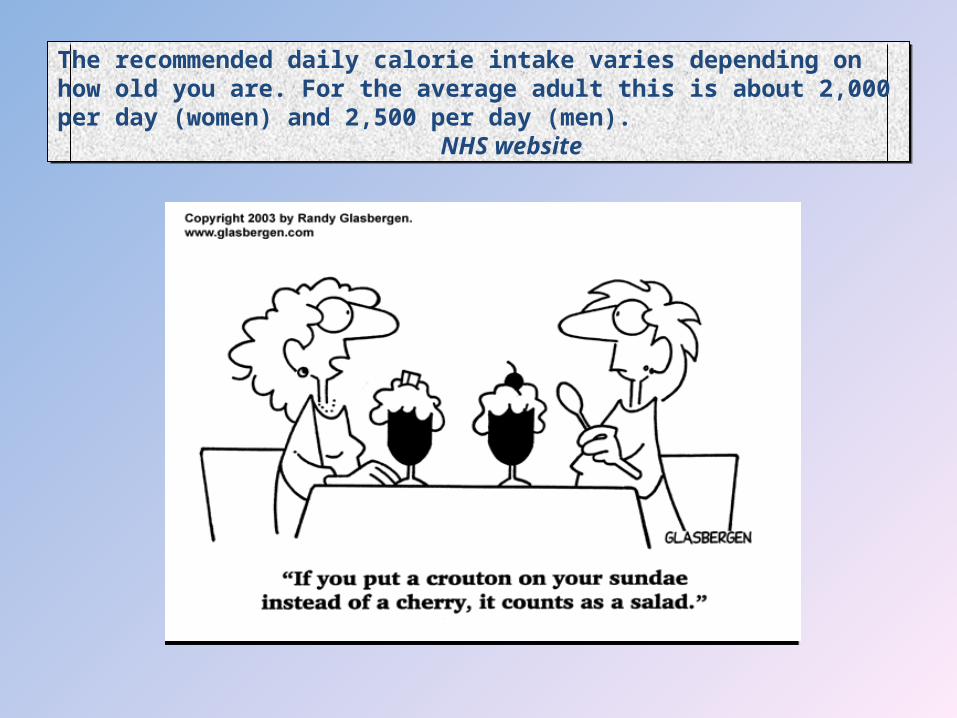
The recommended daily calorie intake varies depending on how old you are. For the average adult this is about 2,000 per day (women) and 2,500 per day (men). NHS website
The recommended daily calorie intake varies depending on how old you are. For the average adult this is about 2,000 per day (women) and 2,500 per day (men). NHS website
The recommended daily calorie intake varies depending on how old you are. For the average adult this is about 2,000 per day (women) and 2,500 per day (men). NHS website
The recommended daily calorie intake varies depending on how old you are. For the average adult this is about 2,000 per day (women) and 2,500 per day (men). NHS website
We are told that recommended daily intake varies with age – but we are not told how it varies so that information is of no use.
The recommended daily calorie intake varies depending on how old you are. For the average adult this is about 2,000 per day (women) and 2,500 per day (men). NHS website
The recommended daily calorie intake varies depending on how old you are. For the average adult this is about 2,000 per day (women) and 2,500 per day (men). NHS website
We are told that recommended daily intake varies with age – but we are not told how it varies so that information is of no use.
Neither are we told how much recommended calorie intake varies with factors such as height, body weight, metabolic rate, lifestyle, or levels of physical activity – all of which will affect energy needs and so the number of calories required.
The recommended daily calorie intake varies depending on how old you are. For the average adult this is about 2,000 per day (women) and 2,500 per day (men). NHS website
The recommended daily calorie intake varies depending on how old you are. For the average adult this is about 2,000 per day (women) and 2,500 per day (men). NHS website
We are told that recommended daily intake varies with age – but we are not told how it varies so that information is of no use.
Neither are we told how much recommended calorie intake varies with factors such as height, body weight, metabolic rate, lifestyle, or levels of physical activity – all of which will affect energy needs and so the number of calories required.
A better way to present the figures would be as a range. For example, "many women need between 1850 and 2150 calories per day, though for some the figure may be as low as 1550 or as high as 2450".
The recommended daily calorie intake varies depending on how old you are. For the average adult this is about 2,000 per day (women) and 2,500 per day (men). NHS website
The recommended daily calorie intake varies depending on how old you are. For the average adult this is about 2,000 per day (women) and 2,500 per day (men). NHS website
We are told that recommended daily intake varies with age – but we are not told how it varies so that information is of no use.
Neither are we told how much recommended calorie intake varies with factors such as height, body weight, metabolic rate, lifestyle, or levels of physical activity – all of which will affect energy needs and so the number of calories required.
A better way to present the figures would be as a range. For example, "many women need between 1850 and 2150 calories per day, though for some the figure may be as low as 1550 or as high as 2450".
Statistics are often presented in the form of averages, but it is important to think about the variation from the average too

Rubbish dump UK: we drop 30 million tonnes of litter a year in public. Reclaim Our Streets website
On average, each person in the UK throws away about 500 kg in rubbish every year. Wasteonline website
Rubbish dump UK: we drop 30 million tonnes of litter a year in public. Reclaim Our Streets website
On average, each person in the UK throws away about 500 kg in rubbish every year. Wasteonline website

Rubbish dump UK: we drop 30 million tonnes of litter a year in public. Reclaim Our Streets website
On average, each person in the UK throws away about 500 kg in rubbish every year. Wasteonline website
Rubbish dump UK: we drop 30 million tonnes of litter a year in public. Reclaim Our Streets website
On average, each person in the UK throws away about 500 kg in rubbish every year. Wasteonline website
In a population of about 60 million people, 30 million tonnes is about 500 kg per person.

Rubbish dump UK: we drop 30 million tonnes of litter a year in public. Reclaim Our Streets website
On average, each person in the UK throws away about 500 kg in rubbish every year. Wasteonline website
Rubbish dump UK: we drop 30 million tonnes of litter a year in public. Reclaim Our Streets website
On average, each person in the UK throws away about 500 kg in rubbish every year. Wasteonline website
In a population of about 60 million people, 30 million tonnes is about 500 kg per person.
But one of these claims is about litter and the other is about rubbish – so they can’t both be correct.

Rubbish dump UK: we drop 30 million tonnes of litter a year in public. Reclaim Our Streets website
On average, each person in the UK throws away about 500 kg in rubbish every year. Wasteonline website
Rubbish dump UK: we drop 30 million tonnes of litter a year in public. Reclaim Our Streets website
On average, each person in the UK throws away about 500 kg in rubbish every year. Wasteonline website
In a population of about 60 million people, 30 million tonnes is about 500 kg per person.
But one of these claims is about litter and the other is about rubbish – so they can’t both be correct.
500 kg per year is more than a kilogram per day. Do you drop that much litter? Do you know anyone who does?

Rubbish dump UK: we drop 30 million tonnes of litter a year in public. Reclaim Our Streets website
On average, each person in the UK throws away about 500 kg in rubbish every year. Wasteonline website
Rubbish dump UK: we drop 30 million tonnes of litter a year in public. Reclaim Our Streets website
On average, each person in the UK throws away about 500 kg in rubbish every year. Wasteonline website
In a population of about 60 million people, 30 million tonnes is about 500 kg per person.
But one of these claims is about litter and the other is about rubbish – so they can’t both be correct.
500 kg per year is more than a kilogram per day. Do you drop that much litter? Do you know anyone who does?
It seems likely that the figure quoted for litter is really the figure for rubbish.
Rubbish dump UK: we drop 30 million tonnes of litter a year in public. Reclaim Our Streets website
On average, each person in the UK throws away about 500 kg in rubbish every year. Wasteonline website
Rubbish dump UK: we drop 30 million tonnes of litter a year in public. Reclaim Our Streets website
On average, each person in the UK throws away about 500 kg in rubbish every year. Wasteonline website
In a population of about 60 million people, 30 million tonnes is about 500 kg per person.
But one of these claims is about litter and the other is about rubbish – so they can’t both be correct.
500 kg per year is more than a kilogram per day. Do you drop that much litter? Do you know anyone who does?
It seems likely that the figure quoted for litter is really the figure for rubbish.
It is important to say exactly what you mean in statistics
Often you can check a statistical claim against other things you know
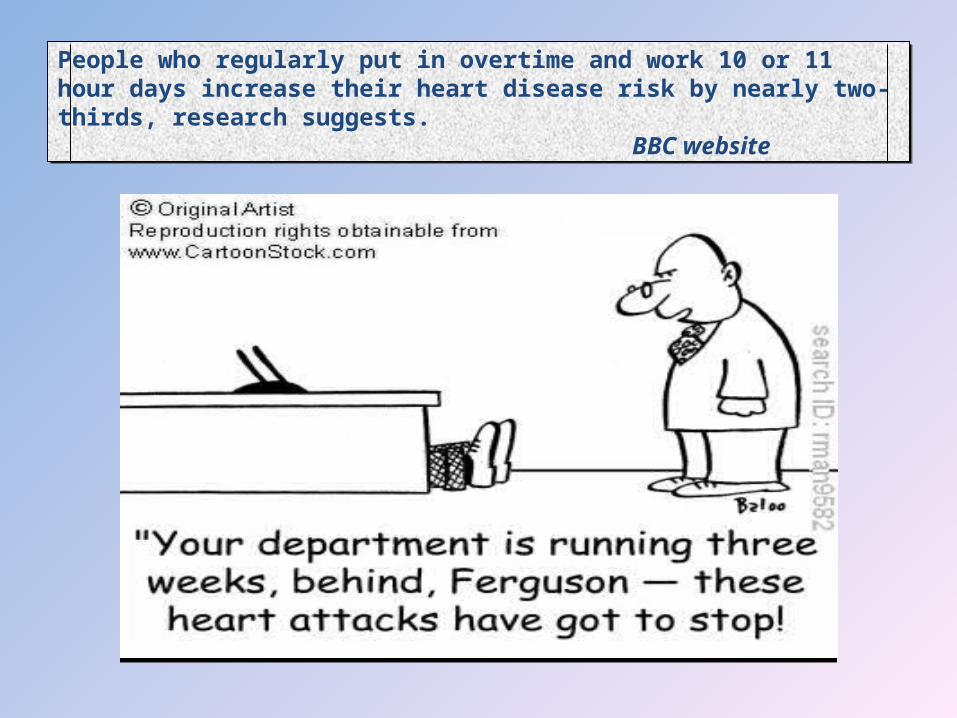
People who regularly put in overtime and work 10 or 11 hour days increase their heart disease risk by nearly two-thirds, research suggests.
BBC website
People who regularly put in overtime and work 10 or 11 hour days increase their heart disease risk by nearly two-thirds, research suggests.
BBC website
People who regularly put in overtime and work 10 or 11 hour days increase their heart disease risk by nearly two-thirds, research suggests.
BBC website
People who regularly put in overtime and work 10 or 11 hour days increase their heart disease risk by nearly two-thirds, research suggests.
BBC website
There is a link – a correlation – between overtime and heart disease, but does overtime cause the increased risk?

People who regularly put in overtime and work 10 or 11 hour days increase their heart disease risk by nearly two-thirds, research suggests.
BBC website
People who regularly put in overtime and work 10 or 11 hour days increase their heart disease risk by nearly two-thirds, research suggests.
BBC website
There is a link – a correlation – between overtime and heart disease, but does overtime cause the increased risk?
The story identifies possible causes: People who spend more time at work have less time to exercise, relax and unwind. They may also be more stressed, anxious, or have depression.
People who regularly put in overtime and work 10 or 11 hour days increase their heart disease risk by nearly two-thirds, research suggests.
BBC website
People who regularly put in overtime and work 10 or 11 hour days increase their heart disease risk by nearly two-thirds, research suggests.
BBC website
There is a link – a correlation – between overtime and heart disease, but does overtime cause the increased risk?
The story identifies possible causes: People who spend more time at work have less time to exercise, relax and unwind. They may also be more stressed, anxious, or have depression.
But it also sounds a note of caution, quoting the lead researcher as saying: more research is needed before we can be confident that overtime work would cause coronary heart disease.
People who regularly put in overtime and work 10 or 11 hour days increase their heart disease risk by nearly two-thirds, research suggests.
BBC website
People who regularly put in overtime and work 10 or 11 hour days increase their heart disease risk by nearly two-thirds, research suggests.
BBC website
There is a link – a correlation – between overtime and heart disease, but does overtime cause the increased risk?
The story identifies possible causes: People who spend more time at work have less time to exercise, relax and unwind. They may also be more stressed, anxious, or have depression.
But it also sounds a note of caution, quoting the lead researcher as saying: more research is needed before we can be confident that overtime work would cause coronary heart disease.
A correlation between two things does not always imply that one causes the other
Good statistics will always be cautious about drawing conclusions

Pay for those at the top is increasing 17 times faster than average pay.For every £100 earned by a top company director in 2000 they earn £205 in 2006, while ordinary employees have had a £6 increase in every £100 they earned six years ago after allowing for inflation. TUC 2007
Pay for those at the top is increasing 17 times faster than average pay.For every £100 earned by a top company director in 2000 they earn £205 in 2006, while ordinary employees have had a £6 increase in every £100 they earned six years ago after allowing for inflation. TUC 2007

Pay for those at the top is increasing 17 times faster than average pay.For every £100 earned by a top company director in 2000 they earn £205 in 2006, while ordinary employees have had a £6 increase in every £100 they earned six years ago after allowing for inflation. TUC 2007
Pay for those at the top is increasing 17 times faster than average pay.For every £100 earned by a top company director in 2000 they earn £205 in 2006, while ordinary employees have had a £6 increase in every £100 they earned six years ago after allowing for inflation. TUC 2007
An increase from £100 to £205 is, indeed, about 17 times as big as an increase from £100 to £106.

Pay for those at the top is increasing 17 times faster than average pay.For every £100 earned by a top company director in 2000 they earn £205 in 2006, while ordinary employees have had a £6 increase in every £100 they earned six years ago after allowing for inflation. TUC 2007
Pay for those at the top is increasing 17 times faster than average pay.For every £100 earned by a top company director in 2000 they earn £205 in 2006, while ordinary employees have had a £6 increase in every £100 they earned six years ago after allowing for inflation. TUC 2007
An increase from £100 to £205 is, indeed, about 17 times as big as an increase from £100 to £106.
But we don’t normally measure pay increases ‘after allowing for inflation’.

Pay for those at the top is increasing 17 times faster than average pay.For every £100 earned by a top company director in 2000 they earn £205 in 2006, while ordinary employees have had a £6 increase in every £100 they earned six years ago after allowing for inflation. TUC 2007
Pay for those at the top is increasing 17 times faster than average pay.For every £100 earned by a top company director in 2000 they earn £205 in 2006, while ordinary employees have had a £6 increase in every £100 they earned six years ago after allowing for inflation. TUC 2007
An increase from £100 to £205 is, indeed, about 17 times as big as an increase from £100 to £106.
But we don’t normally measure pay increases ‘after allowing for inflation’.
And we normally compare annual pay increases, not pay increases across six years.

Pay for those at the top is increasing 17 times faster than average pay.For every £100 earned by a top company director in 2000 they earn £205 in 2006, while ordinary employees have had a £6 increase in every £100 they earned six years ago after allowing for inflation. TUC 2007
Pay for those at the top is increasing 17 times faster than average pay.For every £100 earned by a top company director in 2000 they earn £205 in 2006, while ordinary employees have had a £6 increase in every £100 they earned six years ago after allowing for inflation. TUC 2007
An increase from £100 to £205 is, indeed, about 17 times as big as an increase from £100 to £106.
But we don’t normally measure pay increases ‘after allowing for inflation’.
And we normally compare annual pay increases, not pay increases across six years.
So why have the TUC presented the statistics in this way?
Pay for those at the top is increasing 17 times faster than average pay.For every £100 earned by a top company director in 2000 they earn £205 in 2006, while ordinary employees have had a £6 increase in every £100 they earned six years ago after allowing for inflation. TUC 2007
Pay for those at the top is increasing 17 times faster than average pay.For every £100 earned by a top company director in 2000 they earn £205 in 2006, while ordinary employees have had a £6 increase in every £100 they earned six years ago after allowing for inflation. TUC 2007
An increase from £100 to £205 is, indeed, about 17 times as big as an increase from £100 to £106.
But we don’t normally measure pay increases ‘after allowing for inflation’.
And we normally compare annual pay increases, not pay increases across six years.
So why have the TUC presented the statistics in this way?
Doing the calculations the usual way, pay for those at the top is increasing about 4 times (not 17 times) faster than average pay.
Pay for those at the top is increasing 17 times faster than average pay.For every £100 earned by a top company director in 2000 they earn £205 in 2006, while ordinary employees have had a £6 increase in every £100 they earned six years ago after allowing for inflation. TUC 2007
Pay for those at the top is increasing 17 times faster than average pay.For every £100 earned by a top company director in 2000 they earn £205 in 2006, while ordinary employees have had a £6 increase in every £100 they earned six years ago after allowing for inflation. TUC 2007
An increase from £100 to £205 is, indeed, about 17 times as big as an increase from £100 to £106.
But we don’t normally measure pay increases ‘after allowing for inflation’.
And we normally compare annual pay increases, not pay increases across six years.
So why have the TUC presented the statistics in this way?
Doing the calculations the usual way, pay for those at the top is increasing about 4 times (not 17 times) faster than average pay.
If statistics have been calculated in a non-standard way, ask why
Good statistics are independent of vested interests
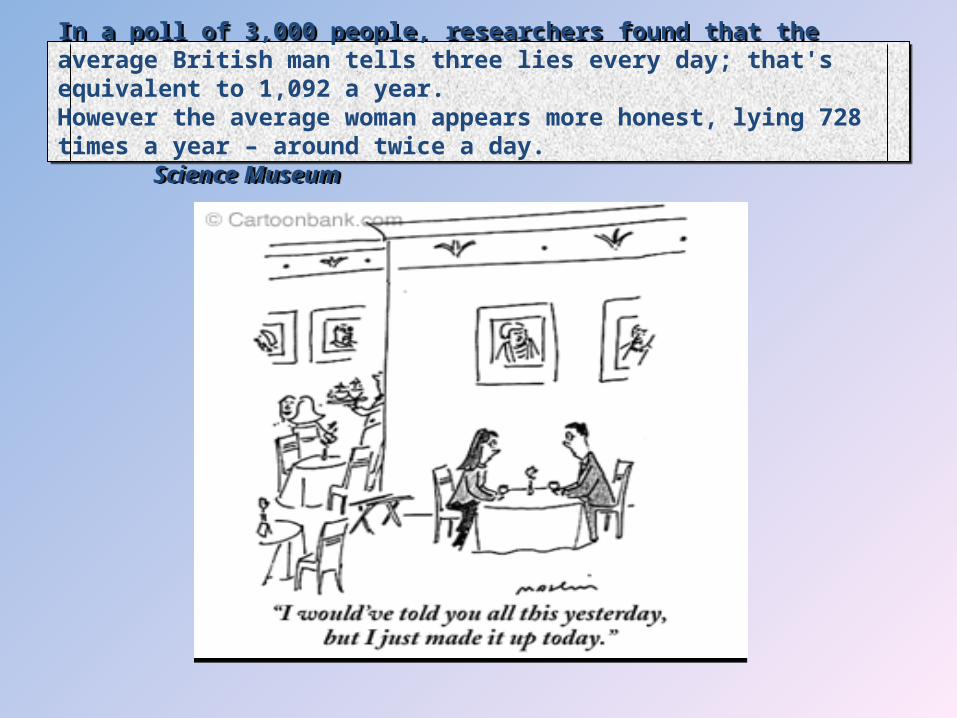
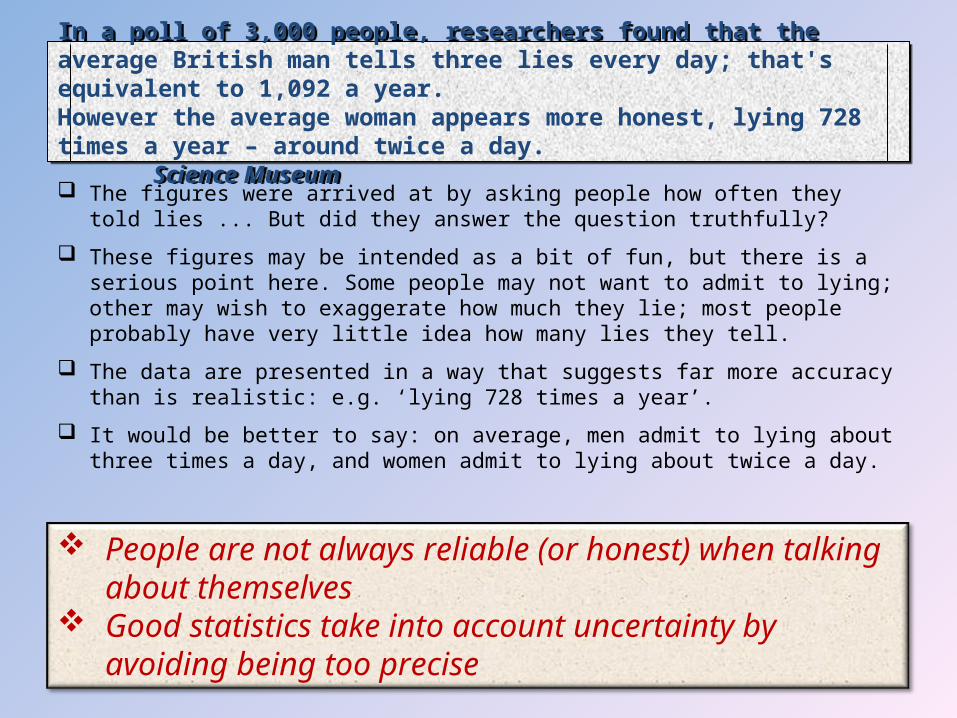
In a poll of 3,000 people, researchers found that the average British man tells three lies every day; that's equivalent to 1,092 a year. However the average woman appears more honest, lying 728 times a year – around twice a day. Science Museum
In a poll of 3,000 people, researchers found that the average British man tells three lies every day; that's equivalent to 1,092 a year. However the average woman appears more honest, lying 728 times a year – around twice a day. Science Museum

In a poll of 3,000 people, researchers found that the average British man tells three lies every day; that's equivalent to 1,092 a year. However the average woman appears more honest, lying 728 times a year – around twice a day. Science Museum
In a poll of 3,000 people, researchers found that the average British man tells three lies every day; that's equivalent to 1,092 a year. However the average woman appears more honest, lying 728 times a year – around twice a day. Science Museum
The figures were arrived at by asking people how often they told lies ... But did they answer the question truthfully?
In a poll of 3,000 people, researchers found that the average British man tells three lies every day; that's equivalent to 1,092 a year. However the average woman appears more honest, lying 728 times a year – around twice a day. Science Museum
In a poll of 3,000 people, researchers found that the average British man tells three lies every day; that's equivalent to 1,092 a year. However the average woman appears more honest, lying 728 times a year – around twice a day. Science Museum
The figures were arrived at by asking people how often they told lies ... But did they answer the question truthfully?
These figures may be intended as a bit of fun, but there is a serious point here. Some people may not want to admit to lying; other may wish to exaggerate how much they lie; most people probably have very little idea how many lies they tell.
In a poll of 3,000 people, researchers found that the average British man tells three lies every day; that's equivalent to 1,092 a year. However the average woman appears more honest, lying 728 times a year – around twice a day. Science Museum
In a poll of 3,000 people, researchers found that the average British man tells three lies every day; that's equivalent to 1,092 a year. However the average woman appears more honest, lying 728 times a year – around twice a day. Science Museum
The figures were arrived at by asking people how often they told lies ... But did they answer the question truthfully?
These figures may be intended as a bit of fun, but there is a serious point here. Some people may not want to admit to lying; other may wish to exaggerate how much they lie; most people probably have very little idea how many lies they tell.
The data are presented in a way that suggests far more accuracy than is realistic: e.g. ‘lying 728 times a year’.

In a poll of 3,000 people, researchers found that the average British man tells three lies every day; that's equivalent to 1,092 a year. However the average woman appears more honest, lying 728 times a year – around twice a day. Science Museum
In a poll of 3,000 people, researchers found that the average British man tells three lies every day; that's equivalent to 1,092 a year. However the average woman appears more honest, lying 728 times a year – around twice a day. Science Museum
The figures were arrived at by asking people how often they told lies ... But did they answer the question truthfully?
These figures may be intended as a bit of fun, but there is a serious point here. Some people may not want to admit to lying; other may wish to exaggerate how much they lie; most people probably have very little idea how many lies they tell.
The data are presented in a way that suggests far more accuracy than is realistic: e.g. ‘lying 728 times a year’.
It would be better to say: on average, men admit to lying about three times a day, and women admit to lying about twice a day.
In a poll of 3,000 people, researchers found that the average British man tells three lies every day; that's equivalent to 1,092 a year. However the average woman appears more honest, lying 728 times a year – around twice a day. Science Museum
In a poll of 3,000 people, researchers found that the average British man tells three lies every day; that's equivalent to 1,092 a year. However the average woman appears more honest, lying 728 times a year – around twice a day. Science Museum
The figures were arrived at by asking people how often they told lies ... But did they answer the question truthfully?
These figures may be intended as a bit of fun, but there is a serious point here. Some people may not want to admit to lying; other may wish to exaggerate how much they lie; most people probably have very little idea how many lies they tell.
The data are presented in a way that suggests far more accuracy than is realistic: e.g. ‘lying 728 times a year’.
It would be better to say: on average, men admit to lying about three times a day, and women admit to lying about twice a day.
People are not always reliable (or honest) when talking about themselves
Good statistics take into account uncertainty by avoiding being too precise

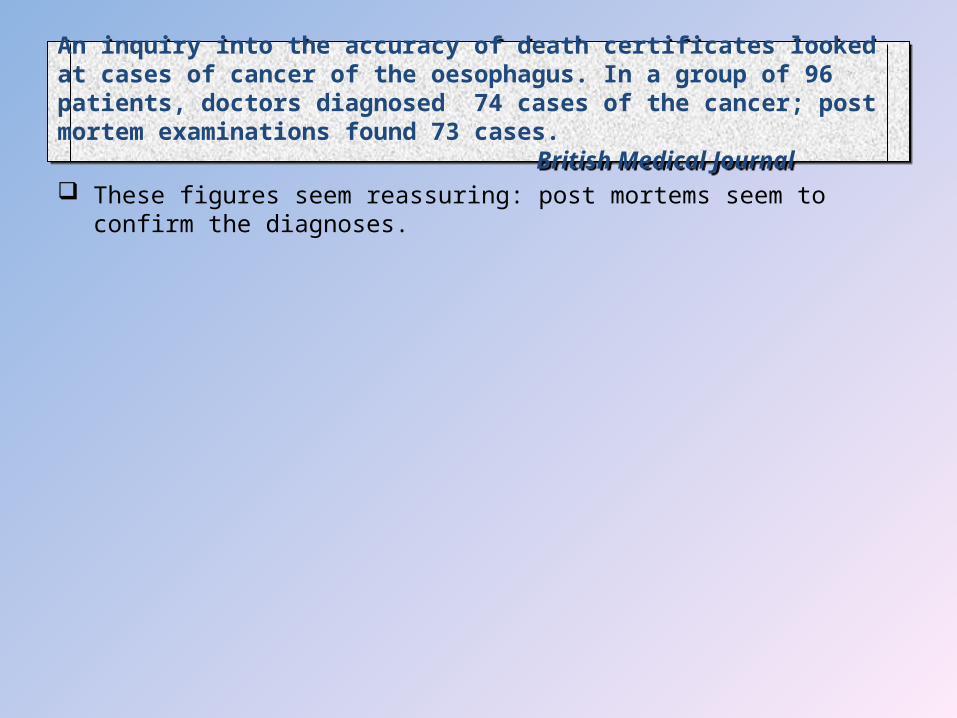
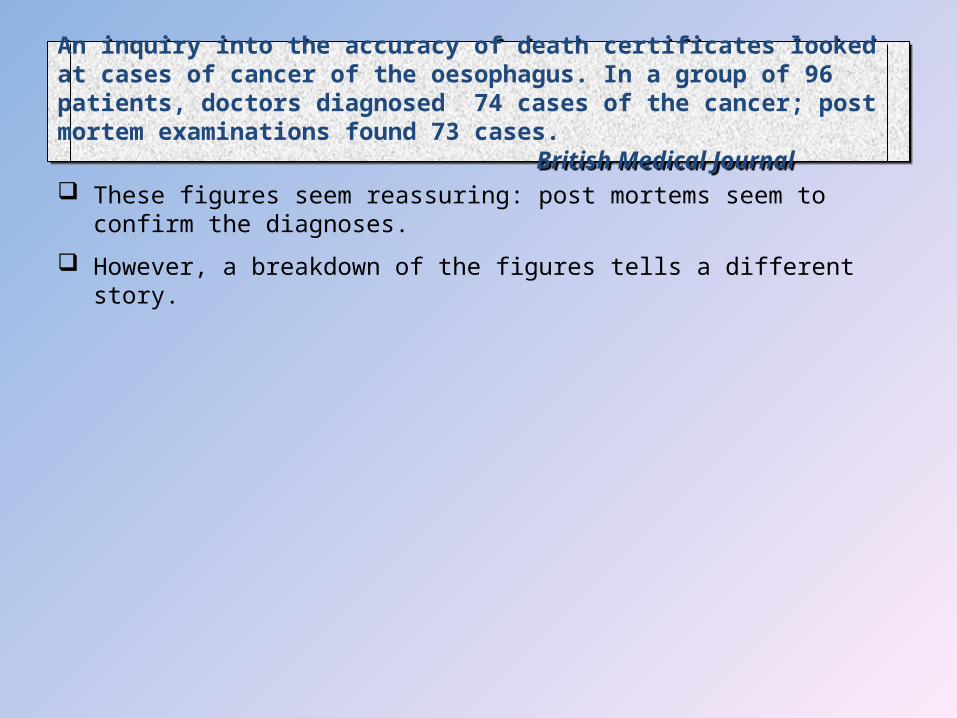
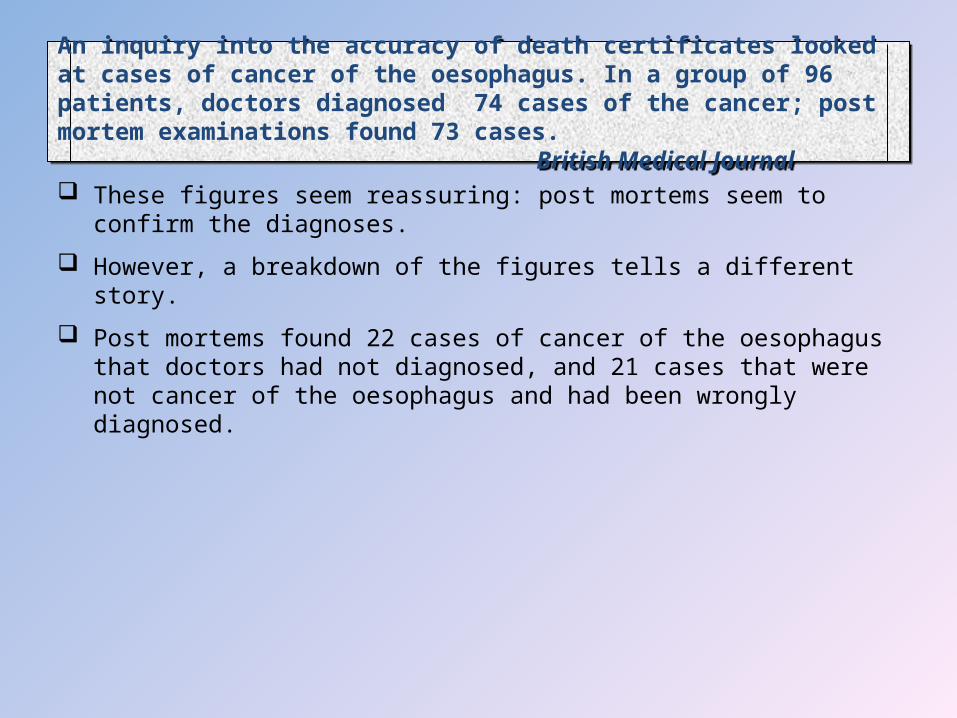
An inquiry into the accuracy of death certificates looked at cases of cancer of the oesophagus. In a group of 96 patients, doctors diagnosed 74 cases of the cancer; post mortem examinations found 73 cases.
British Medical Journal
An inquiry into the accuracy of death certificates looked at cases of cancer of the oesophagus. In a group of 96 patients, doctors diagnosed 74 cases of the cancer; post mortem examinations found 73 cases.
British Medical Journal
An inquiry into the accuracy of death certificates looked at cases of cancer of the oesophagus. In a group of 96 patients, doctors diagnosed 74 cases of the cancer; post mortem examinations found 73 cases.
British Medical Journal
An inquiry into the accuracy of death certificates looked at cases of cancer of the oesophagus. In a group of 96 patients, doctors diagnosed 74 cases of the cancer; post mortem examinations found 73 cases.
British Medical Journal
These figures seem reassuring: post mortems seem to confirm the diagnoses.
An inquiry into the accuracy of death certificates looked at cases of cancer of the oesophagus. In a group of 96 patients, doctors diagnosed 74 cases of the cancer; post mortem examinations found 73 cases.
British Medical Journal
An inquiry into the accuracy of death certificates looked at cases of cancer of the oesophagus. In a group of 96 patients, doctors diagnosed 74 cases of the cancer; post mortem examinations found 73 cases.
British Medical Journal
These figures seem reassuring: post mortems seem to confirm the diagnoses.
However, a breakdown of the figures tells a different story.
An inquiry into the accuracy of death certificates looked at cases of cancer of the oesophagus. In a group of 96 patients, doctors diagnosed 74 cases of the cancer; post mortem examinations found 73 cases.
British Medical Journal
An inquiry into the accuracy of death certificates looked at cases of cancer of the oesophagus. In a group of 96 patients, doctors diagnosed 74 cases of the cancer; post mortem examinations found 73 cases.
British Medical Journal
These figures seem reassuring: post mortems seem to confirm the diagnoses.
However, a breakdown of the figures tells a different story.
Post mortems found 22 cases of cancer of the oesophagus that doctors had not diagnosed, and 21 cases that were not cancer of the oesophagus and had been wrongly diagnosed.
An inquiry into the accuracy of death certificates looked at cases of cancer of the oesophagus. In a group of 96 patients, doctors diagnosed 74 cases of the cancer; post mortem examinations found 73 cases.
British Medical Journal
An inquiry into the accuracy of death certificates looked at cases of cancer of the oesophagus. In a group of 96 patients, doctors diagnosed 74 cases of the cancer; post mortem examinations found 73 cases.
British Medical Journal
These figures seem reassuring: post mortems seem to confirm the diagnoses.
However, a breakdown of the figures tells a different story.
Post mortems found 22 cases of cancer of the oesophagus that doctors had not diagnosed, and 21 cases that were not cancer of the oesophagus and had been wrongly diagnosed.
So the errors in diagnosis (called false negatives and false positives) almost exactly balanced out.

An inquiry into the accuracy of death certificates looked at cases of cancer of the oesophagus. In a group of 96 patients, doctors diagnosed 74 cases of the cancer; post mortem examinations found 73 cases.
British Medical Journal
An inquiry into the accuracy of death certificates looked at cases of cancer of the oesophagus. In a group of 96 patients, doctors diagnosed 74 cases of the cancer; post mortem examinations found 73 cases.
British Medical Journal
These figures seem reassuring: post mortems seem to confirm the diagnoses.
However, a breakdown of the figures tells a different story.
Post mortems found 22 cases of cancer of the oesophagus that doctors had not diagnosed, and 21 cases that were not cancer of the oesophagus and had been wrongly diagnosed.
So the errors in diagnosis (called false negatives and false positives) almost exactly balanced out.
Beware of ‘headline figures’ – often there is hidden information in the detail
What is true of the total is not always true of the parts
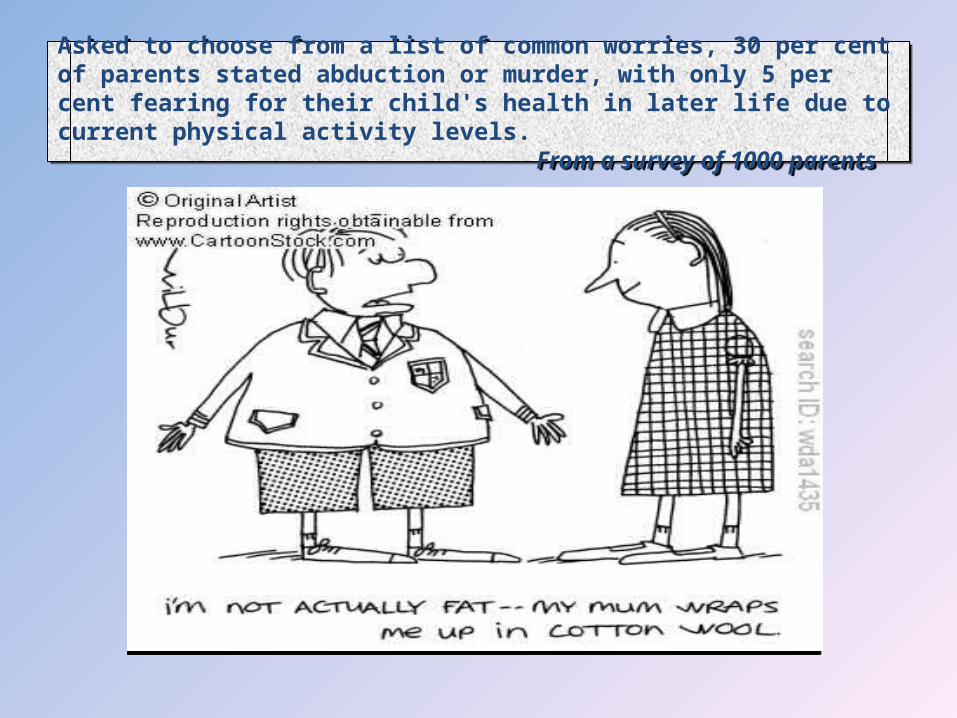
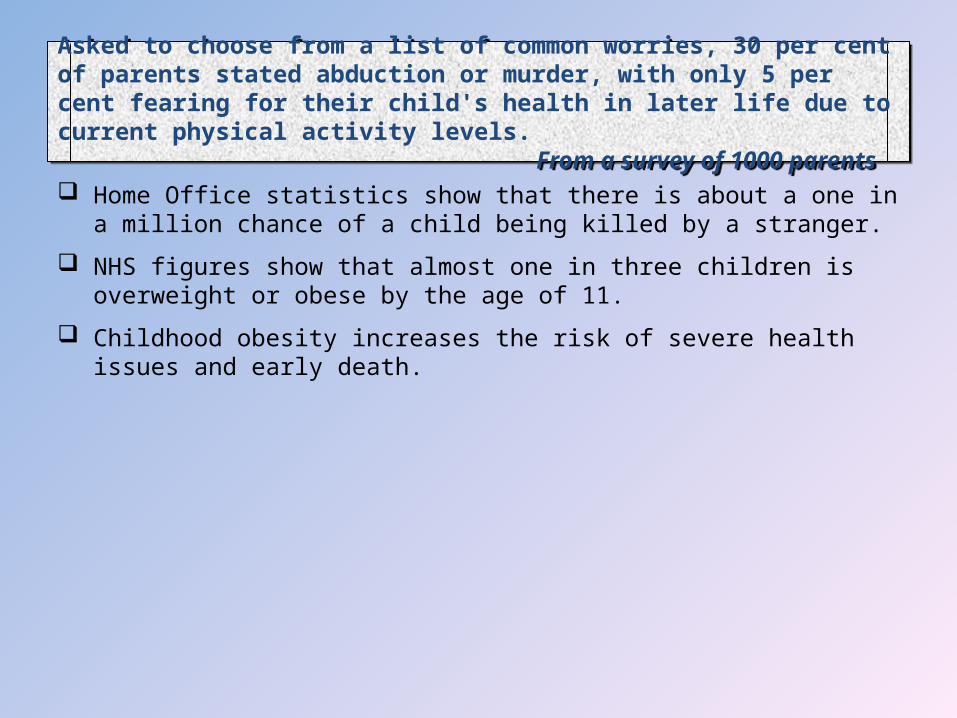
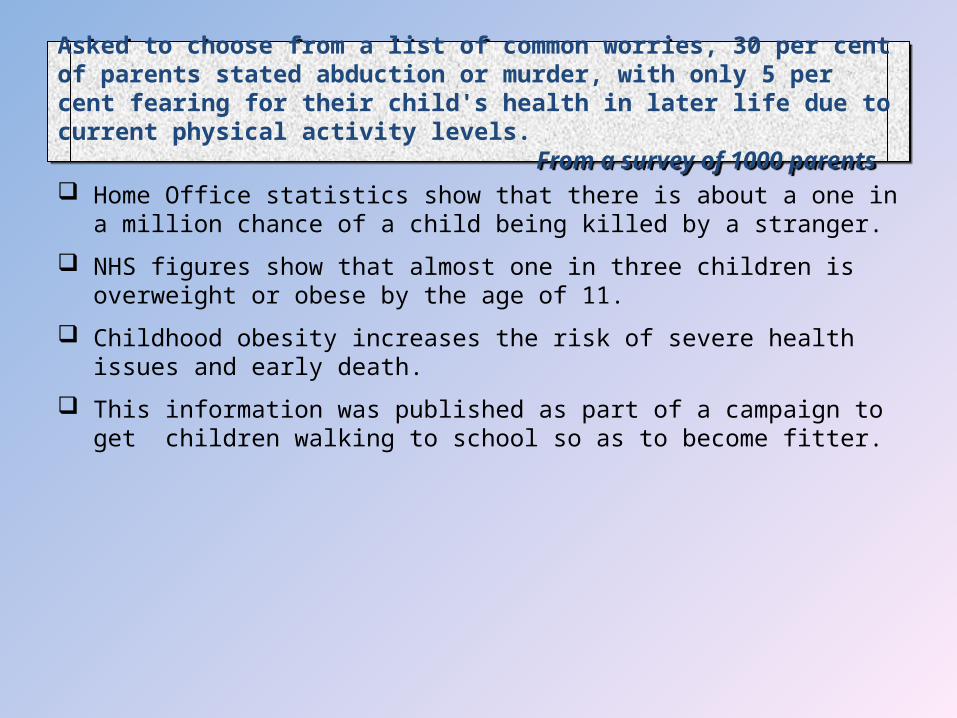
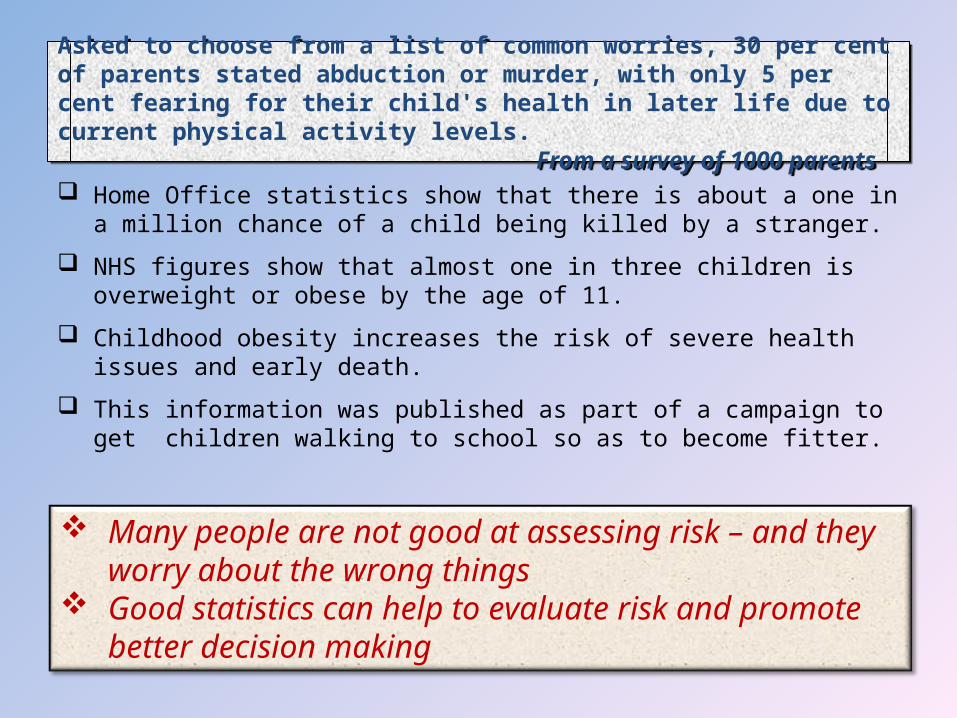
Asked to choose from a list of common worries, 30 per cent of parents stated abduction or murder, with only 5 per cent fearing for their child's health in later life due to current physical activity levels.
From a survey of 1000 parents
Asked to choose from a list of common worries, 30 per cent of parents stated abduction or murder, with only 5 per cent fearing for their child's health in later life due to current physical activity levels.
From a survey of 1000 parents
Asked to choose from a list of common worries, 30 per cent of parents stated abduction or murder, with only 5 per cent fearing for their child's health in later life due to current physical activity levels.
From a survey of 1000 parents
Asked to choose from a list of common worries, 30 per cent of parents stated abduction or murder, with only 5 per cent fearing for their child's health in later life due to current physical activity levels.
From a survey of 1000 parents
Home Office statistics show that there is about a one in a million chance of a child being killed by a stranger.
Asked to choose from a list of common worries, 30 per cent of parents stated abduction or murder, with only 5 per cent fearing for their child's health in later life due to current physical activity levels.
From a survey of 1000 parents
Asked to choose from a list of common worries, 30 per cent of parents stated abduction or murder, with only 5 per cent fearing for their child's health in later life due to current physical activity levels.
From a survey of 1000 parents
Home Office statistics show that there is about a one in a million chance of a child being killed by a stranger.
NHS figures show that almost one in three children is overweight or obese by the age of 11.
Asked to choose from a list of common worries, 30 per cent of parents stated abduction or murder, with only 5 per cent fearing for their child's health in later life due to current physical activity levels.
From a survey of 1000 parents
Asked to choose from a list of common worries, 30 per cent of parents stated abduction or murder, with only 5 per cent fearing for their child's health in later life due to current physical activity levels.
From a survey of 1000 parents
Home Office statistics show that there is about a one in a million chance of a child being killed by a stranger.
NHS figures show that almost one in three children is overweight or obese by the age of 11.
Childhood obesity increases the risk of severe health issues and early death.
Asked to choose from a list of common worries, 30 per cent of parents stated abduction or murder, with only 5 per cent fearing for their child's health in later life due to current physical activity levels.
From a survey of 1000 parents
Asked to choose from a list of common worries, 30 per cent of parents stated abduction or murder, with only 5 per cent fearing for their child's health in later life due to current physical activity levels.
From a survey of 1000 parents
Home Office statistics show that there is about a one in a million chance of a child being killed by a stranger.
NHS figures show that almost one in three children is overweight or obese by the age of 11.
Childhood obesity increases the risk of severe health issues and early death.
This information was published as part of a campaign to get children walking to school so as to become fitter.
Asked to choose from a list of common worries, 30 per cent of parents stated abduction or murder, with only 5 per cent fearing for their child's health in later life due to current physical activity levels.
From a survey of 1000 parents
Asked to choose from a list of common worries, 30 per cent of parents stated abduction or murder, with only 5 per cent fearing for their child's health in later life due to current physical activity levels.
From a survey of 1000 parents
Home Office statistics show that there is about a one in a million chance of a child being killed by a stranger.
NHS figures show that almost one in three children is overweight or obese by the age of 11.
Childhood obesity increases the risk of severe health issues and early death.
This information was published as part of a campaign to get children walking to school so as to become fitter.
Many people are not good at assessing risk – and they worry about the wrong things
Good statistics can help to evaluate risk and promote better decision making

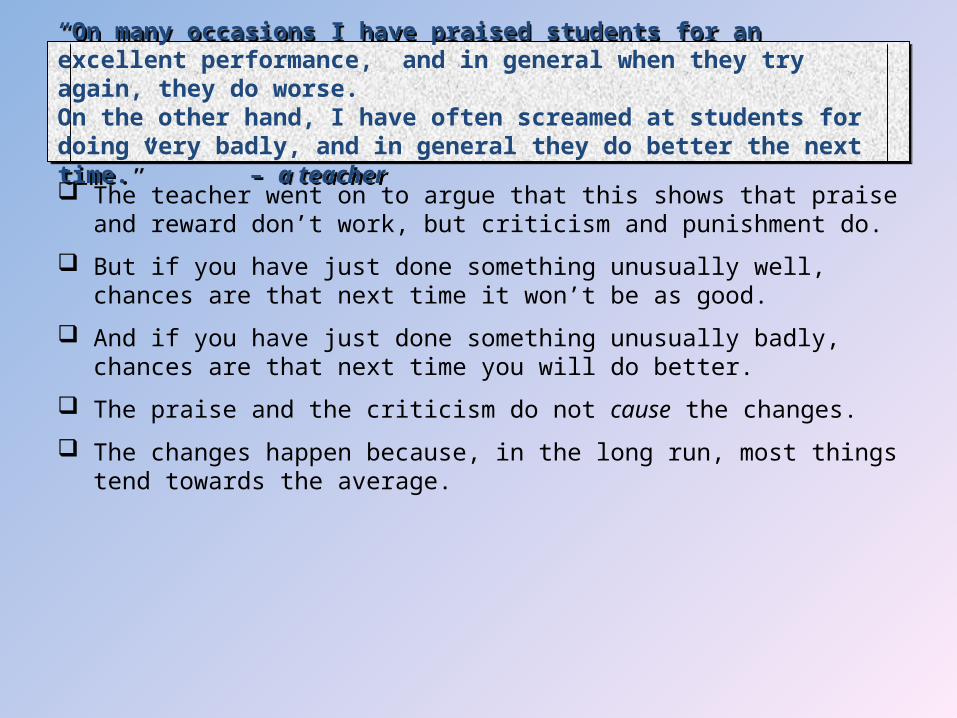
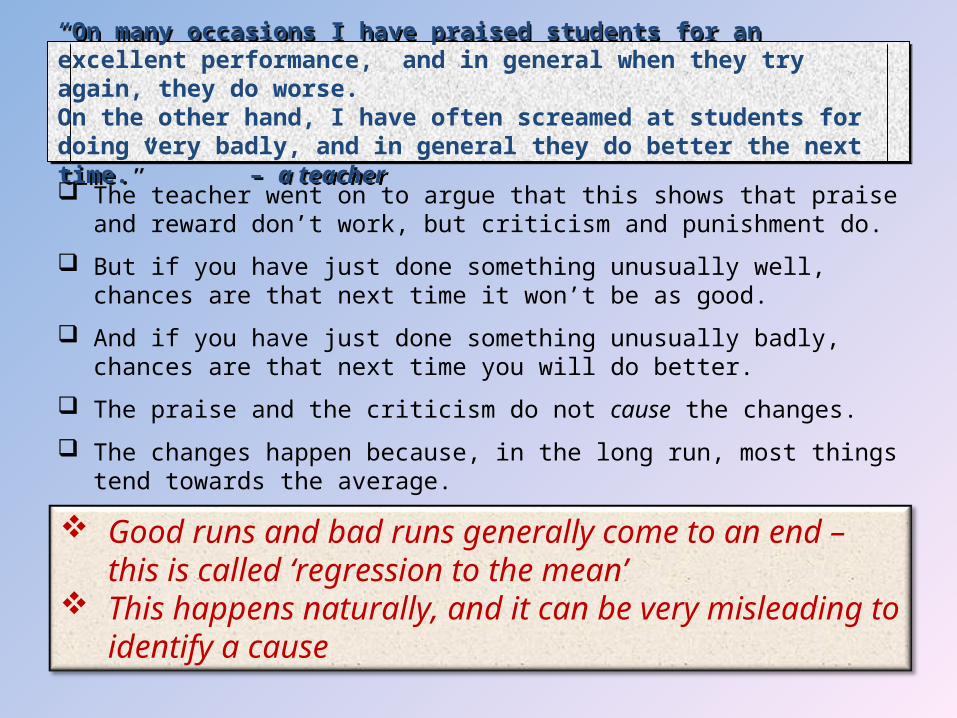
“On many occasions I have praised students for an excellent performance, and in general when they try again, they do worse. On the other hand, I have often screamed at students for doing very badly, and in general they do better the next time.” – a teacher
“On many occasions I have praised students for an excellent performance, and in general when they try again, they do worse. On the other hand, I have often screamed at students for doing very badly, and in general they do better the next time.” – a teacher

“On many occasions I have praised students for an excellent performance, and in general when they try again, they do worse. On the other hand, I have often screamed at students for doing very badly, and in general they do better the next time.” – a teacher
“On many occasions I have praised students for an excellent performance, and in general when they try again, they do worse. On the other hand, I have often screamed at students for doing very badly, and in general they do better the next time.” – a teacher
The teacher went on to argue that this shows that praise and reward don’t work, but criticism and punishment do.

“On many occasions I have praised students for an excellent performance, and in general when they try again, they do worse. On the other hand, I have often screamed at students for doing very badly, and in general they do better the next time.” – a teacher
“On many occasions I have praised students for an excellent performance, and in general when they try again, they do worse. On the other hand, I have often screamed at students for doing very badly, and in general they do better the next time.” – a teacher
The teacher went on to argue that this shows that praise and reward don’t work, but criticism and punishment do.
But if you have just done something unusually well, chances are that next time it won’t be as good.

“On many occasions I have praised students for an excellent performance, and in general when they try again, they do worse. On the other hand, I have often screamed at students for doing very badly, and in general they do better the next time.” – a teacher
“On many occasions I have praised students for an excellent performance, and in general when they try again, they do worse. On the other hand, I have often screamed at students for doing very badly, and in general they do better the next time.” – a teacher
The teacher went on to argue that this shows that praise and reward don’t work, but criticism and punishment do.
But if you have just done something unusually well, chances are that next time it won’t be as good.
And if you have just done something unusually badly, chances are that next time you will do better.

“On many occasions I have praised students for an excellent performance, and in general when they try again, they do worse. On the other hand, I have often screamed at students for doing very badly, and in general they do better the next time.” – a teacher
“On many occasions I have praised students for an excellent performance, and in general when they try again, they do worse. On the other hand, I have often screamed at students for doing very badly, and in general they do better the next time.” – a teacher
The teacher went on to argue that this shows that praise and reward don’t work, but criticism and punishment do.
But if you have just done something unusually well, chances are that next time it won’t be as good.
And if you have just done something unusually badly, chances are that next time you will do better.
The praise and the criticism do not cause the changes.
“On many occasions I have praised students for an excellent performance, and in general when they try again, they do worse. On the other hand, I have often screamed at students for doing very badly, and in general they do better the next time.” – a teacher
“On many occasions I have praised students for an excellent performance, and in general when they try again, they do worse. On the other hand, I have often screamed at students for doing very badly, and in general they do better the next time.” – a teacher
The teacher went on to argue that this shows that praise and reward don’t work, but criticism and punishment do.
But if you have just done something unusually well, chances are that next time it won’t be as good.
And if you have just done something unusually badly, chances are that next time you will do better.
The praise and the criticism do not cause the changes.
The changes happen because, in the long run, most things tend towards the average.
“On many occasions I have praised students for an excellent performance, and in general when they try again, they do worse. On the other hand, I have often screamed at students for doing very badly, and in general they do better the next time.” – a teacher
“On many occasions I have praised students for an excellent performance, and in general when they try again, they do worse. On the other hand, I have often screamed at students for doing very badly, and in general they do better the next time.” – a teacher
The teacher went on to argue that this shows that praise and reward don’t work, but criticism and punishment do.
But if you have just done something unusually well, chances are that next time it won’t be as good.
And if you have just done something unusually badly, chances are that next time you will do better.
The praise and the criticism do not cause the changes.
The changes happen because, in the long run, most things tend towards the average.
Good runs and bad runs generally come to an end – this is called ‘regression to the mean’
This happens naturally, and it can be very misleading to identify a cause

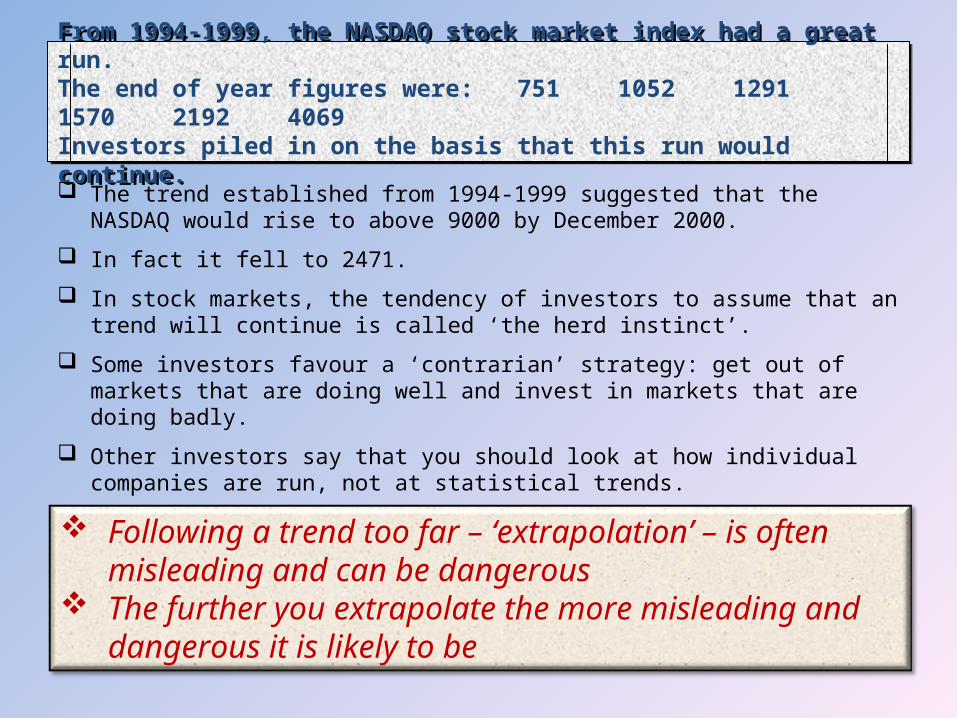
From 1994-1999, the NASDAQ stock market index had a great run.The end of year figures were: 751 1052 1291 1570 2192 4069Investors piled in on the basis that this run would continue.
From 1994-1999, the NASDAQ stock market index had a great run.The end of year figures were: 751 1052 1291 1570 2192 4069Investors piled in on the basis that this run would continue.

From 1994-1999, the NASDAQ stock market index had a great run.The end of year figures were: 751 1052 1291 1570 2192 4069Investors piled in on the basis that this run would continue.
From 1994-1999, the NASDAQ stock market index had a great run.The end of year figures were: 751 1052 1291 1570 2192 4069Investors piled in on the basis that this run would continue.
The trend established from 1994-1999 suggested that the NASDAQ would rise to above 9000 by December 2000.

From 1994-1999, the NASDAQ stock market index had a great run.The end of year figures were: 751 1052 1291 1570 2192 4069Investors piled in on the basis that this run would continue.
From 1994-1999, the NASDAQ stock market index had a great run.The end of year figures were: 751 1052 1291 1570 2192 4069Investors piled in on the basis that this run would continue.
The trend established from 1994-1999 suggested that the NASDAQ would rise to above 9000 by December 2000.
In fact it fell to 2471.

From 1994-1999, the NASDAQ stock market index had a great run.The end of year figures were: 751 1052 1291 1570 2192 4069Investors piled in on the basis that this run would continue.
From 1994-1999, the NASDAQ stock market index had a great run.The end of year figures were: 751 1052 1291 1570 2192 4069Investors piled in on the basis that this run would continue.
The trend established from 1994-1999 suggested that the NASDAQ would rise to above 9000 by December 2000.
In fact it fell to 2471.
In stock markets, the tendency of investors to assume that an trend will continue is called ‘the herd instinct’.

From 1994-1999, the NASDAQ stock market index had a great run.The end of year figures were: 751 1052 1291 1570 2192 4069Investors piled in on the basis that this run would continue.
From 1994-1999, the NASDAQ stock market index had a great run.The end of year figures were: 751 1052 1291 1570 2192 4069Investors piled in on the basis that this run would continue.
The trend established from 1994-1999 suggested that the NASDAQ would rise to above 9000 by December 2000.
In fact it fell to 2471.
In stock markets, the tendency of investors to assume that an trend will continue is called ‘the herd instinct’.
Some investors favour a ‘contrarian’ strategy: get out of markets that are doing well and invest in markets that are doing badly.

From 1994-1999, the NASDAQ stock market index had a great run.The end of year figures were: 751 1052 1291 1570 2192 4069Investors piled in on the basis that this run would continue.
From 1994-1999, the NASDAQ stock market index had a great run.The end of year figures were: 751 1052 1291 1570 2192 4069Investors piled in on the basis that this run would continue.
The trend established from 1994-1999 suggested that the NASDAQ would rise to above 9000 by December 2000.
In fact it fell to 2471.
In stock markets, the tendency of investors to assume that an trend will continue is called ‘the herd instinct’.
Some investors favour a ‘contrarian’ strategy: get out of markets that are doing well and invest in markets that are doing badly.
Other investors say that you should look at how individual companies are run, not at statistical trends.
From 1994-1999, the NASDAQ stock market index had a great run.The end of year figures were: 751 1052 1291 1570 2192 4069Investors piled in on the basis that this run would continue.
From 1994-1999, the NASDAQ stock market index had a great run.The end of year figures were: 751 1052 1291 1570 2192 4069Investors piled in on the basis that this run would continue.
The trend established from 1994-1999 suggested that the NASDAQ would rise to above 9000 by December 2000.
In fact it fell to 2471.
In stock markets, the tendency of investors to assume that an trend will continue is called ‘the herd instinct’.
Some investors favour a ‘contrarian’ strategy: get out of markets that are doing well and invest in markets that are doing badly.
Other investors say that you should look at how individual companies are run, not at statistical trends.
Following a trend too far – ‘extrapolation’ – is often misleading and can be dangerous
The further you extrapolate the more misleading and dangerous it is likely to be
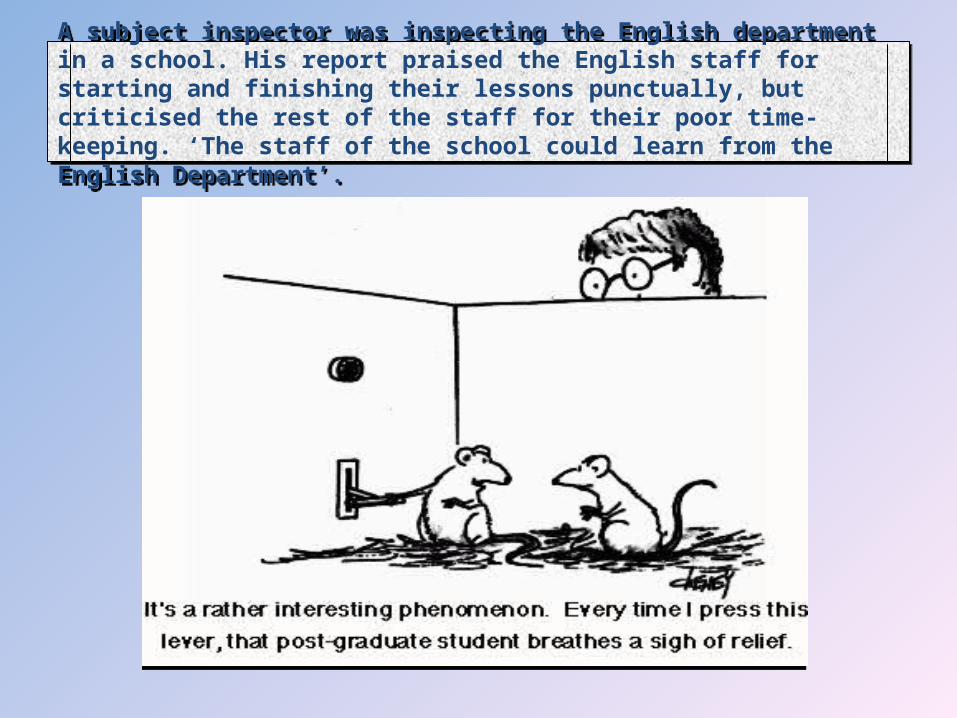
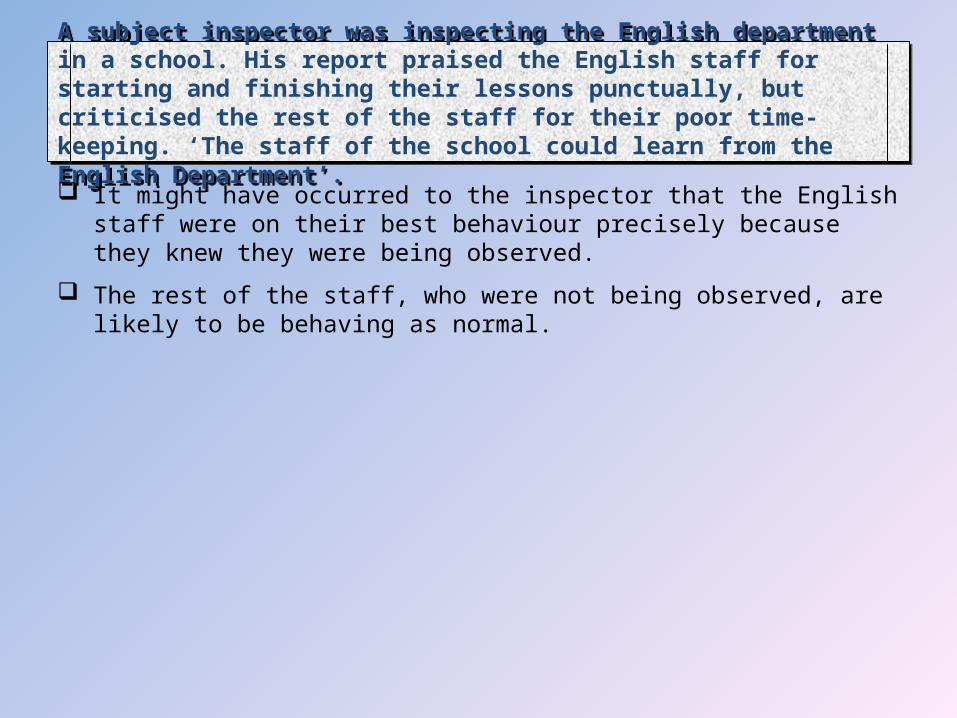
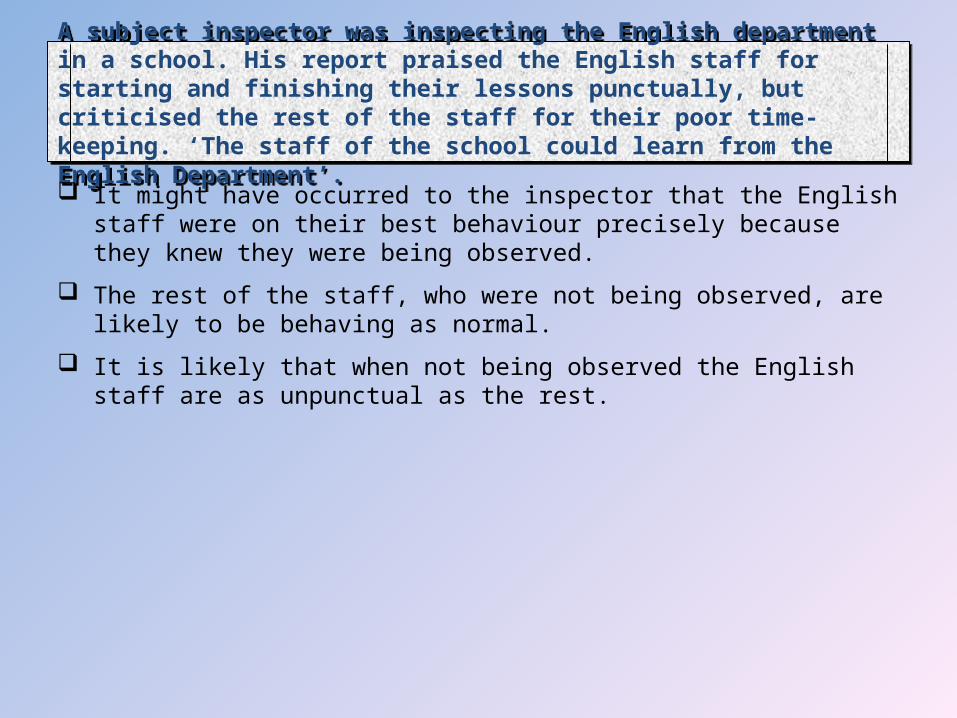
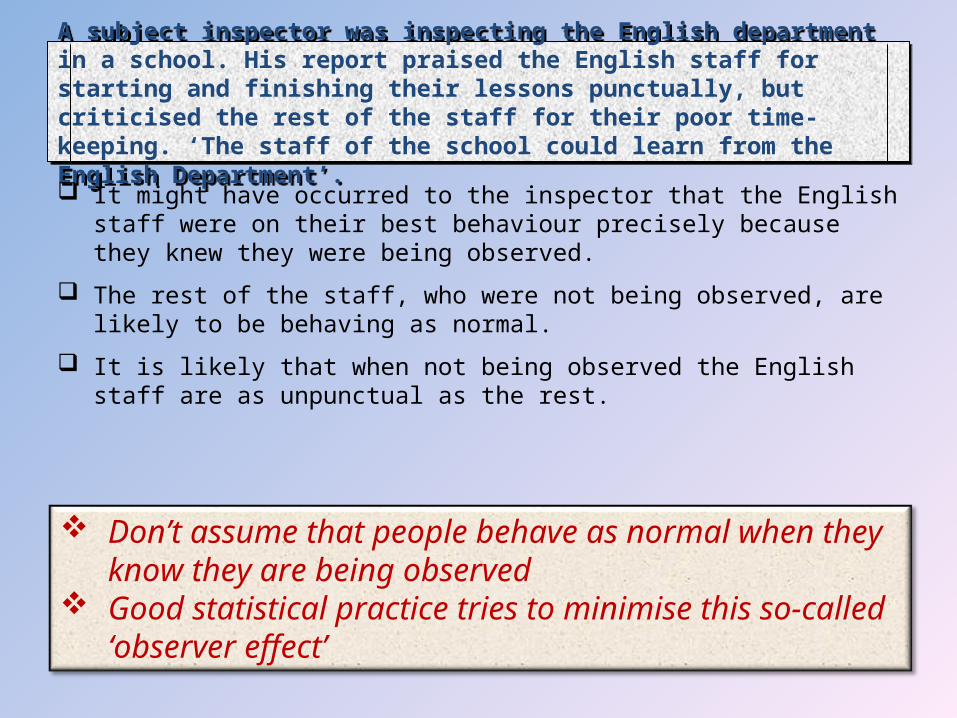
A subject inspector was inspecting the English department in a school. His report praised the English staff for starting and finishing their lessons punctually, but criticised the rest of the staff for their poor time-keeping. ‘The staff of the school could learn from the English Department’.
A subject inspector was inspecting the English department in a school. His report praised the English staff for starting and finishing their lessons punctually, but criticised the rest of the staff for their poor time-keeping. ‘The staff of the school could learn from the English Department’.
A subject inspector was inspecting the English department in a school. His report praised the English staff for starting and finishing their lessons punctually, but criticised the rest of the staff for their poor time-keeping. ‘The staff of the school could learn from the English Department’.
A subject inspector was inspecting the English department in a school. His report praised the English staff for starting and finishing their lessons punctually, but criticised the rest of the staff for their poor time-keeping. ‘The staff of the school could learn from the English Department’.
It might have occurred to the inspector that the English staff were on their best behaviour precisely because they knew they were being observed.
A subject inspector was inspecting the English department in a school. His report praised the English staff for starting and finishing their lessons punctually, but criticised the rest of the staff for their poor time-keeping. ‘The staff of the school could learn from the English Department’.
A subject inspector was inspecting the English department in a school. His report praised the English staff for starting and finishing their lessons punctually, but criticised the rest of the staff for their poor time-keeping. ‘The staff of the school could learn from the English Department’.
It might have occurred to the inspector that the English staff were on their best behaviour precisely because they knew they were being observed.
The rest of the staff, who were not being observed, are likely to be behaving as normal.
A subject inspector was inspecting the English department in a school. His report praised the English staff for starting and finishing their lessons punctually, but criticised the rest of the staff for their poor time-keeping. ‘The staff of the school could learn from the English Department’.
A subject inspector was inspecting the English department in a school. His report praised the English staff for starting and finishing their lessons punctually, but criticised the rest of the staff for their poor time-keeping. ‘The staff of the school could learn from the English Department’.
It might have occurred to the inspector that the English staff were on their best behaviour precisely because they knew they were being observed.
The rest of the staff, who were not being observed, are likely to be behaving as normal.
It is likely that when not being observed the English staff are as unpunctual as the rest.
A subject inspector was inspecting the English department in a school. His report praised the English staff for starting and finishing their lessons punctually, but criticised the rest of the staff for their poor time-keeping. ‘The staff of the school could learn from the English Department’.
A subject inspector was inspecting the English department in a school. His report praised the English staff for starting and finishing their lessons punctually, but criticised the rest of the staff for their poor time-keeping. ‘The staff of the school could learn from the English Department’.
It might have occurred to the inspector that the English staff were on their best behaviour precisely because they knew they were being observed.
The rest of the staff, who were not being observed, are likely to be behaving as normal.
It is likely that when not being observed the English staff are as unpunctual as the rest.
Don’t assume that people behave as normal when they know they are being observed
Good statistical practice tries to minimise this so-called ‘observer effect’

“Lies, damned lies and ...”a guide to dodgy data
Neil Sheldon Royal Statistical Society
Centre for Statistical Education
Manchester Grammar School