leveraging smart meter data to recognize home appliances · leveraging smart meter data to...
TRANSCRIPT
Leveraging smart meter data to recognize home appliances
Markus Weiss+#, Adrian Helfenstein+, Friedemann Mattern+, and Thorsten Staakeᶲ + Institute for Pervasive Computing
ETH Zurich ᶲ Information Management
ETH Zurich # Engineering Systems Division
Massachusetts Institute of Technology
Abstract — The worldwide adoption of smart meters that measure and communicate residential electricity consumption gives rise to the development of new energy efficiency services. Several particularly promising applications involve the disaggregation of individual appliances within a particular household in terms of their energy demand. In this paper we present an infrastructure and a set of algorithms that make use of smart meters together with smartphones to realize new energy efficiency services (such as itemized electricity bills or targeted energy saving advice). The smartphones, together with a novel filtering approach, much simplify the training process for appliances signature recognition. We also report on the performance of our system that was tested with 8 simultaneous devices, achieving recognition rates of 87%.
Keywords—smart metering; non-intrusive load monitoring; energy monitoring; energy break down; electricity consumption
I. APLLIANCE-SPECIFIC CONSUMPTION FEEDBACK The requirement to conserve energy, the modernization
of the electrical grid infrastructure, and the growing share of electricity from intermittent sources (e.g., wind and photo-voltaics) initiated a paradigm shift in the energy domain [1]. As a consequence, smart electricity meters are currently rolled out in many countries. Besides simplifying the meter reading processes for energy utilities, smart meters are seen as enablers for new services, flexible tariffs, and demand response programs in the context of the smart grid.
Smart electricity meters record much more detailed con-sumption information than classical electricity meters. In current deployments, energy consumption is logged and typ-ically made available to energy utilities and consumers by feedback tools such as web sites or in-home displays. How-ever, the information provided is often limited to the mere visualization of the consumption data, or, at best, augmented with efficiency scales or comparisons with average house-holds. While this may already contribute to energy savings, it fails to unlock the full benefit for consumers, as it does not direct the attention to those appliances or actions that bear high saving potentials.
In this work we propose a scheme that leverages meter-ing data by automatically analyzing the recorded consump-tion information to provide better-tailored energy feedback at no extra cost. It provides users with an appliance-specific consumption break down. Such device-level information is essential to establish the link between consumption and de-vice utilization, to enable sophisticated energy efficiency services (e.g., targeted automated recommendations), and to reduce residential electricity consumption by enabling users to derive conservation measures.
Most approaches so far have focused on providing this device-level consumption information by deploying sensors at appliances or power outlets. However, this is costly and
the installation of a large number of sensors imposes a high usage barrier. Other solutions are based on a single sensor only, but require technical expertise for their setup, a-priori knowledge of appliance power signatures, and a complex calibration by the user [1].
Our approach tries to overcome these challenges. To fa-cilitate the appliance-specific breakdown, we extended the capabilities of an earlier prototype that connects a smart me-ter with a mobile phone [2]. We disaggregate the recorded total load to device-level consumption information by apply-ing data analytics to the electricity consumption data that is gathered by the smart meter and by making use of a meas-urement feature implemented as part of a mobile phone ap-plication. This not only enables more meaningful consump-tion feedback and increases users’ energy literacy, but also leverages the added value of smart metering.
II. RELATED WORK Based on the number of sensors used to gather device-
level electricity consumption information, existing solutions for appliance load monitoring can be classified into two do-mains: multi-sensor systems and single-point sensor systems.
Multi-sensor approaches typically require a current sen-sor to be installed in-line with every device. To monitor the whole house, this device-level information is then aggregated at a central point. Commercially available solutions typically come in the form of smart power outlets. They measure the power consumption at the point where the load is caused and either visualize the data on a small display directly attached to the unit or propagate the consumption values wirelessly to a central display. A drawback of these systems is that they typically give a rather technical feedback and fail to integrate the consumption in a bigger picture that makes it more tangi-ble for users. As mentioned above, such approaches typically require high monetary investment and high user effort to setup the feedback system.
Single sensor approaches are typically subsumed under the concept of Nonintrusive Appliance Load Monitoring (NALM). The initial work dates back to the 1980s, where Hart [3] tried first to match a-priori known appliance signa-tures in the overall power signal by using real and reactive power measurements at a rate of 1Hz. The concept proved to be effective in several field tests – at that time especially for larger loads – and paved ground for various other work based on this principle. Norford and Leeb, for example, introduced transient event detection at high sampling rates to disaggre-gate devices with similar power consumption [4], and fol-low-up work by Laughman et al. [5] explained how to use current harmonics to further disaggregate continuous varia-ble loads. A variant of Hart’s scheme deals with the separa-tion of simultaneous on/off events of appliances [6].

Other work utilizes methods from artificial intelligence to disaggregate overall residential energy consumption data. Early approaches were typically bound to low-resolution data. Powers’ [7] rule-based algorithm tries to analyze the energy consumption at a low sampling interval of 15 minutes. However, his approach is based on a large a-priori known reference database that requires monitoring of each appliance in the home for several days. Prudenzi disaggre-gated consumption data for large loads at the same sampling rate by using a neural network approach [8]. Ruzzelli et al. used a special purpose sensor that has to be installed at the circuit breaker. The consumption information is post-processed in an artificial neuronal network that requires a lengthy training process to disaggregate device level con-sumption [9]. Other rule-based work focuses on the possibil-ity of differentiating between appliances with similar power consumption by taking into account their frequency of use [10] and using pattern recognition methods to disaggre-gate the overall electricity consumption into major energy end-uses [11].
More recent approaches deal with the analysis of data sampled at higher frequency. Statistical signature analysis has been used to infer the devices operating from the current and voltage waveforms [12]. Srinivasan combined harmonic signature analysis with neural networks and developed and tested several different classification models for signature extraction and device identification [13]. In contrast to these high frequency approaches that usually rely on special pur-pose sensors, Kolter et al. [14] recently investigated the pos-sibility of load disaggregation using discriminative sparse coding based on hourly data.
Yet another idea has been explored in [15] and [16]. The authors combined two complementary approaches in a sys-tem that relies on a single sensor that can be plugged-in an-ywhere to the electric circuit. It then listens to detect unique noise changes and electromagnetic interference that occur through the switching of devices and through switch mode power supplies. The system can be used to infer about device operation which in combination with the data of an electrici-ty meter can reveal the consumption of particular devices.
Summarizing the related work, existing systems can be characterized as follows: Multi-sensor approaches can rather easily achieve a consumption breakdown, but deploying a large number of sensors in the residential environment quick-ly leads not only to high cost but also to a discouraging high usage barrier [9]. In contrast, single sensor systems are easier to deploy but often rely on expensive custom hardware (e.g., for high sampling rates) and require either a priori knowledge about the household devices and their electrical characteristics, or they require a complex training phase in-volving the user where the system learns about the specific device characteristics. However, a-priori knowledge is diffi-cult to obtain in a world of fast changing small appliances, and training procedures at the initial deployment are discour-aging users and hinder adoption [10]. In addition, these ap-proaches cannot take into account new devices that are intro-duced into the residential environment. Overall, we conclude that existing approaches fail to meet usability requirements that are essential for fast adoption.
III. SYSTEM OVERVIEW Our system represents an integrated solution to identify
the electricity consumption of household appliances from the data gathered by smart meters, which will be installed in large numbers in many countries over the next years. The approach builds on an earlier principle advocated by Hart [3]. It uses a single sensor and addresses remaining technical challenges (e.g., the recognition of smaller loads and overlapping on/off events of appliances) as well as some of the above-mentioned shortcomings with respect to usabil-ity. For this, we designed and developed a system that does not rely on custom hardware or complex training. In particu-lar, we make use of a smartphone application, which much simplifies the appliance signature acquisition process be-cause this is done as a side effect, invisible to users.
In the following, we first give an overview on the system architecture and its components. We then explain how resi-dential appliances can be classified according to their charac-teristic electricity consumption.
A. Data Acquisition Architecture One of the three main components of our system is an
electricity meter that can measure the total electrical load of all attached devices in a household (Figure 1). The meter (we used model E750 by Landis + Gyr) logs the total consump-tion at a frequency of 1 sample per second. It has an integrat-ed communication interface that is connected to a gateway, which is responsible for continuous data acquisition and storage from the electricity meter, and also for the handling of the incoming requests of the user interface. For that, the gateway consists of a web server (lighttpd, php), an SML parser, and a database (SQLite3). It is implemented on an embedded device based on a 600MHz CPU, 256MB storage of RAM and flash memory, and an Ethernet and WiFi-module for communication purposes. The third component of the system is the user interface that is implemented as a smartphone application. It provides users with real-time feedback on their electricity consumption. A detailed de-scription of the design and the capabilities of the system can be found in [1, 2]. The communication between the three decoupled components is realized over http following the “Web of Things” paradigm [17]. This integrates physical resources, such as the meter and its measurements, seamless-ly into the web. They can then be identified by URLs and accessed by the four basic HTTP commands through the RESTful-API provided by the gateway [2].
B. Classification of Residential Appliances In the following, we explain how domestic appliances
Figure 1. Loosely coupled data acquisition architecture.

can be classified according to their characteristic load signatures based on the physical quantities (i.e., apparent power, reactive power, real power, and distortion power) measured by the smart meter. Depending on its characteristic electrical and electronic components, an appliance can be of resistive, inductive, or capacitive nature. For example, a standard light bulb is purely resistive whereas a vacuum cleaner is predominantly inductive. In general, incandescent appliances (e.g., kettle, light bulb) are mostly resistive (ohmic), motors (e.g., fans, heaters) predominantly inductive, and devices containing a power supply or electronic frequency converters (e.g., laptops) mainly capacitive.
Figure 2 illustrates exemplary power signatures at a sampling frequency of 1Hz for different appliance categories over different operation lengths. If the load is purely resistive, then the voltage and current are in phase (e.g., the iron (Figure 2 (left)). The reactive component Q of the apparent power is null, meaning all power is transferred to the load. A consumer with reactive components is either of type ohmic-inductive with a typical phase shift of 0 < φ < π between current and voltage or ohmic-capacitive characterized by a negative phase shift 0 > φ > -π (Figure 2 (middle and right)). In addition, in electrical networks there may exist non-sinusoidal currents and voltages (e.g., caused by inverters in switching events) that result in harmonics. These harmonics cause an additional reactive component, the so-called distortion power (Figure 3). In mathematical terms this can be expressed as:
𝑆𝑆 = 𝑃𝑃 + 𝑄𝑄 + 𝐷𝐷 , where S is the apparent power, P is the real power, Q the
translative component, and D the distortive component of the total reactive power.
Based on its internal composition and its possible modes of operation (e.g., static, multi-level, or variable) an appliance imposes a characteristic load profile on the electric circuit. This signature depends on the relation of the different power components and can be used to discriminate between appliances when disaggregating the total consumption. Our prototype system measures these parameters either directly or indirectly. In addition to these physical quantities, the signature length, peak voltage, and current are also important in terms of the appliance signature.
IV. THE APPLISENSE ALGORITHM The AppliSense algorithm uses consumption data gath-
ered by the smart electricity meter to automatically break down the total consumption to device-level. In the following, we first outline the basic idea and concept of our system that pays particular respect to usability. We then explain how the
signature database on which the algorithm crucially depends is acquired and discuss some algorithm details.
A. Basic Concept The electricity consumption of a household fluctuates
over time based on the operation of individual devices used by the residents (see Figure 4). For example, switching on a light induces the depicted change in the load curve. Having a more detailed look on the consumption data, the figure shows that there exist intervals where the load remains more or less constant on a stable level. A black bar marks two of these levels. The difference in real power (dP) between these levels indicates the change in electricity consumption due to the operation of the light. Our system not only measures the total load of the household, but the load characteristics (i.e., apparent power, real power, etc.) of each of the three phases separately. This phase-level data allows us to split up the overall electricity to get an even more detailed view.
These considerations lead to the following key concept of AppliSense, which can recognize device-switching events in the load curve based on an appliance signature database.
First, identify time points where significant changes be-tween two levels of power consumption in the load curve occur. Second, once such an edge is detected, compute the differences of the different physical quantities between these consecutive levels and classify the change as a potential ap-pliance-switching event. And third, compare each of these differences with a known set of differences from an appli-ance signature database and map the edge to an individual device according to its load characteristics.
Figure 5 illustrates these steps. It shows the electricity consumption (red) at a certain time interval in which five load levels (black bars) were identified. For simplicity, only the real power is visualized in this example. From this we
Figure 3. Relation between the different power quantities that can be derived with our prototype.
Figure 2. Power signatures of three different residential devices from different appliance categories and for different operation periods.

can compute four deltas: dP1, dP2, dP3, and dP4. Each of these deltas corresponds to a potential on/off event of a de-vice. The algorithm tries to match these with a known device signature from the database. For that, each entry dPi in a col-umn of the matrix on the left symbolizes a delta which was extracted from the load curve at time i. The operator repre-sents a detector logic that compares the rows of the matrix to the signature vector with the known deltas. The resulting vector holds the best matching entry, in case a matching ap-pliance could be identified. In the example, this means that at time instant two and three matching signatures of a known device (a turning on and a turning off event) are detected. However, no signature is matching the events at time instants one and four.
B. User-friendly Singature Recording In contrast to other load disaggregation systems, which
often discourage users by requiring a long training period or complex calibration, we wanted to develop a system that is easy to use. This is particularly important for the generation of the signature database that is used to identify an appliance power signature. With our approach it is not necessary to take signatures of every appliance in advance, but the signa-ture database is established with simple means over time. For that, we equipped the user interface of the smartphone with a measurement functionality that allows users to identify the consumption of an individual appliance in a simple, explora-tive way while at the same time logging the signature in the
background, invisible to the user. This also allows easily in-tegrating new appliances that are introduced at home. Whereas other systems need to completely recalibrate, our approach is able to incrementally acquire signatures and thus integrate new devices, which is crucial in a fast changing home environment.
The measurement process is illustrated in Figure 6. To measure the consumption of a device, users initialize the measurement by pressing the start button on the user inter-face. They are then asked to turn the device being measured either on or off. Within a few seconds, the system then com-putes the result based on the measurement algorithm [18]. If desired, users can further personalize the measurement (e.g., picture, name, category, etc.) and store the device character-istics in the inventory of the mobile phone application.
During the measurement, the signature acquisition pro-cess runs in the background (see Figure 7; only real power depicted for clarity reasons). It logs the whole appliance sig-nature (e.g., change in apparent, reactive, and distortion power, etc.). In addition, the algorithm automatically classi-fies whether an on (dP>0) or off (dP<0) switching event has occurred. AppliSense uses this information later as input knowledge. The idea of this approach is to systematically increase the number of signatures in the database while the system is being used. This leads to higher precision in recog-nizable operation events over time.
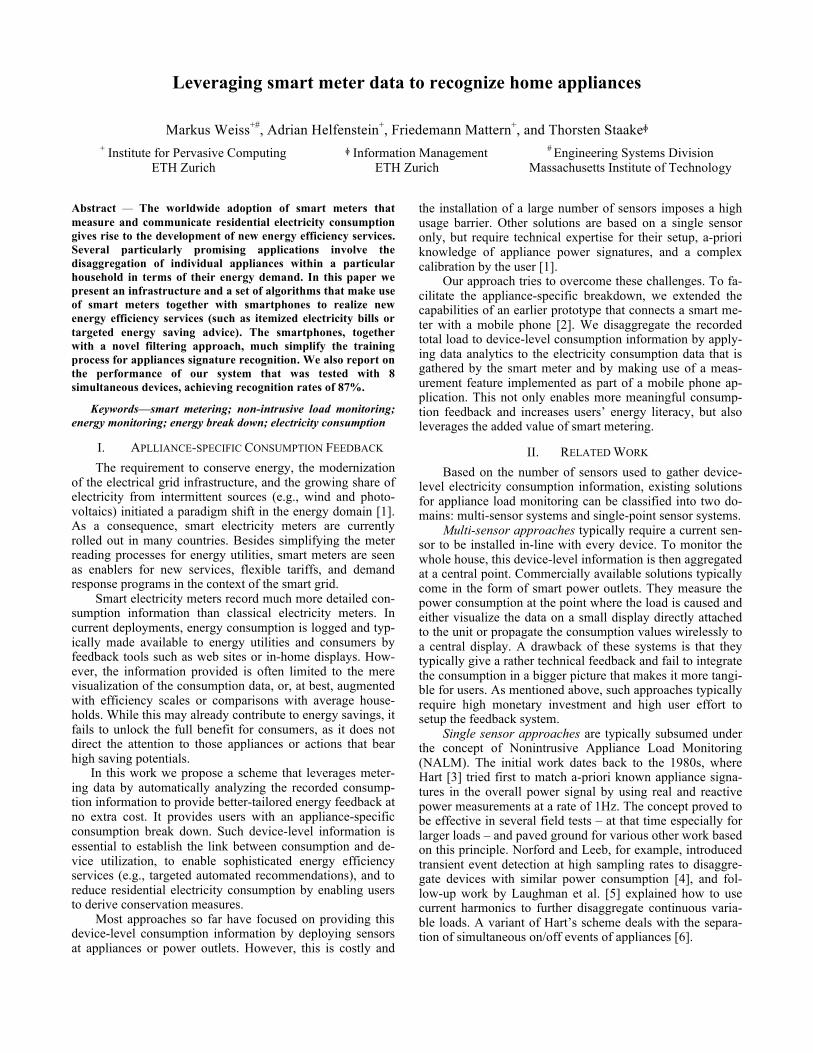
C. Algorithm Design The AppliSense load disaggregation algorithm consists of six
steps that are subsequently discussed in this section (Fig-ure 8). It follows the early principles discovered by Hart, but much simplifies the signature acquisition process for users.
(1) Normalization and (2) Edge Detection: In power cir-cuits, load-dependent voltage drops can occur (e.g., in reac-tion to a switching event of an appliance). From I = U/R and S = U×I for apparent power S and effective values of voltage U and current I, a quadratic relation arises: S = U2/R.
Hence, voltage drops can lead to large differences in power consumption, which we have to account for by nor-malizing the power values to a constant voltage (of 230 V):
Figure 4. Key idea of the AppliSense algorithm.
Figure 7. User-friendly signature acquisition process with the help of the measurement feature of the user interface.
Figure 6. User process to measure the power consumption of an individual appliance (e.g., an office flood light).
Figure 5. Simplified overview of the required steps to recog-nize an appliance in the overall electrical load.
𝑆𝑆 = 230𝑈𝑈
×𝑆𝑆. In order to identify edges in the recorded electricity con-
sumption data that correspond to switching events of appli-ances, we use the normalized apparent power 𝑆𝑆 as input vector. The algorithm computes the absolute values of the differences between two consecutive values of normalized apparent power 𝑆𝑆 in the data series. If the absolute value of such a difference is larger than a predefined threshold f_th, then the value potentially belongs to an edge. However, there can be much more potential edges than appliance-switching events. The threshold f_th has to be robust to small changes due to noise on the electric line.
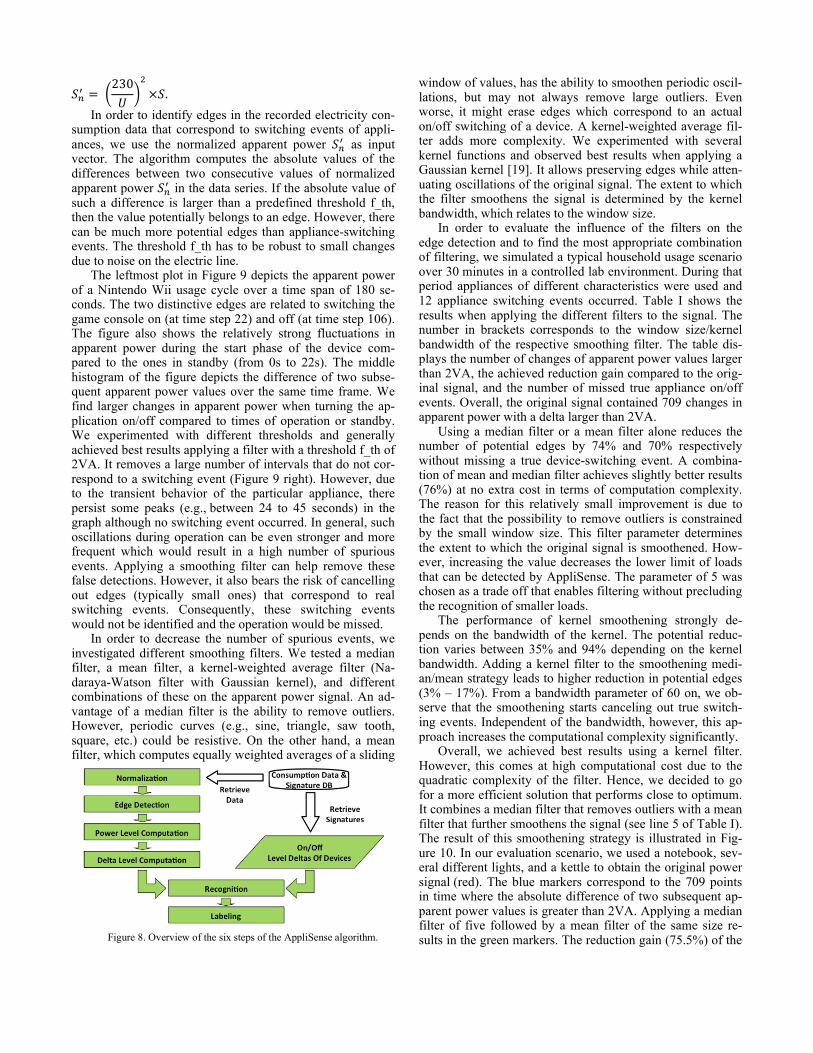
The leftmost plot in Figure 9 depicts the apparent power of a Nintendo Wii usage cycle over a time span of 180 se-conds. The two distinctive edges are related to switching the game console on (at time step 22) and off (at time step 106). The figure also shows the relatively strong fluctuations in apparent power during the start phase of the device com-pared to the ones in standby (from 0s to 22s). The middle histogram of the figure depicts the difference of two subse-quent apparent power values over the same time frame. We find larger changes in apparent power when turning the ap-plication on/off compared to times of operation or standby. We experimented with different thresholds and generally achieved best results applying a filter with a threshold f_th of 2VA. It removes a large number of intervals that do not cor-respond to a switching event (Figure 9 right). However, due to the transient behavior of the particular appliance, there persist some peaks (e.g., between 24 to 45 seconds) in the graph although no switching event occurred. In general, such oscillations during operation can be even stronger and more frequent which would result in a high number of spurious events. Applying a smoothing filter can help remove these false detections. However, it also bears the risk of cancelling out edges (typically small ones) that correspond to real switching events. Consequently, these switching events would not be identified and the operation would be missed.
In order to decrease the number of spurious events, we investigated different smoothing filters. We tested a median filter, a mean filter, a kernel-weighted average filter (Na-daraya-Watson filter with Gaussian kernel), and different combinations of these on the apparent power signal. An ad-vantage of a median filter is the ability to remove outliers. However, periodic curves (e.g., sine, triangle, saw tooth, square, etc.) could be resistive. On the other hand, a mean filter, which computes equally weighted averages of a sliding
window of values, has the ability to smoothen periodic oscil-lations, but may not always remove large outliers. Even worse, it might erase edges which correspond to an actual on/off switching of a device. A kernel-weighted average fil-ter adds more complexity. We experimented with several kernel functions and observed best results when applying a Gaussian kernel [19]. It allows preserving edges while atten-uating oscillations of the original signal. The extent to which the filter smoothens the signal is determined by the kernel bandwidth, which relates to the window size.
In order to evaluate the influence of the filters on the edge detection and to find the most appropriate combination of filtering, we simulated a typical household usage scenario over 30 minutes in a controlled lab environment. During that period appliances of different characteristics were used and 12 appliance switching events occurred. Table I shows the results when applying the different filters to the signal. The number in brackets corresponds to the window size/kernel bandwidth of the respective smoothing filter. The table dis-plays the number of changes of apparent power values larger than 2VA, the achieved reduction gain compared to the orig-inal signal, and the number of missed true appliance on/off events. Overall, the original signal contained 709 changes in apparent power with a delta larger than 2VA.
Using a median filter or a mean filter alone reduces the number of potential edges by 74% and 70% respectively without missing a true device-switching event. A combina-tion of mean and median filter achieves slightly better results (76%) at no extra cost in terms of computation complexity. The reason for this relatively small improvement is due to the fact that the possibility to remove outliers is constrained by the small window size. This filter parameter determines the extent to which the original signal is smoothened. How-ever, increasing the value decreases the lower limit of loads that can be detected by AppliSense. The parameter of 5 was chosen as a trade off that enables filtering without precluding the recognition of smaller loads.
The performance of kernel smoothening strongly de-pends on the bandwidth of the kernel. The potential reduc-tion varies between 35% and 94% depending on the kernel bandwidth. Adding a kernel filter to the smoothening medi-an/mean strategy leads to higher reduction in potential edges (3% – 17%). From a bandwidth parameter of 60 on, we ob-serve that the smoothening starts canceling out true switch-ing events. Independent of the bandwidth, however, this ap-proach increases the computational complexity significantly.
Overall, we achieved best results using a kernel filter. However, this comes at high computational cost due to the quadratic complexity of the filter. Hence, we decided to go for a more efficient solution that performs close to optimum. It combines a median filter that removes outliers with a mean filter that further smoothens the signal (see line 5 of Table I). The result of this smoothening strategy is illustrated in Fig-ure 10. In our evaluation scenario, we used a notebook, sev-eral different lights, and a kettle to obtain the original power signal (red). The blue markers correspond to the 709 points in time where the absolute difference of two subsequent ap-parent power values is greater than 2VA. Applying a median filter of five followed by a mean filter of the same size re-sults in the green markers. The reduction gain (75.5%) of the Figure 8. Overview of the six steps of the AppliSense algorithm.

filter can be seen by comparing the blue with the green markers. The edge detection interprets the remaining 174 green markers as a binary vector which indicates at position i that the smoothed estimate of the apparent power at time step i differs by more than 2VA from the value at position i-1. Hence, the measurement at time i belongs to a potential de-vice-switching event.
TABLE I. COMPARISON OF DIFFERENT SMOOTHENING FILTERS
Filtering Method ∆S > 2VA Reduction Missed Median(5) 185 73.9% 0 Mean(5) 218 69.2% 0Kernel(3) 459 35.3% 0 Kernel(100) 46 93.5% 0 Median(5), Mean(5) 174 75.5% 0 Median(5), Mean(5), Kernel(3) 151 78,7% 0 Median(5), Mean(5), Kernel(60) 78 89% 1 Median(5), Mean(5), Kernel(70) 52 92.7% 4
(3) Power Level and (4) Delta Level Computation: Hav-
ing identified the relevant edges, the next step extracts power levels that connect two edges in the smoothened signal. From two consecutive power levels separated by an edge, the algo-rithm then extracts the delta vectors that are used for match-ing the edge to a particular device.
Each power level consists of a start and an end time, a vector with component-wise means of real, reactive, and dis-tortion power for the first five measurements at the start and the last five measurements at the end of the interval (start mean (sm) vector and end mean (em) vector), and a three-by-five matrix which holds the original real, reactive, and distor-tion power values. The component-wise standard deviation of all power values is also calculated.
From two consecutive power levels, the algorithm com-putes the difference vector for real, reactive, and distortion power. To take oscillations during start up and shut down of an appliance (e.g., due to heating up at the start of a kettle) into account, we not only calculate one difference vector for level i to i+1 (e.g., end of level i (emi) – start of level i+1 (smi+1)), but four difference vectors di,j that include the start and the end values of both levels:
𝑑𝑑 _ , _ = 𝑠𝑠𝑠𝑠 − 𝑠𝑠𝑠𝑠 , 𝑑𝑑 _ , _ = 𝑠𝑠𝑠𝑠 − 𝑒𝑒𝑒𝑒 , 𝑑𝑑 _ , _ = 𝑒𝑒𝑒𝑒 − 𝑠𝑠𝑠𝑠 , and 𝑑𝑑 _ , _ = 𝑒𝑒𝑒𝑒 − 𝑒𝑒𝑒𝑒 . For each edge, we add these four vectors to a result ma-
trix used as input for matching the device signatures in the next step.
(5) Recognition and (6) Labeling: The recognition part of the algorithm tries to match known appliance signatures 𝑘𝑘 from the signature database with extracted delta vectors 𝑑𝑑 obtained as a result in the previous step. In order to identi-fy an appliance on/off event, we perform a nearest neighbor search in the two-dimensional dQ/dP space (see Figure 11).
First, the algorithm computes for every 𝑑𝑑 its Euclidean distance to every 𝑘𝑘 in the two-dimensional vector space. If this is smaller than a predefined value (r) of the length of 𝑘𝑘 plus an oscillation value (osc), a potential matching is identi-fied:
𝑑𝑑 − 𝑘𝑘 < 𝑟𝑟 ∙ 𝑘𝑘 + 𝑜𝑜𝑜𝑜𝑜𝑜 𝑖𝑖𝑖𝑖 𝑡𝑡𝑡𝑡𝑡𝑡𝑡𝑡, 𝑘𝑘 𝑖𝑖𝑖𝑖 𝑎𝑎 𝑝𝑝𝑝𝑝𝑝𝑝𝑝𝑝𝑝𝑝𝑝𝑝𝑝𝑝𝑝𝑝𝑝𝑝 𝑚𝑚𝑚𝑚𝑚𝑚𝑚𝑚ℎ 𝑓𝑓𝑓𝑓𝑓𝑓 𝑑𝑑 𝑖𝑖𝑖𝑖 𝑓𝑓𝑓𝑓𝑓𝑓𝑓𝑓𝑓𝑓, 𝑘𝑘 𝑖𝑖𝑖𝑖 𝑛𝑛𝑛𝑛𝑛𝑛 𝑎𝑎 𝑚𝑚𝑚𝑚𝑚𝑚𝑚𝑚ℎ 𝑓𝑓𝑓𝑓𝑓𝑓 𝑑𝑑
The oscillation term (osc) is the length of a vector which consists of the maximum of the standard deviation in the real power at level i or i+1 as first component, and of the maxi-mum of the standard deviation in reactive power at level i or i + 1 as second component:
𝑜𝑜𝑜𝑜𝑜𝑜 = max (𝑠𝑠𝑠𝑠𝑠𝑠 𝑃𝑃 𝑎𝑎𝑎𝑎 𝑙𝑙𝑙𝑙𝑙𝑙𝑙𝑙𝑙𝑙 𝑖𝑖 , 𝑠𝑠𝑠𝑠𝑠𝑠(𝑃𝑃 𝑎𝑎𝑎𝑎 𝑙𝑙𝑙𝑙𝑙𝑙𝑙𝑙𝑙𝑙 𝑖𝑖 + 1 )max (𝑠𝑠𝑠𝑠𝑠𝑠 𝑄𝑄 𝑎𝑎𝑎𝑎 𝑙𝑙𝑙𝑙𝑙𝑙𝑙𝑙𝑙𝑙 𝑖𝑖 , 𝑠𝑠𝑠𝑠𝑠𝑠(𝑄𝑄 𝑎𝑎𝑎𝑎 𝑙𝑙𝑙𝑙𝑙𝑙𝑙𝑙𝑙𝑙 𝑖𝑖 + 1 )
After this, every 𝑑𝑑 contains a set of associated possible recognition candidates 𝑘𝑘 from the signature database. Note that this set of possible associated recognitions could also be empty. In such a case, the corresponding 𝑑𝑑 could not be re-lated to a known signature. This could be caused for example by a detected edge which does not correspond to an appli-ance switching event, or by the non-existence of a corre-
Figure 9. Apparent power for a duty cycle of a Nintendo Wii (left). Resulting absolute differences in apparent power (middle) and with a filter of 2VA (right).
Figure 10. Application of mean/median filter to the original power signal.

sponding signature in the database that matches 𝑑𝑑 . Second, for each 𝑘𝑘 , a nearest neighbor match is performed over all potentially matching candidates 𝑑𝑑 that have been associated with 𝑘𝑘 . Finally, the algorithm labels the load profile with the corresponding device names.
V. ALGORITHM EVALUATION AND LIMITATIONS In order to analyze the performance of the AppliSense
algorithm, we installed the whole system in a laboratory en-vironment. For the evaluation, we used a controlled set of appliances which typically occur in a student’s household. Table II provides an overview of the appliances, their real power consumption stated on the manufacturer label, their verified real power range in operation (measured by a sepa-rate power monitor), the appliance category (O for ohmic, I for ohmic-inductive, and C for ohmic-capacitive), and the real power that is obtained as part of the power signature using our smartphone application. All devices were connect-ed to the same phase over the whole evaluation. Some of the appliances have power consumptions within the same range. However, if belonging to different categories, we should still be able to differentiate the corresponding events.
TABLE II. APPLIANCES USED FOR ALGORITHM EVALUATION
Appliance Labeled Power Power Range Category Consump-
tion Light bulb 75W 70W O 70W Kettle 2200W 1855 – 1933W O 1900W Heater 2000W 1619 – 1667W O 1635W CD player 13W 9 – 13W I 3W Fan 50W 45W I 45W Notebook 72W 30 – 35W C 35WFluorescent lamp 35W 21 – 28W C 25W
Wii 52W 10 – 45W C 15W During times when only a single appliance was active,
the algorithm identified the on/off events of all devices ex-cept the CD player correctly. Every device was turned on and off at least three times. The edges caused by the CD player were not recognized neither when being turned on nor when being turned off. This can be explained through the limitations introduced by the filtering. Using a window size of 5 samples in our test scenario leads to a lower boundary of 10VA for edges that can be recognized. The CD player has a relatively high standby consumption of 6W compared to its 3 – 7W in operation. While the median filter does not influ-ence the signal, the constant 3W during operation result in a
step-wise increase of 0.6VA after the application of the mean filter. This increase is too small (<<2VA) to be detected as an event using the chosen median/mean filter.
Next, we combined the use of multiple devices in a ran-dom order. Although the CD player cannot be recognized, we operated it and other devices with unknown signatures from time to time to vary the base line consumption and to have more appliances concurrently running. Over a time span of several hours, we documented 80 switching events of which 77 were identified correctly.
Figure 12 shows a sample labeling output of the algo-rithm (for a simulated office environment). After the note-book has been turned on, different devices were concurrently used and a kettle was operated. However, the red circle high-lights a moment at which the office lamp is turned on but the event is not detected. This is due to the oscillations caused by a device that was operating at the same time. A second prob-lem (not depicted) occurred when operating the notebook. Due to the different battery levels, the power consumption had varied compared to the one registered in the appliance signature database. This led to the correct identification of the edge, but no appliance signature could be matched to the detected event.
These two examples outline limitations of the current im-plementation. Oscillations caused by operating devices can mask the consumption, especially of low power drawing ap-pliances. This could in particular be a problem in larger households (e.g., family houses) with lots of appliances and activity. In addition, the algorithm cannot detect devices that do not have well-defined operation states but have a continu-ously changing consumption. This is due to the initial as-sumptions regarding the algorithm design and the tradeoff for relying on a single sensor system with a 1Hz sampling frequency. In the conducted laboratory study we observed that the appliance signatures recorded with the smartphone application were very reliable. That is, the delta vectors ob-tained with the measurement function when turning an appli-ance on/off are stable and reproducible over time. However, this may be different in a more dynamic home environment – there the algorithm may need several (slightly different) sig-natures per device to reliably recognize appliances.
Overall, the evaluation shows promising results. We gen-erated 144 device-switching events in our test scenario. 16 of these came from devices with a consumption so small that
Figure 12. Labeled load curve as output of the AppliSense algorithm.
Figure 11. Device recognition: Comparing a detected power edge to a known signature in the Euclidian dQ/dP space.

the filter canceled out the corresponding edges. When sub-tracting these events, the algorithm identified 125 out of the remaining 128 events correctly, which results in an overall recognition rate of about 90%. In practice this enables inter-esting applications, such as automated recommendations for a more economic use of electricity in households.
VI. CONCLUSIONS AND FUTURE WORK We gave a detailed description and evaluation of a system
that facilitates automatic recognition of switching events of electric appliances. In contrast to other existing approaches, our objective was to develop a system that achieves this by being unobtrusively integrated in users’ life and without re-quiring a complex system setup or training. We achieved this by interconnecting components that are becoming ubiquitous in home environments: a smart meter and a smartphone. The signature database is established over time and also allows introducing new devices, which is important in a fast chang-ing home environment. In particular, we achieve this as a side effect of a smartphone application, which much simpli-fies the appliance signature acquisition for users.
Applying data analytics to the gathered metering data al-lows the system to raise energy awareness by providing bet-ter-tailored energy feedback without the need for special purposed hardware. In combination with actuation capabili-ties, we can foresee this information to be used to automati-cally optimize energy consumption and hence increase resi-dential energy efficiency. Not least, appliance-level con-sumption information can give rise to new business models (e.g., providing cross-selling offers for non-energy-efficient devices). With a recognition rate of about 90% the results of our evaluation study confirm the suitability of the general scheme and encourage us to intensify further research.
Future work consists of deploying the system in various households to gather real-world data that allows for more in-depth evaluation of AppliSense. Based on these experiences, we plan to analyze the algorithm’s dependency on the num-ber of manually recorded signatures and to implement rele-vant refinements. This also includes accuracy improvements through the extension from one to three phases (which helps in case two appliances are turned on/off at the same time) and a module for auto-identification of hard-wired heating and cooling devices. In order to deal with edges detected in the load curve that do not yet correspond to an existing sig-nature in the database, we focus on the application of cluster-ing concepts that automatically classify these events (and once a certain probability is reached, verify the match by pushing a notification to the user interface). We also envision the possibility to upload appliance signatures to a community platform [18]. In the long term, we would like to investigate the possibility of building a larger appliance signature base. In addition, we are considering methods to derive occupancy state from electricity and appliance use data, in order to use this information in a smart heating control strategy [20].
ACKNOWLEDGEMENTS The authors would like to thank the anonymous review-
ers, our industry partners Landis + Gyr and EWZ as well as
David Abdurachmanov, Christian Floerkemeier, Daniel Liv-engood, and Verena Tiefenbeck for their help.
REFERENCES [1] Mattern, F., Staake, T., and Weiss, M. ICT for Green – How Compu-
ters Can Help Us to Conserve Energy. In Proc. e-Energy2010, ACM, 2010.
[2] Weiss, M., Graml, T., Staake, T., Mattern, F., and Fleisch, E. Handy feedback: Connecting smart meters with mobile phones. In Proc. MUM09, ACM, 2009.
[3] Hart, G.W. Nonintrusive appliance load monitoring. Proc. of the IEEE, 80(12):1870-1891, 1992.
[4] Norford, L.K. and Leeb, S.B. Non-intrusive electrical load monitoring in commercial buildings based on steady-state and transient load-detection algorithms. Energy and Buildings, 24(1): 51-64, 1996.
[5] Laughman, C. Power signature analysis. IEEE Power and Energy Magazine, 1(2):56-63, 2003.
[6] Cole, A. and Albicki, A. Data extraction for effective non-intrusive identification of residential power loads. In Proc. Instrumentation and Measurement Technology Conference, IMTC/98, 1998.
[7] Powers, B.S.J. and Margossian, B. Using a rule-based algorithm to disaggregate end-use load profiles from premise-level data. Trans. IEEE Computer Applications in Power, 4(2):42-47, 1991.
[8] Prudenzi, A. A neuron nets based procedure for identifying domestic appliances pattern-of-use from energy recordings at meter panel. In Proc. IEEE Power Engineering Society Winter Meeting, 2002.
[9] Ruzzelli, A.G., Nicolas, C., Schoofs, A., and O’Hare, G.M.P. Real-Time Recognition and Profiling of Appliances through a Single Electricity Sensor. In Proc. SECON 2010, 2010.
[10] Marceau, M.L. and Zmeureanu, R. Nonintrusive load disaggregation computer program to estimate the energy consumption of major end uses in residential buildings. Energy Conversion and Management, 41(1):1389-1403, 2000.
[11] Farinaccio, R.Z.L. Using a pattern recognition approach to disaggregate the total electricity consumption in a house into the major end-uses. Energy and Buildings, 30(3):245-259, 1999.
[12] Lam, H., Fung, G., and Lee, W. A Novel Method to Construct Taxonomy Electrical Appliances Based on Load Signatures. IEEE Trans. Consumer Electronics, 53(2):653-660, 2007.
[13] Srinivasan, D., Ng, W.S., and Liew, A.C. Neural-Network-Based Signature Recognition for Harmonic Source Identification. IEEE Transactions on Power Delivery, 21(1):398-405, 2006.
[14] Kolter, Z., Batra, S., and Ng, A.Y. Energy Disaggregation via Discriminative Sparse Coding. In Proc. Neural Information Processing Systems 2010.
[15] Patel, S., Robertson, T., Kientz, J., Reynolds, M., and Abowd, G. At the Flick of a Switch: Detecting and Classifying Unique Electrical Events on the Residential Power Line. In Proc. Ubicomp07, 2007.
[16] Gupta, S., Reynolds, M.S., and Patel, S.N. ElectriSense: Single-Point Sensing Using EMI for Electrical Event Detection and Classification in the Home. In Proc. UbiComp2010, 2010.
[17] Guinard, D., Trifa, V., Mattern, F., and Wilde, E. From the Internet of Things to the Web of Things: Resource Oriented Architecture and Best Practices. In: Dieter Uckelmann, Mark Harrison, Florian Michahelles: Architecting the Internet of Things. Springer, 2011.
[18] Weiss, M., Staake, T., Mattern, F., and Fleisch, E. PowerPedia – Changing Energy Usage with the Help of a Community-based Smartphone Application. Journal of Pervasive and Ubiquitous Computing, 2012.
[19] Schucany, W.R. Kernel smoothers: an overview of curve estimators for the first graduate course in nonparametric statistics. Statistical Science, 19(4):663-675, 2004.
[20] Kleiminger, W., Santini, S., and Weiss, M. Opportunistic Sensing for Smart Heating Control in Private Households. In Proc. CONET 2011.