leveraging our strengths - annualreports.com · advanced materials and related services. we provide...
TRANSCRIPT

L E V E R A G I N G O U R S T R E N G T H S
MATERION
2013
Annual
Report
ABOUT THE COMPANYMaterion Corporation is a leading global producer of highly engineered
advanced materials and related services. We provide solutions for customers in a range of technology-driven markets including consumer electronics, industrialcomponents and commercial aerospace, automotive electronics, defense and science, medical, energy, telecommunications infrastructure and appliance.
Founded in 1931, the Company today serves customers in more than 50countries with operating, service center and major office locations throughoutNorth America, Europe and Asia. We employ more than 2,600 people. Ourcommon stock (ticker symbol: MTRN) is listed on the New York Stock Exchange.
CONTENTSInside front About the Company
01 Financial Highlights
02Letter to Shareholders
06Leveraging our Strengths
18Operating Summary and Shareholder Returns
192013 Form 10-K
118Directors, Officers and Facilities
Inside backCorporate Data
ABOUT THE COVER: We took actions last year to reduce our cost baseand heighten our focus on promising market opportunities. We are leveragingour strengths across products, markets and geographies.

� 44% Advanced Material Technologies � 39% Performance Alloys� 10% Beryllium and Composites � 7% Technical Materials
VALUE-ADDED SALES* BY SEGMENT
� 27% Consumer Electronics� 18% Industrial Components and Commercial Aerospace� 11% Automotive Electronics� 10% Defense and Science� 10% Medical� 8% Energy� 6% Telecommunications Infrastructure� 1% Appliance� 9% Other
VALUE-ADDED SALES*BY MARKET
1
2012
$ 1,273.1
615.6
24.7
1.19
2011
$ 1,526.7
646.5
40.0
1.93
(Millions except per share amounts)
Sales . . . . . . . . . . . . . . . . . . . . . . . . . . . . . .
Value-added sales* . . . . . . . . . . . . . . . . . . .
Net income . . . . . . . . . . . . . . . . . . . . . . . .
Net income per share, diluted . . . . . . . .
2013
$ 1,166.9
609.1
19.7
0.94
FINANCIAL
HIGHLIGHTS
*Value-added sales is a non-GAAP measure that deducts the value of the pass-through metals sold from sales. See reconciliation on page 35.

Without question, 2013 was a difficult andchallenging year. But Materion emerged
a stronger company, well positioned for profitablegrowth in 2014 and beyond. We are leveraging our strengths to take full advantage of present andfuture opportunities while reducing costs and improving operations.
Last year we faced headwinds from a weakmacroeconomic environment, the U.S. govern-ment’s budget sequestration, the collapse in goldprices and an uneven ramp-up of our primaryberyllium plant. We had to make some tough decisions and take strong actions in our AdvancedMaterial Technologies segment to lower costs and better align employment levels with businessconditions.
Beginning in late 2012, we closed our facilitiesin Newburyport, Massachusetts and the CzechRepublic and moved equipment and productmanufacturing to other locations. This includedrelocating our electronics packaging productionto Singapore to be close to the core customer base.In 2013, we consolidated facilities in Albuquerque,New Mexico, eliminating low-margin products andshifting wire and other product manufacturing
to Wheatfield, New York. We also restructured ourPrecision Optics business in Buellton, California,Westford, Massachusetts and Shanghai.
Overall, these actions are expected to favorablyimpact 2014 results by up to $0.30 per share andexpand operating profit margins in the range of100 to 150 basis points.
2013 ResultsSales for 2013 were $1.17 billion compared
with $1.27 billion in 2012. Value-added sales, anon-GAAP measure that excludes pass-throughmetals, were $609.1 million, compared with value-added sales of $615.6 million in 2012.
Net income for 2013 was $19.7 million, or$0.94 per share, diluted, compared with $24.7million, or $1.19 per diluted share, in 2012. The2013 results included a charge of $0.16 per sharerelated to the facility and product line rationaliza-tions. The decline in net income and earnings pershare was due to a combination of lower sales,weaker product mix, lower manufacturing yields,pricing pressure on precious metal products andservices, and an extended maintenance outage atour Elmore, Ohio facility.
2
TO OUR
SHAREHOLDERS

Cash flow from operations was $75.9 millioncompared with $38.6 million for 2012. Our balance sheet remains strong, with a year-enddebt to total capitalization ratio of 12%. Betweencash on hand and the availability under our revolving credit agreement, which stood at $185.0million at year end, we have more than adequateliquidity to support our growth initiatives, ourdividend, initiated in May 2012, and our sharerepurchase plan.
In the second quarter of 2013, we announced a 7% dividend increase, bringing the quarterly dividend to $0.08 per share. Reinforcing ourconfidence in the Company’s ability togenerate significant free cash flow,the Board of Directors in January2014 approved an authorizationto repurchase up to $50 millionof the Company’s commonstock. This authorization replaces the previous repurchaseauthorization of one millionshares, of which approximately600,000 shares were repurchased.
Markets Review Market conditions varied considerably
across our businesses last year. Our largest market,consumer electronics, saw a 3% sales declinecompared with 2012 on a value-added sales basis.While total value-added sales were down, ship-ments of advanced chemicals for LED lighting applications and copper-based alloys for other applications grew.
Value-added sales to the commercial aerospacemarket were 9% higher than in 2012, reflecting increased penetration in a growing market. Manu-facturers, recognizing the properties of ToughMet®as a lighter, higher-strength alternative, are nowusing more of this alloy to build lighter aircraftcomponents to increase energy efficiency. Across commercial aerospace and other markets combined,we had record ToughMet sales in 2013.
Sales of industrial components on a value-addedbasis were down 7% from 2012, due to declines inindustrial applications.
Value-added sales to the defense and science market declined 6% compared to 2012due to government spending cutbacks and shipment delays.
Medical market sales increased 11% on avalue-added basis, as we saw growth in both ourblood glucose test strip and nuclear medicine businesses. The demand for blood glucose teststrips has increased globally due to the spread of
diabetes and the broader reach of healthcare systems to treat the disease. We support
the development, manufacture and supply of these highly
accurate test strips, and in 2013,not only did we gain additionalmarket share in this business, butwe also developed additional
applications for this technologythat will support further growth.
Meanwhile, our nuclear medicinebusiness, which supplies beryllium
components to isotope reactors, also improvedfrom the uptick in both new reactor builds andretrofitted installations.
Automotive electronics value-added sales improved at nearly 13% compared to 2012 due to improved market conditions and new application development.
Energy market value-added sales grew 5%compared with 2012, due mainly to higher shipments to the oil and gas sector.
Telecommunications infrastructure value-added sales were down 4% versus 2012. This wasdue, in part, to customer delays on several majorundersea fiber-optic cable projects.
Strong New Product Pipeline Our new product pipeline is as full and strong
as it has been since I joined Materion. We expectnew products to generate more than half our
3
We expect new products to
generate more than
50%of our growth
in 2014.

growth in 2014 and account for 6% of our totalvalue-added sales in 2014, on the way to our goalof a 10% contribution. Promising new products,many of which are now in production, include:
• Specialized optical filters for consumer electronics gesture control systems
• New wafer chucks used in semiconductormanufacturing
• New medical test strip materials• High-purity materials for organic light-
emitting diodes used in electronic displays• Clad metal products and materials for
lithium-ion batteries used in hybrid and electric automobiles and as back-up powerfor telecommunications base stations
• New forms of ToughMet that extend thereach and accuracy of drilling tools in the oil and gas industry
• A lightweight connecting rod made from our SupremEX® aluminum composite material for high-performance automotiveand racing engines
• A new AlBeCast® product line providing aluminum beryllium investment cast prototypes and finished parts to customers
Capital Investments In addition to developing new products, we are
also supporting our growth platforms with invest-ments in added capacity and enhanced capabilities.
A new $3.1 million wafer-level optics coatingfacility is ramping up in Westford to manufacturelow-defect coatings in high volume for infraredapplications in the defense, commercial and consumer electronics markets. The 3,000-square-foot facility with its class 1000 cleanroom and expanded capacity to 25,000 wafers per year puts usat the forefront of the infrared imaging industry’stransition to semiconductor-type, wafer-level manufacturing.
Additionally, we recently began production at Westford’s new $1.5 million large area optics facility. This is one of just a few facilities in theworld capable of manufacturing high-performanceand precision optical interference filters in sizesmuch larger than previously available for the globalastronomy and space market.
To meet rapidly rising demand for LED phosphor materials, we have significantly enhancedproduction capacity and improved process and engineering controls with an upgrade at our Milwaukee, Wisconsin facility.
Last year we invested $2 million at our Lorain,Ohio, plant, to effectively double casting capacityfor production of ToughMet and other non-beryllium, high-performance alloys.
We are expanding capabilities and capacity at our Reading, Pennsylvania, plant with a $1.1 million process and equipment upgrade to meet electronics industry demand for ultra-thin
4
$150
$100
$50
$200
$250
$0
$188$199$215
GROSS MARGIN
(Millions)
1311 12
$20
$40
$60
$0
$27$37$57
OPERATING PROFIT
(Millions)
1311 12
VALUE-ADDED SALES*(Millions)
$609
13
$647
11
$616
12
$200
$400
$600
$800
$0
*Value-added sales is a non-GAAP measure that deducts the value of the pass-through metals sold from sales.

$5 million of savings in 2013, and we anticipateadditional savings in 2014 as we advance toward a best-in-class sourcing organization.
On the marketing side, we are conductingcross-company Materion presentations to designand materials engineers at leading global companieswhere we are already doing business but believe wecan do much more. The results, thus far, have beenvery encouraging.
Despite the weak global economy over the last two years, I am confident that our macro-growth thesis remains fully intact and our focus on fast-growing niches in high-growth marketsis on target. With our new products, strategic investments, and cost reduction and margin improvement initiatives, we are poised for a significant improvement in our results.
In closing, I would like to thank our 2,600 employees for their dedication and hard work. We also thank our customers for their business andour suppliers for their partnership. And we extendour appreciation to you, our fellow shareholders,for your investment and confidence in Materion.
5
Richard J. HippleChairman, President and Chief Executive Officer
EARNINGS BEFORE INTEREST, TAXES, DEPRECIATION AND AMORTIZATION (EBITDA)*
(Millions)
$69
13
$101
11
$74
12
$40
$80
$120
$0
NET CASH PROVIDED FROM
OPERATING ACTIVITIES(Millions)
$76
13
$57
11
$39
12
$40
$20
$60
$80
$0
DEBT-TO-DEBT-PLUS-EQUITY
12%
13
17%
11
19%
12
15%
10%
5%
20%
0%
gauge copper alloy strip down to 0.015 of an inch.The upgrades will significantly improve gauge tolerance consistency.
We continue to invest in our mine and processing plant in western Utah to increase capacity to produce beryllium hydroxide using the mine’s bertrandite ore reserves. This is one of several actions we have taken to position theCompany to respond to the anticipated decreasein global supplies of beryllium and capitalize onour unrivaled mine-to-mill production breadth.
Directors During 2013, John Sherwin, Jr. and William
R. Robertson retired from the board upon the completion of their terms. Jack had been a member of our Board since 1981 and served asLead Director. Bill joined our Board in 1997. Ipersonally would like thank them both for theirservice and counsel, and wish them well upontheir future endeavors.
One Materion In addition to new product development and
capital spending, we are also leveraging the powerof One Materion. Our investment in common financial systems is enabling better decision makingin production planning, procurement, pricing and sales forecasting. For example, our global procurement transformation delivered more than
*A non-GAAP measure used as an indicator of cash generation,EBITDA is operating profit plus depreciation and amortization.

LEVERAGING OUR STRENGTHS IN
CONSUMERELECTRONICS
Demand for AMOLED materials
is forecast to increase by nearly
27%to $445 million in 2014.
Source: IHS Inc.
Our advanced materials help electronics designers push the limits of their applications and raise the bar on end-product quality and performance.

7
Materion has a strong and expanding base in consumer electronics.
Smartphones and tablets use our ultra-thin gauge alloys to
improve camera performance. Our precious and non-precious metals
are used in radio frequency filters and amplifiers that enable wireless
communications and are deposited as thin film materials in the produc-
tion of semiconductor-based devices of all types. We are the leading
provider to LED lighting manufacturers of inorganic phosphor precursor
materials that deliver the full spectrum of visible light to LED lamps. Last
year we introduced three copper-nickel-tin thin gauge alloys and several
clad metal solutions for next-generation electronics devices. We also
established a base in gaming devices with our gesture control optical filters.
Other future growth targets include new solid-state storage technologies
and non-traditional applications for thermal imaging.
Advancing AMOLEDTechnology advances have outmoded backlit liquid
crystal displays (LCD) on mobile devices and created a surgein demand for active matrix organic light-emitting diode
(AMOLED) panels for mobile devices and televisions. Thinner,higher-resolution AMOLED panels offer richer color displays, reduced
power consumption and more options in display curvature and flexibility. Materion supplies high-puritysilver, aluminum and magnesium materials, which are essential to AMOLED panels. Customers prizeour processing capabilities, quality assurance service and specialized materials.

LEVERAGING OUR STRENGTHS IN
COMMERCIAL AEROSPACE & INDUSTRIAL COMPONENTS
Shipments of ToughMet®
are expected to grow at a rate of
10%or greater through 2016.
Source: Materion
The high strength and superior wear resistance of ToughMet® alloys help make today’s new commercialairliners more fuel efficient and less costly to operate.

99
Materion has supplied copper beryllium alloys to the aerospace
industry for decades. But over the past ten years, our commercial
aerospace sales have taken off following the introduction of ToughMet®,
our premium copper-nickel-tin alloy. Original equipment makers and
operators count on ToughMet for its extraordinary strength, lubricity
and wear resistance even under extreme load conditions. Today we are
on almost every commercial aircraft in production, including significant
content on the Boeing 787 and 747-800, Airbus A380 and the newly
designed A350 XWB. As aircraft production runs increase, ToughMet
will serve an even larger role. Beyond aerospace, ToughMet has won
converts in many demanding industrial applications. We look to further
penetrate these markets with a new line of lower-cost, thin-walled wrapped
bearings developed in collaboration with Bowman International Ltd., a U.K.
company. The BowMet® product line outperforms bearings made of steel,
bronze or other materials at an easily justifiable price premium.
Mines Shovel up Savings with ToughMet®
L&H Industrial, a world leader in rebuilding heavy mining equipment, is a strong proponent of ToughMet. Thealloy’s superior wear resistance in load roller bushings and
other applications translates into lower maintenance costs and valuable added uptime for its customers. In surface mining
shovels, the track assembly load roller bushings may need to support up to 3 million pounds of load. The company has shown
that bushings made from ToughMet are able to last more than 30,000hours – two to three times longer than the standard manganese bronze bushings. L&H is so confident in ToughMet that its warranty on the load roller bushings is 60 to 100% longer than its competitorsoffer. In a business where a shovel idled for a 36-to 48-hour maintenance cycle can cost $1 million or morein lost production, doubling the interval between cycles generates huge savings for mining operators.
Photo courtesy of L&H Industrial

10
By 2018,
50%of new light vehicles
will have intelligent battery management systems, up from 15% today.
Source:Vishay Intertechnology, Inc.
We are well positioned to benefit from the industry’s key drivers: safety, fuel efficiency, performance and connectivity.
LEVERAGING OUR STRENGTHS IN
AUTOMOTIVEELECTRONICS

11
The global market for automotive electronics is set to rise to
$240 billion by 2020, up more than 50% from 2010, according to
IHS Inc.Today a premium-class automobile contains 100 million lines
of software running on 70 to 100 microprocessor-based electronic
control units. Our alloys and clad composite materials ensure stable
electrical connections and rugged power supplies, and help reduce
costs through streamlined manufacturing, miniaturization and light-
weighting. Our display technologies and optical filters for dashboard
gesture control systems can help manage sensory workload and change
the way people interface with their vehicles, improving their overall
experience, safety and satisfaction.
Current-sensing Resistance AlloysBatteries are at the heart of the automotive electrification
initiative, enabling technologies that reduce weight and drive advances in fuel efficiency. With the ever-increasing demand placed on
batteries, intelligent battery management systems are rapidly becoming standard equipment to monitorthe charge and ensure energy is available to support critical functions – on conventional automobiles aswell as electric and hybrid vehicles. Materion is working with electronics components leader Vishay Intertechnology, Inc. to produce high-performance shunt resistors for this growing market. Utilizingprecision resistance alloys produced by Performance Alloys and electron beam welding at Technical Materials, we supply Vishay with performance materials that provide highly consistent and repeatableelectrical performance.

12
The global market for radioisotopes
is expected to grow at a CAGR of
18.3%from 2012 to 2018.
Source: Transparency Market Research
Medical scans use radioisotopes to diagnose many diseases. Our beryllium rods and reflectors are critical components in most of the test reactors that produce radioisotopes. A looming shortage of production capacity is increasing demand for our rods and reflectors.
LEVERAGING OUR STRENGTHS IN
BERYLLIUM

1313
Materion is the world's only mine-to-mill integrated beryllium
producer, a distinct advantage in the ability to continually
develop new products and applications. Our primary beryllium
plant in Ohio and newly expanded beryllium hydroxide processing
plant in Utah position us to respond to the expected decline in
alternative beryllium sources worldwide over the coming years. As
a pure metal – as well as downstream in alloy, metal matrix composite
or beryllia ceramic form – beryllium has unique properties that make
it a critical enabler of modern technologies in aerospace, defense,
energy exploration, the production of radioisotopes used to diagnose
and treat many diseases, and other applications. In many cases, no
suitable material substitute exists.
New AlBeCast® Product Line Following several casting technology breakthroughs, we
completed a state-of-the-art investment casting capability for our aluminum beryllium products last year. (Investment casting is a
versatile industrial process that allows the production of near net shape components with accuracy, repeatability and integrity.) The new AlBeCast® product line utilizesrapid prototyping and solidification modeling that enables short lead times and competitive pricing.Aluminum beryllium castings provide cost/benefit advantages for technically demanding customers in aerospace, defense and precision industrial equipment requiring a combination of ultra-lightweight,stiffness, mechanical stability and thermal properties. We are currently working with major defensecontractors and other commercial customers on qualification as an AlBeCast supplier.

1414
LEVERAGING OUR STRENGTHS IN
PRECISION OPTICS
The overall infrared imaging market is
expected to grow to $3.9 billion by 2017 at a
9.5%CAGR from 2012. Source: MarketsandMarkets
Our new wafer-level packaging facility not only positions us to continue to be a leader in the infrared camera market, but it also opens up new markets, customers and applications in other sectors.

1515
Materion Precision Optics has the reputation of being ahead of
the curve when it comes to new technology and high quality.
Several years ago we began preparing for a major shift from discrete
to wafer-level packaging that is arriving now to the thermal imaging
industry. We are meeting that demand with a new dedicated, high-
volume facility for low-defect, infrared wafer-level coatings. The 3,000-
square-foot class 1000 cleanroom is outfitted with the latest infrared
coating chambers and 3D photolithography equipment and includes
technical capabilities unmatched by our competition. Its semiconductor-
grade, state-of-the-art, precision patterning tool allows for the processing
of profiled wafers up to 200mm in diameter, a capability critical for the
success of this emerging new packaging technology.
Infrared Cameras Capture Energy SavingsIn recent years, infrared cameras have been used almost
exclusively in defense applications. However, the shift to wafer-levelprocessing is opening new opportunities for end-use manufacturers to
tighten assembly times, lower overall costs and build more compact devices. Based on these trends, industry analysts are forecasting rapid, wider growth in commercial applications suchas residential and commercial thermography, security/surveillance, automotive night vision and smart-phone add-ons for general consumer use. Materion’s ability to provide infrared detector manufacturerswith uniform low-defect wafers with more available devices per wafer will be critical to the industry’scommercial market success.

The global fiber-optic cable
market is forecast to grow at a CAGR of nearly
10%over the period
2012-2016. Source: Technavio
LEVERAGING OUR STRENGTHS IN
TELECOMINFRASTRUCTURE
Our specialty clad materials help make Saft’s new lithium-ion telecom battery systems an effective solution for this market. Reliable backup power is essential for wireless base stations anywhere, both in places like India,
where the power grid is unreliable, as well as in remote areas off the grid in any country.
17
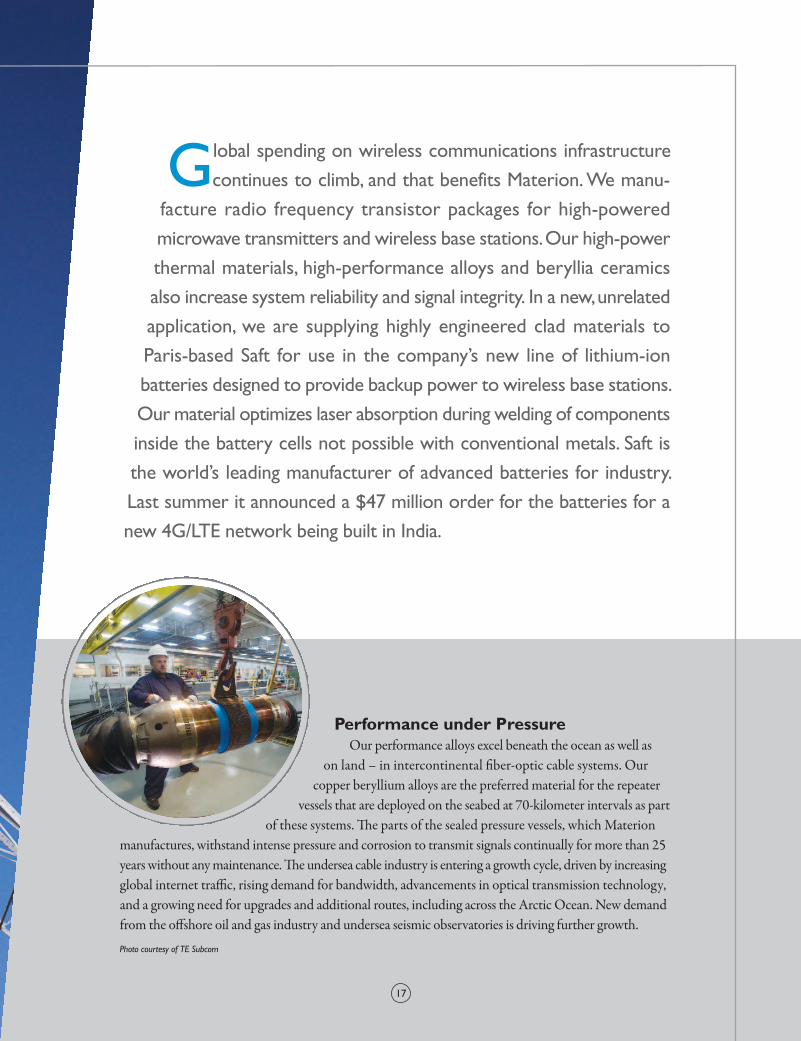
Global spending on wireless communications infrastructure
continues to climb, and that benefits Materion. We manu-
facture radio frequency transistor packages for high-powered
microwave transmitters and wireless base stations. Our high-power
thermal materials, high-performance alloys and beryllia ceramics
also increase system reliability and signal integrity. In a new, unrelated
application, we are supplying highly engineered clad materials to
Paris-based Saft for use in the company’s new line of lithium-ion
batteries designed to provide backup power to wireless base stations.
Our material optimizes laser absorption during welding of components
inside the battery cells not possible with conventional metals. Saft is
the world’s leading manufacturer of advanced batteries for industry.
Last summer it announced a $47 million order for the batteries for a
new 4G/LTE network being built in India.
Performance under PressureOur performance alloys excel beneath the ocean as well as
on land – in intercontinental fiber-optic cable systems. Our copper beryllium alloys are the preferred material for the repeater
vessels that are deployed on the seabed at 70-kilometer intervals as partof these systems. The parts of the sealed pressure vessels, which Materion
manufactures, withstand intense pressure and corrosion to transmit signals continually for more than 25years without any maintenance. The undersea cable industry is entering a growth cycle, driven by increasingglobal internet traffic, rising demand for bandwidth, advancements in optical transmission technology,and a growing need for upgrades and additional routes, including across the Arctic Ocean. New demandfrom the offshore oil and gas industry and undersea seismic observatories is driving further growth.
Photo courtesy of TE Subcom

18
OPERATING SUMMARY
The following graph sets forth the cumulative shareholder return on our common shares as compared to the cumulative total return of the S&P SmallCap 600 Index and the Russell 2000 Index. MaterionCorporation is a component company of the S&P SmallCap 600Index and the Russell 2000 Index.
Assumes that the value of our common shares and each index was $100 on December 31, 2007 and that all applicable dividends were reinvested.
For the Years Ended December 31,
*Return on invested capital = adjusted operating profit/(average debt + average equity – average cash)
2011
$ 1,526,730
57,078
54,266
39,979
56,806
(22,448)
(27,581)
(10,625)
$ 1.93
20,754
$ 24.28
19.56
12.3%
17%
3,015
2013
$ 1,166,882 26,831 23,795 19,707 75,922 0.0 (32,587) (36,172)
$ 0.94 20,895$ 30.85 22.18
6.3 % 12%
2,671
2012
$ 1,273,078
36,776
33,642
24,664
38,620
(3,894)
(39,469)
8,503
$ 1.19
20,679
$ 25.78
20.06
9.6%
19%
2,833
(Dollars in thousands except per share amounts)
Operating DataNet sales . . . . . . . . . . . . . . . . . . . . . . . . . . . . . . . . . . . . . . . . . . . . . . . . . Operating profit . . . . . . . . . . . . . . . . . . . . . . . . . . . . . . . . . . . . . . . . . . . Income before income taxes . . . . . . . . . . . . . . . . . . . . . . . . . . . . . . . . . . Net income . . . . . . . . . . . . . . . . . . . . . . . . . . . . . . . . . . . . . . . . . . . . . . . Net cash provided from operating activities . . . . . . . . . . . . . . . . . . . . . Net cash used for the purchase of businesses . . . . . . . . . . . . . . . . . . . . Net cash used in other investing activities . . . . . . . . . . . . . . . . . . . . . . . Net cash provided from (used in) financing activities . . . . . . . . . . . . . . .
Per Share DataEarnings per share, diluted . . . . . . . . . . . . . . . . . . . . . . . . . . . . . . . . . . . . Diluted shares outstanding (weighted-average, in thousands) . . . . . . . . Closing price of common shares . . . . . . . . . . . . . . . . . . . . . . . . . . . . . . . Book value per share, diluted . . . . . . . . . . . . . . . . . . . . . . . . . . . . . . . . .
RatiosReturn on invested capital*. . . . . . . . . . . . . . . . . . . . . . . . . . . . . . . . . . . Debt-to-debt-plus-equity . . . . . . . . . . . . . . . . . . . . . . . . . . . . . . . . . . . .
OtherNumber of employees . . . . . . . . . . . . . . . . . . . . . . . . . . . . . . . . . . . . . . .
Performance Comparison
2008 2009 2010 2011 2012 2013
Materion Corporation $34 $50 $104 $166 $170 $185
S&P SmallCap 600 $69 $87 $109 $110 $128 $182
Russell 2000 $66 $84 $107 $102 $119 $165
SHAREHOLDER RETURNS
$50
$100
$150
$200
$0
S&P SmallCap 600 Russell 2000 Materion Corporation
2008 2009 2010 2011 2012 2013

UNITED STATESSECURITIES AND EXCHANGE COMMISSION
Washington, D.C. 20549__________________________________
Form 10-K__________________________________
(Mark One)
ANNUAL REPORT PURSUANT TO SECTION 13 OR 15(d) OF THE SECURITIES EXCHANGE ACT OF 1934
For the Fiscal Year Ended December 31, 2013OR
TRANSITION REPORT PURSUANT TO SECTION 13 OR 15(d) OF THE SECURITIES EXCHANGE ACT OF 1934
For the Transition Period from to Commission File Number 1-15885
__________________________________
MATERION CORPORATION(Exact name of Registrant as specified in its charter)
Ohio 34-1919973(State or other jurisdiction of
incorporation or organization)(I.R.S. Employer
Identification No.)
6070 Parkland Blvd.,Mayfield Heights, Ohio 44124
(Address of principal executive offices) (Zip Code)
Registrant’s telephone number, including area code216-486-4200
Securities registered pursuant to Section 12(b) of the Act:
Title of Each Class Name of Each Exchange on Which Registered
Common Stock, no par value New York Stock ExchangeSecurities registered pursuant to Section 12(g) of the Act:
None____________________________________
Indicate by check mark if the registrant is a well-known seasoned issuer, as defined in Rule 405 of the Securities Act. Yes No Indicate by check mark if the registrant is not required to file reports pursuant to Section 13 or Section 15(d) of the Act. Yes No Indicate by check mark whether the registrant (1) has filed all reports required to be filed by Section 13 or 15(d) of the Securities Exchange Act of
1934 during the preceding 12 months (or for such shorter period that the registrant was required to file such reports), and (2) has been subject to such filing requirements for the past 90 days. Yes No
Indicate by check mark whether the registrant has submitted electronically and posted on its corporate Web site, if any, every Interactive Data File required to be submitted and posted pursuant to Rule 405 of Regulation S-T (§ 232.405 of this chapter) during the preceding 12 months (or for such shorter period that the registrant was required to submit and post such files). Yes No
Indicate by check mark if disclosure of delinquent filers pursuant to Item 405 of Regulation S-K (§ 229.405 of this chapter) is not contained herein, and will not be contained, to the best of registrant’s knowledge, in definitive proxy or information statements incorporated by reference in Part III of this Form 10-K or any amendment to this Form 10-K.
Indicate by check mark whether the registrant is a large accelerated filer, an accelerated filer, a non-accelerated filer, or a smaller reporting company. See the definitions of “large accelerated filer,” “accelerated filer” and “smaller reporting company” in Rule 12b-2 of the Exchange Act. (Check one):
Large accelerated filer Accelerated filer
Non-accelerated filer (Do not check if a smaller reporting company) Smaller reporting company
Indicate by check mark whether the registrant is a shell company (as defined in Rule 12b-2 of the Act). Yes No The aggregate market value of common shares, no par value, held by non-affiliates of the registrant (based upon the closing sale price on the New
York Stock Exchange) on June 28, 2013 was $557,659,759.As of February 21, 2014, there were 20,595,691 common shares, no par value, outstanding.
DOCUMENTS INCORPORATED BY REFERENCEPortions of the proxy statement for the annual meeting of shareholders to be held on May 7, 2014 are incorporated by reference into Part III.

MATERION CORPORATION
Index to Annual Report On Form 10-K for
Year Ended December 31, 2013
Item 1.Item 1A.Item 1B.Item 2.Item 3.Item 4.
Item 5.
Item 6.Item 7.Item 7A.Item 8.Item 9.Item 9A.Item 9B.
Item 10.Item 11.Item 12.Item 13.Item 14.
Item 15.
PART IBusiness........................................................................................................................................................... 2Risk Factors ..................................................................................................................................................... 8Unresolved Staff Comments............................................................................................................................ 16Properties......................................................................................................................................................... 17Legal Proceedings ........................................................................................................................................... 18Mine Safety Disclosures.................................................................................................................................. 18
PART IIMarket for Registrant’s Common Equity, Related Stockholder Matters and Issuer Purchases of Equity Securities ......................................................................................................................................................... 19Selected Financial Data ................................................................................................................................... 21Management’s Discussion and Analysis of Financial Condition and Results of Operations.......................... 22Quantitative and Qualitative Disclosures About Market Risk ........................................................................ 48Financial Statements and Supplementary Data ............................................................................................... 50Changes in and Disagreements with Accountants on Accounting and Financial Disclosure.......................... 87Controls and Procedures.................................................................................................................................. 87Other Information............................................................................................................................................ 87
PART IIIDirectors, Executive Officers and Corporate Governance .............................................................................. 88Executive Compensation ................................................................................................................................. 88Security Ownership of Certain Beneficial Owners and Management and Related Stockholder Matters ....... 89Certain Relationships and Related Transactions, and Director Independence ................................................ 89Principal Accountant Fees and Services.......................................................................................................... 89
PART IVExhibits and Financial Statement Schedules................................................................................................... 90Signatures ........................................................................................................................................................ 96

1
Forward-looking Statements
Portions of the narrative set forth in this document that are not statements of historical or current facts are forward-looking statements. Our actual future performance may materially differ from that contemplated by the forward-looking statements as a result of a variety of factors. These factors include, in addition to those mentioned elsewhere herein:
• Actual sales, operating rates and margins for 2014;• Our ability to strengthen our internal control over financial reporting and disclosure controls and procedures, particularly
in light of the matters disclosed in the Current Report on Form 8-K that was filed on February 26, 2014;• The finalization of our review of the procedural error in our physical inventory count in 2013, including the determination
of the impact on affected periods;• Uncertainties relating to the fourth quarter 2012 physical inventory and possible theft at our Albuquerque, New Mexico
facility, including (i) the costs and outcome of our investigations and (ii) the timing and amount, if any, of any insurance proceeds that we might receive;
• The global economy;• The impact of the U.S. Federal Government shutdowns and sequestrations;• The condition of the markets which we serve, whether defined geographically or by segment, with the major market
segments being: consumer electronics, industrial components and commercial aerospace, automotive electronics, defense and science, medical, energy, telecommunications infrastructure and appliance;
• Changes in product mix and the financial condition of customers;• Our success in developing and introducing new products and new product ramp-up rates;• Our success in passing through the costs of raw materials to customers or otherwise mitigating fluctuating prices for those
materials, including the impact of fluctuating prices on inventory values;• Our success in integrating acquired businesses;• The impact of the results of acquisitions on our ability to achieve fully the strategic and financial objectives related to
these acquisitions;• Our success in completing the announced facility consolidations and the product line rationalizations and achieving the
expected benefits;• Our success in implementing our strategic plans and the timely and successful completion and start-up of any capital
projects, including the beryllium pebble plant in Elmore, Ohio;• The availability of adequate lines of credit and the associated interest rates;• Other financial factors, including the cost and availability of raw materials (both base and precious metals), physical
inventory valuations, metal financing fees, tax rates, exchange rates, pension costs and required cash contributions and other employee benefit costs, energy costs, regulatory compliance costs, the cost and availability of insurance, and the impact of the Company's stock price on the cost of incentive compensation plans;
• The uncertainties related to the impact of war, terrorist activities and acts of God;• Changes in government regulatory requirements and the enactment of new legislation that impacts our obligations and
operations;• The conclusion of pending litigation matters in accordance with our expectation that there will be no material adverse
effects;• The timing and ability to achieve further efficiencies and synergies resulting from our name change and product line
alignment under the Materion name and Materion brand; and• The risk factors set forth elsewhere in Item 1A of this Form 10-K.

2
Item 1. BUSINESS
Materion Corporation, through its wholly owned subsidiaries, is an integrated producer of high performance advanced engineered materials used in a variety of electrical, electronic, thermal and structural applications. Our products are sold into numerous markets, including consumer electronics, defense and science, industrial components and commercial aerospace, automotive electronics, telecommunications infrastructure, energy, medical and appliance. As of December 31, 2013, we had 2,671 employees.
The Company, through its subsidiaries, has operations in the United States, Europe and Asia. The Company has four reportable segments: Advanced Material Technologies, Performance Alloys, Beryllium and Composites and Technical Materials.
All Other includes our parent company expenses, other corporate charges and the operating results of Materion Services Inc., a wholly owned subsidiary that provides administrative and financial oversight services to our other businesses on a cost-plus basis. Corporate employees not included in a reportable segment totaled 121 as of December 31, 2013.
The cost of gold, silver, platinum, palladium and copper can be quite volatile. The Company's pricing policy is to directly pass the cost of these metals on to the customer in order to mitigate the impact of metal price volatility on the results from operations. Trends and comparisons of sales are affected by movements in the market prices of these metals, but changes in sales due to metal price movements may not directly impact our profitability.
Internally, management reviews sales on a value-added basis. Value-added sales is a non-GAAP measure that deducts the value of the pass-through metals sold from sales. Value-added sales allows management to assess the impact of differences in sales between periods, segments or markets and analyze the resulting margins and profitability without the distortion of the movements in the pass-through metal values. The dollar amount of gross margin and operating profit is not affected by the value-added sales calculation. The Company sells other metals and materials that are not considered direct pass-throughs and their costs are not deducted from sales when calculating value-added sales.
Beginning with the first quarter of 2013, the Company reported value-added sales and margins externally. By presenting information on sales and value-added sales, it is the Company's intention to allow users of its financial statements to review sales with and without the impact of the pass-through metals. See "Management's Discussion and Analysis of Financial Condition and Results of Operations" for a reconciliation of sales to value-added sales.
We use our Investor Relations web site, http://materion.com, as a channel for routine distribution of important information, including news releases, analyst presentations and financial information. We post filings as soon as reasonably practicable after they are electronically filed with, or furnished to, the SEC, including our annual, quarterly, and current reports on Forms 10-K, 10-Q, and 8-K; our proxy statements; and any amendments to those reports or statements. All such postings and filings are available on our Investor Relations web site. In addition, this web site allows investors and other interested persons to sign up to automatically receive e-mail alerts when we post press releases and financial information on our web site. The SEC also maintains a web site, www.sec.gov, that contains reports, proxy and information statements, and other information regarding issuers who file electronically with the SEC. The content on any web site referred to in this Form 10-K is not incorporated by reference into this Form 10-K unless expressly noted.
ADVANCED MATERIAL TECHNOLOGIES
Sales for this segment were $744.2 million, or 64% of total sales, in 2013; $847.8 million, or 66% of total sales, in 2012 and $1,051.8 million, or 69% of total sales, in 2011. Value-added sales were $270.0 million, or 44% of total value-added sales, in 2013; $278.5 million, or 45% of total value-added sales, in 2012 and $278.0 million, or 43% of total value-added sales, in 2011. As of December 31, 2013, Advanced Material Technologies had 1,216 employees.
Advanced Material Technologies manufactures precious, non-precious and specialty metal products, including vapor deposition targets, frame lid assemblies, clad and precious metal preforms, high temperature braze materials, ultra-fine wire, advanced chemicals, optics, performance coatings and microelectronic packages. These products are used in wireless, semiconductor, photonic, hybrid and other microelectronic applications within the consumer electronics and telecommunications infrastructure markets. Other key markets for these products include medical, defense and science, energy, and industrial components. Advanced Material Technologies also has metal cleaning operations and in-house refineries that allow for the reclaim of precious metals from internally generated or customers’ scrap.
Advanced Material Technologies’ products are sold directly from its facilities throughout the U.S., Asia and Europe, as well as through direct sales offices and independent sales representatives throughout the world. Principal competition includes companies such as Eastman Chemical Company, Heraeus Inc., Honeywell International Inc., JDS Uniphase Corporation, Johnson

3
Matthey plc, Praxair, Inc., Saint-Gobain S.A., Solar Applied Materials Technology Corp., Sumitomo Metals Industries, Ltd., Tanaka Holding Co., Ltd., and a number of smaller regional and national suppliers.
Advanced Material Technologies — Sales and Backlog
The backlog of unshipped orders for Advanced Material Technologies as of December 31, 2013, 2012 and 2011 was $53.5 million, $54.3 million and $75.5 million, respectively. Backlog is generally represented by purchase orders that may be terminated under certain conditions. We expect that substantially all of our backlog of orders for this segment at December 31, 2013 will be filled during 2014.
Sales were made to over 3,000 customers in 2013. Government sales accounted for less than 1% of the sales volume in 2013, 2012 and 2011. Sales outside the United States, principally to Europe and Asia, accounted for approximately 22% of sales in 2013, 23% of sales in 2012 and 16% of sales in 2011. Other segment reporting and geographic information is contained in Note M to the Consolidated Financial Statements, which can be found in Item 8 of this Form 10-K and which is incorporated herein by reference.
Advanced Material Technologies — Research and Development
Active research and development programs seek new product compositions and designs as well as process innovations. Expenditures for research and development for Advanced Material Technologies amounted to $8.0 million in 2013 and 2012 and $6.7 million in 2011. A staff of 40 scientists, engineers and technicians was employed in this effort as of year-end 2013.
PERFORMANCE ALLOYS
Sales for this segment were $292.2 million, or 25% of total sales, in 2013; $292.4 million, or 23% of total sales, in 2012 and $335.3 million, or 22% of total sales, in 2011. Value-added sales were $235.2 million, or 39% of total value-added sales, in 2013; $231.6 million, or 38% of total value-added sales, in 2012 and $257.8 million, or 40% of total value-added sales, in 2011. As of December 31, 2013, Performance Alloys had 880 employees.
Performance Alloys manufactures and sells three main product families:
• Strip products, the largest of the product families, include thin gauge precision strip and thin diameter rod and wire. These copper and nickel alloys provide a combination of high conductivity, high reliability and formability for use as connectors, contacts, switches, relays, shielding and bearings. Major markets for strip products include consumer electronics, telecommunications infrastructure, automotive electronics, appliance and medical. Performance Alloys’ primary direct competitor in strip form beryllium alloys is NGK Insulators, Ltd. of Nagoya, Japan, with subsidiaries in the United States and Europe. Performance Alloys also competes with alloy systems manufactured by Global Brass and Copper, Inc., Wieland Electric, Inc., Stolberger Metallwerke GmbH, Nippon Mining, PMX Industries, Inc. and also with other generally less expensive materials, including phosphor bronze, stainless steel and other specialty copper and nickel alloys, which are produced by a variety of companies around the world;
• Bulk products are copper and nickel-based alloys manufactured in plate, rod, bar, tube and other customized forms that, depending upon the application, may provide superior strength, corrosion or wear resistance, thermal conductivity or lubricity. While the majority of bulk products contain beryllium, a growing portion of bulk products' sales is from non-beryllium-containing alloys as a result of product diversification efforts. Applications for bulk products include oil and gas drilling components, bearings, bushings, welding rods, plastic mold tooling and undersea telecommunications housing equipment. Major markets for bulk products include industrial components and commercial aerospace, energy and telecommunications infrastructure. In the area of bulk products, in addition to NGK Insulators, Ltd., Performance Alloys competes with several smaller regional producers such as International Beryllium Corp., Ningxia Orient Tantalum in China and LeBronze Industriel in Europe; and
• Beryllium hydroxide is produced at our milling operations in Utah from our bertrandite mine and purchased beryl ore. The hydroxide is used primarily as a raw material input for strip and bulk products and, to a lesser extent, by the Beryllium and Composites segment. Sales of beryllium hydroxide to NGK Insulators, Ltd. from the Utah operations were less than 4% of Performance Alloys’ total sales in each of the four most recent years.
Strip and bulk products are manufactured at facilities in Ohio and Pennsylvania and are distributed internationally through a network of company-owned service centers and outside distributors and agents.

4
Performance Alloys — Sales and Backlog
The backlog of unshipped orders for Performance Alloys as of December 31, 2013, 2012 and 2011 was $148.5 million, $73.8 million and $99.6 million, respectively. Backlog is generally represented by purchase orders that may be terminated under certain conditions. We expect that substantially all the backlog of orders for this segment as of December 31, 2013 will be filled during 2014.
Sales were made to over 2,000 customers in 2013. Performance Alloys did not have any sales to governments in 2013. Government sales in 2012 and 2011 accounted for less than 1% of segment sales. Sales outside the United States, principally to Europe and Asia, accounted for approximately 52% of sales in 2013, 54% of sales in 2012 and 51% of sales in 2011. Other segment reporting and geographic information is contained in Note M to the Consolidated Financial Statements, which can be found in Item 8 of this Form 10-K and which is incorporated herein by reference.
Performance Alloys — Research and Development
Active research and development programs seek new product compositions and designs as well as process innovations. Expenditures for research and development amounted to $2.6 million in 2013, $2.2 million in 2012 and $2.1 million in 2011. A staff of 10 scientists, engineers and technicians was employed in this effort as of year-end 2013.
BERYLLIUM AND COMPOSITES
Sales for this segment were $61.3 million, or 5% of total sales, in 2013; $60.0 million, or 5% of total sales, in 2012 and $60.6 million, or 4% of total sales, in 2011. Beryllium and Composites does not directly pass through changes in the costs of its materials sold, and, therefore, value-added sales are the same as sales. As of December 31, 2013, Beryllium and Composites had 265 employees.
Beryllium and Composites manufactures beryllium-based metals and beryllium and aluminum metal matrix composites (MMCs) in rod, sheet, foil and a variety of customized forms. These materials are used in applications that require high stiffness and/or low density, and they tend to be premium-priced due to their unique combination of properties. This segment also manufactures beryllia alumina ceramic products. Defense and science is the largest market for Beryllium and Composites, while other markets served include industrial components and commercial aerospace, medical, energy and telecommunications infrastructure. Products are also sold for acoustics, optical scanning and performance automotive applications. While Beryllium and Composites is the only domestic producer of metallic beryllium, it competes primarily with designs utilizing other materials including metals, MMCs and organic composites. Our aluminum powder metal MMCs compete with DWA Aluminum Composites and cast MMCs made by Duralcan USA. Electronic components utilizing beryllia and alumina ceramics are used in the telecommunications infrastructure, medical, industrial components and commercial aerospace and defense and science markets. Direct competitors include American Beryllia Inc., CBL Ceramics Limited and CoorsTek, Inc.
Manufacturing facilities for Beryllium and Composites are located in Ohio, California, Arizona and England.
Beryllium and Composites — Sales and Backlog
The backlog of unshipped orders for Beryllium and Composites as of December 31, 2013, 2012 and 2011 was $16.4 million, $20.5 million and $16.9 million, respectively. Backlog is generally represented by purchase orders that may be terminated under certain conditions. We expect that substantially all of our backlog of orders for this segment at December 31, 2013 will be filled during 2014.
Sales were made to over 300 customers in 2013. Direct government sales accounted for 2% of Beryllium and Composites’ sales in 2013, less than 2% in 2012 and less than 1% of sales in 2011. Sales outside the United States, principally to Europe and Asia, accounted for approximately 33% of sales in 2013, 31% of sales in 2012 and 28% of sales in 2011. Other segment reporting and geographic information is contained in Note M to the Consolidated Financial Statements, which can be found in Item 8 of this Form 10-K and which is incorporated herein by reference.
Beryllium and Composites — Research and Development
Active research and development programs seek new product compositions and designs as well as process innovations. Expenditures for research and development amounted to $2.8 million in 2013, $2.4 million in 2012 and $2.2 million in 2011. A staff of nine scientists, engineers and technicians was employed in this effort as of year-end 2013. Some research and development projects, expenditures for which are not material, were externally sponsored and funded.
5
TECHNICAL MATERIALS
Sales for this segment were $69.1 million, or 6% of total sales, in 2013; $72.7 million, or 6% of total sales, in 2012 and $78.7 million, or 5% of total sales, in 2011. Value-added sales were $42.6 million, or 7% of total value-added sales, in 2013; $45.4 million, or 7% of total value-added sales, in 2012 and $49.8 million, or 8% of total value-added sales, in 2011. As of December 31, 2013, Technical Materials had 189 employees.
Technical Materials' capabilities include clad inlay and overlay metals, precious and base metal electroplated systems, electron beam welded systems, contour profiled systems and solder-coated metal systems. These specialty strip metal products provide a variety of thermal, electrical or mechanical properties from a surface area or particular section of the material. Our cladding and plating capabilities allow for a precious metal or other base metal to be applied in continuous strip form only where it is needed, reducing the material cost to the customer as well as providing design flexibility and performance. Major applications for these products include connectors, contacts, power lead frames and semiconductors, while the largest markets are automotive electronics and consumer electronics. The energy and medical markets are smaller but offer further growth opportunities. Technical Materials' products are manufactured at our Lincoln, Rhode Island facility and are sold directly and through its sales representatives. Technical Materials' major competitors include Heraeus Inc., AMI Doduco, Inc. and other North American continuous strip plating companies.
Technical Materials — Sales and Backlog
The backlog of unshipped orders for Technical Materials as of December 31, 2013, 2012 and 2011 was $13.9 million, $17.6 million and $16.3 million, respectively. Backlog is generally represented by purchase orders that may be terminated under certain conditions. We expect that substantially all of our backlog of orders for this segment at December 31, 2013 will be filled during 2014.
Sales were made to over 200 customers in 2013. Technical Materials did not have any sales to the government for 2013, 2012 or 2011. Sales outside the United States, principally to Europe and Asia, accounted for approximately 25% of Technical Materials’ sales in 2013, 22% of sales in 2012 and 27% of sales in 2011. Other segment reporting and geographic information is contained in Note M to the Consolidated Financial Statements, which can be found in Item 8 of this Form 10-K and which is incorporated herein by reference.
Technical Materials — Research and Development
Active research and development programs seek new product compositions and designs as well as process innovations. Expenditures for research and development for Technical Materials were nominal in 2013, 2012 and 2011.
GENERAL
Availability of Raw Materials
The principal raw materials we use are aluminum, beryllium, cobalt, copper, gold, nickel, palladium, platinum, ruthenium, silver and tin. Ore reserve data can be found in Item 7 of this Form 10-K. The availability of these raw materials, as well as other materials used by us, is adequate and generally not dependent on any one supplier.
Patents and Licenses
We own patents, patent applications and licenses relating to certain of our products and processes. While our rights under the patents and licenses are of some importance to our operations, our business is not materially dependent on any one patent or license or on all of our patents and licenses as a group.
Regulatory Matters
We are subject to a variety of laws that regulate the manufacture, processing, use, handling, storage, transport, treatment, emission, release and disposal of substances and wastes used or generated in manufacturing. For decades we have operated our facilities under applicable standards of inplant and outplant emissions and releases. The inhalation of airborne beryllium particulate may present a health hazard to certain individuals.
Standards for exposure to beryllium are under review by the United States Occupational Safety and Health Administration (OSHA) and by other governmental and private standard-setting organizations. One result of these reviews will likely be more stringent worker safety standards. Some organizations, such as the California Occupational Health and Safety Administration and the American Conference of Governmental Industrial Hygienists, have adopted standards that are more stringent than the current standards of OSHA. The development, proposal or adoption of more stringent standards may affect the buying decisions by the

6
users of beryllium-containing products. If the standards are made more stringent and/or our customers or other downstream users decide to reduce their use of beryllium-containing products, our results of operations, liquidity and financial condition could be materially adversely affected. The impact of this potential adverse effect would depend on the nature and extent of the changes to the standards, the cost and ability to meet the new standards, the extent of any reduction in customer use and other factors. The magnitude of this potential adverse effect cannot be estimated.

7
Executive Officers of the Registrant
Name Age Positions and Offices
Richard J. Hipple 61 Chairman of the Board, President and Chief Executive Officer. In May 2006, Mr. Hipple was named Chairman of the Board and Chief Executive Officer of Materion Corporation. He had served as President since May 2005. He was Chief Operating Officer from May 2005 until May 2006. Mr. Hipple served as President of Performance Alloys from May 2002 until May 2005. He joined the Company in July 2001 as Vice President of Strip Products, Performance Alloys and served in that position until May 2002. Prior to joining Materion Corporation, Mr. Hipple was President of LTV Steel Company, a business unit of the LTV Corporation (integrated steel producer and metal fabricator). Prior to running LTV’s steel business, Mr. Hipple held numerous leadership positions in engineering, operations, strategic planning, sales and marketing and procurement since 1975 at LTV. Mr. Hipple has served on the Board of Directors of Ferro Corporation since 2007 and as its Lead Director since 2010. Mr. Hipple has served on the Board of Directors of KeyCorp since July 2012.
John D. Grampa 66 Senior Vice President Finance and Chief Financial Officer. Mr. Grampa was named Senior Vice President Finance and Chief Financial Officer in December 2006. Prior to that, he had served as Vice President Finance and Chief Financial Officer since November 1999 and as Vice President Finance since October 1998. Prior to that, he had served as Vice President, Finance for the Worldwide Materials Business of Avery Dennison Corporation (producer of pressure sensitive materials, office products, labels and other converted products) since March 1994 and held other various positions at Avery Dennison Corporation from 1984.
Gregory R. Chemnitz 56 Vice President, General Counsel. Mr. Chemnitz joined Materion Corporation in September 2007 as its Vice President, General Counsel. Prior to that, he had served in various roles in the Law Department at Avery Dennison Corporation beginning in 1992, including most recently, as Assistant General Counsel, Americas, where he had responsibility for the legal affairs of Avery Dennison’s business units in North and South America.

8
Item 1A. RISK FACTORS
Our business, financial condition, results of operations and cash flows can be affected by a number of factors, including, but not limited to, those set forth below and elsewhere in this Form 10-K, any one of which could cause our actual results to vary materially from recent results or from our anticipated future results. Therefore, an investment in us involves some risks, including the risks described below. The risks discussed below are not the only risks that we may experience. If any of the following risks occur, our business, results of operations or financial condition could be negatively impacted.
The businesses of many of our customers are subject to significant fluctuations as a result of the cyclical nature of their industries and their sensitivity to general economic conditions, which could adversely affect their demand for our products and reduce our sales and profitability.
A substantial number of our customers are in the consumer electronics, industrial components and commercial aerospace, automotive electronics, defense and science, medical, energy, telecommunications infrastructure and appliance industries. Each of these industries is cyclical in nature, influenced by a combination of factors which could have a negative impact on our business, including, among other things, periods of economic growth or recession, strength or weakness of the U.S. dollar, the strength of the consumer electronics, automotive electronics and computer industries and the rate of construction of telecommunications infrastructure equipment and government spending on defense.
Also, in times when growth rates in our markets slow down, there may be temporary inventory adjustments by our customers that may negatively affect our business.
Because we experience seasonal fluctuations in our sales, our quarterly results will fluctuate, and our annual performance will be affected by the fluctuations.
We expect seasonal patterns to continue, which may cause our quarterly results to fluctuate. For example, the Christmas season generates increased demand from our customers that manufacture consumer products. If our revenue during any quarter were to fall below the expectations of investors or securities analysts, our share price could decline, perhaps significantly. Unfavorable economic conditions, lower than normal levels of demand and other occurrences in any of the other quarters could also harm our results of operations. For example, toward the end of 2010, customers were building inventory in anticipation of increased demand, whereas in the same period of 2011, demand decreased because our customers had excess inventory.
A portion of our revenue is derived from the sale of defense-related products through various contracts and subcontracts. These contracts may be suspended or canceled, which could have an adverse impact on our revenues.
In 2013, 6% of our revenue was derived from sales to customers in the defense and science market. A portion of these customers operate under contracts with the U.S. Government, which are vulnerable to termination at any time, for convenience or default. Some of the reasons for cancellation include, but are not limited to, budgetary constraints or re-appropriation of government funds, timing of contract awards, violations of legal or regulatory requirements, and changes in political agenda. If cancellations were to occur, it would result in a reduction in our revenue. For example, sales to the defense and science market were approximately 11% lower in 2013 compared to 2012. The fall-off resulted from a decline in value-added sales of optics, largely due to government delays and spending cuts. Furthermore, significant additional reductions to defense spending could occur over the next decade, which could have a significant adverse impact on us.
The markets for our products are experiencing rapid changes in technology.
We operate in markets characterized by rapidly changing technology and evolving customer specifications and industry standards. New products may quickly render an existing product obsolete and unmarketable. For example, for many years thermal and mechanical performance have been at the forefront of device packaging for wireless communications infrastructure devices. In recent years, a tremendous effort has been put into developing simpler packaging solutions composed of copper and other similar components. Our growth and future results of operations depend in part upon our ability to enhance existing products and introduce newly developed products on a timely basis that conform to prevailing and evolving industry standards, meet or exceed technological advances in the marketplace, meet changing customer specifications, achieve market acceptance and respond to our competitors’ products.
The process of developing new products can be technologically challenging and requires the accurate anticipation of technological and market trends. We may not be able to introduce new products successfully or do so on a timely basis. If we fail to develop new products that are appealing to our customers or fail to develop products on time and within budgeted amounts, we may be unable to recover our research and development costs, which could adversely affect our margins and profitability.

9
We are dependent on our new primary beryllium facility for our future supply of pure beryllium.
In 2008, we entered into an agreement with the Department of Defense to share in the cost of a new beryllium plant for primary beryllium feedstock. Installation and start-up of our new beryllium facility continued throughout 2012 and into 2013 at the Elmore, Ohio plant site. Manufacturing inefficiencies, start-up and maintenance costs and inconsistent production levels resulted in disruptions to the material flow and lower gross margins. A number of these issues continued into 2013.
Construction was completed in 2012, and we are ramping up production, but temporary interruptions to make necessary repairs and any delay in further transitioning the operation to run at required production levels could negatively impact our sales and/or cost structure.
The availability of competitive substitute materials for beryllium-containing products may reduce our customers’ demand for these products and reduce our sales.
In certain product applications, we compete with manufacturers of non-beryllium-containing products, including organic composites, metal alloys or composites, titanium and aluminum. Our customers may choose to use substitutes for beryllium-containing products in their products for a variety of reasons, including, among other things, the lower costs of those substitutes, the health and safety concerns relating to these products and the risk of litigation relating to beryllium-containing products. If our customers use substitutes for beryllium-containing products in their products, the demand for our beryllium-containing products may decrease, which could reduce our sales.
Our lengthy and variable sales and development cycle makes it difficult for us to predict if and when a new product will be sold to customers.
Our sales and development cycle, which is the period from the generation of a sales lead or new product idea through the development of the product and the recording of sales, may typically take up to two or three years, making it very difficult to forecast sales and results of operations. Our inability to accurately predict the timing and magnitude of sales of our products, especially newly introduced products, could affect our ability to meet our customers’ product delivery requirements or cause our results of operations to suffer if we incur expenses in a particular period that do not translate into sales during that period, or at all. In addition, these failures would make it difficult to plan future capital expenditure needs and could cause us to fail to meet our cash flow requirements.
The availability and prices of some raw materials we use in our manufacturing operations fluctuate, and increases in raw material costs can adversely affect our operating results and our financial condition.
We manufacture advanced engineered materials using various precious and non-precious metals, including aluminum, beryllium, cobalt, copper, gold, nickel, palladium, platinum, ruthenium, silver and tin. The availability of, and prices for, these raw materials are subject to volatility and are influenced by worldwide economic conditions, speculative action, world supply and demand balances, inventory levels, availability of substitute metals, the U.S. dollar exchange rate, production costs of United States and foreign competitors, anticipated or perceived shortages and other factors. Precious metal prices, including prices for gold and silver, have increased significantly in recent years. These higher prices can cause adjustments to our inventory carrying values, whether as a result of quantity discrepancies, normal manufacturing losses, differences in scrap rates, theft or other factors, to have a greater impact on our profitability and cash flows. Also, the price of our products has increased in tandem with the rising metal prices, as a result of changes in precious metal prices that are passed through to our customers, which could deter them from purchasing our products and adversely affect our sales.
Further, we maintain some precious metals on a consigned inventory basis. The owners of the precious metals charge a fee that fluctuates based on the market price of those metals and other factors. A significant increase in the market price of precious metals or the consignment fee could increase our financing costs, which could increase our operating costs.
Utilizing precious metal in the manufacturing process creates challenges in physical inventory valuations that may impact earnings.
We manufacture precious, non-precious and specialty metal products and also have metal cleaning operations and in-house refineries that allow for the reclaim of precious metals from internally generated or customer scrap. We refine that scrap through our internal operations and externally through outside vendors.
When taking periodic physical inventories in our refinery operations, we reconcile the actual precious metals to what was estimated prior to the physical inventory count. Those estimates are based on assays or samples of precious metals taken during the refining process. If those estimates are inaccurate, we may have an inventory long (more physical precious metal than what we had estimated) or short (less physical precious metal than what we had estimated). These fluctuations could have a material impact on our financial statements and may impact earnings. For example, during the second and third quarters of 2013, procedural errors occurred in the recording of the results of the Company's regular quarterly physical inventory count. The errors understated

10
the Company's book-to-physical adjustment and, therefore, understated cost of sales in the second and third quarters of 2013. As a result, 2013 second and third quarter net income was overstated by approximately $4.8 million and $0.1 million, respectively. Higher precious metal prices may magnify the value of any potential inventory long or short.
We have determined that a material weakness exists in our system of internal control over financial reporting, which could have a material impact on our business.
Our ability to implement our business plan and comply with regulations requires an effective planning and management process. We expect that we will need to improve existing operational and financial systems, procedures and controls, and implement new ones, to manage our future business effectively. Any implementation delays, or disruption in the transition to new or enhanced systems, procedures or controls, could harm our ability to forecast sales, manage our supply chain, and record and report financial and management information on a timely and accurate basis.
We are required to maintain internal control over financial reporting to provide reasonable assurance regarding the reliability of financial reporting and the preparation of our consolidated financial statements in accordance with generally accepted accounting principles. Based on our assessment, management identified a deficiency in the Company’s internal control over financial reporting that constitutes a material weakness as of December 31, 2013. Specifically, our management review controls failed to detect errors in the physical inventory count reconciliation process at one of our facilities on a timely basis during interim periods of 2013. As a result of this material weakness, management concluded that we did not maintain effective internal control over financial reporting as of December 31, 2013.
A material weakness is a deficiency, or a combination of deficiencies, in internal control over financial reporting, such that there is a reasonable possibility that a material misstatement of our annual or interim financial statements will not be prevented or detected on a timely basis. Until the control deficiency is fully remediated, it may be more difficult for us to manage our business, our results of operations could be harmed, our ability to report results accurately and on time could be impaired, investors may lose faith in the reliability of our statements, and the price of our securities may be materially affected.
Any failure to implement and maintain required new or improved controls, or any difficulties we encounter in their implementation, could result in additional significant deficiencies or material weakness. Any such failure could adversely affect the results of periodic management evaluations and annual auditor attestation reports regarding disclosure controls and the effectiveness of our internal control over financial reporting.
Because we maintain a significant inventory of precious metals, we may experience losses due to employee error and theft.
Because we manufacture products that contain precious metals, we maintain a significant amount of precious metals at certain of our manufacturing facilities. Accordingly, we are subject to the risk of precious metal shortages resulting from employee error and theft. For example, in 2013, the Company has filed a claim with its insurance carrier for a theft of approximately $10 million of silver at its Albuquerque, New Mexico refinery.
While we maintain controls to prevent employee theft, including physical security measures, if our controls do not operate effectively or are structured ineffectively, our profitability could be adversely affected, including any charges that we might incur as a result of the shortage of our inventory and by costs associated with increased security, preventative measures and insurance.
We have a limited number of manufacturing facilities, and damage to those facilities could interrupt our operations, increase our costs of doing business and impair our ability to deliver our products on a timely basis.
Some of our facilities are interdependent. For instance, our manufacturing facility in Elmore, Ohio relies on our mining operation for its supply of beryllium hydroxide used in production of most of its beryllium-containing materials. Additionally, our Reading, Pennsylvania; Fremont, California and Tucson, Arizona manufacturing facilities are dependent on materials produced by our Elmore, Ohio manufacturing facility, and our Wheatfield, New York manufacturing facility is dependent on our Buffalo, New York manufacturing facility. The destruction or closure of any of our manufacturing facilities or our mine for a significant period of time as a result of fire, explosion, act of war or terrorism or other natural disaster or unexpected event may interrupt our manufacturing capabilities, increase our capital expenditures and our costs of doing business and impair our ability to deliver our products on a timely basis. In such an event, we may need to resort to an alternative source of manufacturing or to delay production, which could increase our costs of doing business. Our property damage and business interruption insurance may not cover all of our potential losses and may not continue to be available to us on acceptable terms, if at all.
Equipment failures and other unexpected events at our facilities may lead to manufacturing curtailments or shutdowns.
The manufacturing processes that take place in our mining operation, as well as in our manufacturing facilities, depend on critical pieces of equipment. This equipment may, on occasion, be out of service because of unanticipated failure, and some equipment is not readily available or replaceable. In addition to equipment failures, our facilities are also subject to the risk of loss due to unanticipated events such as fires, explosions or other disasters. Material plant shutdowns or reductions in operations could harm our ability to fulfill our customers’ demands, which could harm our sales and cause our customers to find other suppliers.
11
Further, remediation of any interruption in production capability may require us to make large capital expenditures, which may have a negative effect on our profitability and cash flows. Our business interruption insurance may not cover all of the lost revenues associated with interruptions in our manufacturing capabilities.
Many of our manufacturing facilities are dependent on single source energy suppliers, and interruption in energy services may cause manufacturing curtailments or shutdowns.
Many of our manufacturing facilities depend on one source for electric power and for natural gas. For example, Utah Power is the sole supplier of electric power to the processing facility for our mining operations in Utah. A significant interruption in service from our energy suppliers due to equipment failures, terrorism or any other cause may result in substantial losses that are not fully covered by our business interruption insurance. Any substantial unmitigated interruption of our operations due to these conditions could harm our ability to meet our customers’ demands and reduce our sales.
If the price of electrical power, fuel or other energy sources increases, our operating expenses could increase significantly.
We have numerous milling and manufacturing facilities and a mining operation, which depend on electrical power, fuel or other energy sources. Our operating expenses are sensitive to changes in electricity prices and fuel prices, including natural gas prices. Prices for electricity and natural gas may increase and can fluctuate widely with availability and demand levels from other users. During periods of peak usage, supplies of energy may be curtailed, and we may not be able to purchase energy at historical market rates. While we have some long-term contracts with energy suppliers, we are exposed to fluctuations in energy costs that can affect our production costs. Although we enter into forward-fixed price supply contracts for natural gas and electricity for use in our operations, those contracts are of limited duration and do not cover all of our fuel or electricity needs. Additionally, price increases in fuel and electricity costs, such as those increases which may occur from climate change legislation or other environmental mandates, may increase our cost of operations.
Disruptions or volatility in global financial markets could adversely impact our financial performance.
Global economic conditions may cause volatility and disruptions in the capital and credit markets. Should global economic conditions deteriorate or access to credit markets be reduced, customers may experience difficulty in obtaining adequate financing, thereby impacting our sales. Our exposure to bad debt losses may also increase if customers are unable to pay for products previously ordered. The recent global economic crisis and the resulting recession have also caused higher unemployment rates, which could have an adverse impact on demand for consumer electronics, which comprised 30% of our sales in 2013. Any additional negative or uncertain financial and macroeconomic conditions may have a significant adverse impact on our sales, profitability and results of operations. For example, if the current economic conditions in Europe further deteriorate, it could trigger a global economic downturn similar to the one experienced in 2008 and 2009. This could have a negative impact on our sales to Europe, which accounted for approximately 14% of our sales in 2013.
A lower interest rate environment coupled with less than expected investment performance may require us to increase our pension liability and expense, which may require us to fund a portion of our pension obligations and divert funds from other potential uses.
We provide defined benefit pension plans to eligible employees. Our pension expense and our required contributions to our pension plans are directly affected by the value of plan assets, the projected rate of return on plan assets, the actual rate of return on plan assets and the actuarial assumptions we use to measure our defined benefit pension plan obligations, including the rate at which future obligations are discounted to a present value, or the discount rate.
Lower investment performance of our pension plan assets resulting from a decline in the stock market could significantly increase the deficit position of our plans. Should the pension asset return fall below our expectations, it is likely that future pension expenses would increase. The actual return on our plan assets for the year ended December 31, 2013 was a gain of approximately 15.4%. For 2014, for pension accounting purposes, we assumed a 7.25% expected rate of return on pension assets.
We establish the discount rate used to determine the present value of the projected and accumulated benefit obligation at the end of each year based upon the available market rates for high quality, fixed income investments. An increase in the discount rate would reduce the future pension expense and, conversely, a lower discount rate would raise the future pension expense. As of December 31, 2013, for pension accounting purposes, we assumed a 4.875% discount rate for our domestic defined benefit plan compared to 4.0% for the year ended December 31, 2012.
Based on current guidelines, assumptions and estimates, including stock market prices and interest rates, we anticipate that we will make cash contributions of approximately $19.0 million to our pension plan in 2014. If our current assumptions and estimates are not correct, contributions in 2014 and beyond may be greater than our current or future projections.
We cannot predict whether changing market or economic conditions, regulatory changes or other factors will further increase our pension expenses or funding obligations, diverting funds we would otherwise apply to other uses.

12
Our expenditures for post-retirement health benefits could be materially higher than we have predicted if our underlying assumptions prove to be incorrect.
We provide post-retirement health benefits to eligible employees. Our retiree health expense is directly affected by the assumptions we use to measure our retiree health plan obligations, including the assumed rate at which health care costs will increase and the discount rate used to calculate future obligations. For retiree health accounting purposes, we have used a graded assumption schedule to assume the rate at which health care costs will increase. At December 31, 2013 and December 31, 2012, we assumed rates of 7.5% and 8.0%, respectively, for each of the following years. We have assumed that this health care cost increase trend rate will decline in 0.5% increments to the ultimate trend rate of 5.0% by 2019.
Assumed health care cost trend rates have a significant effect on the amounts reported for the health care plans. A one percentage point increase in assumed health care cost trend rates would have increased the post-employment benefit obligation by $0.6 million at December 31, 2013.
We cannot predict whether changing market or economic conditions, regulatory changes or other factors will further increase our retiree health care expenses or obligations, diverting funds we would otherwise apply to other uses.
Our financial results are likely to be negatively impacted by an impairment of goodwill should our shareholder equity exceed our market capitalization for a number of quarters.
A goodwill impairment charge may be triggered by a reduction in actual and projected cash flows, which could be negatively impacted by the market price of our common shares. Our goodwill balance at December 31, 2013 was $88.8 million. Any required non-cash impairment charge could significantly reduce this balance and have a material impact on our reported financial position and results of operations.
A major portion of our bank debt consists of variable-rate obligations, which subjects us to interest rate fluctuations.
Our credit facilities are secured by substantially all of our assets (other than non-mining real property and certain other assets). Our working capital line of credit includes variable-rate obligations, which expose us to interest rate risks. If interest rates increase, our debt service obligations on our variable-rate indebtedness would increase even if the amount borrowed remained the same, resulting in a decrease in our net income. We have developed a hedging program to manage the risks associated with interest rate fluctuations, but our program may not effectively eliminate all of the financial exposure associated with interest rate fluctuations. Additional information regarding our market risks is contained in Item 7A of this Form 10-K.
We may be unable to access the financial markets on favorable terms.
The inability to raise capital on favorable terms, particularly during times of uncertainty in the financial markets, could impact our ability to sustain and grow our business and would increase our capital costs. In particular, the substantial volatility in world capital markets due to the global economic crisis has had a significant negative impact on the global financial markets.
We rely on access to financial markets as a significant source of liquidity for capital requirements not satisfied by cash on hand or operating cash flow. Our access to the financial markets could be adversely impacted by various factors, including:
• changes in credit markets that reduce available credit or the ability to renew existing credit facilities on acceptable terms;
• a deterioration of our credit;
• a deterioration in the financial condition of the banks with which we do business;
• extreme volatility in our markets that increases margin or credit requirements; and
• the collateral pledge of substantially all of our assets in connection with our existing indebtedness, which limits our flexibility in raising additional capital.
These factors have adversely impacted our access to the financial markets from time to time. Negative or uncertain global economic conditions may make it difficult for us to access the credit market and to obtain financing or refinancing, as the case may be, to the extent necessary, on satisfactory terms or at all.
Our failure to comply with the covenants contained in the terms of our indebtedness could result in an event of default, which could materially and adversely affect our operating results and our financial condition.
The terms of our credit facilities require us to comply with various covenants, including financial covenants. In the event of a global economic downturn, it could have a material adverse impact on our earnings and cash flow, which could adversely affect our ability to comply with our financial covenants and could limit our borrowing capacity. Our ability to comply with these covenants depends, in part, on factors over which we may have no control. A breach of any of these covenants could result in an

13
event of default under one or more of the agreements governing our indebtedness which, if not cured or waived, could give the holders of the defaulted indebtedness the right to terminate commitments to lend and cause all amounts outstanding with respect to the indebtedness to be due and payable immediately. Acceleration of any of our indebtedness could result in cross defaults under our other debt instruments. Our assets and cash flow may be insufficient to fully repay borrowings under all of our outstanding debt instruments if some or all of these instruments are accelerated upon an event of default, in which case we may be required to seek legal protection from our creditors.
The terms of our indebtedness may restrict our operations, including our ability to pursue our growth and acquisition strategies.
The terms of our credit facilities contain a number of restrictive covenants, including restrictions in our ability to, among other things, borrow and make investments, acquire other businesses and consign additional precious metals. These covenants could adversely affect our business by limiting our ability to plan for or react to market conditions or to meet our capital needs, as well as adversely affect our ability to pursue our growth, acquisition strategies and other strategic initiatives.
We may not be able to complete our acquisition strategy or successfully integrate acquired businesses.
We have been active over the last several years in pursuing niche acquisitions. For example, we completed the acquisition of Aerospace Metal Composites Ltd. in 2012 and EIS Optics Ltd. in 2011. We intend to continue to consider further growth opportunities through the acquisition of assets or companies and routinely review acquisition opportunities. We cannot predict whether we will be successful in pursuing any acquisition opportunities or what the consequences of any acquisition would be. Future acquisitions may involve the expenditure of significant funds and management time. Depending upon the nature, size and timing of future acquisitions, we may be required to raise additional financing, which may not be available to us on acceptable terms. Further, we may not be able to successfully integrate any acquired business with our existing businesses or recognize any expected advantages from any completed acquisition.
In addition, there may be liabilities that we fail, or are unable, to discover in the course of performing due diligence investigations on the assets or companies we have already acquired or may acquire in the future. We cannot assure that rights to indemnification by the sellers of these assets or companies to us, even if obtained, will be enforceable, collectible or sufficient in amount, scope or duration to fully offset the possible liabilities associated with the business or property acquired. Any such liabilities, individually or in the aggregate, could have a materially adverse effect on our business, financial condition and results of operations.
Payment of dividends will depend on our future financial condition and performance.
Although our Board of Directors currently intends to continue the payment of regular quarterly cash dividends on shares of our common stock, the timing and amount of future dividends will depend on the Board's assessment of our operations, financial condition, projected liabilities, our compliance with contractual restrictions in our credit agreement, restrictions imposed by applicable laws and other factors. We cannot guarantee that we will continue to declare dividends at the same or similar rates.
We are subject to fluctuations in currency exchange rates, which may negatively affect our financial performance.
A significant portion of our sales is conducted in international markets and priced in currencies other than the U.S. dollar. Revenues from customers outside of the United States (principally Europe and Asia) amounted to 31% of sales in 2013, 31% in 2012 and 25% in 2011. Significant fluctuations in currency values relative to the U.S. dollar may negatively affect our financial performance. In the past, fluctuations in currency exchange rates, particularly for the euro and the yen, have impacted our sales, margins and profitability. The fair value of our net liability relating to outstanding foreign currency contracts was $0.1 million at December 31, 2013, indicating that the average hedge rates were favorable compared to the actual year-end market exchange rates. While we may hedge our currency transactions to mitigate the impact of currency price volatility on our earnings, hedging activities may not be successful. For example, hedging activities may not cover the Company’s complete exposure which could have an unfavorable impact on our results of operations.
Our products are deployed in complex applications and may have errors or defects that we find only after deployment.
Our products are highly complex, designed to be deployed in complicated applications and may contain undetected defects, errors or failures. Although our products are generally tested during manufacturing, prior to deployment, they can only be fully tested when deployed in specific applications. For example, we sell beryllium-copper alloy strip products in a coil form to some customers, who then stamp the alloy for its specific purpose. On occasion, it is not until such customer stamps the alloy that a defect in the alloy is detected. Consequently, our customers may discover errors after the products have been deployed. The occurrence of any defects, errors, or failures could result in installation delays, product returns, termination of contracts with our customers, diversion of our resources, increased service and warranty costs and other losses to our customers, end users or to us. Any of these occurrences could also result in the loss of, or delay in, market acceptance of our products and could damage our reputation, which could reduce our sales.

14
Our business could be adversely impacted if we fail to adequately address information security issues.
We have taken measures to protect the integrity of our technology infrastructure and the privacy of confidential information. However, our technology infrastructure is potentially vulnerable to physical or electronic break-ins, viruses or similar problems. If a person or entity circumvents our security measures, they could jeopardize the security of confidential information stored on our systems, misappropriate proprietary information or cause interruptions in our operations. We may be required to make substantial additional investments and efforts to protect against or remedy security breaches. Security breaches that result in access to confidential information could damage our reputation and expose us to a risk of loss or liability.
We conduct our sales and distribution operations on a worldwide basis and are subject to the risks associated with doing business outside the United States.
We sell to customers outside of the United States from our United States and international operations. We have been and are continuing to expand our geographic reach in Europe and Asia. Shipments to customers outside of the United States accounted for approximately 31% of our sales in 2013, 31% in 2012 and 25% in 2011. We anticipate that international shipments will account for a significant portion of our sales for the foreseeable future. Revenue from international operations (principally Europe and Asia) amounted to approximately 18% of our sales in 2013, 16% in 2012 and 14% in 2011. There are a number of risks associated with international business activities, including:
• burdens to comply with multiple and potentially conflicting foreign laws and regulations, including export requirements, tariffs and other barriers, environmental health and safety requirements and unexpected changes in any of these factors;
• difficulty in obtaining export licenses from the United States Government;
• political and economic instability and disruptions, including terrorist attacks;
• disadvantages of competing against companies from countries that are not subject to U.S. laws and regulations, including the Foreign Corrupt Practices Act (FCPA);
• potentially adverse tax consequences due to overlapping or differing tax structures; and
• fluctuations in currency exchange rates.
Any of these risks could have an adverse effect on our international operations by reducing the demand for our products or reducing the prices at which we can sell our products, which could result in an adverse effect on our business, financial position, results of operations or cash flows.
In addition, we could be adversely affected by violations of the FCPA and similar worldwide anti-bribery laws. The FCPA and similar anti-bribery laws in other jurisdictions generally prohibit companies and their intermediaries from making improper payments to non-U.S. officials for the purpose of obtaining or retaining business. Our policies mandate compliance with these anti-bribery laws. We operate in many parts of the world that have experienced governmental corruption to some degree and, in certain circumstances, strict compliance with anti-bribery laws may conflict with local customs and practices. We cannot assure you that our internal controls and procedures always will protect us from the reckless or criminal acts committed by our employees or agents. If we are found to be liable for FCPA violations, we could suffer from criminal or civil penalties or other sanctions, which could have a material adverse effect on our business.
Changes in laws or regulations or the manner of their interpretation or enforcement could adversely impact our financial performance and restrict our ability to operate our business or execute our strategies.
New laws or regulations, or changes in existing laws or regulations or the manner of their interpretation or enforcement, could increase our cost of doing business and restrict our ability to operate our business or execute our strategies. This includes, among other things, the possible taxation under U.S. law of certain income from foreign operations, compliance costs and enforcement under the Dodd-Frank Wall Street Reform and Consumer Protection Act, and costs associated with complying with the Patient Protection and Affordable Care Act of 2010 and the regulations promulgated thereunder.
We are exposed to lawsuits in the normal course of business, which could harm our business.
During the ordinary conduct of our business, we may become involved in certain legal proceedings, including those involving product liability claims, third-party lawsuits relating to exposure to beryllium and claims against us of infringement of intellectual property rights of third parties. Due to the uncertainties of litigation, we can give no assurance that we will prevail at the conclusion of future claims. Certain of these matters involve types of claims that, if they result in an adverse ruling to us, could give rise to substantial liability which could have a material adverse effect on our business, operating results or financial condition.

15
We are presently uninsured for beryllium-related claims where the claimants’ first exposure to beryllium occurred on or after January 1, 2008, and we have not undertaken to estimate the impact of any such claims, which have yet to be asserted. In addition, some jurisdictions preclude insurance coverage for punitive damage awards. Accordingly, our profitability could be adversely affected if any current or future claimants obtain judgments for any uninsured compensatory or punitive damages. Further, an unfavorable outcome or settlement of a pending beryllium case or adverse media coverage could encourage the commencement of additional similar litigation.
Health issues, litigation and government regulations relating to our beryllium operations could significantly reduce demand for our products, limit our ability to operate and adversely affect our profitability.
If exposed to respirable beryllium fumes, dusts or powder, some individuals may demonstrate an allergic reaction to beryllium and may later develop a chronic lung disease known as chronic beryllium disease, or CBD. Some people who are diagnosed with CBD do not develop clinical symptoms at all. In others, the disease can lead to scarring and damage of lung tissue, causing clinical symptoms that include shortness of breath, wheezing and coughing. Severe cases of CBD can cause disability or death.
Further, some scientists claim there is evidence of an association between beryllium exposure and lung cancer, and certain standard-setting organizations have classified beryllium and beryllium compounds as human carcinogens.
The health risks relating to exposure to beryllium have been, and will continue to be, a significant issue confronting the beryllium-containing products industry. The health risks associated with beryllium have resulted in product liability claims, employee and third-party lawsuits. As of December 31, 2013, we had two CBD cases outstanding.
The increased levels of scrutiny by federal, state, foreign and international regulatory authorities could lead to regulatory decisions relating to the approval or prohibition of the use of beryllium-containing materials for various uses. Concerns over CBD and other potential adverse health effects relating to beryllium, as well as concerns regarding potential liability from the use of beryllium, may discourage our customers’ use of our beryllium-containing products and significantly reduce demand for our products. In addition, adverse media coverage relating to our beryllium-containing products could damage our reputation or cause a decrease in demand for beryllium-containing products, which could adversely affect our profitability.
Our bertrandite ore mining and beryllium-related manufacturing operations and some of our customers’ businesses are subject to extensive health and safety regulations that impose, and will continue to impose, significant costs and liabilities, and future regulation could increase those costs and liabilities or effectively prohibit production or use of beryllium-containing products.
We, as well as our customers, are subject to laws regulating worker exposure to beryllium. Standards for exposure to beryllium are under review by OSHA, the Department of Energy and by other U.S. and foreign governmental and private standard-setting organizations. One result of these reviews will likely be more stringent worker safety standards. Some organizations, such as the California Occupational Health and Safety Administration and the American Conference of Governmental Industrial Hygienists, have adopted standards that are more stringent than the current standards of OSHA. The development, proposal or adoption of more stringent standards may affect buying decisions by the users of beryllium-containing products. If the standards are made more stringent and/or our customers or other downstream users decide to reduce their use of beryllium-containing products, our results of operations, liquidity and financial condition could be materially adversely affected. The impact of this potential adverse effect would depend on the nature and extent of the changes to the standards, the cost and ability to meet the new standards, the extent of any reduction in customer use and other factors. The magnitude of this potential adverse effect cannot be estimated.
Our bertrandite ore mining and manufacturing operations are subject to extensive environmental regulations that impose, and will continue to impose, significant costs and liabilities on us, and future regulation could increase these costs and liabilities or prevent production of beryllium-containing products.
We are subject to a variety of governmental regulations relating to the environment, including those relating to our handling of hazardous materials and air and wastewater emissions. Some environmental laws impose substantial penalties for non-compliance. Others, such as the federal Comprehensive Environmental Response, Compensation, and Liability Act, or CERCLA, impose strict, retroactive and joint and several liability upon entities responsible for releases of hazardous substances. Bertrandite ore mining is also subject to extensive governmental regulation on matters such as permitting and licensing requirements, plant and wildlife protection, reclamation and restoration of mining properties, the discharge of materials into the environment and the effects that mining has on groundwater quality and availability. Future requirements could impose on us significant additional costs or obligations with respect to our extraction, milling and processing of ore. If we fail to comply with present and future environmental laws and regulations, we could be subject to liabilities or our operations could be interrupted. In addition, future environmental laws and regulations could restrict our ability to expand our facilities or extract our bertrandite ore deposits. These environmental laws and regulations could also require us to acquire costly equipment, obtain additional financial assurance, or incur other significant expenses in connection with our business, which would increase our costs of production.

16
Natural disasters, equipment failures, work stoppages, bankruptcies and other unexpected events may lead our customers to curtail production or shut down their operations.
Our customers’ manufacturing operations are subject to conditions beyond their control, including raw material shortages, natural disasters, interruptions in electrical power or other energy services, equipment failures, bankruptcies, work stoppages due to strikes or lockouts, including those affecting the automotive industry, which is one of our major markets, and other unexpected events. For example, the tsunami that hit Japan in March 2011 caused wide-scale destruction of the Tohoku region and led most manufacturers in the area, most notably those in the automotive and consumer electronics markets, to slow or halt production. Similar events could also affect other suppliers to our customers. Such events could cause our customers to curtail production or to shut down a portion or all of their operations, which could reduce their demand for our products and reduce our sales.
Unexpected events and natural disasters at our mine could increase the cost of operating our business.
A portion of our production costs at our mine are fixed regardless of current operating levels. Our operating levels are subject to conditions beyond our control that may increase the cost of mining for varying lengths of time. These conditions include, among other things, fire, natural disasters, pit wall failures and ore processing changes. Our mining operations also involve the handling and production of potentially explosive materials. It is possible that an explosion could result in death or injuries to employees and others and material property damage to third parties and us. Any explosion could expose us to adverse publicity or liability for damages and materially adversely affect our operations. Any of these events could increase our cost of operations.
Terrorist attacks and other acts of violence or war may directly harm our operations.
Terrorist attacks or other acts of violence or war may directly impact our facilities. For example, our Elmore, Ohio facility is located near, and derives power from, a nuclear power plant, which could be a target for a terrorist attack. In addition, terrorist attacks, related armed conflicts or prolonged or increased tensions in the Middle East or other regions of the world could cause consumer confidence and spending to decrease, decreasing demand for consumer goods that contain our products. Further, when the United States armed forces are involved in active hostilities or large-scale deployments, defense spending tends to focus more on meeting the physical needs of the troops, and planned expenditures on weapons and other systems incorporating our products may be reduced or deferred. Any of these occurrences could also increase volatility in the United States and worldwide financial markets, which could negatively impact our sales.
Item 1B. UNRESOLVED STAFF COMMENTS
None.

17
Item 2. PROPERTIES
We operate manufacturing plants, service and other facilities throughout the world. During 2013, we made effective use of our productive capacities at our principal facilities. We believe that the quality and production capacity of our facilities is sufficient to maintain our competitive position for the foreseeable future. Information as of December 31, 2013, with respect to our significant facilities that are owned or leased, and the respective segments in which they are included, is set forth below:
Location Owned or Leased
ApproximateNumber of
Square Feet
Corporate and Administrative OfficesMayfield Heights, Ohio (1)(2)(3)(5) ..................................................................... Leased 79,000Manufacturing FacilitiesAlbuquerque, New Mexico (1) ............................................................................. Owned/Leased 13,000/28,800Bloomfield, Connecticut (1) ................................................................................. Leased 23,400Brewster, New York (1)......................................................................................... Leased 75,000Buellton, California (1) ......................................................................................... Leased 35,000Buffalo, New York (1)........................................................................................... Owned 97,000Delta, Utah (2)....................................................................................................... Owned 86,000Elmore, Ohio (2)(3)............................................................................................... Owned/Leased 681,000/191,000Farnborough, England (3) ..................................................................................... Leased 10,000Fremont, California (3) ......................................................................................... Leased 40,000Limerick, Ireland (1) ............................................................................................. Leased 18,000Lincoln, Rhode Island (4) ..................................................................................... Owned/Leased 130,000/12,000Lorain, Ohio (2) .................................................................................................... Owned 55,000Milwaukee, Wisconsin (1) .................................................................................... Owned 98,750Reading, Pennsylvania (2) .................................................................................... Owned 123,000Santa Clara, California (1) .................................................................................... Leased 5,800Shanghai, China (1)............................................................................................... Leased 101,400Singapore (1)......................................................................................................... Leased 30,000Subic Bay, Philippines (1)..................................................................................... Leased 5,000Suzhou, China (1) ................................................................................................. Leased 22,400Taipei, Taiwan (1)................................................................................................. Leased 11,500Tucson, Arizona (3)............................................................................................... Owned 53,000Tyngsboro, Massachusetts (1)............................................................................... Leased 38,000Westford, Massachusetts (1) ................................................................................. Leased 78,000Wheatfield, New York (1)..................................................................................... Owned 35,000Windsor, Connecticut (1) ...................................................................................... Leased 34,700Service and Distribution CentersElmhurst, Illinois (2) ............................................................................................. Leased 28,500Fukaya, Japan (2)(3)(4)......................................................................................... Owned 35,500Reading, England (2)(3)........................................................................................ Leased 9,700Singapore (2)(3)(4) ............................................................................................... Leased 2,500Stuttgart, Germany (2) .......................................................................................... Leased 24,800Tokyo, Japan (2)(3)(4) .......................................................................................... Leased 7,200Warren, Michigan (2)............................................................................................ Leased 34,500
(1) Advanced Material Technologies(2) Performance Alloys(3) Beryllium and Composites(4) Technical Materials(5) All Other

18
In addition to the above, the Company holds certain mineral rights on 7,500 acres in Juab County, Utah from which the beryllium-bearing ore, bertrandite, is mined by the open pit method. A portion of these mineral rights are held under lease. Ore reserve data can be found in Item 7 of this Form 10-K.
Item 3. LEGAL PROCEEDINGS
Our subsidiaries and our holding company are subject, from time to time, to a variety of civil and administrative proceedings arising out of our normal operations, including, without limitation, product liability claims, health, safety and environmental claims and employment-related actions. Among such proceedings are cases alleging that plaintiffs have contracted, or have been placed at risk of contracting, beryllium sensitization or chronic beryllium disease or other lung conditions as a result of exposure to beryllium (“beryllium cases”). The plaintiffs in beryllium cases seek recovery under negligence and various other legal theories and demand compensatory and often punitive damages, in many cases of an unspecified sum. Spouses of some plaintiffs claim loss of consortium.
Beryllium Claims
As of December 31, 2013, our subsidiary, Materion Brush Inc., was a defendant in two beryllium cases, as described more fully below.
As of December 31, 2012, there was one pending beryllium case (involving two plaintiffs), and as of December 31, 2013, there were two beryllium cases (involving five plaintiffs).
During 2013, one beryllium case (involving three plaintiffs) was filed.
The Company is one of two defendants in a case originally filed on September 25, 2012 in the Court of Common Pleas of Philadelphia County, Pennsylvania titled Schwartz v. Accuratus Corporation et al., and subsequently removed to the United States District Court for the Eastern District of Pennsylvania (No. 12-6189). Plaintiff alleges that she contracted chronic beryllium disease from “take-home” exposures resulting from her husband’s employment at facilities at the Company and of co-defendant Accuratus Corporation, and asserts claims for negligence and strict liability. She seeks compensatory and exemplary damages in unspecified amounts. Her husband claims a loss of consortium.
The Company is one of five defendants in a case filed on October 4, 2013 in the Superior Court of the State of Arizona, Maricopa County, titled Parmar et al. v. Dolphin, Inc. et al., CV 2013-012980. One plaintiff alleges that he contracted chronic beryllium disease from exposures that resulted from his employment at manufacturing facilities of Karsten Manufacturing Corporation (“Karsten”) in Arizona, and asserts claims for negligence, strict liability and fraudulent concealment. His wife claims a loss of consortium. Another plaintiff alleges that he has been diagnosed with beryllium sensitization that resulted from his employment at Karsten, and asserts a claim for medical monitoring. Plaintiffs seek compensatory and punitive damages and/or medical monitoring in unspecified sums.
Item 4. MINE SAFETY DISCLOSURES
Information concerning mine safety violations or other regulatory matters required by Section 1503(a) of the Dodd-Frank Wall Street Reform and Consumer Protection Act and Item 104 of Regulation S-K (17 CFR 229.104) is included in Exhibit 95 to this Form 10-K.

19
PART II
Item 5. MARKET FOR REGISTRANT’S COMMON EQUITY, RELATED STOCKHOLDER MATTERS AND ISSUER PURCHASES OF EQUITY SECURITIES
Market Information and Dividends
The Company's common shares are listed on the New York Stock Exchange under the symbol “MTRN”. As of February 21, 2014, there were 1,105 shareholders of record. The table below is a summary of the range of market prices with respect to common shares during each quarter of fiscal years 2013 and 2012 and the dividends declared per common share.
Stock Price RangeFiscal Quarters High Low Dividends
2013First ............................. $ 29.81 $ 26.20 $ 0.075Second ......................... 31.49 24.58 0.080Third ........................... 33.69 27.09 0.080Fourth ......................... 32.73 25.75 0.080
2012First.............................. $ 32.91 $ 24.77 $ —Second ......................... 29.37 20.37 0.075Third ............................ 25.57 17.59 0.075Fourth .......................... 25.93 18.84 0.075
We began paying dividends in June 2012. We expect to pay cash dividends in the future, subject to the continuing determination by our Board of Directors that paying dividends remains in the best interest of our shareholders. The agreements governing our credit facilities restrict the amount of cash dividends that we can pay. Any determinations by our Board of Directors to pay cash dividends in the future will take into account various factors, including our financial condition, results of operations, current and anticipated cash needs, plans for expansion and restrictions under the agreements governing our credit facilities and any agreement governing our future debt. We cannot provide assurance that dividends will be paid in the future or that, if paid, the dividends will be at the same amount or frequency.

20
Performance Graph
The following graph sets forth the cumulative shareholder return on our common shares as compared to the cumulative total return of the S&P SmallCap 600 Index and the Russell 2000 Index as Materion Corporation is a component of these indices.
2007 2008 2009 2010 2011 2012 2013
Materion Corporation... $100 $34 $50 $104 $66 $70 $85S&P SmallCap 600 ...... $100 $69 $87 $109 $110 $128 $182Russell 2000................. $100 $66 $84 $107 $102 $119 $165
The above graph assumes that the value of our common shares and each index was $100 on December 31, 2007 and that all applicable dividends were reinvested.

21
Item 6. SELECTED FINANCIAL DATA
Materion Corporation and Subsidiaries
(Thousands except per share data) 2013 2012 2011 2010 2009
For the yearNet sales ................................................. $ 1,166,882 $ 1,273,008 $ 1,526,730 $ 1,302,314 $ 715,186Cost of sales ........................................... 978,904 1,074,295 1,311,409 1,079,666 623,764Gross margin.......................................... 187,978 198,783 215,321 222,648 91,422Operating profit (loss)............................ 26,831 36,776 57,078 73,633 (19,485)Interest expense - net ............................. 3,036 3,134 2,812 2,665 1,299Income (loss) before income taxes ........ 23,795 33,642 54,266 70,968 (20,784)Income taxes (benefit)............................ 4,088 8,978 14,287 24,541 (8,429)Net income (loss) ................................... 19,707 24,664 39,979 46,427 (12,355)Earnings per share of common stock:
Basic ........................................ 0.96 1.21 1.96 2.29 (0.61)Diluted ..................................... 0.94 1.19 1.93 2.25 (0.61)
Dividends per share of common stock... 0.315 0.225 — — —Depreciation and amortization............... 42,328 37,695 44,194 35,932 32,369Capital expenditures............................... 27,848 34,088 28,187 42,314 44,173Mine development expenditures ............ 4,776 10,573 560 11,348 808Year-end positionWorking capital...................................... 265,489 251,922 231,230 208,365 140,482Ratio of current assets to currentliabilities................................................. 3.1 to 1 2.7 to 1 2.7 to 1 2.4 to 1 2.0 to 1Property and equipment:
At cost............................................. $ 782,879 $ 779,785 $ 752,726 $ 719,953 $ 665,361Cost less depreciation,amortization and depletion ............. 261,893 272,542 263,398 265,868 227,766
Total assets............................................. 777,945 814,917 772,103 735,410 621,953Long-term liabilities............................... 153,296 203,335 184,143 157,571 131,630Long-term debt....................................... 29,267 44,880 40,463 38,305 8,305Shareholders’ equity............................... 463,321 414,995 405,982 384,356 339,859Weighted-average number of shares ofstock outstanding:
Basic ............................................... 20,571 20,418 20,365 20,282 20,191Diluted ............................................ 20,895 20,679 20,754 20,590 20,191
Capital expenditures shown above include amounts spent under government contracts for which reimbursements were received from the government in the amounts of $1.0 million in 2012, $5.4 million in 2011, $21.9 million in 2010 and $28.2 million in 2009.
See Notes to Consolidated Financial Statements.

22
Item 7. MANAGEMENT’S DISCUSSION AND ANALYSIS OF FINANCIAL CONDITION AND RESULTS OF OPERATIONS
OVERVIEW
We are an integrated producer of high-performance advanced engineered materials used in a variety of electrical, electronic, thermal and structural applications. Our products are sold into numerous markets, including consumer electronics, industrial components and commercial aerospace, automotive electronics, defense and science, medical, energy, telecommunications infrastructure and appliance.
Sales of $1.2 billion in 2013 were 8% lower than sales of $1.3 billion in 2012, with the majority of the decline due to the pass-through of lower metal prices. Shipments into the automotive electronics, medical and energy markets improved in 2013 over 2012, but these improvements were more than offset by softer shipments for defense and science, industrial components and commercial aerospace, and consumer electronics.
Gross margin of $188.0 million declined in 2013 from 2012 as a result of lower yields and manufacturing efficiencies, primarily within our precious metal operations, an unfavorable shift in product mix and other factors.
During 2013, we completed the consolidation of several of our smaller operations under a program we announced and started in 2012. These actions were designed to improve operating efficiencies and customer service, while reducing operating and overhead costs over the long term. One-time costs to implement the facility consolidation plan totaled $6.0 million in 2013.
As a result of the lower gross margin and the facility consolidation costs, as well as an increase in research and development costs (to support key technology projects), operating profit declined from $36.8 million in 2012 to $26.8 million in 2013. Diluted earnings per share were $0.94 in 2013 and $1.19 in 2012.
Cash flow from operations was a solid $75.9 million in 2013, including $37.4 million in the fourth quarter 2013. Total debt was reduced $29.5 million in 2013. We increased the quarterly dividend beginning in the second quarter 2013 and paid $6.5 million in dividends to shareholders during the year.
During the second quarter 2013, we secured a new revolving credit facility to replace the existing facility that was scheduled to mature in 2016. The borrowing capacity is $50.0 million higher and the borrowing spreads are lower under the new facility than they were under the prior facility. The new facility matures in 2018. In 2013, we also renewed our precious metal consignment lines, extending the maturity dates out from one to three years.

23
RESULTS OF OPERATIONS
(Millions except per share data) 2013 2012 2011
Net sales ............................................................................................ $ 1,166.9 $ 1,273.1 $ 1,526.7Value-added sales.............................................................................. 609.1 615.6 646.5Operating profit................................................................................. 26.8 36.8 57.1Income before income taxes ............................................................. 23.8 33.6 54.3Net income ........................................................................................ 19.7 24.7 40.0Diluted earnings per share................................................................. 0.94 1.19 1.93
Sales were $1.2 billion in 2013, a decline of $106.2 million, or 8%, from sales of $1.3 billion in 2012. Sales in 2012 were $253.6 million, or 17%, lower than sales of $1.5 billion in 2011. The sales comparisons between years were affected by the pass-through of lower metal prices, the discontinuation of a non-strategic product line, changes in the use of customer-supplied metal, new product development and market demand.
The costs of gold, silver, platinum, palladium and copper are typically passed through to customers and, therefore, movements in the prices of these metals will affect sales, but may not have a proportionate impact on margins. Internally, we manage our business on a value-added sales basis. Value-added sales is a non-GAAP measure that deducts the cost of these pass-through metals from sales and removes the potential distortion caused by differences in metal values sold. Value-added sales were $609.1 million in 2013 compared to $615.6 million in 2012. Value-added sales in 2012 were 5% lower than value-added sales of $646.5 million in 2011. A reconciliation of sales to value-added sales is provided in a later section of this Management’s Discussion and Analysis.
Value-added sales to the consumer electronics market, our largest market accounting for approximately 27% of our total value-added sales in 2013, were 3% lower in 2013 than in 2012 and 1% lower in 2012 than 2011. The decline in value-added sales in 2013 was due to lower shipments of precious metal products offset in part by increased shipments of various products for gaming systems and advanced chemicals for LED applications. Value-added sales in 2012 were 1% lower than 2011 due to lower precious metal sales for microelectronics applications offset in part by the impact of the acquisition of EIS Optics Limited (EIS) late in 2011.
End-use applications for our materials in the consumer electronics market include cell phones, tablets, gaming systems and other hand-held devices and the market’s demand for increased power and miniaturization in these applications favors the use of our high-performance materials. As a material supplier, we sell to stamping houses and sub-assembly shops so we are several steps removed from the final consumer. Our sales to this market in a given period, therefore, are affected by downstream inventory levels and production schedules and changes in market share of the intermediaries within the supply chain and not necessarily by changes in sales of the final product or in consumer demand in that period. While our marketing staffs work closely with various demand generators to develop new applications, technologies can be closely guarded for competitive reasons and we may lose applications from time to time due to rapid changes in technologies and applications that have short life spans.
Value-added sales to the defense and science market were approximately 6% lower in 2013 than in 2012. The fall-off resulted from a decline in value-added sales of optics, largely due to government delays and spending cuts, offset in part by an increase in value-added sales of beryllium materials. Defense and science value-added sales in 2012 were approximately 10% lower than value-added sales in 2011 as shipments of optics and beryllium products declined driven mainly by government budget cuts and the impact of the sequestration. Value-added sales to the defense and science market accounted for approximately 11% of our total value-added sales in 2013.
Industrial components and commercial aerospace market value-added sales softened approximately 4% in 2013 from 2012 after growing 8% in 2012 over 2011. Value-added sales for commercial aerospace applications improved in 2013, but this growth was more than offset by declines in other industrial applications, including x-ray windows. The growth in 2012 was driven by higher value-added sales of materials for heavy equipment, as a result of product development and market penetration efforts, and improved aerospace market conditions.
Medical market value-added sales improved 11% in 2013 over 2012 and 4% in 2012 over 2011 due to increased sales for blood glucose strip applications. Value-added sales of other materials into this market declined in both 2013 and 2012. Medical market value-added sales were approximately 10% of our total value-added sales in 2013.
Energy market value-added sales grew 5% in 2013 over 2012 after softening 9% in 2012 from 2011. The growth in 2013 was largely due to higher value-added sales for oil and gas applications in the second half of the year from improved market conditions as the rig count increased. The lower value-added sales in 2012 were due to a decline in the oil and gas rig count and

24
weaker conditions in the solar energy sector. The energy market represented approximately 8% of our total value-added sales in 2013.
Value-added sales to the automotive electronics market grew at a double-digit rate in 2013 over 2012 after declining slightly in 2012 from 2011. The growth in 2013 was due to a combination of improved market conditions in the U.S. and Europe, new product development and other factors. The decline in 2012 was largely due to softer sales for an optics application. Value-added sales to this market accounted for approximately 11% of our total value-added sales.
As part of our product rationalization actions, we exited the silver investment bar business in 2012. This non-strategic product line generated extremely low margins that could not support the associated level of working capital and overhead. This action resulted in a reduction of sales of approximately $9.3 million in 2013 from 2012 and $44.6 million in 2012 from 2011 with an immaterial impact on value-added sales and profitability.
The acquisitions of Aerospace Metal Composites Limited (AMC) in the first quarter 2012 and EIS in the fourth quarter 2011 had a minor impact on the comparison of sales and value-added sales in 2012 versus 2011.
Our sales are affected by metal prices, as changes in the prices we pay for precious metals and various base metals, primarily copper, are generally passed on to our customers. The average prices for the metals we purchased in 2013 and 2012 were lower than the respective prior year. The net change in metal prices resulted in an estimated $85.7 million decrease in sales in 2013 from 2012 and accounted for the majority of the reduction in sales for the year. The net change in metal price pass-through accounted for an estimated $5.3 million decrease in sales in 2012 from 2011.
Gross margin was $188.0 million, or 16% of sales, in 2013, $198.8 million, or 16% of sales, in 2012 and $215.3 million, or 14% of sales in 2011. Gross margin was 31% of value-added sales in 2013, 32% of value-added sales in 2012 and 33% of value-added sales in 2011.
Lower manufacturing yields and an unfavorable change in product mix within our precious metal operations accounted for the majority of the gross margin decline in 2013. Manufacturing inefficiencies in our Elmore, Ohio strip manufacturing operations also contributed to the decline. Inefficiencies and inconsistent production output continued from the new beryllium facility in 2013 as it did in 2012, but improvements were made throughout the year. We also made manufacturing improvements at our Lincoln, Rhode Island facility in 2013.
Improved pricing in portions of our business provided a margin benefit in both 2013 and 2012, while the lower value-added sales volume reduced margins in both years. The cost of bertrandite ore was higher and had a negative impact on gross margin in 2013 and 2012 as compared to the respective prior years.
The 2013 gross margin was reduced by net quarterly physical inventory adjustments totaling $2.2 million at the Albuquerque, New Mexico facility within the Advanced Material Technologies segment. The majority of this loss was recorded in the first quarter 2013. The gross margin in 2012 was also reduced by a net physical inventory adjustment of $7.4 million recorded in the fourth quarter at the Albuquerque facility. Physical inventories were taken at this facility in the first and second quarters in 2012 that resulted in a combined net short of $0.2 million.
We believe that a portion, which may have been a significant portion, of the inventory loss at Albuquerque may be due to theft. We have filed an insurance claim and discussions with the insurance carrier were ongoing as of the first quarter 2014. Since the amount of any recovery was still uncertain, an insurance recoverable was not recorded in 2013 or 2012 and the benefit from any insurance proceeds will be recorded in a future period. Shipments to customers were not affected by the physical inventory losses.
The acquisitions of EIS and AMC provided additional gross margin dollars in 2012 over 2011. The change in product mix was favorable in 2012 partially due to higher sales of precious metal products for medical applications and pure beryllium metal products that generally generate higher margins. Improved yields on nickel products generated a margin benefit in 2012 compared to 2011. The comparison of gross margins between 2012 and 2011 was also affected by a net unfavorable inventory valuation adjustment of $3.6 million recorded in the fourth quarter 2011.
The annual expense on the domestic defined benefit pension plan was $13.3 million in 2013, $9.8 million in 2012 and $8.0 million in 2011. The increase in the pension expense in 2013 and 2012 over the respective prior years was due to changes in the discount rate, the performance of the plan assets and other factors and affected cost of sales, selling, general and administrative expenses and, to a lesser extent, research and development expenses. See “Critical Accounting Policies” below.
During 2013 and 2012, we took steps to consolidate several of our smaller operations, rationalize our product lines and reduce overhead costs. Specifically:

25
• We shut down our microelectronics packaging business in Massachusetts and transferred the operations to Singapore in order to more effectively serve our customer base in Asia. The relocation and customer qualifications were completed in the third quarter 2013;
• We shut down the precision cleaning facility in the Czech Republic in the fourth quarter 2012. The existing customer base is now serviced from our Irish operations. The Czech operation had been unprofitable;
• The majority of the ongoing operations at our optics facility in Buellton, California were transferred to our Westford, Massachusetts operations in the fourth quarter 2013. Buellton’s business had declined due to changes in market conditions and we had excess capacity. The Buellton operations remained open on a reduced basis to service a key application with one customer. Manpower reductions were also made at the Westford and Shanghai, China facilities in efforts to right-size the optics operations;
• The Albuquerque operations were consolidated from four leased facilities into two in the fourth quarter 2013 in order to improve work flow and manufacturing efficiencies. Portions of the operations were also transferred to our Wheatfield, New York facility; and
• Manpower reductions were made in the management group of the Advanced Material Technologies segment in the fourth quarter 2013 in order to reduce costs and streamline the operations.
Costs associated with these actions, including severance, equipment write-offs, equipment relocations and other related items, totaled $6.0 million in 2013, with $1.8 million recorded in cost of sales, $2.8 million recorded in selling, general and administrative expense and $1.4 million in other-net expense. Related costs for these actions totaled $4.8 million in 2012 with $1.6 million recorded in cost of sales, $1.6 million recorded in selling, general and administrative expense and $1.6 million recorded in other-net expense. These actions resulted in a reduction in excess of 200 employees, or approximately 7% of our total work force. All of the facilities affected by these actions are within our Advanced Material Technologies segment.
Selling, general and administrative (SG&A) expenses totaled $133.3 million (11% of sales) in 2013, $133.9 million (11% of sales) in 2012 and $131.4 million (9% of sales) in 2011. SG&A expenses were 22% of value-added sales in 2013 and 2012 and 20% of value-added sales in 2011.
The incentive compensation expense on plans that pay in cash was $0.5 million lower in 2013 than in 2012 and $3.5 million lower in 2012 than in 2011. The changes in the annual expense between years were caused primarily by the performance of the individual operations relative to their plans’ objectives. Stock-based compensation expense, including the expense for stock appreciation rights, restricted stock and performance restricted shares, was $5.7 million in 2013, $5.9 million in 2012 and $5.0 million in 2011. The comparison of stock-based compensation expense between years may be affected by changes in plan design, the number of grants in a given year, actual performance relative to the plans’ objectives, movement in our stock price, forfeitures, vesting schedules and other factors.
Various corporate costs increased in 2013 over 2012 and in 2012 over 2011. A portion of the higher costs was due to various initiatives, including a new centralized procurement function, that are designed to produce long-term savings and improve profitability across the organization. Other costs increased in 2013, including administration, legal, information technology and business development, in order to support a more diverse organization. Corporate costs also included legal and investigation expenses associated with the Albuquerque inventory loss and the related insurance claim totaling $1.3 million in 2013.
SG&A savings from the plant consolidations and related efforts totaled an estimated $2.9 million in 2013.
Expenses incurred by EIS and AMC subsequent to their acquisitions increased SG&A expenses by $5.1 million in 2012 over 2011.
Legal, administrative and marketing expenses associated with the change of our name to Materion Corporation in the first quarter 2011 totaled $3.9 million in 2011. One-time acquisition-related expenses for legal, accounting and due diligence services totaled $1.8 million in 2011.
Research and development (R&D) expenses were $13.4 million in 2013, a 7% increase from the expense of $12.5 million in 2012. R&D expenses totaled $11.1 million in 2011. R&D expenses were over 1% of sales in 2013 compared to less than 1% of sales in the prior two years. R&D expenses were approximately 2% of value-added sales for all three years presented. The higher expense in 2013 as compared to 2012 was largely due to increased activity in our beryllium-based business segments on key projects for future sales growth. The majority of the increase in the expense in 2012 over 2011 was primarily due to the expenses incurred by EIS after its acquisition. Our R&D staff works closely with production engineers, sales engineers and marketing to support the development of new products and applications as well as to make improvements in the current product portfolio.
Other-net expense totaled $14.5 million in 2013, $15.6 million in 2012 and $15.8 million in 2011. See Note N to the Consolidated Financial Statements for the details of the major components of other-net expense for each of the three years. In

26
addition to the previously discussed charges recorded in conjunction with the plant consolidation efforts, the major differences in other-net expense between the years include the following:
The metal consignment fee was $1.8 million lower in 2013 than in 2012 and $0.9 million lower in 2012 than in 2011, mainly due to differences in the rate charged by the financial institutions and the value of the metal on hand.
Other-net in 2013 included one-time bank fees of $0.9 million associated with the renewal of the metal consignment facilities in the third quarter 2013.
The net foreign currency exchange and translation gains totaled $1.5 million in both 2013 and 2012 compared to net losses of $2.8 million in 2011. These gains and losses result from movements in the value of the U.S. dollar versus other currencies, primarily the euro and yen, and the related impact on certain foreign currency denominated assets, liabilities and transactions and the maturity of foreign currency hedge contracts.
Other-net in 2011 included a $1.3 million benefit from the favorable resolution of a lawsuit that we had filed against a utility provider for raising our billing rates in violation of our contract. In the fourth quarter 2011, the court ruled in our favor and we received $1.3 million in full satisfaction of our claim. Other-net in 2011 also included a $1.1 million benefit that resulted from our determination that the remaining fair value of the earn-out liability associated with the acquisition of Barr Associates, Inc. in 2009 was zero.
Operating profit was $26.8 million (2% of sales) in 2013 compared to $36.8 million (3% of sales) in 2012 and $57.1 million (4% of sales) in 2011. The lower profit in 2013 was largely due to the decline in gross margin as a result of manufacturing inefficiencies and other operating factors. The $20.3 million decline in profitability in 2012 was due to the lower gross margin as a result of the reduced volumes, the physical inventory differences and other factors, the charges recorded for the plant consolidations and higher SG&A expenses. Operating profit was 4% of value-added sales in 2013, 6% of value-added sales in 2012 and 9% of value-added sales in 2011.
Interest expense - net was $3.0 million in 2013, $3.1 million in 2012 and $2.8 million in 2011. The lower expense in 2013 resulted from lower average outstanding debt levels offset in part by a higher average borrowing rate. The increase in expense in 2012 over 2011 was due primarily to higher average debt levels and, to a lesser extent, an increase in the average borrowing rate.
Income before income taxes and income tax expense for each of the past three years were as follows:
(Millions) 2013 2012 2011
Income before income taxes............................................................... $ 23.8 $ 33.6 $ 54.3Income tax expense ............................................................................ 4.1 9.0 14.3Effective tax rate ................................................................................ 17.2% 26.7% 26.3%
The effects of percentage depletion (a tax benefit resulting from our mining operations), foreign source income and deductions, the production deduction, discrete events and other items were major causes of the differences between the effective and statutory rates in each of the three years.
The research and experimentation credit provided a tax benefit in 2011, but this credit was not extended by the federal government for 2012 until January 2013. Accounting regulations require us to record tax expense based upon the laws in effect at the end of the year and, even though the research and experimentation credit was used to determine our actual liability on our 2012 tax return, the 2012 benefit of this credit was not recorded in our Consolidated Statement of Income until 2013. The effective tax rate in 2013 also includes the benefit of this credit for 2013 activity.
Tax expense included net favorable discrete items totaling $1.4 million in 2013, $0.3 million in 2012 and $2.0 million in 2011. Discrete items included reductions to the tax reserves due to the lapse of the statute of limitations and adjustments to the respective prior year’s tax returns in each of these three years. Discrete items in 2013 also included the favorable impact from filing an amended return for a prior period while the 2012 discrete items included the impact of a change in the Japanese tax rates on the carrying value of certain deferred tax assets.
See Note Q to the Consolidated Financial Statements for a reconciliation of the statutory and effective tax rates.
Net income was $19.7 million, or $0.94 per share diluted in 2013, compared to $24.7 million, or $1.19 per share diluted, in 2012 and $40.0 million, or $1.93 per share diluted, in 2011.
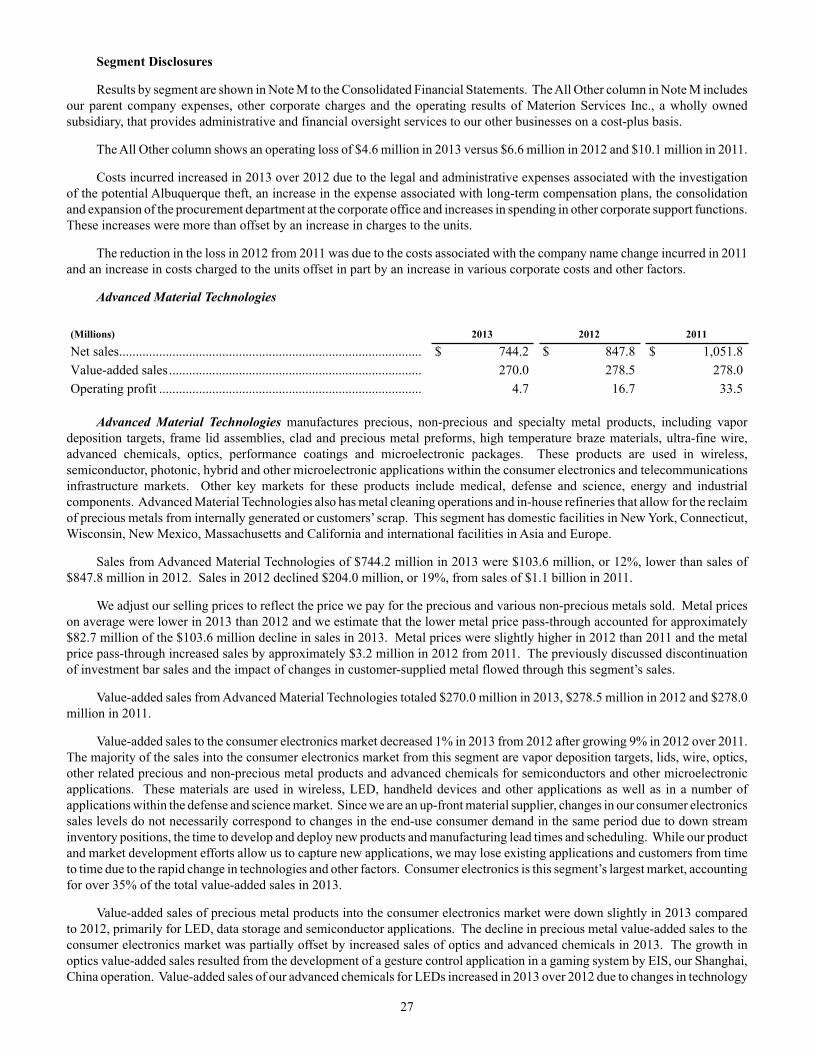
27
Segment Disclosures
Results by segment are shown in Note M to the Consolidated Financial Statements. The All Other column in Note M includes our parent company expenses, other corporate charges and the operating results of Materion Services Inc., a wholly owned subsidiary, that provides administrative and financial oversight services to our other businesses on a cost-plus basis.
The All Other column shows an operating loss of $4.6 million in 2013 versus $6.6 million in 2012 and $10.1 million in 2011.
Costs incurred increased in 2013 over 2012 due to the legal and administrative expenses associated with the investigation of the potential Albuquerque theft, an increase in the expense associated with long-term compensation plans, the consolidation and expansion of the procurement department at the corporate office and increases in spending in other corporate support functions. These increases were more than offset by an increase in charges to the units.
The reduction in the loss in 2012 from 2011 was due to the costs associated with the company name change incurred in 2011 and an increase in costs charged to the units offset in part by an increase in various corporate costs and other factors.
Advanced Material Technologies
(Millions) 2013 2012 2011
Net sales........................................................................................... $ 744.2 $ 847.8 $ 1,051.8Value-added sales ............................................................................ 270.0 278.5 278.0Operating profit ............................................................................... 4.7 16.7 33.5
Advanced Material Technologies manufactures precious, non-precious and specialty metal products, including vapor deposition targets, frame lid assemblies, clad and precious metal preforms, high temperature braze materials, ultra-fine wire, advanced chemicals, optics, performance coatings and microelectronic packages. These products are used in wireless, semiconductor, photonic, hybrid and other microelectronic applications within the consumer electronics and telecommunications infrastructure markets. Other key markets for these products include medical, defense and science, energy and industrial components. Advanced Material Technologies also has metal cleaning operations and in-house refineries that allow for the reclaim of precious metals from internally generated or customers’ scrap. This segment has domestic facilities in New York, Connecticut, Wisconsin, New Mexico, Massachusetts and California and international facilities in Asia and Europe.
Sales from Advanced Material Technologies of $744.2 million in 2013 were $103.6 million, or 12%, lower than sales of $847.8 million in 2012. Sales in 2012 declined $204.0 million, or 19%, from sales of $1.1 billion in 2011.
We adjust our selling prices to reflect the price we pay for the precious and various non-precious metals sold. Metal prices on average were lower in 2013 than 2012 and we estimate that the lower metal price pass-through accounted for approximately $82.7 million of the $103.6 million decline in sales in 2013. Metal prices were slightly higher in 2012 than 2011 and the metal price pass-through increased sales by approximately $3.2 million in 2012 from 2011. The previously discussed discontinuation of investment bar sales and the impact of changes in customer-supplied metal flowed through this segment’s sales.
Value-added sales from Advanced Material Technologies totaled $270.0 million in 2013, $278.5 million in 2012 and $278.0 million in 2011.
Value-added sales to the consumer electronics market decreased 1% in 2013 from 2012 after growing 9% in 2012 over 2011. The majority of the sales into the consumer electronics market from this segment are vapor deposition targets, lids, wire, optics, other related precious and non-precious metal products and advanced chemicals for semiconductors and other microelectronic applications. These materials are used in wireless, LED, handheld devices and other applications as well as in a number of applications within the defense and science market. Since we are an up-front material supplier, changes in our consumer electronics sales levels do not necessarily correspond to changes in the end-use consumer demand in the same period due to down stream inventory positions, the time to develop and deploy new products and manufacturing lead times and scheduling. While our product and market development efforts allow us to capture new applications, we may lose existing applications and customers from time to time due to the rapid change in technologies and other factors. Consumer electronics is this segment’s largest market, accounting for over 35% of the total value-added sales in 2013.
Value-added sales of precious metal products into the consumer electronics market were down slightly in 2013 compared to 2012, primarily for LED, data storage and semiconductor applications. The decline in precious metal value-added sales to the consumer electronics market was partially offset by increased sales of optics and advanced chemicals in 2013. The growth in optics value-added sales resulted from the development of a gesture control application in a gaming system by EIS, our Shanghai, China operation. Value-added sales of our advanced chemicals for LEDs increased in 2013 over 2012 due to changes in technology

28
and product development activities. Total value-added sales of advanced chemicals, which are produced at our Wisconsin facility and are also used in optics, security, photovoltaic and other applications, improved 16% in 2013 over 2012.
The growth in consumer electronics value-added sales in 2012 was largely due to the acquisition of EIS late in 2011. In addition to gaming applications, EIS manufactures optical coatings and related products for projection display and other related applications. Offsetting a portion of this growth from the EIS acquisition in 2012 was a decline in precious metal value-added sales for LED applications.
Value-added sales to the medical market increased 14% in 2013 over 2012 and 17% in 2012 over 2011. The majority of this segment’s value-added sales into the medical market are precision precious metal-coated polymer films for blood glucose test strip applications. The growth in both years was largely due to application development efforts and share gains within the existing customer base. A portion of the growth in 2013 was due to increased shipments to a key customer as a result of a quality problem encountered by one of our competitors with that customer, as we were able to increase production to meet this extra demand. This additional growth may not be sustainable in future periods depending upon the performance of our competitor. Value-added sales also grew in 2012 over 2011 due to geographic expansion efforts. The medical market accounted for approximately 20% of Advanced Material Technologies’ value-added sales in 2013.
Value-added sales to the defense market declined approximately 22% in 2013 from 2012 and 12% in 2012 from 2011. The majority of the decline was due to lower sales of optics as a result of government spending patterns and cutbacks. The loss of a government defense contract by a key customer was a main driver behind our decision to consolidate the small optical coating operation in Buellton.
Value-added sales to the telecommunications infrastructure and energy markets improved by minor amounts in 2013 over 2012 after declining in 2012 from 2011.
Refine and chamber cleaning value-added sales declined slightly in 2013 from 2012 partially as a result of the lower precious metal prices reducing the value of the metal that we retained as part of the standard pricing arrangements with our refine customers. Refine and chamber cleaning value-added sales was lower in 2012 than in 2011 in part due to the lower business levels at the now-closed Czech operation. Refining value-added sales can be affected by the quantity of metal on the market available to be reclaimed.
Advanced Material Technologies generated a gross margin of $93.6 million in 2013 (13% of sales), $104.2 million in 2012 (12% of sales) and $112.2 million (11% of sales) in 2011. Gross margin was 35% of value-added sales in 2013, 37% of value-added sales in 2012 and 40% of value-added sales in 2011. The previously discussed plant consolidation costs affected the comparison of margins between years within this segment.
The $10.6 million decline in gross margins in 2013 from 2012 was due in part to the lower value-added sales in 2013. The decline in gross margin in 2013 was also caused in part by physical inventory losses and lower manufacturing yields in our precious metal operations, including the refining and shield kit cleaning operations.
The change in product mix was unfavorable in 2013 compared to 2012 and contributed to the lower gross margin dollars. Due to competitive pricing pressures, new applications generally generate lower margins than the applications they replace, particularly in precious metal products. Our selling prices typically include a small spread over the cost of the precious metal and the magnitude of this spread can vary based on various factors, including the market price of the metal sold (which on average was lower in 2013 than in 2012). In addition, margins generated by the refining and shield kit cleaning operations were lower due to the impact of the lower market prices on the metal that we retain as part of the standard pricing arrangements with our customers. These negative mix factors more than offset the benefits from the increase in higher-margin medical value-added sales in 2013.
The decline in gross margin dollars in 2012 from 2011 was largely due to the physical inventory loss in the fourth quarter 2012 at the Albuquerque facility. This was partially offset by the benefits from owning EIS for a full year, lower manufacturing overhead expenses and a favorable change in product mix, which resulted from the increase in medical market value-added sales and a decline in investment bar value-added sales in 2012 as compared to 2011.
SG&A, R&D and other-net expenses were $88.9 million (12% of sales) in 2013 compared to $87.5 million (10% of sales) in 2012 and $78.8 million (7% of sales) in 2011. These expenses were 33% of value-added sales in 2013, 31% of value-added sales in 2012 and 28% of value-added sales in 2011. The expense totals included $4.2 million of plant consolidation costs in 2013 and $3.2 million in 2012 and the resulting savings of $2.9 million in 2013. Significantly larger benefits are expected to be generated from these actions in 2014.
Precious metal consignment fees decreased $1.4 million in 2013 from 2012 after declining $0.9 million in 2012 than in 2011. This segment’s portion of the one-time bank fee associated with the extended consignment facilities totaled $0.4 million in 2013.

29
Incentive compensation expense was $0.5 million higher in 2013 than in 2012 and $2.5 million lower in 2012 than in 2011 due to differences in performance relative to the plans’ objectives. R&D costs were relatively unchanged across 2013, 2012 and 2011. Corporate charges were $1.3 million higher in 2013 than in 2012 and $1.7 million higher in 2012 than 2011. Various selling and administrative expenses increased in 2013 over 2012 due to various projects, inflation and other factors.
A full year of owning EIS was a main cause for the increase in expenses in 2012 over 2011. The expense total in 2011 included the previously discussed $1.1 million favorable adjustment of earn-out liability from an earlier acquisition.
Operating profit generated by Advanced Material Technologies of $4.7 million in 2013 was $12.0 million lower than operating profit of $16.7 million in 2012. The decline in operating profit was due to the lower gross margin as a result of the reduced value-added sales, manufacturing inefficiencies, the unfavorable change in product mix and other factors, and the higher expenses caused by the additional plant consolidation costs and other items.
Operating profit was $16.8 million lower in 2012 than the operating profit of $33.5 million in 2011 due to the margin differences from the physical inventory losses, product mix shifts and other factors affecting gross margins and the increase in expenses. Operating profit was 1% of sales in 2013, 2% of sales in 2012 and 3% of sales in 2011. Operating profit was also 2% of value-added sales in 2013, 6% of value-added sales in 2012 and 12% of value-added sales in 2011.
Performance Alloys
(Millions) 2013 2012 2011
Net sales ............................................................................................ $ 292.2 $ 292.5 $ 335.3Value-added sales.............................................................................. 235.2 231.6 257.8Operating profit................................................................................. 23.4 24.0 27.2
Performance Alloys manufactures and sells three main product families:
Strip products, the largest of the product families, include thin gauge precision strip and thin diameter rod and wire. These copper and nickel alloys provide a combination of high conductivity, high reliability and formability for use as connectors, contacts, switches, relays, shielding and bearings. Major markets for strip products include consumer electronics, telecommunications infrastructure, automotive electronics, appliance and medical;
Bulk products are copper and nickel-based alloys manufactured in plate, rod, bar, tube and other customized forms that, depending upon the application, may provide superior strength, corrosion or wear resistance, thermal conductivity or lubricity. Applications for bulk products include oil and gas drilling components, bearings, bushings, welding rods, plastic mold tooling and undersea telecommunications housing equipment. Major markets for bulk products include industrial components and commercial aerospace, energy and telecommunications infrastructure; and,
Beryllium hydroxide is produced at our milling operations in Utah from our bertrandite mine and purchased beryl ore. The hydroxide is used primarily as a raw material input for strip and bulk products and, to a lesser extent, by the Beryllium and Composites segment. Sales of hydroxide are also made on a limited basis.
Strip and bulk products are manufactured at facilities in Ohio and Pennsylvania and are distributed internationally through a network of company-owned service centers and outside distributors and agents.
Performance Alloys’ sales were $292.2 million in 2013 compared to sales of $292.5 million in 2012. Sales in 2012 were $42.9 million, or 13%, lower than sales of $335.3 million in 2011.
Strip product volumes shipped (as measured in pounds) improved 2% in 2013 over 2012 after declining 18% in 2012 from 2011. The majority of the growth in 2013 was in the lower beryllium-containing strip alloys. Bulk product volumes declined 2% in 2013 from 2012 and 3% in 2012 from 2011. While shipments of traditional bulk alloys declined in 2013 and 2012 from the prior year, shipments of ToughMet®, our non-beryllium-containing bulk alloy, established record highs both years, although the growth rate was much lower in 2013 than it was in 2012.
Average selling prices increased in both 2013 and 2012 over the prior year as a result of pricing improvement programs, but the foreign currency translation impact on sales was unfavorable in both years.
Copper prices were lower on average in 2013 than in 2012 and the lower metal price pass-through reduced sales by an estimated $2.9 million. Copper prices were also lower in 2012 than in 2011 and the reduced copper price pass-through accounted for an estimated $8.4 million of the decline in sales between periods.

30
Value-added sales were $235.2 million in 2013, a 2% improvement over the value-added sales of $231.6 million in 2012. Value-added sales were $257.8 million in 2011.
Value-added sales to the automotive electronics market, primarily strip products sold in North America and Europe, grew approximately 20% in 2013 over 2012 and 7% in 2012 over 2011 as a result of improved market conditions and the development of new applications. In addition, increased consumer demand for higher automobile quality has led to stronger demand for our products in Europe in 2013. Automotive applications for Performance Alloys include under the hood electronic connectors and other sensors that require a high degree of reliability.
Value-added sales into the energy market, primarily bulk products for oil and gas applications, grew 2% in 2013 over 2012 after declining 8% in 2012 from 2011. Value-added sales to the oil and gas sector were strong throughout 2011 and into the first half of 2012, but then declined beginning in the third quarter 2012 due to a reduction in the rig count. Market conditions remained soft in the first half of 2013 and improved during the second half of 2013 and in the fourth quarter 2013 in particular. Our products are used in downhole drilling tool, instrument housing and related applications due to their high strength, non-galling and non-magnetic characteristics.
Value-added sales to the consumer electronics market, which accounted for 20% of Performance Alloys’ total value-added sales, improved 5% in 2013 over 2012. This growth was due to new product development, including two gaming system applications, and a stronger mix as a result of increased sales of thinner gauge and other higher-priced materials.
The fall-off in Performance Alloys’ total value-added sales in 2012 was largely due to weaker demand for strip products from the consumer electronics and appliance markets. Value-added sales to the consumer electronics market declined 17% in 2012 from 2011. Our materials are used in the early stages of the manufacture of consumer electronics products and our sales to the intermediaries typically are made well in advance of the sale of the ultimate finished product to the consumer. After a strong first half of 2011, consumer electronics sales softened in the second half of 2011 and then remained relatively flat throughout 2012. Appliance sales declined approximately 40% in both 2013 and 2012 from the respective prior year. While the end-use demand for appliance applications is in Europe, a growing portion of the component manufacturing is in Asia, where our products have been facing competition from lower-priced alloy systems.
Value-added sales to the industrial component and commercial aerospace market, Performance Alloys’ largest market accounting for approximately 31% of the total value-added sales in 2013, were relatively unchanged in 2013 as compared to 2012. In 2012, value-added sales to this market grew approximately 13% over 2011. During 2013, we changed distribution methods for certain industrial component applications from using independent distributors to direct sales, which had a negative impact on our sales as inventories were worked down. The commercial aerospace sector, which accounted for approximately one-third of this market’s total value-added sales, grew modestly in 2013 and offset the decline in industrial component sales. The growth in value-added sales to this market in 2012 over 2011 was largely due to increased sales of ToughMet® for heavy equipment and related applications as a result of market penetration and product development efforts.
Sales of hydroxide were unchanged in 2013 from 2012 and grew slightly in 2012 over 2011, but remained relatively small at less than 4% of total Performance Alloy sales in all three years presented.
Performance Alloys generated a gross margin of $66.6 million, or 23% of sales, in 2013, $68.4 million, or 23% of sales, in 2012 and $74.6 million, or 22% of sales, in 2011. Gross margin was 28% of value-added sales in 2013, 30% of value-added sales in 2012 and 29% of value-added sales in 2011.
The $1.8 million reduction in gross margin in 2013 compared to 2012 resulted in part from lower yields and manufacturing performance that affected one product line at the Elmore facility. Performance had stabilized by year-end 2013 and we anticipate that yields will improve and return to historical levels by the end of the first quarter 2014.
Gross margin was also negatively affected in 2013 by an increase of approximately $0.8 million in the bertrandite ore cost in 2013 over 2012 due to the higher cost to remove the overburden during the construction of our most recent open pit mine.
Manufacturing overhead costs at the Elmore facility increased approximately 10% in 2013, mainly for manpower and outside services. Overhead costs at the Reading, Pennsylvania facility also increased in 2013.
The impact of the above items on gross margins was partially offset by pricing improvements, the slight increase in volumes and a favorable change in product mix in 2013.
The $6.2 million decline in gross margin in 2012 from 2011 was due to the $26.1 million reduction in value-added sales and a $1.8 million increase in the cost of bertrandite ore offset in part by higher selling prices, improved yields on nickel products and lower manufacturing overhead costs.

31
During 2012, we improved the yields on certain nickel-containing products resulting in lower scrap rates and rework costs and leading to a $3.3 million increase in gross margin in 2012 over 2011.
Manufacturing overhead costs at the Elmore facility, including rent, depreciation and outside services, were approximately 10% lower in 2012 than in 2011.
SG&A, R&D and other-net expenses were $43.2 million in 2013, a 3% reduction from the expense total of $44.4 million in 2012. In 2011, these expenses totaled $47.4 million. Expenses were 15% of sales in 2013 and 2012 and 14% of sales in 2011. Expenses were also 18% of value-added sales in 2013, 19% of value-added sales in 2012 and 18% of value-added sales in 2011.
The lower expense total in 2013 as compared to 2012 was due to a reduction in incentive compensation expense, differences in currency exchange gains and losses and lower selling expenses. The translation impact on foreign currency expenses also was favorable in 2013. These reductions in expenses were partially offset by an increase in corporate charges and higher R&D costs.
The $3.0 million reduction in expenses in 2012 from 2011 was largely due to differences in exchange gains and losses between years and a reduction in domestic selling expenses. These reductions were partially offset by higher corporate costs in 2012 and a one-time litigation gain from a lawsuit against a utility provider over billing rates recorded in 2011. R&D expenses and incentive compensation costs were relatively unchanged in 2012 as compared to 2011.
Operating profit from Performance Alloys was $23.4 million in 2013 compared to $24.0 million in 2012. This $0.6 million decline in profitability was caused by the lower gross margin, which was due to manufacturing inefficiencies, higher ore costs and other factors, offset in part by a reduction in expenses. Operating profit in 2012 was $3.2 million lower than the operating profit of $27.2 million in 2011. Operating profit was 8% of sales in each of the three years presented. Operating profit was also 10% of value-added sales in 2013 and 2012 and 11% of value-added sales in 2011.
Beryllium and Composites
(Millions) 2013 2012 2011
Net sales ............................................................................................... $ 61.3 $ 60.0 $ 60.6Operating (loss) .................................................................................... (3.5) (3.9) (0.8)
Beryllium and Composites manufactures beryllium-based metals and metal matrix composites in rod, sheet, foil and a variety of customized forms. These materials are used in applications that require high stiffness and/or low density and they tend to be premium-priced due to their unique combination of properties. This segment also manufactures beryllia ceramic products. The acquisition of AMC in the first quarter 2012 provides a complementary family of non-beryllium-based alloys and composites. Defense and science is the largest market for Beryllium and Composites, while other markets served include industrial components and commercial aerospace, medical, energy and telecommunications infrastructure. Products are also sold for acoustics, optical scanning and performance automotive applications. Manufacturing facilities for Beryllium and Composites are located in Ohio, California, Arizona and England.
Sales by Beryllium and Composites totaled $61.3 million in 2013, a 2% increase from sales of $60.0 million in 2012. Sales in 2012 were slightly lower than sales of $60.6 million in 2011. Beryllium and Composites does not directly pass through changes in the costs of its materials sold, so under our definition, sales and value-added sales for this segment are the same.
Sales to the defense and science market, which accounted for more than half of Beryllium and Composites’ sales in 2013, grew approximately 8% in 2013 over 2012 after declining 6% in 2012 from 2011. Defense applications for these products include strategic missile defense systems, airborne optical payloads and advanced lightweight avionic packaging. Sales for defense applications are affected by our product development and marketing efforts as well as the timing of program releases and the funding of government budgets in a given year. While the government sequestration had a negative effect on our sales and order entry to a certain extent in 2013, our defense sales grew in total as a number of key projects that utilize our materials, including the SM-3 missile defense system and the F-35 fighter jet, were funded and not subject to significant cutbacks in 2013.
Sales for nuclear medicine and other science applications, which are a major long-term growth platform for beryllium products, contributed to the growth in sales in the defense and science market in 2013. In 2012, softer defense sales were partially offset by improved sales for science applications, including shipments for a nuclear fusion test reactor (ITER) and the Large Hadron Collider in Europe. Beryllium metal’s nuclear properties make it ideal to serve as a neutron reflector and moderator in the design of scientific nuclear test reactors.
Industrial components and commercial aerospace market sales declined approximately 5% in 2013 from 2012 after growing 2% in 2012 from 2011. The lower sales in 2013 were primarily due to weaker demand for industrial x-ray applications and lower

32
sales of AMC products. Demand for AlBeMet®, a metal matrix composite, for applications in semiconductor manufacturing and inspection equipment has been soft for approximately two years. However, order entry levels for these applications improved in the second half of 2013 for shipments in future periods. The growth in sales to this market in 2012 over 2011 was due to the acquisition of AMC.
Sales of beryllium speaker domes for acoustic diaphragm assemblies were unchanged in 2013 from 2012 after growing modestly in 2012 and 2011. Beryllium’s unique combination of properties reduces mechanical deformation in sound, shifting the resonant frequencies inherent in other materials outside of the audible range. Our speaker domes are used in high-end commercial, entertainment and consumer applications and, while sales remained minor in 2013, we believe that this application represents a long-term growth opportunity for our materials.
Medical market sales declined 19% in 2013 from 2012 and 17% in 2012 from 2011. The decline in both years was due to lower sales of x-ray windows and assemblies and beryllia ceramics for medical laser applications.
Sales of beryllia ceramic for applications within the telecommunications infrastructure market showed solid growth in 2013 over 2012, rebounding from a slight decline in 2012 from 2011.
Gross margin generated by Beryllium and Composites was $12.3 million (20% of sales) in 2013, $11.3 million (19% of sales) in 2012 and $12.1 million (20% of sales) in 2011.
Progress was made with the new beryllium facility at our Elmore plant site during 2013. This operation is designed to produce pure beryllium metal from beryllium hydroxide that is mined by our Utah operations allowing us to significantly reduce our dependency upon external sources for pure beryllium metal. In prior periods, manufacturing inefficiencies, start-up and maintenance costs and inconsistent production levels resulted in disruptions to the material flow and lower gross margins. A number of these issues continued into 2013, but manufacturing efficiencies improved and the productive output increased sequentially each quarter during the year. While the plant did not operate for the full year at the designed level of output and cost, it operated at a level during the fourth quarter 2013 that would be sufficient to satisfy the projected 2014 demand.
The gross margin in 2013 also benefited from the slight increase in sales volume as well as a favorable change in product mix that resulted from the increase in pure beryllium metal sales, which generate higher margins. Scrap reclamation and the use of purchased scrap provided a benefit to gross margin in 2013 as well. These benefits were partially offset by an increase in incurred manufacturing overhead costs at the Elmore operations.
Gross margin in 2012 benefited from a favorable change in product mix, primarily due to an increase in sales of beryllium metal products and a decrease in sales of AlBeMet®, which typically generate lower margins. Improved pricing on beryllia ceramic products also provided a margin benefit in 2012 compared to 2011. Offsetting these benefits was the negative impact of the slightly lower sales volume and the related lower production volumes. Manufacturing overhead costs increased $0.6 million in Elmore in 2012 over 2011, largely depreciation and utilities associated with the new facility. Manufacturing overhead costs at the Fremont, California facility also increased, including manpower and outside services.
Total SG&A, R&D and other-net expenses were $15.8 million (26% of sales) in 2013, $15.2 million (25% of sales) in 2012 and $12.9 million (21% of sales) in 2011. The main cause for the higher expenses in 2013 was increased activity on R&D projects, including bulk metallic glass, amorphous metals and investment casting technology projects. Corporate charges were also higher in 2013 than in 2012, while other selling and administrative costs declined slightly.
The expenses incurred by AMC subsequent to its acquisition were a major cause of the increase in expenses in 2012 over 2011. R&D expenses grew 8% in 2012 over 2011 due to increased activity and various projects. Corporate charges also increased in 2012 over 2011 while incentive compensation declined in 2012 due to the segment’s performance against the design of the plans.
Beryllium and Composites generated an operating loss of $3.5 million in 2013 compared to an operating loss of $3.9 million in 2012. This segment also had an operating loss of $0.8 million in 2011. The slight improvement in the operating loss in 2013 compared to 2012 resulted from the higher gross margin (due to efficiency gains in the new plant, a favorable product mix and other factors) offset in part by an increase in expenses. The increased operating loss in 2012 was due to the reduced gross margin, caused by the lower sales volume and other factors, and the additional expenses.
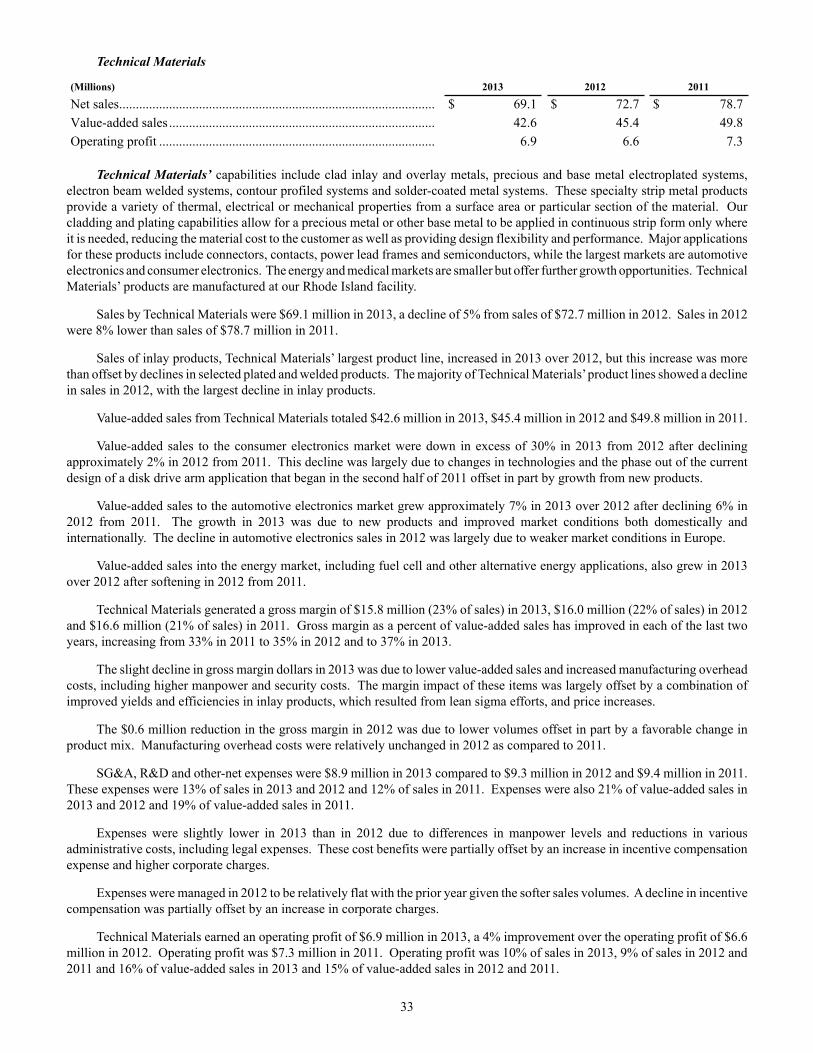
33
Technical Materials
(Millions) 2013 2012 2011
Net sales............................................................................................... $ 69.1 $ 72.7 $ 78.7Value-added sales ................................................................................ 42.6 45.4 49.8Operating profit ................................................................................... 6.9 6.6 7.3
Technical Materials’ capabilities include clad inlay and overlay metals, precious and base metal electroplated systems, electron beam welded systems, contour profiled systems and solder-coated metal systems. These specialty strip metal products provide a variety of thermal, electrical or mechanical properties from a surface area or particular section of the material. Our cladding and plating capabilities allow for a precious metal or other base metal to be applied in continuous strip form only where it is needed, reducing the material cost to the customer as well as providing design flexibility and performance. Major applications for these products include connectors, contacts, power lead frames and semiconductors, while the largest markets are automotive electronics and consumer electronics. The energy and medical markets are smaller but offer further growth opportunities. Technical Materials’ products are manufactured at our Rhode Island facility.
Sales by Technical Materials were $69.1 million in 2013, a decline of 5% from sales of $72.7 million in 2012. Sales in 2012 were 8% lower than sales of $78.7 million in 2011.
Sales of inlay products, Technical Materials’ largest product line, increased in 2013 over 2012, but this increase was more than offset by declines in selected plated and welded products. The majority of Technical Materials’ product lines showed a decline in sales in 2012, with the largest decline in inlay products.
Value-added sales from Technical Materials totaled $42.6 million in 2013, $45.4 million in 2012 and $49.8 million in 2011.
Value-added sales to the consumer electronics market were down in excess of 30% in 2013 from 2012 after declining approximately 2% in 2012 from 2011. This decline was largely due to changes in technologies and the phase out of the current design of a disk drive arm application that began in the second half of 2011 offset in part by growth from new products.
Value-added sales to the automotive electronics market grew approximately 7% in 2013 over 2012 after declining 6% in 2012 from 2011. The growth in 2013 was due to new products and improved market conditions both domestically and internationally. The decline in automotive electronics sales in 2012 was largely due to weaker market conditions in Europe.
Value-added sales into the energy market, including fuel cell and other alternative energy applications, also grew in 2013 over 2012 after softening in 2012 from 2011.
Technical Materials generated a gross margin of $15.8 million (23% of sales) in 2013, $16.0 million (22% of sales) in 2012 and $16.6 million (21% of sales) in 2011. Gross margin as a percent of value-added sales has improved in each of the last two years, increasing from 33% in 2011 to 35% in 2012 and to 37% in 2013.
The slight decline in gross margin dollars in 2013 was due to lower value-added sales and increased manufacturing overhead costs, including higher manpower and security costs. The margin impact of these items was largely offset by a combination of improved yields and efficiencies in inlay products, which resulted from lean sigma efforts, and price increases.
The $0.6 million reduction in the gross margin in 2012 was due to lower volumes offset in part by a favorable change in product mix. Manufacturing overhead costs were relatively unchanged in 2012 as compared to 2011.
SG&A, R&D and other-net expenses were $8.9 million in 2013 compared to $9.3 million in 2012 and $9.4 million in 2011. These expenses were 13% of sales in 2013 and 2012 and 12% of sales in 2011. Expenses were also 21% of value-added sales in 2013 and 2012 and 19% of value-added sales in 2011.
Expenses were slightly lower in 2013 than in 2012 due to differences in manpower levels and reductions in various administrative costs, including legal expenses. These cost benefits were partially offset by an increase in incentive compensation expense and higher corporate charges.
Expenses were managed in 2012 to be relatively flat with the prior year given the softer sales volumes. A decline in incentive compensation was partially offset by an increase in corporate charges.
Technical Materials earned an operating profit of $6.9 million in 2013, a 4% improvement over the operating profit of $6.6 million in 2012. Operating profit was $7.3 million in 2011. Operating profit was 10% of sales in 2013, 9% of sales in 2012 and 2011 and 16% of value-added sales in 2013 and 15% of value-added sales in 2012 and 2011.

34
International Sales and Operations
We operate in worldwide markets and our international customer base continues to expand geographically. In Asia, we have strategically located our facilities in Japan, Singapore, China, Korea, Taiwan and the Philippines while our European facilities are in Germany, the United Kingdom and Ireland. Our two most recent acquisitions, AMC and EIS, are based overseas.
Our international operations provide a combination of manufacturing, finishing operations, local sales support and distribution services and are designed to provide a cost-effective method of capturing the growing overseas demand for our products over the long term. We also augment our sales and distribution efforts with an established network of independent distributors and agents throughout the world.
The following table summarizes total international sales by region for the last three years:
(Millions) 2013 2012 2011
Asia................................................................................................... $ 175.4 $ 219.8 $ 203.9Europe .............................................................................................. 157.7 137.6 147.6Rest of world .................................................................................... 23.1 33.7 31.5Total.................................................................................................. $ 356.2 $ 391.1 $ 383.0Percent of total sales......................................................................... 31% 31% 25%
International sales include sales from international operations and direct exports from our U.S. operations. The international sales in the above chart are included in the individual segment sales previously discussed.
Total international sales declined 9% in 2013 from 2012 as Asian sales declined approximately 20% while European sales grew 15%. A portion of the growth in Europe was due to improved demand from the automotive electronics market, while a portion of the lower Asian sales was due to the weaker yen in 2013. Total international sales improved approximately 2% in 2012 over 2011. This growth was due to the acquisitions of EIS and AMC as sales from the existing operations were lower in 2012 than in 2011. The lower sales to Europe in 2012 were reflective of the weaker economic conditions and the decline in shipments to the appliance market.
Sales from the European and certain Asian operations are denominated in their local currencies. Exports from the U.S. and the balance of the sales from the Asian operations are typically denominated in U.S. dollars. Local competition generally limits our ability to adjust selling prices upwards to compensate for short-term unfavorable exchange rate movements.
We have a hedge program with the objective of minimizing the impact of fluctuating currency values on our consolidated operating profit. See “Critical Accounting Policies”.

35
Value-Added Sales - Reconciliation of Non-GAAP Measure
A reconciliation of sales to value-added sales, a non-GAAP measure, for each reportable segment and for the Company in total for 2013, 2012 and 2011 is as follows:
(Millions) 2013 2012 2011
SalesAdvanced Material Technologies................................................... $ 744.3 $ 847.8 $ 1,051.8Performance Alloys........................................................................ 292.2 292.5 335.3Beryllium and Composites ............................................................. 61.3 60.0 60.6Technical Materials ........................................................................ 69.1 72.7 78.7All Other......................................................................................... — 0.1 0.3Total................................................................................................ $ 1,166.9 $ 1,273.1 $ 1,526.7
Less: pass-through metal costAdvanced Material Technologies................................................... $ 474.3 $ 569.3 $ 773.8Performance Alloys........................................................................ 57.0 60.9 77.5Beryllium and Composites ............................................................. — — —Technical Materials ........................................................................ 26.5 27.3 28.9All Other......................................................................................... — — —Total................................................................................................ $ 557.8 $ 657.5 $ 880.2
Value-added salesAdvanced Material Technologies................................................... $ 270.0 $ 278.5 $ 278.0Performance Alloys........................................................................ 235.2 231.6 257.8Beryllium and Composites ............................................................. 61.3 60.0 60.6Technical Materials ........................................................................ 42.6 45.4 49.8All Other......................................................................................... — 0.1 0.3Total................................................................................................ $ 609.1 $ 615.6 $ 646.5
The cost of gold, silver, platinum, palladium and copper can be quite volatile. Our pricing policy is to directly pass the cost of these metals on to the customer in order to mitigate the impact of metal price volatility on our results from operations. Trends and comparisons of sales are affected by movements in the market prices of these metals, but changes in sales due to metal price movements may not have a proportionate impact our profitability.
Internally, management reviews sales on a value-added basis. Value-added sales is a non-GAAP measure that deducts the value of the pass-through metals sold from sales. Value-added sales allows management to assess the impact of differences in sales between periods, segments or markets and analyze the resulting margins and profitability without the distortion of the movements in the pass-through metal values. The dollar amount of gross margin and operating profit is not affected by the value-added sales calculation. We sell other metals and materials that are not considered direct pass-throughs and their costs are not deducted from sales when calculating value-added sales.
Our sales are also affected by changes in the use of customer-supplied metal. When we manufacture a precious metal product, the customer may purchase metal from us or may elect to provide its own metal, in which case we process the metal on a toll basis and the metal value does not flow through sales or cost of sales. In either case, we generally earn our margin based upon our fabrication efforts. The relationship of that margin to sales can change depending upon whether the product was made from our metal or the customer’s metal. The use of value-added sales removes the potential distortion in the comparison of sales caused by changes in the level of customer-supplied metal.
By presenting information on sales and value-added sales, it is our intention to allow users of our financial statements to review our sales with and without the impact of the pass-through metals.
Legal Proceedings
One of our subsidiaries, Materion Brush Inc., is a defendant from time to time in proceedings in various state and federal courts brought by plaintiffs alleging that they have contracted chronic beryllium disease or other lung conditions as a result of

36
exposure to beryllium. Plaintiffs in beryllium cases generally seek recovery under negligence and various other legal theories and seek compensatory and punitive damages, in many cases of an unspecified sum. Spouses, if any, often claim loss of consortium.
Two beryllium cases were outstanding as of year-end 2013. One of these cases was filed in 2013 and the other was filed in 2012. We recorded a loss reserve of $0.1 million in the aggregate as of December 31, 2013 for these two cases. There were no cases dismissed or settled during 2013 and 2012. There were no new cases filed against us in 2011. Two beryllium cases were outstanding in 2011 that were filed in a prior year; one of these was dismissed and the other one was settled for less than $0.1 million during 2011.
Additional beryllium claims may arise. Management believes that we have substantial defenses in these types of cases and intends to contest the suits vigorously should they arise. Employee cases, in which plaintiffs have a high burden of proof, have historically involved relatively small losses to us. Third-party plaintiffs (typically employees of customers or contractors) face a lower burden of proof than do employees or former employees, but these cases are generally covered by varying levels of insurance.
Although it is not possible to predict the outcome of any litigation, we provide for costs related to these matters when a loss is probable and the amount is reasonably estimable. Litigation is subject to many uncertainties, and it is possible that some of these actions could be decided unfavorably in amounts exceeding our reserves. An unfavorable outcome or settlement of a beryllium case or adverse media coverage could encourage the commencement of additional similar litigation. We are unable to estimate our potential exposure to unasserted claims.
Based upon currently known facts and out experience with beryllium cases and assuming collectibility of insurance, we do not believe that resolution of future beryllium proceedings will have a material adverse effect on our financial condition or cash flow. However, our results of operations could be materially affected by unfavorable results in one or more of these cases.
Regulatory Matters. Standards for exposure to beryllium are under review by the United States Occupational Safety and Health Administration (OSHA) and by other governmental and private standard-setting organizations. One result of these reviews will likely be more stringent worker safety standards. Some organizations, such as the California Occupational Health and Safety Administration and the American Conference of Governmental Industrial Hygienists, have adopted standards that are more stringent than the current standards of OSHA. The development, proposal or adoption of more stringent standards may affect the buying decisions by the users of beryllium-containing products. If the standards are made more stringent and/or our customers or other downstream users decide to reduce their use of beryllium-containing products, our results of operations, liquidity and financial condition could be materially adversely affected. The impact of this potential adverse effect would depend on the nature and extent of the changes to the standards, the cost and ability to meet the new standards, the extent of any reduction in customer use and other factors. The magnitude of this potential adverse effect cannot be estimated.
FINANCIAL POSITION
Net cash provided from operations totaled $75.9 million in 2013 as a result of net income, the effects of depreciation and amortization, a decline in accounts receivable and the net movements in other working capital items. Cash provided from operations in the fourth quarter 2013 was $37.4 million, almost half of the total cash provided from operations for the full year.
Cash provided from operations was $38.6 million in 2012 as net income and the effects of depreciation more than offset a net increase in working capital items. Cash provided from operations was a strong $46.0 million in the fourth quarter 2012 partially due to the collection of accounts receivable and a reduction in inventory.
In 2011, cash provided from operations was $56.8 million. Cash used in operations totaled $11.7 million through the first three quarters of 2011 as a result of increases in receivables and inventory, contributions to the domestic pension plan, payment of the 2010 incentive compensation and changes in other items. In the fourth quarter 2011, however, a decline in receivables, coupled with other improvements, resulted in cash flow from operations of $68.5 million in that period.
As previously noted, changes in the cost of precious and base metals are essentially passed on to customers. Therefore, while sudden movements in the price of metals can cause a temporary imbalance in our cash receipts and payments in either direction, once prices stabilize our cash flow tends to stabilize as well.
Working Capital
Cash totaled $22.8 million as of December 31, 2013, an increase of $6.7 million from the cash balance of $16.1 million as of December 31, 2012. Cash increased $3.8 million in 2012 as compared to 2011.
Accounts receivable totaled $112.8 million as of year-end 2013, a decline of $13.7 million, or 11%, from the year-end 2012 balance of $126.5 million. This decline was largely due to the lower sales in the fourth quarter 2013 compared to the fourth quarter

37
2012. In addition to the impact of the lower sales on the receivable balance, the days sales outstanding (DSO), a measure of how fast receivables are collected, improved from approximately 37 days at the end of 2012 to 36 days at the end of 2013.
The year-end 2012 accounts receivable balance was $8.7 million, or 7%, higher than the accounts receivable balance of $117.8 million as of year-end 2011. This growth was primarily due to a five day slow down in the DSO. The slower DSO was due in part to a decline in sales of precious metal products, which typically have a very short collection period. The 37 day collection period is within our normal operating range.
The expense for accounts written off to bad debts and changes in the allowance for doubtful accounts remained low at $0.1 million in 2013 and $0.4 million in 2012.
We have procedures in place to closely monitor our accounts receivable aging and to follow-up on past due accounts. We evaluate the credit position of new customers in advance of the initial sale and we evaluate our existing customers’ credit positions on an ongoing basis. We will revise credit terms offered to our customers as conditions warrant in order to minimize our exposures. Credit terms may vary by country based upon local customary practices and competition. Billings for precious metals tend to have tighter payment terms than billings for other products. Advance billings are used from time to time to help reduce credit exposures and speed up the collection of cash.
Inventories were $213.4 million as of year-end 2013, an increase of $7.3 million, or 4%, over the inventory balance of $206.1 million as of year-end 2012. The inventory turnover ratio, a measure of how quickly inventory is utilized, slowed down during the year.
The inventory increase was within the Beryllium and Composites segment as its inventory balance of $35.1 million as of year-end 2013 was higher than year-end 2012 as a result of the purchase of feedstock during the year to augment production from the new beryllium plant in order to meet demand, the strong output from the new plant in the fourth quarter that was still in work-in-process inventory as of year-end, shipments originally planned for the fourth quarter 2013 but delayed into 2014 and other factors. Beryllium and Composites also has a relatively long manufacturing processing time. Inventory at our Utah mine and mill grew 15% during 2013 due to the opening of a new pit and increased extraction activity, the higher ore cost and in order to support the additional production requirements of the beryllium plant in Elmore.
Inventories within the other reportable segments declined during 2013 as a result of lower sales, inventory control efforts and other causes.
Inventories increased $18.9 million, or 10%, in 2012 over the inventory balance of $187.2 million as of year-end 2011, as the turnover ratio slowed down during that year as well.
The inventory increase in 2012 was predominately within Performance Alloys with only minor changes in inventories within the other segments. Performance Alloys inventory, which totaled $123.6 million at year-end 2012, increased as a result of product mix shifts, growth in various bulk products that have longer processing times, strategic inventory investments and the level loading of production schedules. Inventories at our Utah operations, which are part of the Performance Alloys segment, increased $1.7 million in 2012 over 2011, partially due to the higher cost of ore mined.
The acquisition of AMC in 2012 contributed a small increase in our total inventory balances in that year, while the delayed start-up of the beryllium facility in Elmore had a minor impact on the inventory growth in 2012.
For further information on inventory values and the last-in, first-out (LIFO) accounting method, see “Critical Accounting Policies” below.
Intangible assets totaled $24.2 million as of the end of 2013 compared to $28.9 million as of the end of 2012. The $4.7 million decline was due to amortization of $6.2 million offset in part by new deferred financing costs of $1.5 million. Intangible assets declined $6.1 million in 2012 due to amortization of $6.6 million offset in part by intangible assets of $0.5 million acquired with AMC.
See Note E to the Consolidated Financial Statements for additional details on our intangible assets.
Other liabilities and accrued items of $25.1 million as of December 31, 2013 were $1.9 million lower than the balance as of December 31, 2012 due to the payments for work on a small environmental remediation project, lower workers’ compensation accruals and other items. The 2012 year-end balance of $27.0 million was $1.1 million higher than the previous year-end due to changes in activity levels and normal movements in the accruals.
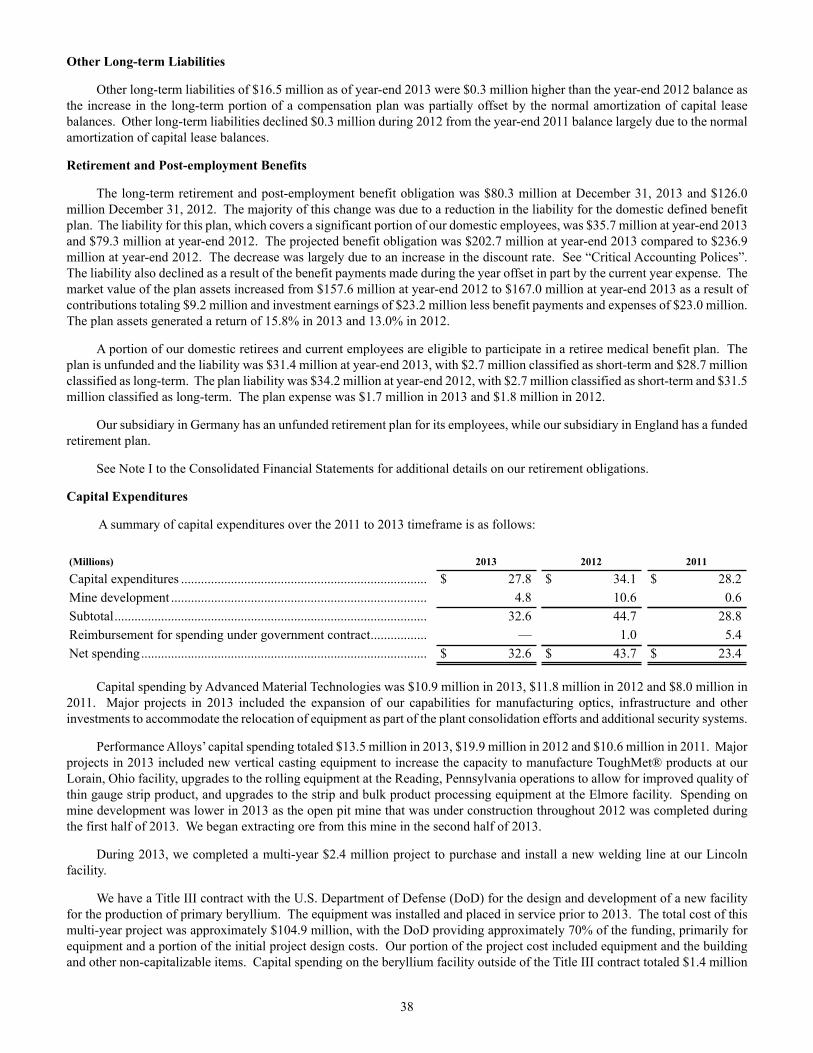
38
Other Long-term Liabilities
Other long-term liabilities of $16.5 million as of year-end 2013 were $0.3 million higher than the year-end 2012 balance as the increase in the long-term portion of a compensation plan was partially offset by the normal amortization of capital lease balances. Other long-term liabilities declined $0.3 million during 2012 from the year-end 2011 balance largely due to the normal amortization of capital lease balances.
Retirement and Post-employment Benefits
The long-term retirement and post-employment benefit obligation was $80.3 million at December 31, 2013 and $126.0 million December 31, 2012. The majority of this change was due to a reduction in the liability for the domestic defined benefit plan. The liability for this plan, which covers a significant portion of our domestic employees, was $35.7 million at year-end 2013 and $79.3 million at year-end 2012. The projected benefit obligation was $202.7 million at year-end 2013 compared to $236.9 million at year-end 2012. The decrease was largely due to an increase in the discount rate. See “Critical Accounting Polices”. The liability also declined as a result of the benefit payments made during the year offset in part by the current year expense. The market value of the plan assets increased from $157.6 million at year-end 2012 to $167.0 million at year-end 2013 as a result of contributions totaling $9.2 million and investment earnings of $23.2 million less benefit payments and expenses of $23.0 million. The plan assets generated a return of 15.8% in 2013 and 13.0% in 2012.
A portion of our domestic retirees and current employees are eligible to participate in a retiree medical benefit plan. The plan is unfunded and the liability was $31.4 million at year-end 2013, with $2.7 million classified as short-term and $28.7 million classified as long-term. The plan liability was $34.2 million at year-end 2012, with $2.7 million classified as short-term and $31.5 million classified as long-term. The plan expense was $1.7 million in 2013 and $1.8 million in 2012.
Our subsidiary in Germany has an unfunded retirement plan for its employees, while our subsidiary in England has a funded retirement plan.
See Note I to the Consolidated Financial Statements for additional details on our retirement obligations.
Capital Expenditures
A summary of capital expenditures over the 2011 to 2013 timeframe is as follows:
(Millions) 2013 2012 2011
Capital expenditures .......................................................................... $ 27.8 $ 34.1 $ 28.2Mine development ............................................................................. 4.8 10.6 0.6Subtotal.............................................................................................. 32.6 44.7 28.8Reimbursement for spending under government contract................. — 1.0 5.4Net spending...................................................................................... $ 32.6 $ 43.7 $ 23.4
Capital spending by Advanced Material Technologies was $10.9 million in 2013, $11.8 million in 2012 and $8.0 million in 2011. Major projects in 2013 included the expansion of our capabilities for manufacturing optics, infrastructure and other investments to accommodate the relocation of equipment as part of the plant consolidation efforts and additional security systems.
Performance Alloys’ capital spending totaled $13.5 million in 2013, $19.9 million in 2012 and $10.6 million in 2011. Major projects in 2013 included new vertical casting equipment to increase the capacity to manufacture ToughMet® products at our Lorain, Ohio facility, upgrades to the rolling equipment at the Reading, Pennsylvania operations to allow for improved quality of thin gauge strip product, and upgrades to the strip and bulk product processing equipment at the Elmore facility. Spending on mine development was lower in 2013 as the open pit mine that was under construction throughout 2012 was completed during the first half of 2013. We began extracting ore from this mine in the second half of 2013.
During 2013, we completed a multi-year $2.4 million project to purchase and install a new welding line at our Lincoln facility.
We have a Title III contract with the U.S. Department of Defense (DoD) for the design and development of a new facility for the production of primary beryllium. The equipment was installed and placed in service prior to 2013. The total cost of this multi-year project was approximately $104.9 million, with the DoD providing approximately 70% of the funding, primarily for equipment and a portion of the initial project design costs. Our portion of the project cost included equipment and the building and other non-capitalizable items. Capital spending on the beryllium facility outside of the Title III contract totaled $1.4 million

39
in 2013. Spending on the facility was $5.0 million in 2012 and is included in the $34.1 million total in the above table while spending on this project totaled $5.1 million in 2011.
Reimbursements from the DoD are recorded as unearned income, a liability on the Consolidated Balance Sheet. See “Critical Accounting Policies” below for further discussion. The spending and reimbursement received from the government may differ in a given year due to the normal lag between when the spending occurs and the government issues the reimbursement.
We worked on various software upgrades and implementations during the 2011 to 2013 timeframe, including a new sales and operations planning software package in 2013.
Acquisitions
In addition to the above capital expenditures, we acquired the following businesses in the 2011 to 2013 timeframe:
(Millions) Year CostAcquiredGoodwill
Aerospace Metal Composites Limited.................................................. 2012 $ 3.3 $ 1.9EIS Optics Limited ............................................................................... 2011 24.5 13.9
The EIS acquisition cost includes $0.6 million that was paid in 2012 as a result of the resolution of valuation adjustments in accordance with the purchase agreement. The acquisition costs shown are net of cash acquired, if any. Both of these acquisitions were financed with a combination of cash on hand and borrowings under the revolving credit agreement. See Note B to the Consolidated Financial Statements.
Debt
Total outstanding debt decreased from $94.3 million at year-end 2012 to $64.8 million as of year-end 2013 as a result of the cash provided from operations.
Debt increased $12.9 million in 2012, largely due to the net growth in inventory and other working capital items, capital expenditures, the acquisition of AMC and the payment of dividends.
Short-term debt was $35.5 million at December 31, 2013 versus $49.4 million at December 31, 2012. Long-term debt was $29.3 million at year-end 2013 compared to $44.9 million at year-end 2012.
Shareholders’ Equity
Shareholders’ equity was $463.3 million at year-end 2013, an increase of $48.3 million over the year-end 2012 balance of $415.0 million. Equity increased $9.0 million in 2012. Major causes for the changes in equity in both years included comprehensive income, share repurchases, option exercises and the payment of dividends.
Comprehensive income was $48.2 million in 2013 and $8.4 million in 2012. As a result of a change in accounting regulations, beginning in 2012, comprehensive income is presented in a separate financial statement as opposed to being detailed in a footnote. Comprehensive income is net income plus items that are charged or credited directly to shareholders’ equity, including the cumulative translation adjustment, changes in the fair value of derivative financial instruments and adjustments to the pension and other retirement benefit obligations.
Our Board of Directors implemented a dividend program in the second quarter 2012. Dividends declared totaled $6.6 million in 2013 and $4.6 million in 2012.
We received $1.2 million from the exercise of approximately 74,000 options in 2013 and $0.2 million from the exercise of approximately 16,000 options in 2012.
We repurchased approximately 6,000 shares of our common stock at a cost of $0.1 million in 2012. These repurchases were made under a share buyback program initially approved by the Board of Directors in 2008. We did not repurchase any shares in 2013.
Equity was also affected by stock-based compensation expense, the tax benefits on stock compensation realization and other factors in both 2013 and 2012.

40
Off-balance Sheet Obligations
We maintain the majority of the precious metals we use in production and a portion of our copper requirements on a consignment basis in order to reduce our exposure to metal price movements and to reduce our working capital investment. See “Quantitative and Qualitative Disclosures about Market Risk”. The notional value of the off-balance sheet metal was $255.8 million as of year-end 2013 versus $286.9 million as of year-end 2012. This decrease was due to lower metal prices as of December 31, 2013 compared to prices as of December 31, 2012 offset in part by an increase in ounces on hand.
We were in compliance with all of the covenants contained in the consignment agreements as of December 31, 2013.
Contractual Obligations
A summary of payments to be made under long-term debt agreements, operating leases, significant capital leases, pension plan contributions and material purchase commitments by year is as follows:
(Millions) 2014 2015 2016 2017 2018There-after Total
Long-term debt ............................... $ 0.6 $ 0.7 $ 9.0 $ 0.7 $ 15.8 $ 3.1 $ 29.9Non-cancelable lease payments ..... 6.9 6.2 5.3 4.0 3.4 12.1 37.9Capital lease payments ................... 1.1 1.1 1.1 1.0 1.0 4.7 10.0Pension plan contribution............... 19.0 — — — — — 19.0Purchase commitments................... 4.2 — — — — — 4.2Total................................................ $ 31.8 $ 8.0 $ 15.4 $ 5.7 $ 20.2 $ 19.9 $ 101.0
The revolving credit agreement matures in 2018 and the long-term debt repayment in 2018 in the above chart includes $15.0 million borrowed under this agreement as of year-end 2013. In the past, we have renegotiated a new facility prior to the maturity of the then-existing credit facility, and we anticipate that we would do the same in the future. However, we cannot guarantee that a replacement facility will have similar terms as the existing facility. See Note F to the Consolidated Financial Statements for additional debt information.
The non-cancelable lease payments represent payments under operating leases with initial lease terms in excess of one year as of December 31, 2013. The capital lease payments include a building at the Elmore site and other material capital leases. See Note G to the Consolidated Financial Statements for further leasing details.
The pension plan contribution of $19.0 million in the above table represents our best estimate of the contribution to be made to the domestic defined benefit plan as of early 2014. See "Liquidity" discussion below.
The purchase commitments of $4.2 million are for capital equipment to be acquired in 2014 based on orders placed with vendors as of December 31, 2013.
Liquidity
We believe that cash flow from operations plus the available borrowing capacity and the current cash balance are adequate to support operating requirements, capital expenditures, projected pension plan contributions, the current dividend and share repurchase programs, environmental remediation projects and strategic acquisitions.
A summary of key data relative to our liquidity, including the outstanding debt, cash balances, available borrowing capacity and the debt-to-debt-plus-equity ratio, as of the end of each of the last three years is as follows:
December 31,(Dollars in millions) 2013 2012 2011
Total outstanding debt............................................................................. $ 64.8 $ 94.3 $ 81.4Cash......................................................................................................... 22.8 16.1 12.3Debt net of cash....................................................................................... $ 42.0 $ 78.2 $ 69.1Available borrowing capacity ................................................................. $ 186.8 $ 189.5 $ 274.9Debt-to-debt-plus-equity ratio................................................................. 12% 19% 17%
Debt net of cash is a non-GAAP measure. We are providing this information because we believe it is more indicative of our overall financial position. It is also a measure our management uses to assess financing and other decisions.

41
The cumulative cash flow provided from operations in 2012 and 2013 totaled $114.5 million and is net of contributions to the domestic defined benefit plan of $21.1 million. This cash flow allowed us to fund capital expenditures of $76.3 million, the acquisition of AMC and dividends of $11.1 million, while debt net of cash declined $27.1 million during these two years.
The debt-to-debt-plus-equity ratio improved to 12% as of December 31, 2013 from 19% as of December 31, 2012 due to the decline in debt and the growth in equity. This ratio is lower than our long-term average, and we believe that, given our typical cash flow from operations, we can support a higher leverage ratio in future periods.
The available borrowing capacity in the table above represents the additional amounts that could be borrowed under the revolving credit facility and other secured lines existing as of December 31 of each year depicted. The applicable debt covenants have been taken into account when determining the available borrowing capacity, including the covenant that restricts the borrowing capacity to a multiple of the twelve-month trailing earnings before interest, income taxes, depreciation and amortization and other adjustments. The main cause for the reduction in the available borrowing capacity in 2013 and 2012 was the impact of this covenant and our lower profitability.
We negotiated a new revolving credit facility in the second quarter 2013 that replaced the prior facility that was scheduled to mature in 2016. The new facility is secured and provides up to $375.0 million of borrowing capacity, an increase of $50.0 million over the prior facility. Borrowing rates are based on a spread over LIBOR, with the spreads being slightly lower under the new facility than they were under the old facility. The financial covenants remained unchanged. The new facility matures in 2018.
We were in compliance with all of our debt covenants as of December 31, 2013 and as of early in the first quarter 2014, we do not know of any future or pending changes that will cause us to be in non-compliance with any of our debt covenants in the near term.
The working capital ratio, which compares current assets to current liabilities, was 3.1 to 1.0 as of year-end 2013 versus 2.7 to 1.0 as of year-end 2012.
We intend to pay a quarterly dividend under the program initiated in 2012 on an ongoing basis, subject to a continuing strong capital structure and a determination that the dividend remains in the best interest of the shareholders. We increased the dividend from $0.075 per share to $0.08 per share beginning in the second quarter 2013. The dividend payments subsequent to this increase averaged approximately $1.7 million per quarter.
In January 2014, our Board of Directors authorized the purchase of up to $50.0 million of our common stock. This authorization replaced the prior authorization to purchase up to 1,000,000 shares of stock, of which approximately 600,000 shares had been purchased. We may use several methods to purchase stock, including open market purchases, negotiated block transactions, accelerated share purchases or open market solicitations for shares, some of which may be conducted through Rule 10b5-1 plans. The timing of the share purchases will depend upon several factors, including market and business conditions, our cash flow, debt levels and other investment opportunities. There is no minimum required purchase quantity for a given year and the purchases may be discontinued at any time. We did not purchase any of our common stock in 2013.
Our domestic defined benefit pension plan is under-funded as of year-end 2013. Contributions in future periods will be dependent upon regulatory requirements, the plan funded ratio, plan investment performance, discount rates, actuarial assumptions, plan amendments, our contribution objectives and other factors. Federal legislation enacted during 2012 resulted in a reduction in mandatory contributions in the short term from the levels under the previous regulations, but we may elect to contribute funds in excess of the mandatory levels in a given year depending upon our cash flow from operations and other considerations. As of early in the first quarter 2014, we anticipate contributing approximately $19.0 million to the defined benefit plan in 2014. This estimate, which is in excess of the mandatory contributions, includes a $3.0 million contribution that was deferred from the fourth quarter 2013 to the first quarter 2014. This higher contribution level is designed to minimize our PBGC premium payments as well as to maintain the plan funded ratio in line with our long-term objectives. We also anticipate funding those contributions with cash on hand, cash generated from operations or borrowings under existing lines of credit. It is not practical to estimate the required contributions beyond 2014 at the present time.
The closure of the domestic defined benefit plan to new entrants in the second quarter 2012 will reduce our plan funding requirements in the long term, but it has a minimal impact on our funding requirements in the short term.
During 2013, we offered a one-time opportunity for terminated deferred vested participants in the domestic defined benefit plan the election of a lump sum payment in 2013 in lieu of an annuity upon retirement. The resulting lump sum payouts of $14.8 million were made from the pension plan assets during 2013 and no additional contribution from the Company was required to fund the payments. The lump sum payout option was part of a long term program to reduce risk associated with the pension plan assets and liabilities.
42
Portions of our business utilize off-balance sheet consignment arrangements to finance their metal requirements. Expansion of business volumes and/or higher metal prices can put pressure on the consignment line limitations from time to time. As a result, we have negotiated increases in the available capacity under existing lines, added additional lines and extended the maturity dates of the existing lines in recent years. The available and unused capacity under the metal financing lines totaled approximately $165.6 million as of December 31, 2013.
We have an active environmental compliance program. We estimate the probable cost of identified environmental remediation projects and establish reserves accordingly. The environmental remediation reserve balance was $4.8 million at December 31, 2013 and $5.3 million at December 31, 2012. Payments for environmental projects totaled $0.8 million in 2013 and $0.3 million in 2012. Environmental projects tend to be long term and the associated payments are typically made over a number of years. See Note J to the Consolidated Financial Statements.
Cash on hand does not affect the covenants or the borrowing capacity under our debt agreements. Portions of the cash balances may be invested in high-quality, highly liquid investments with maturities of three months or less from time to time.

43
ORE RESERVES
We have proven and probable reserves of beryllium-bearing bertrandite ore in Juab County, Utah. We own approximately 95 percent of the proven reserves, with the remaining reserves leased from the State of Utah. Approximately 87 percent of the beryllium in ore is recovered in the extraction process at our facility in Utah. We augment our proven reserves of bertrandite ore through the purchase of imported beryl ore from time to time. This ore, which is approximately four percent beryllium, is also processed at the Utah extraction facility.
Proven and probable reserves are based on extensive drilling, sampling, mine modeling and metallurgical testing from which we determine economic feasibility. The term “proven reserves” means reserves for which (a) the quantity is computed from dimensions revealed in outcrops, trenches, workings or drill holes; grade and/or quality are computed from the results of detailed sampling, (b) the sites for inspection, sampling and measurement are spaced so closely and the geologic character is so well defined that size, shape, depth and mineral content of reserves are well-established and (c) are commercially recoverable through open-pit methods.
The term “probable reserves” means reserves for which quantity and grade and/or quality are computed from information similar to that used for proven reserves, but the sites for inspection, sampling, and measurement are farther apart or are otherwise less adequately spaced. The degree of assurance, although lower than that for proven reserves, is high enough to assume continuity between points of observation. A summary of our proven and probable reserves is as follows:
Proven Probable Total
As of December 31, 2013Tonnage (in thousands) ...................................................................................... 6,173 3,519 9,692Grade (% beryllium)........................................................................................... 0.263% 0.232% 0.252%Beryllium pounds (in millions) .......................................................................... 32.48 16.33 48.81
As of December 31, 2012Tonnage (in thousands) ...................................................................................... 6,250 3,519 9,769Grade (% beryllium)........................................................................................... 0.264% 0.232% 0.252%Beryllium pounds (in millions) .......................................................................... 33.00 16.33 49.33
Based upon average production levels in recent years and our near-term production forecasts, proven reserves would last over 75 years. Efforts are underway to further analyze, quantify and develop the reserves classified as probable. The inclusion of probable reserves as proven reserves could provide more than 25 years of additional reserve life. The table below details our production of beryllium at our Utah location during the 2011 to 2013 timeframe.
(Thousands of Pounds of Beryllium) 2013 2012 2011
Domestic ore ........................................................................................... 514 486 520Non-domestic ore .................................................................................... 17 17 28Unyielded total ........................................................................................ 531 503 548Annual yield ............................................................................................ 85% 87% 88%Beryllium produced................................................................................. 450 438 482
CRITICAL ACCOUNTING POLICIES
The preparation of financial statements requires the inherent use of estimates and management’s judgment in establishing those estimates. The following are the most significant accounting policies we use that rely upon management’s judgment.
Accrued Liabilities. We have various accruals on our balance sheet that are based in part upon management’s judgment, including accruals for litigation, environmental remediation and workers’ compensation costs. We establish accrual balances at the best estimate determined by a review of the available facts and trends by management and independent advisors and specialists as appropriate. Absent a best estimate, the accrual is established at the low end of the estimated reasonable range in accordance with accounting guidelines. Litigation and environmental accruals are established only for identified and/or asserted claims; future claims, therefore, could give rise to increases to the accruals. The accruals are adjusted as facts and circumstances change as well as for changes in our strategies or the pertinent regulatory requirements. Since these accruals are estimates, the ultimate resolution

44
may be greater or less than the established accrual balance for a variety of reasons, including court decisions, additional discovery, inflation levels, cost control efforts and resolution of similar cases. Changes to the accruals would then result in an additional charge or credit to income in the period when the change was made. See Note J to the Consolidated Financial Statements.
Legal claims may be subject to partial or complete insurance recovery. The accrued liability is recorded at the gross amount of the estimated cost and the insurance recoverable, if any, is recorded as an asset and is not netted against the liability. The accrued legal liability includes the estimated indemnity cost only, if any, to resolve the claim through a settlement or court verdict. The legal defense costs are not included in the accrual and are expensed in the period incurred, with the level of expense in a given year affected by the number and types of claims we are actively defending.
Non-employee claims for beryllium disease made prior to 2022 where any of the alleged exposure period is prior to year-end 2007 are covered by insurance. The insurance covers defense costs and indemnity payments (resulting from settlements or court verdicts) and is subject to a $1.0 million annual deductible. In 2013 and 2012, defense and indemnity costs were less than the deductible.
Pensions. Carrying values of the defined benefit pension plan assets and liabilities are determined on an actuarial basis using numerous actuarial and financial assumptions. Differences between the assumptions and current period actual results are typically deferred into the net pension asset or liability value and amortized against future income under established guidelines. The deferral process generally reduces the volatility of the recognized net pension asset or liability and current period income or expense. Unrealized gains or losses are recorded in other comprehensive income (OCI), a component of shareholders’ equity.
Management, in conjunction with our actuaries annually review key pension plan assumptions, including the expected return on plan assets, the discount rate, the average projected wage rate increase and mortality levels, against actual results, trends, Company strategies, interest rate curves, the current and projected investment environment, industry standards and other regulations and make adjustments accordingly. The actuaries will make calculations and adjust various assumptions to reflect changes in demographics and other factors, including employee turnover, annually as warranted. These adjustments may then lead to a higher or lower expense in future periods.
We establish the discount rate used to determine the present value of the projected and accumulated benefit obligation at the end of each year based upon the available market rates for high quality, fixed income investments whose maturities match the plan’s projected cash flows. An increase to the discount rate would reduce the present value of the projected benefit obligation and future pension expense and, conversely, a lower discount rate would raise the benefit obligation and future pension expense. For our domestic defined benefit pension plan, we elected to use a discount rate of 4.875% as of December 31, 2013, an increase from the 4.0% assumption as of December 31, 2012.
Our pension plan investment strategies are governed by a policy adopted by the Board of Directors. A senior management team oversees a group of outside investment analysts and brokerage firms that implement these strategies. The future return on pension assets is dependent upon the plan’s asset allocation, which changes from time to time, and the performance of the underlying investments. As a result of our review of various factors, we reduced the expected rate of return on plan assets assumption to 7.25% as of December 31, 2013 from 7.50% as of December 31, 2012. This change is reflective of management’s view of the long-term returns in the market place as well as changes in risk profiles and available investments. Management believes that a long-term rate of return of 7.25% is reasonable. Should the assets earn an average return less than 7.25% over time, in all likelihood the future pension expense would increase. Investment earnings in excess of 7.25% would tend to reduce the future expense.
The impact on the pension expense of a change in discount rate or expected rate of return assumption can vary from year to year depending upon the undiscounted liability level, the current discount rate, the asset balance, other changes to the plan and other factors. If the December 31, 2013 discount rate were reduced by 25 basis points (0.25%) and all other pension assumptions remained constant, then the 2014 projected pension expense would increase by approximately $0.6 million. If the expected rate of return assumption was reduced by 25 basis points and all other pension assumptions remained constant, the 2014 projected pension expense would increase by approximately $0.4 million.
See Note I to the Consolidated Financial Statements for additional details on our pension and other retirement plans.
LIFO Inventory. The prices of certain major raw materials that we use, including copper, nickel, gold, silver and other precious metals, fluctuate during a given year. Where possible, such changes in material costs, in either direction, are generally reflected in selling price adjustments, particularly with precious metals and copper.
The prices of labor and other factors of production, including supplies and utilities, generally increase with inflation. Portions of these cost increases may be offset by manufacturing improvements and other efficiencies. From time to time, we will revise our billing practices to include an energy surcharge in attempts to recover a portion of our higher energy costs from our customers.

45
However, market factors, alternative materials and competitive pricing may limit our ability to offset all or a portion of a cost increase with higher prices.
We use the LIFO method for costing the majority of our domestic inventories. Under the LIFO method, inflationary cost increases are charged against the current period cost of goods sold in order to more closely match the cost with the associated revenue. The carrying value of the inventory is based upon older costs and, as a result, the LIFO cost of the inventory on the balance sheet is typically, but not always, lower than it would be under most alternative costing methods. The LIFO cost may also be lower than the current replacement cost of the inventory. The LIFO inventory value tends to be less volatile during years of fluctuating costs than the inventory value would be using other costing methods.
The LIFO impact on the income statement in any given year is dependent upon the inflation rate effect on raw material purchases and manufacturing conversion costs, the level of purchases in a given year and changes in the inventory mix and quantities. Assuming no change in the quantity or mix of inventory from the December 31, 2013 level, a 100 basis point change in the annual inflation rate would cause a change of approximately $0.7 million in the LIFO inventory value.
Deferred Tax Assets. We record deferred tax assets and liabilities based upon the temporary difference between the financial reporting and tax bases of assets and liabilities. We review the expiration dates of the deferrals against projected income levels to determine if the deferral will or can be realized. If it is determined that it is more likely than not that a deferral will not be realized, a valuation allowance would be established for that item. Certain deferrals do not have an expiration date. We will also evaluate deferred tax assets for impairment due to cumulative operating losses by jurisdiction and record a valuation allowance as warranted. A valuation allowance may increase tax expense and reduce net income in the period it is recorded. If a valuation allowance is no longer required, it will reduce tax expense and increase net income in the period that it is reversed.
We had valuation allowances of $4.8 million associated with state and foreign deferred tax assets as of year-end 2013 primarily for net operating loss carryforwards.
See Note Q to the Consolidated Financial Statements for additional deferred tax details.
Unearned revenue. Billings to customers in advance of the shipment of the goods are initially recorded as unearned revenue, which is a liability on the balance sheet. This liability is subsequently reversed and the revenue, cost of sales and gross margin are recorded when the goods are shipped, title passes to the customer and all other revenue recognition criteria are satisfied. The related inventory also remains on our balance sheet until these revenue recognition criteria are met. Advanced billings are typically made in association with products with long manufacturing times and/or products paid with funds from a customer’s contract with the government. Billings in advance of the shipments allow us to collect cash earlier than billing at the time of the shipment and, therefore, the collected cash can be used to help finance the underlying inventory. The unearned revenue balance was $0.5 million as of year-end 2013.
Unearned income. Expenditures for capital equipment to be reimbursed under the Title III contract with the government were initially recorded in construction in process. Reimbursements from the government for those expenditures were recorded in unearned income, a liability on the balance sheet. The total cost of the assets to be constructed under this contract included costs reimbursed by the government as well as costs borne by us. The assets were placed in service and capitalized in 2012. Depreciation expense was calculated and recorded based upon the assets’ total cost and their useful lives. The unearned income liability was reduced and credited to cost of sales on a ratable basis with the annual depreciation expense on the associated assets. The benefit from reducing the unearned income liability in effect reduces the net expense charged to the income statement to an amount equal to the depreciation on the portion of the cost of the assets borne by us. Depreciation and amortization on the Consolidated Statement of Cash Flows is presented net of the current period reduction in the unearned income liability.
Reimbursements recorded in unearned income for the equipment purchased totaled $63.5 million, all of which was received prior to 2013.
We reduced the liability by $4.7 million in 2013 and $2.3 million in 2012 and credited cost of sales on the Consolidated Statement of Income in both years. The unearned income balance was $56.5 million as of year-end 2013 and $61.2 million as of year-end 2012.
Precious metal physical inventory counts. We take and record the results of a physical inventory count of our precious metals on a quarterly basis. Our precious metal operations include a refinery that processes precious metal-containing scrap and other materials from our customers as well as our own internally generated scrap. We also outsource portions of our refining requirements to other vendors, particularly those materials with longer processing times. The precious metal content within these various refine streams may be in solutions, sludges and other non-homogeneous forms and can vary over time based upon the input materials, yield rates and other process parameters. The determination of the weight of the precious metal content within the refine streams as part of a physical inventory count requires the use of estimates and calculations based upon assays, assumed

46
recovery percentages developed from actual historical data and other analyses, the total estimated volumes of solutions and other materials within the refinery, data from our refine vendors and other factors. The resulting calculated weight of the precious metals in our refine operations may differ, in either direction, from what our records indicate that we should have on hand, which would then result in an adjustment to our pre-tax income in the period when the physical inventory was taken and the related estimates were made.
Derivatives. We may use derivative financial instruments to hedge our foreign currency, commodity and precious metal price and interest rate exposures. We apply hedge accounting when an effective hedge relationship can be documented and maintained. The effective portion of the change in a cash flow hedge’s fair value is recorded in other comprehensive income (OCI), a component of shareholders’ equity, until the underlying hedged item matures. If a hedge does not qualify as effective, changes in its fair value are recorded against income in the current period. If a derivative is deemed to be a hedge of the fair value of a balance sheet item, the change in the derivative’s value will be recorded in income and will offset the change in the fair value of the hedged item to the extent that the hedge is effective.
We secure derivatives with the intention of hedging existing or forecasted transactions only and do not engage in speculative trading or holding derivatives for investment purposes. Hedge contracts are typically held until maturity unless there is a change in the underlying hedged transaction. Our annual budget, quarterly forecasts, monthly estimates, customer agreements and other analyses serve as the basis for determining forecasted transactions. The use of derivatives is governed by policies established by the Audit Committee of the Board of Directors. These policies provide guidance on the allowable types of hedge contracts, the allowable duration of the contracts, the maximum allowable notional amount of the outstanding contracts and other related matters. Hedge contracts are approved by senior financial managers at our corporate office. The level of derivatives outstanding at a particular point in time may also be limited by the availability of credit from financial institutions.
Our practice has been to secure hedge contracts denominated in the same manner as the underlying exposure; for example, a yen exposure will only be hedged with a yen contract and not with a surrogate currency and a silver exposure will only be hedged with a silver contract and not a gold contract. We also typically secure contracts through financial institutions that are already part of our bank group.
See Note H to the Consolidated Financial Statements and “Quantitative and Qualitative Disclosures About Market Risk”.
47
OUTLOOK
The outlook for the major markets we serve is solid in the near term. Because of their high-end performance characteristics, our materials continue to be the product of choice in a wide range of applications and markets. Our products serve a number of applications that demand high quality and high reliability in the medical, oil and gas, defense and science, automotive electronics and industrial markets and we have a well-established presence in these markets.
We face a challenge in the ongoing trend of lower defense spending. While portions of our defense applications tend to be long-term strategic programs that are not as affected by current changes in spending budgets, other portions of our defense business have declined due to the spending cut backs.
We also face pressures from our customers and the down stream consumers to reduce the cost of the final product. Given the relatively higher price of our materials, particularly our precious metal products, customers are attempting to change designs to utilize lower quantities of our materials or electing to use lower-performing materials in some cases.
To counter balance these trends and to further grow our sales and the breadth of our product reach, we have an active pipeline of new product development and technologies that are being designed to capitalize on our materials’ strengths. We believe that these new products and applications will be a key to our growth in the near term.
As noted, we made various improvements in the beryllium facility in Elmore during 2013. Output and efficiencies for the full year were not at the designed level, but the operating level in the fourth quarter 2013, if sustained, will provide a benefit in 2014 in terms of operating costs and inventory flow relative to 2013.
The non-recurring costs associated with the plant consolidation program within the Advanced Material Technologies segment are largely behind us and profitability in 2014 should benefit from the program’s savings and efficiencies.
With the higher discount rate used in the valuation of the domestic defined benefit pension plan as of December 31, 2013 and other changes in the demographics, the plan expense will be lower in 2014 than 2013.
We anticipate that our profitability in 2014 should improve over 2013 due to the growth in our value-added sales, the above cost and operational improvements and other factors.
Capital spending, which can be affected by our cash flow, new business opportunities, age of our equipment and other factors, is anticipated to be approximately $30.0 million in 2014.
48
Item 7A. QUANTITATIVE AND QUALITATIVE DISCLOSURES ABOUT MARKET RISK
We are exposed to precious metal and commodity price, interest rate, foreign exchange rate and utility cost differences. While the degree of exposure varies from year to year, our methods and policies designed to manage these exposures have remained fairly consistent over time. Generally, we attempt to minimize the effects of these exposures on our pre-tax income and cash flows through the use of natural hedges, which include pricing strategies, borrowings denominated in the same terms as the exposed asset, off-balance sheet financing arrangements and other methods. Where we cannot use a natural hedge, we may use derivative financial instruments to minimize the effects of these exposures when practical and cost efficient. The use of off-balance sheet financing arrangements and derivative financial instruments is subject to policies approved by the Audit Committee of the Board of Directors with oversight provided by a group of senior financial managers at our corporate office.
Precious metals. We use gold and other precious metals in manufacturing various products. To reduce the exposure to market price changes, the majority of our precious metal requirements are maintained on a consigned inventory basis. We purchase the metal out of consignment from our suppliers when it is ready to ship to a customer as a finished product. Our purchase price forms the basis for the price charged to the customer for the precious metal content and, therefore, the current cost is matched to the selling price and the price exposure is minimized.
We are charged a consignment fee by the financial institutions that own the precious metals. This fee is a function of the market price of the metal, the quantity of metal we have on hand and the rate charged by the institution. Because of market forces and competition, the fee can only be charged to customers in a limited case-by-case basis. Should the market price of precious metals that we have on consignment increase by 20% from the prices on December 31, 2013, the additional pre-tax cost to us as a result of an increase in the consignment fee would be approximately $1.0 million on an annual basis. This calculation assumes no changes in the quantity of metal held on consignment or the underlying fee and that none of the additional fees are charged to customers.
To further limit price and financing rate exposures, under some circumstances, we will require customers to furnish their own metal for processing. Customers may also elect to provide their own material for us to process on a toll basis as opposed to purchasing our material.
The available capacity of our existing credit lines to consign precious metals is a function of the quantity and price of the metals on hand. As prices increase, a given quantity of metal will utilize a larger proportion of the existing credit lines. A significant prolonged increase in metal prices could result in our credit lines being fully utilized, and, absent securing additional credit line capacity from a financial institution, could require us to purchase precious metals rather than consign them, require customers to supply their own metal and/or force us to turn down additional business opportunities. If we were in a significant precious metal ownership position, we might elect to use derivative financial instruments to hedge the potential price exposure. The cost to finance and potentially hedge the purchased inventory may also be higher than the consignment fee. The financial statement impact of the risk from rising metal prices impacting our credit availability cannot be estimated at the present time.
In certain circumstances, we may elect to fix the price of precious metals for a customer for a stated quantity over a specified period of time. In those cases, we may secure hedge contracts whose terms match the terms in the agreement with our customer so that the gain or loss on the contract with the customer due to subsequent movements in the precious metal price will generally be offset by a gain or loss on the hedge contract. At year-end 2013, we had hedge contracts to purchase and sell gold with a notional value of $10.2 million. A metal price decline of 10% from the year-end price would result in a net additional pre-tax expense of approximately $0.1 million in 2014. This calculation does not take into account the additional net gain that would be recorded on the underlying hedged transactions with the customer.
Copper. We also use copper in our production processes. When possible, fluctuations in the purchase price of copper are passed on to customers in the form of price adders or reductions. While over time our price exposure to copper is generally in balance, there can be a lag between the change in our cost and the pass-through to our customers, resulting in higher or lower margins in a given period.
We consign a portion of our copper inventory requirements. As with precious metals, the available capacity under the existing lines is a function of the quantity and price of metal on hand. Should the market cost of copper increase by 20% from the price as of December 31, 2013, the additional pre-tax cost to us as a result of an increase in the consignment fee would be approximately $0.1 million on an annual basis. This calculation assumes no changes in the quantity of inventory or the underlying fee and that none of the additional fees are charged to customers.
Lower of cost or market. In our manufacturing processes, we use various metals that are not widely used by others or actively traded and, therefore, there is no established efficient market for derivative financial instruments that could be used to effectively hedge the related price exposures. For certain applications, our pricing practice with respect to these metals is to establish the selling price based upon our cost to purchase the material, limiting our price exposure. However, the inventory

49
carrying value may be exposed to market fluctuations. The inventory value is maintained at the lower of cost or market and if the market value were to drop below the carrying value, the inventory would have to be reduced accordingly and a charge taken against cost of sales. This risk is mainly associated with long manufacturing lead time items and with sludges and scrap materials, which generally have longer processing times to be refined or processed into a usable form for further manufacturing and are typically not covered by specific sales orders from customers. We did not record any material lower of cost or market charges in 2013, 2012 or 2011 as a result of market price fluctuations on metals in our inventories.
Interest rates. We are exposed to changes in interest rates on portions of our debt and cash balances. This interest rate exposure is managed by maintaining a combination of short-term and long-term debt and variable and fixed rate instruments. We may also use interest rate swaps to fix the interest rate on variable rate obligations, as we deem appropriate. There were no interest rate derivatives outstanding as of December 31, 2013. Excess cash is typically invested in high quality instruments that mature in ninety days or less. Investments are made in compliance with policies approved by the Board of Directors. Assuming no change in the amount or make-up of the outstanding debt as of December 31, 2013, a 200 basis point movement upwards in the interest rates on our variable rate debt would increase our annual interest expense by $0.9 million.
Foreign currencies. Portions of our international operations sell products priced in foreign currencies, mainly the euro and yen, while the majority of these products’ costs are incurred in U.S. dollars. We are exposed to currency movements in that if the U.S. dollar strengthens, the translated value of the foreign currency sale and the resulting margin on that sale will be reduced. We typically cannot increase the price of our products for short-term exchange rate movements because of local competition. To minimize this exposure, we may purchase foreign currency forward contracts, options and collars in compliance with approved policies. If the dollar strengthened, the decline in the translated value of our margins would be at least partially offset by a gain on the hedge contract. A decrease in the value of the dollar would result in larger margins but potentially a loss on the contract, depending upon the method used to hedge the exposure. Our current policy limits our hedges to 80% or less of the forecasted exposure.
The notional value of the outstanding currency contracts was $31.0 million as of December 31, 2013. If the dollar weakened 10% against the currencies we have hedged from the December 31, 2013 exchange rates, the reduced gain and/or increased loss on the outstanding contracts as of December 31, 2013 would reduce pre-tax profits by approximately $3.1 million in 2014. This calculation does not take into account the increase in margins as a result of translating foreign currency sales at the more favorable exchange rates, any changes in margins from potential volume fluctuations caused by currency movements or the translation effects on any other foreign currency denominated income statement or balance sheet item.
Utilities. The cost of natural gas and electricity used in our operations may vary from year to year and from season to season. We attempt to minimize these fluctuations and the exposure to higher costs by utilizing fixed price agreements of set durations, when deemed appropriate, obtaining competitive bidding between regional energy suppliers and other methods.
Economy. We are exposed to changes in global economic conditions and the potential impact those changes may have on various facets of our business. We have a program in place to closely monitor the credit worthiness and financial condition of our key providers of financial services, including our bank group and insurance carriers, as well as the credit worthiness of customers and vendors and have various contingency plans in place.
We negotiated extensions to our bank lines for credit, consignment and hedging purposes during 2013. In general, the credit capacity under these lines has increased. These lines are established with a number of different banks in order to mitigate our exposure with any one financial institution. All of the banks in our bank group had credit in good standing as of year-end 2013. The financial statement impact from the risk of one or more of the banks in our bank group dropping our lines due to their insolvency or other causes cannot be estimated at the present time.

50
Item 8. FINANCIAL STATEMENTS AND SUPPLEMENTARY DATA
Financial Statements Page
Management’s Report on Internal Control over Financial Reporting .....................................................................Reports of Independent Registered Public Accounting Firm ..................................................................................Consolidated Statements of Income for the Years Ended December 31, 2013, 2012 and 2011..............................Consolidated Statements of Comprehensive Income for the Years Ended December 31, 2013, 2012 and 2011....Consolidated Statements of Cash Flows for the Years Ended December 31, 2013, 2012 and 2011.......................Consolidated Balance Sheets as of December 31, 2013 and 2012 ..........................................................................Consolidated Statements of Shareholders’ Equity for the Years Ended December 31, 2013, 2012 and 2011........Notes to Consolidated Financial Statements............................................................................................................
5152545556575859

51
Management’s Report on Internal Control over Financial Reporting
The management of Materion Corporation and subsidiaries are responsible for establishing and maintaining adequate internal controls over financial reporting, as such term is defined in Exchange Act Rules 13a-15(f) and 15d-15(f). Materion Corporation and subsidiaries’ internal control system was designed to provide reasonable assurance to the Company’s management and Board of Directors regarding the preparation and fair presentation of published financial statements. All internal control systems, no matter how well designed, have inherent limitations. Therefore, even those systems determined to be effective can provide only reasonable assurance with respect to financial statement preparation and presentation.
Materion Corporation and subsidiaries’ management assessed the effectiveness of the Company’s internal control over financial reporting as of December 31, 2013. In making this assessment, we used the framework set forth by the Committee of Sponsoring Organizations of the Treadway Commission (the COSO criteria) in Internal Control - Integrated Framework (1992). Based on our assessment, management identified a deficiency in the Company’s internal control over financial reporting that constitutes a material weakness as of December 31, 2013. Specifically, our management review controls failed to detect material errors in the physical inventory count reconciliation process at one of our facilities during 2013. As a result of this material weakness, management concluded that we did not maintain effective internal control over financial reporting as of December 31, 2013.
A material weakness is a deficiency, or a combination of deficiencies, in internal control over financial reporting, such that there is a reasonable possibility that a material misstatement of our annual or interim financial statements will not be prevented or detected on a timely basis.
The effectiveness of our internal control over financial reporting as of December 31, 2013 has been audited by Ernst & Young LLP, an independent registered public accounting firm, as stated in their report.
/S/ RICHARD J. HIPPLE
Richard J. HippleChairman, President and Chief Executive Officer
/S/ JOHN D. GRAMPA
John D. GrampaSenior Vice President Finance andChief Financial Officer

52
Report of Independent Registered Public Accounting Firm
The Board of Directors and Shareholders of Materion Corporation
We have audited Materion Corporation and subsidiaries’ internal control over financial reporting as of December 31, 2013, based on criteria established in Internal Control-Integrated Framework issued by the Committee of Sponsoring Organizations of the Treadway Commission (1992 framework) (the COSO criteria). Materion Corporation and subsidiaries’ management is responsible for maintaining effective internal control over financial reporting, and for its assessment of the effectiveness of internal control over financial reporting included in the accompanying Management’s Report on Internal Control over Financial Reporting. Our responsibility is to express an opinion on the company’s internal control over financial reporting based on our audit.
We conducted our audit in accordance with the standards of the Public Company Accounting Oversight Board (United States). Those standards require that we plan and perform the audit to obtain reasonable assurance about whether effective internal control over financial reporting was maintained in all material respects. Our audit included obtaining an understanding of internal control over financial reporting, assessing the risk that a material weakness exists, testing and evaluating the design and operating effectiveness of internal control based on the assessed risk, and performing such other procedures as we considered necessary in the circumstances. We believe that our audit provides a reasonable basis for our opinion.
A company’s internal control over financial reporting is a process designed to provide reasonable assurance regarding the reliability of financial reporting and the preparation of financial statements for external purposes in accordance with generally accepted accounting principles. A company’s internal control over financial reporting includes those policies and procedures that (1) pertain to the maintenance of records that, in reasonable detail, accurately and fairly reflect the transactions and dispositions of the assets of the company; (2) provide reasonable assurance that transactions are recorded as necessary to permit preparation of financial statements in accordance with generally accepted accounting principles, and that receipts and expenditures of the company are being made only in accordance with authorizations of management and directors of the company; and (3) provide reasonable assurance regarding prevention or timely detection of unauthorized acquisition, use or disposition of the company’s assets that could have a material effect on the financial statements.
Because of its inherent limitations, internal control over financial reporting may not prevent or detect misstatements. Also, projections of any evaluation of effectiveness to future periods are subject to the risk that controls may become inadequate because of changes in conditions, or that the degree of compliance with the policies or procedures may deteriorate.
A material weakness is a deficiency, or a combination of deficiencies, in internal control over financial reporting, such that there is a reasonable possibility that a material misstatement of the company’s annual or interim financial statements will not be prevented or detected on a timely basis. The following material weakness has been identified in management’s assessment. Management has identified a material weakness in controls related to management review controls that failed to detect material errors in the physical inventory count reconciliation process at one of their facilities during 2013. We also have audited, in accordance with the standards of the Public Company Accounting Oversight Board (United States), the consolidated balance sheets as of December 31, 2013 and 2012, and the related consolidated statements of income, comprehensive loss, shareholders’ equity, and cash flows for each of the three years in the period ended December 31, 2013. This material weakness was considered in determining the nature, timing and extent of audit tests applied in our audit of the 2013 financial statements, and this report does not affect our report dated March 14, 2014, which expressed an unqualified opinion on those financial statements.
In our opinion, because of the effect of the material weakness described above on the achievement of the objectives of the control criteria, Materion Corporation and subsidiaries has not maintained effective internal control over financial reporting as of December 31, 2013, based on the COSO criteria.
/s/ Ernst & Young LLP
Cleveland, OhioMarch 14, 2014

53
Report of Independent Registered Public Accounting Firm
The Board of Directors and Shareholders of Materion Corporation
We have audited the accompanying consolidated balance sheets of Materion Corporation and subsidiaries as of December 31, 2013 and 2012, and the related consolidated statements of income, comprehensive income, shareholders’ equity, and cash flows for each of the three years in the period ended December 31, 2013. Our audits also included the financial statement schedule listed in the index at Item 15(a). These financial statements and schedule are the responsibility of the Company’s management. Our responsibility is to express an opinion on these financial statements and schedule based on our audits.
We conducted our audits in accordance with the standards of the Public Company Accounting Oversight Board (United States). Those standards require that we plan and perform the audit to obtain reasonable assurance about whether the financial statements are free of material misstatement. An audit includes examining, on a test basis, evidence supporting the amounts and disclosures in the financial statements. An audit also includes assessing the accounting principles used and significant estimates made by management, as well as evaluating the overall financial statement presentation. We believe that our audits provide a reasonable basis for our opinion.
In our opinion, the financial statements referred to above present fairly, in all material respects, the consolidated financial position of Materion Corporation and subsidiaries at December 31, 2013 and 2012, and the consolidated results of its operations and its cash flows for each of the three years in the period ended December 31, 2013, in conformity with U.S. generally accepted accounting principles. Also, in our opinion, the related financial statement schedule, when considered in relation to the basic financial statements taken as a whole, presents fairly in all material respects the information set forth therein.
We also have audited, in accordance with the standards of the Public Company Accounting Oversight Board (United States), Materion Corporation and subsidiaries’ internal control over financial reporting as of December 31, 2013, based on criteria established in Internal Control-Integrated Framework issued by the Committee of Sponsoring Organizations of the Treadway Commission (1992 framework) and our report dated March 14, 2014, expressed an adverse opinion thereon.
/s/ Ernst & Young LLP
Cleveland, OhioMarch 14, 2014

54
Materion Corporation and SubsidiariesYears Ended December 31, 2013, 2012 and 2011
Consolidated Statements of Income
(Thousands except per share amounts) 2013 2012 2011
Net sales.................................................................................................................... $ 1,166,882 $ 1,273,078 $ 1,526,730Cost of sales ........................................................................................................... 978,904 1,074,295 1,311,409
Gross margin............................................................................................................. 187,978 198,783 215,321Selling, general and administrative expense .......................................................... 133,253 133,893 131,388Research and development expense ....................................................................... 13,432 12,505 11,081Other — net ............................................................................................................ 14,462 15,609 15,774
Operating profit ........................................................................................................ 26,831 36,776 57,078Interest expense — net ........................................................................................... 3,036 3,134 2,812
Income before income taxes............................................................................ 23,795 33,642 54,266Income tax expense................................................................................................... 4,088 8,978 14,287
Net income ........................................................................................................ $ 19,707 $ 24,664 $ 39,979Basic earnings per share:Net income per share of common stock ................................................................... $ 0.96 $ 1.21 $ 1.96Diluted earnings per share:Net income per share of common stock ................................................................... $ 0.94 $ 1.19 $ 1.93
Cash dividends per share ....................................................................................... $ 0.315 $ 0.225 $ —
Weighted-average number of shares of common stock outstandingBasic ....................................................................................................................... 20,571 20,418 20,365Diluted.................................................................................................................... 20,895 20,679 20,754
See Notes to Consolidated Financial Statements.

55
Materion Corporation and SubsidiariesYears Ended December 31, 2013, 2012 and 2011
Consolidated Statements of Comprehensive Income
(Thousands) 2013 2012 2011
Net income ............................................................................................................... $ 19,707 $ 24,664 $ 39,979Other comprehensive income:
Foreign currency translation adjustment.............................................................. (3,790) (870) 958Derivative and hedging activity, net of tax benefit (expense) of $160, $385,and ($1,047) ......................................................................................................... (296) (715) 1,946Pension and post employment benefit adjustment, net of tax of ($17,613),$7,676, and $12,292............................................................................................. 32,627 (14,629) (23,503)
Net change in accumulated other comprehensive income........................................ 28,541 (16,214) (20,599)Comprehensive income .......................................................................................... $ 48,248 $ 8,450 $ 19,380
See Notes to Consolidated Financial Statements.

56
Materion Corporation and SubsidiariesYears Ended December 31, 2013, 2012 and 2011
Consolidated Statements of Cash Flows
(Thousands) 2013 2012 2011
Cash flows from operating activities:Net income ............................................................................................................. $ 19,707 $ 24,664 $ 39,979Adjustments to reconcile net income to net cash provided from operatingactivities:
Depreciation, depletion and amortization.......................................................... 41,649 37,046 43,635Amortization of deferred financing costs in interest expense ........................... 679 649 559Stock-based compensation expense .................................................................. 5,741 5,889 5,000Deferred tax (benefit) expense .......................................................................... (2,442) (2,462) (1,668)
Changes in assets and liabilities net of acquired assets and liabilities:Decrease (increase) in accounts receivable ....................................................... 11,956 (8,913) 26,818Decrease (increase) in other receivables ........................................................... 160 4,197 (630)Decrease (increase) in inventory ....................................................................... (8,241) (18,880) (30,016)Decrease (increase) in prepaid and other current assets .................................... 6,647 483 (7,571)Increase (decrease) in accounts payable and accrued expenses ........................ (7,739) 1,472 (2,580)Increase (decrease) in unearned revenue........................................................... (1,064) (1,491) 661Increase (decrease) in interest and taxes payable .............................................. 2,391 (2,324) (5,891)Increase (decrease) in long-term liabilities........................................................ 6,879 (5,053) (15,993)Other — net ....................................................................................................... (401) 3,343 4,503
Net cash provided from operating activities............................................. 75,922 38,620 56,806Cash flows from investing activities:
Payments for purchase of property, plant and equipment ...................................... (27,848) (34,088) (28,187)Payments for mine development ............................................................................ (4,776) (10,573) (560)Reimbursement for capital spending under government contract.......................... — 991 5,386Payments for purchase of business less cash received........................................... — (3,894) (22,448)Proceeds from sale of property, plant and equipment ............................................ 22 — 54Other investments — net........................................................................................ 15 4,201 (4,274)
Net cash (used in) investing activities........................................................ (32,587) (43,363) (50,029)Cash flows from financing activities:
Issuance (repayment) of short-term debt................................................................ (13,692) 8,594 (6,950)Proceeds from issuance of long-term debt ............................................................. 70,423 32,403 118,582Repayment of long-term debt................................................................................. (86,036) (27,986) (116,425)Principal payments under capital lease obligations................................................ (657) (749) (812)Cash dividends paid ............................................................................................... (6,497) (4,615) —Deferred financing costs......................................................................................... (1,587) — (2,637)Repurchase of common stock ................................................................................ — (119) (3,776)Issuance of common stock under stock option plans ............................................. 1,163 158 735Tax benefit from stock compensation realization................................................... 711 817 658
Net cash (used in) provided from financing activities ............................. (36,172) 8,503 (10,625)Effects of exchange rate changes on cash and cash equivalents............................... (445) 41 (1)
Net change in cash and cash equivalents .................................................. 6,718 3,801 (3,849)Cash and cash equivalents at beginning of year ...................................... 16,056 12,255 16,104Cash and cash equivalents at end of year ................................................. $ 22,774 $ 16,056 $ 12,255
See Notes to Consolidated Financial Statements.

57
Materion Corporation and SubsidiariesDecember 31, 2013 and 2012
Consolidated Balance Sheets
(Thousands) 2013 2012
AssetsCurrent assets
Cash and cash equivalents .............................................................................................................. $ 22,774 $ 16,056Accounts receivable (net of allowance of $1,421 for 2013 and $1,403 for 2012) ......................... 112,767 126,482Other receivables ............................................................................................................................ 245 405Inventories ...................................................................................................................................... 213,392 206,125Prepaid expenses............................................................................................................................. 35,761 41,685Deferred income taxes .................................................................................................................... 9,566 10,236
Total current assets..................................................................................................................... 394,505 400,989Long-term deferred income taxes ..................................................................................................... 4,672 19,946Property, plant and equipment........................................................................................................... 782,879 779,785Less allowances for depreciation, amortization and depletion ......................................................... (520,986) (507,243)
Property, plant and equipment — net ............................................................................................. 261,893 272,542Intangible assets ................................................................................................................................ 24,248 28,869Other assets ....................................................................................................................................... 3,874 3,818Goodwill............................................................................................................................................ 88,753 88,753
Total Assets........................................................................................................................... $ 777,945 $ 814,917
Liabilities and Shareholders’ EquityCurrent liabilities
Short-term debt ............................................................................................................................... $ 35,566 $ 49,432Accounts payable............................................................................................................................ 36,556 42,281Salaries and wages.......................................................................................................................... 28,202 27,768Taxes other than income taxes........................................................................................................ 1,527 1,055Other liabilities and accrued items ................................................................................................. 25,122 26,988Unearned revenue ........................................................................................................................... 479 1,543Income taxes ................................................................................................................................... 1,564 —
Total current liabilities............................................................................................................... 129,016 149,067Other long-term liabilities ................................................................................................................. 16,531 16,173Retirement and post-employment benefits ....................................................................................... 80,275 125,978Unearned income .............................................................................................................................. 56,490 61,184Long-term income taxes.................................................................................................................... 1,576 1,510Deferred income taxes ...................................................................................................................... 1,469 1,130Long-term debt.................................................................................................................................. 29,267 44,880Shareholders’ equity
Serial preferred stock (no par value; 5,000 authorized shares, none issued).................................. — —Common stock (no par value; 60,000 authorized shares, issued shares of 27,164 for 2013 and27,050 for 2012) ............................................................................................................................. 197,576 191,169Retained earnings............................................................................................................................ 441,518 428,394Common stock in treasury (6,274 shares for 2013 and 6,607 shares for 2012) ............................ (118,151) (118,298)Other comprehensive income (loss) ............................................................................................... (59,888) (88,429)Other equity transactions ................................................................................................................ 2,266 2,159
Total shareholders’ equity.......................................................................................................... 463,321 414,995Total Liabilities and Shareholders’ Equity....................................................................... $ 777,945 $ 814,917
See Notes to Consolidated Financial Statements.

58
Materion Corporation and SubsidiariesYears Ended December 31, 2013, 2012 and 2011
Consolidated Statements of Shareholders’ Equity
(Thousands)Common
StockRetainedEarnings
CommonStock InTreasury
OtherComprehensiveIncome (Loss)
OtherEquity
Transactions TotalBalance at January 1, 2011 ...................................... $ 180,161 $ 368,401 $ (115,090) $ (51,616) $ 2,500 $ 384,356Net income ................................................................. — 39,979 — — — 39,979Other comprehensive income..................................... — — — (20,599) — (20,599)Proceeds from exercise of 53 shares under optionplans............................................................................ 735 — — — — 735Income tax benefit from stock compensationrealization ................................................................... 658 — — — — 658Repurchase of 132 shares ........................................... — — (3,776) — — (3,776)Stock-based compensation expense ........................... 5,000 — — — — 5,000Shares withheld for employee taxes on equityawards......................................................................... (641) — — — — (641)Directors' deferred compensation............................... — — 587 — (317) 270Balance at December 31, 2011................................. 185,913 408,380 (118,279) (72,215) 2,183 405,982Net income ................................................................. — 24,664 — — — 24,664Other comprehensive income..................................... — — — (16,214) — (16,214)Cash dividends declared — (4,650) — — — (4,650)Proceeds from exercise of 16 shares under optionplans............................................................................ 158 — — — — 158Income tax benefit from stock compensationrealization ................................................................... 817 — — — — 817Repurchase of 6 shares ............................................... — — (119) — — (119)Stock-based compensation expense ........................... 5,889 — — — — 5,889Shares withheld for employee taxes on equityawards......................................................................... (1,608) — — — — (1,608)Directors' deferred compensation............................... — — 100 — (24) 76Balance at December 31, 2012................................. 191,169 428,394 (118,298) (88,429) 2,159 414,995Net income ................................................................. — 19,707 — — — 19,707Other comprehensive income..................................... — — — 28,541 — 28,541Cash dividends declared............................................. — (6,583) — — — (6,583)Proceeds from exercise of 74 shares under optionplans............................................................................ 1,163 — — — — 1,163Income tax benefit from stock compensationrealization ................................................................... 711 — — — — 711Stock-based compensation expense ........................... 5,741 — — — — 5,741Shares withheld for employee taxes on equityawards......................................................................... (1,208) — — — — (1,208)Directors’ deferred compensation............................... — — 147 — 107 254Balance at December 31, 2013................................. $ 197,576 $ 441,518 $ (118,151) $ (59,888) $ 2,266 $ 463,321
See Notes to Consolidated Financial Statements.

59
Materion Corporation and SubsidiariesNotes to Consolidated Financial Statements
Note A — Significant Accounting Policies
Organization: The Company is a holding company with subsidiaries that have operations in the United States, Europe and Asia. These operations manufacture advanced engineered materials used in a variety of markets, including consumer electronics, defense and science, industrial components and commercial aerospace, automotive electronics, telecommunications infrastructure, energy, medical and appliance. The Company has four reportable segments:
Advanced Material Technologies manufactures precious and non-precious vapor deposition targets, frame lid assemblies, advanced chemicals, performance coatings, optics, microelectronic packages, other precious and non-precious metal products and specialty inorganic materials;
Performance Alloys manufactures high precision strip and bulk products from copper and nickel-based alloys;
Beryllium and Composites produces beryllium metal, beryllium and non-beryllium metal matrix composites and beryllia ceramics in a variety of forms; and
Technical Materials manufactures clad inlay and overlay metals, precious and base metal electroplated systems and other related products.
See Note M to the Consolidated Financial Statements for additional segment details. The Company is vertically integrated and distributes its products through a combination of company-owned facilities and independent distributors and agents.
Use of Estimates: The preparation of financial statements in conformity with accounting principles generally accepted in the United States requires management to make estimates and assumptions that affect the amounts reported in the financial statements and accompanying notes. Actual results may differ from those estimates.
Consolidation: The Consolidated Financial Statements include the accounts of Materion Corporation and its subsidiaries. All of the Company’s subsidiaries are wholly owned as of December 31, 2013. Intercompany accounts and transactions are eliminated in consolidation.
Cash Equivalents: All highly liquid investments with a maturity of three months or less when purchased are considered to be cash equivalents.
Accounts Receivable: An allowance for doubtful accounts is maintained for the estimated losses resulting from the inability of customers to pay the amounts due. The allowance is based upon identified delinquent accounts, customer payment patterns and other analyses of historical data and trends. The Company extends credit to customers based upon their financial condition and generally collateral is not required.
Inventories: Inventories are stated at the lower of cost or market. The cost of the majority of domestic inventories is determined using the last-in, first-out (LIFO) method. The remaining inventories are stated principally at average cost.
Property, Plant and Equipment: Property, plant and equipment is stated on the basis of cost. Depreciation is computed principally by the straight-line method, except certain assets for which depreciation may be computed by the units-of-production or the sum-of-the-years-digit method. The depreciable lives that are used in computing the annual provision for depreciation by class of asset are as follows:
YearsLand improvements............................................................................................................................................... 5 to 25Buildings ............................................................................................................................................................... 10 to 40Leasehold improvements ...................................................................................................................................... Life of leaseMachinery and equipment..................................................................................................................................... 3 to 15Furniture and fixtures............................................................................................................................................ 4 to 15Automobiles and trucks ........................................................................................................................................ 2 to 8Research equipment .............................................................................................................................................. 6 to 12Computer hardware............................................................................................................................................... 3 to 10Computer software ................................................................................................................................................ 3 to 10

60
An asset acquired under a capital lease will be recorded at the lesser of the present value of the projected lease payments or the fair value of the asset and will be depreciated in accordance with the above schedule. Leasehold improvements will be depreciated over the life of the improvement if it is shorter than the life of the lease. Repair and maintenance costs are expensed as incurred.
Mineral Resources and Mine Development: Property acquisition costs are capitalized as mineral resources on the balance sheet and are depleted using the units-of-production method based upon recoverable proven reserves. Mine development costs are capitalized once mineralization has been classified as proven or probable reserves. Drilling and related costs are capitalized for an ore body where proven and probable reserves exist if those activities are directed at obtaining additional information about the ore body or convert mineralized materials into proven or probable reserves. Drilling costs incurred during the production phase are allocated to inventory. The cost of removing overburden and waste materials to access the ore body in an open pit are capitalized and amortized as the ore is extracted using the units-of-production method based upon the proven reserves in that particular pit. Costs incurred to access specific ore blocks or areas that only provide benefit over the life of that area are amortized over the estimated life of that specific ore block area.
Goodwill and Other Intangible Assets: Goodwill is not amortized, but instead reviewed annually as of December 31 of each year, or more frequently under certain circumstances, for impairment. Goodwill is assigned to the reporting unit, which is the operating segment level or one level below the operating segment. Intangible assets with finite lives are amortized using the straight-line method or effective interest method, as applicable, over the periods estimated to be benefited, which is generally twenty years or less. Finite-lived intangible assets are also reviewed for impairment if facts and circumstances warrant.
Asset Impairment: In the event that facts and circumstances indicate that the carrying value of long-lived assets may be impaired, an evaluation of recoverability is performed by comparing the carrying value of the assets to the associated estimated future undiscounted cash flow. If the carrying value exceeds that cash flow, then the assets are written down to their fair values.
Derivatives: The Company recognizes all derivatives on the balance sheet at their fair values. If the derivative is designated and effective as a cash flow hedge, changes in the fair value of the derivative are recognized in other comprehensive income (loss), a component of shareholders’ equity, until the hedged item is recognized in earnings. If the derivative is designated as a fair value hedge, changes in its value are offset against the change in the value of the hedged asset, liability or commitment through earnings. The ineffective portion of a derivative’s change in fair value, if any, is recognized in earnings immediately. If a derivative is not a hedge, changes in its fair value are adjusted through income.
Asset Retirement Obligation: The Company records a liability to recognize the legal obligation to remove an asset at the time the asset is acquired or when the legal liability arises. The liability is recorded for the present value of the ultimate obligation by discounting the estimated future cash flows using a credit-adjusted risk-free interest rate. The liability is accreted over time, with the accretion charged to expense. An asset equal to the fair value of the liability is recorded concurrent with the liability and depreciated over the life of the underlying asset.
Unearned Income: Expenditures for capital equipment to be reimbursed under government contracts are recorded in construction in process while the reimbursements for those expenditures are recorded in unearned income, a liability on the balance sheet. When the assets subject to reimbursement are placed in service, their total cost is depreciated over their useful lives and the unearned income liability is reduced and credited to cost of sales on the Consolidated Statements of Income ratably with the annual depreciation expense. Depreciation and amortization expense on the Consolidated Statement of Cash Flows is shown net of the associated current period reduction in the unearned income liability.
Revenue Recognition: The Company generally recognizes revenue when the goods are shipped and title passes to the customer. The Company requires persuasive evidence that a revenue arrangement exists, delivery of the product has occurred, the selling price is fixed or determinable and collectibility is reasonably assured before revenue is realized and earned. Billings in advance of the shipment of the goods are recorded as unearned revenue, which is a liability on the balance sheet. Revenue is recognized for these transactions when the goods are shipped and all other revenue recognition criteria are met.
Shipping and Handling Costs: The Company records shipping and handling costs for products sold to customers in cost of sales on the Consolidated Statements of Income.
Advertising Costs: The Company expenses all advertising costs as incurred. Advertising costs were $1.1 million in 2013, $1.2 million in 2012, $3.1 million in 2011.
Stock-based Compensation: All stock-based compensation instruments, including options, stock appreciation rights, restricted stock and performance restricted stock, are viewed collectively when determining the accounting treatment of the tax considerations upon the realization of the benefit by the recipient.

61
Capitalized Interest: Interest expense associated with active capital asset construction and mine development projects is capitalized and amortized over the future useful lives of the related assets.
Income Taxes: The Company uses the liability method in measuring the provision for income taxes and recognizing deferred tax assets and liabilities on the balance sheet. The Company will record a valuation allowance to reduce the deferred tax assets to the amount that is more likely than not to be realized, as warranted by the facts and circumstances. The Company applies a more-likely-than-not recognition threshold for all tax uncertainties and will record a liability for those tax benefits that have a less than 50% likelihood of being sustained upon examination by the taxing authorities.
Net Income Per Share: Basic earnings per share (EPS) is computed by dividing income available to common stockholders by the weighted-average number of common shares outstanding for the period. Diluted EPS reflects the assumed conversion of all dilutive common stock equivalents as appropriate under the treasury stock method.
Reclassification: Certain amounts in prior years have been reclassified to conform to the 2013 consolidated financial statement presentation.
New Pronouncements: In 2011, the Financial Accounting Standards Board (FASB) issued two Accounting Standards Updates (ASU) which amended guidance for the presentation of comprehensive income. The amended guidance requires an entity to present components of net income and other comprehensive income in one continuous statement, referred to as the statement of comprehensive income, or in two separate, but consecutive statements. The current option to report other comprehensive income and its components in the statement of stockholders’ equity was eliminated. Although the new guidance changes the presentation of comprehensive income, there were no changes to the components that are recognized in net income or other comprehensive income under existing guidance. The ASU is effective for interim and annual periods beginning after December 15, 2011 and retrospective application is required. The Company adopted these ASUs beginning with its disclosures for the first quarter 2012.
In February 2013, the FASB issued guidance that requires an entity to disclose information showing the effect of the items reclassified from accumulated other comprehensive income on the line items of net income. The provisions of this new guidance were effective prospectively as of the beginning of our 2013 fiscal year. Accordingly, an enhanced footnote disclosure for the year ended December 31, 2013 was included.
In July 2013, the Financial Accounting Standards Board (FASB) issued new accounting guidance that requires an entity to net its liability for unrecognized tax positions against a net operating loss carryforward, a similar tax loss or a tax credit carryforward when settlement in this manner is available under the tax law. The provisions of this new guidance are effective as of the beginning of 2014. Adoption of this new guidance is not expected to have a material impact on the financial statements.
Note B — Acquisitions
In the first quarter 2012, the Company acquired all of the outstanding stock of Aerospace Metal Composites Limited (AMC) of Farnborough, England for $3.3 million, net of $1.5 million of cash acquired. AMC manufactures ultrafine particulate reinforced metal matrix composites, primarily aluminum materials, that are used in performance automotive, aerospace, defense and precision high speed machinery applications. Goodwill was valued at $1.9 million.
In the fourth quarter of 2011, the Company acquired the outstanding stock of EIS Optics Limited (EIS) for $23.0 million, net of $1.5 million of cash acquired. EIS manufactures optical thin film filters, glass processing, lithography and optical subassemblies that allow for the precision management of light in a broad range of end-use applications throughout the projection display, entertainment lighting, sensors, medical instruments and gaming industries. EIS manufactures its products at a 101,000 square foot facility in Shanghai, China. The $23.0 million net purchase price includes $0.6 million paid by the Company in the first quarter of 2012 as a result of the resolution of working capital valuation adjustments in accordance with the purchase agreement. Goodwill assigned to the transaction totaled $13.9 million.
Both of these acquisitions were financed with a combination of cash on hand and borrowings under the existing revolving credit agreement.
The results of the above acquired businesses were included in the Company’s financial statements since their respective acquisition dates. The AMC acquisition is included in the Beryllium and Composites segment while the EIS acquisition is included in the Advanced Material Technologies segment. See Note E to the Consolidated Financial Statements for additional information on the intangible assets associated with these acquisitions.

62
Note C — Inventories
Inventories on the Consolidated Balance Sheets are summarized as follows:
December 31,(Thousands) 2013 2012
Principally average cost:Raw materials and supplies ...................................................................................................... $ 42,352 $ 42,751Work in process........................................................................................................................ 203,107 203,179Finished goods.......................................................................................................................... 45,503 51,094
Gross inventories ................................................................................................................. 290,962 297,024Excess of average cost over LIFO inventory value.................................................................. 77,570 90,899
Net inventories..................................................................................................................... $ 213,392 $ 206,125
Average cost approximates current cost. Gross inventories accounted for using the LIFO method totaled $195.0 million at December 31, 2013 and $195.7 million at December 31, 2012. The use of the LIFO method results in a better matching of revenue and costs. The liquidation of LIFO inventory layers reduced cost of sales by $1.0 million in 2013 and $0.5 million in 2012.
Note D — Property, Plant and Equipment
Property, plant and equipment on the Consolidated Balance Sheets is summarized as follows:
December 31,(Thousands) 2013 2012
Land ............................................................................................................................................ $ 8,097 $ 8,797Buildings..................................................................................................................................... 128,187 127,691Machinery and equipment .......................................................................................................... 569,617 570,001Software...................................................................................................................................... 31,571 31,640Construction in progress ............................................................................................................. 14,363 15,389Allowances for depreciation ....................................................................................................... (510,718) (503,560)
Subtotal................................................................................................................................ 241,117 249,956Capital leases .............................................................................................................................. 10,912 10,912Allowances for amortization....................................................................................................... (1,728) (1,440)
Subtotal................................................................................................................................ 9,184 9,472Mineral resources........................................................................................................................ 4,979 4,979Mine development ...................................................................................................................... 15,153 10,377Allowances for amortization and depletion................................................................................ (8,540) (2,243)
Subtotal................................................................................................................................ 11,592 13,113Property, plant and equipment — net ......................................................................................... $ 261,893 $ 272,542
The Company has a Title III contract with the Department of Defense (DoD) for the design and development of a primary beryllium production facility. Construction of the facility would not have been economically feasible without assistance from the government. The cost of the project, which included the equipment and building and project design, administrative and other general costs that were not capitalizable as fixed assets, totaled approximately $104.9 million. The Company capitalized $14.7 million of fixed assets and $10.0 million of capital leases as a portion of its cost share for the project. Reimbursements received by the Company from the DoD included $63.5 million for its share of the cost of equipment that was purchased by the Company and installed in the facility. The cost paid by the Company was recorded in property, plant and equipment and the reimbursement from the government was recorded as unearned income on the Consolidated Balance Sheets. The unearned income liability will be reduced and credited to income ratably with the depreciation expense recorded over the useful life the equipment.
The equipment was placed in service during 2012. Depreciation expense on the portion of the equipment whose cost was reimbursed by the DoD was $4.7 million in 2013 and $2.3 million in 2012. Accordingly, unearned income was reduced by $4.7 million in 2013 and $2.3 million in 2012 and credited to cost of sales in the Consolidated Statement of Income, offsetting the impact of the depreciation expense on the associated equipment on the Company's cost of sales and gross margin.

63
Depreciation expense, including amortization for assets recorded under capital lease, was $36.1 million in 2013, $31.0 million in 2012 and $37.5 million in 2011. The expense in 2013 and 2012 is net of the above referenced reductions in the unearned income liability. Depreciation, depletion and amortization as shown on the Consolidated Statement of Cash Flows is also net of the reduction in the unearned income liability in 2013 and 2012. The net book value of capitalized software as of December 31, 2013 was $7.0 million and $8.5 million as of December 31, 2012. Depreciation expense related to software was $1.7 million in 2013, $1.6 million in 2012 and $1.2 million in 2011.
Note E — Intangible Assets
Assets Acquired
The Company incurred $1.6 million for deferred financing costs associated with new debt agreements in 2013 with a weighted-average amortization period of 4.8 years.
Assets Subject to Amortization
The cost, accumulated amortization and net book value of intangible assets subject to amortization as of December 31, 2013 and 2012 and the aggregate amortization expense for each year then ended is as follows:
(Thousands) 2013 2012
Deferred financing costsCost ............................................................................................................................................... $ 7,794 $ 6,427Accumulated amortization ............................................................................................................ (4,507) (4,048)Net book value .............................................................................................................................. 3,287 2,379
Customer relationshipsCost ............................................................................................................................................... 38,427 38,427Accumulated amortization ............................................................................................................ (22,624) (18,703)Net book value .............................................................................................................................. 15,803 19,724
TechnologyCost ............................................................................................................................................... 12,092 12,092Accumulated amortization ............................................................................................................ (7,626) (6,538)Net book value .............................................................................................................................. 4,466 5,554
LicenseCost ............................................................................................................................................... 2,480 2,480Accumulated amortization ............................................................................................................ (1,828) (1,340)Net book value .............................................................................................................................. 652 1,140
Non-compete contractsCost ............................................................................................................................................... 550 550Accumulated amortization ............................................................................................................ (550) (530)Net book value .............................................................................................................................. — 20
Trade NameCost ............................................................................................................................................... 62 62Accumulated amortization ............................................................................................................ (22) (10)Net book value .............................................................................................................................. 40 52
TotalCost ............................................................................................................................................... $ 61,405 $ 60,038Accumulated amortization ............................................................................................................ (37,157) (31,169)Net book value .............................................................................................................................. $ 24,248 $ 28,869
Aggregate amortization expense ..................................................................................................... $ 6,208 $ 6,657
The aggregate amortization expense is estimated to be $5.9 million in 2014, $5.8 million in 2015, $5.1 million in 2016, $4.5 million in 2017 and $1.7 million in 2018.

64
Assets Not Subject to Amortization
The Company’s only intangible asset not subject to amortization is goodwill. A reconciliation of the goodwill activity for 2013 and 2012 is as follows:
(Thousands) 2013 2012
Balance at the beginning of the year ............................................................................................... $ 88,753 $ 84,036Current year additions ..................................................................................................................... — 4,717Balance at the end of the year.......................................................................................................... $ 88,753 $ 88,753
Goodwill totaling $86.9 million has been assigned to the Advanced Material Technologies segment while the remaining $1.9 million has been assigned to the Beryllium and Composites segment.
The goodwill acquired in 2012 was not deductible for tax purposes.
Note F — Debt
Long-term debt on the Consolidated Balance Sheets is summarized as follows:
December 31,(Thousands) 2013 2012
Revolving credit agreement ............................................................................................................... $ 15,000 $ 30,000Fixed rate industrial development revenue bonds payable in annual installments through 2021 ..... 6,575 7,158Variable rate industrial development revenue bonds payable in 2016............................................... 8,305 8,305Total outstanding................................................................................................................................ 29,880 45,463Current portion of long-term debt...................................................................................................... (613) (583)Total ................................................................................................................................................... $ 29,267 $ 44,880
Maturities on long-term debt instruments as of December 31, 2013 are as follows:
2014 ............................................................................................................................................................................ $ 6132015 ............................................................................................................................................................................ 6532016 ............................................................................................................................................................................ 9,0002017 ............................................................................................................................................................................ 7332018 ............................................................................................................................................................................ 15,773Thereafter.................................................................................................................................................................... 3,108
Total ............................................................................................................................................................................ $ 29,880
In July 2013, the Company entered into an amended and restated credit agreement (Credit Agreement) with six financial institutions that expires in 2018 and provides for a $375.0 million revolving credit facility comprised of sub-facilities for revolving loans, swing line loans, letters of credit and foreign borrowings. The Credit Agreement also provides for an uncommitted incremental facility whereby, under certain conditions, the Company may be able to borrow additional term loans in an aggregate amount not to exceed $100.0 million. Borrowings under the revolving credit facility are secured by substantially all of the assets of the Company and its direct subsidiaries, with the exception of non-mining real property and certain other assets. The Credit Agreement allows the Company to borrow money at a premium over LIBOR or the prime rate and at varying maturities. The premium resets quarterly according to the terms and conditions available under the agreement. At December 31, 2013 there was $39.5 million outstanding against the letters of credit sub-facility. The Company pays a variable commitment fee that resets quarterly (0.225% as of December 31, 2013) of the available and unborrowed amounts under the revolving credit line.
The Credit Agreement contains restrictive covenants including incurring additional indebtedness, acquisition limits, dividend declarations and stock repurchases. In addition, the Credit Agreement includes covenants over a maximum leverage ratio and a minimum fixed charge coverage ratio. The Company was in compliance with all of its debt covenants as of December 31, 2013.
65
The following table summarizes the Company’s short-term lines of credit. Amounts shown as outstanding are included in short-term debt on the Consolidated Balance Sheets.
December 31, 2013 December 31, 2012(Thousands) Total Outstanding Available Total Outstanding Available
Domestic.................................... $ 320,510 $ 6,291 $ 314,219 $ 256,799 $ 8,000 $ 248,799Foreign....................................... 13,320 — 13,320 15,266 1,415 13,851Precious metal ........................... 28,662 28,662 — 39,435 39,435 —
Total......................................... $ 362,492 $ 34,953 $ 327,539 $ 311,500 $ 48,850 $ 262,650
While the available borrowings under the individual existing credit lines total $327.5 million, the covenants in the domestic credit agreement restrict the aggregate available borrowings to $186.8 million as of December 31, 2013.
The domestic line is committed and includes all sub-facilities in the $375.0 million maximum borrowing under the revolving credit agreement. The Company has various foreign lines of credit, one of which is for 3.5 million euros is committed and secured. The remaining foreign lines are uncommitted, unsecured and renewed annually. The average interest rate on short-term debt was 2.47% and 2.43% as of December 31, 2013 and 2012, respectively.
In April 2011, the Company entered into an agreement with the Toledo-Lucas County Port Authority and the Dayton–Montgomery County Port Authority, who co-issued $8.0 million in taxable development revenue bonds, with a fixed amortization term that will mature in 2021. The interest rate on these bonds is fixed at 4.9% and the unamortized balance of the bonds was $6.6 million at December 31, 2013.
In November 1996, the Company entered into an agreement with the Lorain Port Authority, Ohio to issue $8.3 million in variable rate industrial revenue bonds, maturing in 2016. The variable rate ranged from 0.19% to 0.38% in 2013 and from 0.26% to 0.46% in 2012.
Note G — Leasing Arrangements
The Company leases warehouse and manufacturing space, and manufacturing and computer equipment under operating leases with terms ranging up to 25 years. Operating lease expense amounted to $9.4 million, $9.0 million, and $8.9 million during 2013, 2012, and 2011, respectively. The future estimated minimum payments under capital leases and non-cancelable operating leases with initial lease terms in excess of one year at December 31, 2013, are as follows:
Capital Operating(Thousands) Leases Leases
2014.............................................................................................................................................. $ 1,076 $ 6,9312015.............................................................................................................................................. 1,069 6,2272016.............................................................................................................................................. 1,064 5,2572017.............................................................................................................................................. 1,064 4,0322018.............................................................................................................................................. 1,064 3,4362019 and thereafter....................................................................................................................... 4,701 12,110Total minimum lease payments.................................................................................................... 10,038 $ 37,993Amounts representing interest...................................................................................................... 2,151Present value of net minimum lease payments ............................................................................ $ 7,887
The Company was in compliance with all of the covenants contained in the lease agreements as of December 31, 2013.
Note H — Fair Value Information and Derivative Financial Instruments
The Company measures and records financial instruments at their fair value. A hierarchy is used for those instruments measured at fair value that distinguishes between assumptions based upon market data (observable inputs) and the Company's assumptions (unobservable inputs). The hierarchy consists of three levels:
Level 1 — Quoted market prices in active markets for identical assets and liabilities;
Level 2 — Inputs other than Level 1 inputs that are either directly or indirectly observable; and

66
Level 3 — Other significant unobservable inputs developed using estimates and assumptions developed by the Company, which reflect those that a market participant would use.
The following table summarizes the financial instruments measured at fair value in the Consolidated Balance Sheet as of December 31, 2013:
Fair Value Measurements
(Thousands) Total
Quoted Pricesin Active
Markets forIdentical
Assets(Level 1)
SignificantObservable
Inputs(Level 2)
OtherSignificant
UnobservableInputs
(Level 3)
Financial AssetsDirectors’ deferred compensation investments......... $ 535 $ 535 $ — $ —Precious metal forward contracts.............................. 11 — 11 —Foreign currency forward contracts.......................... 292 — 292 —Total.......................................................................... $ 838 $ 535 $ 303 $ —
Financial LiabilitiesDirectors’ deferred compensation liability ............... $ 535 $ 535 $ — $ —Precious metal swaps................................................ 30 — 30 —Foreign currency forward contracts.......................... 379 — 379 —Total.......................................................................... $ 944 $ 535 $ 409 $ —
The Company uses a market approach to value the assets and liabilities for outstanding derivative contracts in the table above. Foreign currency and precious metal hedge contracts are valued through models that utilize market observable inputs including both spot and forward prices for the same underlying currencies and metals. The carrying values of the other working capital items and debt on the Consolidated Balance Sheet approximate their fair values as of December 31, 2013.
The Company uses derivative contracts to hedge portions of its foreign currency exposures and may also use derivatives to hedge a portion of its precious metal exposures. The objectives and strategies for using derivatives in these areas are as follows:
Foreign Currency. The Company sells products to overseas customers in their local currencies, primarily the euro and yen. The Company secures foreign currency derivatives, mainly forward contracts and options, to hedge these anticipated sales transactions. The purpose of the hedge program is to protect against the reduction in the dollar value of foreign currency sales from adverse exchange rate movements. Should the dollar strengthen significantly, the decrease in the translated value of the foreign currency sales should be partially offset by gains on the hedge contracts. Depending upon the methods used, the hedge contract may limit the benefits from a weakening U.S. dollar.
The use of forward contracts locks in a firm rate and eliminates any downside from an adverse rate movement as well as any benefit from a favorable rate movement. The Company may from time to time choose to hedge with options or a tandem of options known as a collar. These hedging techniques can limit or eliminate the downside risk but can allow for some or all of the benefit from a favorable rate movement to be realized. Unlike a forward contract, a premium is paid for an option; collars, which are a combination of a put and call option, may have a net premium but they can be structured to be cash neutral. The Company will primarily hedge with forward contracts due to the relationship between the cash outlay and the level of risk.
Precious Metals. The Company maintains the majority of its precious metal production requirements on consignment in order to reduce its working capital investment and the exposure to metal price movements. When a precious metal product is fabricated and ready for shipment to the customer, the metal is purchased out of consignment at the current market price. The price paid by the Company forms the basis for the price charged to the customer. This methodology allows for changes in either direction in the market prices of the precious metals used by the Company to be passed through to the customer and reduces the impact changes in prices could have on the Company's margins and operating profit. The consigned metal is owned by financial institutions who charge the Company a financing fee based upon the current value of the metal on hand.
In certain instances, a customer may want to establish the price for the precious metal at the time the sales order is placed rather than at the time of shipment. Setting the sales price at a different date than when the material would be purchased potentially creates an exposure to movements in the market price of the metal. Therefore, in these limited situations, the Company may elect to enter into a forward contract to purchase precious metal. The forward contract allows the Company

67
to purchase metal at a fixed price on a specific future date. The price in the forward contract serves as the basis for the price to be charged to the customer. By doing so, the selling price and purchase price are matched and the Company's price exposure is reduced.
The Company refines precious metal containing materials for its customers and typically will purchase the refined metal from the customer at current market prices. In limited circumstances, the customer may want to fix the price to be paid at the time of the order as opposed to when the material is refined. The customer may also want to fix the price for a set period of time. The Company may then elect to enter into a hedge contract, either a forward contract or a swap, to fix the price for the estimated quantity of metal to be purchased thereby reducing the exposure to adverse movements in the price of the metal.
The Company may from time to time elect to purchase precious metal and hold in its inventory rather than on consignment due to potential credit line limitations or other factors. These purchases are typically held for a short duration. A forward contract will be secured at the time of the purchase to fix the price to be used when the metal is transferred back to the consignment line, thereby limiting any price exposure during the time when the metal was owned.
A team consisting of senior financial managers reviews the estimated exposure levels, as defined by budgets, forecasts and other internal data, and determines the timing, amounts and instruments to use to hedge that exposure. Management analyzes the effective hedged rates and the actual and projected gains and losses on the hedging transactions against the program objectives, targeted rates and levels of risk assumed. Foreign currency contracts are typically layered in at different times for a specified exposure period in order to minimize the impact of market rate movements.
The use of derivatives is governed by policies adopted by the Audit Committee of the Board of Directors. The Company will only enter into a derivative contract if there is an underlying identified exposure. Contracts are typically held to maturity. The Company does not engage in derivative trading activities and does not use derivatives for speculative purposes. The Company only uses hedge contracts that are denominated in the same currency or metal as the underlying exposure.
The fair values of the outstanding derivatives are recorded as assets (if the derivatives are in a gain position) or liabilities (if the derivatives are in a loss position). The fair values will also be classified as short term or long term depending upon their maturity dates. The following table summarizes the notional amount and the fair value of the Company’s outstanding derivatives and their balance sheet classification as of December 31, 2013 and 2012:
December 31, 2013 December 31, 2012
(Thousands)NotionalAmount
FairValue
NotionalAmount
FairValue
Prepaid expensesForeign currency forward contracts - yen................ $ 4,951 $ 292 $ 8,024 $ 650Precious metal forward contracts............................. 5,663 11 14,623 197
Total..................................................................... 10,614 303 22,647 847Other liabilities and accrued items
Foreign currency forward contracts - euro............... 25,112 (364) 21,047 (397)Precious metal swaps ............................................... 4,511 (30) 11,673 (100)
Total..................................................................... 29,623 (394) 32,720 (497)Other long-term liabilities
Foreign currency forward contracts - euro............... 952 (15) — —Total..................................................................... $ 41,189 $ (106) $ 55,367 $ 350
All of the foreign currency and precious metal derivative contracts outstanding at December 31, 2013 and 2012 were designated and effective as cash flow hedges.
There was no ineffectiveness associated with the derivative contracts outstanding at December 31, 2013 and 2012, and no ineffectiveness expense was recorded in 2013, 2012 or 2011.
The change in the fair value of derivative contracts recorded in accumulated other comprehensive income totaled ($0.1) million as of December 31, 2013. The Company expects to relieve substantially all of this balance to expense on the Consolidated Statement of Income in 2014. The change in fair value of derivative contracts in accumulated other comprehensive income totaled $0.4 million at December 31, 2012.

68
Note I — Pensions and Other Post-retirement Benefits
The obligation and funded status of the Company’s pension and other post-retirement benefit plans are shown below. The Pension Benefits column aggregates defined benefit pension plans in the U.S., Germany and England and the U.S. supplemental retirement plans. The Other Benefits column includes the domestic retiree medical and life insurance plan.
Pension Benefits Other Benefits(Thousands) 2013 2012 2013 2012Change in benefit obligationBenefit obligation at beginning of year ............................................ $ 253,839 $ 210,996 $ 34,294 $ 33,209Service cost....................................................................................... 9,724 7,915 305 285Interest cost....................................................................................... 9,936 9,912 1,243 1,439Plan amendments.............................................................................. — 117 — —Actuarial (gain) loss ......................................................................... (28,581) 32,595 (2,396) 1,493Benefit payments from fund............................................................. (22,893) (7,523) — —Benefit payments directly by Company ........................................... (136) (129) (2,271) (2,431)Expenses paid from assets ................................................................ (613) (293) — —Medicare Part D subsidy .................................................................. — — 223 299Foreign currency exchange rate changes.......................................... 472 249 — —Benefit obligation at end of year ...................................................... 221,748 253,839 31,398 34,294Change in plan assetsFair value of plan assets at beginning of year .................................. 163,436 140,344 — —Actual return on plan assets.............................................................. 23,824 18,534 — —Employer contributions .................................................................... 9,615 12,218 — —Benefit payments from fund............................................................. (22,893) (7,523) — —Expenses paid from assets ................................................................ (613) (293) — —Foreign currency exchange rate changes.......................................... 125 156 — —Fair value of plan assets at end of year ............................................ 173,494 163,436 — —Funded status at end of year ............................................................. $ (48,254) $ (90,403) $ (31,398) $ (34,294)Amounts recognized in the ConsolidatedBalance Sheets consist of:Other assets....................................................................................... $ 1,321 $ 1,112 $ — $ —Other liabilities and accrued items ................................................... (1,138) (475) (2,663) (2,663)Retirement and post-employment benefits....................................... (48,437) (91,040) (28,735) (31,631)
$ (48,254) $ (90,403) $ (31,398) $ (34,294)Amounts recognized in other comprehensive income (beforetax) consist of:Net actuarial loss .............................................................................. $ 78,983 $ 127,027 $ 52 $ 2,472Net prior service (credit) cost ........................................................... (1,734) (2,075) — 115
$ 77,249 $ 124,952 $ 52 $ 2,587Amortizations expected to be recognized during next fiscalyear (before tax):Amortization of net loss ................................................................... $ 5,100 $ 7,731 $ — $ —Amortization of prior service credit ................................................. (434) (341) — 115
$ 4,666 $ 7,390 $ — $ 115Additional informationAccumulated benefit obligation for all defined benefit pensionplans.................................................................................................. $ 213,585 $ 242,854 — —For defined benefit pension plans with benefit obligations inexcess of plan assets:
Aggregate benefit obligation ................................................... 216,567 249,075 — —Aggregate fair value of plan assets.......................................... 166,992 157,560 — —
For defined benefit pension plans with accumulated benefitobligations in excess of plan assets:
Aggregate accumulated benefit obligation.............................. 208,404 238,090 — —Aggregate fair value of plan assets.......................................... 166,992 157,560 — —

69
Components of net periodic benefit cost and other amounts recognized in other comprehensive income (OCI)
Pension Benefits Other Benefits(Thousands) 2013 2012 2011 2013 2012 2011
Net periodic benefit costService cost ...................................... $ 9,724 $ 7,915 $ 6,955 $ 305 $ 285 $ 284Interest cost ...................................... 9,936 9,912 9,786 1,243 1,439 1,596Expected return on plan assets......... (12,261) (11,934) (11,050) — — —Amortization of prior service cost(benefit)............................................ (340) (335) (335) 115 87 (36)Recognized net actuarial loss........... 7,912 5,605 3,920 — — —Net periodic benefit cost .................. $ 14,971 $ 11,163 $ 9,276 $ 1,663 $ 1,811 $ 1,844
Pension Benefits Other Benefits(Thousands) 2013 2012 2011 2013 2012 2011
Change in other comprehensiveincomeOCI at beginning of year ................... $ 124,955 $ 104,056 $ 69,716 $ 2,587 $ 1,180 $ (275)Increase (decrease) in OCI:
Recognized during year — priorservice cost (credit) ......................... 340 335 335 (115) (87) 36Recognized during year — netactuarial (losses) gains .................... (7,912) (5,605) (3,920) — — —Occurring during year — priorservice cost ...................................... — 117 430 — — —Occurring during year — netactuarial losses (gains) .................... (40,143) 25,995 37,543 (2,397) 1,494 1,419Other adjustments ........................... (3) — — (23) — —Foreign currency exchange ratechanges............................................ 12 57 (48) — — —
OCI at end of year ............................. $ 77,249 $ 124,955 $ 104,056 $ 52 $ 2,587 $ 1,180
Summary of key valuation assumptions
Pension Benefits Other Benefits 2013 2012 2011 2013 2012 2011
Weighted-average assumptionsused to determine benefitobligations at fiscal year endDiscount rate .................................... 4.80% 3.99% N/A 4.50% 3.75% N/ARate of compensation increase......... 4.43% 4.44% N/A 4.50% 4.50% N/AWeighted-average assumptionsused to determine net cost for thefiscal yearDiscount rate .................................... 3.97% 4.81% 5.49% 3.75% 4.50% 5.13%Expected long-term return on planassets ................................................ 7.44% 7.65% 7.88% N/A N/A N/ARate of compensation increase......... 4.42% 4.43% 3.97% 4.50% 4.50% 4.00%
The Company uses a December 31 measurement date for the above plans.
Effective January 1, 2014, the Company revised the expected long-term rate of return assumption used in calculating the annual expense for its domestic defined benefit pension plan, decreasing it to 7.25% from 7.50%. Effective January 1, 2013, the Company revised the expected long-term rate of return assumption used in calculating the annual expense for its domestic defined

70
benefit pension plan, decreasing it to 7.50% from 7.75%, and effective January 1, 2012, this assumption was decreased to 7.75% from 8.00%. In each instance, the impact was accounted for as a change in estimate.
Management establishes the domestic expected long-term rate of return assumption by reviewing its historical trends and analyzing the current and projected market conditions in relation to the plan’s asset allocation and risk management objectives. Consideration is given to both recent plan asset performance as well as plan asset performance over various long-term periods of time, with an emphasis on the assumption being a prospective, long-term rate of return. Management consults with and considers the opinions of its outside investment advisors and actuaries when establishing the rate and reviews its assumptions with the Audit Committee of the Board of Directors. Management believes that the 7.25% domestic expected long-term rate of return assumption is achievable and reasonable given current market conditions and forecasts, asset allocations, investment policies and investment risk objectives.
The rate of compensation increase assumption was changed to 4.5% for 2012 and years after in the domestic defined benefit pension plan and the domestic retiree medical plan. Previously, a graded assumption was used that resulted in an assumption of 4.0% for the 2011.
In the second quarter 2012, the Company closed its domestic defined benefit pension plan to new entrants. Current plan participants will continue to accrue benefits under the existing formulas while new hires will be offered an enhanced defined contribution plan.
Assumptions for the defined benefit pension plans in Germany and England are determined separately from the U.S. plan assumptions, based on historical trends and current and projected market conditions in Germany and England. The plan in Germany is unfunded and the plan in England has assets that are approximately 4.0% of the Company’s aggregated total fair value of plan assets as of year-end 2013.
Assumed health care trend rates at fiscal year end 2013 2012
Health care trend rate assumed for next year................................................................. 7.50% 8.00%Rate that the trend rate gradually declines to (ultimate trend rate)................................ 5.00% 5.00%Year that the rate reaches the ultimate trend rate........................................................... 2019 2019
Assumed health care cost trend rates have a significant effect on the amounts reported for the health care plans. A one-percentage-point change in assumed health care cost trend rates would have the following effects:
1-Percentage-Point Increase
1-Percentage-Point Decrease
(Thousands) 2013 2012 2013 2012
Effect on total of service and interest cost components.... $ 30 $ 35 $ (26) $ (31)Effect on post-retirement benefit obligation..................... 602 827 (567) (723)

71
Plan Assets
The following tables present the fair values of the Company’s defined benefit pension plan assets as of December 31, 2013 and 2012 by asset category. See Note H to the Consolidated Financial Statements for definitions of fair value hierarchy.
December 31, 2013
Total Level 1 Level 2 Level 3(Thousands)
Cash......................................................................... $ 6,568 $ 6,568 $ — $ —Equity securities:
U.S. (a).................................................................. 63,321 54,095 9,226 —International (b) .................................................... 27,403 23,911 3,492 —Emerging markets (c) ........................................... 14,165 13,908 257 —
Fixed income securities:Intermediate-term bonds (d) ................................. 21,874 14,482 7,392 —Short-term bonds (e) ............................................. 11,608 11,608 — —Global bonds (f) .................................................... 12,728 10,879 1,849 —
Other types of investments:Real estate fund (g) ................................................. 9,943 9,882 61 —Multi-strategy hedge funds (h)................................ 5,467 — — 5,467Private equity funds ................................................ 417 — — 417Total........................................................................ $ 173,494 $ 145,333 $ 22,277 $ 5,884
December 31, 2012
Total Level 1 Level 2 Level 3(Thousands)
Cash......................................................................... $ 7,388 $ 7,388 $ — $ —Equity securities:
U.S. (a).................................................................. 54,691 45,025 9,666 —International (b) .................................................... 22,683 19,650 3,033 —Emerging markets (c) ........................................... 14,786 14,535 251 —
Fixed income securities:Intermediate-term bonds (d) ................................. 26,749 18,378 8,371 —Short-term bonds (e) ............................................. 11,656 11,656 — —Global bonds (f) .................................................... 12,854 11,185 1,669 —
Other types of investments:Real estate fund (g) ................................................. 7,793 7,768 25 —Multi-strategy hedge funds (h)................................ 4,191 — — 4,191Private equity funds ................................................ 645 — — 645Total......................................................................... $ 163,436 $ 135,585 $ 23,015 $ 4,836
(a) Mutual funds that invest in various sectors of the U.S. market.(b) Mutual funds that invest in non-U.S. companies primarily in developed countries that are generally considered to be value
stocks.(c) Mutual funds that invest in non-U.S. companies in emerging market countries.(d) Includes a mutual fund that employs a value-oriented approach to fixed income investment management and a mutual
fund that invests primarily in investment-grade debt securities. (e) Includes a mutual fund that seeks a market rate of return for a fixed-income portfolio with low relative volatility of returns,
investing generally in U.S. and foreign debt securities maturing in five years or less.(f) Mutual funds that invest in domestic and foreign sovereign securities, fixed income securities, mortgage-backed and asset-
backed bonds, convertible bonds, high yield bonds and emerging market bonds.(g) Includes a mutual fund that typically invests at least 80% of its assets in equity and debt securities of companies in the real
estate industry or related industries or in companies which own significant real estate assets at the time of investment.(h) Includes a hedge fund that employs multiple strategies to multiple asset classes with low correlations.
72
The following table summarizes changes in the fair value of the Company’s defined benefit pension plan Level 3 assets measured using significant unobservable inputs during 2013 and 2012:
(Thousands)
Multi-strategy
Hedge Funds
PrivateEquityFunds Total
Balance as of January 1, 2012 ......................................................... $ 3,989 $ 682 $ 4,671Actual return:
On assets still held at reporting date......................................... 386 17 403On assets sold during the period .............................................. (57) 4 (53)
Purchases, sales and settlements ................................................... (127) (58) (185)Balance as of December 31, 2012 ................................................... $ 4,191 $ 645 $ 4,836
Actual return:On assets still held at reporting date......................................... 1,276 (93) 1,183On assets sold during the period .............................................. — 229 229
Purchases, sales and settlements ................................................... — (364) (364)Balance as of December 31, 2013 ................................................... $ 5,467 $ 417 $ 5,884
Capital may be withdrawn from the multi-strategy hedge fund partnership on a monthly basis with a ten day notice period.
The Company’s domestic defined benefit pension plan investment strategy, as approved by the Governance and Organization Committee of the Board of Directors, is to employ an allocation of investments that will generate returns equal to or better than the projected long-term growth of pension liabilities so that the plan will be self-funding. The return objective is to maximize investment return to achieve and maintain a 100% funded status over time, taking into consideration required cash contributions. The allocation of investments is designed to maximize the advantages of diversification while mitigating the risk and overall portfolio volatility to achieve the return objective. Risk is defined as the annual variability in value and is measured in terms of the standard deviation of investment return. Under the Company’s investment policies, allowable investments include domestic equities, international equities, fixed income securities, cash equivalents and alternative securities (which include real estate, private venture capital investments, hedge funds and tactical asset allocation). Ranges, in terms of a percentage of the total assets, are established for each allowable class of security. Derivatives may be used to hedge an existing security or as a risk reduction strategy. Current asset allocation guidelines are to invest 30% to 70% in equity securities, 20% to 50% in fixed income securities and cash and up to 20% in alternative securities. Management reviews the asset allocation on a quarterly or more frequent basis and makes revisions as deemed necessary.
None of the plan assets noted above are invested in the Company’s common stock.
Cash Flows
Employer Contributions
The Company expects to contribute $19.0 million to its domestic defined benefit pension plan and $2.7 million to its other benefit plans in 2014.

73
Estimated Future Benefit Payments
The following benefit payments, which reflect expected future service, as appropriate, are expected to be paid:
Other Benefits
Pension BenefitsGross Benefit
Payment
Net ofMedicare
Part DSubsidy
(Thousands)
2014............................................................................................ $ 10,280 $ 2,663 $ 2,3222015............................................................................................ 9,629 2,745 2,3842016............................................................................................ 10,201 2,789 2,4102017............................................................................................ 12,867 2,852 2,4522018............................................................................................ 11,518 2,883 2,4572019 through 2023 ..................................................................... 71,293 13,270 10,677
Other Benefit Plans
In addition to the plans shown above, the Company also has certain foreign subsidiaries with accrued unfunded pension and other post-employment arrangements. The liability for these arrangements was $2.3 million at December 31, 2013 and $2.6 million at December 31, 2012 and was included in retirement and post-employment benefits on the Consolidated Balance Sheets.
The Company also sponsors defined contribution plans available to substantially all U.S. employees. The Company’s annual defined contribution expense, including the expense for the enhanced defined contribution plan that was implemented in the second quarter 2012, was $2.8 million in 2013, $2.5 million in 2012 and $2.2 million in 2011.
Note J — Contingencies and Commitments
CBD Claims
The Company is a defendant from time to time in proceedings in various state and federal courts brought by plaintiffs alleging that they have contracted chronic beryllium disease (CBD) or related ailments as a result of exposure to beryllium. Plaintiffs in CBD cases seek recovery under theories of negligence and various other legal theories and seek compensatory and punitive damages, in many cases of an unspecified sum. Spouses, if any, often claim loss of consortium.
Employee cases, in which plaintiffs have a high burden of proof, have historically involved relatively small losses to the Company. Third-party plaintiffs (typically employees of customers) face a lower burden of proof than do the Company’s employees, but these cases have generally been covered by varying levels of insurance. Management has vigorously contested the CBD cases brought against the Company.
Claims filed by third-party plaintiffs alleging CBD filed prior to the end of 2022 are covered by insurance if any portion of the alleged exposure period occurred prior to year-end 2007. Both defense and indemnity costs are covered subject to an annual $1.0 million deductible and other terms and provisions.
There were two CBD cases outstanding as of year-end 2013 with a recorded reserve of $0.1 million. One of these cases was filed during 2013, while the other case was filed in 2012. There were no settlements paid or cases dismissed during 2013 or 2012. There were two active cases during 2011, both of which were filed prior to 2011. One of these cases was settled for less than $0.1 million while the other case was dismissed during 2011.
Although it is not possible to predict the outcome of any pending litigation, the Company provides for costs related to litigation matters when a loss is probable and the amount is reasonably estimable. Litigation is subject to many uncertainties, and it is possible that some of the actions could be decided unfavorably in amounts exceeding the Company’s reserves. An unfavorable outcome or settlement of a CBD case or adverse media coverage could encourage the commencement of additional similar litigation. The Company is unable to estimate its potential exposure to unasserted claims.
Based upon currently known facts and assuming collectibility of insurance, the Company does not believe that resolution of the current or future beryllium proceedings will have a material adverse effect on the financial condition or cash flow of the Company. However, the Company’s results of operations could be materially affected by unfavorable results in one or more cases.

74
Insurance Recoverable
After recording and investigating a $7.4 million inventory loss in the fourth quarter 2012, the Company filed a claim with its insurance provider under existing polices for theft. As of early in the first quarter 2014, the insurance company and the Company were still in discussions regarding the claim and no payment to the Company had been made. No benefit from an insurance recovery was recorded as of December 31, 2013 or 2012. The benefit of any insurance recoverable may be recorded in future periods based upon the ability to determine the amount of the recovery, an assessment of the probability of the recovery and other factors and/or in the period when the cash is received.
Environmental Proceedings
The Company has an active program for environmental compliance that includes the identification of environmental projects and estimating their impact on the Company’s financial performance and available resources. Environmental expenditures that relate to current operations, such as wastewater treatment and control of airborne emissions, are either expensed or capitalized as appropriate. The Company records reserves for the probable costs for identified environmental remediation projects. The Company’s environmental engineers perform routine ongoing analyses of the remediation sites and will use outside consultants to assist in their analyses from time to time. Accruals are based upon their analyses and are established at either the best estimate or, absent a best estimate, at the low end of the estimated range of costs. The accruals are revised for the results of ongoing studies, changes in strategies, inflation and for differences between actual and projected costs. The accruals may also be affected by rulings and negotiations with regulatory agencies. The timing of payments often lags the accrual, as environmental projects typically require a number of years to complete.
The environmental reserves recorded represent the Company's best estimate of what is reasonably possible and cover existing or currently foreseen projects based upon the current facts and circumstances. The Company does not believe that it is reasonably possible that the cost to resolve environmental matters for sites where the investigative work and work plan development are substantially complete will be materially different than what has been accrued while the ultimate loss contingencies for sites that are in the preliminary stages of investigation cannot be reasonably determined at the present time. As facts and circumstances changes, the ultimate cost may be revised and the recording of additional costs may be material in the period in which the additional costs are accrued. The Company does not believe that the ultimate liability for environmental matters will have a material impact on its financial condition or liquidity due to the extended period of time during which environmental remediation normally takes place.
The undiscounted reserve balance at the beginning of the year, the amounts expensed and paid and the balance at the end of the year for 2013 and 2012 are as follows:
(Thousands) 2013 2012
Reserve balance at beginning of year.......................................................................... $ (5,301) $ (5,312)Expensed ..................................................................................................................... (503) (316)Paid.............................................................................................................................. 995 327Reserve balance at end of year.................................................................................... $ (4,809) $ (5,301)Ending balance recorded in:Other liabilities and accrued items.............................................................................. $ (430) $ (903)Other long-term liabilities ........................................................................................... (4,379) (4,398)
The majority of spending in 2013 and 2012 was for various remediation projects at the Elmore, Ohio plant site with lesser amounts spent at other locations.
Long-term Obligation
The Company has a long-term supply agreement with Ulba/Kazatomprom of the Republic of Kazakhstan and its marketing representative, Nukem, Inc. (Nukem) of Connecticut, for the purchase of approximately 775,000 pounds of beryllium copper master alloy. The pricing for the beryllium content of the material is fixed while the price for the copper content fluctuates based upon the monthly average LME market price. The contract was completed prior to year-end 2013. Purchases made under this agreement totaled $1.8 million in 2013, $5.2 million in 2012 and $8.8 million in 2011. The material purchased from Nukem is used in the manufacture of beryllium-containing alloy products by the Performance Alloys segment.

75
Other
The Company is subject to various other legal or other proceedings that relate to the ordinary course of its business. The Company believes that the resolution of these proceedings, individually or in the aggregate, will not have a material adverse impact upon the Company’s consolidated financial statements.
The Company has outstanding letters of credit totaling $27.3 million related to workers’ compensation, consigned precious metal guarantees, environmental remediation issues and other matters, the majority of which will expire in 2014.
Note K — Common Stock and Stock-based Compensation
A reconciliation of the changes in the number of common shares issued is as follows:
(Thousands)
Issued as of January 1, 2011 ................................................................................................................................... 26,968Exercise of stock options and stock appreciation rights (SARs)............................................................................ 55Vesting of performance-restricted shares................................................................................................................ 1Issued as of December 31, 2011 ............................................................................................................................. 27,024Exercise of stock options and SARs....................................................................................................................... 26Issued as of December 31, 2012 ............................................................................................................................. 27,050Exercise of stock options and SARs....................................................................................................................... 114Issued as of December 31, 2013 ............................................................................................................................. 27,164
Stock incentive plans (the 2006 Stock Incentive Plan and the 2006 Non-employee Director Equity Plan) were approved at the May 2, 2006 annual meeting of shareholders. These plans authorize the granting of option rights, stock appreciation rights, performance-restricted shares, performance shares, performance units and restricted shares and replaced the 1995 Stock Incentive Plan and the 1997 Stock Incentive Plan for Non-employee Directors, although there are still options outstanding under these plans. The 2006 Stock Incentive Plan and the 2006 Non-employee Director Equity Plan were amended to, among other things, add additional shares to the plans. These amendments were approved by shareholders at the May 2011 annual meeting.
Stock Options
Stock options may be granted to employees or non-employee directors of the Company. Option rights entitle the optionee to purchase common shares at a price equal to or greater than the market value on the date of grant. Option rights granted to employees generally become exercisable (i.e., vest) over a four-year period and expire ten years from the date of the grant. Options granted to employees may also be issued with shorter vesting periods. Options granted to non-employee directors vest in six months and expire ten years from the date of the grant. The number of options available to be issued is established in plans approved by shareholders. The exercise of options is generally satisfied by the issuance of new shares.
The following table summarizes the Company’s stock option activity during 2013:
(Shares in thousands)Number of
Options
Weighted-averageExercisePrice Per
Share
AggregateIntrinsic
Value
Weighted-average
RemainingTerm (Years)
Outstanding at December 31, 2012 ...................................... 96 $ 15.98Exercised .............................................................................. (74) 15.60Canceled ............................................................................... (1) 10.30Outstanding at December 31, 2013 ...................................... 21 17.29 $ 291,000 1.0Vested and expected to vest as of December 31, 2013......... 21 17.29 291,000 1.0Exercisable at December 31, 2013....................................... 21 17.29 291,000 1.0

76
Summarized information on options outstanding as of December 31, 2013 is as follows:
Range of Option Prices
NumberOutstanding
and Exercisable(Thousands)
Weighted-average
RemainingLife (Years)
Weighted-averageExercise
Price
$14.80 ........................................................................................... 2 1.3 $ 14.80$17.08 ........................................................................................... 4 0.1 17.08$17.68 ........................................................................................... 15 1.1 17.68
Total 21 0.9 $ 17.29
Cash received from the exercise of stock options totaled $1.2 million in 2013, $0.2 million in 2012 and $0.7 million in 2011. The benefit realized from tax deductions from exercises was $0.5 million in 2013, $0.1 million in 2012 and $0.5 million in 2011. The total intrinsic value of options exercised during the years ended December 31, 2013, 2012 and 2011 was $1.0 million, $0.3 million and $1.4 million, respectively.
Restricted Stock
The Company may grant restricted stock to employees and non-employee directors of the Company. These shares are restricted and vest over a designated period of time as defined at the date of the grant and are forfeited should the holder’s employment terminate during the restriction period. The fair market value of the restricted shares is determined on the date of the grant and is amortized over the restriction period. The restriction period is typically three years.
The fair value of the restricted stock is based on the closing stock price on the date of grant. The weighted-average grant date fair value for 2013, 2012 and 2011 was $27.35, $27.87 and $39.18, respectively.
Compensation cost was $2.5 million in 2013, $2.7 million in 2012 and $2.5 million in 2011. The unamortized compensation cost on the outstanding restricted stock was $2.4 million as of December 31, 2013 and is expected to be amortized over a weighted-average period of 18 months. The benefit realized from tax deductions from the vesting of restricted stock totaled $0.2 million in 2013, $0.7 million in 2012 and $0.2 million in 2011.
The following table summarizes the restricted stock activity during 2013:
(Shares in thousands)Number of
Shares
Weighted-average
Grant DateFair Value
Outstanding at December 31, 2012.............................................................................. 223 $ 30.18Granted......................................................................................................................... 67 27.35Vested........................................................................................................................... (66) 27.72Forfeited....................................................................................................................... (24) 29.36Outstanding at December 31, 2013.............................................................................. 200 $ 32.71
Long-term Incentive Plans
Under long-term incentive compensation plans, executive officers and selected other employees receive cash or stock awards based upon the Company’s performance over the defined period, typically three years. Awards may vary based upon the degree to which actual performance exceeds the pre-determined threshold, target and maximum performance levels at the end of the performance periods. Payouts may be subjected to attainment of threshold performance objectives.
Compensation expense is based upon the performance projections for the three-year plan period, the percentage of requisite service rendered and the fair market value of the Company’s common shares on the date of grant. The offset to the compensation expense for the portion of the award to be settled in shares is recorded within shareholders’ equity and was $0.8 million for 2013, $0.4 million for 2012 and zero for 2011.
Directors Deferred Compensation
Non-employee directors may defer all or part of their fees into the Company’s common shares. The fair value of the deferred shares is determined at the share acquisition date and is recorded within shareholders’ equity. Subsequent changes in the fair value of the Company’s common shares do not impact the recorded values of the shares.

77
The following table summarizes the stock activity for the directors' deferred compensation plan during 2013:
(Shares in thousands)Number of
Shares
Weighted-average
Grant DateFair Value
Outstanding at December 31, 2012........................................................................................ 103 $ 22.28Granted................................................................................................................................... 15 26.99Distributed.............................................................................................................................. (17) 20.32Outstanding at December 31, 2013........................................................................................ 101 $ 23.74
There was no income or expense associated with this plan recorded in 2013, 2012 or 2011. During the years ended December 31, 2013, 2012 and 2011, the weighted-average grant date fair value of shares granted was $26.99, $23.10 and $38.00, respectively.
Stock Appreciation Rights
The Company may grant SARs to certain employees and non-employee directors. Upon exercise of vested SARs, the participant will receive a number of shares of common stock equal to the spread (the difference between the market price of the Company’s common shares at the time of the exercise and the strike price established in the SARs agreement) divided by the common share price. The strike price of the SARs is equal to or greater than the market value of the Company’s common shares on the day of the grant. The number of SARs available to be issued is established by plans approved by the shareholders. The vesting period and the life of the SARs are established in the SARs agreement at the time of the grant. The exercise of the SARs is satisfied by the issuance of treasury shares. The SARs vest three years from the date of grant. SARs granted prior to 2011 expire in ten years, while the SARs granted in 2011 and later expire in seven years.
The following table summarizes the Company's SARs activity during 2013:
(Shares in thousands)Number of
SARs
Weighted-averageExercisePrice Per
Share
AggregateIntrinsic
Value
Weighted-average
RemainingTerm (Years)
Outstanding at December 31, 2012.............................. 993 $ 24.80Granted......................................................................... 147 28.32Exercised...................................................................... (145) 17.42Cancelled...................................................................... (11) 31.90Outstanding at December 31, 2013.............................. 984 26.34 $ 6,211,000 5.0Vested and expected to vest as of December 31, 2013 984 26.34 6,211,000 5.0Exercisable at December 31, 2013............................... 511 20.94 5,592,000 4.7
The weighted-average fair value of the SARs granted in 2013 was $12.54. The fair value will be amortized to compensation cost on a straight-line basis over the three-year vesting period. Compensation cost was $2.4 million, $2.8 million and $2.5 million in 2013, 2012 and 2011, respectively, and was included in selling, general and administrative expense. The unamortized compensation cost balance was $2.6 million as of December 31, 2013.
Summarized information on SARs outstanding as of December 31, 2013 follows:
SARs Prices
NumberOutstanding(Thousands)
Weighted-average
RemainingLife (Years)
Weighted-averageExercise
Price
$15.01.......................................................................................................... 221 4.8 $ 15.01$21.24-$24.03 ............................................................................................. 223 5.0 21.87$27.78-$29.45 ............................................................................................. 353 5.5 28.86$34.30-$39.30 ............................................................................................. 148 4.4 39.19$44.72.......................................................................................................... 39 3.0 44.72
984 5.0 $ 26.34
The SARs granted at $15.01, $24.03, $27.78 and $44.72 are exercisable.

78
The fair value of the SARs was estimated on the grant date using the Black-Scholes pricing model with the following assumptions:
2013 2012 2011
Risk-free interest rate................................................................................. 0.70% 0.89% 0.03%Dividend yield............................................................................................ 1.1% —% —%Volatility..................................................................................................... 56.6% 50.0% 58.7%Expected lives (in years)............................................................................ 5.0 5.0 6.5
The risk-free rate of return was based upon the five-year Treasury note rate at the time the SARs were granted. The Company initiated a dividend in May 2012, subsequent to the 2012 grant date. The share price volatility was calculated based upon the actual closing prices of the Company's common shares at month end over a period of approximately ten years prior to the granting of the SARs. This approach to measuring volatility is consistent with the approach used to calculate the volatility assumption in the valuation of stock options. The Company's current SARs program has been in place since 2006. The expected life assumption was based upon prior analyses.
Serial Preferred Stock
The Company has five million shares of Serial Preferred Stock authorized (no par value), none of which have been issued. Certain terms of the Serial Preferred Stock, including dividends, redemption and conversion, will be determined by the Board of Directors prior to issuance.

79
Note L — Accumulated Other Comprehensive Income
Changes in the components of accumulated other comprehensive income, including amounts reclassified out, for 2013, 2012 and 2011 and the balances in accumulated other comprehensive income as of December 31, 2013, 2012 and 2011 are as follows:
Gains and LossesOn Cash Flow Hedges Pension and
PostEmployment
Benefits
ForeignCurrency
Translation(Thousands)Foreign
CurrencyPreciousMetals Total Total
Accumulated other comprehensive income as ofJanuary 1, 2011
Gross............................................................................. $ (1,543) $ — $ (1,543) $ (69,441) $ 3,989 $ (66,995)Deferred tax (benefit) ................................................... (1,942) — (1,942) (13,437) — (15,379)Net ................................................................................ 399 — 399 (56,004) 3,989 (51,616)
2011 current year activity:Other comprehensive income (loss) beforereclassifications............................................................... 133 51 184 (39,344) 958 (38,202)Amounts reclassified from accumulated othercomprehensive income ................................................... 2,809 — 2,809 3,549 — 6,358Net current period other comprehensive income (loss).. 2,942 51 2,993 (35,795) 958 (31,844)Deferred tax on current period activity........................... 1,029 18 1,047 (12,292) — (11,245)
Subtotal 2011 activity 1,913 33 1,946 (23,503) 958 (20,599)Accumulated other comprehensive income as ofDecember 31, 2011
Gross............................................................................. 1,399 51 1,450 (105,236) 4,947 (98,839)Deferred tax expense (benefit) ..................................... (913) 18 (895) (25,729) — (26,624)Net ................................................................................ 2,312 33 2,345 (79,507) 4,947 (72,215)
2012 current year activity:Other comprehensive income (loss) beforereclassifications............................................................... 693 (552) 141 (27,662) (870) (28,391)Amounts reclassified from accumulated othercomprehensive income ................................................... (1,839) 598 (1,241) 5,357 — 4,116Net current period other comprehensive income (loss).. (1,146) 46 (1,100) (22,305) (870) (24,275)Deferred taxes on current period activity ....................... (401) 16 (385) (7,676) — (8,061)
Subtotal 2012 activity (745) 30 (715) (14,629) (870) (16,214)Accumulated other comprehensive income as ofDecember 31, 2012
Gross............................................................................. 253 97 350 (127,541) (4,077) (123,114)Deferred tax expense (benefit) ..................................... (1,314) 34 (1,280) (33,405) — (34,685)Net ................................................................................ 1,567 63 1,630 (94,136) (4,077) (88,429)
2013 current year activity:Other comprehensive income (loss) beforereclassifications............................................................... 618 4 622 42,553 (3,790) 39,385Amounts reclassified from accumulated othercomprehensive income ................................................... (958) (120) (1,078) 7,687 — 6,609Net current period other comprehensive income (loss).. (340) (116) (456) 50,240 (3,790) 45,994Deferred taxes on current period activity ....................... (119) (41) (160) 17,613 — 17,453
Subtotal 2013 activity (221) (75) (296) 32,627 (3,790) 28,541Accumulated other comprehensive income as ofDecember 31, 2013
Gross............................................................................. (87) (19) (106) (77,301) 287 (77,120)Deferred tax (benefit) ................................................... (1,433) (7) (1,440) (15,792) — (17,232)Net ................................................................................ $ 1,346 $ (12) $ 1,334 $ (61,509) $ 287 $ (59,888)

80
Reclassifications from accumulated other comprehensive income of gains and losses on foreign currency cash flow hedges are recorded in other-net on the Consolidated Statement of Income while gains and losses on precious metal cash flow hedges are recorded in cost of sales on the Consolidated Statement of Income. See Note H to the Consolidated Financial Statements for additional details on cash flow hedges.
Reclassifications from accumulated other comprehensive income for pension and post employment benefits are included in the computation of the net periodic pension and post employment benefit expense. See Note I to the Consolidated Financial Statements for additional details on pension and post employment expenses.
Note M — Segment Reporting and Geographic Information
(Thousands)
AdvancedMaterial
TechnologiesPerformance
Alloys
Berylliumand
CompositesTechnicalMaterials Subtotal
AllOther Total
2013Sales to externalcustomers....................... $ 744,240 $ 292,189 $ 61,338 $ 69,115 $ 1,166,882 $ — $ 1,166,882Intersegment sales ......... 2,463 2,054 330 760 5,607 — 5,607Operating profit (loss) ... 4,661 23,384 (3,526) 6,897 31,416 (4,585) 26,831Depreciation, depletionand amortization ............ 17,483 17,683 2,760 2,590 40,516 1,133 41,649Expenditures for long-lived assets..................... 10,942 13,463 3,215 1,663 29,283 3,341 32,624Assets............................. 306,291 264,521 142,390 21,795 734,997 42,948 777,9452012Sales to externalcustomers....................... $ 847,835 $ 292,448 $ 59,983 $ 72,733 $ 1,272,999 $ 79 $ 1,273,078Intersegment sales ......... 2,556 2,718 740 672 6,686 — 6,686Operating profit (loss) ... 16,749 24,004 (3,944) 6,608 43,417 (6,641) 36,776Depreciation, depletionand amortization ............ 16,282 14,994 1,883 2,609 35,768 1,278 37,046Expenditures for long-lived assets..................... 11,874 19,906 7,962 3,604 43,346 1,315 44,661Assets............................. 341,604 269,003 135,414 23,328 769,349 45,568 814,9172011Sales to externalcustomers....................... $ 1,051,823 $ 335,323 $ 60,557 $ 78,732 $ 1,526,435 $ 295 $ 1,526,730Intersegment sales ......... 2,493 3,771 757 2,167 9,188 — 9,188Operating profit (loss) ... 33,471 27,241 (754) 7,262 67,220 (10,142) 57,078Depreciation, depletionand amortization ............ 16,170 22,324 1,367 2,459 42,320 1,315 43,635Expenditures for long-lived assets..................... 8,014 10,599 6,460 2,286 27,359 1,388 28,747Assets............................. 342,819 235,547 127,708 21,502 727,576 44,527 772,103
Intersegment sales are eliminated in consolidation. The sales to external customers are presented net of intersegment sales. Segments are evaluated at the operating profit level.
The All Other column includes the parent company expenses, the operating results for Materion Services Inc., a wholly owned subsidiary, and other corporate charges. Materion Services Inc. provides administrative and financial services to the other businesses in the Company on a cost-plus basis.
The assets shown in the All Other column include the assets used by Materion Services Inc. and the parent company as well as cash and long-term deferred income taxes.

81
Other geographic information includes the following:
(Thousands) 2013 2012 2011
Sales from U.S. operations.......................................................................... $ 962,288 $ 1,064,779 $ 1,306,192Sales based upon location of customers
United States............................................................................................. $ 810,642 $ 881,968 $ 1,143,720All other .................................................................................................... 356,240 391,110 383,010Total.......................................................................................................... $ 1,166,882 $ 1,273,078 $ 1,526,730
Long-lived assets by country deployedUnited States............................................................................................. $ 340,922 $ 354,122 $ 349,988All other .................................................................................................... 33,972 36,042 32,441Total.......................................................................................................... $ 374,894 $ 390,164 $ 382,429
No individual country, other than the United States, or customer accounted for 10% or more of the Company’s sales for the years presented. Sales outside the United States are primarily to Asia and Europe.
Note N — Other-net
Other-net expense is summarized for 2013, 2012 and 2011 as follows:
Income (Expense)(Thousands) 2013 2012 2011
Foreign currency exchange/translation gain (loss) ..................................... $ 1,506 $ 1,477 $ (2,775)Amortization of intangible assets................................................................ (5,529) (6,008) (6,144)Metal consignment fees .............................................................................. (7,218) (9,011) (9,877)Changes to earn-out valuation..................................................................... — — 1,052Net loss on disposal of fixed assets............................................................. (1,459) (1,836) —Consignment facility renegotiation bank fee .............................................. (853) — —Other items.................................................................................................. (909) (231) 1,970Total............................................................................................................. $ (14,462) $ (15,609) $ (15,774)
Note O — Facility Consolidation
During 2012, the Company announced a plan to consolidate various small facilities to improve efficiencies and reduce overhead costs in order to improve profitability and cash flows. As part of this program, two facilities were closed down with their operations transferred to other existing facilities (one in the fourth quarter 2012 and the other in the third quarter 2013), one operation was consolidated from four separate buildings into two in the fourth quarter 2013 and the majority of the equipment from a fourth operation was either transferred to another facility or written off. That fourth operation remained open as of December 31, 2013 to service one customer on a limited basis. The program also involved a reduction in the hourly workforce and management group at other facilities. All of the affected facilities and manpower reductions were within the Advanced Materials Technologies segment.
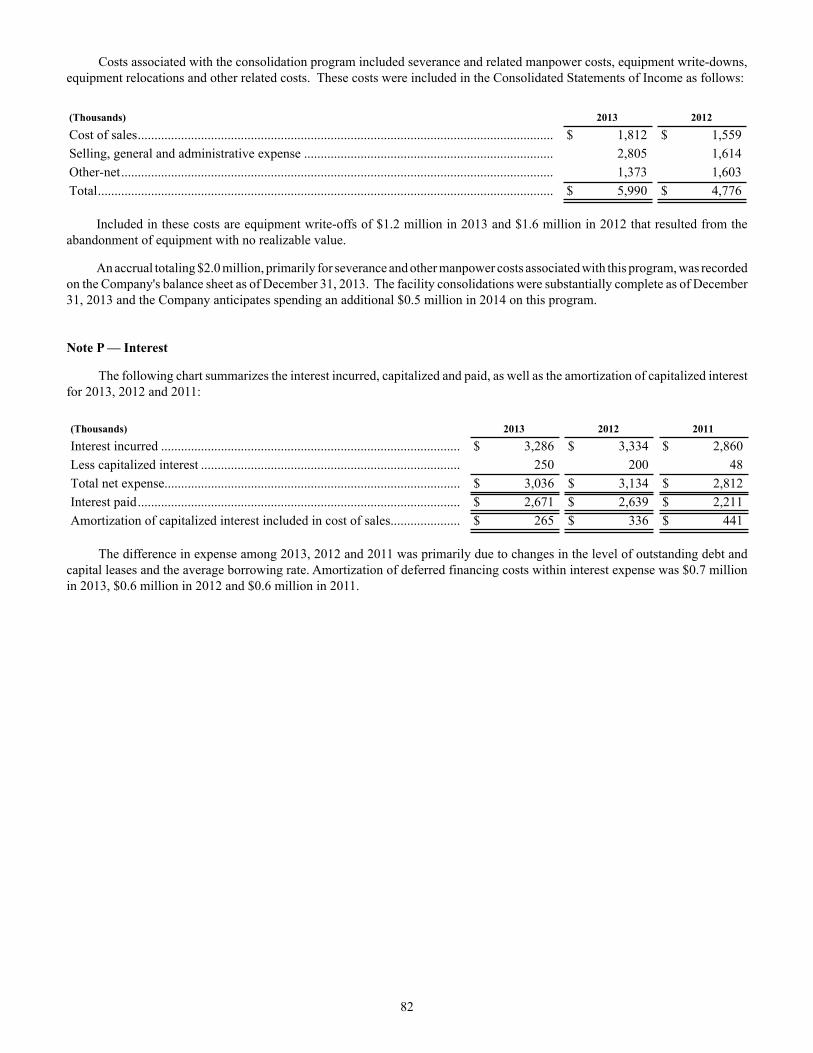
82
Costs associated with the consolidation program included severance and related manpower costs, equipment write-downs, equipment relocations and other related costs. These costs were included in the Consolidated Statements of Income as follows:
(Thousands) 2013 2012
Cost of sales............................................................................................................................. $ 1,812 $ 1,559Selling, general and administrative expense ........................................................................... 2,805 1,614Other-net.................................................................................................................................. 1,373 1,603Total......................................................................................................................................... $ 5,990 $ 4,776
Included in these costs are equipment write-offs of $1.2 million in 2013 and $1.6 million in 2012 that resulted from the abandonment of equipment with no realizable value.
An accrual totaling $2.0 million, primarily for severance and other manpower costs associated with this program, was recorded on the Company's balance sheet as of December 31, 2013. The facility consolidations were substantially complete as of December 31, 2013 and the Company anticipates spending an additional $0.5 million in 2014 on this program.
Note P — Interest
The following chart summarizes the interest incurred, capitalized and paid, as well as the amortization of capitalized interest for 2013, 2012 and 2011:
(Thousands) 2013 2012 2011
Interest incurred .......................................................................................... $ 3,286 $ 3,334 $ 2,860Less capitalized interest .............................................................................. 250 200 48Total net expense......................................................................................... $ 3,036 $ 3,134 $ 2,812Interest paid................................................................................................. $ 2,671 $ 2,639 $ 2,211Amortization of capitalized interest included in cost of sales..................... $ 265 $ 336 $ 441
The difference in expense among 2013, 2012 and 2011 was primarily due to changes in the level of outstanding debt and capital leases and the average borrowing rate. Amortization of deferred financing costs within interest expense was $0.7 million in 2013, $0.6 million in 2012 and $0.6 million in 2011.

83
Note Q — Income Taxes
Income before income taxes and income taxes (benefit) are comprised of the following:
(Thousands) 2013 2012 2011
Income before income taxes:Domestic................................................................................................. $ 16,528 $ 23,379 $ 53,648Foreign ................................................................................................... 7,267 10,263 618
Total income before income taxes ....................................................... $ 23,795 $ 33,642 $ 54,266
Income taxes:Current income taxes:
Domestic................................................................................................. $ 4,325 $ 7,825 $ 15,487Foreign ................................................................................................... 2,205 3,615 468
Total current......................................................................................... $ 6,530 $ 11,440 $ 15,955
Deferred income taxes (benefit):Domestic................................................................................................. $ (2,958) $ (3,084) $ (2,710)Foreign ................................................................................................... 319 (44) (351)Valuation allowance............................................................................... 197 666 1,393
Total deferred....................................................................................... $ (2,442) $ (2,462) $ (1,668)
Total income taxes.................................................................................... $ 4,088 $ 8,978 $ 14,287
The reconciliation of the federal statutory and effective income tax rates follows:
2013 2012 2011
Federal statutory rate ........................................................................ 35.0% 35.0% 35.0%State and local income taxes, net of federal tax effect ..................... (0.8) (0.3) 0.7Effect of excess of percentage depletion over cost depletion .......... (11.8) (7.3) (3.9)Manufacturing production deduction ............................................... (2.4) (2.2) (3.5)Officers’ compensation..................................................................... 0.4 1.1 0.7Adjustment to unrecognized tax benefits ......................................... 0.3 (0.6) (3.4)Foreign rate differential.................................................................... (0.1) (0.1) (0.2)Research and experimentation tax credit ......................................... (7.4) — (1.0)Retiree medical expense................................................................... — (2.0) —Valuation allowance......................................................................... 0.8 2.0 2.5Other items ....................................................................................... 3.2 1.1 (0.6)
Effective tax rate ............................................................................ 17.2% 26.7% 26.3%
Included in domestic income taxes, as shown in the Consolidated Statements of Income, are $(0.2) million, $(0.1) million and $0.6 million of state and local income taxes in 2013, 2012 and 2011, respectively.
The Company had domestic and foreign income tax payments of $8.2 million, $13.2 million and $20.7 million in 2013, 2012 and 2011, respectively.

84
Deferred tax assets and liabilities are determined based on temporary differences between the financial reporting bases and the tax bases of assets and liabilities. Deferred tax assets and (liabilities) recorded in the Consolidated Balance Sheets consist of the following:
December 31,(Thousands) 2013 2012
Asset (liability)Post-retirement benefits other than pensions ................................................................... $ 10,989 $ 12,003Other reserves................................................................................................................... 13,744 12,804Environmental reserves .................................................................................................... 1,789 1,958Inventory .......................................................................................................................... 3,934 4,303Pensions............................................................................................................................ 9,867 27,547Net operating loss and credit carryforwards .................................................................... 5,588 5,186Miscellaneous................................................................................................................... 303 357Subtotal............................................................................................................................. 46,214 64,158Valuation allowance......................................................................................................... (4,782) (4,584)
Total deferred tax assets............................................................................................ 41,432 59,574Depreciation ..................................................................................................................... (18,669) (19,388)Amortization..................................................................................................................... (7,371) (7,939)Capitalized interest expense ............................................................................................. (184) (195)Mine development............................................................................................................ (2,309) (2,832)Derivative instruments and hedging activities ................................................................. (130) (168)
Total deferred tax liabilities ...................................................................................... (28,663) (30,522)Net deferred tax asset ................................................................................................ $ 12,769 $ 29,052
The Company had deferred income tax assets offset with a valuation allowance for state and foreign net operating losses and state investment tax credit carryforwards. The Company intends to maintain a valuation allowance on these deferred tax assets until a realization event occurs to support reversal of all or a portion of the allowance.
At December 31, 2013, for income tax purposes, the Company had foreign net operating loss carryforwards of $4.9 million that do not expire, and $10.5 million that expire in calendar years 2014 through 2022. The Company had state net operating loss carryforwards of $23.6 million that expire in calendar years 2017 through 2033. The Company had state tax credits of $2.7 million that expire in calendar years 2014 through 2027.
The Company files income tax returns in the U.S. federal jurisdiction, and in various state, local and foreign jurisdictions. With limited exceptions, the Company is no longer subject to U.S. federal examinations for years before 2010, state and local examinations for years before 2009, and foreign examinations for tax years before 2007. The Company is not presently under examination for its income tax filings.
A reconciliation of the Company’s unrecognized tax benefits for the year-to-date periods ending December 31, 2013 and 2012 is as follows:
(Thousands) 2013 2012
Balance as of January 1 ............................................................................................................ $ 1,767 $ 1,969Additions to tax provisions related to the current year ............................................................ — 149Additions to tax positions related to prior years ...................................................................... 484 174Reduction to tax positions related to prior years...................................................................... (17) (20)Lapses on statutes of limitations .............................................................................................. (555) (455)Settlements ............................................................................................................................... — (50)Balance as of December 31...................................................................................................... $ 1,679 $ 1,767
At December 31, 2013, the Company had $1.7 million of unrecognized tax benefits, of which $0.8 million would affect the Company’s effective tax rate if recognized.

85
The Company classifies all interest and penalties as income tax expense. The amount of interest and penalties, net of related federal tax benefit, recognized in earnings was immaterial during 2013 and 2012. As of December 31, 2013 and 2012, accrued interest and penalties, net of related federal tax benefit, were immaterial.
A provision has not been made with respect to $49.0 million of unremitted earnings at December 31, 2013 because such earnings may be considered to be reinvested indefinitely. It is not practical to estimate the amount of unrecognized deferred tax liability for undistributed foreign earnings.
Note R — Earnings Per Share
The following table sets forth the computation of basic and diluted EPS:
(Thousands except per share amounts) 2013 2012 2011
Numerator for basic and diluted EPS:Net income................................................................................................. $ 19,707 $ 24,664 $ 39,979
Denominator:Denominator for basic EPS:
Weighted-average shares outstanding................................................... 20,571 20,418 20,365Effect of dilutive securities:
Stock options and stock appreciation rights.......................................... 188 163 237Restricted stock ..................................................................................... 101 94 152Performance-based restricted shares ..................................................... 35 4 —Diluted potential common shares.......................................................... 324 261 389
Denominator for diluted EPS:Adjusted weighted-average shares outstanding .................................... 20,895 20,679 20,754
Basic EPS ..................................................................................................... $ 0.96 $ 1.21 $ 1.96Diluted EPS .................................................................................................. $ 0.94 $ 1.19 $ 1.93
SARs with grants in excess of the average annual share price totaling 368,000 in 2013, 465,000 in 2012 and 152,000 in 2011 were excluded from the diluted EPS calculation as their effect would have been anti-dilutive.

86
Note S — Quarterly Data (Unaudited)
The following tables summarize selected quarterly financial data for the years ended December 31, 2013 and 2012:
2013
(Dollars in thousands except per share amounts)First
QuarterSecondQuarter
ThirdQuarter
FourthQuarter Total
Net sales ......................................................... $ 299,169 $ 306,141 $ 275,434 $ 286,138 $ 1,166,882Gross margin .................................................. 48,339 45,992 44,483 49,164 187,978
Percent of sales ............................................ 16.2% 15.0% 16.2% 17.2% 16.1%Net income ..................................................... $ 6,785 $ 4,155 $ 4,992 $ 3,775 $ 19,707Net income per share of common stock:
Basic............................................................. 0.33 0.20 0.24 0.18 0.96Diluted.......................................................... 0.33 0.20 0.24 0.18 0.94
Cash dividends per share of common stock ... 0.075 0.080 0.080 0.080 0.315Stock price range:
High.............................................................. 29.81 31.49 33.69 32.73Low .............................................................. 26.20 24.58 27.09 25.75
2012
First
QuarterSecondQuarter
ThirdQuarter
FourthQuarter Total
Net sales ......................................................... $ 353,630 $ 325,088 $ 290,601 $ 303,759 $ 1,273,078Gross margin .................................................. 49,418 53,024 52,369 43,972 198,783
Percent of sales ............................................ 14.0% 16.3% 18.0% 14.5% 15.6%Net income ..................................................... $ 6,118 $ 7,929 $ 8,114 $ 2,503 $ 24,664Net income per share of common stock:
Basic............................................................. 0.30 0.39 0.40 0.12 1.21Diluted.......................................................... 0.30 0.38 0.39 0.12 1.19
Cash dividends per share of common stock ... — 0.075 0.075 0.075 0.225Stock price range:
High.............................................................. 32.91 29.37 25.57 25.93Low .............................................................. 24.77 20.37 17.59 18.84
During the fourth quarter 2013, the Company determined that there were procedural errors made during the reconciliation of the physical inventory counts taken and recorded at one of its facilities within the Advanced Material Technologies reporting segment during the second and third quarters of 2013 that were not detected by the management review process on a timely basis. The Company, after determining that these errors were material to the applicable quarterly financial results, filed amended Quarterly Reports on Form 10-Q in March 2014 with corrected financial statements for the periods ended June 28, 2013 and September 27, 2013.
The corrections reduced the previously reported gross margin in the second quarter 2013 by $6.8 million and net income by $4.8 million, or $0.23 per share diluted. The corrections reduced the previously reported gross margin by $0.7 million in the third quarter 2013. Net income was reduced by $0.1 million and earnings per share was reduced by a nominal amount in the third quarter 2013. The figures in the above table represent the corrected amounts for each quarter.
The Company recorded a $7.4 million pre-tax expense in the fourth quarter 2012 for a net inventory loss. A portion of this expense may have been applicable to the third quarter 2012. Any insurance recoveries will be recorded in the future as they become probable and estimable.

87
Item 9. CHANGES IN AND DISAGREEMENTS WITH ACCOUNTANTS ON ACCOUNTING AND FINANCIAL DISCLOSURE
None.
Item 9A. CONTROLS AND PROCEDURES
a) Evaluation of Disclosure Controls and Procedures
We carried out an evaluation under the supervision and with participation of our management, including the chief executive officer and chief financial officer, of the effectiveness of the design and operation of our disclosure controls and procedures as of December 31, 2013 pursuant to Rule 13a-15(b) and 15d-15(b) under the Securities Exchange Act of 1934, as amended (Exchange Act). Based upon that evaluation, our management, including the chief executive officer and chief financial officer, concluded that our disclosure controls and procedures were not effective due to the material weakness in our internal control over financial reporting that existed as of December 31, 2013, as described below.
b) Management’s Report on Internal Control over Financial Reporting
The Report of Management on Internal Control over Financial Reporting and of the Report of Independent Registered Public Accounting Firm thereon are set forth in Item 8 of this Form 10-K and are incorporated by reference.
Plan for Remediation
During the fourth quarter 2013, the Company identified a deficiency in the Company’s internal control over financial reporting that constitutes a material weakness as of December 31, 2013. Specifically, our management review controls failed to detect errors in the physical inventory count reconciliation process at one of our facilities during certain periods of 2013. As a result of this material weakness, management concluded that we did not maintain effective control over financial reporting as of December 31, 2013.
During 2014, certain actions are being implemented to remediate the above identified material weakness including: improving processes, implementing additional controls and increased precision around management’s review controls, supplementing technical competence of our accounting staff with additional internal and, as needed, contract resources and creating a new management level position of Inventory Controller, reporting directly to the Corporate Vice President of Finance, responsible for maintaining company-wide controls specifically over precious metal inventory.
c) Changes in Internal Control over Financial Reporting
There has been no change in our internal control over financial reporting that occurred during the most recent quarter that has materially affected, or is reasonably likely to materially affect, our internal control over financial reporting.
Item 9B. OTHER INFORMATION
None.
88
PART III Item 10. DIRECTORS, EXECUTIVE OFFICERS AND CORPORATE GOVERNANCE
The information under “Election of Directors” in the proxy statement for our 2014 annual meeting of shareholders, to be filed with the Securities and Exchange Commission pursuant to Regulation 14A, is incorporated herein by reference. The information required by Item 10 relating to our executive officers is included under the caption “Executive Officers of the Registrant” in Part I of this Form 10-K and is incorporated herein by reference. The information required by Item 10 with respect to directors, the Audit Committee of the Board of Directors and Audit Committee financial experts is incorporated herein by reference from the section entitled “Corporate Governance; Committees of the Board of Directors — Audit Committee” and “— Audit Committee Expert, Financial Literacy and Independence” in the proxy statement for our 2014 annual meeting of shareholders to be filed with the Securities and Exchange Commission pursuant to Regulation 14A. The information required by Item 10 regarding compliance with Section 16(a) of the Exchange Act is incorporated herein by reference from the section entitled “Section 16(a) Beneficial Ownership Reporting Compliance” in the proxy statement for our 2014 annual meeting of shareholders to be filed with the Securities and Exchange Commission pursuant to Regulation 14A.
We have adopted a Policy Statement on Significant Corporate Governance Issues and a Code of Conduct Policy that applies to our chief executive officer and senior financial officers, including the principal financial and accounting officer, controller and other persons performing similar functions, in compliance with applicable New York Stock Exchange and Securities and Exchange Commission requirements. The aforementioned materials, along with the charters of the Audit, Governance and Organization and Compensation Committees of our Board of Directors, which also comply with applicable requirements, are available on our web site at http://materion.com, and copies are also available upon request by any shareholder to Secretary, Materion Corporation, 6070 Parkland Boulevard, Mayfield Heights, Ohio 44124. We make our reports on Forms 10-K, 10-Q and 8-K available on our web site, free of charge, as soon as reasonably practicable after these reports are filed with the Securities and Exchange Commission, and any amendments and/or waivers to our Code of Conduct Policy, Statement on Significant Corporate Governance Issues and Committee Charters will also be made available on our web site. The information on our web site is not incorporated by reference into this Form 10-K.
Item 11. EXECUTIVE COMPENSATION
The information required under Item 11 is incorporated by reference from the sections entitled “Executive Compensation” and “2013 Director Compensation” in the proxy statement for our 2014 annual meeting of shareholders to be filed with the Securities and Exchange Commission pursuant to Regulation 14A.

89
Item 12. SECURITY OWNERSHIP OF CERTAIN BENEFICIAL OWNERS AND MANAGEMENT AND RELATED STOCKHOLDER MATTERS
The information required under Item 12 regarding security ownership is incorporated by reference from the section entitled “Security Ownership of Certain Beneficial Owners and Management” in the proxy statement for our 2014 annual meeting of shareholders to be filed with the Securities and Exchange Commission pursuant to Regulation 14A. The information required by Item 12 regarding securities authorized for issuance under equity compensation plans is incorporated by reference from the section entitled “Equity Compensation Plan Information” in the proxy statement for our 2014 annual meeting of shareholders to be filed with the Securities and Exchange Commission pursuant to Regulation 14A.
Item 13. CERTAIN RELATIONSHIPS AND RELATED TRANSACTIONS, AND DIRECTOR INDEPENDENCE
The information required under Item 13 is incorporated herein by reference from the sections entitled “Related Party Transactions” and “Corporate Governance; Committees of the Board of Directors — Director Independence” of the proxy statement for our 2014 annual meeting of shareholders to be filed with the Securities and Exchange Commission pursuant to Regulation 14A.
Item 14. PRINCIPAL ACCOUNTANT FEES AND SERVICES
The information required under Item 14 is incorporated herein by reference from the section entitled “Ratification of Independent Registered Public Accounting Firm” of the proxy statement for our 2014 annual meeting of shareholders to be filed with the Securities and Exchange Commission pursuant to Regulation 14A.

90
PART IV
Item 15. EXHIBITS AND FINANCIAL STATEMENT SCHEDULES
(a) 1. Financial Statements and Supplemental Information
The financial statements listed in the accompanying index to financial statements are included in Item 8 of this Form 10-K.
(a) 2. Financial Statement Schedules
The following consolidated financial information for the years ended December 31, 2013, 2012 and 2011 is submitted herewith:
Schedule II — Valuation and qualifying accounts.
All other schedules for which provision is made in the applicable accounting regulations of the Securities and Exchange Commission are not required under the related instructions or are inapplicable, and therefore have been omitted.
(a) 3. Exhibits
All documents referenced below were filed pursuant to the Exchange Act by Materion Corporation, file number 001-15885, unless otherwise noted.
(3a) Amended and Restated Articles of Incorporation of Brush Engineered Materials Inc. (filed as Annex B to the Registration Statement on Form S-4 filed by the Company on February 1, 2000, Registration No. 333-95917), incorporated herein by reference.
(3b) Amendment to Amended and Restated Articles of Incorporation (filed as Exhibit 3(a) to the Company’s Form 8-K (File No. 1-15885) on March 8, 2011), incorporated herein by reference.
(3c) Amended and Restated Code of Regulations (filed as Exhibit 3 to the Company’s Quarterly Report on Form 10-Q (File No. 1-15885) for the period ended on July 1, 2011), incorporated herein by reference.
(4a) Indenture Modification between Toledo-Lucas County Port Authority, dated as of May 30, 2003 (filed as Exhibit 4 to the Company’s Quarterly Report on Form 10-Q (File No. 1-15885) for the period ended June 27, 2003), incorporated herein by reference.
(4b) Pursuant to Regulation S-K, Item 601(b)(4), the Company agrees to furnish to the Securities and Exchange Commission, upon its request, a copy of the instruments defining the rights of holders of long-term debt of the Company that are not being filed with this report.
(4c) Second Amended and Restated Credit Agreement dated June 20, 2013 among Materion Corporation, Materion Advanced Materials Technologies and Services Netherlands B.V., JPMorgan Chase Bank, N.A. and other lenders from time to time party thereto (filed as Exhibit 10.1 to the Registrant’s Form 8-K (File No. 1-15885) filed on June 25, 2013), incorporated herein by reference.
(4d) Third Amended and Restated Precious Metals Agreement dated October 1, 2010, between Brush Engineered Materials Inc. and other borrowers and The Bank of Nova Scotia (filed as Exhibit 4.2 to the Company’s Form 8-K (File No. 1-15885) on October 4, 2010), incorporated herein by reference.
(4e) Amendment No. 1 to the Third Amended and Restated Precious Metals Agreement dated March 31, 2011, among Materion Corporation and other borrowers and The Bank of Nova Scotia (filed as Exhibit 10.1 to the Company’s Form 8-K (File No. 1-15885) on April 6, 2011), incorporated herein by reference.
(4f)
Amendment No. 2 to the Third Amended and Restated Precious Metals Agreement dated August 18, 2011, among Materion Corporation and other borrowers and The Bank of Nova Scotia (filed as Exhibit 10.1 to the Company’s Form 8-K (File No. 1-15885) filed on August 22, 2011), incorporated herein by reference.
(4g)
Amendment No. 3 to the Third Amended and Restated Precious Metals Agreement dated October 17, 2011, among Materion Corporation and other borrowers and The Bank of Nova Scotia (filed as Exhibit 10.1 to the Company’s Form 8-K (File No. 1-15885) filed on October 18, 2011), incorporated herein by reference.
(4h) Amendment No. 4 to the Third Amended and Restated Precious Metals Agreement dated September 13, 2013, among Materion Corporation and other borrowers and The Bank of Nova Scotia (filed as Exhibit 10.1 to the Company's Form 8-K (File No. 1-15885) filed on September 18, 2013), incorporated herein by refernce.

91
(10a) Form of Indemnification Agreement entered into by the Company and its executive officers (filed as Exhibit 10a to the Company’s Annual Report on Form 10-K (File No. 1-15885) for the year ended December 31, 2008), incorporated herein by reference.
(10b) Form of Indemnification Agreement entered into by the Company and its directors (filed as Exhibit 10b to the Company’s Annual Report on Form 10-K (File No. 1-15885) for the year ended December 31, 2008), incorporated herein by reference.
(10c)* Amended and Restated Form of Severance Agreement for Executive Officers (filed as Exhibit 10.2 to the Company’s Quarterly Report on Form 10-Q (File No. 1-15885) for the period ended June 27, 2008), incorporated herein by reference.
(10d)* Amendment No. 1 to Amended and Restated Severance Agreement, dated May 4, 2011 (filed as Exhibit 10.2 to the Company’s Quarterly Report on Form 10-Q (File No. 1-15885) for the period ended July 1, 2011), incorporated herein by reference.
(10e)* Amended and Restated Form of Severance Agreement for Key Employees (filed as Exhibit 10.1 to the Company’s Quarterly Report on Form 10-Q (File No. 1-15885) for the period ended June 27, 2008), incorporated herein by reference.
(10f)* Form of Executive Insurance Agreement entered into by the Company and certain employees dated January 2, 2002 (filed as Exhibit 10g to the Company’s Annual Report on Form 10-K (File No. 1-15885) for the year ended December 31, 1994), incorporated herein by reference.
(10g)* Form of Trust Agreement between the Company and Key Trust Company of Ohio, N.A. (formerly Ameritrust Company National Association) on behalf of the Company’s executive officers (filed as Exhibit 10e to the Company’s Annual Report on Form 10-K (File No. 1-15885) for the year ended December 31, 1994), incorporated herein by reference.
(10h)* 2013 Management Incentive Plan (filed as Exhibit 10i to the Company's Annual Report on Form 10-K (File No. 1-15885) for the year ended December 31, 2012), incorporated herein by reference.
(10i)* 1984 Stock Option Plan as amended by the Board of Directors on April 18, 1984 and February 24, 1987 (filed by Brush Wellman Inc. as Exhibit 4.4 to Registration Statement on Form S-8, Registration No. 33-28605), incorporated herein by reference.
(10j)* Amendment, effective May 16, 2000, to the 1984 Stock Option Plan (filed as Exhibit 4b to Post- Effective Amendment No. 1 to Registration Statement on Form S-8, Registration No. 2-90724), incorporated herein by reference.
(10k)* 1995 Stock Incentive Plan (as Amended March 3, 1998) (filed as Appendix A to the Company’s Proxy Statement (File No. 1-15885) dated March 16, 1998), incorporated herein by reference.
(10l)* Amendment No. 1, effective May 16, 2000, to the 1995 Stock Incentive Plan (filed as Exhibit 4b to Post-Effective Amendment No. 1 to Registration Statement on Form S-8, Registration No. 333-63357), incorporated herein by reference.
(10m)* Amendment No. 2, effective February 1, 2005, to the 1995 Stock Incentive Plan (filed as Exhibit 10.4 to the Current Report on Form 8-K (File No. 1-15885) filed by the Company on February 7, 2005) incorporated herein by reference.
(10n)* Amended and Restated 2006 Stock Incentive Plan (filed as Exhibit 10.3 to the Company’s Quarterly Report on Form 10-Q (File No. 1-15885) for the period ended June 27, 2008), incorporated herein by reference.
(10o)*
Amended and Restated Materion Corporation 2006 Stock Incentive Plan (as Amended and Restated as of May 4, 2011) (filed as Exhibit 10.1 to the Registrant’s Form 8-K (File No. 1-15885) filed on May 5, 2011), incorporated herein by reference.
(10p)* Form of Nonqualified Stock Option Agreement, (filed as Exhibit 10t to the Company’s Form 10-K (File No. 1-15885) Annual Report for the year ended December 31, 2004) incorporated herein by reference.
(10q)* Form of Nonqualified Stock Option Agreement (filed as Exhibit 10.7 to the Current Report on Form 8-K (File No. 1-15885) filed by the Company on February 7, 2005) incorporated herein by reference.
(10r)* Form of 2011 Restricted Stock Units Agreement (Stock-settled) (filed as Exhibit 10.1 to the Company’s Form 8-K (File No. 1-15885) filed on March 3, 2011), incorporated herein by reference.
(10s)* Form of 2011 Restricted Stock Units Agreement (Cash-settled) (filed as Exhibit 10.2 to the Company’s Form 8-K (File No. 1-15885) filed on March 3, 2011), incorporated herein by reference.

92
(10t)* Form of 2012 Restricted Stock Units Agreement (Cash-Settled) (filed as Exhibit 10aa to the Company's Annual Report on Form 10-K (File No. 1-15885) for the year ended December 31, 2012), incorporated herein by reference.
(10u)* Form of 2012 Restricted Stock Units Agreement (Stock-Settled) (filed as Exhibit 10ab to the Company's Annual Report on Form 10-K (File No. 1-15885) for the year ended December 31, 2012), incorporated herein by reference.
(10v)* Form of 2006 Stock Appreciation Rights Agreement (filed as Exhibit 10.3 to the Current Report on Form 8-K (File No. 1-15885) filed by the Company on May 8, 2006), incorporated herein by reference.
(10w)* Form of 2012 Performance-Based Restricted Stock Units and Performance Shares Agreement (Cash-settled) (filed as Exhibit 10ad to the Company's Annual Report on Form 10-K (File No. 1-15885) for the year ended December 31, 2012), incorporated herein by reference.
(10x)* Form of 2012 Performance-Based Restricted Stock Units and Performance Shares Agreement (Stock-settled) (filed as Exhibit 10ae to the Company's Annual Report on Form 10-K (File No. 1-15885) for the year ended December 31, 2012), incorporated herein by reference.
(10y)*# Form of 2014 Performance-Based Restricted Stock Units (Cash-settled).
(10z)*# Form of 2014 Performance-Based Restricted Stock Units (Stock-settled).
(10aa)*
Form of 2007 Stock Appreciation Rights Agreement (filed as Exhibit 10.5 to Amendment No. 1 to the Current Report on Form 8-K (File No. 1-15885) filed by the Company on February 16, 2007), incorporated herein by reference.
(10ab)* Form of 2008 Stock Appreciation Rights Agreement (filed as Exhibit 10an to the Company’s Annual Report on Form 10-K (File No. 1-15885) for the year ended December 31, 2007), incorporated herein by reference.
(10ac)* Form of 2009 Stock Appreciation Rights Agreement (filed as Exhibit 10ag to the Company’s Annual Report on Form 10-K (File No. 1-15885) for the year ended December 31, 2008), incorporated herein by reference.
(10ad)* Form of 2010 Stock Appreciation Rights Agreement (filed as Exhibit 10ah to the Company’s Annual Report on Form 10-K (File No. 1-15885) for the year ended December 31, 2009), incorporated herein by reference.
(10ae)* Form of 2011 Stock Appreciation Rights Agreement (filed as Exhibit 10.3 to the Company’s Form 8-K (File No. 1-15885) filed on March 3, 2011), incorporated herein by reference.
(10af)* Materion Corporation Supplemental Retirement Benefit Plan (filed as Exhibit 10.1 to the Company’s Form 8-K (File No. 1-15885) filed on September 19, 2011), incorporated herein by reference.
(10ag)* Amendment No. 1 to the Supplemental Retirement Benefit Plan (filed as Exhibit 10al to the Company's Annual Report on Form 10-K (File No. 1-15885) for the year ended December 31, 2012), incorporated herein by reference.
(10ah)*# Amendment No. 2 to the Supplemental Retirement Benefit Plan.
(10ai)* Key Employee Share Option Plan (filed as Exhibit 4.1 to the Registration Statement on Form S-8, Registration No. 333-52141, filed by Brush Wellman Inc. on May 5, 1998), incorporated herein by reference.
(10aj)* Amendment No. 1 to the Key Employee Share Option Plan, (effective May 16, 2005) (filed as Exhibit 4b to Post-Effective Amendment No. 1 to Registration Statement on Form S-8, Registration No. 333-52141), incorporated herein by reference.
(10ak)* Amendment No. 2 to the Key Employee Share Option Plan dated June 10, 2005 (filed as Exhibit 10aw to the Company’s Annual Report on Form 10-K (File No. 1-15885) for the year ended December 31, 2006), incorporated herein by reference.
(10al)* Amendment No. 3 to the Key Employee Share Option Plan dated July 12, 2011 (filed as Exhibit 10.4 to the Company’s Quarterly Report on Form 10-Q (File No. 1-15885) for the period ended July 1, 2011), incorporated herein by reference.
(10am)*
1997 Stock Incentive Plan for Non-employee Directors, (As Amended and Restated as of May 1, 2001) (filed as Appendix B to the Company’s Proxy Statement (File No. 1-15885) dated March 19, 2001), incorporated herein by reference.
(10an)*
Amendment No. 1 to the 1997 Stock Incentive Plan for Non-employee Directors, (filed as Exhibit 10gg to the Company’s Annual Report on Form 10-K (File No. 1-15885) for the year ended December 31, 2003), incorporated herein by reference.

93
(10ao)*
Form of Nonqualified Stock Option Agreement for Non-employee Directors (filed as Exhibit 10mm to the Company’s Annual Report on Form 10-K (File No. 1-15885) for the year ended December 31, 2004), incorporated herein by reference.
(10ap)*
1992 Deferred Compensation Plan for Non-employee Directors (As Amended and Restated as of December 2, 1997) (filed as Exhibit 4d to the Registration Statement on Form S-8, Registration No. 333-63355, filed by Brush Wellman Inc.), incorporated herein by reference.
(10aq)*
2000 Reorganization Amendment, dated May 16, 2000, to the 1997 Deferred Compensation Plan for Non-employee Directors (filed as Exhibit 4b to Post-Effective Amendment No. 1 to Registration Statement on Form S-8, Registration No. 333-63353), incorporated herein by reference.
(10ar)*
Amendment No. 1 (effective September 11, 2001) to the 1992 Deferred Compensation Plan for Non-employee Directors (filed as Exhibit 4c to the Company’s Post-Effective Amendment No. 1 to Registration Statement on Form S-8, Registration No. 333-74296), incorporated herein by reference.
(10as)*
Amendment No. 2 (effective September 13, 2004) to the 1992 Deferred Compensation Plan for Non- employee Directors (filed as Exhibit 10.1 to the Company’s Quarterly Report on Form 10-Q (File No. 1-15885) for the period ended October 1, 2004), incorporated herein by reference.
(10at)*
Amendment No. 3 (effective January 1, 2005) to the 1992 Deferred Compensation Plan for Non-employee Directors (filed as Exhibit 10rr to the Company’s Annual Report on Form 10-K (File No. 1-15885) for the year ended December 31, 2004), incorporated herein by reference.
(10au)*
Amendment No. 4 (effective April 1, 2009) to the 1992 Deferred Compensation Plan for Non- employee Directors (filed as Exhibit 10bb to the Company’s Annual Report on Form 10-K (File No. 1-15885) for the year ended December 31, 2008), incorporated herein by reference.
(10av)*
Amended and Restated 2005 Deferred Compensation Plan for Non-employee Directors (filed as Exhibit 10.2 to the Company’s Quarterly Report on Form 10-Q (File No. 1-15885) for the period ended September 26, 2008), incorporated herein by reference.
(10aw)*
Amended and Restated Materion Corporation 2006 Non-employee Director Equity Plan (as Amended and Restated as of May 4, 2011) (filed as Appendix B to the Registrant’s Proxy Statement (File No. 1-15885) filed on March 25, 2011), incorporated herein by reference.
(10ax)*
First Amendment to the 2006 Non-employee Director Equity Plan (as Amended and Restated as of May 4, 2011) (filed as Exhibit 10bb to the Company's Annual Report on Form 10-K (File No. 1-15885) for the year ended December 31, 2012), incorporated herein by reference.
(10ay)*
Amended and Restated Executive Deferred Compensation Plan II (filed as Exhibit 10.1 to the Company’s Quarterly Report on Form 10-Q (File No. 1-15885) for the period ended March 28, 2008), incorporated herein by reference.
(10az)*
Amendment No. 1 to the Amended and Restated Executive Deferred Compensation Plan II (filed as Exhibit 10bf to the Company’s Annual Report on Form 10-K (File No. 1-15885) for the year ended December 31, 2008), incorporated herein by reference.
(10ba)*
Amendment No. 2 to the Amended and Restated Executive Deferred Compensation Plan II (filed as Exhibit 10.2 to the Company’s Quarterly Report on Form 10-Q (File No. 1-15885) for the period ended July 3, 2009), incorporated herein by reference.
(10bb)*
Amendment No. 3 to the Amended and Restated Executive Deferred Compensation Plan II, dated July 6, 2011 (filed as Exhibit 10.3 to the Company’s Quarterly Report on Form 10-Q (File No. 1-15885) for the period ended July 1, 2011), incorporated herein by reference.
(10bc)*
Trust Agreement between the Company and Fidelity Investments dated September 26, 2006 for certain deferred compensation plans for Non-employee Directors of the Company (filed as Exhibit 99.4 to the Current Report on Form 8-K (File No. 1-15885) filed by the Company on September 29, 2006), incorporated herein by reference.
(10bd)*
Trust Agreement between the Company and Fidelity Management Trust Company, dated June 25, 2009 relating to the Executive Deferred Compensation Plan II (filed as Exhibit 10.1 to the Company’s Quarterly Report on Form 10-Q (File No. 1-15885) for the period ended July 3, 2009), incorporated herein by reference.
(10be)
Trust Agreement between the Company and Fifth Third Bank N.A. dated September 25, 2006 relating to the Key Employee Share Option Plan (filed as Exhibit 99.3 to the Current Report on Form 8-K (File No. 1-15885) filed by the Company on September 29, 2006), incorporated herein by reference.

94
(10bf)
Lease dated as of October 1, 1996, between Brush Wellman Inc. and Toledo-Lucas County Port Authority (filed as Exhibit 10v to the Company’s Annual Report on Form 10-K (File No. 1-15885) for the year ended December 31, 1996), incorporated herein by reference.
(10bg)
Amended and Restated Inducement Agreement with the Prudential Insurance Company of America dated May 30, 2003 (filed as Exhibit 10 to the Company’s Quarterly Report on Form 10-Q (File No. 1-15885) for the period ended June 27, 2003), incorporated herein by reference.
(10bh)
Amended and Restated Supply Agreement between RWE Nukem, Inc. and Brush Wellman Inc. for the sale and purchase of beryllium products (filed as Exhibit 10 to the Company’s Quarterly Report on Form 10-Q (File No. 1-15885) for the period ended September 26, 2003), incorporated herein by reference.
(10bi) Supply Agreement between the Defense Logistics Agency and Brush Wellman Inc. for the sale and purchase of beryllium products (filed as Exhibit 10tt to the Company’s Annual Report on Form 10-K (File No. 1-15885) for the year ended December 31, 2004), incorporated herein by reference.
(10bj) Asset Purchase Agreement by and between Williams Advanced Materials Inc. and Techni-Met, Inc. dated December 20, 2007 (filed as Exhibit 10bw to the Company’s Annual Report on Form 10-K (File No. 1-15885) for the year ended December 31, 2007), incorporated herein by reference.
(10bk) Consignment Agreement dated October 2, 2009 between Brush Engineered Materials Inc. and Canadian Imperial Bank of Commerce and CIBC World Markets Inc. (filed as Exhibit 10.1 to the Company’s Form 8-K (File No. 1-15885) on October 8, 2009), incorporated herein by reference.
(10bl) Amendment No. 1 to the Consignment Agreement dated October 2, 2009 between Brush Engineered Materials Inc. and Canadian Imperial Bank of Commerce and CIBC World Markets Inc. (filed as Exhibit 99.1 to the Company’s Form 8-K (File No. 1-15885) on March 12, 2010), incorporated herein by reference.
(10bm) Amendment No. 2 to the Consignment Agreement dated June 11, 2010 between Brush Engineered Materials Inc. and Canadian Imperial Bank of Commerce and CIBC World Markets Inc., (filed as Exhibit 99.1 to the Company’s Form 8-K (File No. 1-15885) filed on June 14, 2010), incorporated herein by reference.
(10bn) Amendment No. 3 to the Consignment Agreement dated September 30, 2010 between Brush Engineered Materials Inc. and Canadian Imperial Bank of Commerce and CIBC World Markets Inc. (filed as Exhibit 10.1 to the Company’s Form 8-K (File No. 1-15885), on October 4, 2010), incorporated herein by reference.
(10bo) Amendment No. 4 to the Consignment Agreement dated November 10, 2010 between Brush Engineered Materials Inc. and Canadian Imperial Bank of Commerce and CIBC World Markets Inc. (filed as Exhibit 99.1 to the Company’s Form 8-K (File No. 1-15885), on November 12, 2010), incorporated herein by reference.
(10bp) Amendment No. 5 to the Consignment Agreement dated March 7, 2011 between Brush Engineered Materials Inc. and Canadian Imperial Bank of Commerce and CIBC World Markets Inc. (filed as Exhibit 10.1 to the Company’s Quarterly Report on Form 10-Q (File No. 1-15885) for the period ended April 1, 2011), incorporated herein by reference.
(10bq) Amendment No. 6 to the Consignment Agreement dated September 13, 2011 between Materion Corporation and Canadian Imperial Bank of Commerce and CIBC World Markets Inc. (filed as Exhibit 10.1 to the Company’s Form 8-K (File No. 1-15885) filed on September 16, 2011), incorporated herein by reference.
(10br) Amendment No. 7 to the Consignment Agreement dated August 24, 2012 between Materion Corporation and Canadian Imperial Bank of Commerce and CIBC World Markets Inc., (filed as Exhibit 10.1 to the Company's Form 8-K (File No. 1-15885) on August 31, 2012), incorporated herein by reference.
(21)# Subsidiaries of the Registrant.
(23)# Consent of Ernst & Young LLP.
(24)# Power of Attorney.
(31.1)# Certification of Chief Executive Officer required by Rule 13a-14(a) or 15d-14(a).
(31.2)# Certification of Chief Financial Officer required by Rule 13a-14(a) or 15d-14(a).
(32)# Certifications of Chief Executive Officer and Chief Financial Officer required by 18 U.S.C. Section 1350.
(95)# Mine Safety Disclosure Pursuant to Section 1503(a) of the Dodd-Frank Wall Street Reform and ConsumerProtection Act for the Fiscal Year Ended December 31, 2013.
95
(101.INS) XBRL Instance Document.
(101.SCH) XBRL Taxonomy Extension Schema Document.
(101.CAL) XBRL Taxonomy Extension Calculation Linkbase Document.
(101.DEF) XBRL Taxonomy Extension Definition Linkbase Document.
(101.LAB) XBRL Taxonomy Extension Label Linkbase Document.
(101.PRE) XBRL Taxonomy Extension Presentation Linkbase Document.
* Denotes a compensatory plan or arrangement.
# Filed herewith.

96
SIGNATURESPursuant to the requirements of Section 13 or 15(d) of the Securities Exchange Act of 1934, the registrant has duly caused
this report to be signed on its behalf by the undersigned, thereunto duly authorized.
MATERION CORPORATION
By: /s/ RICHARD J. HIPPLE By: /s/ JOHN D. GRAMPA Richard J. Hipple John D. Grampa
Chairman of the Board, Presidentand Chief Executive Officer
Senior Vice President Financeand Chief Financial Officer
March 14, 2014
Pursuant to the requirements of the Securities Exchange Act of 1934, this report has been signed below by the following persons on behalf of the registrant and in the capacities and on the dates indicated.
/s/ RICHARD J. HIPPLE Chairman of the Board, President, Chief Executive Officer and Director (Principal Executive Officer)
March 14, 2014
Richard J. Hipple
/s/ JOHN D. GRAMPA Senior Vice President Finance and Chief Financial Officer (Principal Financial and Accounting Officer)
March 14, 2014
John D. Grampa
/s/ JOSEPH P. KEITHLEY* Director March 14, 2014Joseph P. Keithley*
/s/ VINOD M. KHILNANI* Director March 14, 2014Vinod M. Khilnani*
/s/ WILLIAM B. LAWRENCE* Director March 14, 2014William B. Lawrence*
/s/ N. MOHAN REDDY* Director March 14, 2014N. Mohan Reddy*
/s/ CRAIG S. SHULAR* Director March 14, 2014Craig S. Shular*
/s/ DARLENE J. S. SOLOMON* Director March 14, 2014Darlene J. S. Solomon*
/s/ ROBERT B. TOTH* Director March 14, 2014Robert B. Toth*
/s/ GEOFFREY WILD* Director March 14, 2014Geoffrey Wild*
* The undersigned, by signing his/her name hereto, does sign and execute this report on behalf of each of the above-named officers and directors of Materion Corporation, pursuant to Powers of Attorney executed by each such officer and director filed with the Securities and Exchange Commission.
By: /s/ JOHN D. GRAMPA John D. Grampa
March 14, 2014 Attorney-in-Fact
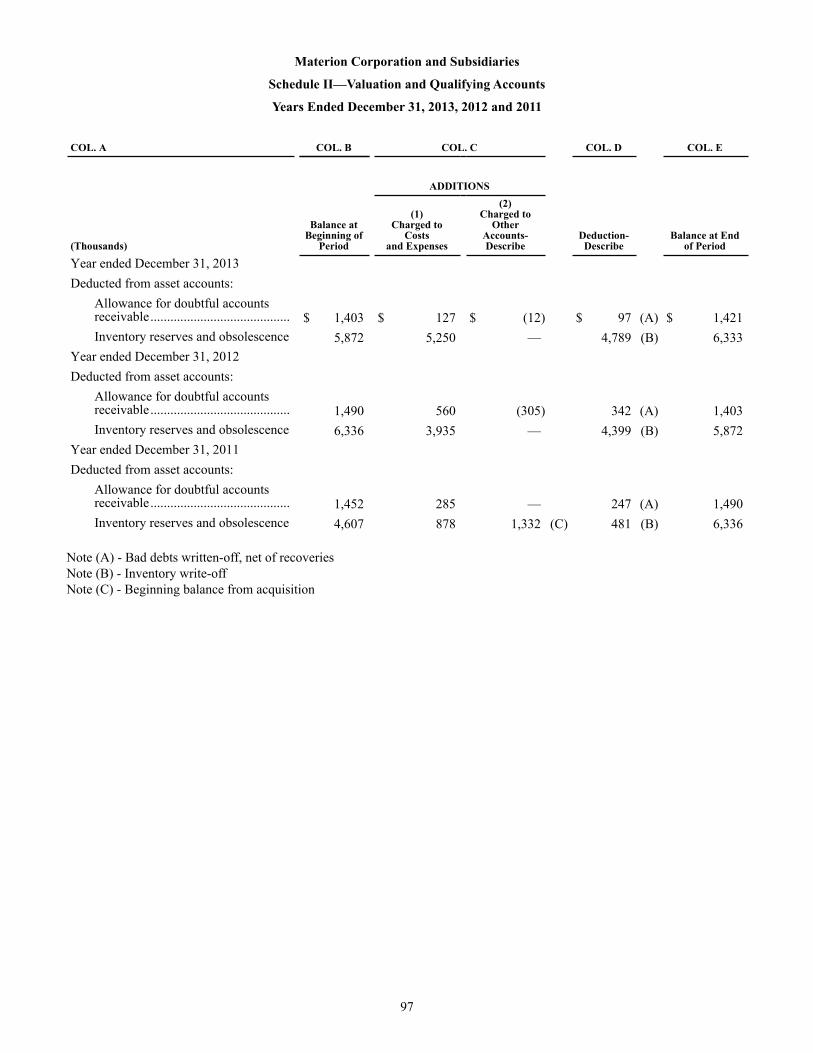
97
Materion Corporation and Subsidiaries
Schedule II—Valuation and Qualifying Accounts
Years Ended December 31, 2013, 2012 and 2011
COL. A COL. B COL. C COL. D COL. E
(Thousands)
Balance atBeginning of
Period
ADDITIONS
Deduction-Describe
Balance at Endof Period
(1)Charged to
Costsand Expenses
(2)Charged to
OtherAccounts-Describe
Year ended December 31, 2013Deducted from asset accounts:
Allowance for doubtful accountsreceivable.......................................... $ 1,403 $ 127 $ (12) $ 97 (A) $ 1,421Inventory reserves and obsolescence 5,872 5,250 — 4,789 (B) 6,333
Year ended December 31, 2012Deducted from asset accounts:
Allowance for doubtful accountsreceivable.......................................... 1,490 560 (305) 342 (A) 1,403Inventory reserves and obsolescence 6,336 3,935 — 4,399 (B) 5,872
Year ended December 31, 2011Deducted from asset accounts:
Allowance for doubtful accountsreceivable.......................................... 1,452 285 — 247 (A) 1,490Inventory reserves and obsolescence 4,607 878 1,332 (C) 481 (B) 6,336
Note (A) - Bad debts written-off, net of recoveriesNote (B) - Inventory write-offNote (C) - Beginning balance from acquisition
118
Board of Directors and Committees of the BoardRichard J. Hipple 3
Chairman, President and Chief Executive Officer Materion Corporation
Joseph P. Keithley 1, 3, 4
Non-executive Chairman of the Board Nordson Corporation
Vinod M. Khilnani 2, 4
Retired Executive ChairmanCTS Corporation
William B. Lawrence 2, 3, 4
Lead DirectorNon-executive Chairman of the BoardFerro Corporation
N. Mohan Reddy 1, 3, 4
B. Charles AmesProfessor of Management Case Western Reserve University
Craig S. Shular 1, 4
Executive Chairman of the BoardGraf Tech International Ltd.
Darlene J. S. Solomon 2, 4
Senior Vice President and Chief Technology Officer Agilent Technologies, Inc.
Robert B. Toth 2, 4
Chairman, President and Chief Executive Officer Polypore International, Inc.
Geoffrey Wild 1, 4
Chief Executive Officer AZ Electronic Materials S.A.
1 Audit Committee2 Compensation Committee3 Executive Committee4 Governance and Organization Committee
Offices and Facilities
Corporate OfficeMayfield Heights, Ohio
Manufacturing FacilitiesAlbuquerque, New MexicoBloomfield, ConnecticutBrewster, New YorkBuellton, CaliforniaBuffalo, New YorkDelta, UtahElmore, OhioFarnborough, EnglandFremont, CaliforniaLimerick, IrelandLincoln, Rhode IslandLorain, OhioMilwaukee, WisconsinReading, PennsylvaniaSanta Clara, California Shanghai, ChinaSingaporeSubic Bay, PhilippinesSuzhou, ChinaTaipei, TaiwanTucson, ArizonaTyngsboro, MassachusettsWestford, MassachusettsWheatfield, New YorkWindsor, Connecticut
Domestic Service CentersElmhurst, IllinoisWarren, Michigan
International Service Centersand Sales OfficesFukaya, JapanMaastricht, The NetherlandsReading, EnglandSeoul, KoreaSingaporeStuttgart, GermanyTaoyuan City, TaiwanTokyo, Japan
International Representative OfficesHong KongIncheon, KoreaLondon, EnglandPune, IndiaShanghai, ChinaTaipei, Taiwan
Corporate and ExecutiveOfficersRichard J. Hipple 1, 2
Chairman, President and Chief Executive Officer
John D. Grampa 1, 2
Senior Vice President Financeand Chief Financial Officer
Gregory R. Chemnitz 1, 2
Vice President, General Counsel
Michael C. Hasychak 1
Vice President, Treasurer andSecretary
Joseph P. Kelley 1
Vice President, Finance
James P. Marrotte 1
Vice President, Controller
Gary W. Schiavoni 1
Assistant Treasurer and AssistantSecretary 1 Corporate Officers2 Executive Officers
Operating ExecutivesRichard W. Sager, PresidentAdvanced Material Technologies
Donald G. Klimkowicz, President Advanced Materials Group
W. Glenn Maxwell, PresidentPerformance Metals Group
Alfonso T. Lubrano, PresidentTechnical Materials
DIRECTORS, OFFICERS AND FACILITIES

Annual MeetingThe Annual Meeting of Shareholders will be held onWednesday, May 7, 2014 at 11:00 a.m. at ExecutiveCaterers at Landerhaven, 6111 Landerhaven Drive,Mayfield Heights, Ohio 44124
Investor InformationMaterion Corporation maintains an active program of communication with shareholders, securities analystsand other members of the investment community. Management makes regular presentations in major financial centers around the world. Upon written request,Materion Corporation will provide, without charge:
• additional copies of the annual report• SEC Form 10-K/10-Q
For such documents, please contact:Michael C. HasychakVice President, Treasurer and Secretary(216) 486-4200
AuditorsErnst & Young LLP950 Main Avenue, Suite 1800 Cleveland, Ohio 44113
CORPORATE DATA
Web SiteMaterion Corporation’s web
site offers financial and investor
information, news and facts about the
Company, its businesses, markets and
products. The Company has adopted
Corporate Governance Guidelines and a Code
of Conduct Policy, in compliance with applicable
New York Stock Exchange and Securities and Exchange
Commission requirements. These materials, along with
the charters of the Audit, Compensation and Governance
and Organization Committees of the Company’s Board of
Directors, which also comply with applicable requirements, are
available on the Company’s web site.
Visit the site at: www.materion.com
Transfer Agent and RegistrarWells Fargo Bank, N.A.Shareholder Services P.O. Box 64854 St. Paul, Minnesota 55164-0854For shareholder inquiries, call: (800) 468-9716www.wellsfargo.com/shareownerservices.com
Stock ListingNew York Stock Exchange/Symbol: MTRN
Corporate HeadquartersMaterion Corporation6070 Parkland Boulevard Mayfield Heights, Ohio 44124(216) 486-4200 Facsimile: (216) 383-4091

6070 Parkland Boulevard, Mayfield Heights, Ohio 44124216.486.4200 • www. materion.com