leveraging chile’s strengths to become a preferred ... bell director, global business policy...
TRANSCRIPT
Simon BellDirector, Global Business Policy Council
April 10, 2007
Leveraging Chile’s Strengths to become aPreferred Location for Remote Services

2A.T. Kearney / 2007
Presentation Overview
The Global Remote ServicesOpportunity – and Challenge
Assessing Chile’s Strengths andWeaknesses
Recommendations to Optimize Chile’sCompetitive Position

3A.T. Kearney / 2007
The Global Remote Services Opportunity– and Challenge

4A.T. Kearney / 2007
A confluence of factors has, in the last 10 years, created awhole new industry – the offshoring of services
IncreasingIncreasingTalent Shortage Talent Shortage
in Developed in Developed CountriesCountries
Increasing Increasing Talent Supply Talent Supply in Developing in Developing
CountriesCountries
GlobalGlobalMarket Market
Liberalization Liberalization & Integration& Integration
Shift from Shift from ManufacturingManufacturing
to Servicesto ServicesEconomyEconomy
Technology-Technology-Driven Driven
Innovation Innovation and Productivityand Productivity
Any service orfunction
that does not requirephysical interaction
can now bedelivered remotely
from anywherein the world
5A.T. Kearney / 2007
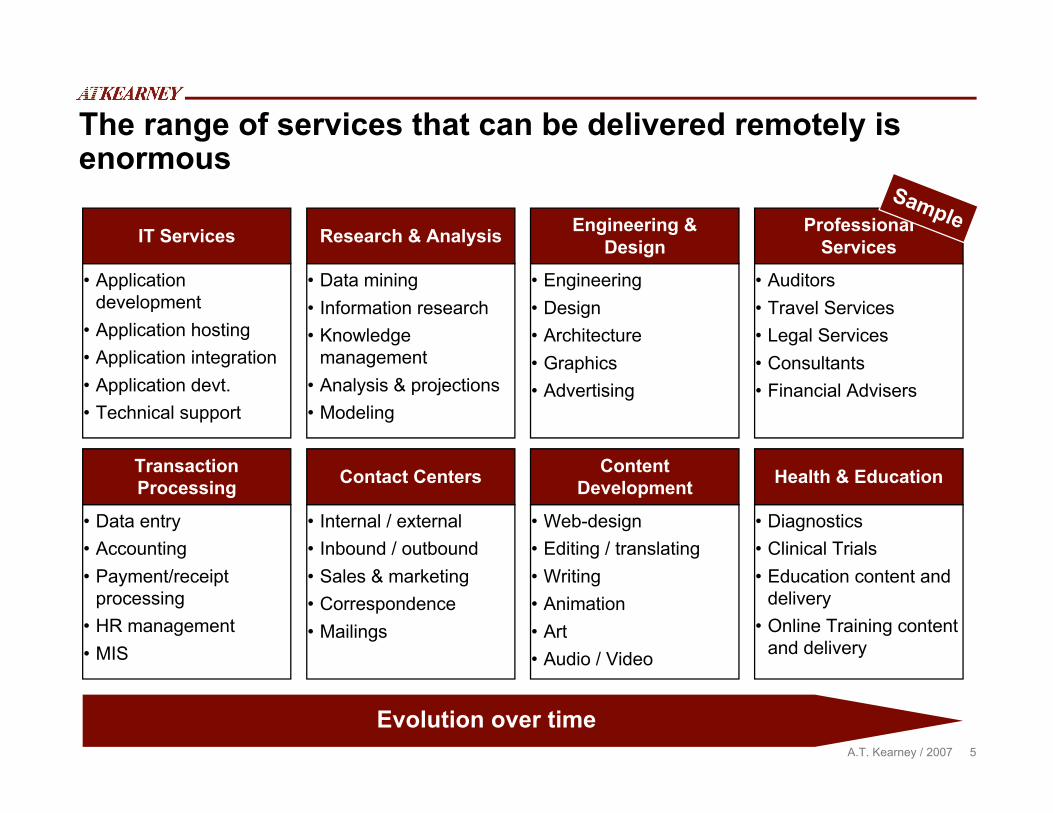
The range of services that can be delivered remotely isenormous
• Applicationdevelopment
• Application hosting• Application integration• Application devt.• Technical support
IT Services
• Data mining• Information research• Knowledge
management• Analysis & projections• Modeling
Research & Analysis
• Engineering• Design• Architecture• Graphics• Advertising
Engineering &Design
• Auditors• Travel Services• Legal Services• Consultants• Financial Advisers
ProfessionalServices
• Diagnostics• Clinical Trials• Education content and
delivery• Online Training content
and delivery
Health & Education
• Web-design• Editing / translating• Writing• Animation• Art• Audio / Video
ContentDevelopment
• Internal / external• Inbound / outbound• Sales & marketing• Correspondence• Mailings
Contact Centers
• Data entry• Accounting• Payment/receipt
processing• HR management• MIS
TransactionProcessing
Evolution over time
Sample

6A.T. Kearney / 2007
39%
66%
62%
50%
61%
71%
73%
66%
76%
70%
87%
79%
Source: A.T. Kearney Foreign Direct Confidence Index, 2003-2005
Interest in offshoring is growing rapidly across all regionsand functional areas
11%
14%
14%
15%
26%
13%
24%
16%
16%
30%
25%
32%
38%
50%
24%
26%
41%
41%
44%
50%
IT Developm’t.& Support
ContactCenters
Logistics/Distribution
Manufacturing
BusinessProcesses
KnowledgeManagement
R&D/Engineering
Major companies planning on offshoring overthe next three years, percent
AsianInvestors
EuropeanInvestors
GlobalInvestors
NorthAmericanInvestors
2005 2004 2003
Major companies planning on offshoringcorporate activities, by function, percent
67%
7A.T. Kearney / 2007
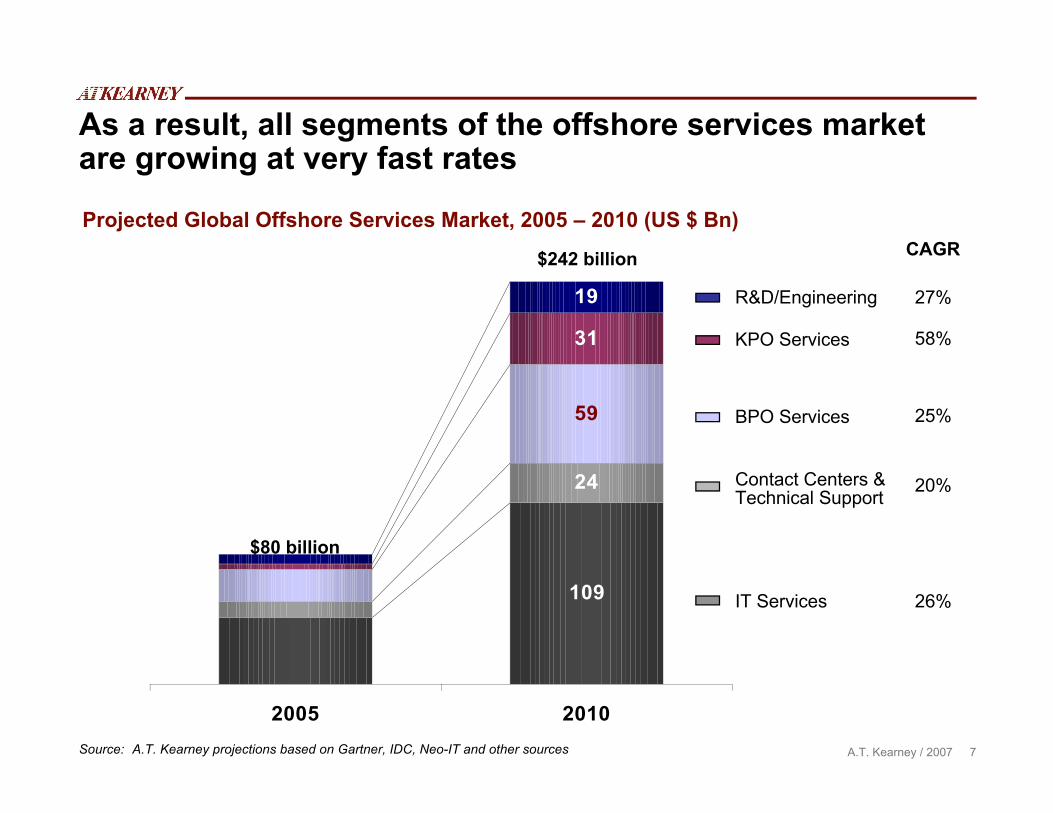
As a result, all segments of the offshore services marketare growing at very fast rates
Source: A.T. Kearney projections based on Gartner, IDC, Neo-IT and other sources
Projected Global Offshore Services Market, 2005 – 2010 (US $ Bn)
109
24
59
31
19
2005 2010
CAGR
R&D/Engineering
26%
Contact Centers &Technical Support
BPO Services
KPO Services
27%
58%
25%
20%
IT Services
$80 billion
$242 billion
8A.T. Kearney / 2007
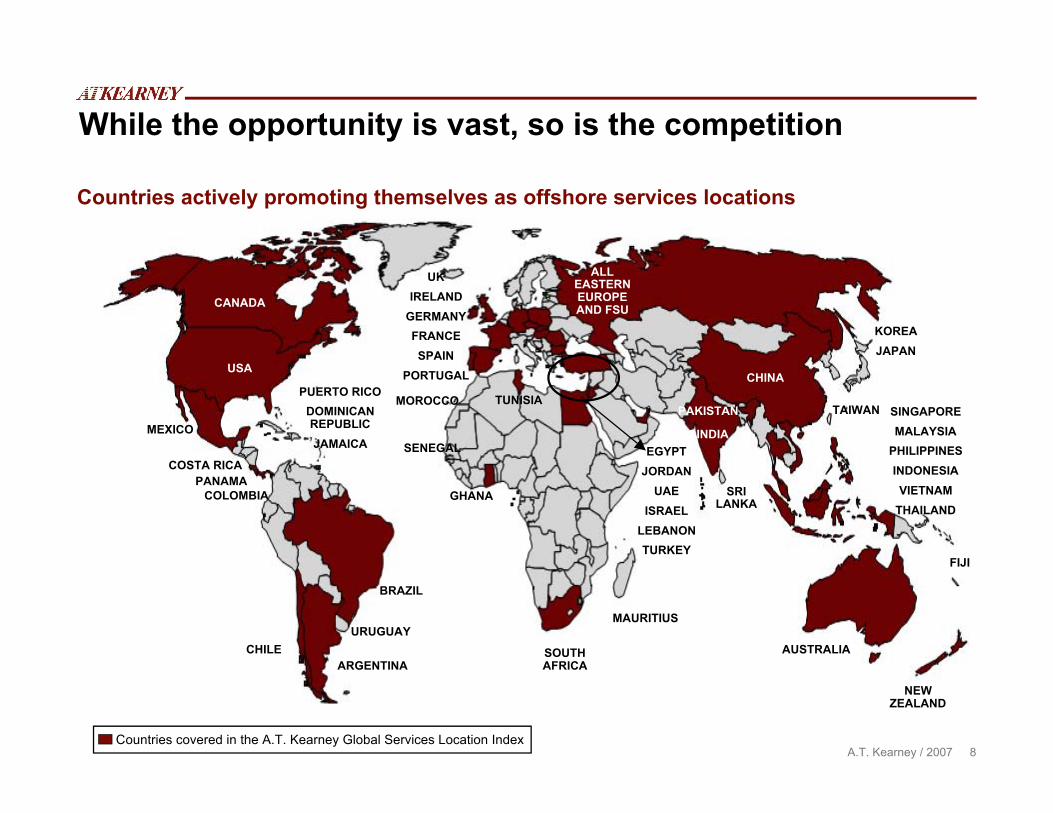
While the opportunity is vast, so is the competition
Countries covered in the A.T. Kearney Global Services Location Index
SENEGAL
AUSTRALIA
NEWZEALAND
SOUTHAFRICA
GHANA SRILANKA
INDIA
PAKISTAN
ALLEASTERNEUROPEAND FSU
EGYPTJORDAN
UAEISRAEL
LEBANONTURKEY
CANADA
USA
MEXICO
MOROCCO TUNISIAPUERTO RICO
DOMINICANREPUBLICJAMAICA
CHILEARGENTINA
BRAZIL
COSTA RICAPANAMA
COLOMBIA
UKIRELAND
GERMANYFRANCESPAIN
PORTUGAL
KOREAJAPAN
SINGAPOREMALAYSIA
PHILIPPINESINDONESIAVIETNAM
THAILAND
CHINA
TAIWAN
FIJI
MAURITIUS
Countries actively promoting themselves as offshore services locations
URUGUAY
9A.T. Kearney / 2007
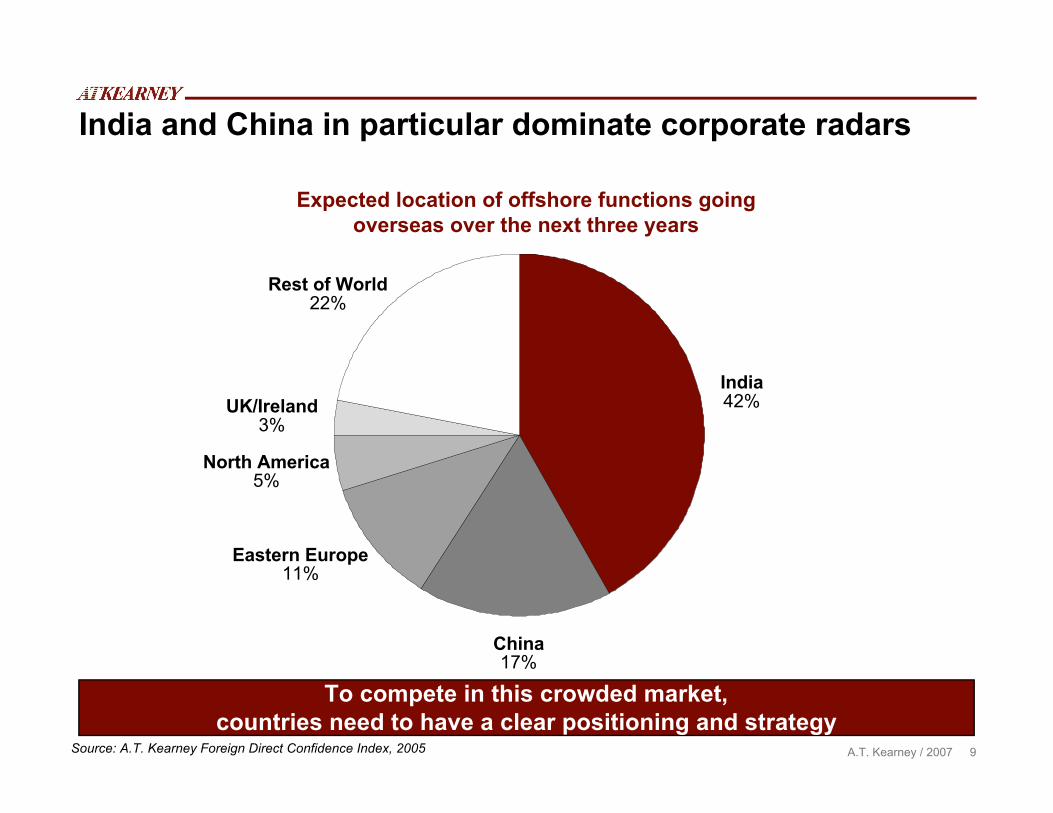
India and China in particular dominate corporate radars
India42%
Eastern Europe11%
China17%
Rest of World22%
UK/Ireland3%
North America5%
Expected location of offshore functions goingoverseas over the next three years
Source: A.T. Kearney Foreign Direct Confidence Index, 2005
To compete in this crowded market,countries need to have a clear positioning and strategy
10A.T. Kearney / 2007
Assessing Chile’s Strengths and Weaknesses

11A.T. Kearney / 2007
Since 2001, A.T. Kearney has produced a Location Index toassist clients in assessing potential service locations
Financial Costs People Skills and Availability Business Environment
40% 30% 30%
Compensation Costs
Infrastructure Costs
Tax and Regulatory Costs
80%
10%
10%
Cumulative IT/ServicesExperience and Skills
Labor Force Availability
Language Skills
Educational Skills
Attrition Risk
40%
20%
15%
15%
10%
Country Environment
Country Infrastructure
Security of IntellectualProperty
Cultural Exposure
60%
20%
10%
10%
Metrics evaluated in the A.T. Kearney Global Services Location Index
Source: A.T. Kearney Global Services Location Index

12A.T. Kearney / 2007
Chile has consistently ranked among the top 10 countriesin the Index
3.2
2.9
2.8
3.2
2.6
3.3
2.7
3.3
3.2
2.6
1.7
2.8
3.2
3.1
2.4
2.4
2.6
2.6
3.3
2.7
0.5
3.0
2.9
2.5
2.8
2.3
2.3
1.3
1.2
1.8
1.5
1.2
1.2
1.0
1.5
1.5
1.0
1.1
1.0
1.0
1.1
0.9
1.2
1.0
0.9
2.7
1.0
1.3
1.0
1.0
1.4
1.4
2.0
1.6
1.5
1.1
1.9
1.3
1.6
1.6
2.5
1.8
1.3
1.5
2.2
2.1
2.0
1.8
1.2
1.9
2.3
1.5
1.3
2.0
1.6
India
ChinaMalaysia
Thailand
BrazilIndonesia
ChilePhilippines
BulgariaMexico
SingaporeSlovakia
Egypt
JordanEstonia
CzechLatvia
PolandVietnam
UAEUSA (Tier II)
Uruguay
ArgentinaHungary
Mauritius
Source: A.T. Kearney Global Services Location Index 2007
Global Services Location Index 2007Ranks 1-25 Ranks 26-50
3.0
3.3
2.6
3.2
3.2
2.5
2.8
2.9
3.0
0.8
2.9
2.6
2.0
3.2
0.5
2.9
0.5
1.2
1.5
0.9
1.6
2.8
0.5
2.1
0.4
0.9
0.9
0.8
1.0
1.0
1.2
1.0
0.9
0.9
2.1
0.9
1.4
1.3
0.8
2.2
0.8
2.2
1.7
1.1
1.7
1.1
1.0
2.1
1.3
1.5
1.5
1.3
2.0
1.2
1.1
1.6
1.5
1.5
1.4
2.3
1.3
1.2
1.9
1.1
2.4
1.4
2.4
2.1
2.3
2.3
2.1
1.1
2.3
1.4
2.3
Tunisia
GhanaLithuaniaSri Lanka
PakistanSouth Africa
Jamaica
RomaniaCosta Rica
Canada
MoroccoRussia
IsraelSenegal
Germany (Tier II)
PanamaUK (Tier II)
Spain
New ZealandAustraliaPortugal
UkraineFrance (Tier II)
Turkey
Ireland
EnvironmentFinancial PeopleCountry score:
13A.T. Kearney / 2007
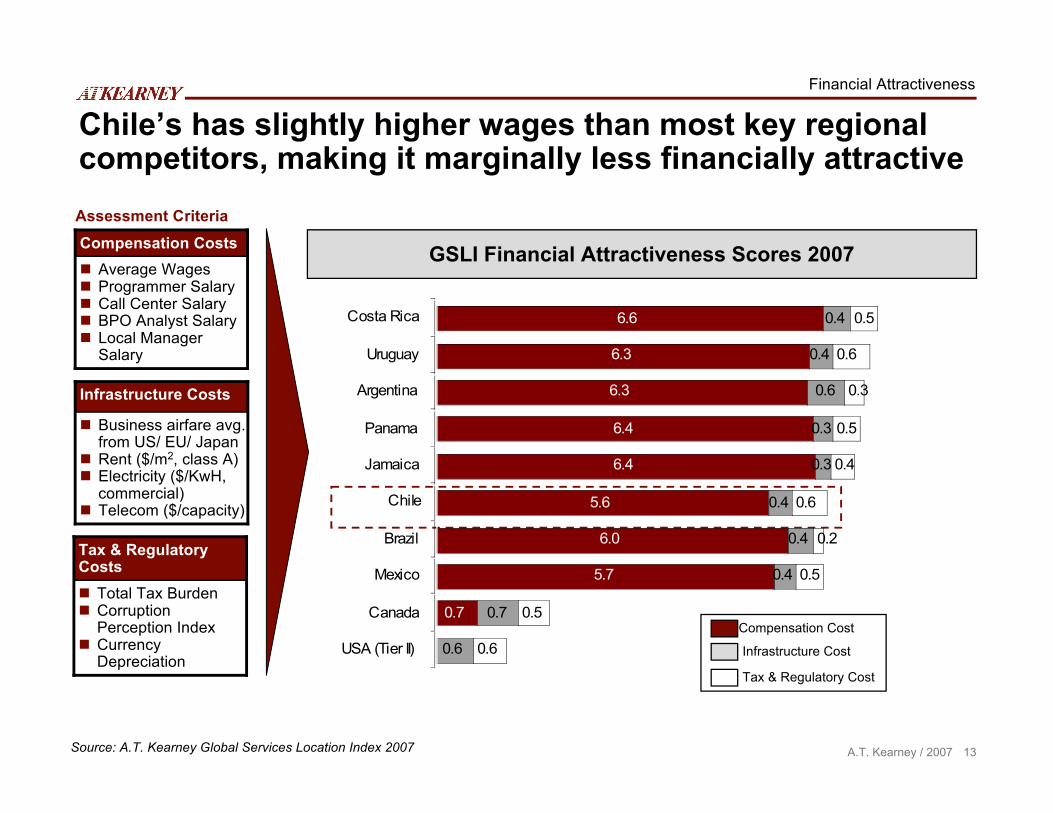
Chile’s has slightly higher wages than most key regionalcompetitors, making it marginally less financially attractive
GSLI Financial Attractiveness Scores 2007
0.7
5.7
6.0
5.6
6.4
6.4
6.3
6.3
6.6
0.6
0.7
0.4
0.4
0.4
0.3
0.3
0.6
0.4
0.4
0.6
0.5
0.5
0.2
0.6
0.4
0.5
0.3
0.5
0.6
USA (Tier II)
Canada
Mexico
Brazil
Chile
Jamaica
Panama
Argentina
Uruguay
Costa Rica
Tax & Regulatory Cost
Compensation Cost
Infrastructure Cost
Business airfare avg.from US/ EU/ Japan
Rent ($/m2, class A) Electricity ($/KwH,
commercial) Telecom ($/capacity)
Infrastructure Costs
Total Tax Burden Corruption
Perception Index Currency
Depreciation
Tax & RegulatoryCosts
Assessment Criteria
Average Wages Programmer Salary Call Center Salary BPO Analyst Salary Local Manager
Salary
Compensation Costs
Source: A.T. Kearney Global Services Location Index 2007
Financial Attractiveness
14A.T. Kearney / 2007
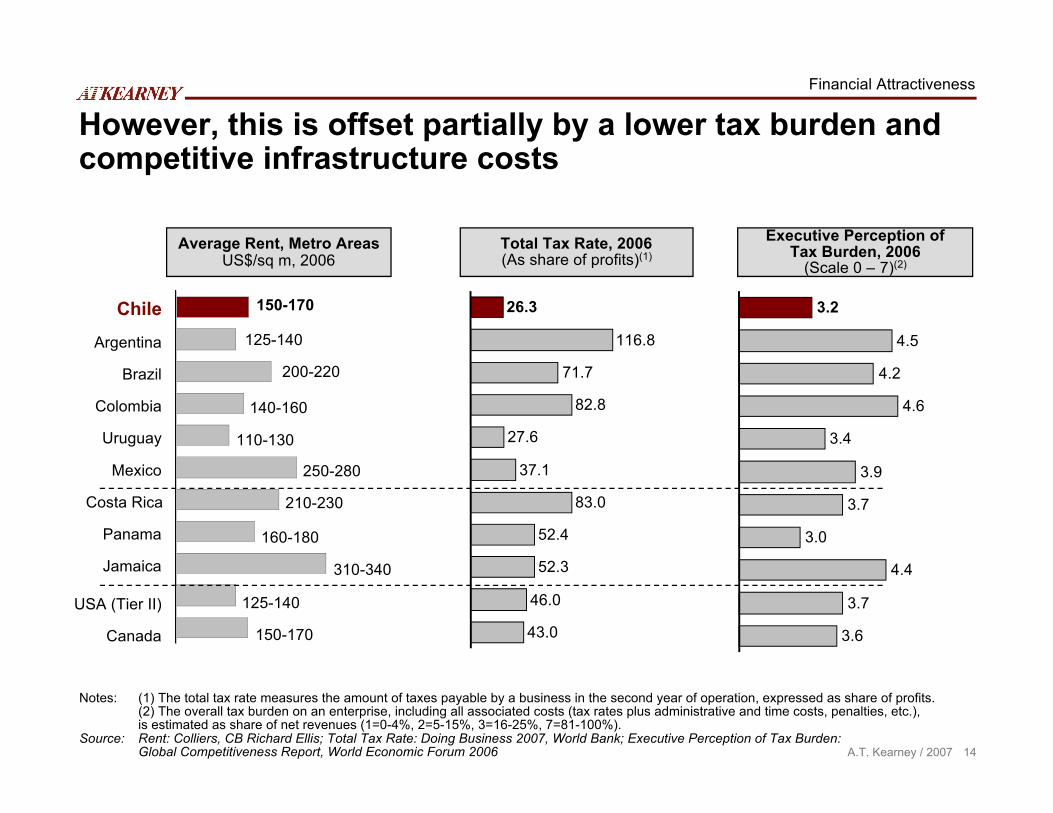
However, this is offset partially by a lower tax burden andcompetitive infrastructure costs
Financial Attractiveness
Chile
Argentina
Brazil
Colombia
Uruguay
Costa Rica
Panama
Jamaica
Mexico
USA (Tier II)
Canada
150-170
125-140
200-220
140-160
110-130
210-230
160-180
310-340
250-280
125-140
150-170
Average Rent, Metro AreasUS$/sq m, 2006
Total Tax Rate, 2006(As share of profits)(1)
Executive Perception ofTax Burden, 2006
(Scale 0 – 7)(2)
Notes: (1) The total tax rate measures the amount of taxes payable by a business in the second year of operation, expressed as share of profits.(2) The overall tax burden on an enterprise, including all associated costs (tax rates plus administrative and time costs, penalties, etc.),is estimated as share of net revenues (1=0-4%, 2=5-15%, 3=16-25%, 7=81-100%).
Source: Rent: Colliers, CB Richard Ellis; Total Tax Rate: Doing Business 2007, World Bank; Executive Perception of Tax Burden:Global Competitiveness Report, World Economic Forum 2006
26.3
116.8
82.8
27.6
37.1
83.0
52.4
46.0
43.0
52.3
71.7
3.2
4.5
4.6
3.4
3.9
3.7
3.0
3.7
3.6
4.4
4.2
15A.T. Kearney / 2007
0.3
0.4
0.3
0.4
1.2
1.3
1.8
2.2
3.4
4.0
0.1
0.4
0.8
1.3
0.3
2.0
1.0
0.7
1.1
1.0
1.0
1.0
1.0
1.3
1.2
1.1
1.2
1.5
1.2
1.2
1.2
1.2
1.5
1.5
0.4
0.2
0.4
0.5
0.3
0.3
0.5
0.5
0.7
1.2
0.6
0.7
Panama
Costa Rica
Jamaica
Uruguay
Chile
Argentina
Mexico
Brazil
Canada
USA (Tier II)
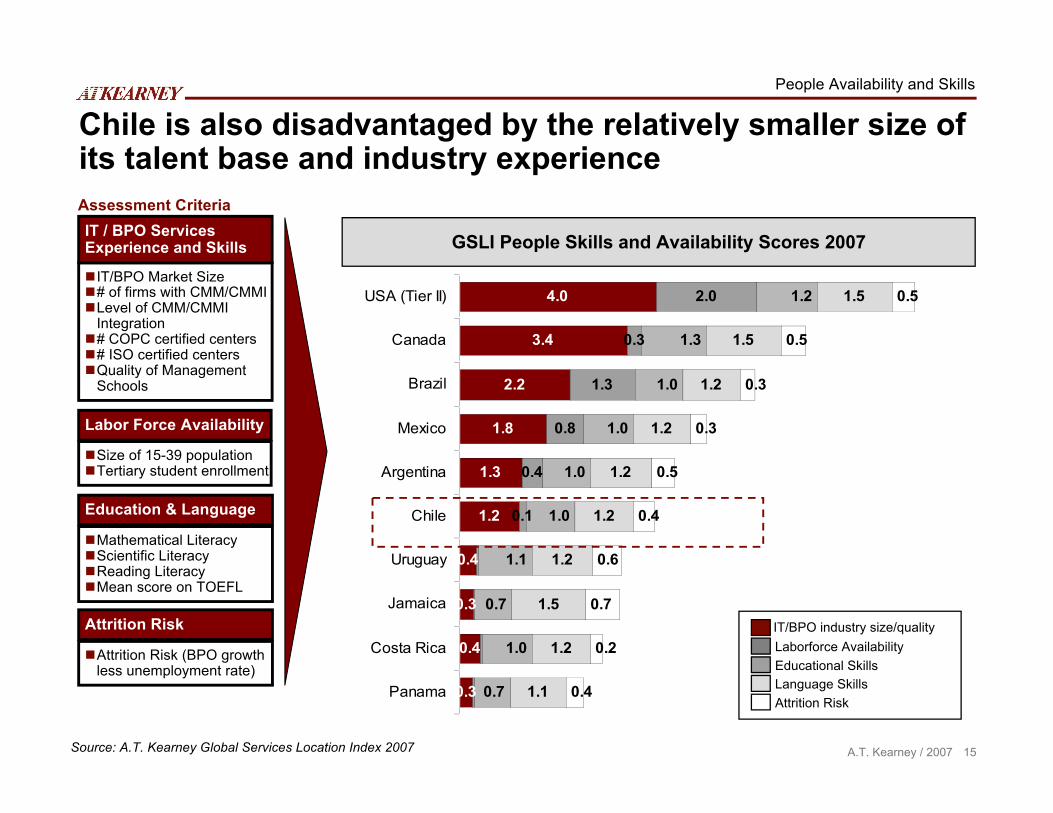
Chile is also disadvantaged by the relatively smaller size ofits talent base and industry experience
GSLI People Skills and Availability Scores 2007
People Availability and Skills
Educational Skills
IT/BPO industry size/qualityLaborforce Availability
Language SkillsAttrition Risk
Size of 15-39 populationTertiary student enrollment
Labor Force Availability
Mathematical LiteracyScientific LiteracyReading LiteracyMean score on TOEFL
Education & Language
IT/BPO Market Size# of firms with CMM/CMMILevel of CMM/CMMI
Integration# COPC certified centers# ISO certified centersQuality of Management
Schools
IT / BPO ServicesExperience and Skills
Attrition Risk (BPO growthless unemployment rate)
Attrition Risk
Assessment Criteria
Source: A.T. Kearney Global Services Location Index 2007
16A.T. Kearney / 2007
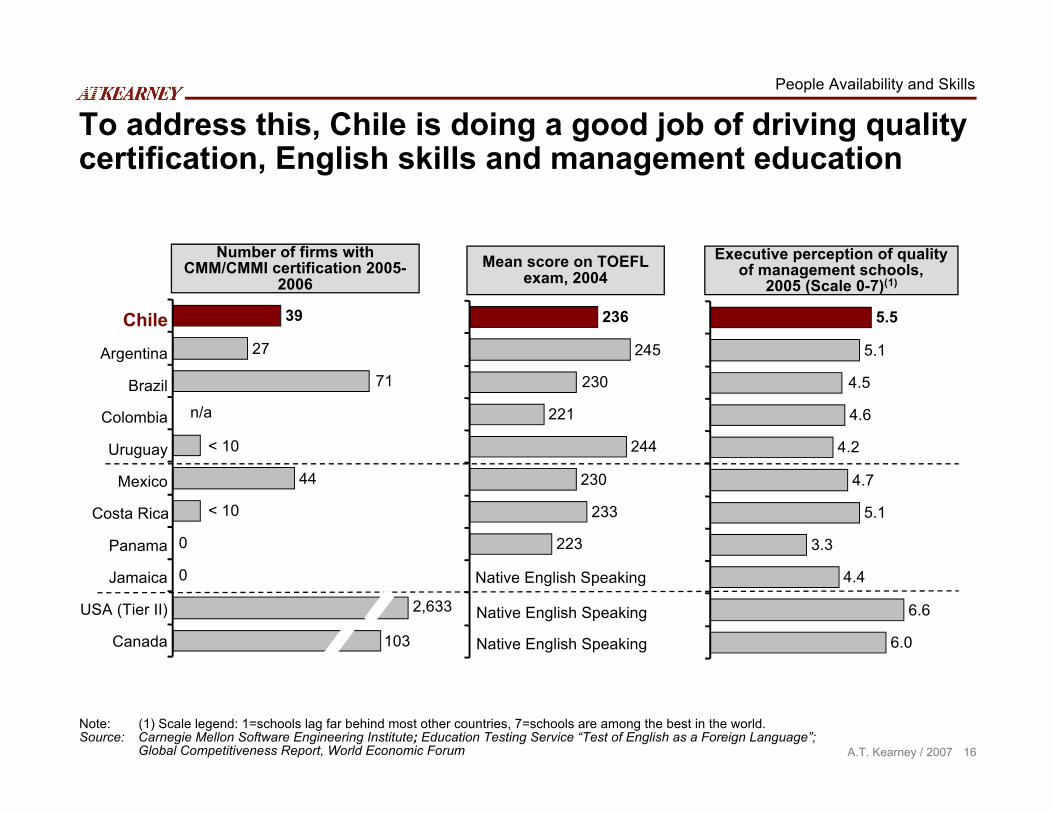
To address this, Chile is doing a good job of driving qualitycertification, English skills and management education
People Availability and Skills
Chile
Argentina
Brazil
Colombia
Uruguay
Costa Rica
Panama
Jamaica
Mexico
USA (Tier II)
Canada
Native English Speaking
Native English Speaking
Native English Speaking
Note: (1) Scale legend: 1=schools lag far behind most other countries, 7=schools are among the best in the world.Source: Carnegie Mellon Software Engineering Institute; Education Testing Service “Test of English as a Foreign Language”;
Global Competitiveness Report, World Economic Forum
Mean score on TOEFLexam, 2004
Executive perception of qualityof management schools,
2005 (Scale 0-7)(1)
2,633
n/a
103
< 10
< 10
Number of firms withCMM/CMMI certification 2005-
2006
39
27
44
0
71
0
5.5
5.1
4.6
4.2
4.7
5.1
3.3
6.6
6.0
4.4
4.5
236
245
221
244
230
233
223
230
17A.T. Kearney / 2007
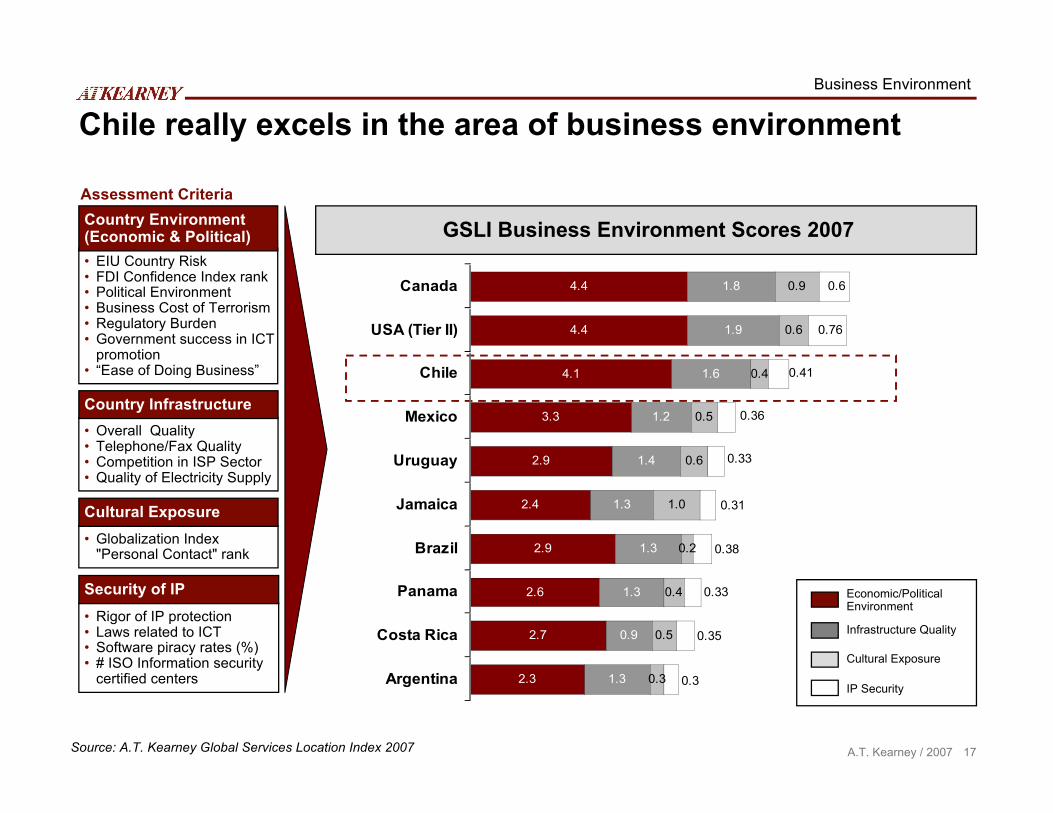
Chile really excels in the area of business environment
• Overall Quality• Telephone/Fax Quality• Competition in ISP Sector• Quality of Electricity Supply
Country Infrastructure
• Globalization Index"Personal Contact" rank
Cultural Exposure
Assessment Criteria
• EIU Country Risk• FDI Confidence Index rank• Political Environment• Business Cost of Terrorism• Regulatory Burden• Government success in ICT
promotion• “Ease of Doing Business”
Country Environment(Economic & Political)
• Rigor of IP protection• Laws related to ICT• Software piracy rates (%)• # ISO Information security
certified centers
Security of IP
Business Environment
2.3
2.7
2.6
2.9
2.4
2.9
3.3
4.1
4.4
4.4
1.3
0.9
1.3
1.3
1.3
1.4
1.2
1.6
1.9
1.8
0.3
0.5
0.4
0.2
1.0
0.6
0.5
0.4
0.76
0.60.9
0.6
0.3
0.35
0.33
0.38
0.31
0.33
0.36
0.41
Argentina
Costa Rica
Panama
Brazil
Jamaica
Uruguay
Mexico
Chile
USA (Tier II)
Canada
GSLI Business Environment Scores 2007
Economic/Political Environment
Infrastructure Quality
Cultural Exposure
IP Security
Source: A.T. Kearney Global Services Location Index 2007

18A.T. Kearney / 2007
Chile offers by far the most stable business-friendlyoperating environment in Latin America
Business Environment
EIU Overall Business Risk2006
100=high risk (lower is better)
Source: Economist Intelligence Unit, Global Competitiveness Report, World Economic Forum; World Bank, Doing Business 2007
Chile
Argentina
Brazil
Colombia
Uruguay
Costa Rica
Panama
Jamaica
Mexico
USA (Tier II)
Canada
World Bank Labor MarketRigidity, 2006
100= Most rigid
Executive Perception ofRegulatory Burden, 2006
Index 1-5 (5 = lowest burden)
3.6
2.4
2.8
2.9
2.5
2.6
2.9
3.4
2.6
2.0
3.6
53
54
21
40
41
40
40
22
20
50
48
24
41
27
31
38
32
56
0
4
4
42
19A.T. Kearney / 2007
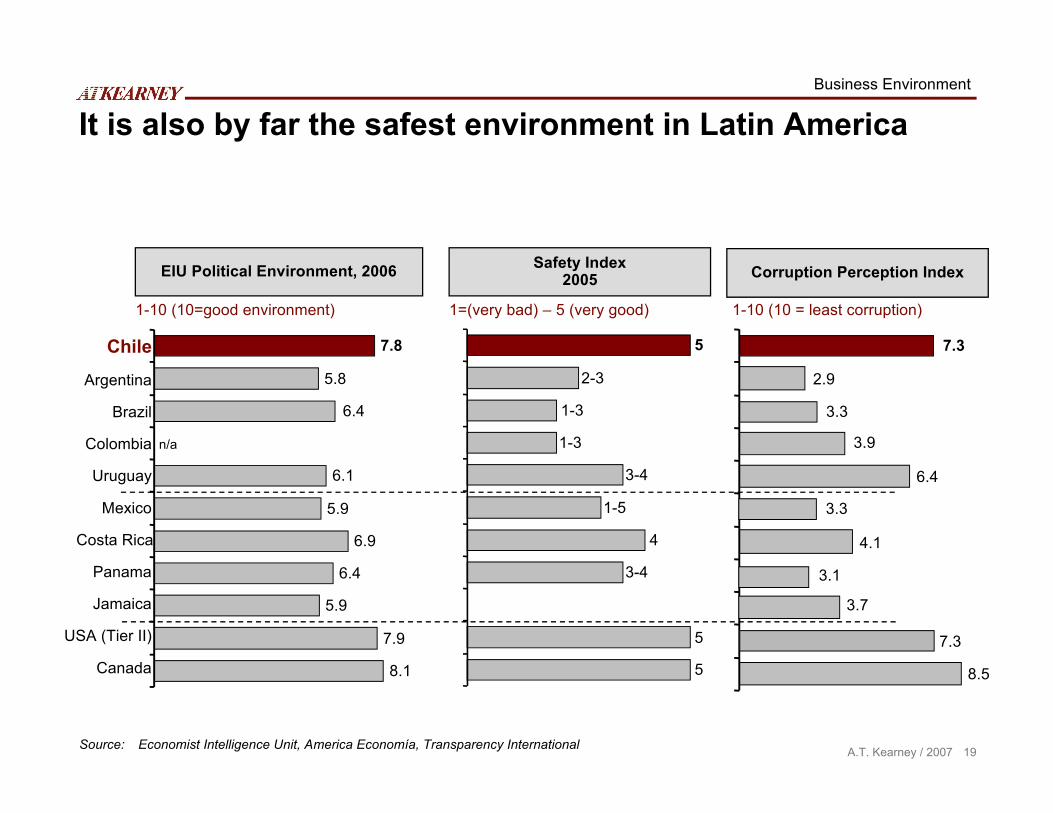
It is also by far the safest environment in Latin AmericaBusiness Environment
n/a
EIU Political Environment, 2006
1-10 (10=good environment)
Source: Economist Intelligence Unit, America Economía, Transparency International
Chile
Argentina
Brazil
Colombia
Uruguay
Costa Rica
Panama
Jamaica
Mexico
USA (Tier II)
Canada
1-10 (10 = least corruption)
Safety Index2005
1=(very bad) – 5 (very good)
Corruption Perception Index
7.3
2.9
3.9
6.4
4.1
3.1
8.5
3.7
3.3
7.3
3.3
5
4
5
5
3-4
1-5
3-4
1-3
2-3
1-3
7.8
5.8
6.1
5.9
6.9
6.4
7.9
8.1
5.9
6.4
20A.T. Kearney / 2007
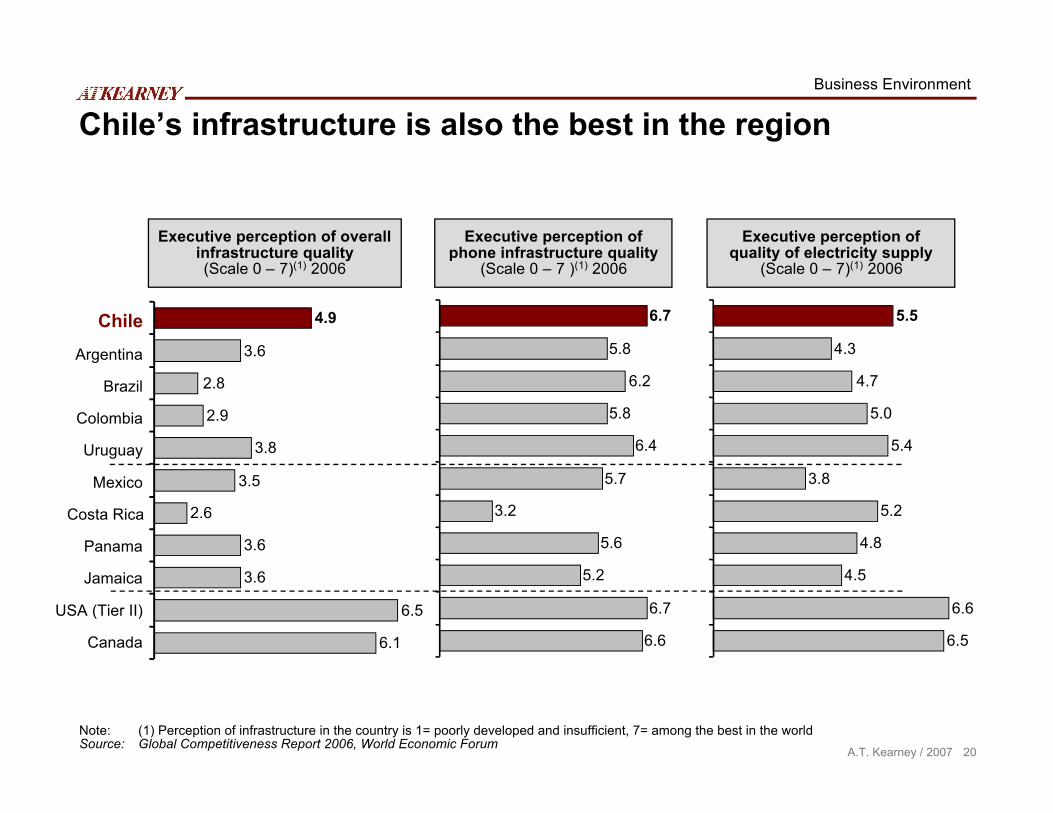
Chile’s infrastructure is also the best in the region
Chile
Argentina
Brazil
Colombia
Uruguay
Costa Rica
Panama
Jamaica
Mexico
USA (Tier II)
Canada
Executive perception of overallinfrastructure quality(Scale 0 – 7)(1) 2006
Note: (1) Perception of infrastructure in the country is 1= poorly developed and insufficient, 7= among the best in the worldSource: Global Competitiveness Report 2006, World Economic Forum
Executive perception ofphone infrastructure quality
(Scale 0 – 7 )(1) 2006
Executive perception ofquality of electricity supply
(Scale 0 – 7)(1) 2006
4.9
3.6
2.9
3.8
3.5
2.6
3.6
6.5
6.1
3.6
2.8
6.7
5.8
5.8
6.4
5.7
3.2
5.6
6.7
6.6
6.2
5.2
5.5
4.3
5.0
5.4
3.8
5.2
4.8
6.6
6.5
4.5
4.7
Business Environment
21A.T. Kearney / 2007
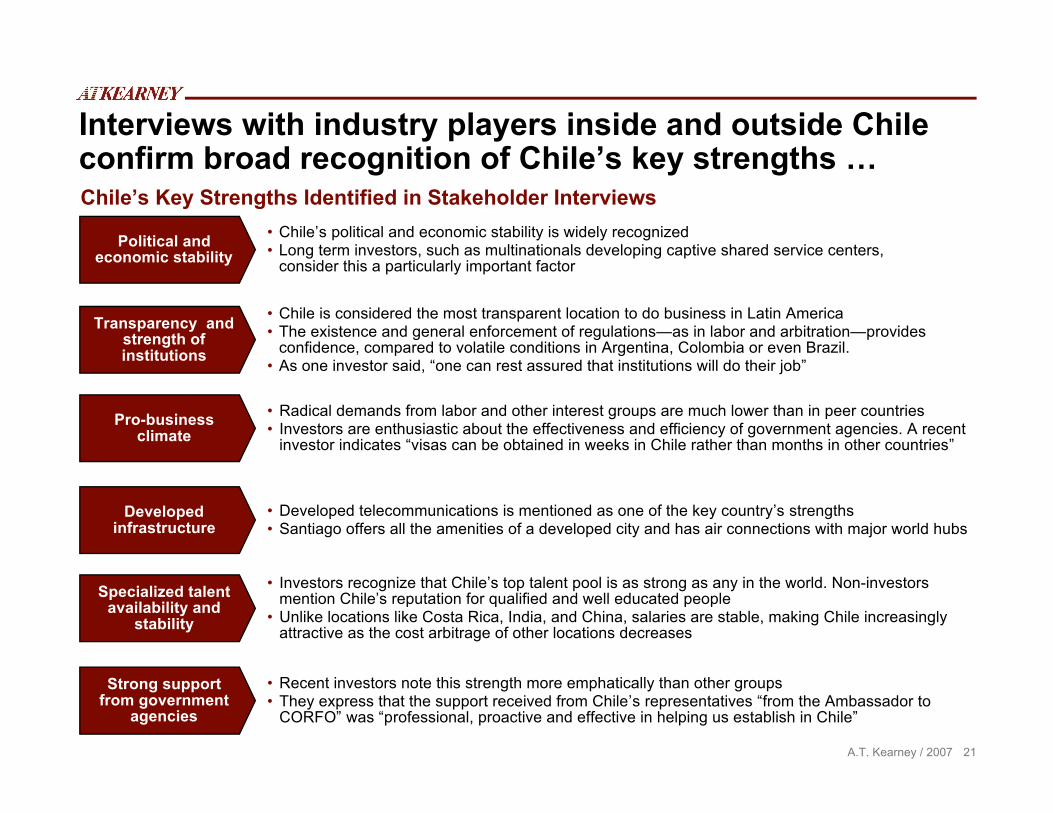
Interviews with industry players inside and outside Chileconfirm broad recognition of Chile’s key strengths …
Political andeconomic stability
• Chile’s political and economic stability is widely recognized• Long term investors, such as multinationals developing captive shared service centers,
consider this a particularly important factor
Transparency andstrength ofinstitutions
• Chile is considered the most transparent location to do business in Latin America• The existence and general enforcement of regulations—as in labor and arbitration—provides
confidence, compared to volatile conditions in Argentina, Colombia or even Brazil.• As one investor said, “one can rest assured that institutions will do their job”
Pro-businessclimate
• Radical demands from labor and other interest groups are much lower than in peer countries• Investors are enthusiastic about the effectiveness and efficiency of government agencies. A recent
investor indicates “visas can be obtained in weeks in Chile rather than months in other countries”
Developedinfrastructure
• Developed telecommunications is mentioned as one of the key country’s strengths• Santiago offers all the amenities of a developed city and has air connections with major world hubs
Specialized talentavailability and
stability
• Investors recognize that Chile’s top talent pool is as strong as any in the world. Non-investorsmention Chile’s reputation for qualified and well educated people
• Unlike locations like Costa Rica, India, and China, salaries are stable, making Chile increasinglyattractive as the cost arbitrage of other locations decreases
Strong supportfrom government
agencies
• Recent investors note this strength more emphatically than other groups• They express that the support received from Chile’s representatives “from the Ambassador to
CORFO” was “professional, proactive and effective in helping us establish in Chile”
Chile’s Key Strengths Identified in Stakeholder Interviews
22A.T. Kearney / 2007
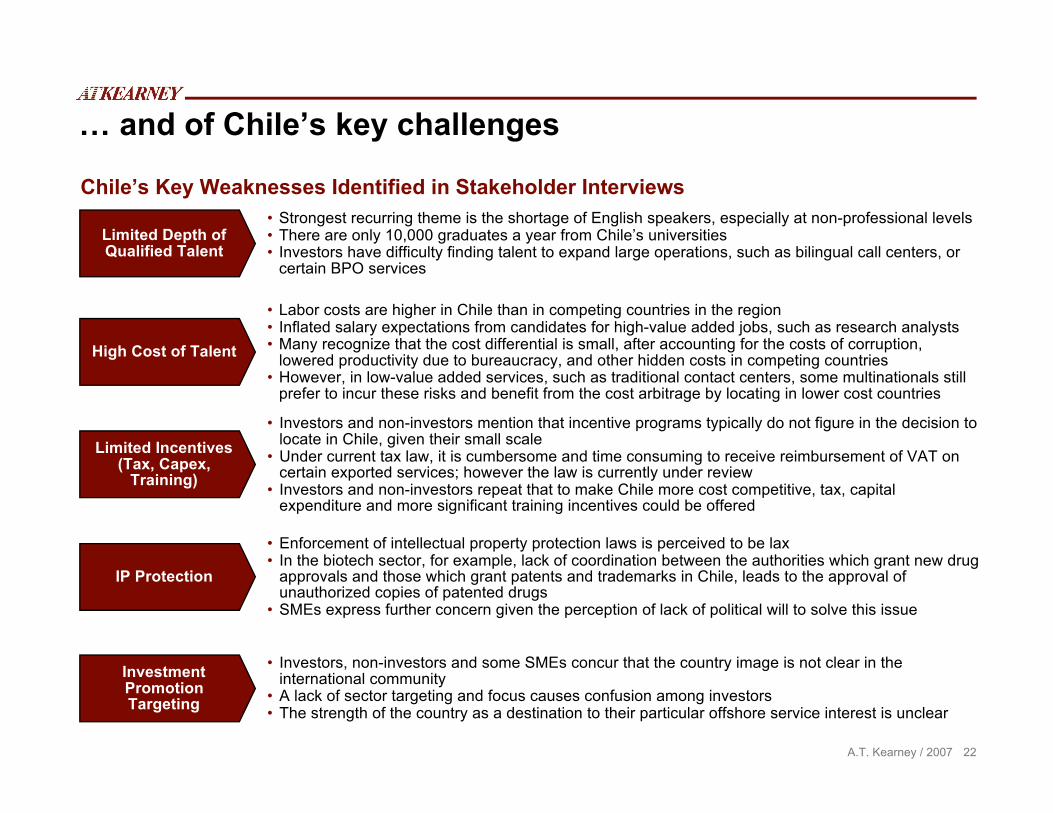
… and of Chile’s key challenges
Limited Depth ofQualified Talent
• Strongest recurring theme is the shortage of English speakers, especially at non-professional levels• There are only 10,000 graduates a year from Chile’s universities• Investors have difficulty finding talent to expand large operations, such as bilingual call centers, or
certain BPO services
High Cost of Talent
• Labor costs are higher in Chile than in competing countries in the region• Inflated salary expectations from candidates for high-value added jobs, such as research analysts• Many recognize that the cost differential is small, after accounting for the costs of corruption,
lowered productivity due to bureaucracy, and other hidden costs in competing countries• However, in low-value added services, such as traditional contact centers, some multinationals still
prefer to incur these risks and benefit from the cost arbitrage by locating in lower cost countries
Limited Incentives(Tax, Capex,
Training)
• Investors and non-investors mention that incentive programs typically do not figure in the decision tolocate in Chile, given their small scale
• Under current tax law, it is cumbersome and time consuming to receive reimbursement of VAT oncertain exported services; however the law is currently under review
• Investors and non-investors repeat that to make Chile more cost competitive, tax, capitalexpenditure and more significant training incentives could be offered
IP Protection
• Enforcement of intellectual property protection laws is perceived to be lax• In the biotech sector, for example, lack of coordination between the authorities which grant new drug
approvals and those which grant patents and trademarks in Chile, leads to the approval ofunauthorized copies of patented drugs
• SMEs express further concern given the perception of lack of political will to solve this issue
InvestmentPromotionTargeting
• Investors, non-investors and some SMEs concur that the country image is not clear in theinternational community
• A lack of sector targeting and focus causes confusion among investors• The strength of the country as a destination to their particular offshore service interest is unclear
Chile’s Key Weaknesses Identified in Stakeholder Interviews

23A.T. Kearney / 2007
Recommendations to OptimizeChile’s Competitive Position

24A.T. Kearney / 2007
Four key themes emerge to optimize Chile’s position as apreferred location for remote services
1. Focus• Given its small size and the competitive environment, Chile can not afford
to compete in all segments of the remote services sector• Chile must focus on those segments where it offers investors a clear value-
proposition
2. TargetedPromotion
• Having identified priority sectors, more targeted promotion is required tospecific sub-segments within these sectors
• This means development and distribution of more specific information onChile’s attributes in key target sectors, as well as prioritization of specificregions, industries and firms to be targeted
3. Skills andCreativity
• The most important key to success in each of the priority sectors is going tobe to expand the quantity and quality of the skill-base eligible to work inthe sector – English language skills, relevant graduation rates, opennessand attractiveness to foreign knowledge workers, and so on
4. BusinessEnvironment
• As this is Chile’s key competitive advantage, like Singapore, Chile mustcontinuously seek to optimize all aspects of its business environment,particularly areas like Intellectual property protection and informationsecurity, infrastructure quality and costs, and regulatory efficiency
Key Recommendations
25A.T. Kearney / 2007
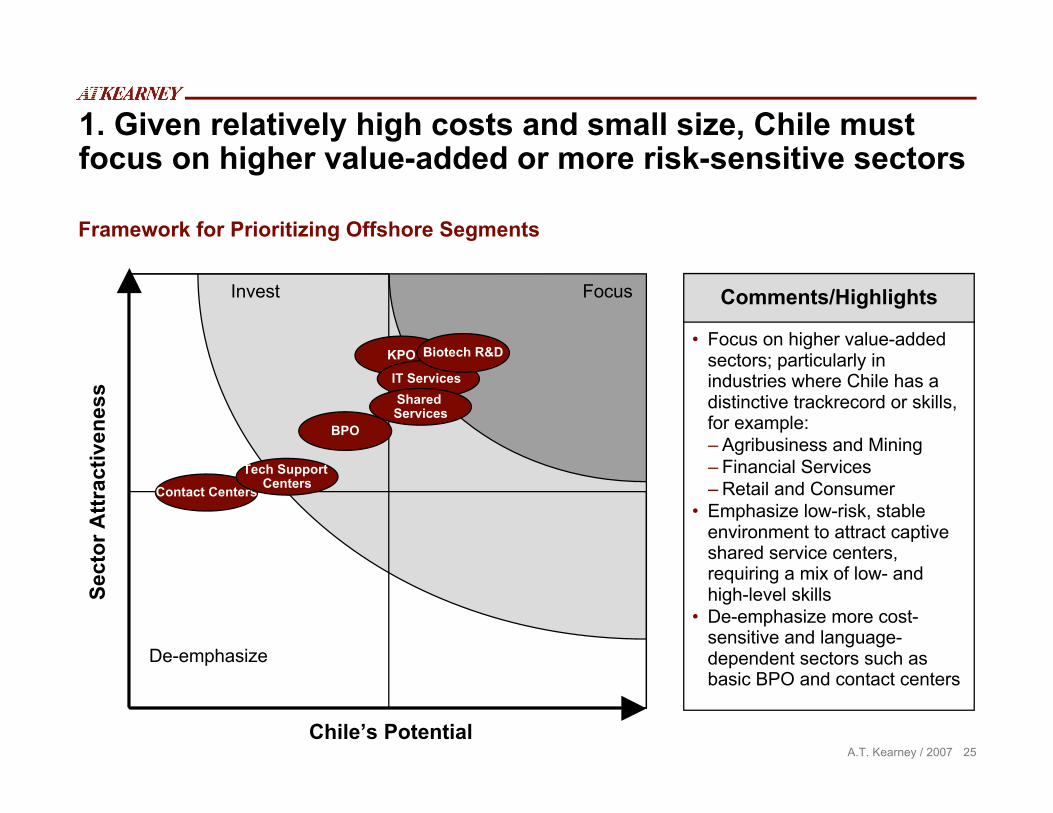
1. Given relatively high costs and small size, Chile mustfocus on higher value-added or more risk-sensitive sectors
KPO
BPO
IT Services
Chile’s Potential
Sect
or A
ttrac
tiven
ess
Focus
De-emphasize
Invest
Biotech R&D
Shared Services
Contact CentersTech Support
Centers
• Focus on higher value-addedsectors; particularly inindustries where Chile has adistinctive trackrecord or skills,for example:– Agribusiness and Mining– Financial Services– Retail and Consumer
• Emphasize low-risk, stableenvironment to attract captiveshared service centers,requiring a mix of low- andhigh-level skills
• De-emphasize more cost-sensitive and language-dependent sectors such asbasic BPO and contact centers
Comments/Highlights
Framework for Prioritizing Offshore Segments

26A.T. Kearney / 2007
2. Within these sectors, a very targeted approach isrequired to promote Chile’s attributes
• For target sectors, develop andmake readily available muchmore specific information onChile’s key attributes:–#/sources of relevant graduates
in relevant disciplines–Special skill development
initiatives (universitypartnerships, etc.)
–Detailed cost information–Fringes and taxes–Specific incentives–Specific policy commitments
(e.g. labor laws for ICT; IP forR&D, etc.)
–Set-up/Approval process/speed
What
• Focus on promoting Chile asR&D, ITO and BPO location toindustries with affinity for Chile orexisting local skill-base:–Agribusiness and Fisheries–Mining, Forestry,–Retail, Consumer–Financial Services
• Focus on countries where Chilehas FTA
• Target specific firms most likelyto be seeking a Latin Americaservice center in the near future
• Identify and leverage Chilenoexpat connections in target firms
Who
• Focus less on advertising, largetrade-shows and broad-brushbrochures; develop customizedpresentations for specific firms,laying out business case andproposition
• Find opportunities for individualdecision-makers visit Chile – tosee for themselves theinfrastructure, stability, quality oflife, etc.
• Mobilize existing investors, localvendors and industryassociations as ambassadors
• Look at overall Chile branding –does not adequately conveyattributes
How
Targeted Promotion Campaign
27A.T. Kearney / 2007
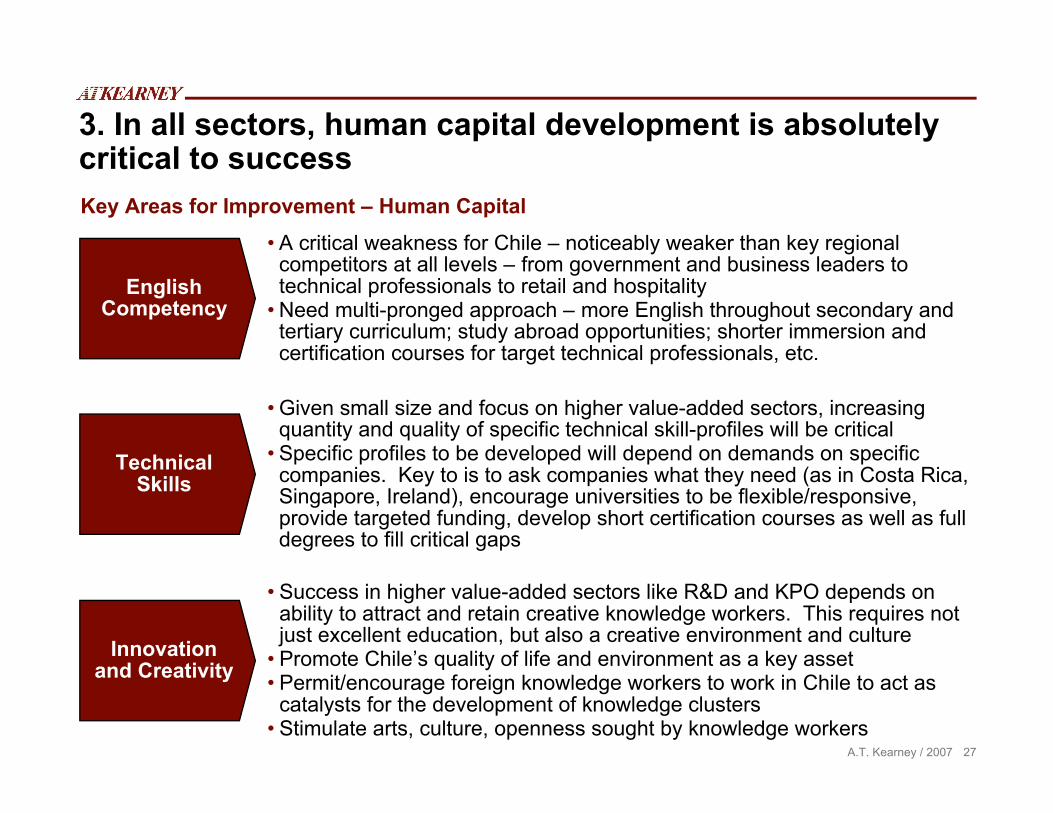
3. In all sectors, human capital development is absolutelycritical to success
EnglishCompetency
• A critical weakness for Chile – noticeably weaker than key regionalcompetitors at all levels – from government and business leaders totechnical professionals to retail and hospitality
• Need multi-pronged approach – more English throughout secondary andtertiary curriculum; study abroad opportunities; shorter immersion andcertification courses for target technical professionals, etc.
TechnicalSkills
• Given small size and focus on higher value-added sectors, increasingquantity and quality of specific technical skill-profiles will be critical
• Specific profiles to be developed will depend on demands on specificcompanies. Key to is to ask companies what they need (as in Costa Rica,Singapore, Ireland), encourage universities to be flexible/responsive,provide targeted funding, develop short certification courses as well as fulldegrees to fill critical gaps
Innovationand Creativity
• Success in higher value-added sectors like R&D and KPO depends onability to attract and retain creative knowledge workers. This requires notjust excellent education, but also a creative environment and culture
• Promote Chile’s quality of life and environment as a key asset• Permit/encourage foreign knowledge workers to work in Chile to act as
catalysts for the development of knowledge clusters• Stimulate arts, culture, openness sought by knowledge workers
Key Areas for Improvement – Human Capital
28A.T. Kearney / 2007
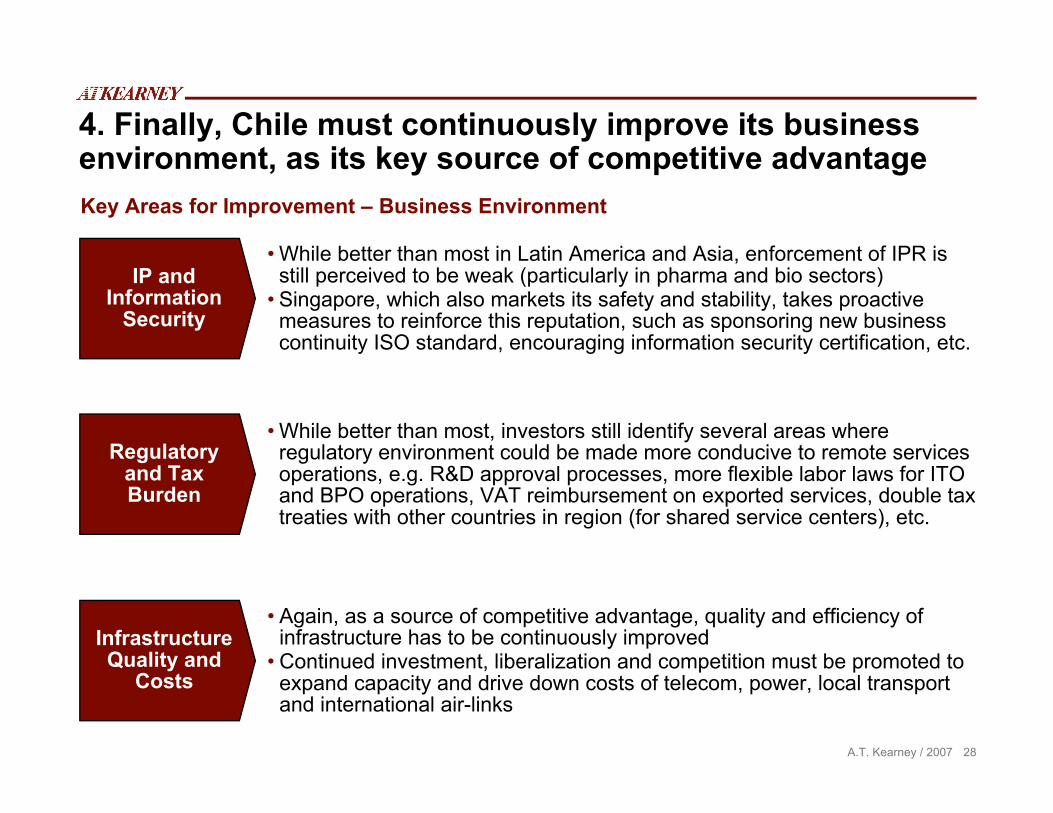
4. Finally, Chile must continuously improve its businessenvironment, as its key source of competitive advantage
IP andInformation
Security
• While better than most in Latin America and Asia, enforcement of IPR isstill perceived to be weak (particularly in pharma and bio sectors)
• Singapore, which also markets its safety and stability, takes proactivemeasures to reinforce this reputation, such as sponsoring new businesscontinuity ISO standard, encouraging information security certification, etc.
Regulatoryand TaxBurden
• While better than most, investors still identify several areas whereregulatory environment could be made more conducive to remote servicesoperations, e.g. R&D approval processes, more flexible labor laws for ITOand BPO operations, VAT reimbursement on exported services, double taxtreaties with other countries in region (for shared service centers), etc.
InfrastructureQuality and
Costs
• Again, as a source of competitive advantage, quality and efficiency ofinfrastructure has to be continuously improved
• Continued investment, liberalization and competition must be promoted toexpand capacity and drive down costs of telecom, power, local transportand international air-links
Key Areas for Improvement – Business Environment
29A.T. Kearney / 2007
Thank you
For further information, please contact:
Simon Bell: [email protected]
or
Chris Callieri: [email protected]