leverage across firms, banks and countriesbsorense/leverage_feb28d_12.pdf · leverage across firms,...
TRANSCRIPT
Leverage Across Firms, Banks and Countries∗
Sebnem Kalemli-OzcanKoc University, Harvard University, NBER, and CEPR
Bent SorensenUniversity of Houston and CEPR
Sevcan YesiltasJohns Hopkins University
February 2012
Abstract
We present new stylized facts on bank and firm leverage during the period 2000–2009 usinginternationally comparable micro level data from many countries. We document the followingpatterns: a) there was an increase in leverage for investment banks prior to the sub-prime crisis;b) there was no visible increase in leverage for the typical commercial bank and non-financialfirm; c) off-balance-sheet items constitute a big fraction of assets, especially for large commercialbanks in the US, whereas investment banks do not report these items; d) the leverage ratio isprocyclical for investment banks and for large commercial banks in the US; e) banks in emergingmarkets with tighter bank regulation and stronger investor protection experienced significantlyless deleveraging during the crisis. The results suggest that excessive risk taking before thecrisis was not easily detectable because the risk involved the quality rather than the quantity ofassets.
JEL Classification: E32, F15, F36Keywords: leverage, crisis, international, banks, firms
∗We thank Charles Engel, Jeff Frankel, Kristin Forbes, Hyun Song Shin, three anonymous referees, and participants
at the 2010 Cambridge and 2011 Bretton Woods meetings of the NBER-MIT Global Financial Crisis Conference.

1 Introduction
The 2007–2009 global crisis started in the financial sector and quickly turned into a global recession
with a decline in output, employment, and trade unprecedented since the Great Depression. One
lesson learned from previous emerging market crises is that banks’ and firms’ financing conditions
are key mechanisms in turning financial crises into recessions: declining collateral values lead to
higher cost of external financing which forces banks and firms to lower leverage and contract real
investment leading to lower output (Kiyotaki and Moore (1997)). Procyclical leverage is therefore
a potentially important amplification mechanism in propagating financial shocks to real economy
(Bernanke and Gertler (1995)). Many commentators have argued that the lending boom of the
early 2000s, which fueled the run-up to the sub-prime crises, caused firms and banks to increase
their leverage substantially. When the boom turned into a bust and banks deleveraged through
contraction of credit, the global economic meltdown occurred.
A number of recent theoretical papers aim at understanding the endogenous leverage process
(Farhi and Tirole (2010); Fostel and Geanakoplos (2008); Brunnermeier and Pedersen (2009)) but,
to this date, leverage before and after the crisis has not been studied in the framework of an
internationally comparative setting including listed as well as non-listed firms (financial and non-
financial).1 This is the task we undertake in this paper by documenting leverage patterns across
firms, banks, and countries during the 2000s. We examine if leverage patterns differ across firms and
banks, across large and small banks, and across countries with different institutional and regulatory
structures. In particular, we study which types of banks and firms were highly leveraged in which
countries in the run-up to the crisis.
We utilize the most comprehensive and comparable firm-level and bank-level world-wide data
set; namely, ORBIS from Bureau van Dijk Electronic Publishing (BvD) for the years 2000–2009
which covers listed, private, large, and small non-financial firms, financial firms, and banks. It is
important to use micro data because aggregate country-level data may mask micro level patterns.
Adrian and Shin (2008, 2009, 2010) and He, Khang, and Krishnamurthy (2010) investigate US
commercial banks and investment banks mainly using aggregate sectoral Flow of Funds data from
the Federal Reserve. Sectoral data may be driven by the largest banks and it is important to know
how typical investment and commercial banks behave. From a regulatory standpoint, the policy
prescription will differ if aggregate leverage is driven by few large banks rather than by a large
1The highly influential works of Adrian and Shin (2008, 2009, 2010) and Greenlaw, Hatzius, Kashyap, and Shin
(2008) focus solely on the US
1
number of small and mid-size banks.
We show that leverage is procyclical for large commercial banks and investment banks in the
US and to a lesser extent in Europe. Large banks have a comparative advantage in raising funds in
short-term markets (overnight repurchase agreements and commercial paper) and they were able
to increase leverage pre-crisis and skirt capital requirements by using off-balance sheet investment
vehicles. Large banks may be somewhat more stable than investment banks due to their ability
to obtain funds from depositors; nonetheless, excessive risk taking by huge “too-big-to-fail” banks,
which are considered safe due to explicit deposit insurance and implicit government insurance,
raises serious regulatory issues. Our main result is that excessive risk taking before the crisis was
not easily detectable in aggregate data because pre-crisis increases in leverage were typical only
for investment banks and very large banks in developed countries. These institutions grew their
balance sheets aggressively by increasing debt and assets but the large risks taken became clear
only after the crisis started. Banks in emerging markets behaved differently possibly due to tighter
bank regulation. Using regression analysis, we show that banks in emerging markets had a tendency
to grow leverage ratios less aggressively before the crisis and were able to better maintain their
leverage ratios during the crisis.
Our results may have important policy implications especially with regards to regulatory reform.
Indeed, we find that banks in countries with tighter regulation deleveraged less when the crisis hit
in 2008. This result is consistent with the finding of Beltratti and Stulz (2011) that banks from
countries with tighter regulation performed better during the crisis as measured by stock prices.2
The remainder of the article proceeds as follows. Section 2 reviews the theoretical and empirical
literature on leverage while Section 3 presents our data and discusses relevant issues. Section 4
presents the empirical patterns and regression results and Section 5 presents robustness analysis.
Section 6 concludes.
2 Literature on Leverage
Since the celebrated paper of Modigliani and Miller (1958) there has been an outpouring of theo-
retical work on firms’ capital structure but empirical work is only slowly catching up. Theoretical
models pinpoint important departures from the Modigliani-Miller assumptions which make capital
structure relevant for the value of firms. However, the empirical relevance of many theories is not
2They consider very large listed banks with assets over 50 billion dollars.
2

established and the empirical evidence on capital structure outside the US is scarce because most
of the literature uses data from COMPUSTAT on large listed US firms. The empirical literature is
mostly cross-sectional and therefore doesn’t address time-series dynamics in leverage patterns (see
Frank and Goyal (2004) for an example).
The corporate finance literature studying US non-financial listed firms finds that the most
important cross-firm determinants of leverage are size, profitability, and tangibility (collateral).
Rajan and Zingales (1995), using data for non-financial listed firms for the year 1991, show that
these factors are also important for leverage in other G7 countries and that differences in accounting
practices across countries do not substantially affect firms’ leverage patterns although European
firms have higher average levels of leverage compared to US firms. Booth, Aivazian, Demirguc-Kunt,
and Maksimovic (2001) study ten developing countries using a data set of large listed firms in a static
setting and find that size, profitability, and tangibility also are important for developing countries;
however, there are significant country-level differences in mean levels of leverage. Lemmon, Roberts,
and Zender (2008) undertake a dynamic analysis using data from COMPUSTAT and CRSP for
listed US firms and conclude that more than 90% of the variation in leverage is captured by firm-
fixed effects while the determinants identified by the previous cross-sectional literature only account
for 10% of the variation—leverage is remarkably stable over time for listed non-financial firms.
In simple textbook theory, bank capital is determined by regulatory capital requirements. In
more sophisticated models, banks optimize their capital structure responding to prices and pressures
from shareholders and debtors in the same fashion as non-financial firms in a market economy as
modeled by Flannery (1994), Flannery and Sorescu (1996), Myers and Rajan (1998), Diamond
and Rajan (2000), and Allen, Carletti, and Marquez (2009). The recent theoretical literature
on endogenous leverage stresses financial frictions: financial intermediaries face frictions in raising
funds and when frictions worsen they sell assets and reduce liquidity provision.3 Leverage-constraint
models, in which a tightening of constraints will lead to deleveraging, focus on the amount of debt
financing of intermediaries; see, for example, Fostel and Geanakoplos (2008) and Brunnermeier and
Pedersen (2009).
A rise in asset prices will mechanically increase the value of equity (banks’ net worth) as a
percentage of assets. Keeping everything else fixed, rising asset prices will lead to a lower leverage
ratio, defined as the ratio of assets to equity. Conversely, in a downturn, asset prices would fall
and the leverage ratio would increase. Adrian and Shin (2008, 2009, 2010) show that leverage
3These models go back to the influential work of Shleifer and Vishny (1992).
3

patterns are countercyclical for the US non-financial sector but procyclical for investment banks.
This procyclicality amplifies the business cycle, potentially leading to systemic risk, especially if
asset prices do not properly reflect fundamental values (“bubbles”). Investment banks actively
manage their balance sheet and leverage, typically through collateralized borrowing and lending,
although this paper does not explore how leverage is managed. For example, if the intermediary
targets a constant leverage it will react to changes in net worth by adjusting debt. If balance sheets
are not marked to market—as is typically the case for commercial banks—leverage is measured as
total book assets to book equity. Banks can react to an increase in asset prices by increasing debt
and assets, in which case the relationship between balance sheet leverage growth and the balance
sheet size (asset growth) can be positive.
Flannery and Rangan (2008) and Gropp and Heider (2010) find large variation in banks’ capital
ratios and investigate whether capital requirements are a first-order determinant of banks’ capital
structure. Flannery and Rangan (2008) show that banks increased capital holdings independently
of regulatory requirements in the 1990s and interpret this as a reflection of reduced government
implicit guarantees. Gropp and Heider (2010) undertake an analysis similar to that of Rajan and
Zingales (1995) using BANKSCOPE data with both cross-bank and temporal variation as does
the present article. They focus on the 100 largest listed European and US banks between 1991
and 2004 and find that the importance of size, profitability, and tangibility disappears once bank-
fixed effects are accounted for. They also find that minimum capital requirements do not play a
role in explaining banks’ capital structure. Another important finding from the study of Gropp
and Heider (2010) is that, on the margin, banks finance their balance sheet growth entirely from
non-deposit liabilities. He, Khang, and Krishnamurthy (2010) emphasize the shifts in holdings of
securitized assets within the financial sector and show that investment banks decreased leverage by
selling assets during the deleveraging process of 2008–2009, commercial banks and the government
increased leverage by acquiring these assets.
The empirical results of Adrian and Shin (2008, 2009) and Greenlaw, Hatzius, Kashyap, and
Shin (2008) suggest that the largest banks manage their capital structure based on internal value
at risk and not based on regulatory constraints, especially for financial intermediaries that strive
to maintain a constant (maximal) risk exposure, often measured as Value at Risk (VaR), while
maximizing earnings.4 Leverage is high during boom times because perceived risk is low while
4VaR is an estimate of a financial institution’s worst case loss and is usually defined with respect to a confidence
level of, say, 99%. VaR is defined such that the probability that losses on the asset portfolio exceed the value VaR is
less than 1%.
4

leverage is low during contractions because risk is high with increased volatility of asset prices.
Overall, it appears that determinants of non-financial firms’ and banks’ leverage are quite stable
over time and across countries, though there exist significant country differences in leverage levels.
3 Data and Descriptive Statistics
3.1 Data
We use a unique data set composed of firm- and bank-level observations for 2000–2009 from the
ORBIS database provided by BvD. This database is an umbrella product that covers other well-
known databases from the same company such as AMADEUS (only European firms), ZEPHYR
(worldwide mergers), BANKSCOPE (worldwide banks), and OSIRIS (worldwide listed firms). The
time coverage of each firm/bank is a subset of the sample period, leading to an unbalanced panel.5
The database comes in two modules: “Financials,” which provides financial information—both
on- and off-balance-sheet and “Ownership/Corporate Tree,” which provides information on foreign
and domestic owners of each firm as well as all subsidiaries. In our original data set, we have
60,000 publicly quoted companies worldwide (OSIRIS), 30,000+ banks worldwide (BANKSCOPE),
29 million European companies from 46 countries (AMADEUS), 18+ million US and Canadian
companies, 5+ million South and Central American companies, 6+ million companies in the Far
East and Central Asia (mainly in Japan, Korea, China), and 790,000 African and Middle Eastern
companies (ORBIS).
We only use banks/financial firms and “large” non-financial firms in this study because small
non-financial firms played no role in the onset of the crisis. In fact, we document that even large
non-financial firms did not increase leverage before the crisis. For banks and financial firms, we
use a benchmark world sample because we have representative universal coverage. However, for
non-financial firms, we do not have a representative sample and coverage varies across countries
so we focus on “large” firms (defined as firms with more than 150 employees) from Europe and
the US which comprise the countries with best quality data and coverage. In Europe and the US,
all corporations (listed or not) have to file with official registries. Our European coverage is good
because companies have to file both unconsolidated and consolidated statements while the US cov-
erage suffers from the fact that many firms only report consolidated statements.6 For non-financial
5We use ZEPHYR data to control for all firm mergers and acquisitions that happened during our sample.6In addition to this issue, BvD has a relatively thin coverage for the US before 2007 even for consolidated accounts.
5
firms, we use unconsolidated accounts to avoid double counting and to improve comparability
across countries while we use consolidated accounts for investment banks because they only report
these. Adding consolidated statements (holding companies) for commercial banks does not alter
our results.
We use two types of samples for both banks and firms: permanent and non-permanent. The
non-permanent sample is used in the regression analysis and in the investigation of cross-sectional
patterns. We made sure the non-permanent sample does not suffer from survivorship bias by
assembling our panel data from individual cross-sections using historical, archived releases of the
database. This is important since BvD erases the data on banks in BANKSCOPE from all previous
years if the bank does not exist in the current year. They apply a similar practice to firms in
AMADEUS and in ORBIS where they keep a firm in the data set for 5 years after it disappears
and then erase it from the data for all years. Hence, the data has to be downloaded disk by disk
for every year and not from the latest disk for all the previous years.
The permanent sample is used for time series figures. We have to use a permanent sample
here otherwise we would not know if the patterns seen in leverage are due to entry and exit of
banks and firms. The trade-off is that these permanent samples will suffer from survivorship bias.
Permanent samples are defined as firms and banks with non-missing asset data throughout the
period 2000–2009—Lemmon, Roberts, and Zender (2008) make similar choices.
In the context of leverage, our bank data from BANKSCOPE is used by Gropp and Heider
(2010). In the context of the bank competition literature, it is used by Berger, Klapper, and
Turk-Ariss (2008) and Claessens and Laeven (2004). Our firm data is used by many authors in
different contexts. Arellano and Bai (2010) study the relationship between leverage and financial
development for one year (2004) using AMADEUS data but do not analyze dynamic properties of
leverage. Coricelli, Driffield, Pal, and Roland (2009) use AMADEUS data to study the relation
between growth and leverage in 9 CEE countries during the pre-crisis period 1996–2005. ORBIS,
from where we get the US firms, is identical to the well-known Dun and Bradstreet data set for the
US. For example, Black and Strahan (2002) use this data to study entrepreneurial activity in the
US. The firm-level data is also used in two other studies involving two of the authors of this article;
namely, Kalemli-Ozcan, Sørensen and Volosovych (2010) who study the relationship between growth
and volatility and Fons-Rosen, Kalemli-Ozcan, Sørensen, Volosovych, Villegas-Sanchez (2011) who
study financial integration and productivity spillovers.
The bank-level and firm-level data sets are suitable for international comparisons because BvD
6

harmonizes the data. Our dynamic analysis either compares banks over time within a single country
or banks over time within a group of countries using bank and country-time fixed effects which
control for permanent differences between banks or countries and for global common factors. For
our purpose, it is important to undertake a dynamic analysis, rather than a cross-sectional analysis
which doesn’t allow for fixed effects, because country-fixed effects will absorb all features that are
common to all banks and firms in a country such as differences in accounting practices, balance sheet
representation, and domestic regulatory adjustments. For example, using international financial
reporting standards results in higher total asset amounts reported than when US generally accepted
accounting principles are used because netting conditions are stricter under international standards.
Regulatory requirements might apply differently across countries; for example, in the US min-
imum capital requirements apply both to individual banks and to consolidated banks, whereas
in other countries this may be different. Investment banks and their subsidiaries in the US are
regulated by the Securities and Exchange Commission (SEC) while other countries have different
regulatory systems. Again, any non-time varying bank-level changes will be absorbed by our fixed
effects.
Differences between countries can be due to assets and liabilities being valued at book value
(historical) versus market value (current). If different countries follow different accounting practices
but all banks and firms within each country behave similarly then these differences will be absorbed
by country fixed effects. If banks and firms in various countries behave differently in a fashion that
changes over time then we cannot account for this with fixed effects. Therefore, we stick to book
value overall as reported in balance sheets if we have a choice between the two as in the case of
listed firms and banks. For private firms and banks, we have book value only.
We use country-level measures from the Bank Regulation Data Set of Barth, Caprio, and Levine
(2007). This data set comes in surveys from 2003 and 2010, respectively. We use the 2003 values
of the following variables: 1) “Supervision Index,” which measures the efficiency of supervision and
takes a value of 1 if there are multiple independent supervisors for banks and zero otherwise and 2)
“Monitoring Index,” which measures the efficiency of monitoring and takes a value of 1 if the top
ten banks in the country are all rated by international rating agencies, if off-balance sheet items
are disclosed to public, if banks must disclose risk management procedures to the public, and if
subordinated debt is required as part of regulatory capital and zero otherwise. We expect banks
in countries where the values of these indices are high to take lower risks in terms of asset quality
because it is relatively harder to hide such risks on or off the balance sheet.
7

3.2 Descriptive Statistics
The leverage ratio is measured as the ratio of assets to equity (shareholder funds).7 We explored
other measures such as the ratio of Tier 1 capital (sum of capital and reserves minus intangible
assets) to adjusted assets, the ratio of total liabilities to total assets, the ratio of total debt to
total assets, and the ratio of total debt to equity. The patterns in those data series were mainly
consistent with what we show in this paper and they are not reported in the present version of the
article.
The leverage ratio does not reflect off-balance sheet exposure. One of the key characteristics of
the sub-prime crisis is that in the pre-crisis period banks funded a growing amount of long-term
assets with short-term liabilities through the use of off-balance sheet vehicles, exposing themselves
to credit and liquidity risk by providing credit facilities and guarantees to these vehicles. Many
have argued that this was the main amplification mechanism (see Brunnermeier 2009 and Adrian
and Shin 2009). In addition, many banks held structured credit instruments on their balance
sheet, increasing the maturity mismatch of their balance sheet and their funding liquidity risk. We
investigate patterns in the ratio of off-balance sheet items (guarantees and committed credit lines)
to assets because a loan guarantee involves a future contingent commitment even if it does not show
up on the balance sheet. Banks report these data together with the balance sheet as a separate
memo line called off-balance sheet items where they report guarantees, committed credit lines, and
other exposure to securitization. Very few banks report the last item and investment banks do not
report any of these items.
Table 1 shows the number of bank-year and firm-year observations by country. We have over
200,000 bank observations and over one and a half million firm observations from 60+ countries.
Table 2 presents the number of observations by bank type and account type. Most of our banks
are commercial banks and most of our banks report unconsolidated accounts. The majority of
banks are not listed. Most of the firms in our sample are non-financial, unlisted firms reporting
unconsolidated accounts.
Table 3 presents descriptive statistics for the data as used in the regression analysis—this data
set is winsorized at 2% and 98%. The leverage ratio is as high as 46 with a mean of about 12 while
the maximum amount of off-balance sheet items is more than 11 times of assets, although the mean
across banks is only 0.7%. Table 3 also shows descriptive statistics by type of bank. Investment
banks have slightly higher leverage on average. “Sponsor”banks and large commercial banks have
7Our measure is equivalent to the measure 1−equity/assets used by Gropp and Heider.
8

the highest leverage on average at around 23 and 17, respectively.8
4 Empirical Patterns
4.1 Aggregate Picture
In Figure 1, we plot bank assets since 2000. Panel A shows sectoral data from the Flow of Funds
accounts compiled by the US Federal Reserve System. As shown, assets of commercial banks,
savings institutions, and credit unions increased from about 6 trillion dollars in 2000 to over 12
trillion dollars in 2008 followed by a decline of several hundred billion since 2008. Investment banks
(“brokers and dealers” in the Flow of Funds, which includes all institutions who are engaged in
brokering and dealing of securities) saw tremendous growth in assets from 2000 to 2008 followed by a
steep reversal of over half a trillion dollars.9 The travails of the US investment banks culminating in
the default of Lehman Brothers have been extensively documented in many places, see for example
Duffie (2010), Krishnamurthy (2010), and other papers in the Journal of Economic Perspective’s
symposium on the financial crisis in the Winter 2010 issue.
Panel B displays bank assets, aggregated from our bank-level data, for the US. In this article,
we use the label “aggregated” for data summed over the banks in our sample. Total Assets of each
bank is defined as total book value of intangible, tangible, and other fixed assets. Compared to
the Flow of Funds data, our aggregated data overstates assets because banks’ claims on each other
are not netted out. Nonetheless, the patterns in our aggregated data are similar to the patterns
in the Flow of Funds data for both investment banks and non-investment banks. Using our data,
we are able to break down the patterns for large banks, large banks excluding investment banks,
and small banks. We define a large bank as a bank that has more than a billion dollars worth of
assets at the beginning of our sample. Panel C shows aggregated assets of the European banks in
our data set: assets grew marginally from 2000 till 2004 followed by a sharp acceleration to more
than 20 trillion dollars in 2008 followed by an astounding drop of about 3 trillion dollars from 2008
8“Sponsor banks” are large banks which have created off-balance sheet investment vehicles. We obtained the
names of the sponsor banks from Acharya, Schnabl, and Suarez (2010). There are 70 conduit sponsor banks in their
data set and we have located 62 of these in our data. 31 of these banks are European, 23 are American, 4 are
Australian, 3 are Japanese, and 1 bank is Canadian. Only 3 out of 62 are investment banks. Non-sponsor banks
statistics are similar to the statistics of all banks.9There may be brokers and dealers in the Flow of Funds that are not “investment banks” in the BvD data;
however, there is a large overlap between the categories.
9

to 2009.10
Looking at risk-weighted assets may be more informative about risk taking and we do so in
Figure 2. A clear divergence in the trend between total assets and risk-weighted assets can be
observed for all banks and as well as for large banks (aggregated from micro data), with risk-
weighted assets growing more slowly. Risk-Weighted Assets (RWA) are defined as the sum of three
components: operational risk, market risk, and a weighted sum of assets with appropriate weights
determined by the regulators. The weights can be chosen in a simplified manner or in a more
sophisticated manner which is typically used by large banks. The weights assigned in the simplified
system are 0 for government and other public assets, 20% for liabilities of other banks and securities
firms, 35% for secured mortgages, 75% for personal lending, and 100% for corporate and commercial
lending. A more sophisticated system includes more subcategories based on credit rankings.11 Risk-
weighted assets give an indication of the degree of measured risks regulators believe banks take;
however, the low rate of increase in risk-weighted assets compared to total assets imply that the
risk that became evident during the crisis was not captured by the risk-weights applied to banks’
assets in the period leading up to the sub-prime crisis. Figure 2 shows that the risks that became
evident during the crisis were not captured by the risk-weights applied to banks’ assets in the period
leading up to the sub-prime crisis as risk weighted assets displayed lower growth rates before the
crisis.12
Figure 3 displays bank equity, in a similar fashion to Figure 1, using the sectoral Flow of Funds
data for the US in Panel A, and using aggregated data (aggregation of bank-level observations for
the US banks) in Panel B. Equity of US investment banks grew sharply from 2004 to 2006 followed
by a sharp drop in 2008 (the exact timing being slightly different between the quarterly Flow of
Funds data and the annual aggregated data). For large banks (excluding investment banks) there
has been a steady increase in assets. For European banks, aggregated equity (displayed in Panel C
of Figure 3) increased rapidly from about 600 billion dollars in 2004 to about 800 billion in 2007
followed by a slight drop in 2008 and a recovery in 2009.
Figure 4 compares aggregate US leverage, calculated as assets over equity, from the Flow of
Funds to aggregated leverage compiled from our micro data, in Panels A and B. The US patterns
from the Flow of Funds in Panel A are very similar to those of the aggregated data in Panel B
which display aggregated assets divided by aggregated equity. In 2004, the SEC deregulated the
10The European sample includes all European countries. Results with EU banks only are similar.11See Blundell-Wignall and Atkinson (2010) for more details.12Plotting the assets of the median bank, rather than aggregated assets, results in a similar picture.
10

minimum capital requirements for investment banks, freeing leverage ratios from direct regulatory
constraints. A run-up in leverage of investment banks (“brokers and dealers” in the Flow of Funds)
from 2004 to 2008 is evident in both panels although the Flow of Funds data, being quarterly,
exhibits sharper peaks and valleys. The collapse in the leverage of investment banks after 2008
is clearly evident in both panels. This is mechanically explained by the sharp decline in assets
combined with equity rebounding in 2009. Leverage ratios of commercial banks were quite stable
from 2000 until 2008 when a steep decline occurred. This is mechanically explained by the small
decline in assets and the steeper increase in equity seen in the previous figures. Panel C shows
similar patterns for the European banks. Appendix Table 1 shows aggregated, mean, and median
leverage for 2006–2009 for other countries.
Aggregate patterns may be driven by a few mega-banks, such as Bank of America, Citibank,
and JP Morgan. Our micro data allows us to examine leverage of typical banks. We plot median
leverage for banks over time in Figure 5. Panel A is visually dominated by investment banks
which have pro-cyclical leverage ratios between 14 and 20. These medians are higher than those of
commercial banks but much lower than the aggregate leverage ratios of investment banks—clearly,
high leverage of investment banks is concentrated within the largest banks. Panel B shows that
the median European bank decreased leverage steadily from around 17.5 to 15 over our sample.
The sub-prime crisis first came to the surface on July 31, 2007 with the default of two Bear
Stearns hedge funds followed by BNP Paribas halting withdrawals from three investment funds.
A large number of banks had created off-balance sheet conduits which mainly invested in asset-
backed securities in order to reduce capital requirements. However, most conduits were still fully or
partially guaranteed by their sponsoring banks which also provided committed lines of credit (see
Acharya, Schnabl, and Suarez (2010) for more details on this). We have measures of guarantees
and committed credit lines and we display the aggregated amounts relative to assets for all banks
and separately for large banks in Figure 6. Investment banks do not report these items. The total
amount of guarantees and credit lines at 85% were almost as large as total assets from 2000 till
2007 for large banks and lower at 70% for all banks. From 2007 till 2009 there was a sharp drop
with the aggregate amount falling to less than 50% of assets when banks were getting out of these
commitments in the wake of the interbank lending freeze and the difference between larger and
smaller banks narrowed. Panel B shows similar patterns for Europe in terms of timing, though less
pronounced in terms of scale: guarantees and committed credit lines never exceeded 22% of assets
in Europe. This is partly due the differences in regulation: banks in Spain do not issue guarantees
to off-balance sheet entities because Spain had imposed similar capital requirements for assets on-
11

or off-balance sheets, leaving little incentives for Spanish banks to use such entities.
Guarantees and credit lines are not the focus of this article but it appears that banks carry a
large amount of risk that is not visible from conventional leverage ratios. Ex post, major US banks
were subject to increasing risk from guaranteeing enormous pools of assets of declining quality;
however, the pattern of Figure 6 does not indicate increased risk taking before 2007—only the
collapse after the start of the crises reveals the risk taken. It is clear that outside of investment
banks neither leverage nor guarantees and committed credit lines relative to assets (or equity)
signalled excessive risk taking over time in the run-up to the crisis. It appears that the increasing
risk exposure of commercial banks in 2004–2007 were hidden in the deteriorating quality of the
asset pool. Figure 7 shows median levels of guarantees and committed credit lines to assets for
large banks and for all banks. The median is much smaller than the aggregate ratio for large
banks and much smaller again for all banks. This holds for both the US and Europe implying that
issuing of guarantees and committed credit lines was concentrated among the largest banks which
disproportionately affect the mean.
4.2 Bank Leverage: Procyclical or Countercyclical?
An increase in asset values will mechanically increase the value of both the numerator and denom-
inator of the leverage ratio but the increase in equity will be proportionally larger and the leverage
ratio will fall. Such a pattern is observed for households as pointed out by Adrian and Shin (2008,
2009). However, a firm or a bank may be able to use the increased equity as basis for further
lending which will increase assets (and liabilities) relative to equity with the outcome that asset
appreciation and leverage is no longer inversely related. Adrian and Shin (2008, 2009) demonstrate
that non-financial corporations’ asset growth and leverage is virtually uncorrelated using aggregate
data from the US Flow of Funds accounts.
A non-financial firm may face decreasing marginal profitability of investments; however, banks
will often be able to invest with non-decreasing marginal returns in large liquid markets, such as the
market for mortgage-backed securities, while borrowing at a constant low rate through repurchase
arrangements, commercial paper, or implicitly through cash management for hedge funds. If banks
have target leverage ratios, leverage will not increase with asset values but if banks target a level of
risk exposure, leverage may be procyclical as Adrian and Shin (2008, 2009) find for US investment
banks 1963–2006. They find an acyclical pattern for commercial banks, although Greenlaw, Hatzius,
Kashyap, and Shin (2008) found a procyclical pattern for 5 big commercial banks in the US. We
12

do not explore models of how banks determine their leverage in this paper but Appendix Figure 12
shows that aggregate leverage tends to move inversely with the US VIX-index of risk.13
Figure 8 examines potential procyclicality for US investment banks, and large commercial banks
in Panels A, and B, respectively. The figure complements Adrian and Shin (2008, 2009) and
Greenlaw, Hatzius, Kashyap, and Shin (2008), plotting average growth of leverage against average
growth of assets for the sample of all (investment, and large) banks in our data set. In these figures,
all banks have equal weight and the interpretation is that the figures show whether typical banks
display the “Adrian-Shin pattern.”14 Because all banks have equal weights, the patterns are not
strongly affected by a few giant banks. We include a 45 degree line along which points will cluster
if banks maintain a constant level of equity implying that assets and leverage move in lock step.
Panel A focusses on US investment banks and the “Adrian-Shin pattern” is easily visible over
the full sample period. Year 2008 is an outlier with large declines in assets and leverage but it
pretty much lies on the line that one can easily fit using ordinary myopic eyeballs.15 For large US
(non-investment) banks in Panel B, a similar pattern is visible, maybe with an even steeper slope
although the observations for 2008 and 2009, which are above the other points, probably should be
interpreted with caution: many observers, see for example, Greenlaw, Hatzius, Kashyap, and Shin
(2008), interpret the increase in bank lending in 2008 as “forced lending” where borrowers were
drawing on pre-committed credit lines. Certainly, the steep decline in assets, committed credit
lines, and guarantees that started in 2008 and accelerated in 2009 is consistent with banks needing
time to unwind their obligations. For smaller banks, we do not find procyclicality and we omit
results smaller banks for space considerations. For European banks, we observe a slight tendency
for leverage to be pro-cyclical for large banks, although with a much smaller slope than found for
large US banks. Smaller European banks display a surprisingly stable level of asset growth and no
hint of procyclical leverage. These results are available upon request.
13VIX is the symbol for the Chicago Board Options Exchange Market Volatility Index, which measures the implied
volatility of S&P 500 index options.14This is different from saying that the median bank displays the pattern. In the time series graphs, we plotted
medians against time but it is not as meaningful to plot median leverage growth against median asset growth because
the medians will belong to different banks.15Note that in the figures in Adrian and Shin’s articles 2008 is the peak year. This discrepancy to our results occurs
because they use first quarter of 2008 where the crisis was still in its infancy. Our annual data is from end-of-year
accounts.
13

4.3 Non-Financial Firms
Mean values of leverage for large non-financial firms over time are plotted in Appendix Figure 9.
Mean firm leverage for listed US firms is very stable at around 2.3-2.4 while the leverage ratio is
slightly larger for non-listed firms but still much lower than for banks. This pattern is consistent
with firms hoarding cash in 2009 (for example, Almeida, Campello, and Weisbach 2004 discuss how
constrained firms may be more likely to conserve cash in a recession drawing on their bank lines
of credit). For Europe, we see slightly higher leverage ratios, which may be due to differences in
accounting rules, but the temporal patterns are similar to those of the US with very little variation
over time except that we find a weak but steady decline in leverage for all (mainly non-listed) firms.
The great recession does not register at all for European non-financial firms. Non-financial firms
showed no inkling of procyclicality and very little systematic growth of leverage. We do not show
these results for space issues.
4.4 Regression Analysis
From the previous section, it appears that leverage at the bank and firm level did not signal an
impending recession. In this section, we examine if leverage patterns differed between countries
with looser or stricter regulation.
We estimate the relation
Leverageit = µi + ΣtγtDt + ΣtβtDt ∗Xc(i) ,
where the left-hand side is firm-level leverage, µi indicates firm-level dummies (“fixed effects”),
Dt is a set of time dummies (with 2000 left out to avoid collinearity), and Xc(i) is one of the
regulatory variables that captures intensity of bank regulation in country c in which bank i is
located.16 The bank-level dummies capture any constant bank-level (and therefore also country-
level) variables and the non-interacted time dummies capture world wide impacts in each year. The
objects of interest are the βt coefficients which show whether countries with particular regulatory
environments experience different temporal patterns in leverage.
The temporal patterns in Table 4 are revealing: the time-dummy interaction terms are in general
16In a previous version, we controlled for size (log assets), profitability, and collateral because these were found
by Gropp and Heider (2010) to be predictors of bank leverage but because those variables may be endogenous, we
include only the variables of interest in this version, including bank fixed effects to account for unobserved bank
heterogeneity.
14

not significant for 2001 to 2008 (meaning these years are similar to 2000) except for the Monitoring
Index (for all banks) for which leverage is lower during 2001–2008 than 2000 in countries where
these variables are higher (meaning stricter regulation). More interesting is the result that more
restrictive regulation is associated with a relatively higher leverage in 2009.17 We interpret this in
the light of the time series patterns observed in the figures. Banks with high leverage and relatively
risky assets displayed strongly declining leverage after 2008 when assets were written down. As
discussed previously, standard leverage measures did not flag that the assets on many banks’ balance
sheets were questionable—this only became apparent when assets lost significant value in 2008 and
2009. If a restrictive regulatory environment helped banks stay on a straight and narrow path in
terms of asset quality, this should be visible only when the banks in lightly regulated countries were
deleveraging during the crisis. The positive coefficient associated with strict regulation implies that
countries with strict regulation deleveraged less which we interpret to mean that banks in those
countries on average held higher quality assets and/or avoided risk exposure through guarantees to
off-balance sheet entities. The coefficient to, say, Supervision Index of 0.291 implies that a change
from less restrictive to more restrictive leads to a change in the leverage ratio of about 0.3. If the
initial leverage ratio was 0.9 the new leverage predicted ratio is 1.2—a rather substantial increase in
leverage. Or rather, substantially less deleveraging because all results are relative. The implication
is that the underlying problems in asset quality and, therefore, the vulnerability of the real economy
may be significantly impacted by regulatory constraint.
5 Robustness and Other Issues
5.1 Other Determinants of Leverage: Banks and Firms
What about the role of cash holdings? Appendix Figures 10 and 11 display median and aggregate
cash holdings of US banks and European banks, respectively. For the US, cash holdings increased
slower than aggregate assets before the crisis but this would not have signalled an increase in risk
taking. The US data displays a highly pronounced spike in 2009 which reflects the breakdown of
interbank lending during the crisis when the interbank lending market froze as banks’ feared that
counter-parties might be in danger of failure. The banks, therefore, held assets on their books
leading to the spike in cash while the Federal Reserve lent directly to banks needing short-term
17At the time of this writing, the data set is not complete for 2009 where our sample is significantly smaller than
in the other years, so the results are subject to this caveat.
15

financing.18 For Europe, the picture is one of steadily increasing cash holdings, roughly mirroring
the increase in assets.
We performed firm-level regressions for non-financial firms but there was no visible increase
or decrease in leverage of the non-financial firms before and/or after the crisis. We have checked
whether this can be explained by firms’ cash holdings but cash holdings do not display significant
time variation. These results are available upon request.
5.2 The Role of Conduits
Acharya, Schnabl, and Suarez (2010) show that commercial banks set up conduits to securitize
assets—specifically Asset Backed Commercial Paper (ABCP)—without transferring risk to outside
investors. These conduits were designed to avoid capital charges and commercial banks facing more
stringent capital requirements were more likely to set up conduits with guarantees implying that
risk was not transferred outside of the banking system.
Conduits are independent shell companies sponsored by large financial institutions. Acharya,
Schnabl, and Suarez (2010) use a hand-collected data set on the universe of conduits from Jan-
uary 2001 to December 2008 and their sponsors. They show that almost all conduits have credit
guarantees issued by large financial institutions. We do not have these conduits in our data but
we have the sponsors. The data on guarantees and committed credit lines displayed previously
include the credit guarantees to conduits because these are explicit commitments of the sponsor
banks. Acharya, Schnabl, and Suarez (2010) report that investors in conduits only lost 1.7% of
their investments in ABCP because guarantees were called and the assets were liquidated and looses
absorbed by the sponsoring banks. Our figures are consistent with this fact. Thus, it is clear that
much of the deleveraging process is closely linked to these conduits and their sponsor banks.
Did banks with conduits have different leverage? Most conduit sponsor banks are large com-
mercial banks: only 3 out of 62 sponsors in our data are investment banks. In order to investigate
if sponsor banks had different leverage on their balance sheets, we plotted all our figures dropping
all conduit sponsor banks from our permanent sample. This had very little effect on the figures
which therefore are not reported.
18In order to limit any potential inflationary impact of the large reserves the Federal Reserve, for the first time in
its history, began paying interest on reserves in October 2008. In effect, the Federal Reserve acts as an intermediary
between banks with excess funds and banks wishing to lend. This mechanism is explained in detail in Keister and
McAndrews (2009).
16

5.3 The Role of Mergers and Government
During the crisis, several large commercial banks acquired investment banks, notably JP Morgan’s
takeover of Bear Stearns in 2008 and Bank of America’s takeover of Merrill Lynch in January
2009. We do not control for these mergers which took place mid to end of 2008/beginning of 2009.
It is most likely the case that the mergers will not cause an immediate increase in the assets of
the commercial bank but over time, as the securities held by the acquired banks are transferred,
we should see a rise in the assets of the commercial bank. Thus, this is a potentially important
issue if we want to trace changes in leverage and assets through the end of 2010 since Bank of
America’s and JP Morgan’s assets may increase as a result of the acquisitions. The same issue
may effect the acquired banks but He, Khang, and Krishnamurthy (2010) do not observe any
change in Merrill Lynch’s asset holdings in the first quarter of 2009. Other investment banks were
not acquired but ceased to be investment banks and converted into bank holding companies, in
particular Goldman Sachs and Morgan Stanley but even after being converted into holding company
status, the commercial banking operations represent a very small fraction of the business of these
banks.
The government played a very active role in recapitalizing banks. He, Khang, and Krishna-
murthy (2010) suggest that the preferred stock owned by the government must be subtracted from
equity in calculating “true leverage.” They find, using data from the Federal Deposit Insurance
Corporation, that such a correction raises the leverage of the top 19 commercial banks in the US
from 10.0 to 14.4 in the first quarter of 2009. They further argue that “true leverage” may have been
as high as 30 if assets were marked to market. While they were able to roughly impute the fall in
the value of banks’ asset during the peak of the crises for the commercial banking sector as a whole
and for some major banks, it is not easy to do so systematically bank-by-bank over our sample and
hence we do not perform such an exercise. We also do not perform an adjustment on the govern-
ment owned stock because if the purpose of measuring leverage is to gauge the riskiness of banks,
surely government owned preferred equity helps buffer risk. We report asset and equity holdings
and leverage of big investment and commercial banks from the US and Europe in Table 5. Our
numbers match He, Khang, and Krishnamurthy (2010) for investment banks but for commercial
banks we find a smaller increase in 2008 because we do not adjust for government owned equity.
A final difference is that they focus on subsidiaries and, most likely unconsolidated statements,
since they drop holding companies. (One has to use either consolidated or the non-consolidated
statements in order to avoid double counting.) In our empirical analysis, we use unconsolidated
17

accounts for non-investment (commercial) banks and for investment banks we use consolidated
accounts throughout because these banks only report consolidated statements. For the purpose of
Table 5, we use consolidated statements and include holding companies for both commercial and
investment banks in order to make a meaningful comparison between the two groups.
6 Conclusion
Traditional leverage ratios and off-balance sheet exposure did not signal high levels of risk taking
by commercial banks the US and other countries before the sub-prime financial crises. However,
investment banks in the US and large European banks with investment banking arms aggressively
increased leverage, especially after the SEC 2004 deregulation in the US.
Our results are not informative about whether banks knowingly took high risk. Nonetheless,
when the crisis broke in 2007–2008, the banks in countries with large exposure to sub-prime assets
suffered large declines in assets. There was little relation between leverage and restrictiveness of
regulation across countries before 2008 but the countries with stricter bank regulation were less
affected by the crises implying that regulation may well have benefits even if these benefits are
invisible until the economy faces a major stress event.
18

References
Acharya, V.V., Schnabl, P., 2009. How Banks Played the Leverage Game, in: Acharya, V.V.
and Richardson, M. (Eds.), Restoring Financial Stability: How to Repair a Failed System,
chapter 2, John Wiley & Sons, New York, pp. 83–100.
Acharya, V.V., Schnabl, P., Suarez, G., 2010. Securitization without Risk Transfer. NBER
working paper no. 15730.
Adrian, T., Shin H., 2008. Financial Intermediary Leverage and Value-at-Risk. Federal Reserve
Bank of New York Staff Reports no. 338.
Adrian, T., Shin H., 2009. Money, Liquidity, and Monetary Policy. American Economic Review
99, 600-605.
Adrian, T., Shin H., 2010. Liquidity and Leverage. Journal of Financial Intermediation 19,
418–437.
Allen, F., Carletti, E., Marquez, R., 2009. Credit Market Competition and Capital Regulation.
Review of Financial Studies, forthcoming.
Almeida, H., Campello, M., Weisbach, M., 2004. The Cash Flow Sensitivity of Cash. Journal of
Finance 59, 1777–1804.
Arellano, C., Bai, Y., 2010. Financial Markets and Fluctuations in Uncertainty. Federal Reserve
Bank of Minneapolis Research Department Staff Report.
Barth, J., Caprio, G., Levine, R., 2007. Bank Regulation and Supervision (updated data set).
World Bank working paper series no. 2588.
Beltratti, A., Stulz, R.M., 2011. The Credit Crises Around the Globe: Why Did Some Banks
Perform Better? Fisher College of Business, working paper no. 2010-05.
Berger, A., Klapper, L.F., Turk-Ariss, R., 2008. Bank Competition and Financial Stability. World
Bank working paper no. 4696.
Bernanke, B.S., Gertler, M., 1995. Inside the Black Box: The Credit Channel of Monetary Policy
Transmission. Journal of Economic Perspectives 9, 27–48.
19

Black, S., Strahan, E., 2002. Entrepreneurship and Bank Credit Availability. Journal of Finance
57, 2807–2833.
Blundell-Wignall, A., Atkinson, P., 2010. Thinking Beyond Basel III: Necessary Solutions for
Capital and Liquidity. OECD Journal: Financial Market Trends 2010.
Booth, L., Aivazian, V., Demirguc-Kunt, A., Maksimovic, V., 2001. Capital Structures in Devel-
oping Countries. Journal of Finance 56, 87–130.
Brunnermeier, M., 2009. Deciphering the 2007/8 Liquidity and Credit Crunch. Journal of Eco-
nomic Perspectives 23, 77-100.
Brunnermeier, M., Pedersen, L., 2009. Market Liquidity and Funding Liquidity. Review of Fi-
nancial Studies 22, 2201–2238.
Claessens, S., Laeven, L., 2004. What Drives Bank Competition? Some International Evidence.
Journal of Money, Credit and Banking 36, 563–583.
Coricelli, F., Driffield, N., Pal, S., Roland, I., 2009. Excess Leverage and Productivity Growth in
Emerging Economies: Is There a Threshold Effect? CEPR discussion paper no. 7617.
Diamond, D., Rajan, R., 2000. A Theory of Bank Capital. Journal of Finance 55, 2431–2465.
Duffie, D., 2010. The Failure Mechanics of Dealer Banks. Journal of Economic Perspectives 24,
51–72.
Farhi, E., Tirole, J., 2010. Bubbly Liquidity. NBER working paper no. 16750.
Flannery, M., 1994. Debt Maturity and the Deadweight Cost of Leverage: Optimally Financing
Banking Firms. American Economic Review 84, 320–331.
Flannery, M., Sorescu, M., 1996. Evidence of Bank Market Discipline in Subordinated Debenture
Yields: 1983–1991. Journal of Finance 51, 1347–1377.
Flannery, M., Rangan, K., 2008. What Caused the Bank Capital Build-Up of the 1990s? Review
of Finance 12, 391–429.
Fons-Rosen, C., Kalemli-Ozcan, S., Sørensen, B.E., Villegas-Sanchez, C., Volosovych, V., 2011.
Productivity versus Competition Effects of Foreign Investment Within and Across Countries.
University of Houston working paper.
20

Fostel, A., Geanakoplos, J., 2008. Leverage Cycles and the Anxious Economy. American Economic
Review 98, 1211–1244.
Frank, M., Goyal, V., 2004. Capital structure decisions: Which factors are reliably important?
Financial Management 38, 1–37.
Greenlaw, D., Hatzius, J., Kashyap, A., Shin, H., 2008. Leveraged Losses: Lessons from the
Mortgage Market Meltdown. U.S. Monetary Policy Forum report no. 2.
Gropp, R., Heider, F., 2010. The Determinants of Bank Capital Structure. Review of Finance 14,
587-622.
He, Z., Khang, I.G., Krishnamurthy, A., 2010. Balance Sheet Adjustment during the 2008 Crisis.
IMF Economic Review 58, 118–156.
Kalemli-Ozcan, S., Sørensen, B.E., Volosovych, V., 2010. Deep Financial Integration and Volatil-
ity. CEPR discussion paper no. 7784.
Keister, T., McAndrews, J., 2009. Why Are Banks Holding So Many Excess Reserves? Federal
Reserve Bank of New York, Staff Reports no. 380.
Kiyotaki, N., Moore, J., 1997. Credit Cycles. Journal of Political Economy 105, 211–248.
Krishnamurthy, A., 2010. How Debt Markets Have Malfunctioned in the Crisis. Journal of
Economic Perspectives 24, 3-28.
Lemmon, M.L., Roberts, M.R., Zender, J.F., 2008. Back to the Beginning: Persistence and the
Cross-Section of Corporate Capital Structure. Journal of Finance 63, 1575–1608.
Myers, S., Rajan, R., 1998. The Paradox of Liquidity. Quarterly Journal of Economics 113,
733–771.
Modigliani, F., Miller, M., 1958. The Cost of Capital, Corporation Finance and the Theory of
Investment. American Economic Review 48, 261–297.
Rajan, R., Zingales, L., 1995. What Do We Know About Capital Structure? Some Evidence
From International Data. Journal of Finance 50, 1421–1460.
Shleifer, A., Vishny, R.W., 1992. Liquidation Values and Debt Capacity: A Market Equilibrium
Approach. Journal of Finance 47, 1343–1366.
21
A Data Appendix
We use permanent and non-permanent samples both for banks and firms. The non-permanent
samples are used in regression analysis and in the investigation of cross-sectional patterns. The
permanent samples are used for time-series plots.
A.1 Bank Selection Criteria
The data is from BANKSCOPE for the period 1990–2010. We exclude the first 6 years and the
last year because of poor coverage. We apply the following sample selection criteria to obtain the
samples used in the regression analysis:
• We drop central banks.
• We drop banks with faulty records such as inconsistent information on any generic variables:
date of establishment/type of company/template etc.
• We drop bank-year observations with negative values of assets/capital/reserves or deposits.
In addition to the criteria mentioned, we drop banks that do not report total assets continuously
for 2000–2009. The sample of European banks has 1123 banks with 11,230 observations while the
sample of US banks has 7334 banks with 73,340 observations—both for the period 2000–2009.
For other countries, in addition to above selection criteria:
• We drop countries with less than 20 banks in non-permanent sample.
The final sample has 9437 banks with 85,383 observations for the period 2000–2008.
A.2 Firm Selection Criteria
The time period covered in firm-level data downloaded from the ORBIS and AMADEUS databases
is 1996–2010, however we exclude the last year because of poor coverage.
• We drop firms with faulty records and firms with inconsistent information on any generic
variables such as date of establishment/type of company/template etc.
• We drop firm-year observations with negative values of all types of assets/capital/reserves
and deposits.
22

The following sample selection criteria are applied to obtain the final samples used in the regression
analysis:
• We drop firms if any of total assets, current liabilities, and non-current liabilities is missing
in all years between 1996–2009.
• We drop firms if any of total assets, employment, sales, operating revenue, current liabilities,
and non-current liabilities is negative.
• We drop firms whose total number of employees is lower than 10.
• We drop firms if total assets are less than 100,000 in PPP dollars.
• We drop firms if sales are less than 1000 in PPP dollars.
• We drop firms if operating revenue are less than 1000 in PPP dollars.
• We drop firm-year observations beyond the 0.1% and 99.9% tails of ratios employment/sales,sales/total
assets, operating revenue/total assets, and shareholders funds/total assets
• In the data that covers European firms, we drop countries having less than 100 firms for at
least 6 years between 1996–2009.
• We drop firm-year observations beyond the 0.1% and 99.9% tails of all leverage measures.
• We drop firm-year observations beyond the 0.1% and 99.9% tails for collateral variable defined
as total fixed assets/total assets.
• We drop firm-year observations beyond the 0.1% and 99.9% tails for all profitability measures.
The resulting samples consist of 54,108 firms with 152,124 observations and 234,380 firms with
1,495,671 observations for the US firm-level sample and the European firm-level sample, respec-
tively.
A.3 Bank-Level Variables
Total Assets: Total book value of intangible, tangible, and other fixed assets.
Shareholder’s Funds: Book value of equity (issued share capital plus other shareholders fund)
23

Off-Balance Sheet Items: In financial statement of banks, off-balance sheet volumes are listed
in three summary lines of acceptances, documentary credits, and guarantees.
Guarantees : Total amount guaranteed by the bank.
Acceptances (reported off-balance sheet): Total amounts the bank “accepts” to pay, usually
under international trade finance arrangements where reported off-balance sheet.
Committed credit lines: Total committed and undrawn lines of credit extended by the bank.
Adjusted Assets: Book value of total assets excluding goodwill and intangibles.
A.4 Firm-Level Variables
Total Assets: Total book value of intangible, tangible, and other fixed assets.
Shareholder’s Funds: Book value of equity (issued share capital plus other shareholder funds).
Total Liabilities: Total book value of current (all current liabilities of the company such as
Loans+ Creditors+ Other current liabilities) and non-current liabilities (all long term liabilities of
the company such as Long term financial debt+other long term liabilities and provisions).
A.5 Country-Level Data
We use the Barth, Caprio, and Levine data set on Bank Regulation. It provides information on
bank regulation and supervisory practice for 107 countries and provides aggregate indexes based
on responses to a survey.19 We use the 2003 values of the following variables: 1) “Supervision
Index,” which measures the efficiency of supervision and takes a value of 1 if there are multiple
independent supervisors for banks and zero otherwise and 2) “Monitoring Index,” which measures
the efficiency of monitoring and takes a value of 1 if the top ten banks in the country are all rated
by international rating agencies, if off-balance sheet items are disclosed to public, if banks must
disclose risk management procedures to the public, and if subordinated debt is required as part of
regulatory capital and zero otherwise.
19For the details on the survey questions and data collection process, see Barth, Caprio, and Levine (2007).
24

Table 1: Firms and Banks Across Countries, 2000–2009: Number of Observations by Country
Country Bank-Year Firm-Year(Europe and US Only)
ARGENTINA 1404AUSTRALIA 1384AUSTRIA 2996 5225AZERBAIJAN 180BANGLADESH 412BELGIUM 1420 67385BOSNIA 249BRAZIL 2248BULGARIA 333 11585CANADA 963CHILE 547CHINA 993COLOMBIA 507COSTA RICA 861CROATIA 509 11277CZECH REPUBLIC 449 37078DENMARK 1812 23231EGYPT 478EL SALVADOR 272ESTONIA 160 5847FINLAND 350 32318FRANCE 6809 182857GEORGIA 125GERMANY 22981 104191GHANA 337GREECE 472HONG KONG 1647HUNGARY 553 21703ICELAND 262 2163INDIA 1318INDONESIA 846IRELAND 914 13141ISRAEL 332ITALY 9891 163632JAPAN 10079KENYA 671KOREA REP. OF 810LATVIA 365 6399LITHUANIA 198 6564LUXEMBOURG 1617 2592MALAYSIA 1514MEXICO 770NETHERLANDS 1345 29182NEW ZEALAND 280NORWAY 1474 30479PARAGUAY 230PERU 395PHILIPPINES 718POLAND 695 72030PORTUGAL 765 34732ROMANIA 366 16891RUSSIA 5889 154729SERBIA 345 19796SINGAPORE 816SLOVAKIA 290 7989SLOVENIA 337 4239SOUTH AFRICA 980SPAIN 3069 133102SWEDEN 1343 81489SWITZERLAND 6104 4646TAIWAN 1237THAILAND 661TURKEY 946UKRAINE 555 16099UNITED KINGDOM 6533 183959URUGUAY 464USA 112116 139026VENEZUELA 619
TOTAL 229610 1675576
Notes: Banks are defined broadly to include financial firms such as credit card companies, private equity firms, hedge
funds, broker-dealers, specialized credit institutions, etc. Firms are non-financial firms from Europe and the US with
more than 150 employees.
25

Table 2: Firms and Banks Across Countries, 2000–2009: Observations by Type
BANKS
World Europe US
All 30056 14680 13964
Investment 975 402 138Commercial 29081 14278 13826
Consolidated 6826 2612 3246Unconsolidated 23201 10978 10606
Listed 3351 1164 1074Unlisted 26705 13516 12890
FIRMS
Europe US
All 227295 53666
Financial 1466 6632Non-Financial 225829 47034
Consolidated 42451 16486Unconsolidated 184844 37180
Listed 10476 8875Unlisted 216819 44791
Notes: Consolidated and unconsolidated refer to the number of banks/firms with consolidated and unconsolidated
statements, respectively. Listed indicates the number of banks/firms that are listed on a stock exchange. Financial
firms are firms with Primary NACE Rev. 1.1 sector code J: Financial intermediation.
26

Table 3: Descriptive Statistics 2000–2009
Panel A: All BanksN Mean Min Max
Leverage Ratio 180460 12.4 1.3 46.3Total Assets (billion USD) 180553 11.5 0 3663.3
Adjusted Assets (billion USD) 141669 9.3 -36.9 3318.9Equity (billion USD) 180504 0.8 -92.9 3472.3
Off Balance Sheet 79573 0.0 0 5.2(ratio of Total Assets)
Panel B: Investment BanksN Mean Min Max
Leverage Ratio 4101 13.6 1.3 46.3Total Assets (billion USD) 4103 26.6 0 1599.6
Adjusted Assets (billion USD) 1890 32.2 0 1258.2Equity (billion USD) 4103 1.1 -9 106
Off Balance Sheet 34 0.1 0 1.9(ratio of Total Assets)
Panel C: Large Non-Investment BanksN Mean Min Max
Leverage Ratio 33664 17.4 1.3 46.3Total Assets (billion USD) 33673 38.9 0 3663.3
Adjusted Assets (billion USD) 20837 35.4 0 2332.6Equity (billion USD) 33667 2.8 -92.9 543.5
Off Balance Sheet 1601 0.0 0 1.7(ratio of Total Assets)
Panel D: Sponsor BanksN Mean Min Max
Leverage Ratio 404 22.7 1.3 46.3Total Assets (billion USD) 404 490.3 0.1 3335.8
Adjusted Assets (billion USD) 366 514.2 0.1 3318.9Equity (billion USD) 404 22.8 -1.8 198
Off Balance Sheet 11 0.0 0 0.1(ratio of Total Assets)
Panel E: Non-Sponsor BanksN Mean Min Max
Leverage Ratio 180056 12.4 1.3 46.3Total Assets (billion USD) 180149 10.4 0 3663.3
Adjusted Assets (billion USD) 141303 8 -36.9 3318.8Equity (billion USD) 180100 0.7 -92.9 3472.3
Off Balance Sheet 79562 0.0 0 5.2(ratio of Total Assets)
Notes: The data is winsorized at 2% and 98% before splitting into groups which explains why some extreme values
are identical. In Panel A, statistics are given for all banks while Panels B and C display statistics for investment
and large non-investment banks, respectively. Panel D displays statistics of conduit sponsor banks. The names of
the sponsor banks are taken from Acharya and Schnabl (2009). There are 70 conduit sponsor banks in their data
set, of which we have located 62 in our data set. 31 of these banks are European, 23 are US, 4 are Australian, 3 are
Japanese and 1 bank is Canadian. In Panel E, non-sponsor bank statistics are shown separately. Leverage ratio is
defined as the ratio of total assets to equity. Totals assets are composed of tangible and intangible assets. Adjusted
assets exclude goodwill and intangibles. Equity is measured as shareholder funds. Off-Balance sheet items are the
sum of guarantees and committed credit lines. A “large bank” has more than one billion dollars worth of assets in
2000. All non-ratio items are in 2005 dollars. 27

Tab
le4:
Ban
kL
ever
age:
2000
–200
9,W
orld
Sam
ple
Dep
enden
tV
ari
able
:B
ank
Lev
erage
(1)
(2)
(3)
Bank
Sam
ple
All
All
Larg
e
Reg
ula
tory
/In
stit
uti
onal
(R/I)
Sup
ervis
ion
Monit
ori
ng
Monit
ori
ng
Fra
mew
ork
Index
Index
Index
2001×
R/I
Fra
mew
ork
0.0
12**
–0.0
05*
-0.0
07
(0.0
05)
(0.0
03)
(0.0
05)
2002×
R/I
Fra
mew
ork
0.0
06
–0.0
11***
-0.0
06
(0.0
06)
(0.0
03)
(0.0
06)
2003×
R/I
Fra
mew
ork
–0.0
10
–0.0
14***
0.0
01
(0.0
07)
(0.0
04)
(0.0
06)
2004×
R/I
Fra
mew
ork
–0.0
03
–0.0
11***
-0.0
02
(0.0
07)
(0.0
04)
(0.0
07)
2005×
R/I
Fra
mew
ork
–0.0
13*
–0.0
11**
-0.0
09
(0.0
08)
(0.0
04)
(0.0
09)
2006×
R/I
Fra
mew
ork
–0.0
48***
–0.0
21***
-0.0
17
(0.0
09)
(0.0
05)
(0.0
11)
2007×
R/I
Fra
mew
ork
–0.0
54***
–0.0
24***
-0.0
16
(0.0
09)
(0.0
05)
(0.0
11)
2008×
R/I
Fra
mew
ork
–0.0
11
–0.0
09
0.0
07
(0.0
1)
(0.0
07)
(0.0
12)
2009×
R/I
Fra
mew
ork
0.2
91***
0.1
40***
0.0
73***
(0.0
56)
(0.0
51)
(0.0
19)
Bank
dum
mie
sY
esY
esY
esY
ear
dum
mie
sY
esY
esY
es
R2
0.0
08
0.0
08
0.0
15
N172344
136360
22116
Note
s:L
ever
age
isth
elo
gari
thm
of
tota
lass
ets
over
equ
ity.
Sta
nd
ard
erro
rsin
pare
nth
eses
,cl
ust
ered
at
the
ban
kle
vel
.T
he
main
regre
ssors
are
cou
ntr
y-l
evel
vari
ab
les
that
cap
ture
the
regu
lato
ryan
din
stit
uti
on
al
fram
ework
(th
eex
act
vari
ab
len
am
eis
giv
enin
each
colu
mn
’sh
ead
ing),
inte
ract
edw
ith
tim
ed
um
mie
s.C
olu
mn
(3)
lim
its
the
sam
ple
tola
rge
ban
ks
wit
hm
ore
than
ab
illion
doll
ars
inass
ets
in2000.
All
regre
ssio
nvari
ab
les
are
win
sori
zed
at
2%
an
d98%
.2000
isth
eom
itte
dyea
r.
Su
per
vis
ion
ind
exm
easu
res
the
effici
ency
of
sup
ervis
ion
an
dta
kes
avalu
eof
1if
ther
eare
mu
ltip
lein
dep
end
ent
sup
ervis
ors
for
ban
ks
an
dze
rooth
erw
ise.
Mon
itori
ng
ind
exm
easu
res
the
effici
ency
of
mon
itori
ng
an
dta
kes
avalu
eof
1if
top
ten
ban
ks
inth
eco
untr
yare
all
rate
dby
inte
rnati
on
al
rati
ng
agen
cies
,if
off
-bala
nce
shee
t
item
sare
dis
close
dto
pu
bli
c,if
ban
ks
mu
std
iscl
ose
risk
man
agem
ent
pro
ced
ure
sto
the
pu
blic,
an
dif
sub
ord
inate
dd
ebt
isre
qu
ired
as
part
of
regu
lato
ryca
pit
al.
Th
isin
dex
isze
rooth
erw
ise.
Th
ese
vari
ab
les
are
from
the
Bart
h,
Cap
rio,
an
dL
evin
e(2
010),
Ban
kR
egu
lati
on
an
dS
up
ervis
ion
Data
Set
.S
eeT
ab
le1
for
the
set
of
cou
ntr
ies
inth
ew
orl
dsa
mp
le.
28

Table 5: Leverage of Very Large Banks
(2007) (2008)
Assets Equity Leverage Assets Equity Leverage
Bank of America 1616 138.3 11.7 1648.9 160.6 10.3Bear Stearns 372.4 11.1 33.5 N.A. N.A. N.A.
Citigroup 2060.5 112 18.4 1758.2 130.6 13.5Goldman Sachs 1054.7 47.2 22.4 802.3 59.9 13.4
JP Morgan 1471.4 116.9 12.6 1972.8 152.4 12.9Lehman Brothers 650.9 21.2 30.7 N.A. N.A. N.A.
Merrill Lynch 960.8 30.1 31.9 605.5 18.1 33.4Morgan Stanley 984.7 29.5 33.4 597.6 46.1 13
Wells Fargo 542 45.1 12 1187.9 92.8 12.8
BNP Paribas 71.4 4.8 14.9 N.A. N.A. N.A.Barclays 2073.8 54.1 38.3 3335.7 77 43.3
Deutsche Bank 2315.9 47.3 49 N.A. N.A. N.A.Fortis Bank 331.3 27.3 12.1 N.A. N.A. N.A.
RBS 3211.1 154.5 20.8 3051.3 76.8 39.7UBS 1.5 0.2 6.4 N.A. N.A. N.A.
Notes: Leverage is defined as the ratio of total assets to equity. Total assets are composed of tangible and intangible
assets. Equity is measured as shareholder funds. All non-ratio items are in billion 2005 dollars.
29

Figure 1: Financial Sector Assets
Panel A: Flow of Funds Data: US
0 2 4 6 8 10 12 14Aggregate Assets
2000q1
2001q1
2002q1
2003q1
2004q1
2005q1
2006q1
2007q1
2008q1
2009q1
2010q1
Com
mercial B
anks, Savings Institutions, Credit U
nions
Brokers D
ealers
Panel B: Bankscope Micro Data, Aggregated: US
2 4 6 8 10 12 14 16 18 20Aggregated Assets
2000
2001
2002
2003
2004
2005
2006
2007
2008
2009
All B
anks
Large B
anks (no Inv.)
Investment B
anks
Large B
anks
Panel C: Bankscope Micro Data, Aggregated: Europe
1112
1314
1516
1718
1920
21A
ggre
gate
d A
sset
s
2000
2001
2002
2003
2004
2005
2006
2007
2008
2009
All Banks Large Banks
Notes: Panel A displays financial sector assets from the Flow of Funds. The numbers are in trillion 2005 dollars,
deflated by the GDP deflator. Panels B and C display total assets aggregated from our bank-level data for different
group of banks for US and Europe, respectively. The numbers are in trillion 2005 dollars, deflated by the consumer
price index. Total assets is defined as total book value of intangible, tangible, and other fixed assets. A “large bank”
has more than one billion dollars worth of assets in 2000.
30

Figure 2: Risk Weighted versus Non-Risk Weighted Assets
Bankscope Micro Data, Aggregated: US
24
68
1012
1416
1820
Agg
rega
ted
Ass
ets
2000
2001
2002
2003
2004
2005
2006
2007
2008
All Banks (TOAS) Large Banks (TOAS)
All Banks (RWA) Large Banks (RWA)
Notes: The data plotted is aggregated from bank-level data and is denominated in trillion 2005 dollars. Total assets
(TOAS) is defined as total book value of intangible, tangible, and other fixed assets. Risk-Weighted Assets (RWA)
are weighted according to riskiness with weights determined by regulators. Bank can choose weights according to a
“simple rule,” for which the weights are 0 for government and other public assets, 20% for liabilities of other banks
and securities firms, 35% for secured mortgages, 75% for personal lending, and 100% for corporate and commercial
lending. A “sophisticated rule,” used by larger banks, include more subcategories based on credit rankings; se
Blundell-Wignall and Atkinson (2010) for more details. A “large bank” has more than one billion dollars worth of
assets in 2000.
31

Figure 3: Financial Sector Equity
Panel A: Flow of Funds Data: US
0 .2 .4 .6 .8 1Aggregate Equity
2000q1
2001q1
2002q1
2003q1
2004q1
2005q1
2006q1
2007q1
2008q1
2009q1
2010q1
Com
mercial B
anks, Savings Institutions, Credit U
nions
Brokers D
ealers
Panel B: Bankscope Micro Data, Aggregated: US
0 .2 .4 .6 .8 1 1.2 1.4 1.6 1.8Aggregated Equity
2000
2001
2002
2003
2004
2005
2006
2007
2008
2009
All B
anksL
arge Banks (no Inv.)
Investment B
anksL
arge Banks
Panel C: Bankscope Micro Data, Aggregated: Europe
.5.5
5.6
.65
.7.7
5.8
.85
.9.9
5A
ggre
gate
d E
quity
2000
2001
2002
2003
2004
2005
2006
2007
2008
2009
All Banks Large Banks
Notes: Panel A displays financial sector equity from Flow of Funds data. The numbers are deflated by the GDP
deflator and displayed in trillion 2005 dollars. Panels B and C display banks’ equity aggregated from our bank-level
data for different group of banks in the US and Europe, respectively. The numbers are deflated by the consumer
price index and is reported in trillion dollars. Equity is measured as shareholder funds. A “large bank” has more
than one billion dollars worth of assets in 2000.
32
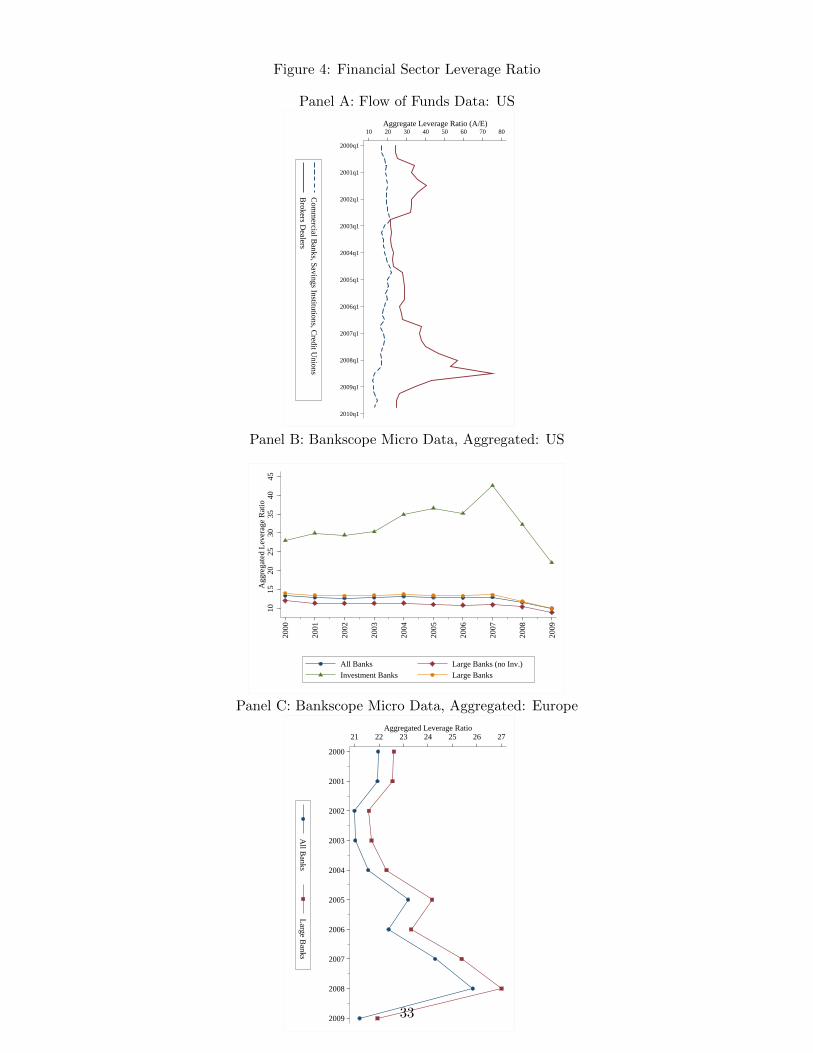
Figure 4: Financial Sector Leverage Ratio
Panel A: Flow of Funds Data: US
10 20 30 40 50 60 70 80Aggregate Leverage Ratio (A/E)
2000q1
2001q1
2002q1
2003q1
2004q1
2005q1
2006q1
2007q1
2008q1
2009q1
2010q1
Com
mercial B
anks, Savings Institutions, Credit U
nions
Brokers D
ealers
Panel B: Bankscope Micro Data, Aggregated: US
1015
2025
3035
4045
Agg
rega
ted
Lev
erag
e R
atio
2000
2001
2002
2003
2004
2005
2006
2007
2008
2009
All Banks Large Banks (no Inv.)
Investment Banks Large Banks
Panel C: Bankscope Micro Data, Aggregated: Europe
21 22 23 24 25 26 27Aggregated Leverage Ratio
2000
2001
2002
2003
2004
2005
2006
2007
2008
2009
All B
anksL
arge Banks
Notes: Panel A displays financial sector leverage ratio in the US, calculated as assets over equity, using sectoral data
from the Flow of Funds. Panels B and C display leverage ratios, calculated from bank-level data for the US and
Europe, respectively. We aggregate bank-level assets and equity for different group of banks and take the ratio of
aggregated assets to aggregated equity. A “large bank” has more than one billion dollars worth of assets in 2000.
33

Figure 5: Financial Sector Leverage Ratio: Typical Bank
Panel A: Bankscope Micro Data, Median: US10
1112
1314
1516
1718
19L
ever
age
Rat
io (
A/E
)
2000
2001
2002
2003
2004
2005
2006
2007
2008
2009
All Banks Large Banks (no Inv.)
Investment Banks Large Banks
Panel B: Bankscope Micro Data, Median: Europe
1516
1718
1920
Lev
erag
e R
atio
(A
/E)
2000
2001
2002
2003
2004
2005
2006
2007
2008
2009
All Banks Large Banks
Notes: Panels A and B display median leverage; that is, the leverage ratio for the typical bank in the US and Europe,
respectively. A “large bank” has more than one billion dollars worth of assets in 2000.
34
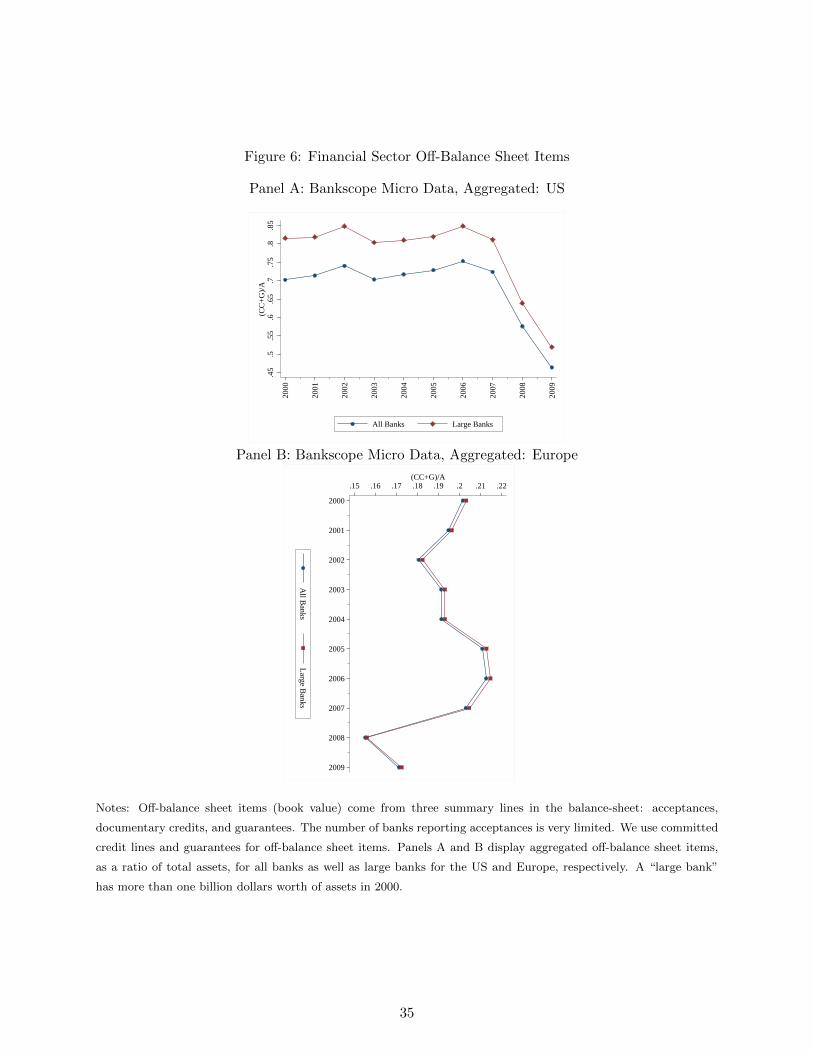
Figure 6: Financial Sector Off-Balance Sheet Items
Panel A: Bankscope Micro Data, Aggregated: US
.45
.5.5
5.6
.65
.7.7
5.8
.85
(CC
+G
)/A
2000
2001
2002
2003
2004
2005
2006
2007
2008
2009
All Banks Large Banks
Panel B: Bankscope Micro Data, Aggregated: Europe
.15 .16 .17 .18 .19 .2 .21 .22(CC+G)/A
2000
2001
2002
2003
2004
2005
2006
2007
2008
2009
All B
anksL
arge Banks
Notes: Off-balance sheet items (book value) come from three summary lines in the balance-sheet: acceptances,
documentary credits, and guarantees. The number of banks reporting acceptances is very limited. We use committed
credit lines and guarantees for off-balance sheet items. Panels A and B display aggregated off-balance sheet items,
as a ratio of total assets, for all banks as well as large banks for the US and Europe, respectively. A “large bank”
has more than one billion dollars worth of assets in 2000.
35

Figure 7: Financial Sector Off-Balance Sheet Items: Typical Bank
Panel A: Bankscope Micro Data, Median: US
.06
.08
.1.1
2.1
4.1
6.1
8.2
.22
.24
(CC
+G
)/A
2000
2001
2002
2003
2004
2005
2006
2007
2008
2009
All Banks Large Banks
Panel B: Bankscope Micro Data, Median: Europe
.055 .06 .065 .07 .075(CC+G)/A
2000
2001
2002
2003
2004
2005
2006
2007
2008
2009
All B
anksL
arge Banks
Notes: Off-balance sheet items come from three summary lines in the balance-sheet in book value: Acceptances,
documentary credits, and guarantees. The number of banks reporting acceptances is very limited. We use committed
credit lines and guarantees for off-balance sheet items. Panels A and B display median off-balance sheet items as a
ratio of total assets for all banks as well as large banks in the US and Europe, respectively. A “large bank” has more
than one billion dollars worth of assets in 2000.
36

Figure 8: Financial Sector Procyclical Leverage Ratio: US
Panel A: Bankscope Micro Data, Mean: US Investment Banks
2009
200020012002
2003
2004
2005
20062007
2008
2009
−.1
5−
.05
.05
.15
.25
Mea
n G
row
th o
f B
ank
Lev
erag
e (A
/E)
−.15 −.05 .05 .15 .25Mean Growth of Bank Assets
Panel B: Bankscope Micro Data, Mean: US Large Banks (exc. inv.)
2009
20002001
20022003
2004
2005
2006
2007
2008
2009
0.0
5.1
.15
.2.2
5.3
Mea
n G
row
th o
f B
ank
Lev
erag
e (A
/E)
0 .05 .1 .15 .2 .25 .3 Mean Growth of Bank Assets
Notes: Panels A and B plot the growth rate of bank leverage, defined as growth rate of assets over equity, against
the growth rate of assets for US investment banks and large US banks excluding investment banks, respectively. A
45 degree line is plotted for easy reference. The growth rates are the mean growth rates across banks for each year.
See notes to previous figures (and/or appendix) for exact definitions of the variables.
37

Ap
pen
dix
Tab
le1:
Inte
rnat
ion
alC
omp
aris
onof
Lev
erag
eR
atio
s:D
escr
ipti
ve
Sta
tist
ics
Panel
A:
US
&E
uro
pean
Banks
2006
2007
2008
2009
2006-2
009
Aggre
gate
dM
ean
Media
nA
ggre
gate
dM
ean
Media
nA
ggre
gate
dM
ean
Media
nA
ggre
gate
dM
ean
Media
nN
US
12.7
10.2
10.2
12.9
10
10
11.6
10.2
10.2
9.9
10.7
10.2
7372
Aust
ria
20.5
71.1
16.2
19
60.3
16.3
20.1
63.2
15.4
19.4
50.9
16.9
49
Belg
ium
15.1
14.3
15.3
12.1
12.2
14
12.6
12.5
12.9
13.2
12.7
12.5
3
Bulg
ari
a7.9
7.9
7.7
8.4
9.8
8.8
7.4
9.6
9.4
6.1
8.4
7.8
6
Cro
ati
a7.2
9.2
9.9
7.2
910.2
6.4
7.6
8.1
6.1
7.1
7.6
6
Cypru
s19.8
19.8
19.8
16.1
16.1
16.1
15.2
15.2
15.2
15
15.3
15.3
2
Czech
Republic
3.9
3.9
3.9
44
44.1
4.1
4.1
5.9
5.9
5.9
1
Denm
ark
16.6
9.8
7.9
17
10.2
8.3
17.9
11.2
8.6
17.8
11.5
9.8
67
Est
onia
12.3
13.5
13.5
11.4
12.8
12.8
10.2
12.2
12.3
11.2
16.9
17.1
4
Fin
land
20.4
56.5
23.4
22.7
81.2
22.6
30.3
327.1
28.2
25.1
58.3
26.1
4
Fra
nce
20.7
21.7
12.8
23.8
22.3
12.3
24.4
23.5
12.3
21.3
34.2
11.6
173
Germ
any
30.7
19.7
17.5
31.7
19.5
17.4
35.8
20.4
17.9
28.5
19.2
17.1
471
Hungary
16.7
16.8
13.9
16.8
17.6
15.1
19.3
18.5
17.3
18.9
16.8
15.7
4
Irela
nd
9.5
99.1
8.1
11.4
69.1
10.4
12.2
47
11.4
7.1
30.1
6.3
5
Latv
ia12.6
11.6
11
10.8
11.8
10
10.3
11.9
12.1
9.6
11.5
11.4
9
Lit
huania
16.2
16.2
16.2
14.5
14.5
14.5
13.9
13.9
13.9
14.2
14.2
14.2
1
Luxem
bourg
27
33.7
24.2
25.1
33.3
24.1
25.1
31.7
25.1
20.2
23.2
18.8
29
Neth
erl
ands
3.3
11
10.4
3.6
10.9
94
14
10.9
3.5
11.1
9.5
5
Rom
ania
9.7
6.3
5.1
11.4
7.5
6.7
9.8
6.2
4.7
9.4
7.7
9.6
3
Russ
ia7
8.3
8.1
7.3
87.9
8.6
9.2
97.6
8.3
8.9
23
Sw
eden
18.1
23.3
18.7
19.2
24.6
13.8
19.7
18.1
16
19.9
24.4
17.9
11
Sw
itzerl
and
7.7
14.4
10.5
8.2
13.7
10.4
8.8
13.5
10.8
9.2
13.9
11
179
Ukra
ine
9.3
8.5
8.4
11.4
11.3
11.3
11.9
11.7
12.1
7.6
11.4
7.7
5
Unit
ed
Kin
gdom
30.4
17.4
15.6
32.3
18
15.5
32.1
16.7
14.5
16.8
12.5
13.4
67
Table
tob
eC
onti
nued
38

Ap
pen
dix
Tab
le1
(conti
nu
ed):
Inte
rnat
ion
alC
omp
aris
onof
Lev
erag
eR
atio
s:D
escr
ipti
veS
tati
stic
s
Panel
B:
Countr
ies
inR
est
of
the
Worl
d
2006
2007
2008
2006-2
008
Aggre
gate
dM
ean
Media
nA
ggre
gate
dM
ean
Media
nA
ggre
gate
dM
ean
Media
nN
Arg
enti
na
7.5
6.9
6.7
7.7
7.2
6.5
8.3
7.4
7.2
58
Azerb
aij
an
12.5
10.4
11.6
11
10.1
10.6
9.7
8.7
9.2
3
Bangla
desh
33.8
12.3
16.5
18.8
17.6
15
17
16.1
15.5
11
Bra
zil
11.6
10
8.8
11.3
10.1
7.7
12.7
10.2
9.1
46
Canada
20.5
20.5
13.1
21.6
18.9
14.1
21.8
28.2
13.4
39
Chin
a44.7
30.8
27.9
-21.8
19
18.3
23.7
20.5
20.8
13
Colo
mbia
7.8
8.5
9.1
88.7
9.9
8.3
8.6
9.1
17
Cost
aR
ica
99.8
10.9
9.4
9.6
10
99.1
9.2
25
El
Salv
ador
8.3
7.9
8.3
8.2
8.4
8.7
7.6
88.1
13
Georg
ia3.2
3.2
3.2
5.3
5.3
5.3
4.5
4.5
4.5
1
India
14.8
14.8
15.6
15.6
15.2
15.6
13.6
14.8
15.2
63
Indonesi
a9.4
8.8
9.7
9.6
8.6
9.3
10.6
9.7
10.2
16
Isra
el
16.3
17
17.1
15.6
16.3
15.9
16.8
17.6
16.5
7
Japan
18
35.2
18.8
16.8
19.8
18.2
18.5
25.9
19.9
710
Kenya
8.9
8.3
8.7
8.5
7.6
7.8
87.6
7.4
12
Kore
a14
14.5
14.9
14.1
14.3
15.5
16.4
15.7
16.6
19
Mala
ysi
a12.7
11
12.7
13
11.6
13
12.6
10.8
13.1
31
Mexic
o7.7
88.5
7.5
8.5
8.5
10.8
13.3
13.4
15
Norw
ay
6.6
10.7
9.4
7.9
11.4
9.9
8.8
11.8
10.7
10
Para
guay
7.9
87.9
99.3
9.2
8.9
9.3
8.9
12
Peru
10.2
10.1
10.3
11.5
10.9
11.9
12.6
12.4
11.8
13
Slo
vakia
12.2
18.3
16.2
13.3
17.3
15.8
13.5
19.6
14.1
3
Slo
venia
11.8
12.1
12.5
12.2
11.4
11.2
12.5
11.8
11.8
4
Thailand
11.5
13.5
10.8
10.6
27.2
10.1
10.8
13.1
10.8
24
Turk
ey
9.3
10.7
8.9
8.2
9.3
7.8
8.6
8.7
8.7
11
Uru
guay
2.4
2.4
2.4
3.1
3.1
3.1
5.3
5.3
5.3
1
Venezuela
11.8
11.5
11.5
11.3
11.8
11.9
11.1
11.5
11.2
8
Note
s:A
ggre
gate
,m
ean,
and
media
nle
vera
ge
rati
os
and
num
ber
of
banks
inth
esa
mple
are
rep
ort
ed
by
countr
y.
Levera
ge
iscalc
ula
ted
as
tota
lass
ets
over
equit
yw
here
tota
lass
ets
isdefi
ned
as
tota
lb
ook
valu
eof
inta
ngib
le,
tangib
le,
and
oth
er
fixed
ass
ets
.A
ggre
gate
levera
ge
iscalc
ula
ted
as
aggre
gate
dass
ets
over
aggre
gate
dequit
y,
wit
hbank-l
evel
obse
rvati
ons
aggre
gate
dby
the
auth
ors
.T
he
num
ber
of
banks
rep
ort
ed
are
low
er
than
the
num
ber
of
banks
use
din
the
regre
ssio
nanaly
sis
because
they
refe
rto
the
perm
anent
bank
sam
ple
,defi
ned
as
banks
wit
hnon-m
issi
ng
ass
et
data
thro
ughout
the
sam
ple
peri
od.
39

Figure 9: Appendix Figure: Non-Financial Sector Leverage Ratio
Panel A: ORBIS Micro Data, Mean: US
2.2
2.3
2.4
2.5
2.6
2.7
Lev
erag
e R
atio
(A
/E)
2004
2005
2006
2007
2008
2009
All Non−Financial Firms
Listed Non−Financial Firms
Foreign Non−Financial Firms
Panel B: AMADEUS Micro Data, Mean: Europe
2.5
33.
54
4.5
55.
5L
ever
age
Rat
io (
A/E
)
2000
2001
2002
2003
2004
2005
2006
2007
2008
All Non−Financial Firms
Listed Non−Financial Firms
Foreign Non−Financial Firms
Notes: Panels A and B display mean leverage for non-financial firms in US and Europe, respectively. The leverage
ratio is defined as total assets over equity. Non-financial firms refer to all firms, excluding financial firms with
Primary NACE Rev. 1.1 sector code J (Financial intermediation). Listed non-financial firms are those listed on a
stock exchange. Foreign non-financial firms are non-financial firms which are foreign owned, defined as more than
10% of their voting shares owned by a foreign company.
40

Figure 10: Appendix Figure: Cash Holdings of US Banks
Panel A: ORBIS Micro Data, Aggregate Cash Holdings, US Banks
.02
.025
.03
.035
.04
.045
.05
.055
.06
.065
.07
Cas
h/A
sset
s
2000
2001
2002
2003
2004
2005
2006
2007
2008
2009
All Banks Large Banks
Panel B: ORBIS Micro Data, Median US Bank Cash Holdings
.02
.025
.03
.035
.04
.045
.05
Cas
h/A
sset
s
2000
2001
2002
2003
2004
2005
2006
2007
2008
2009
All Banks Large Banks
Notes: Panel A displays cash holdings as a ratio of assets for all banks in the US, as well as for large banks, aggregated
from bank-level data. Panel B displays the median of the cash holdings ratio for all banks and large banks. A “large
bank” has more than one billion dollars worth of assets in 2000.
41

Figure 11: Appendix Figure: Cash Holdings of European Banks
Panel A: ORBIS Micro Data, Aggregate Cash Holdings, European Banks
.01 .012 .014 .016 .018 .02Cash/Assets
2000
2001
2002
2003
2004
2005
2006
2007
2008
2009
All B
anksL
arge Banks
Panel B: ORBIS Micro Data, Median European Bank Cash Holdings
.011 .012 .013 .014 .015 .016 .017 .018 .019Cash/Assets
2000
2001
2002
2003
2004
2005
2006
2007
2008
2009
All B
anksL
arge Banks
Notes: Panel A displays cash holdings as a ratio of total assets for all banks in Europe, as well as for large banks,
aggregated from bank-level data. Panel B displays the median of cash holdings of all banks as well as of large banks.
A “large bank” has more than one billion dollars worth of assets in 2000.
42
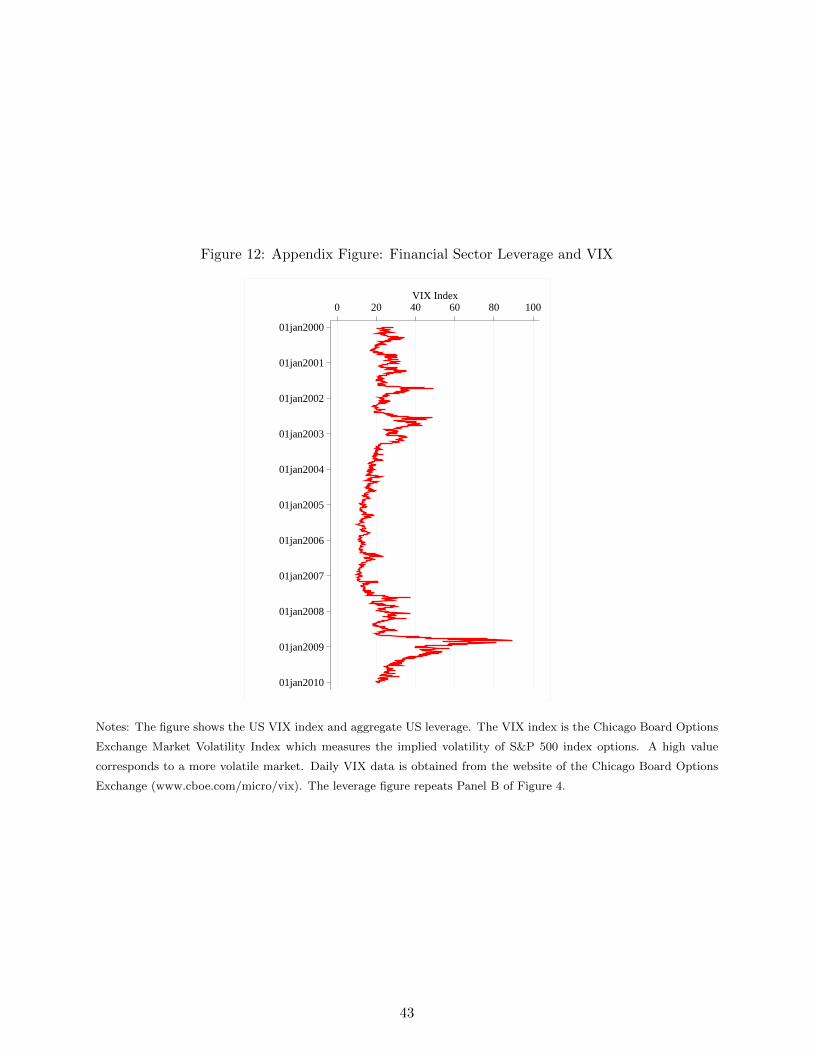
Figure 12: Appendix Figure: Financial Sector Leverage and VIX
0 20 40 60 80 100VIX Index
01jan2000
01jan2001
01jan2002
01jan2003
01jan2004
01jan2005
01jan2006
01jan2007
01jan2008
01jan2009
01jan2010
Notes: The figure shows the US VIX index and aggregate US leverage. The VIX index is the Chicago Board Options
Exchange Market Volatility Index which measures the implied volatility of S&P 500 index options. A high value
corresponds to a more volatile market. Daily VIX data is obtained from the website of the Chicago Board Options
Exchange (www.cboe.com/micro/vix). The leverage figure repeats Panel B of Figure 4.
43