let's make the pain visible!
TRANSCRIPT
Janelle Kleinopenmastery.org @janellekz
Let’s Make the PAIN Visible!
Tour Speaker newiron.com
The discoveries I made over the last decade…
Fundamentally Changed My Beliefs
How to Measure the PAIN in Software Development
Janelle Klein
leanpub.com/ideaflow
It’s Taken Me FIVE YEARS to Explain Why:
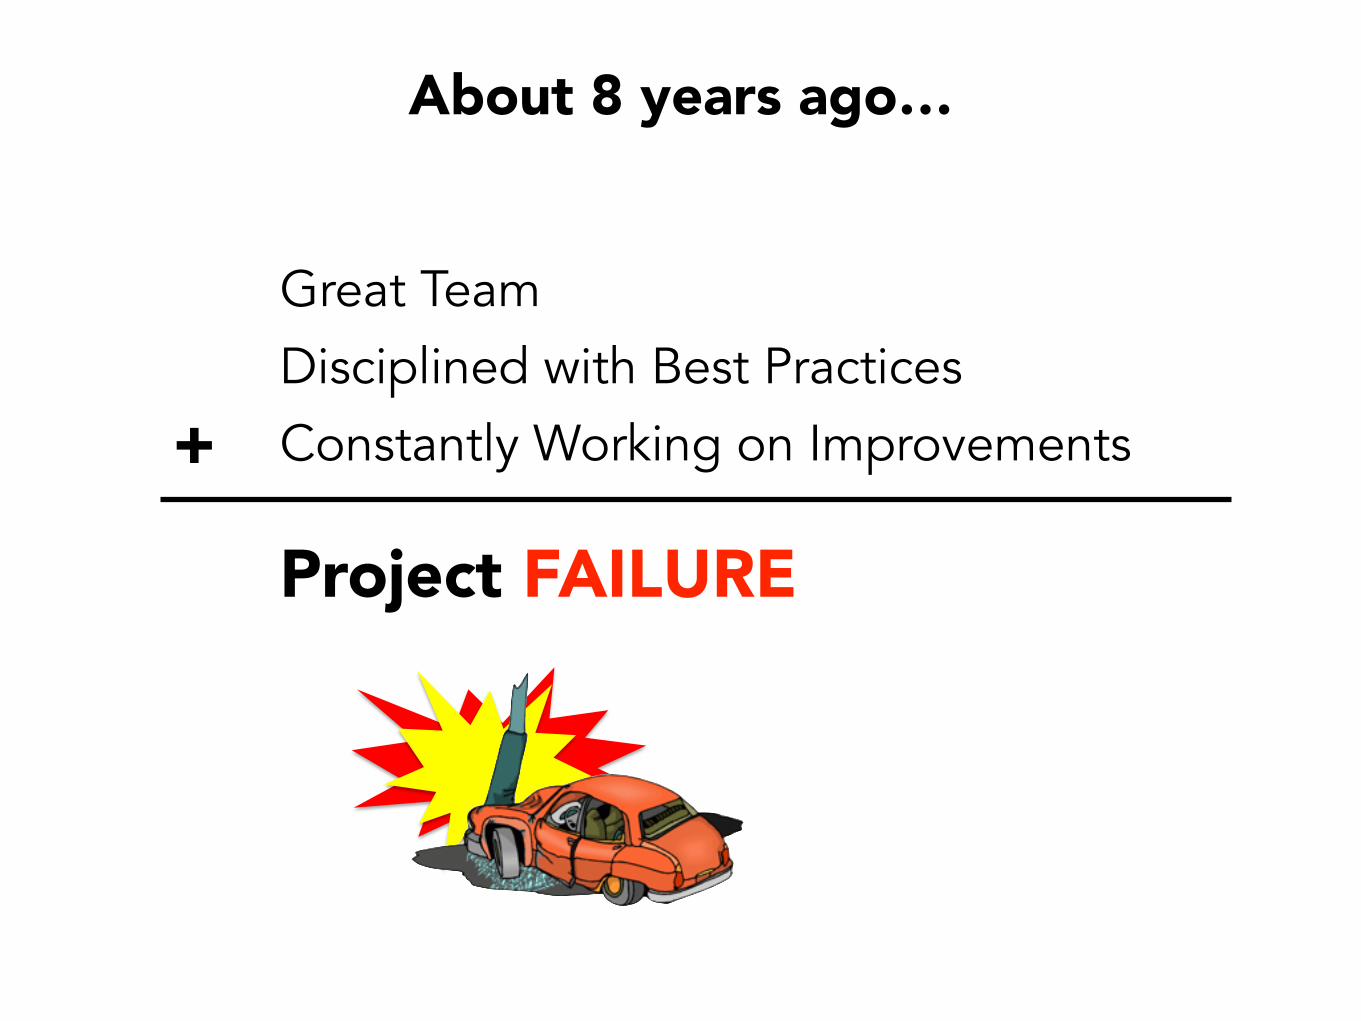
Great Team Disciplined with Best Practices Constantly Working on Improvements+
Project FAILURE
About 8 years ago…
ApplicationTests
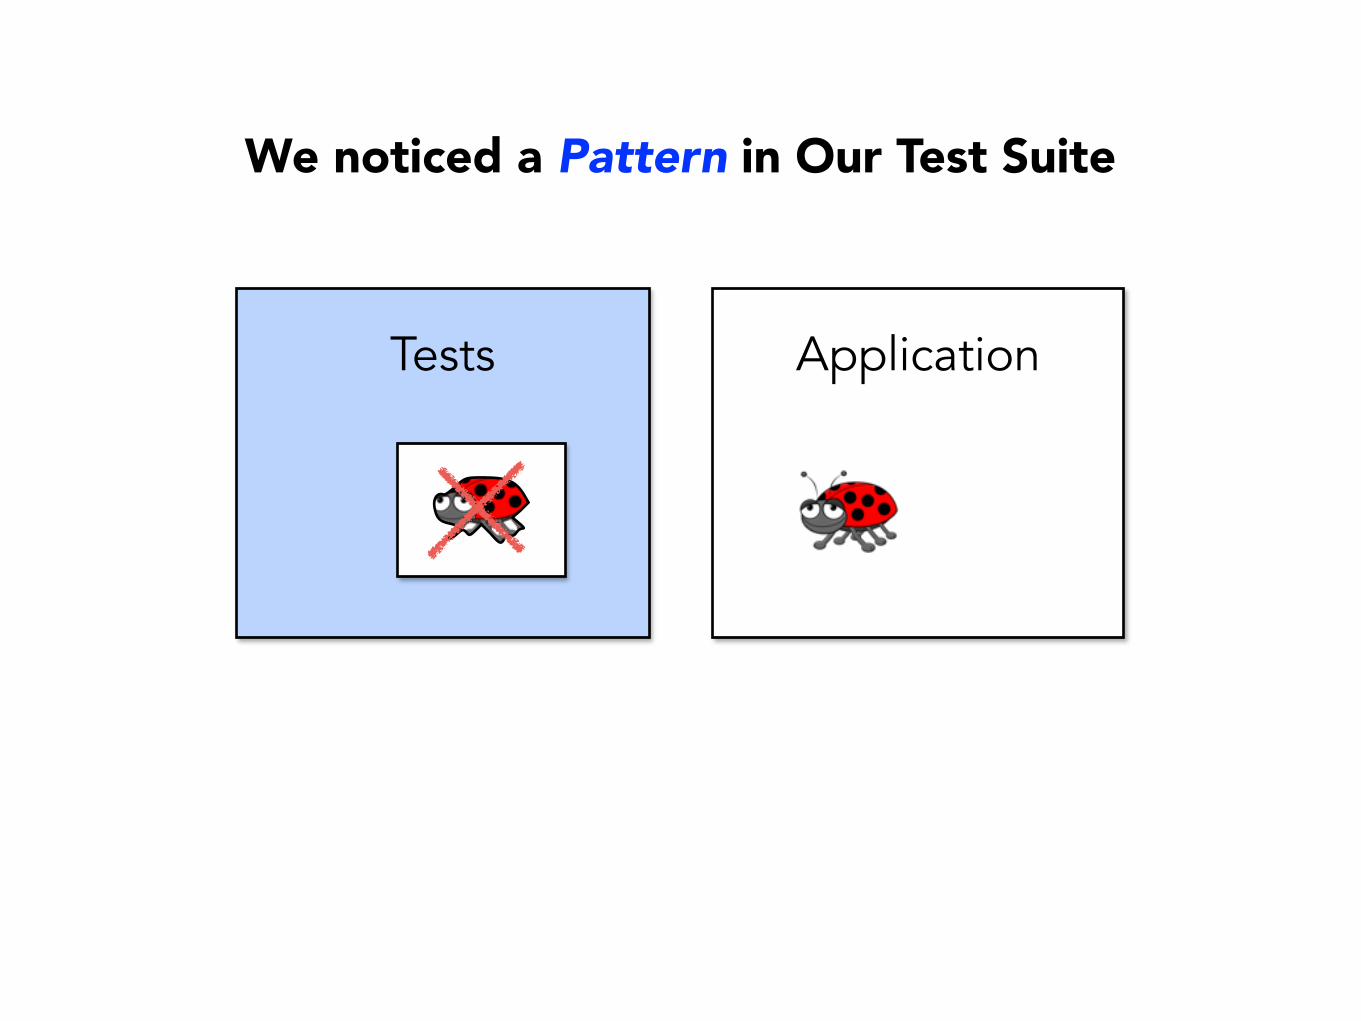
We noticed a Pattern in Our Test Suite
ApplicationTests
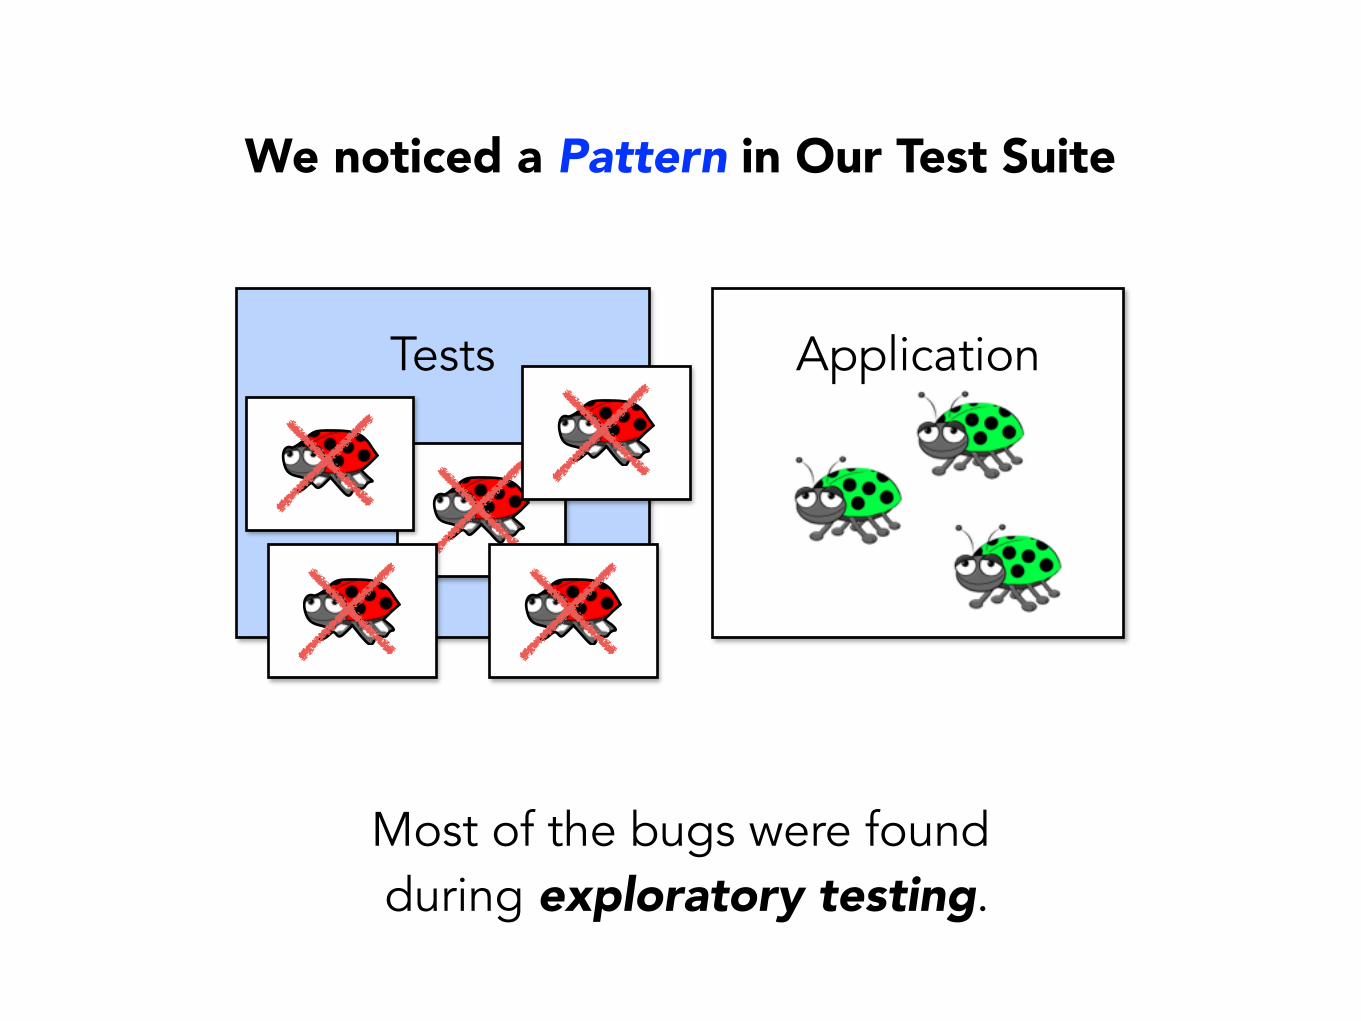
We noticed a Pattern in Our Test Suite
Most of the bugs were found during exploratory testing.
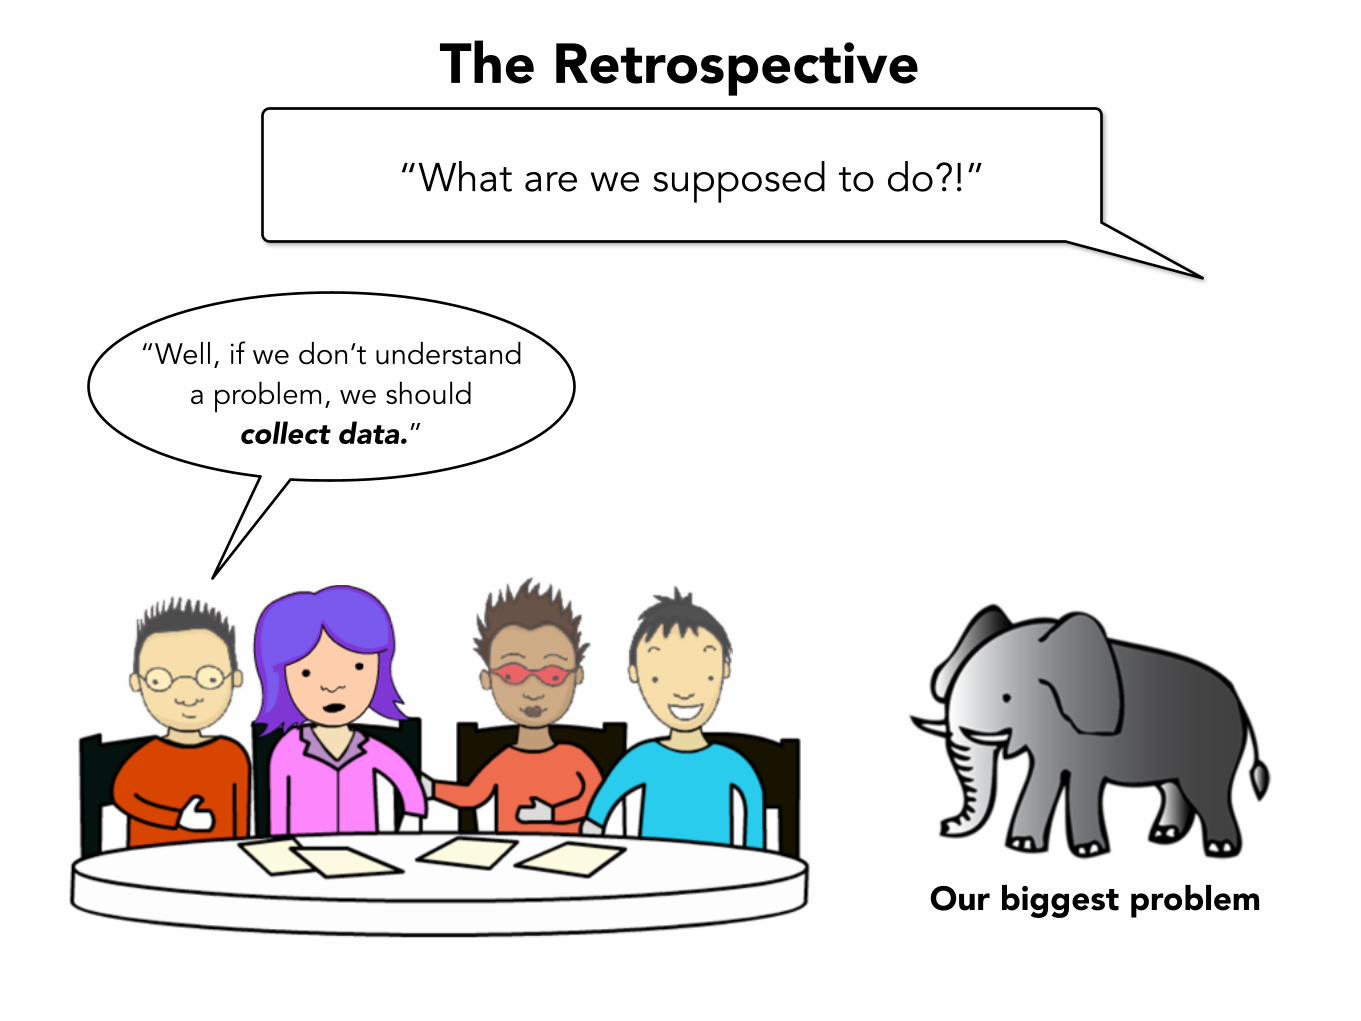
The Retrospective
“What are we supposed to do?!”
Our biggest problem
“Well, if we don’t understand a problem, we should
collect data.”
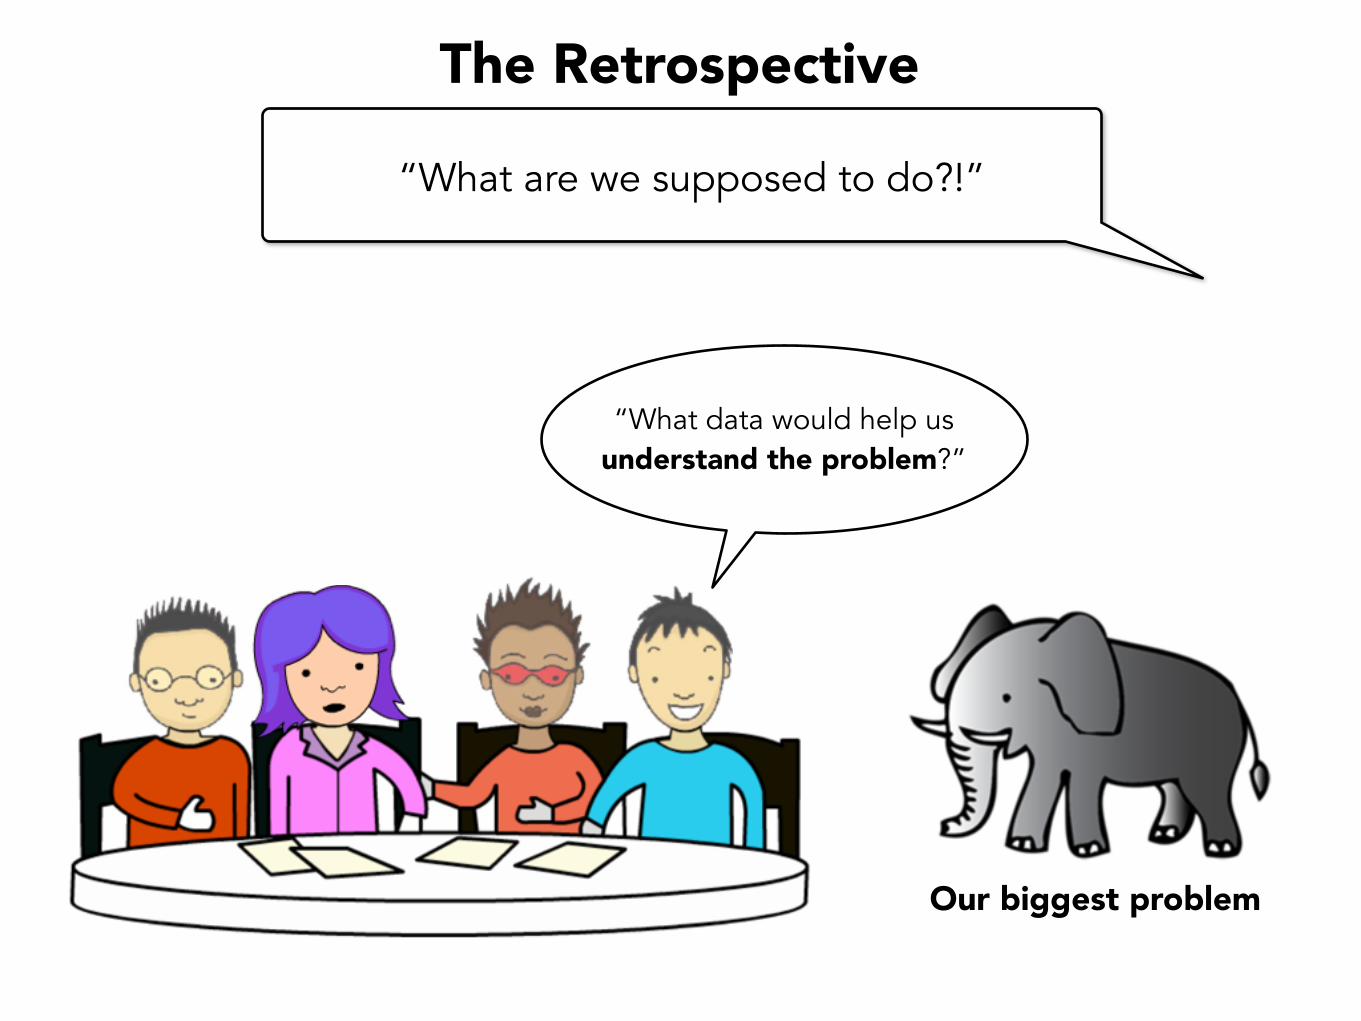
The Retrospective
Our biggest problem
“What data would help us understand the problem?”
“What are we supposed to do?!”
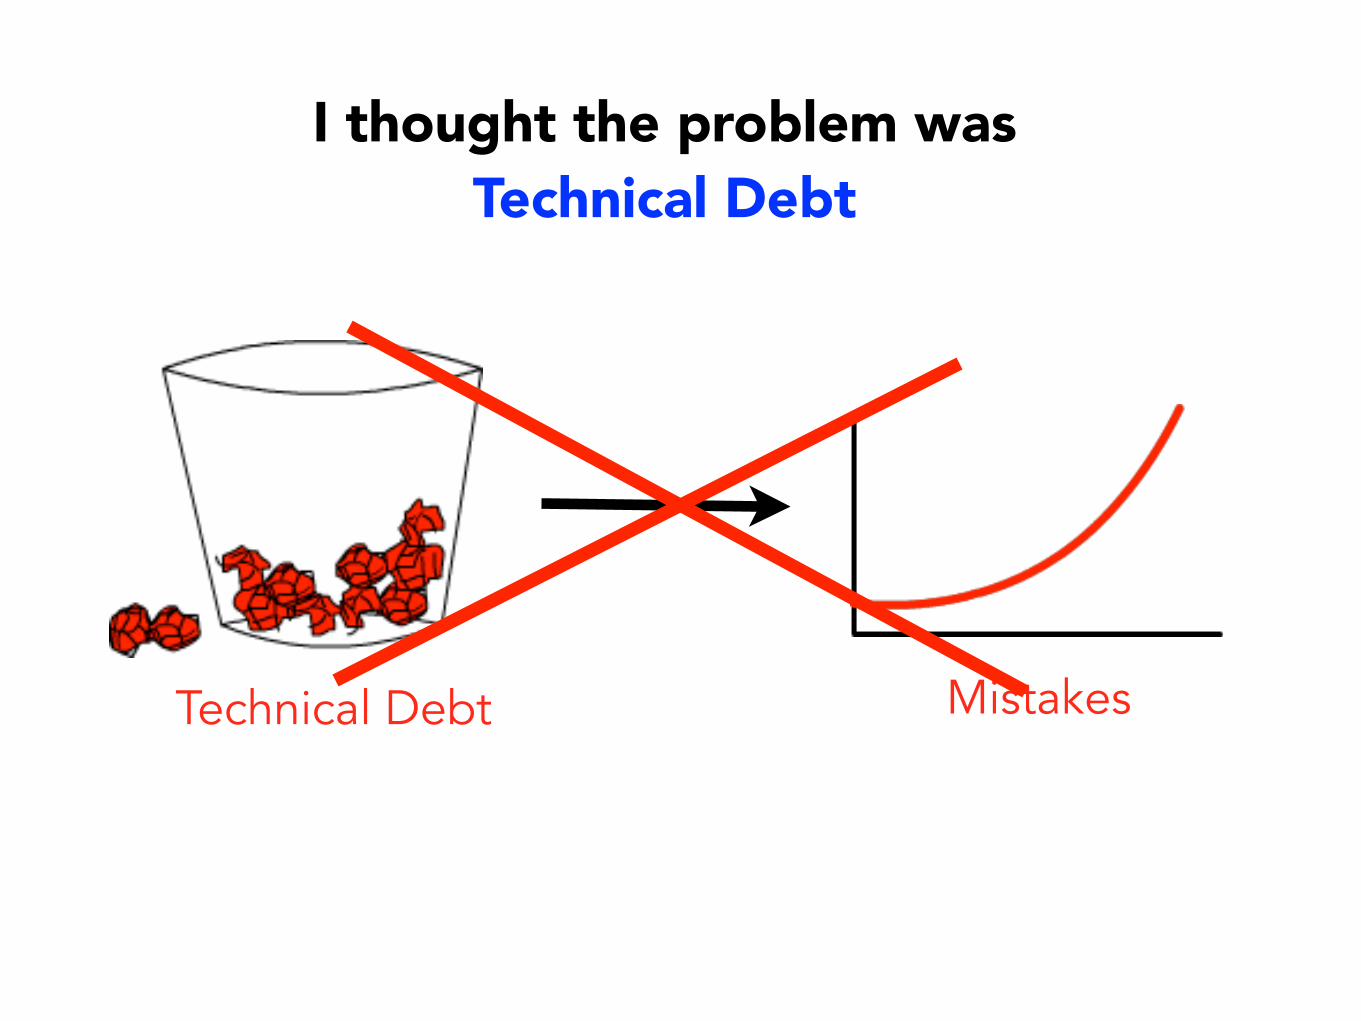
Technical Debt Mistakes
I thought the problem was Technical Debt
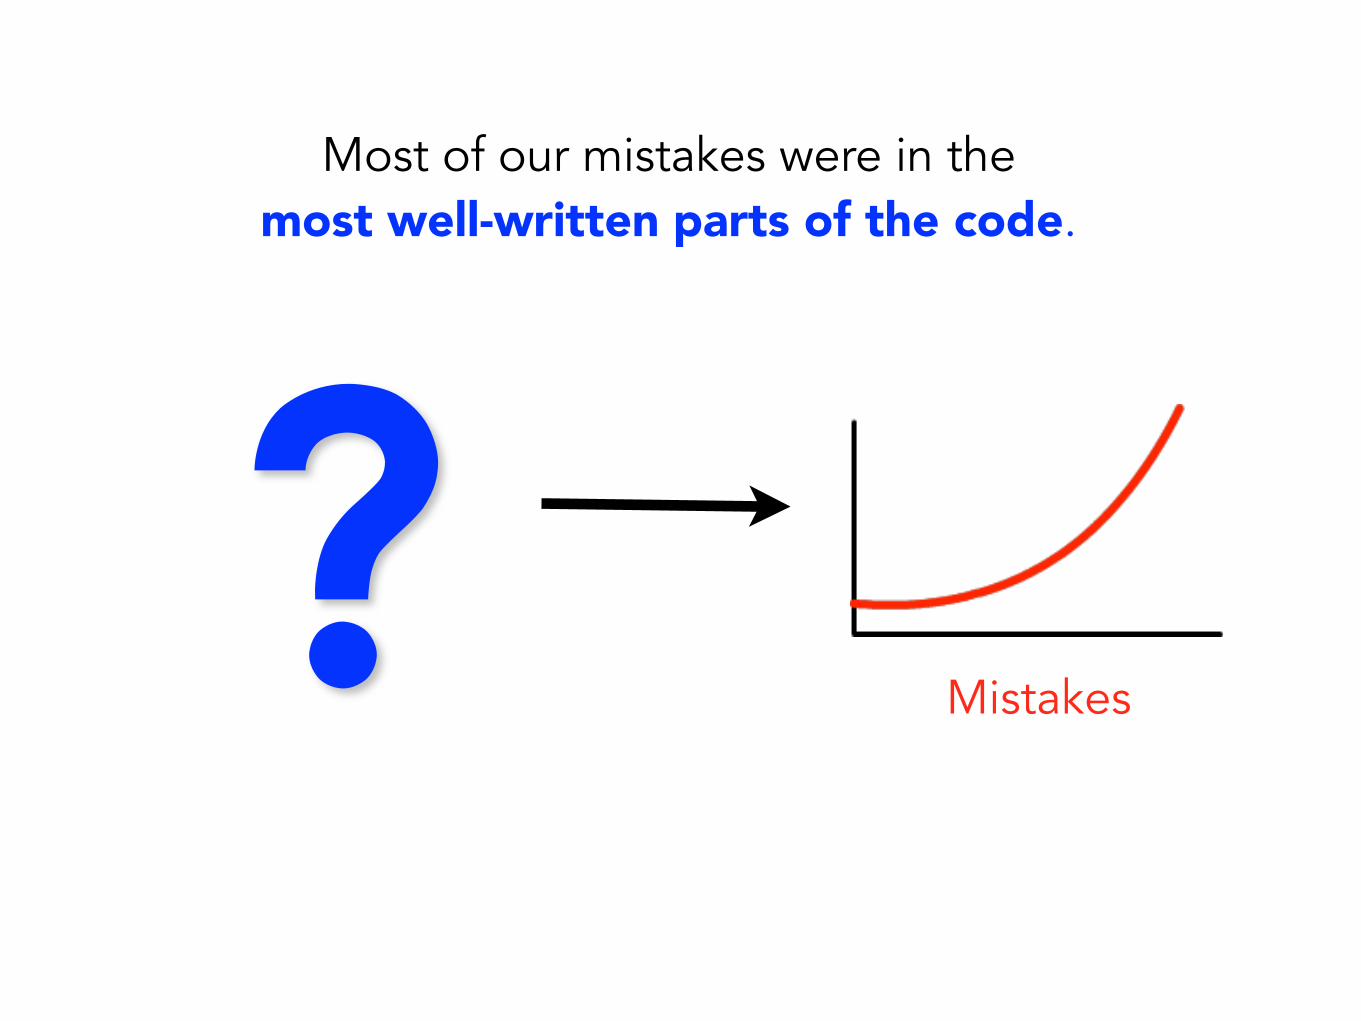
?Most of our mistakes were in the
most well-written parts of the code.
Mistakes
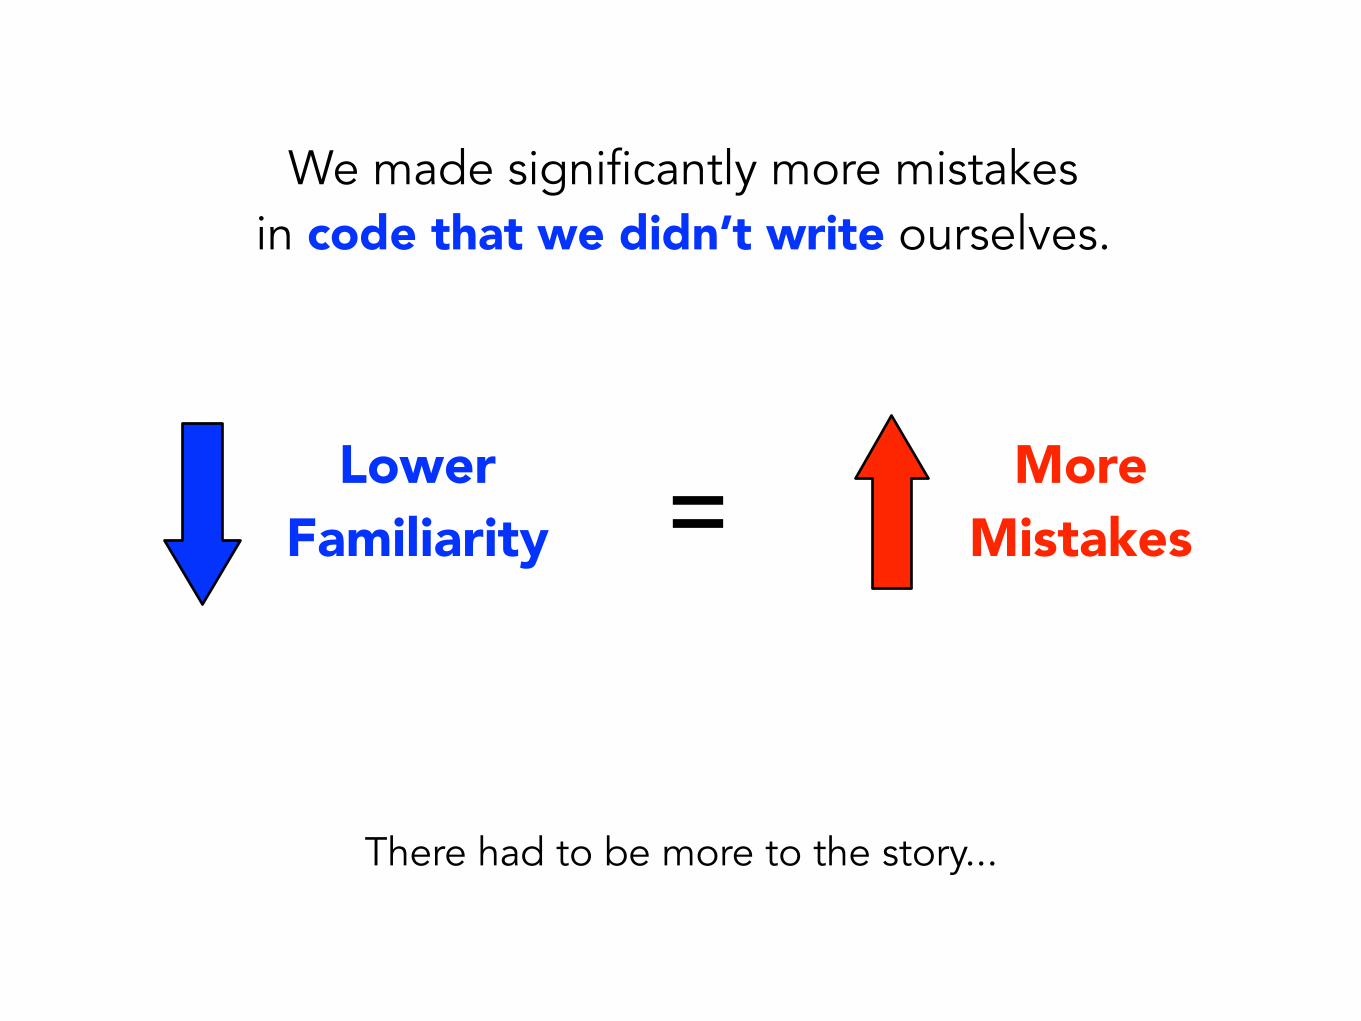
We made significantly more mistakes in code that we didn’t write ourselves.
Lower Familiarity
More Mistakes=
There had to be more to the story...
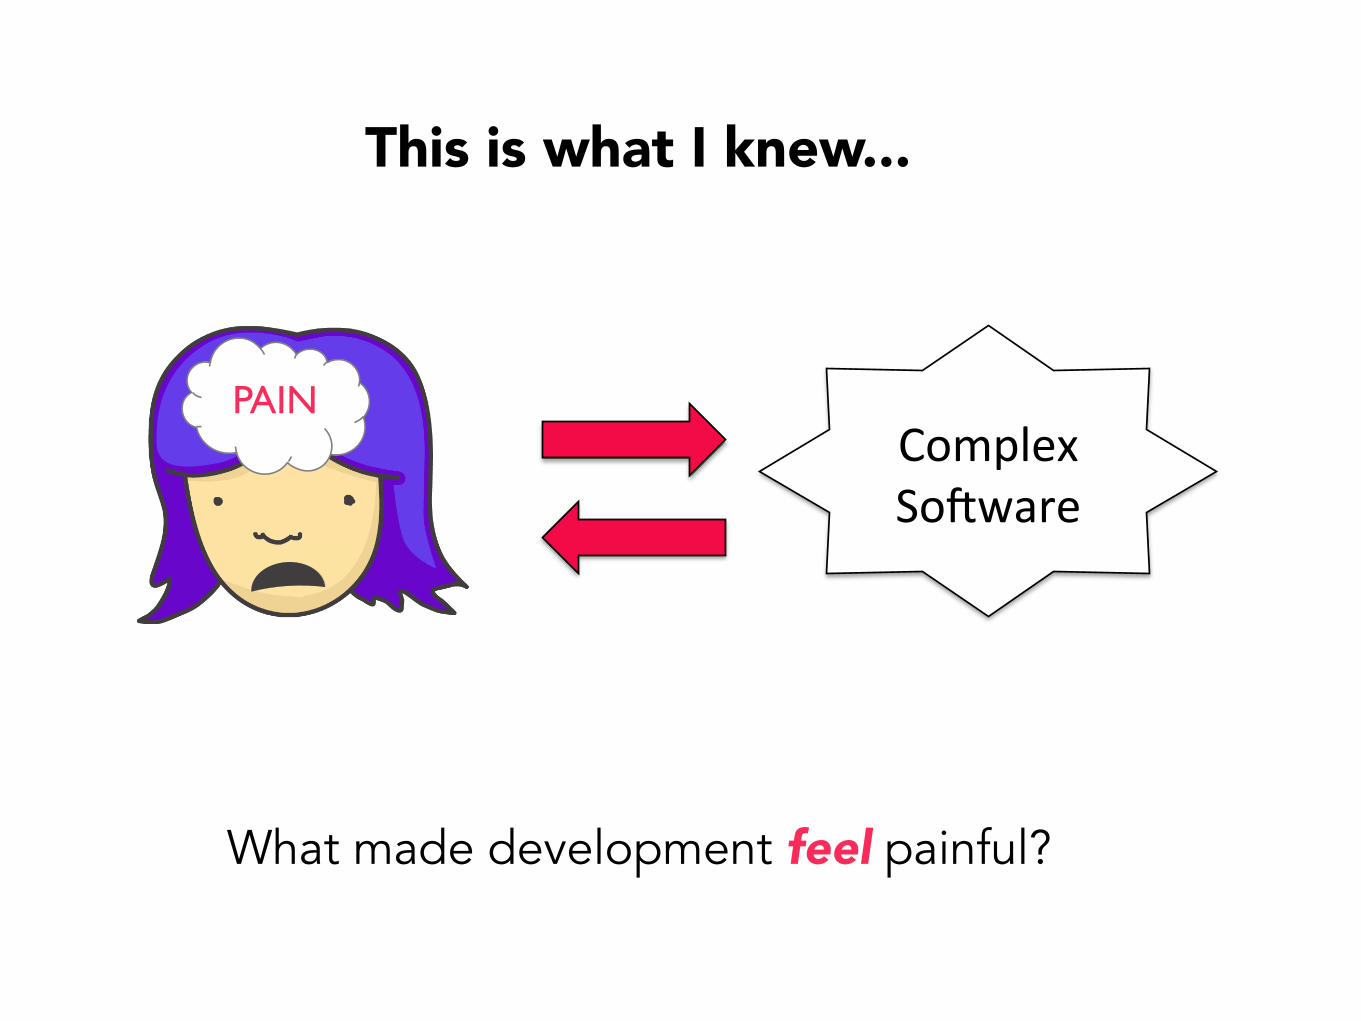
Complex(So*ware(
PAIN
This is what I knew...
What made development feel painful?
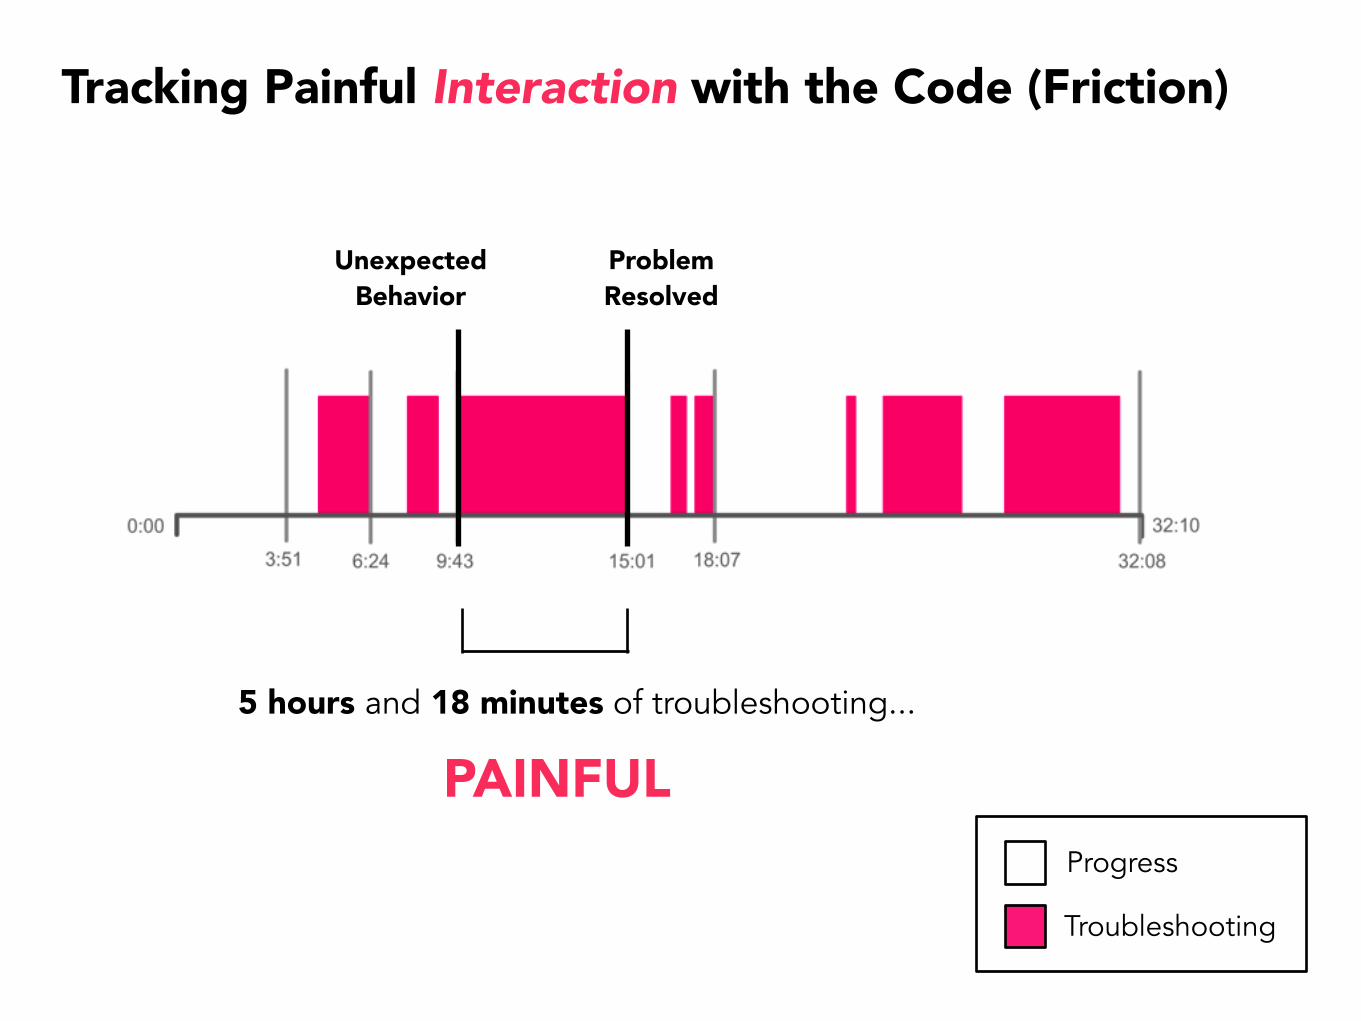
Unexpected Behavior
Problem Resolved
Tracking Painful Interaction with the Code (Friction)
Troubleshooting
Progress
5 hours and 18 minutes of troubleshooting...
PAINFUL
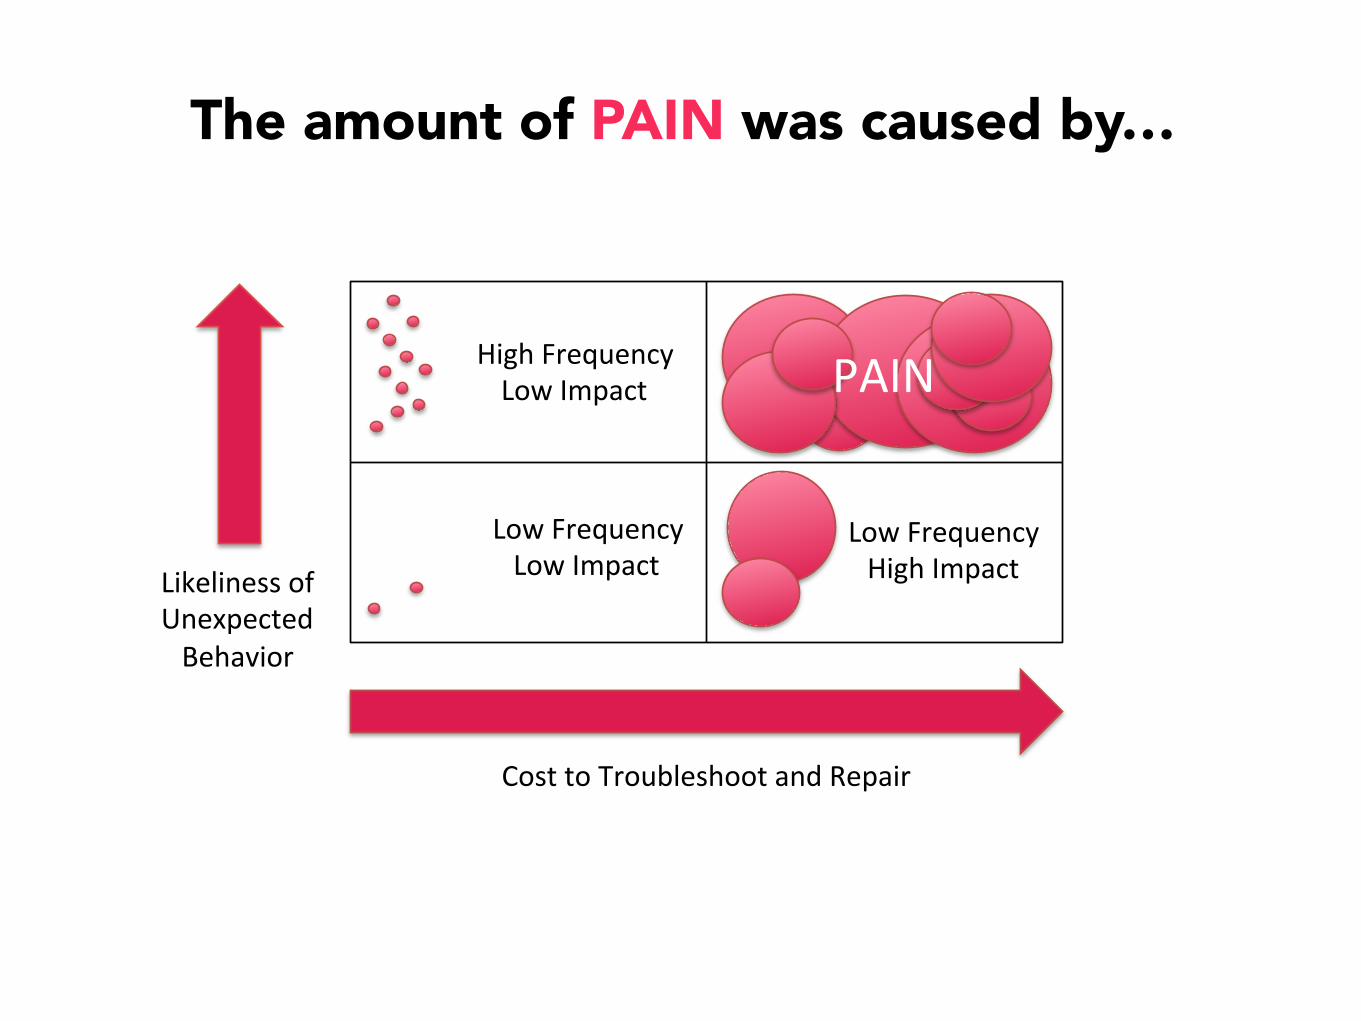
The amount of PAIN was caused by…
Likeliness(of((Unexpected(Behavior(
Cost(to(Troubleshoot(and(Repair(
High(Frequency(Low(Impact(
Low(Frequency(Low(Impact(
Low(Frequency(High(Impact(
PAIN(
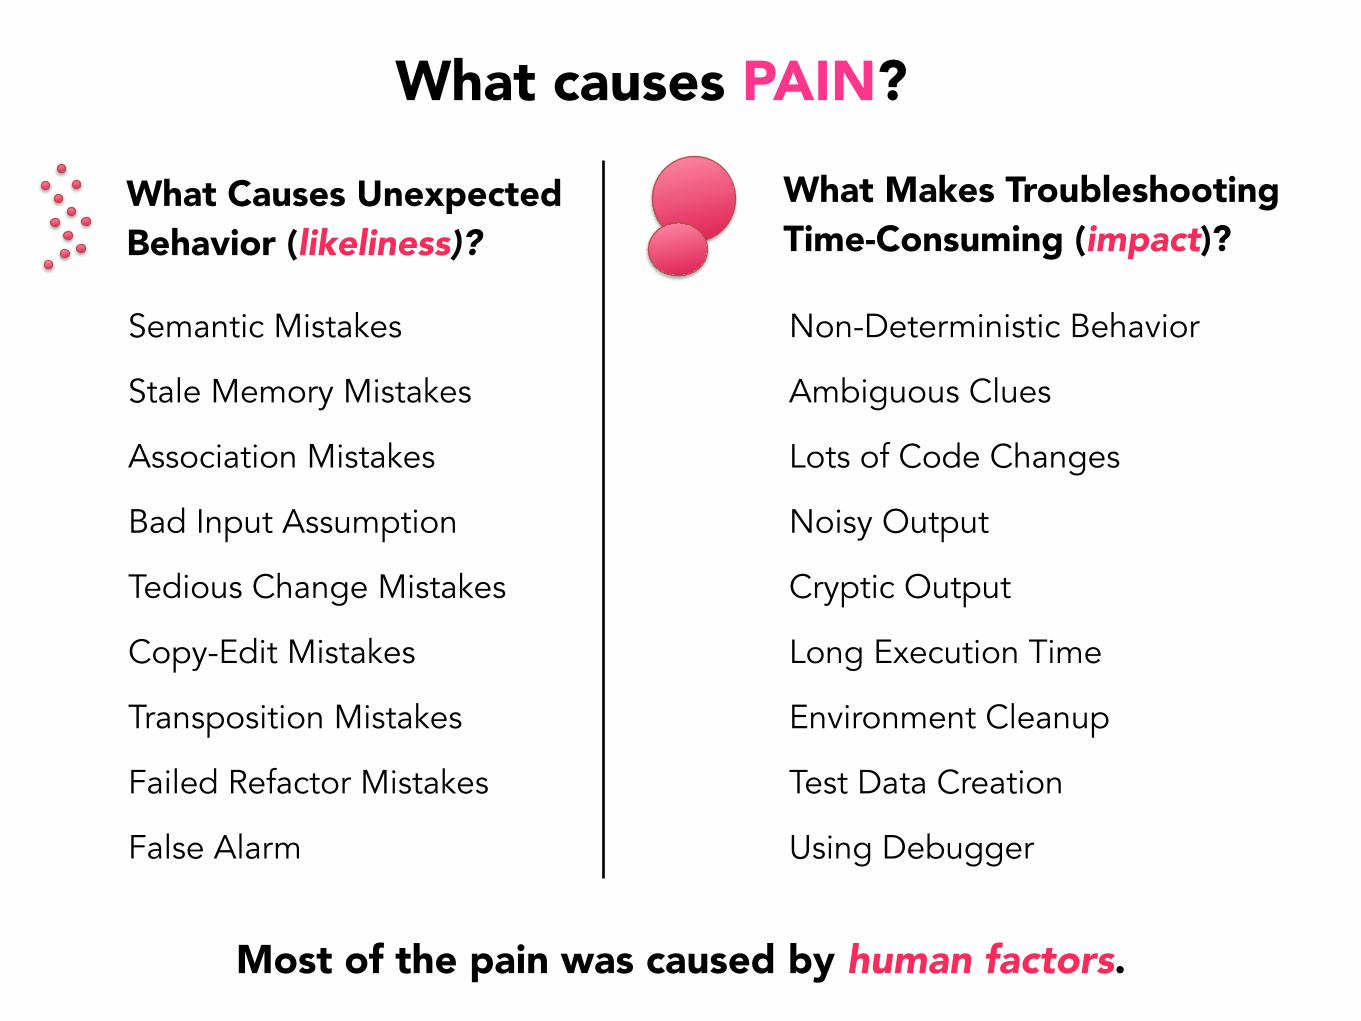
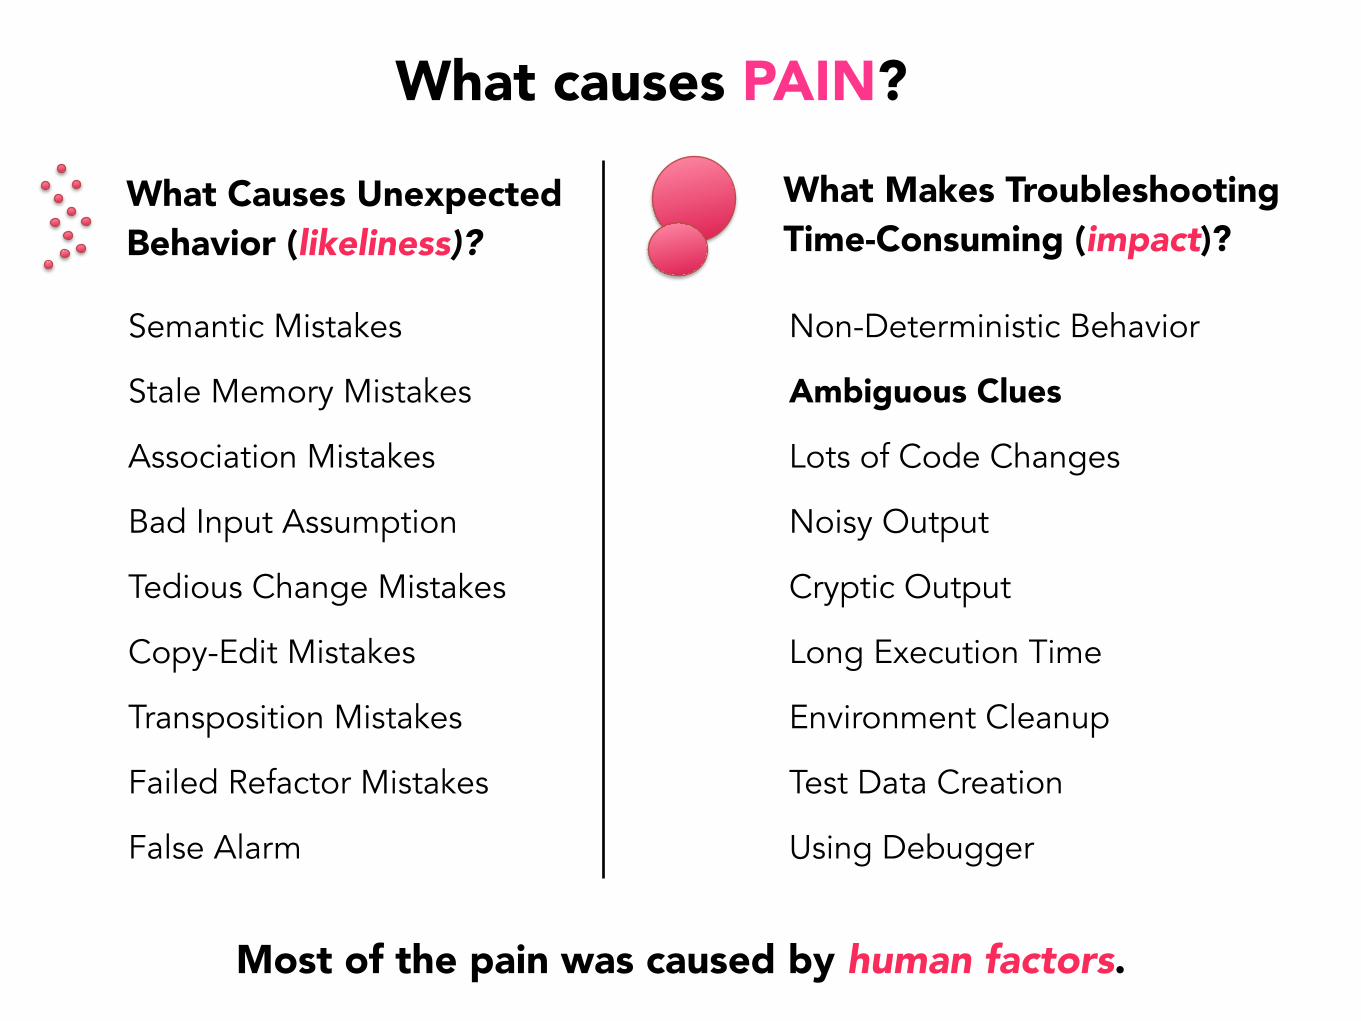
What Causes Unexpected Behavior (likeliness)?
What Makes Troubleshooting Time-Consuming (impact)?
Semantic Mistakes
Stale Memory Mistakes
Association Mistakes
Bad Input Assumption
Tedious Change Mistakes
Copy-Edit Mistakes
Transposition Mistakes
Failed Refactor Mistakes
False Alarm
Non-Deterministic Behavior
Ambiguous Clues
Lots of Code Changes
Noisy Output
Cryptic Output
Long Execution Time
Environment Cleanup
Test Data Creation
Using Debugger
Most of the pain was caused by human factors.
What causes PAIN?
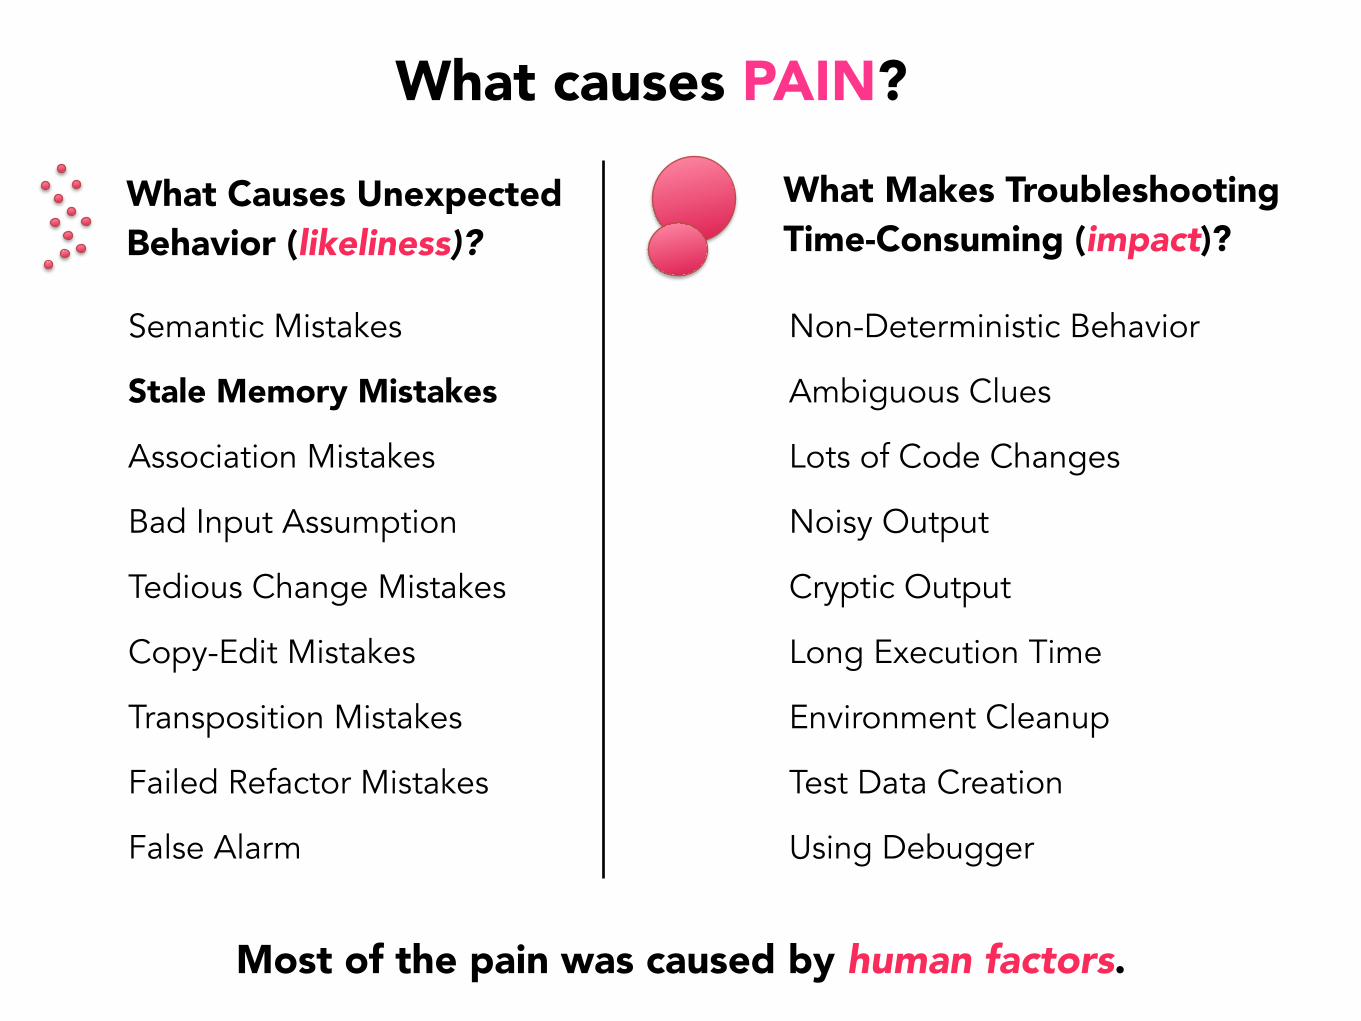
What Causes Unexpected Behavior (likeliness)?
What Makes Troubleshooting Time-Consuming (impact)?
Non-Deterministic Behavior
Ambiguous Clues
Lots of Code Changes
Noisy Output
Cryptic Output
Long Execution Time
Environment Cleanup
Test Data Creation
Using Debugger
What causes PAIN?
Most of the pain was caused by human factors.
Semantic Mistakes
Stale Memory Mistakes
Association Mistakes
Bad Input Assumption
Tedious Change Mistakes
Copy-Edit Mistakes
Transposition Mistakes
Failed Refactor Mistakes
False Alarm
What Causes Unexpected Behavior (likeliness)?
What Makes Troubleshooting Time-Consuming (impact)?
Non-Deterministic Behavior
Ambiguous Clues
Lots of Code Changes
Noisy Output
Cryptic Output
Long Execution Time
Environment Cleanup
Test Data Creation
Using Debugger
What causes PAIN?
Semantic Mistakes
Stale Memory Mistakes
Association Mistakes
Bad Input Assumption
Tedious Change Mistakes
Copy-Edit Mistakes
Transposition Mistakes
Failed Refactor Mistakes
False Alarm
Most of the pain was caused by human factors.
What Causes Unexpected Behavior (likeliness)?
What Makes Troubleshooting Time-Consuming (impact)?
Non-Deterministic Behavior
Ambiguous Clues
Lots of Code Changes
Noisy Output
Cryptic Output
Long Execution Time
Environment Cleanup
Test Data Creation
Using Debugger
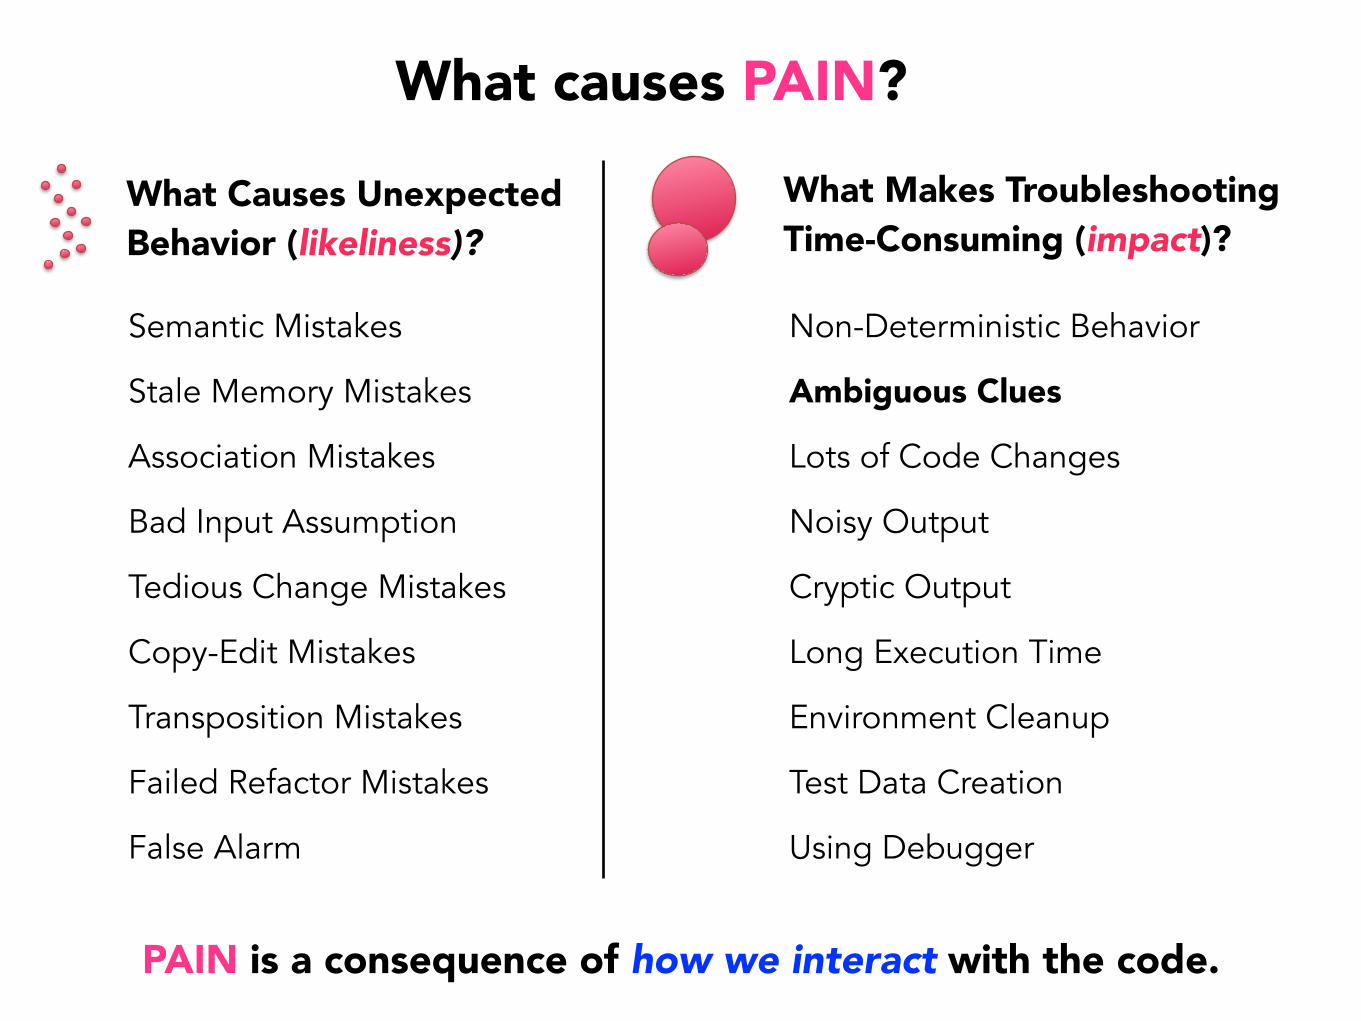
What causes PAIN?
PAIN is a consequence of how we interact with the code.
Semantic Mistakes
Stale Memory Mistakes
Association Mistakes
Bad Input Assumption
Tedious Change Mistakes
Copy-Edit Mistakes
Transposition Mistakes
Failed Refactor Mistakes
False Alarm
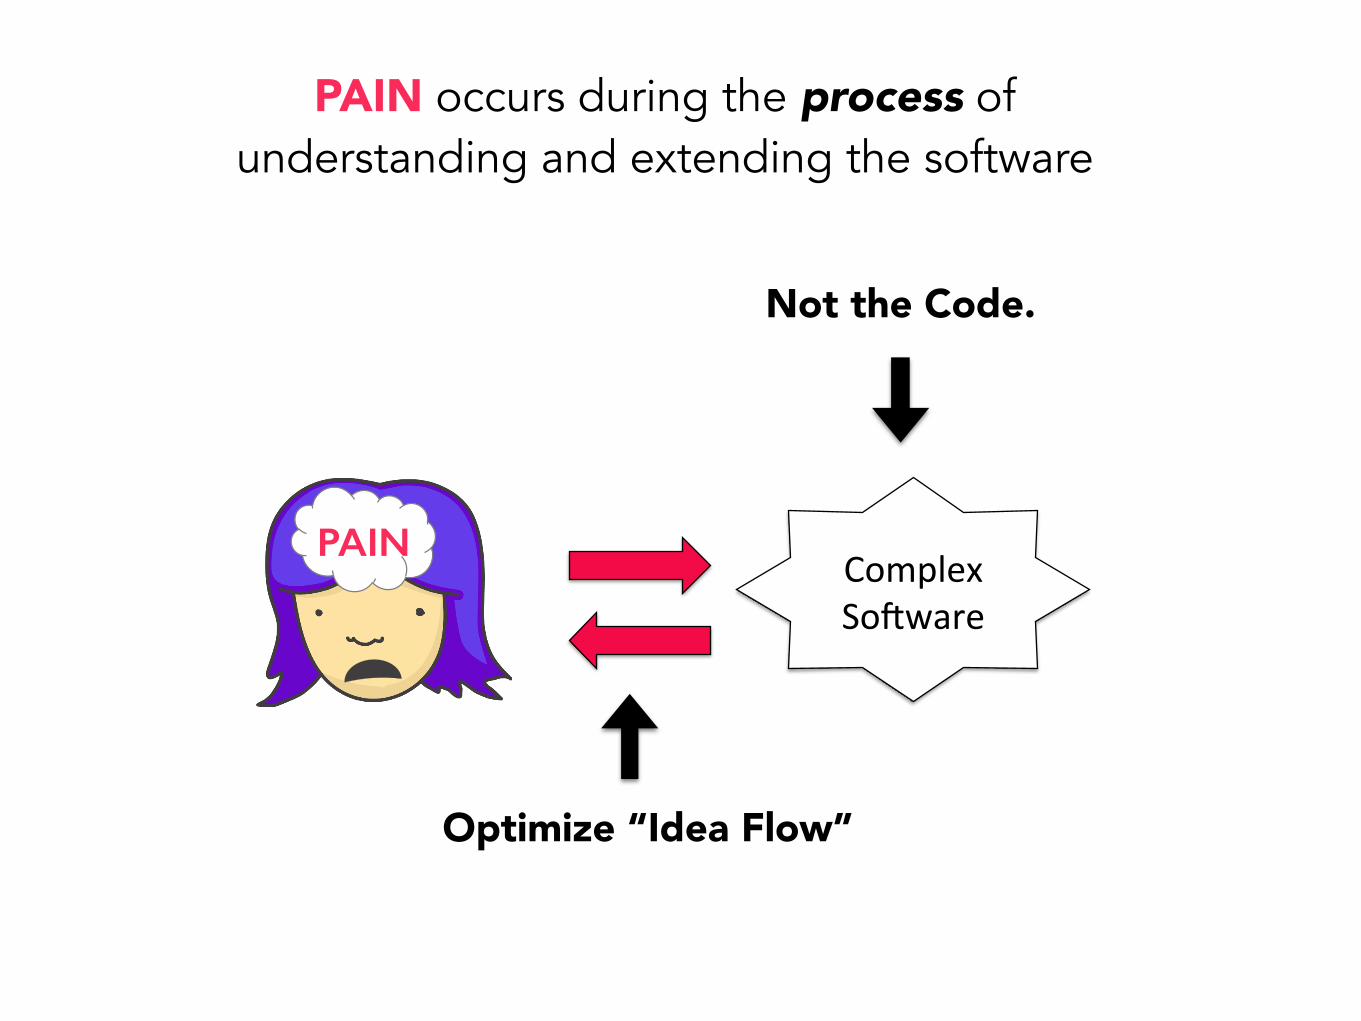
PAIN occurs during the process of understanding and extending the software
Complex(So*ware(
PAIN
Not the Code.
Optimize “Idea Flow”
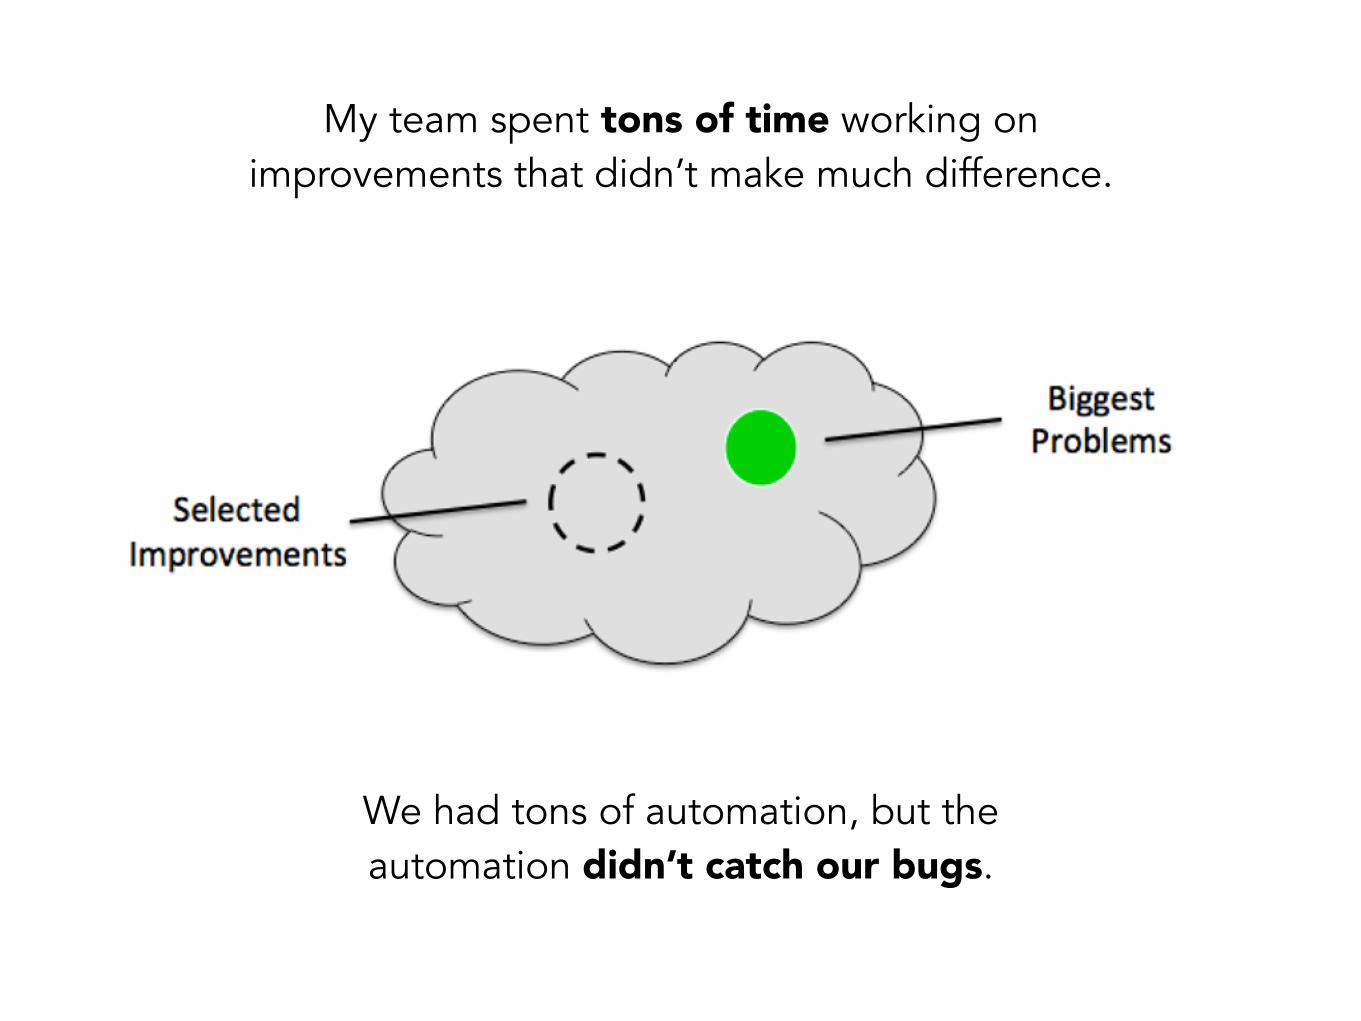
My team spent tons of time working on improvements that didn’t make much difference.
We had tons of automation, but the automation didn’t catch our bugs.
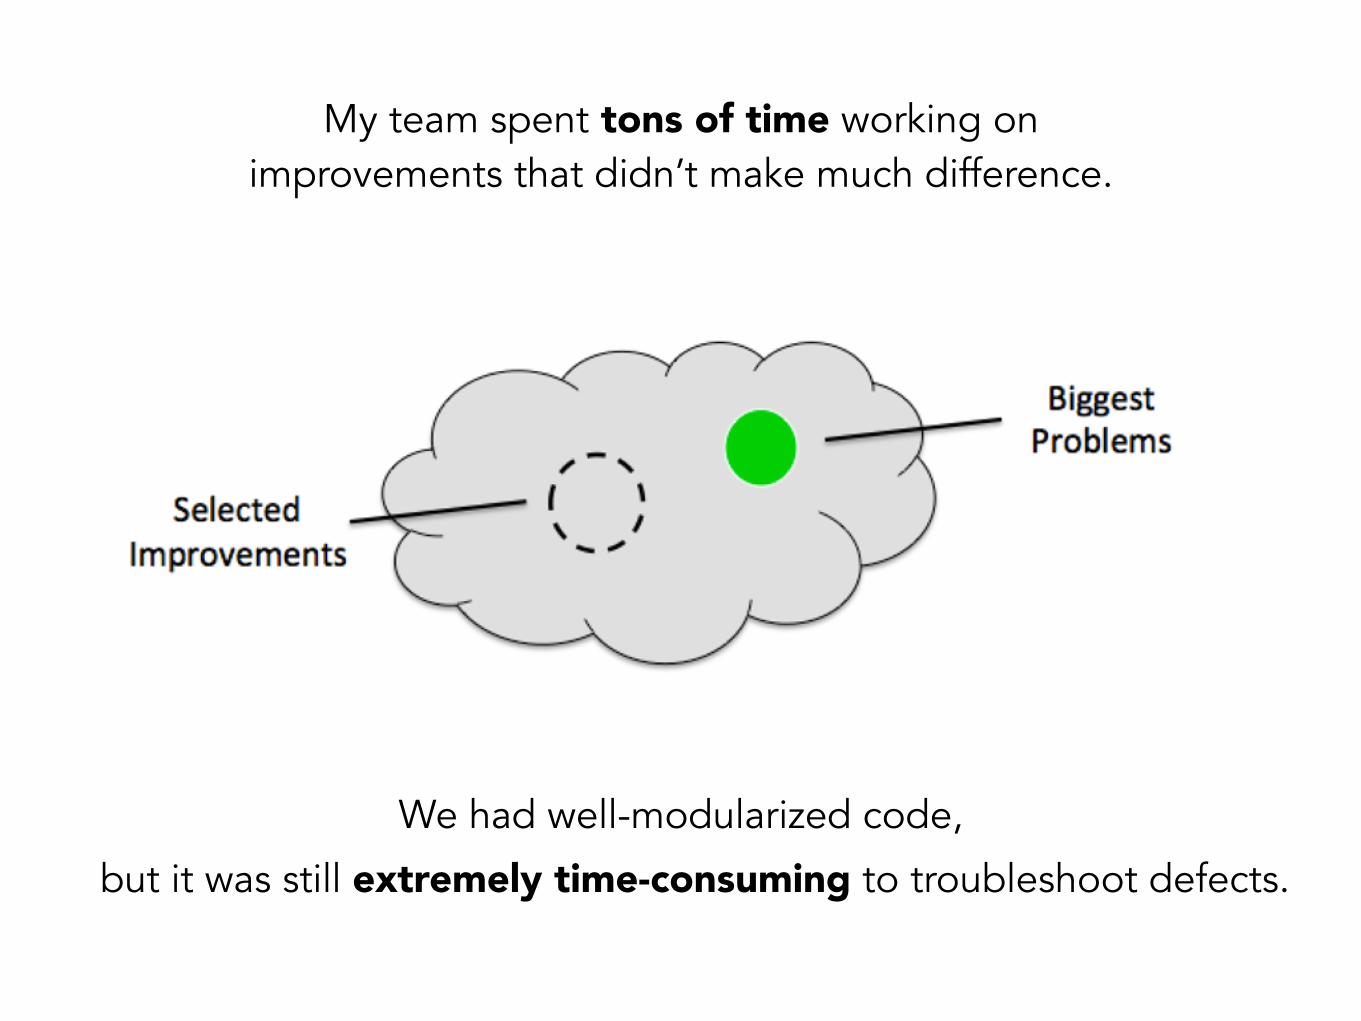
My team spent tons of time working on improvements that didn’t make much difference.
We had well-modularized code,
but it was still extremely time-consuming to troubleshoot defects.
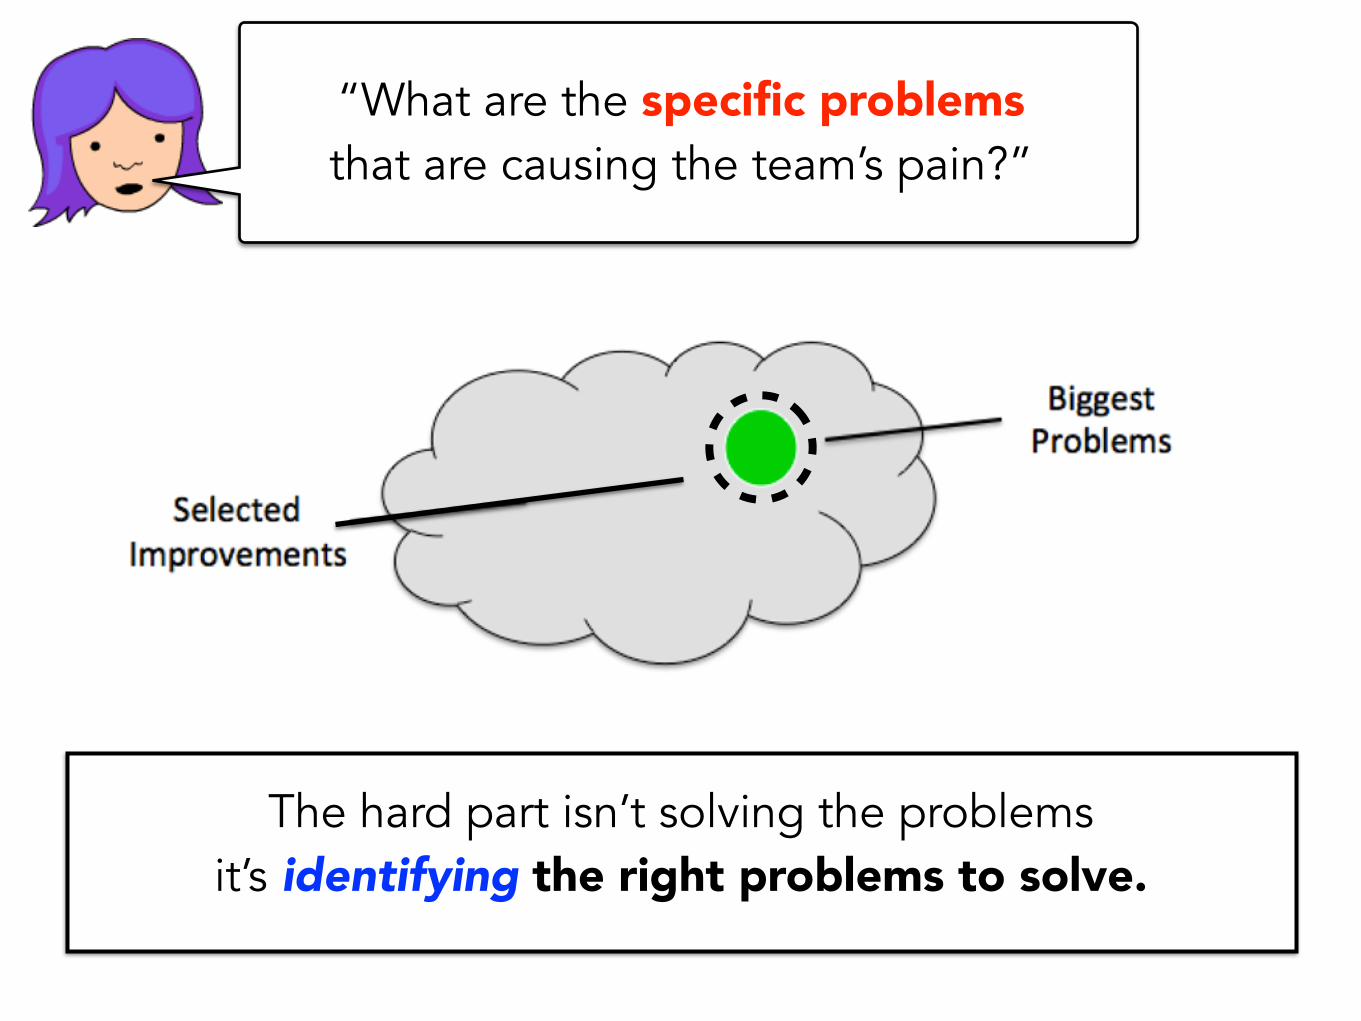
The hard part isn’t solving the problems it’s identifying the right problems to solve.
“What are the specific problems that are causing the team’s pain?”
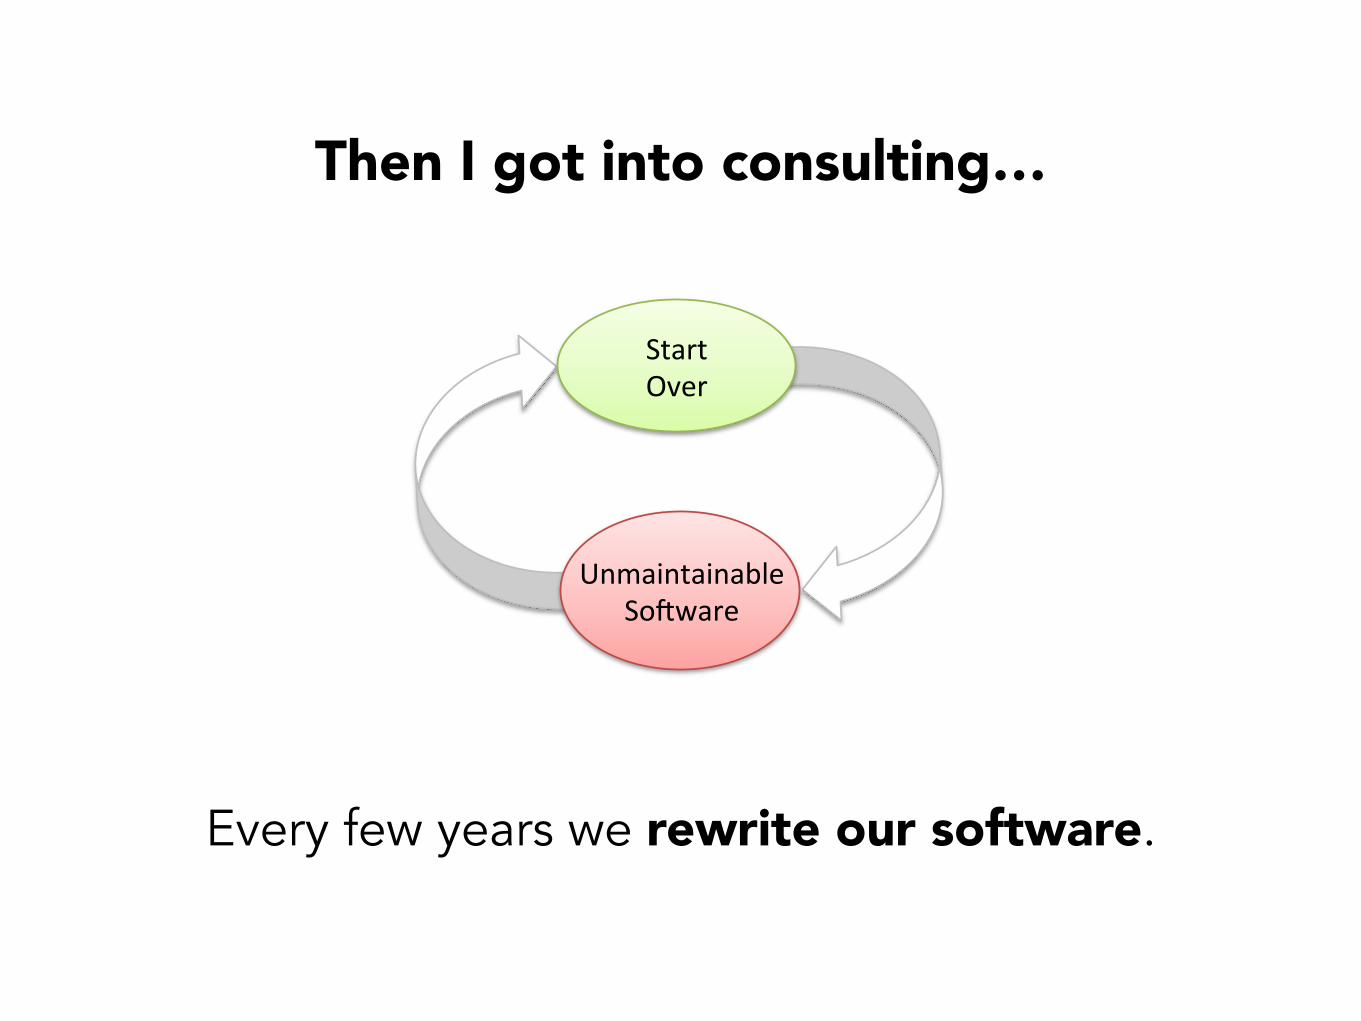
Then I got into consulting…
Every few years we rewrite our software.
Start%Over%
Unmaintainable%So0ware%
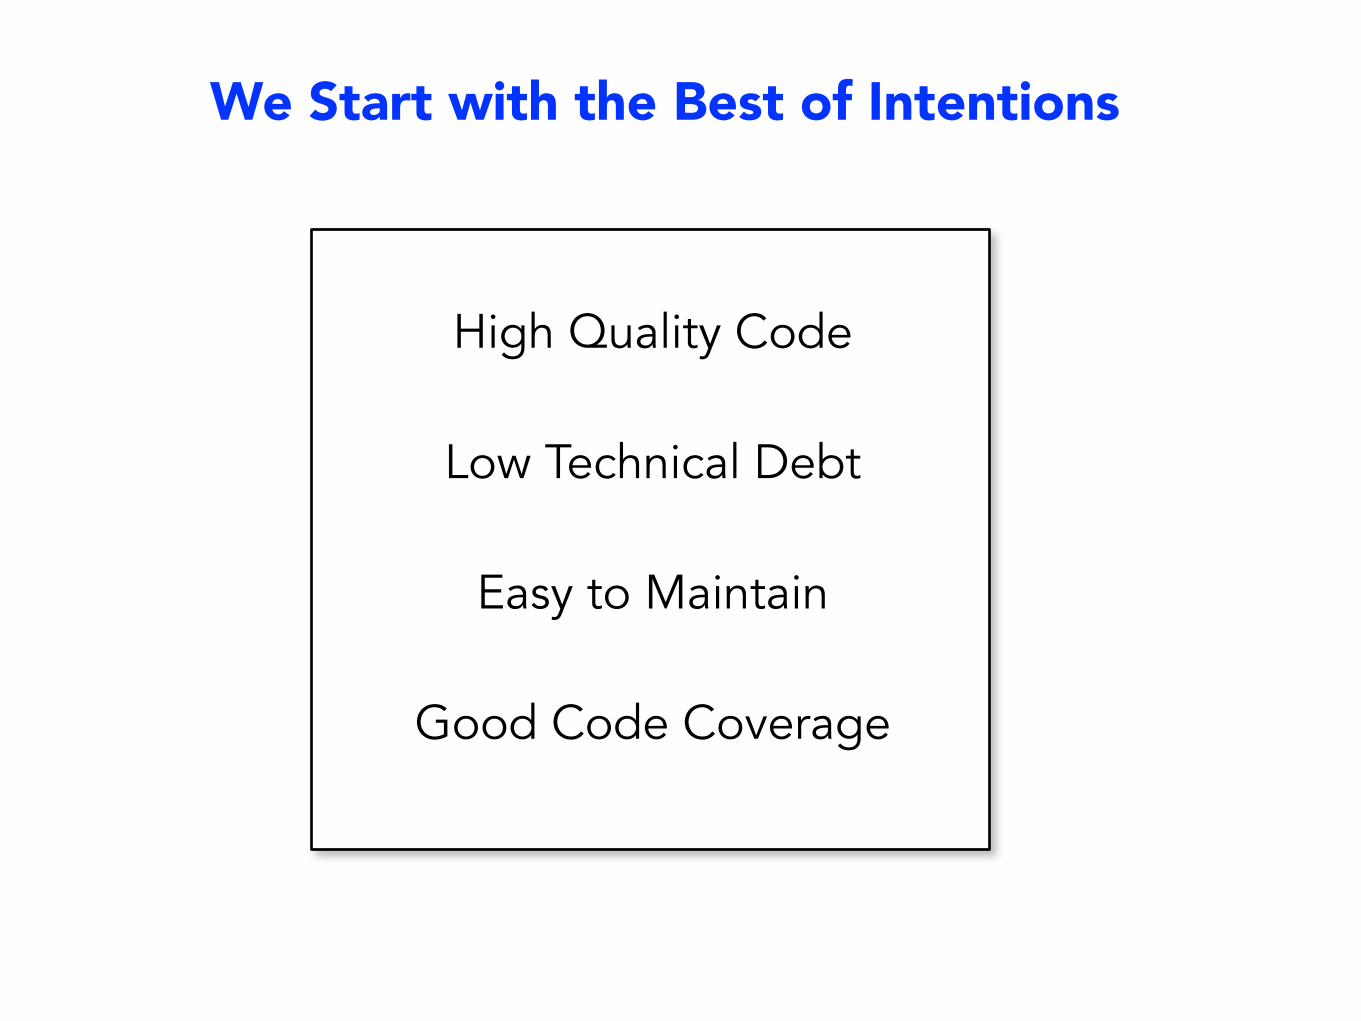
We Start with the Best of Intentions
High Quality Code
Low Technical Debt
Easy to Maintain
Good Code Coverage

Then This Happens!
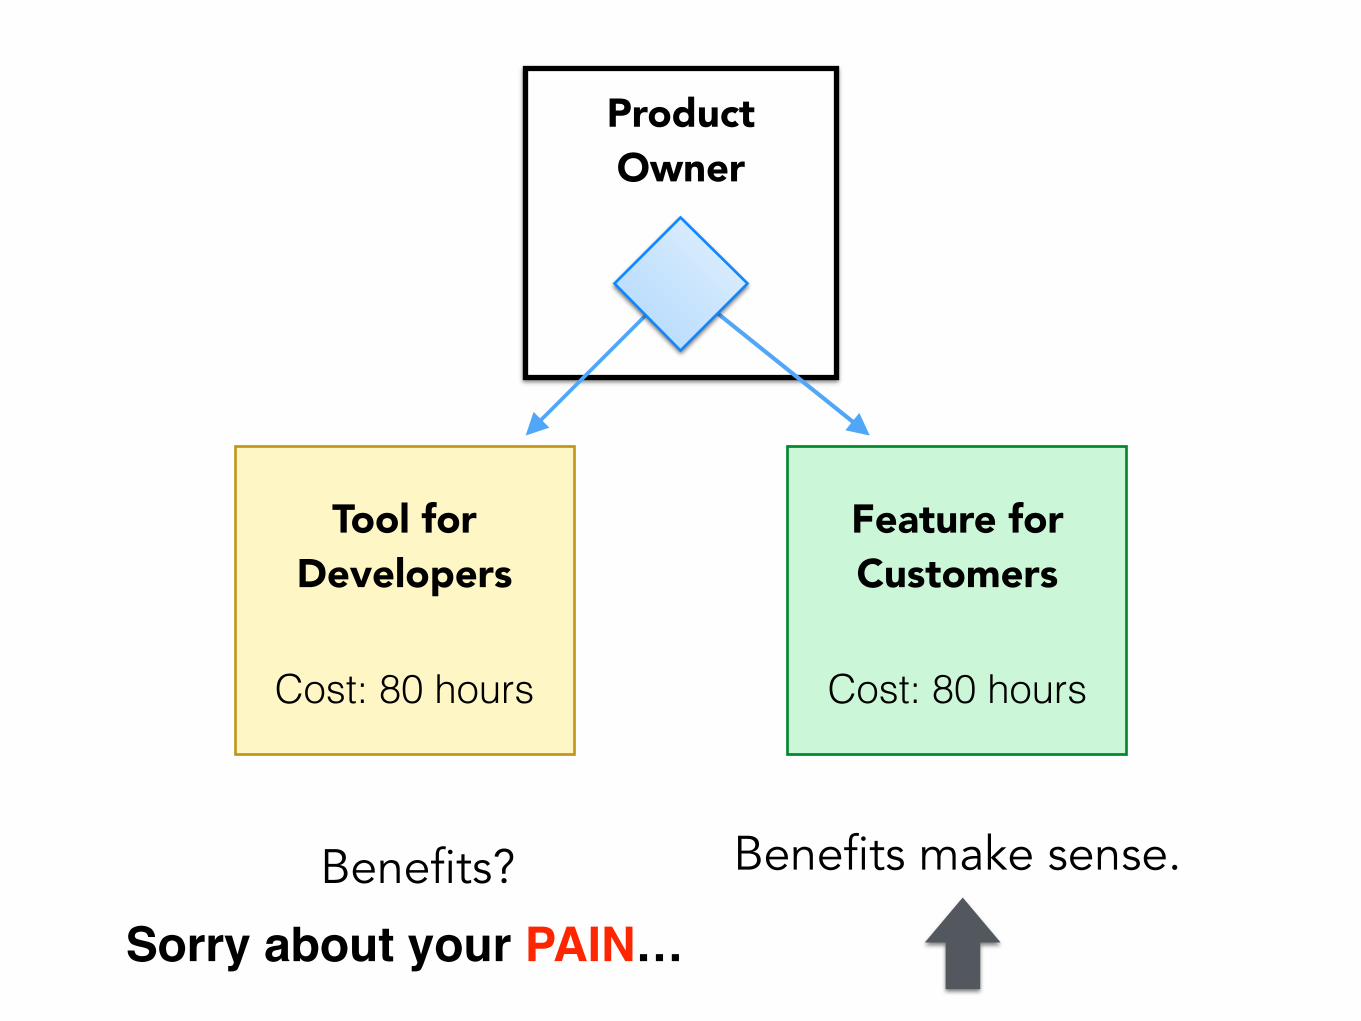
Feature for Customers
Cost: 80 hours
Tool for Developers
Cost: 80 hours
Benefits make sense.
Product Owner
Sorry about your PAIN…Benefits?
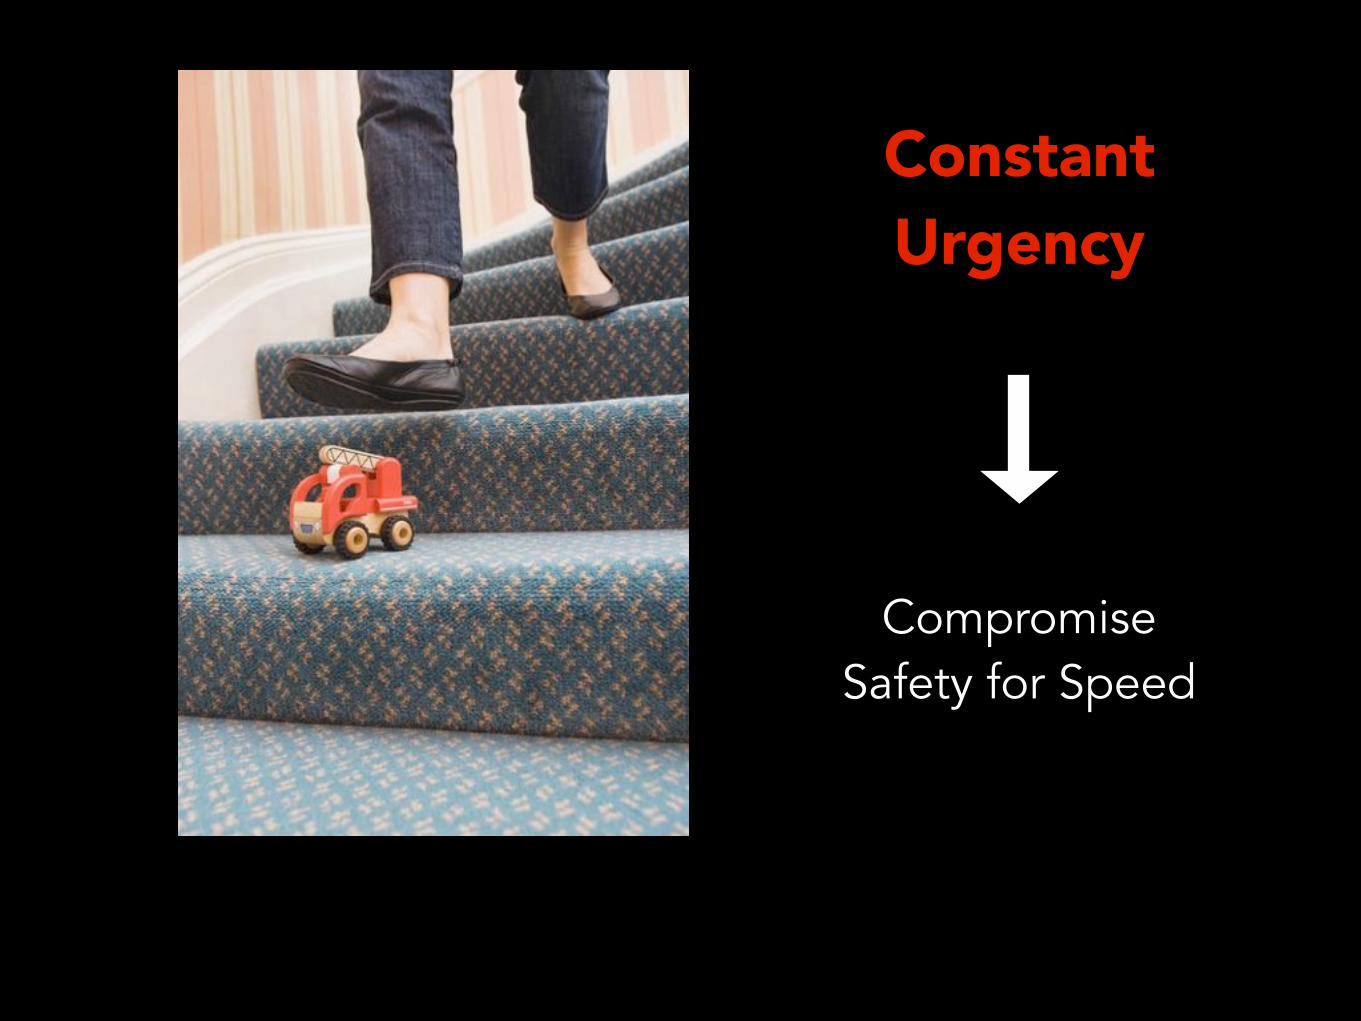
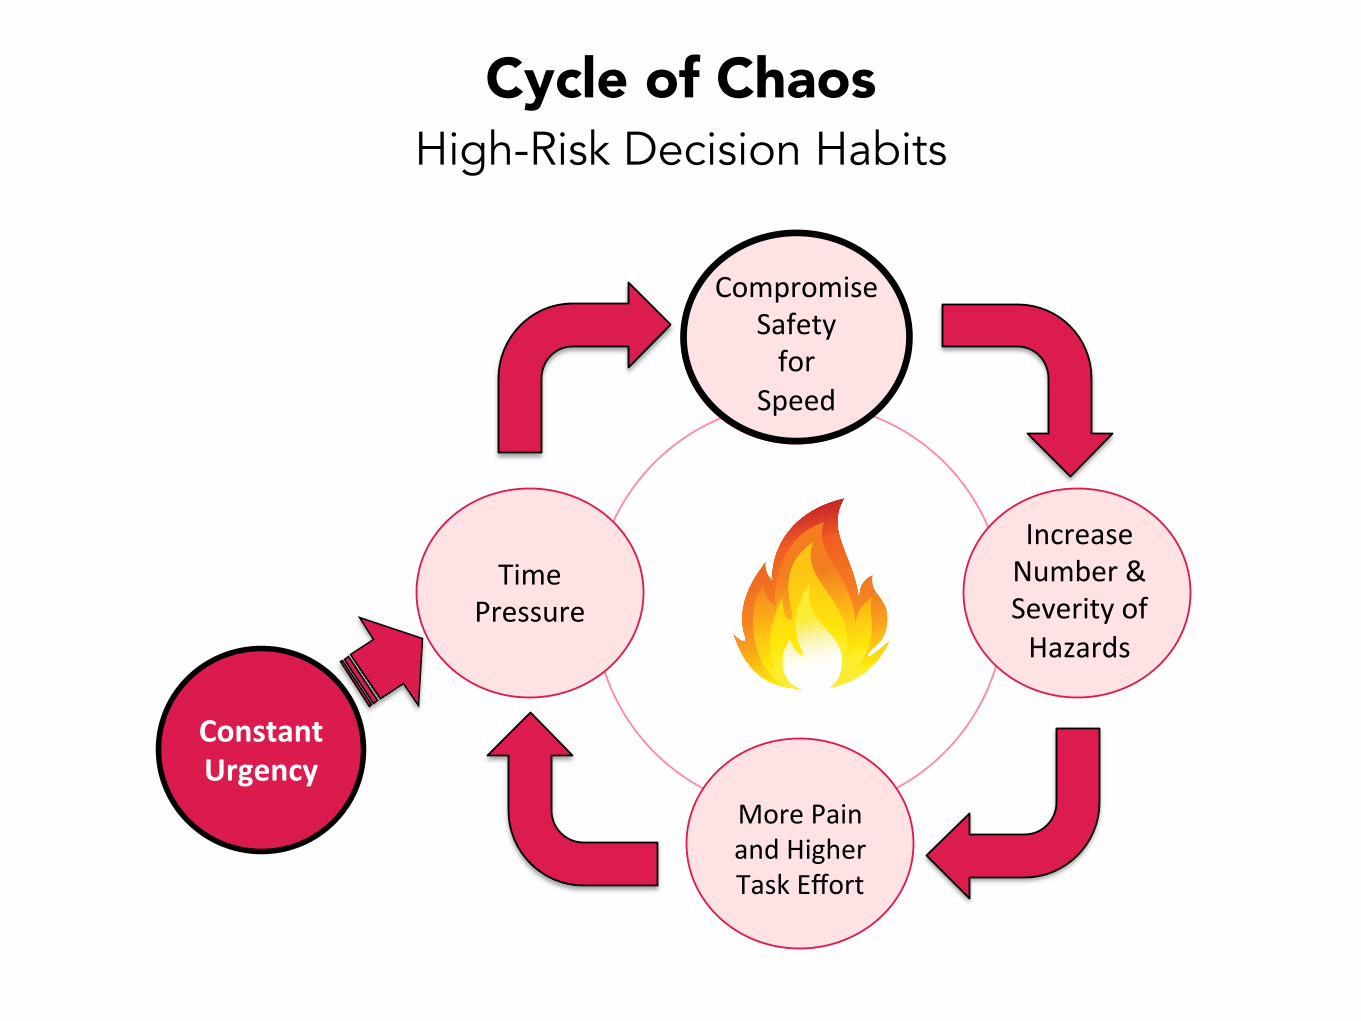
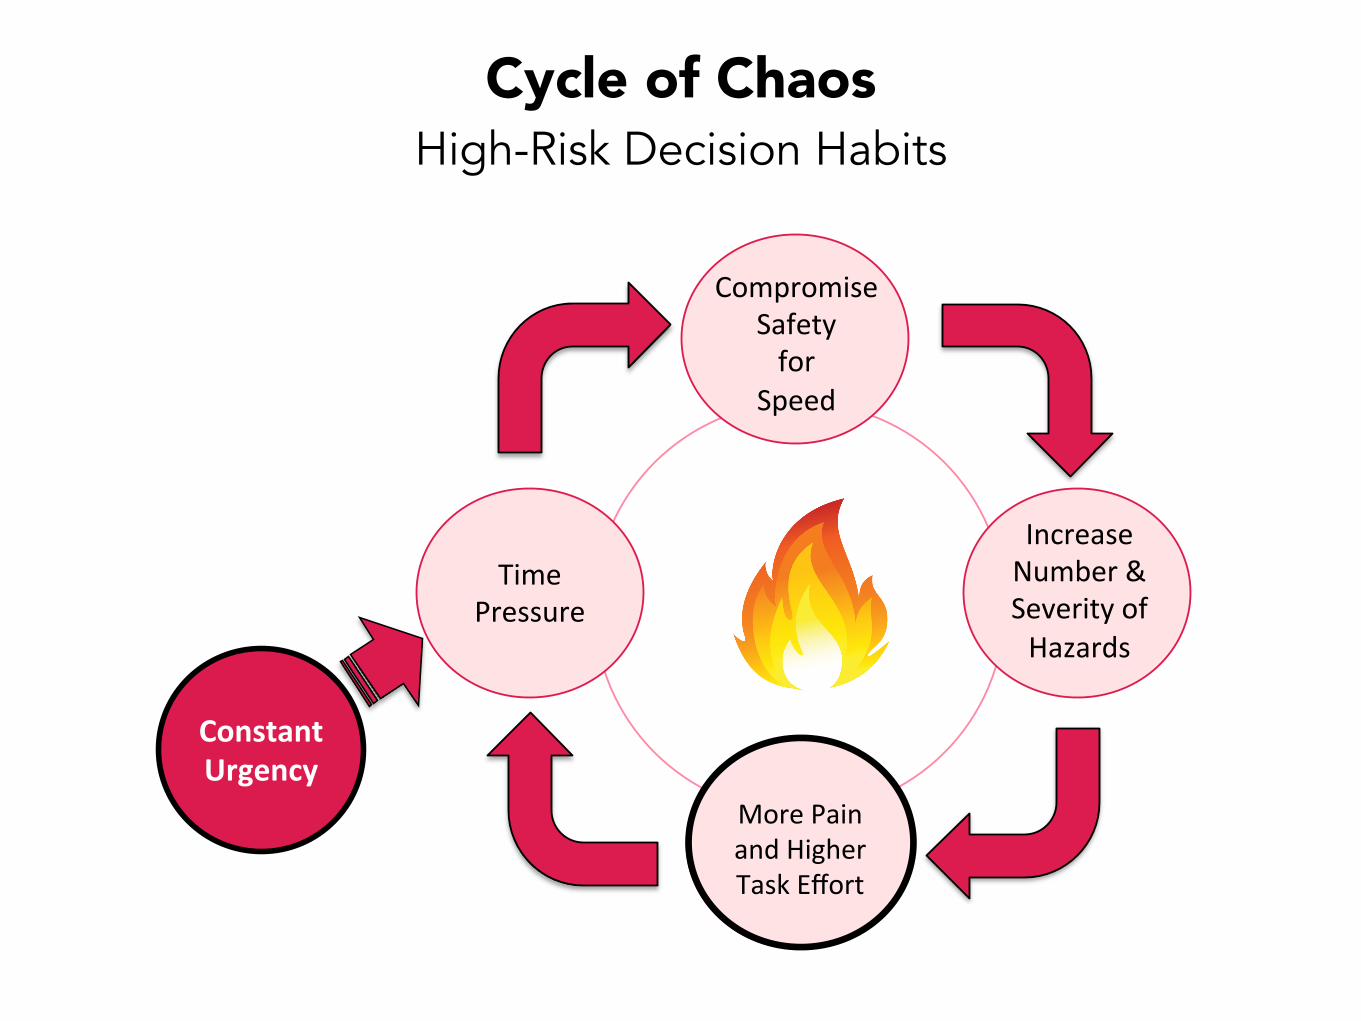
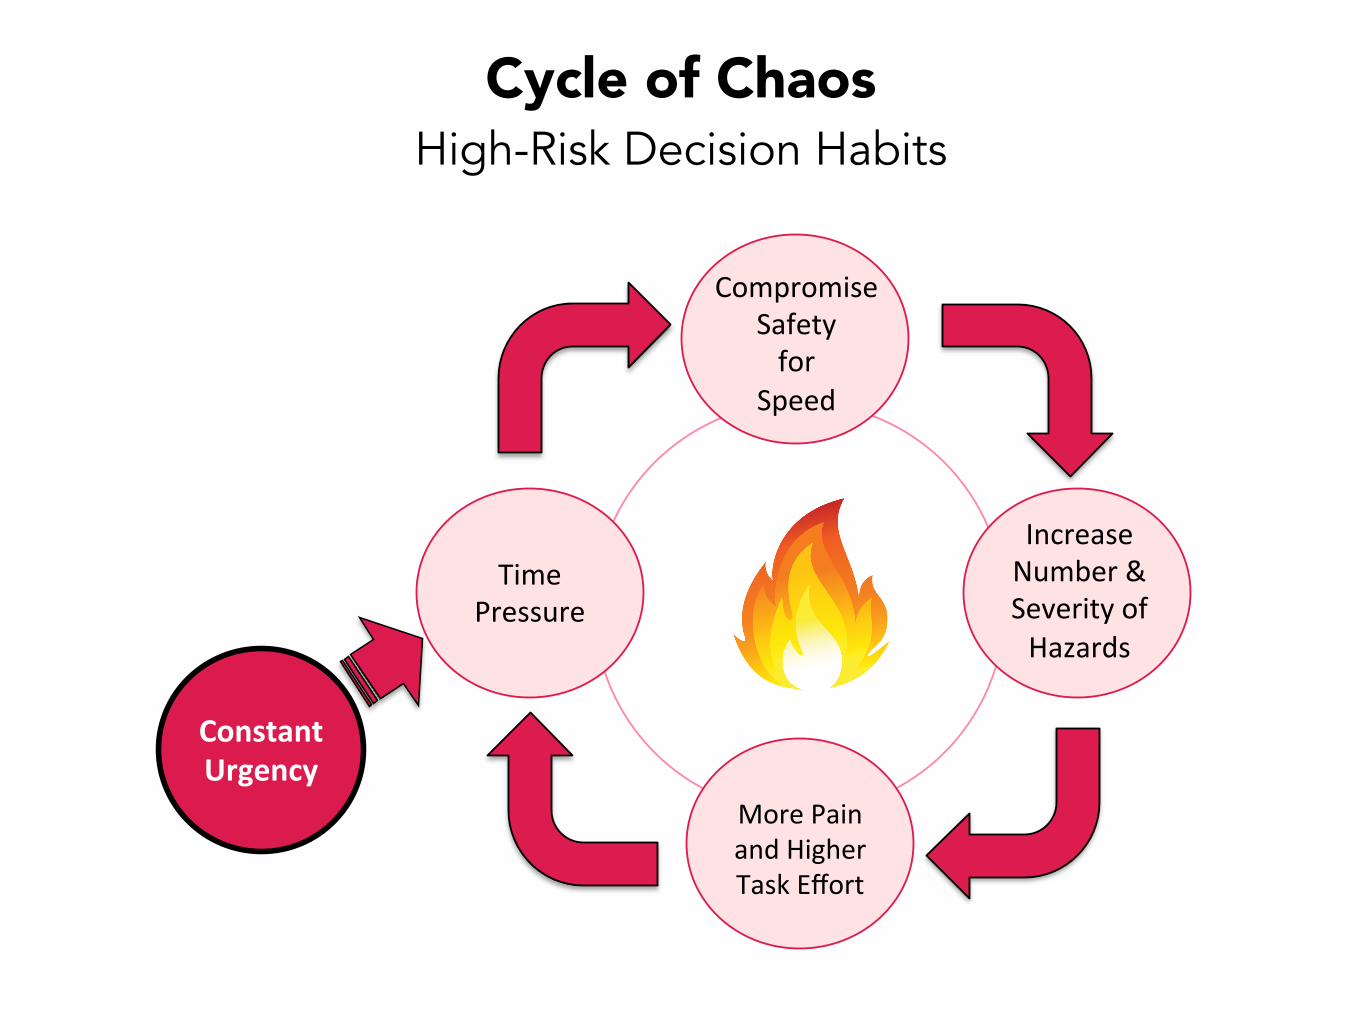
Constant Urgency
Compromise Safety for Speed

Time%Pressure%
Compromise%Safety%for%
Speed%
Increase%Number%&%Severity%of%Hazards%
%
More%Pain%and%Higher%Task%Effort%
Constant'Urgency'
Cycle of Chaos High-Risk Decision Habits
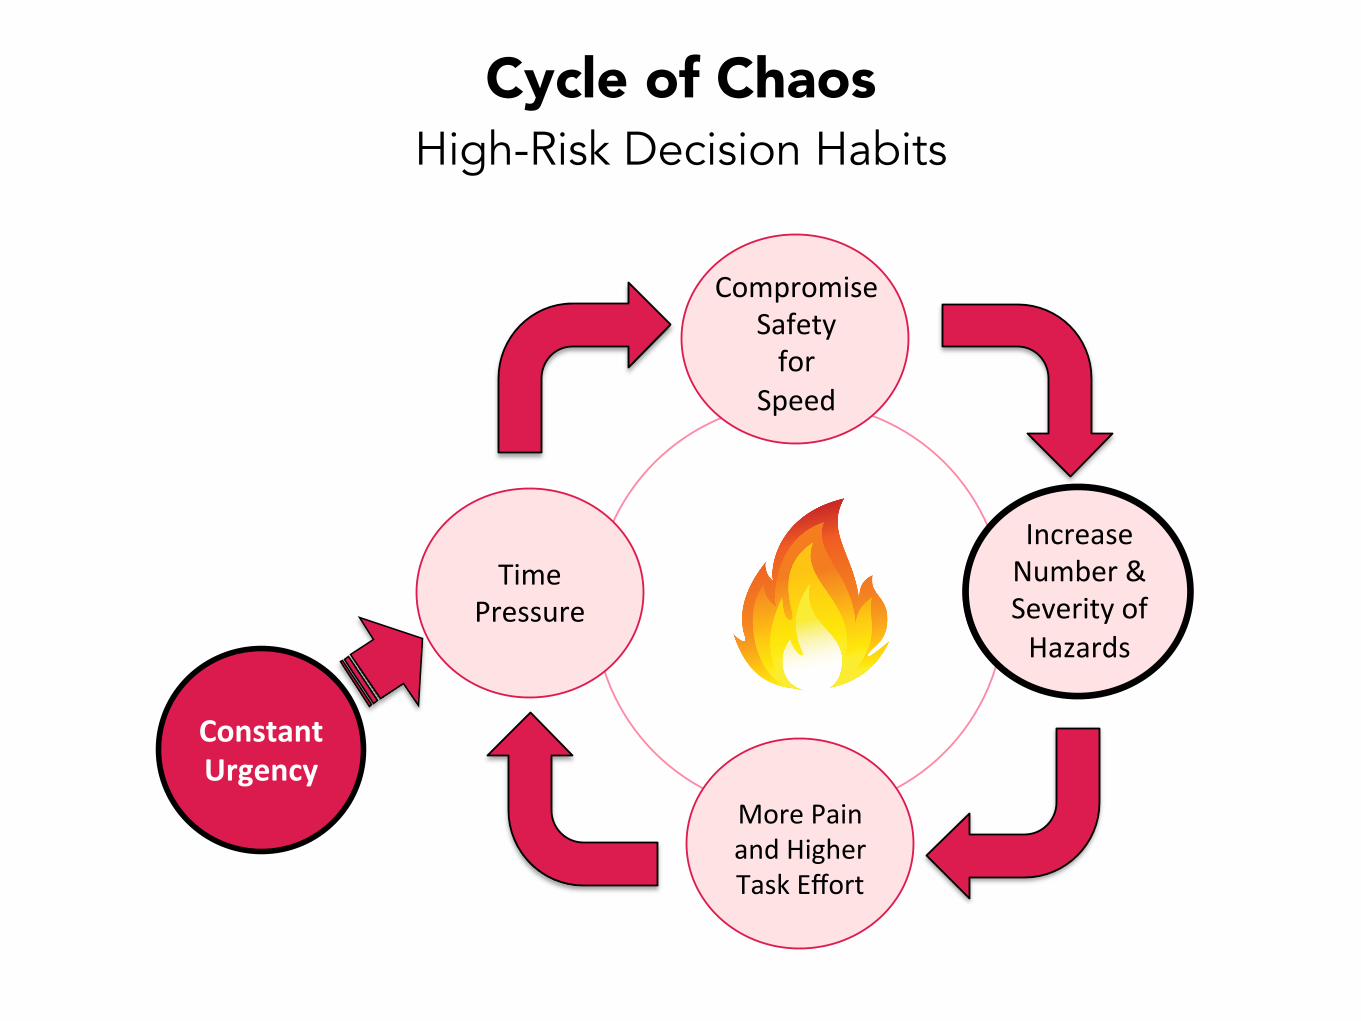
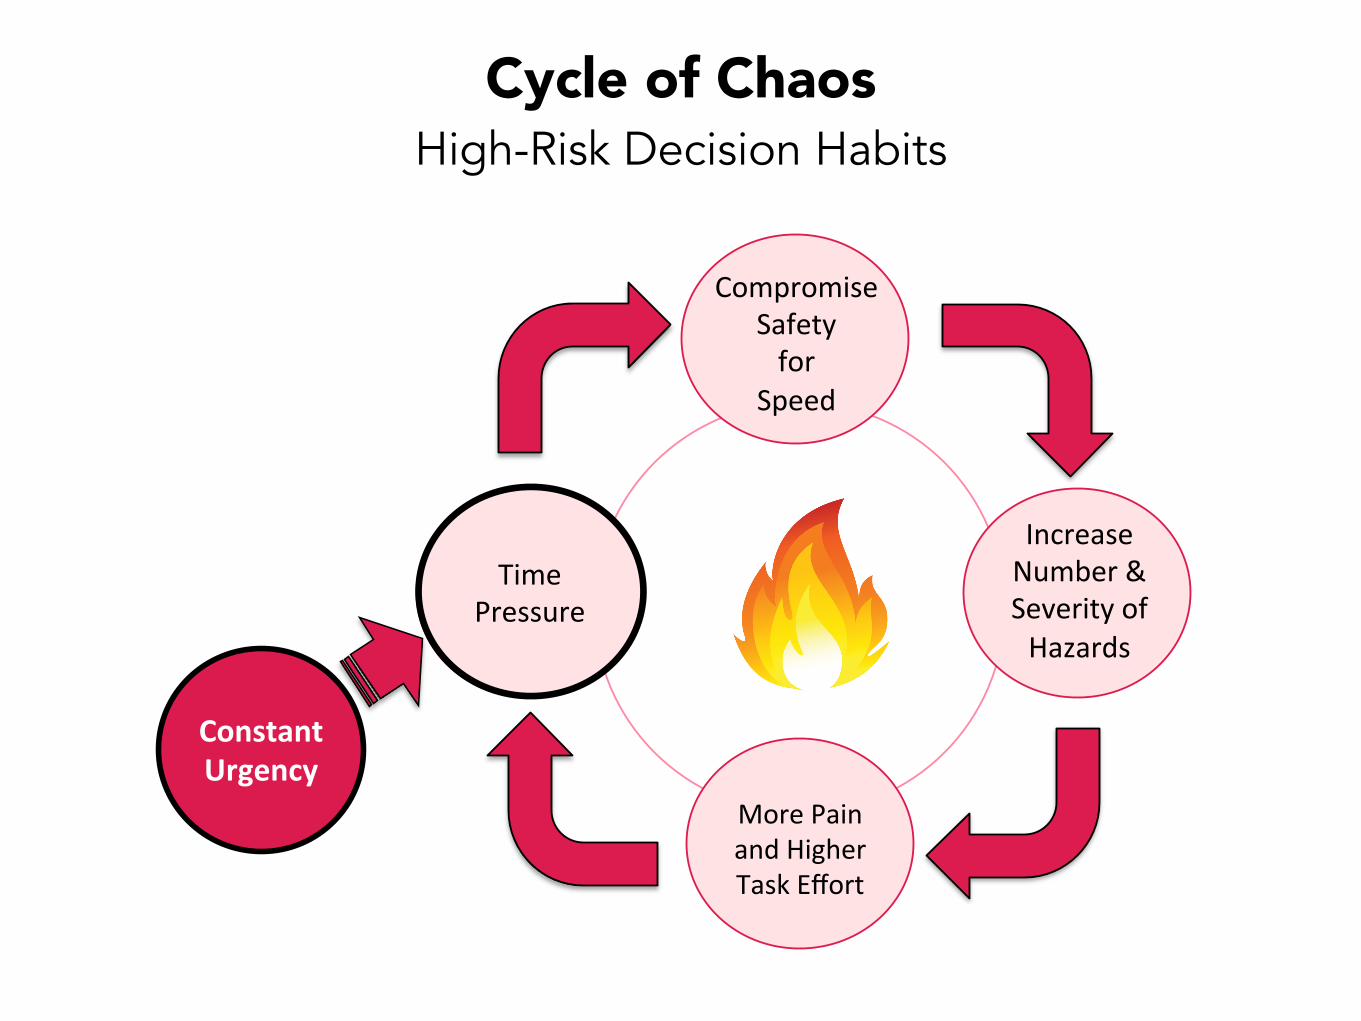
Time%Pressure%
Compromise%Safety%for%
Speed%
Increase%Number%&%Severity%of%Hazards%
%
More%Pain%and%Higher%Task%Effort%
Constant'Urgency'
Cycle of Chaos High-Risk Decision Habits
Time%Pressure%
Compromise%Safety%for%
Speed%
Increase%Number%&%Severity%of%Hazards%
%
More%Pain%and%Higher%Task%Effort%
Constant'Urgency'
Cycle of Chaos High-Risk Decision Habits
Time%Pressure%
Compromise%Safety%for%
Speed%
Increase%Number%&%Severity%of%Hazards%
%
More%Pain%and%Higher%Task%Effort%
Constant'Urgency'
Cycle of Chaos High-Risk Decision Habits
Time%Pressure%
Compromise%Safety%for%
Speed%
Increase%Number%&%Severity%of%Hazards%
%
More%Pain%and%Higher%Task%Effort%
Constant'Urgency'
Cycle of Chaos High-Risk Decision Habits
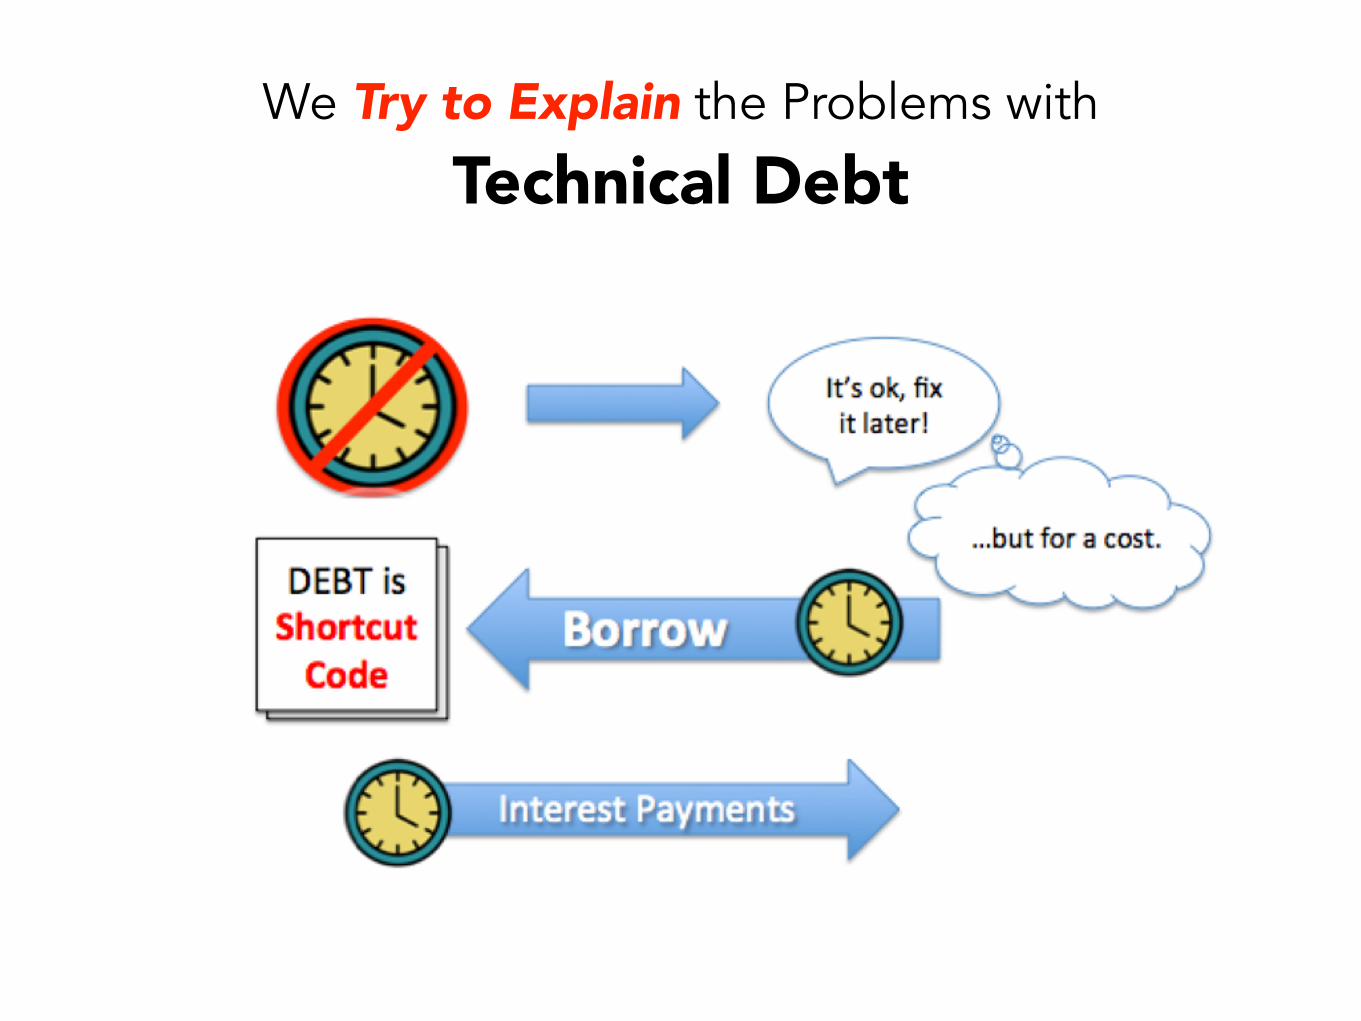
We Try to Explain the Problems with Technical Debt
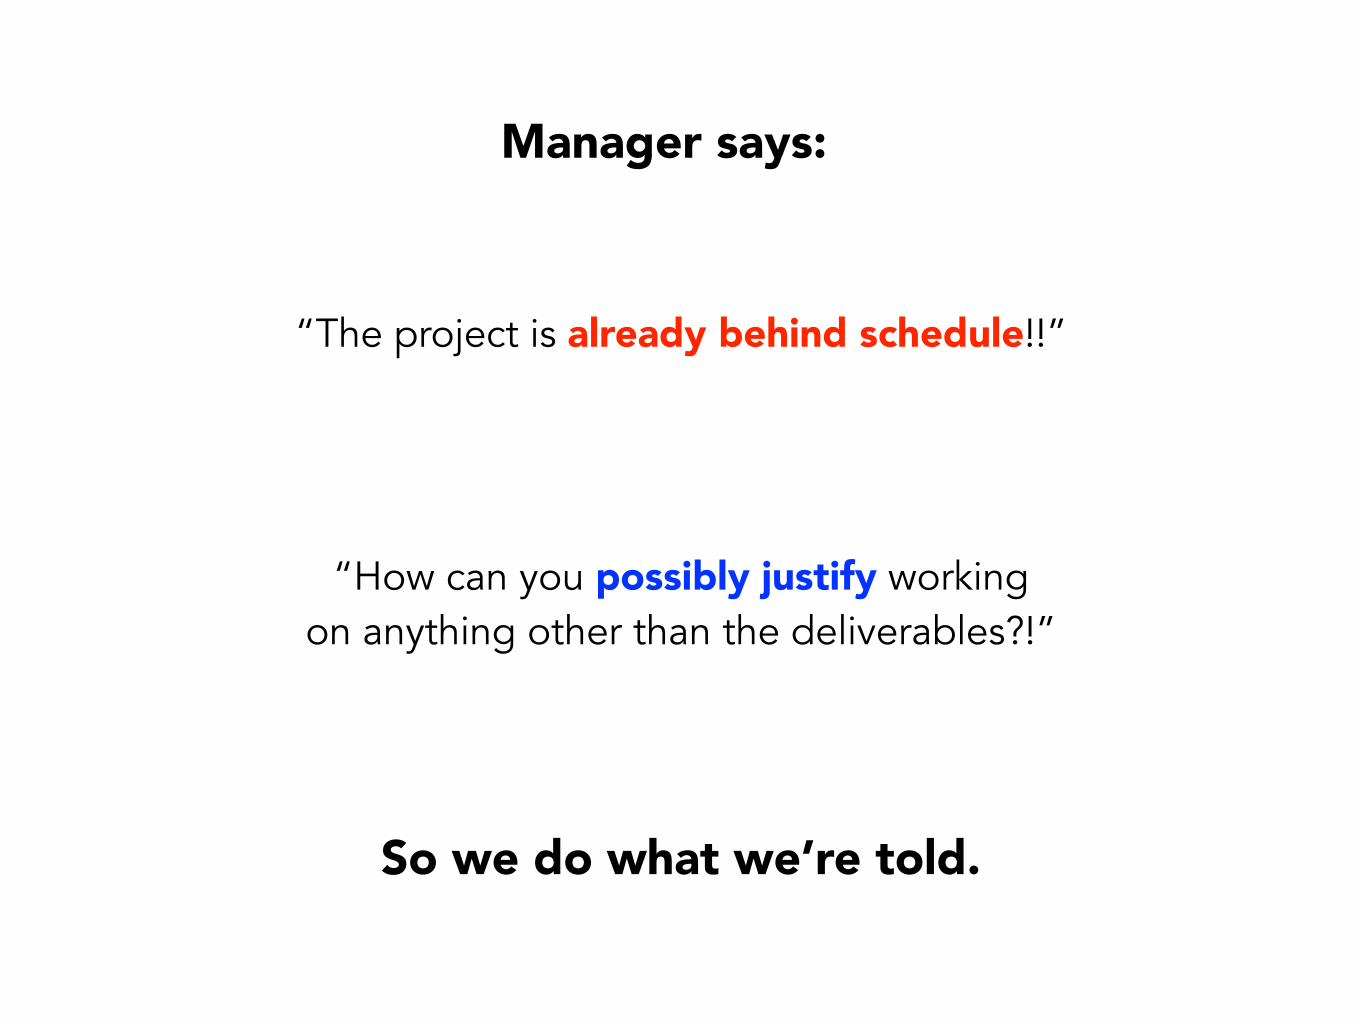
“The project is already behind schedule!!”
Manager says:
“How can you possibly justify working on anything other than the deliverables?!”
So we do what we’re told.
PAIN
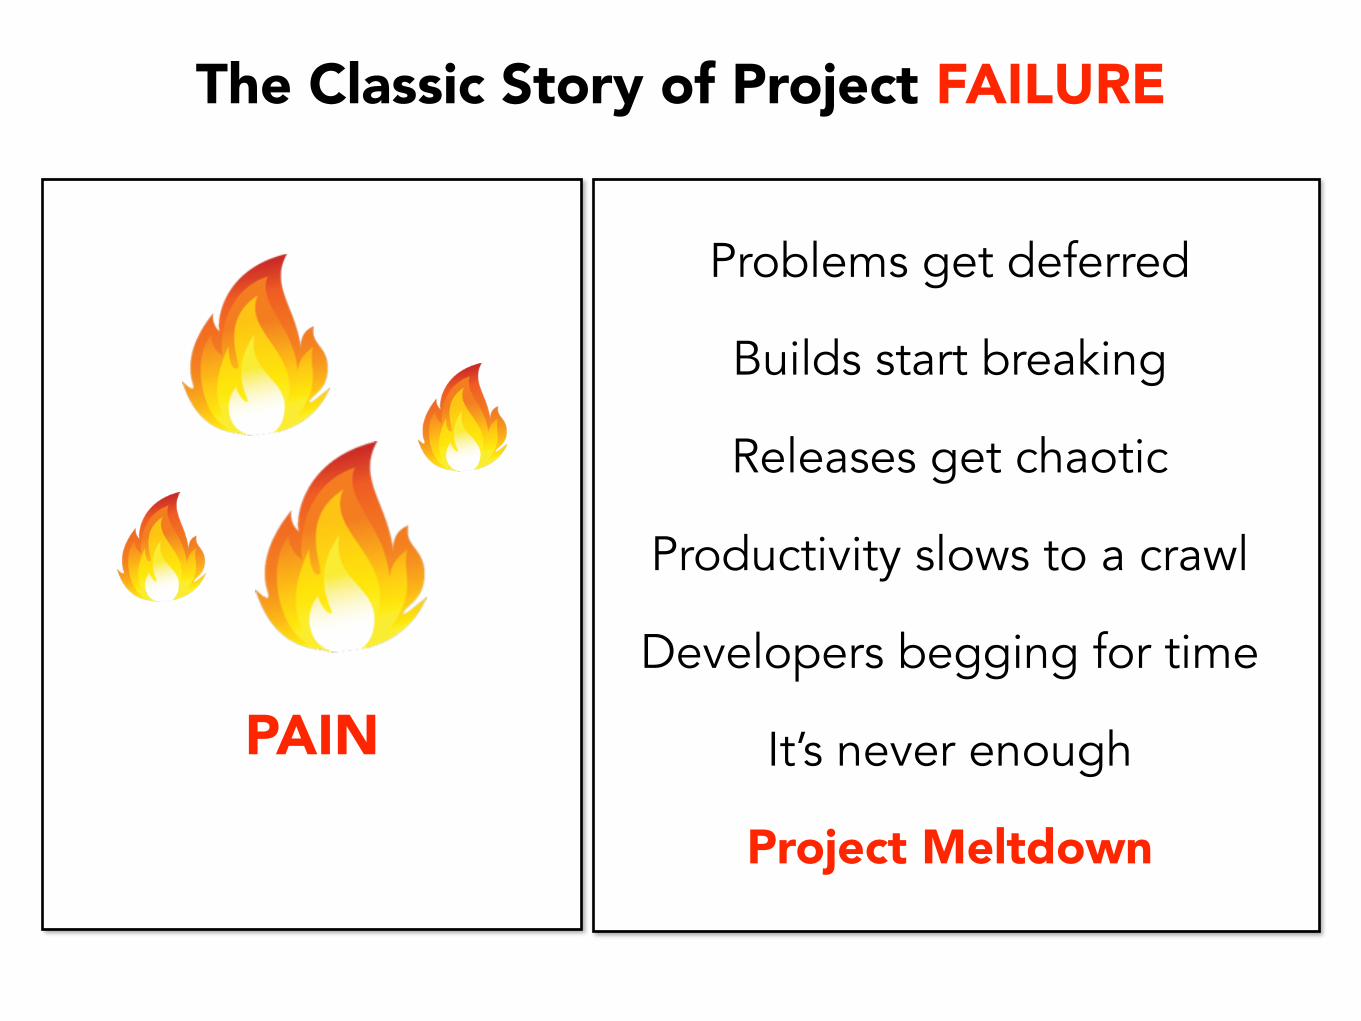
The Classic Story of Project FAILURE
Problems get deferred
Builds start breaking
Releases get chaotic
Productivity slows to a crawl
Developers begging for time
It’s never enough
Project Meltdown
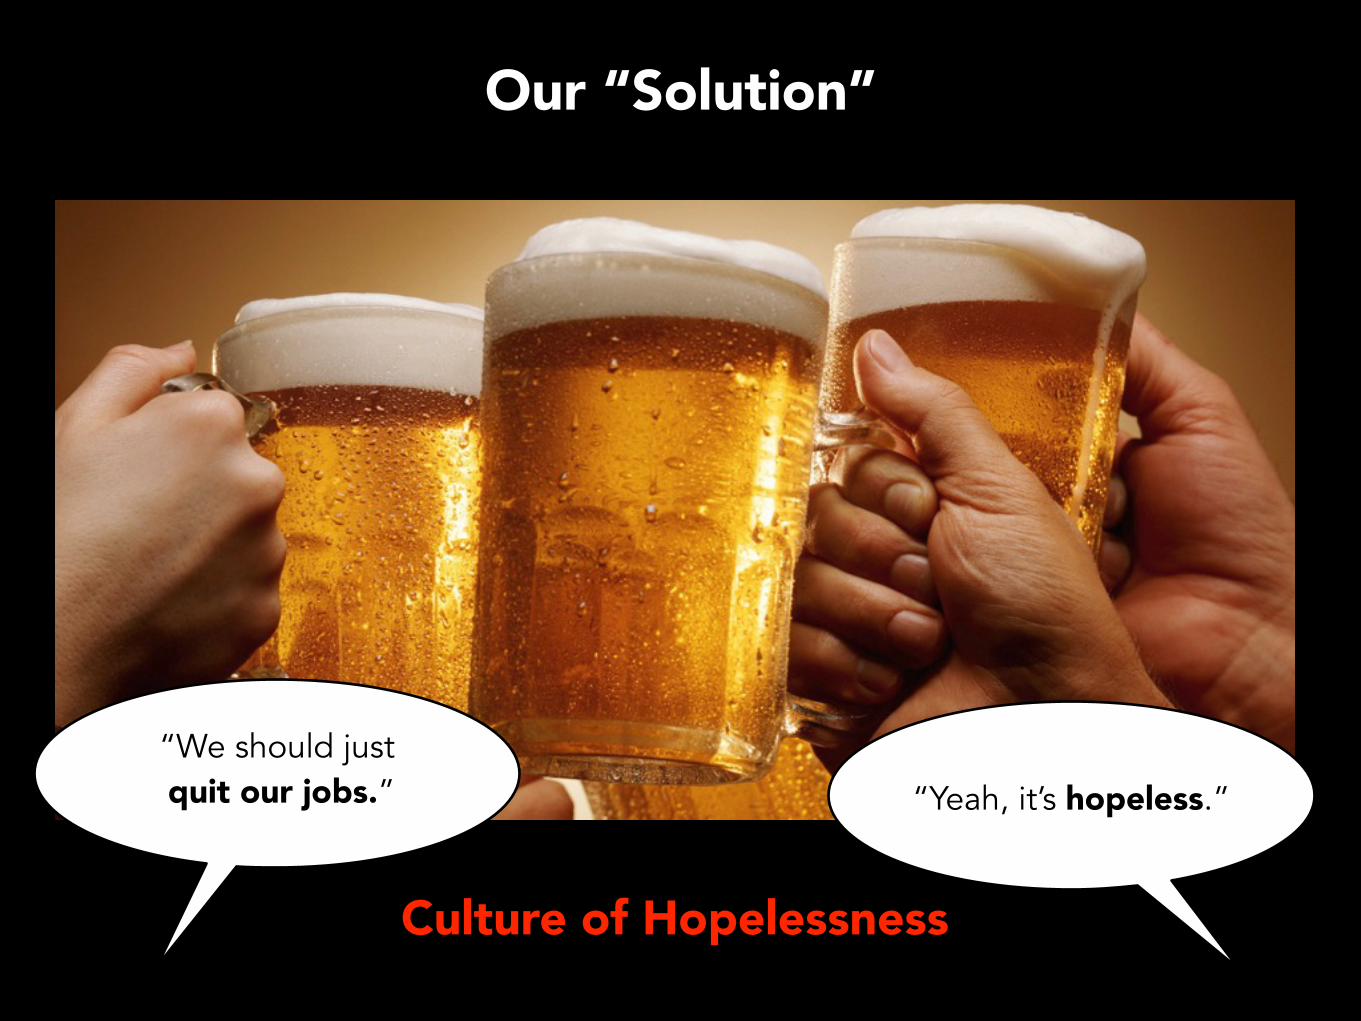
Our “Solution”
“We should just quit our jobs.” “Yeah, it’s hopeless.”
Culture of Hopelessness
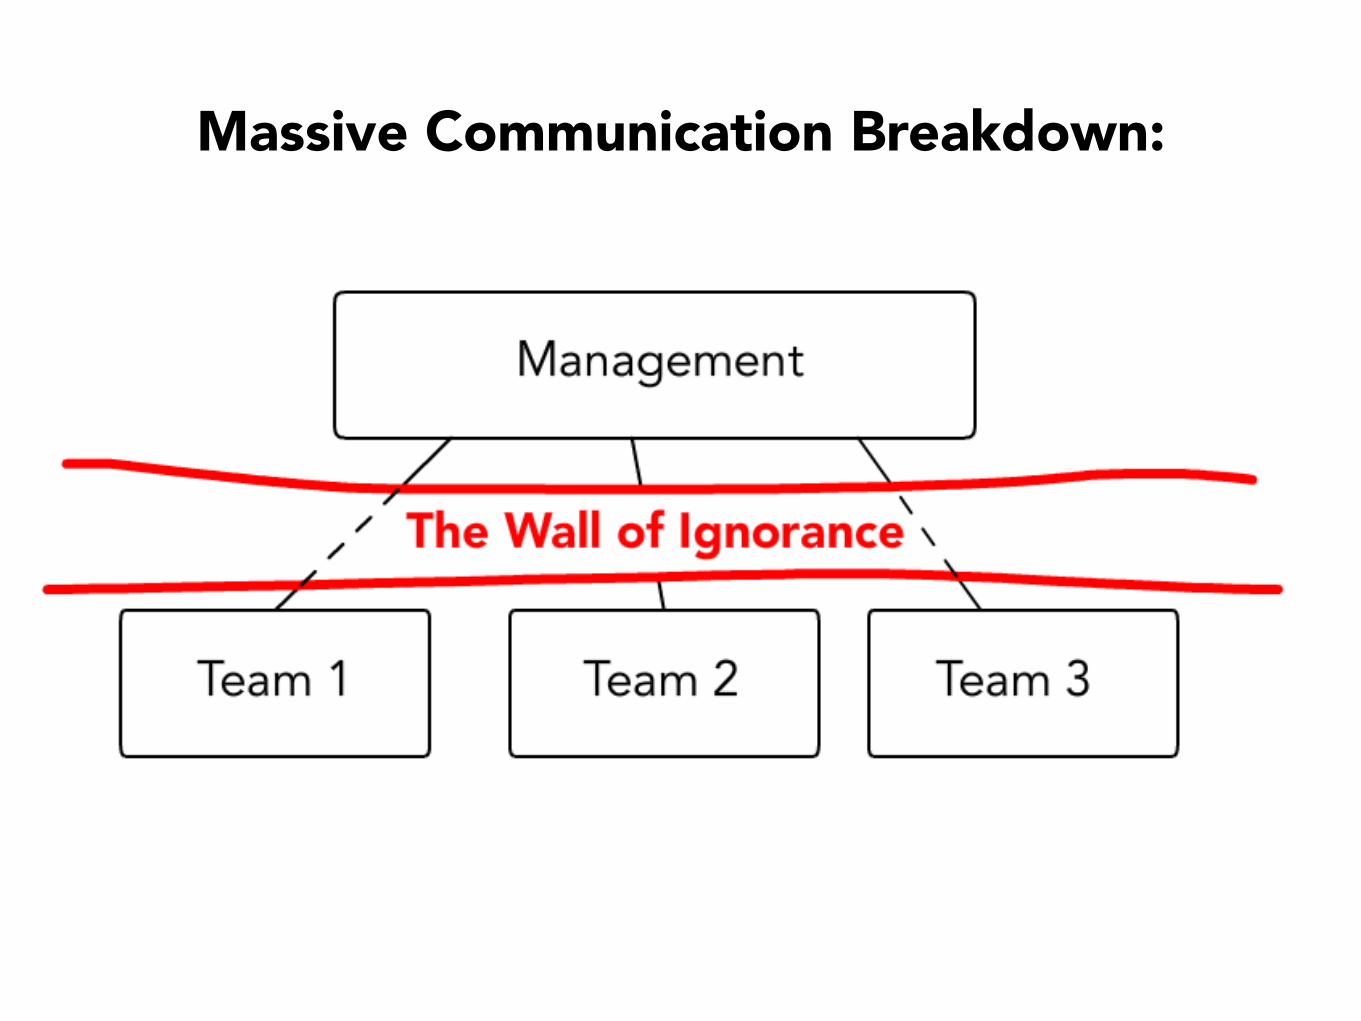
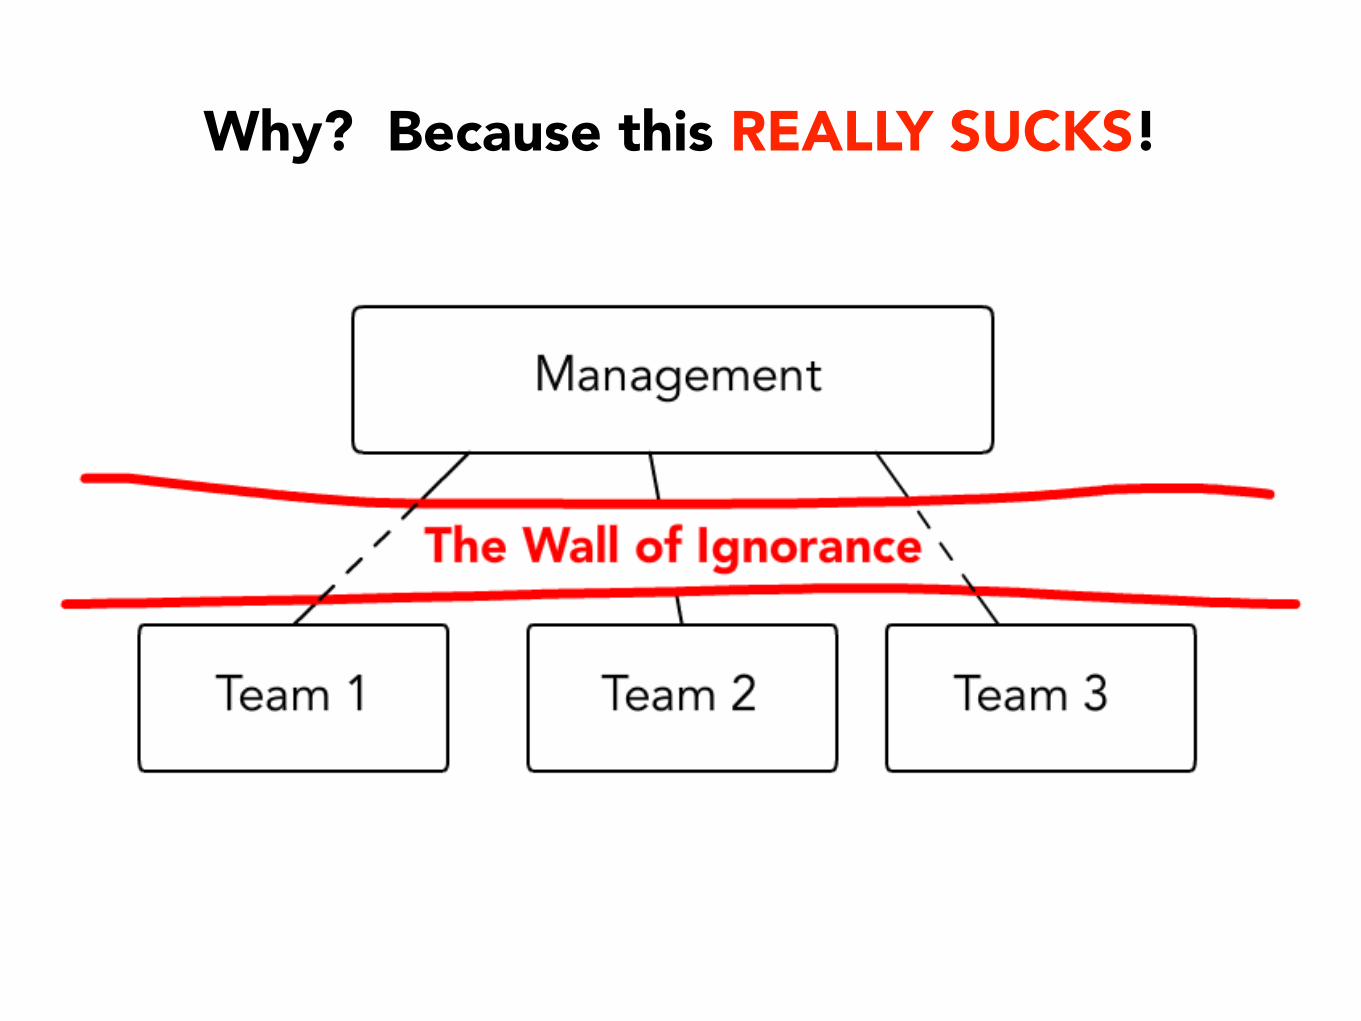
Massive Communication Breakdown:
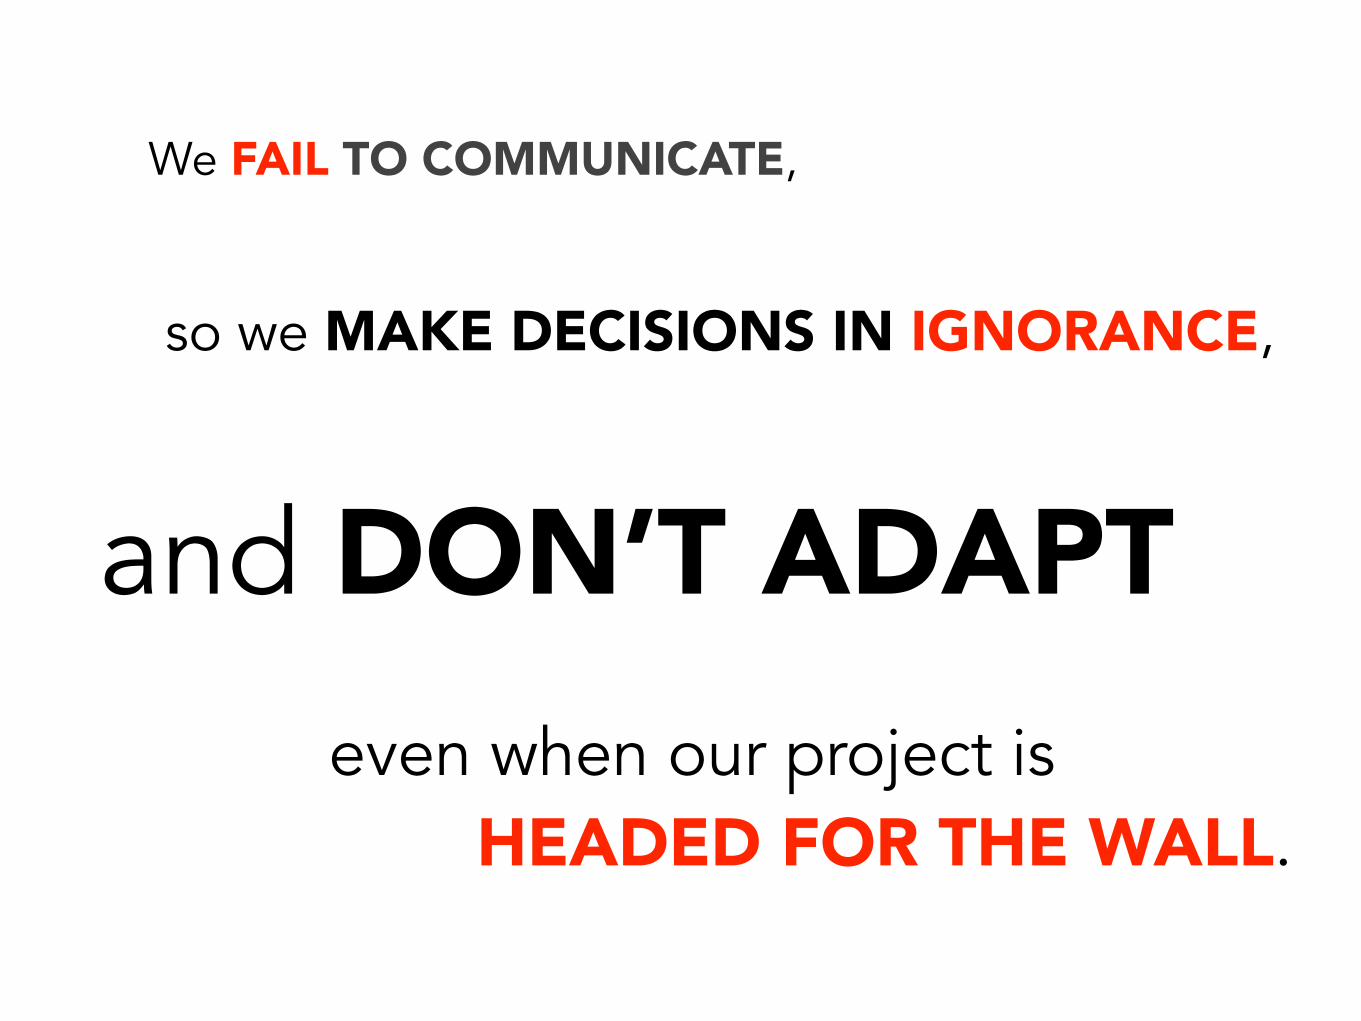
We FAIL TO COMMUNICATE,
so we MAKE DECISIONS IN IGNORANCE,
and DON’T ADAPT even when our project is HEADED FOR THE WALL.
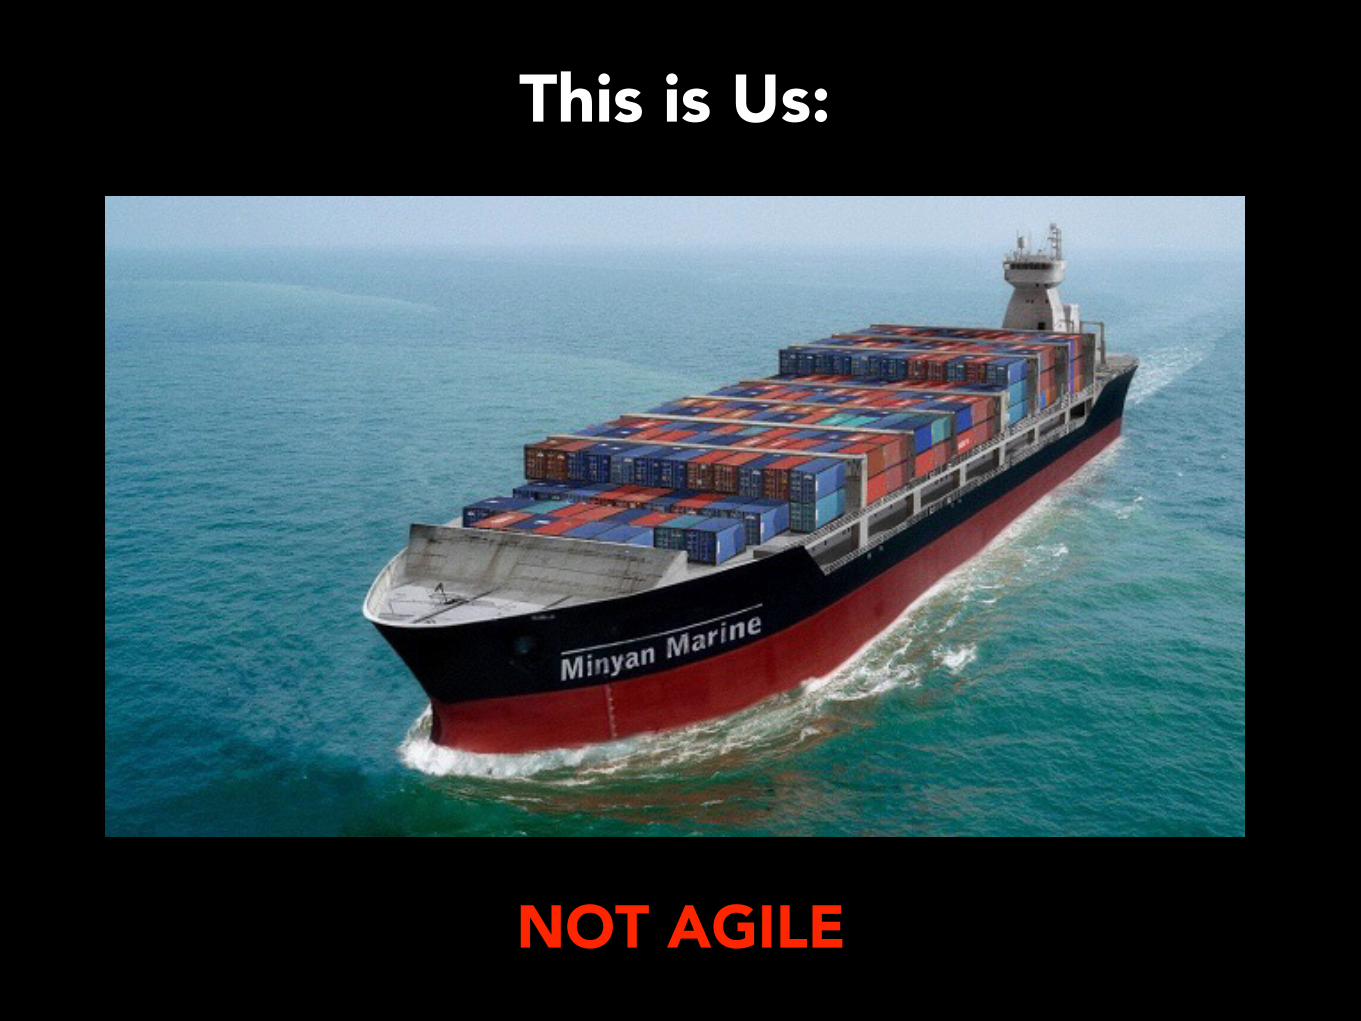
This is Us:
NOT AGILE

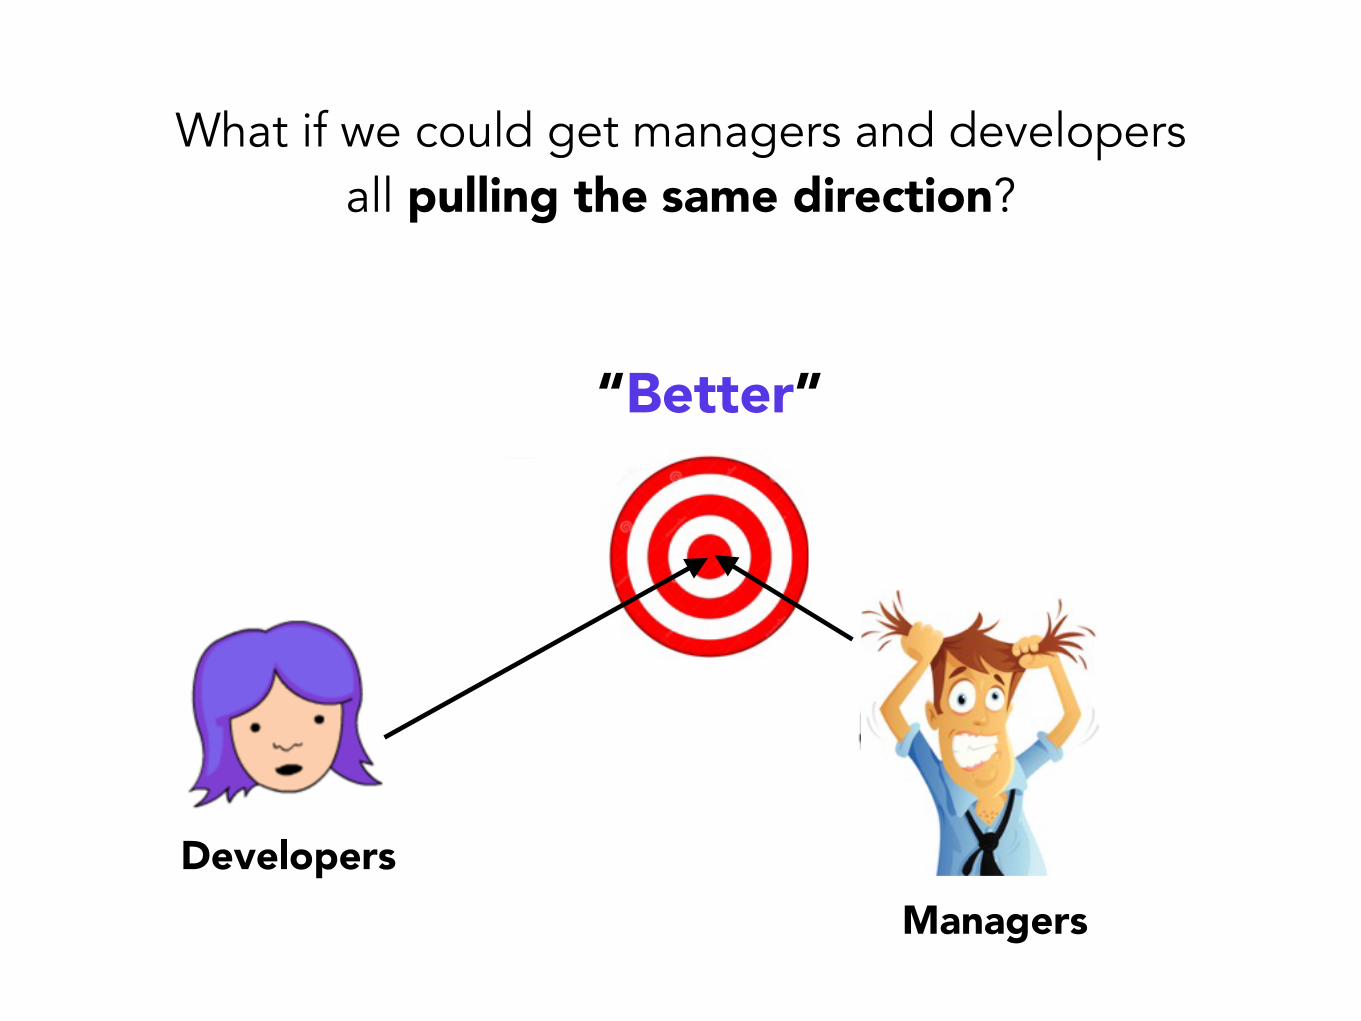
“Better”“Better”
What if we could get managers and developers all pulling the same direction?
ManagersDevelopers
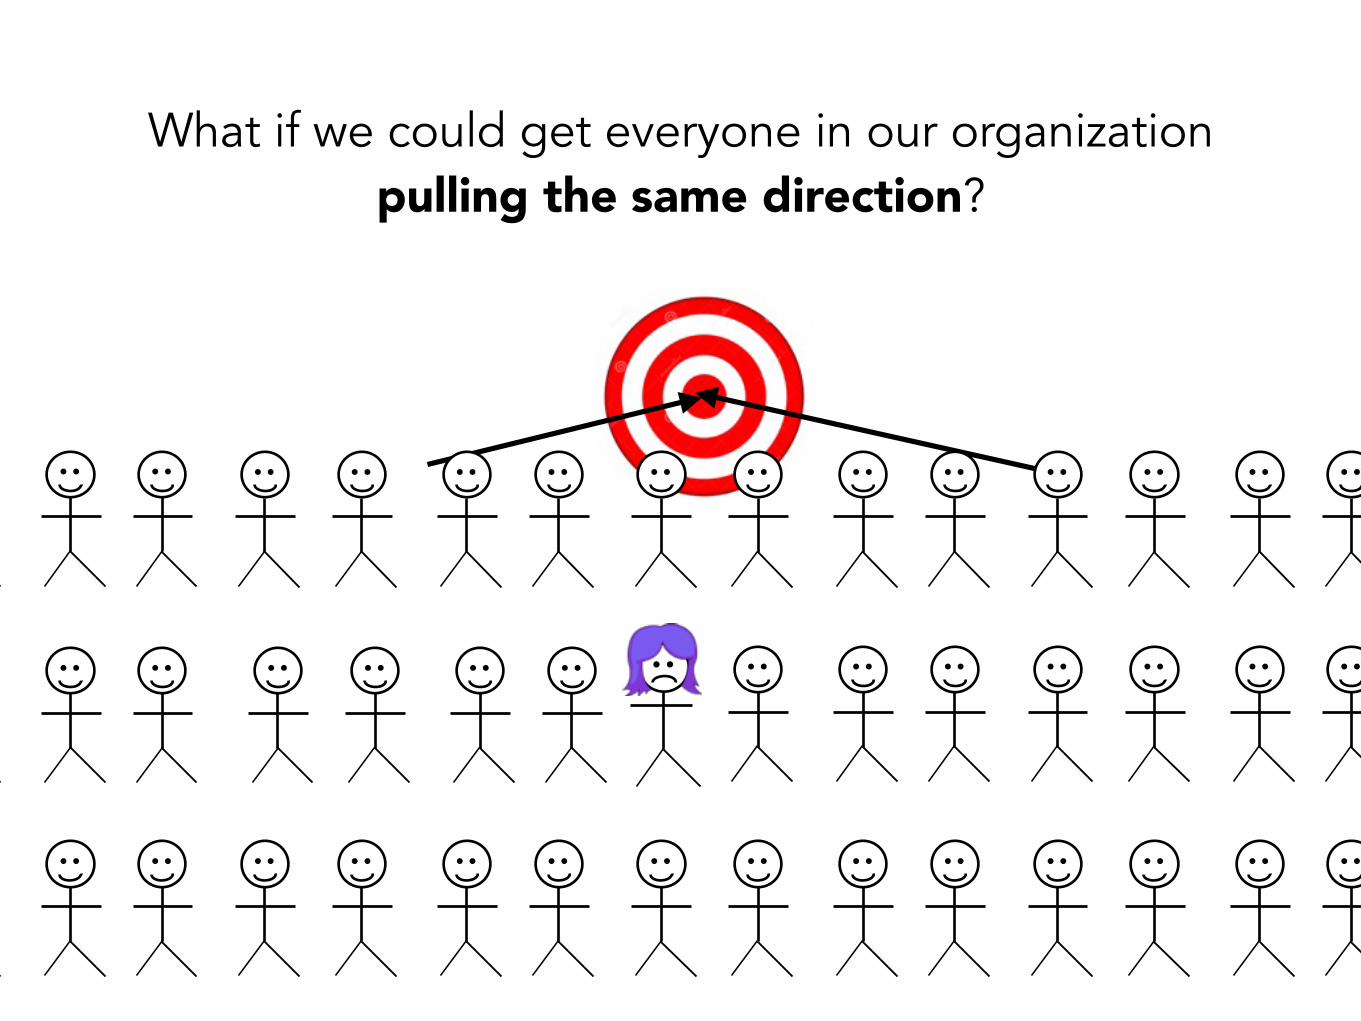
What if we could get everyone in our organization pulling the same direction?

CompanyCompany
Company
Company
Company
Company Company
What if we could solve this problem in all our companies?
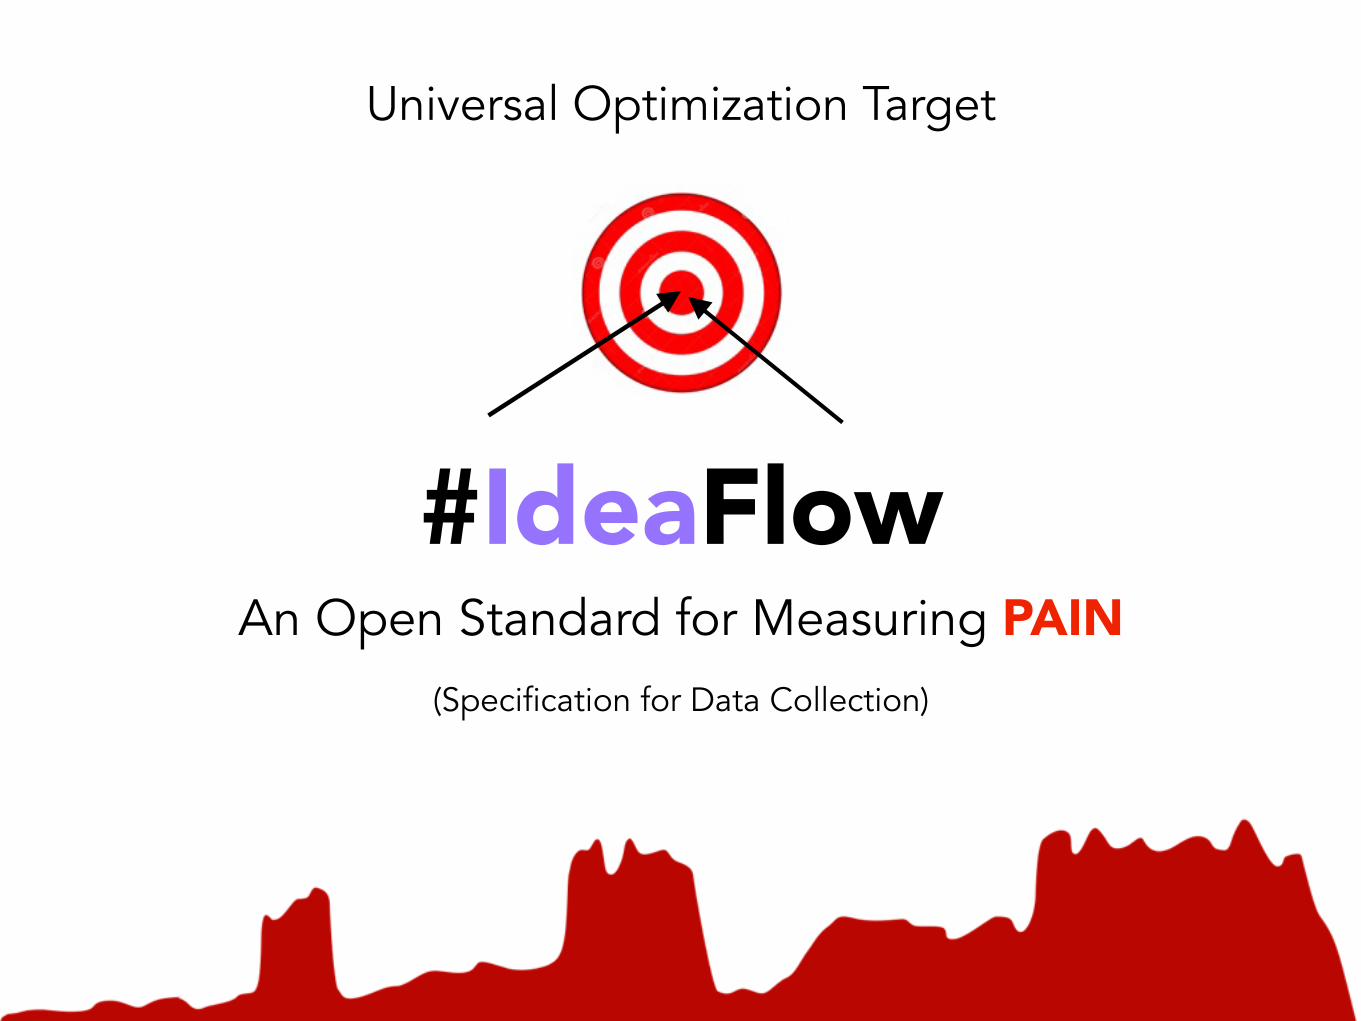
#IdeaFlowAn Open Standard for Measuring PAIN
(Specification for Data Collection)
Universal Optimization Target
How do we measure PAIN?

PAIN occurs during the process of understanding and extending the software
Complex(So*ware(
PAIN
Not the Code.
Optimize “Idea Flow”
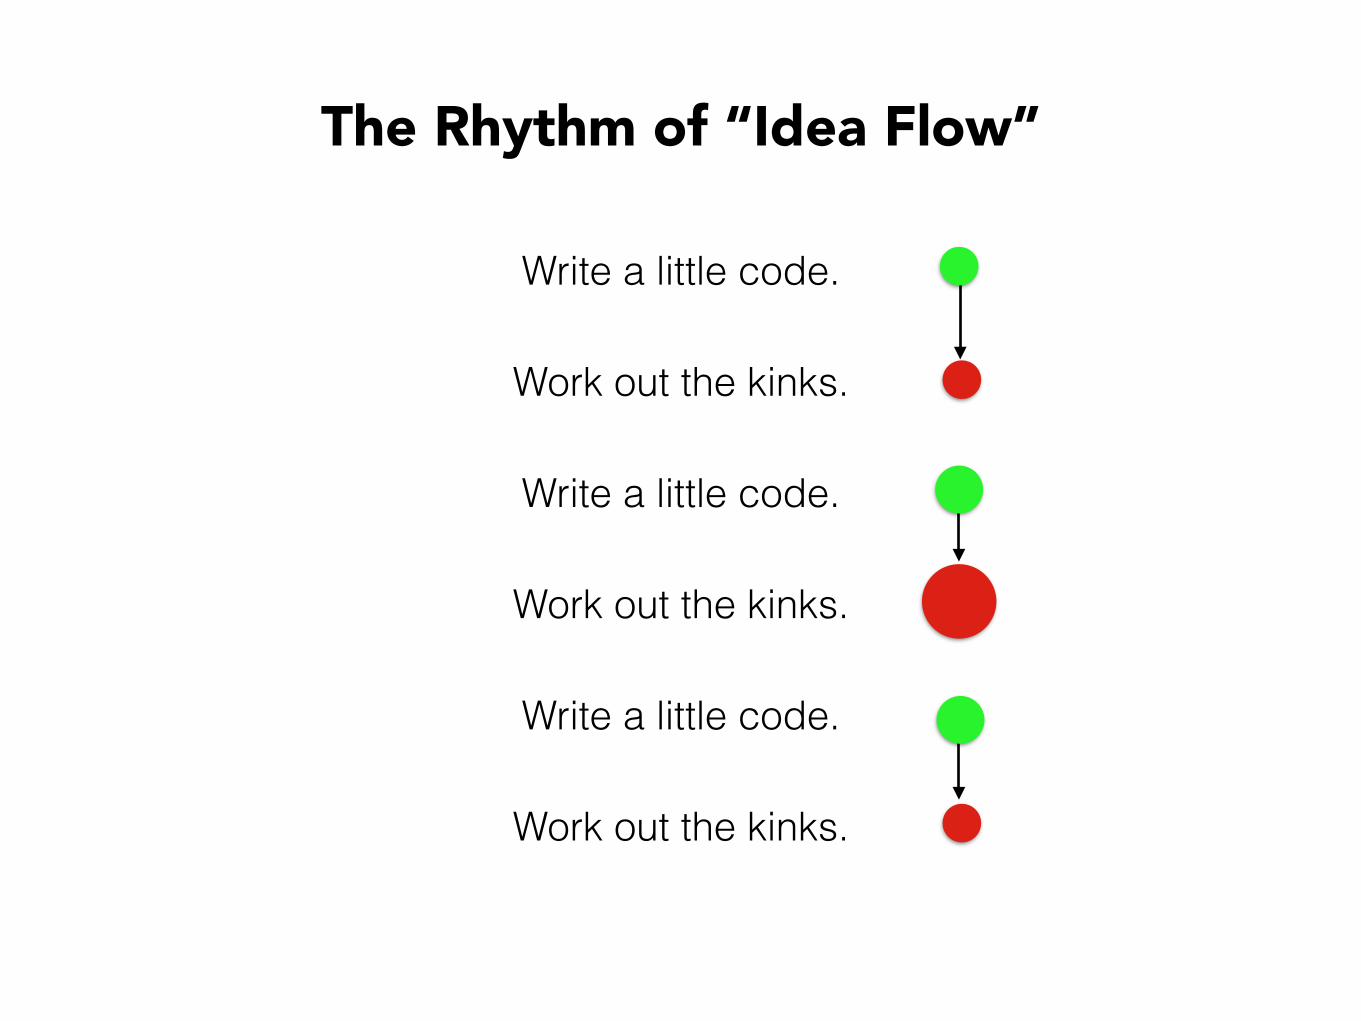
The Rhythm of “Idea Flow”
Write a little code.
Work out the kinks.
Write a little code.
Work out the kinks.
Write a little code.
Work out the kinks.
Conflict Confirm
Rework'
Learn'
Validate(
Modify'
Progress Loop Conflict Loop
Troubleshoot'
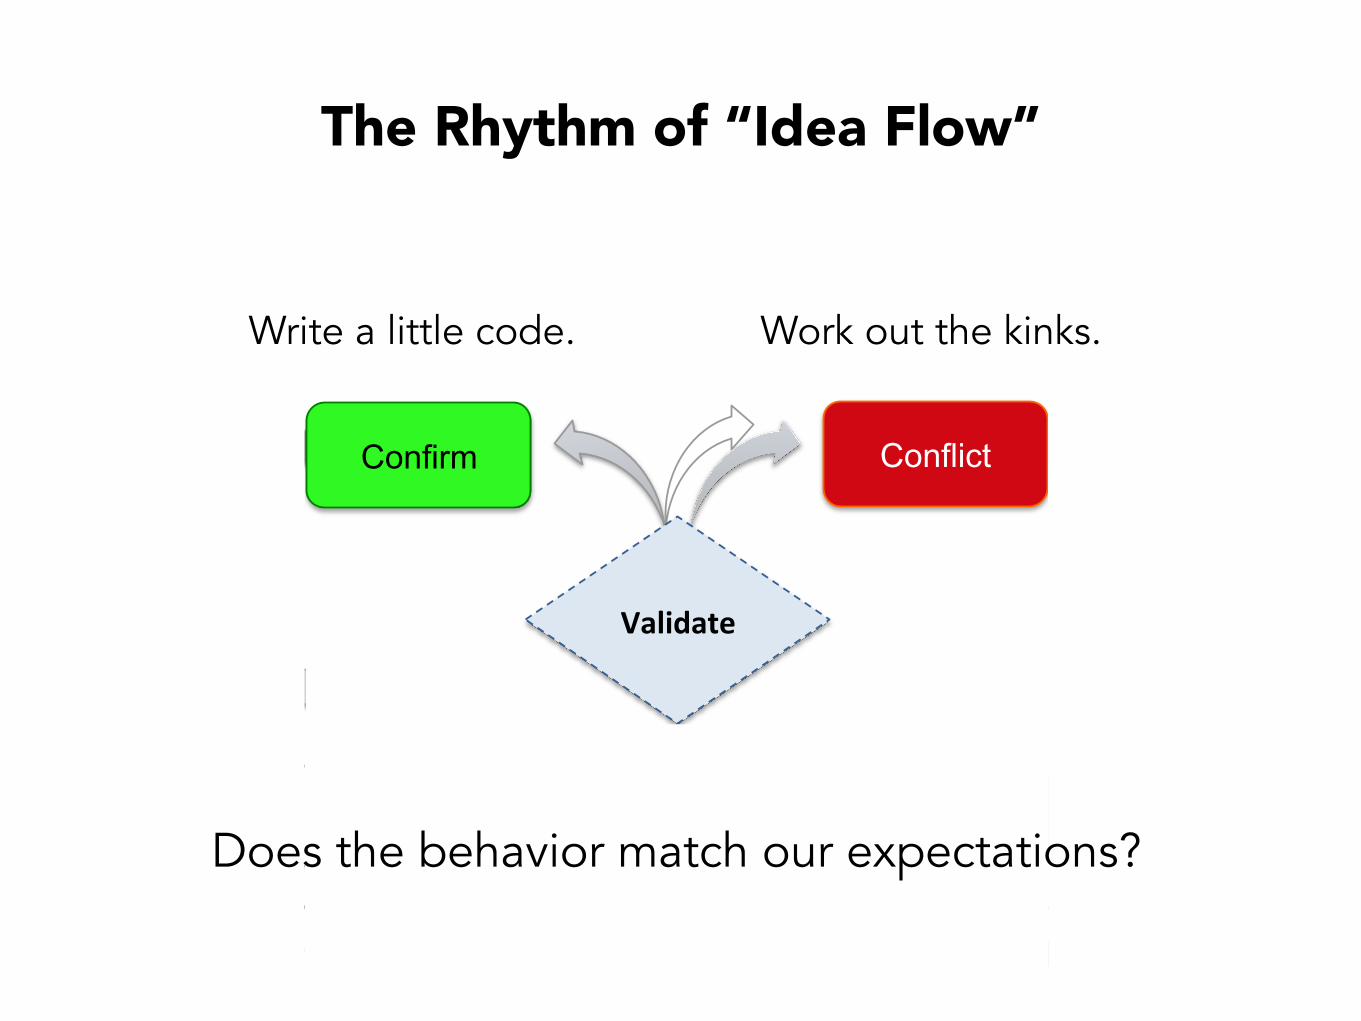
Write a little code. Work out the kinks.
The Rhythm of “Idea Flow”
Does the behavior match our expectations?
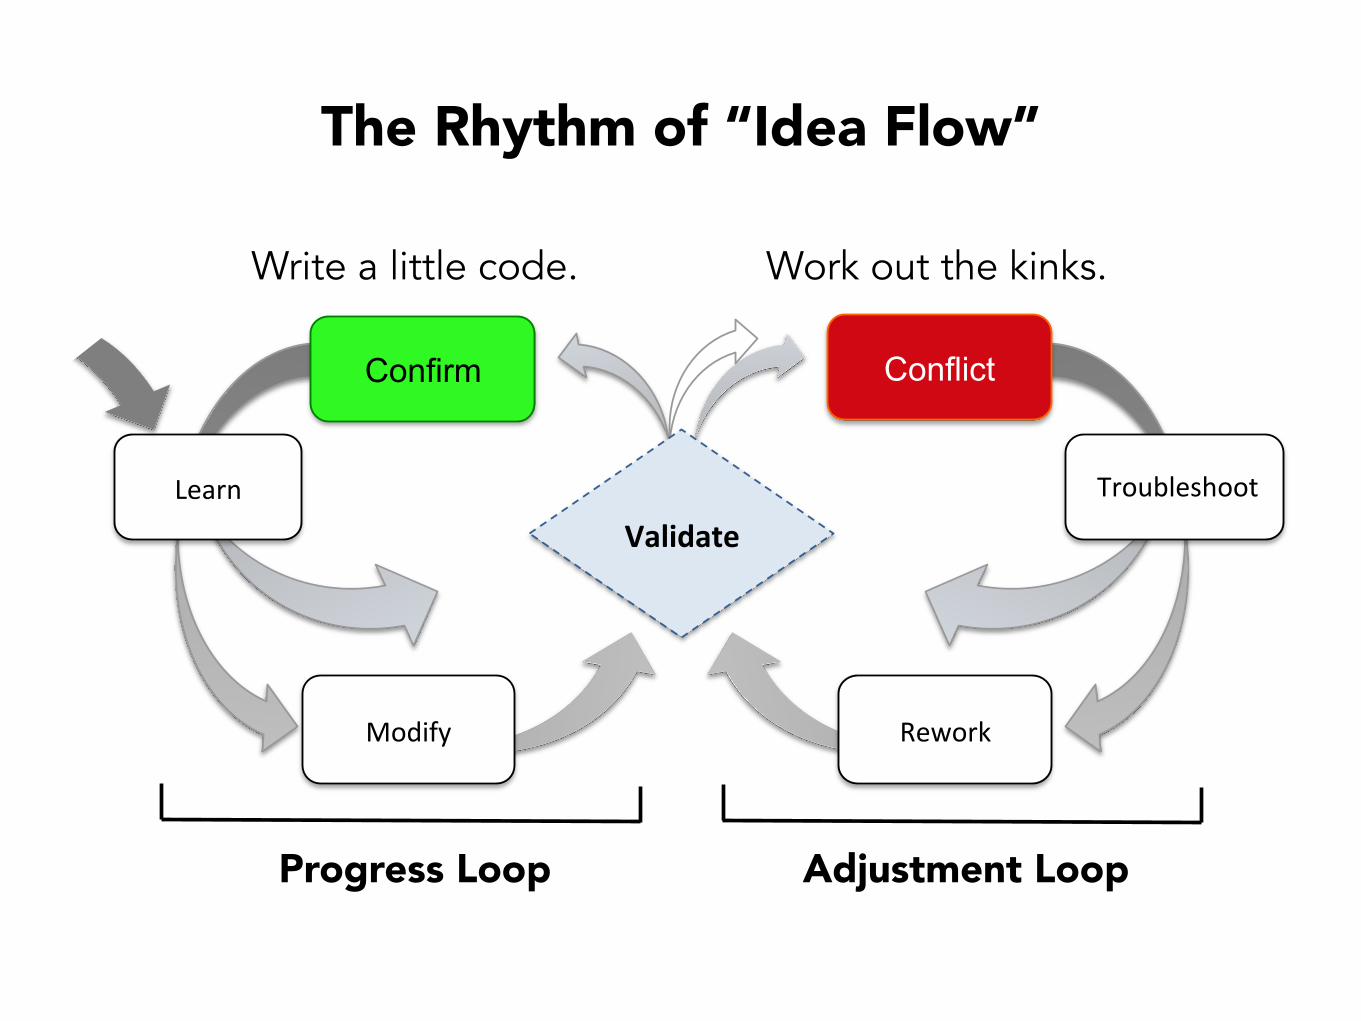
The Rhythm of “Idea Flow”
Conflict Confirm
Rework'
Learn'
Validate(
Modify'
Progress Loop Conflict Loop
Troubleshoot'
Write a little code. Work out the kinks.
Adjustment LoopProgress Loop
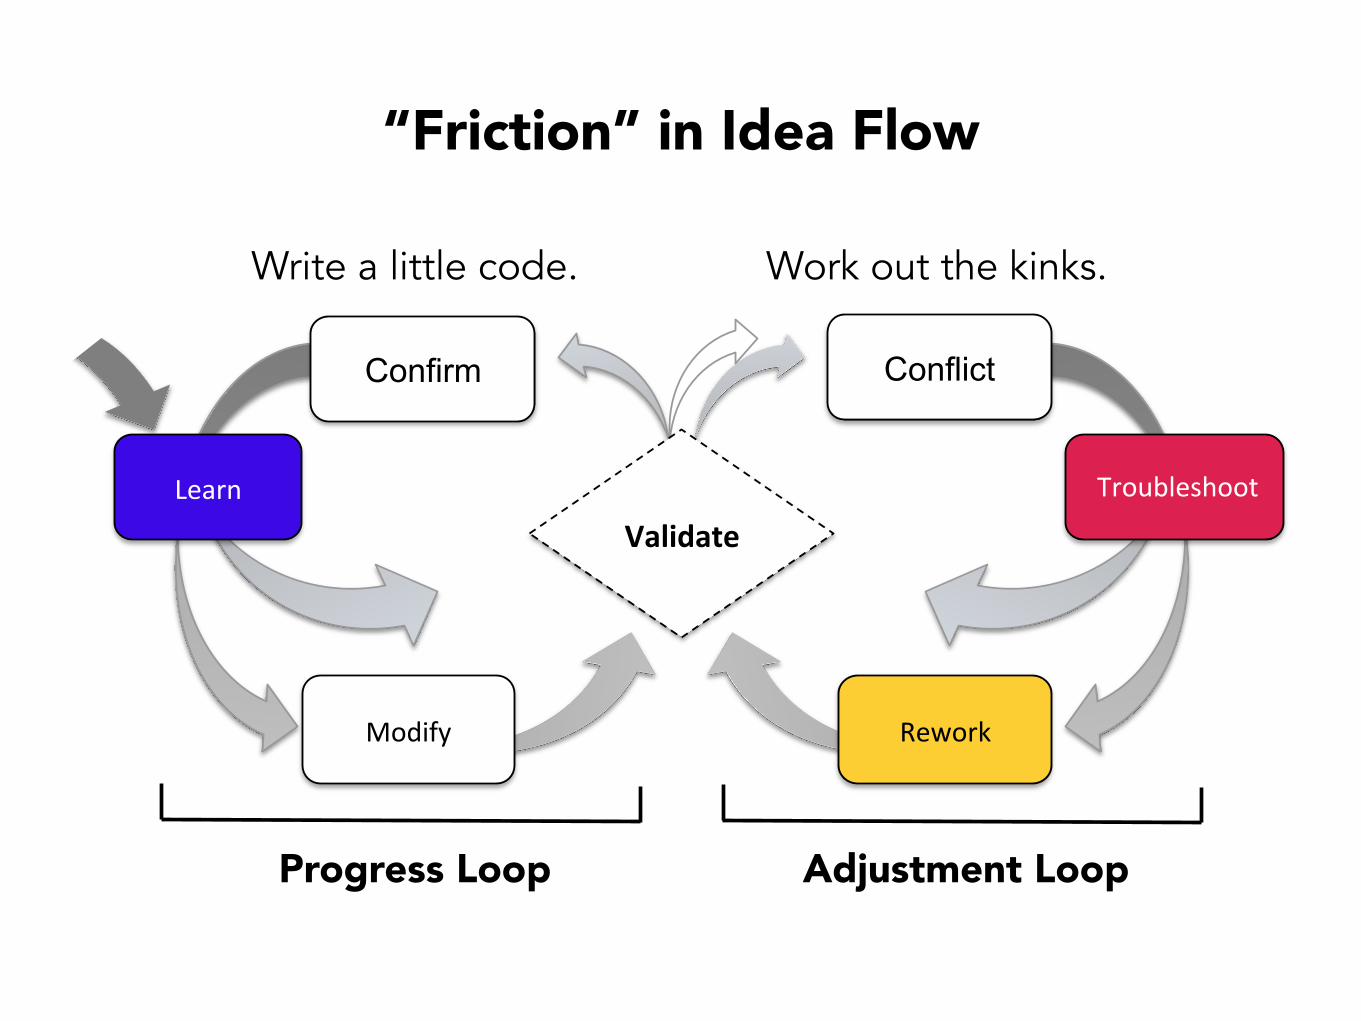
“Friction” in Idea Flow
Conflict Confirm
Rework'
Learn'
Validate(
Modify'
Progress Loop Conflict Loop
Troubleshoot'
Write a little code. Work out the kinks.
Adjustment LoopProgress Loop
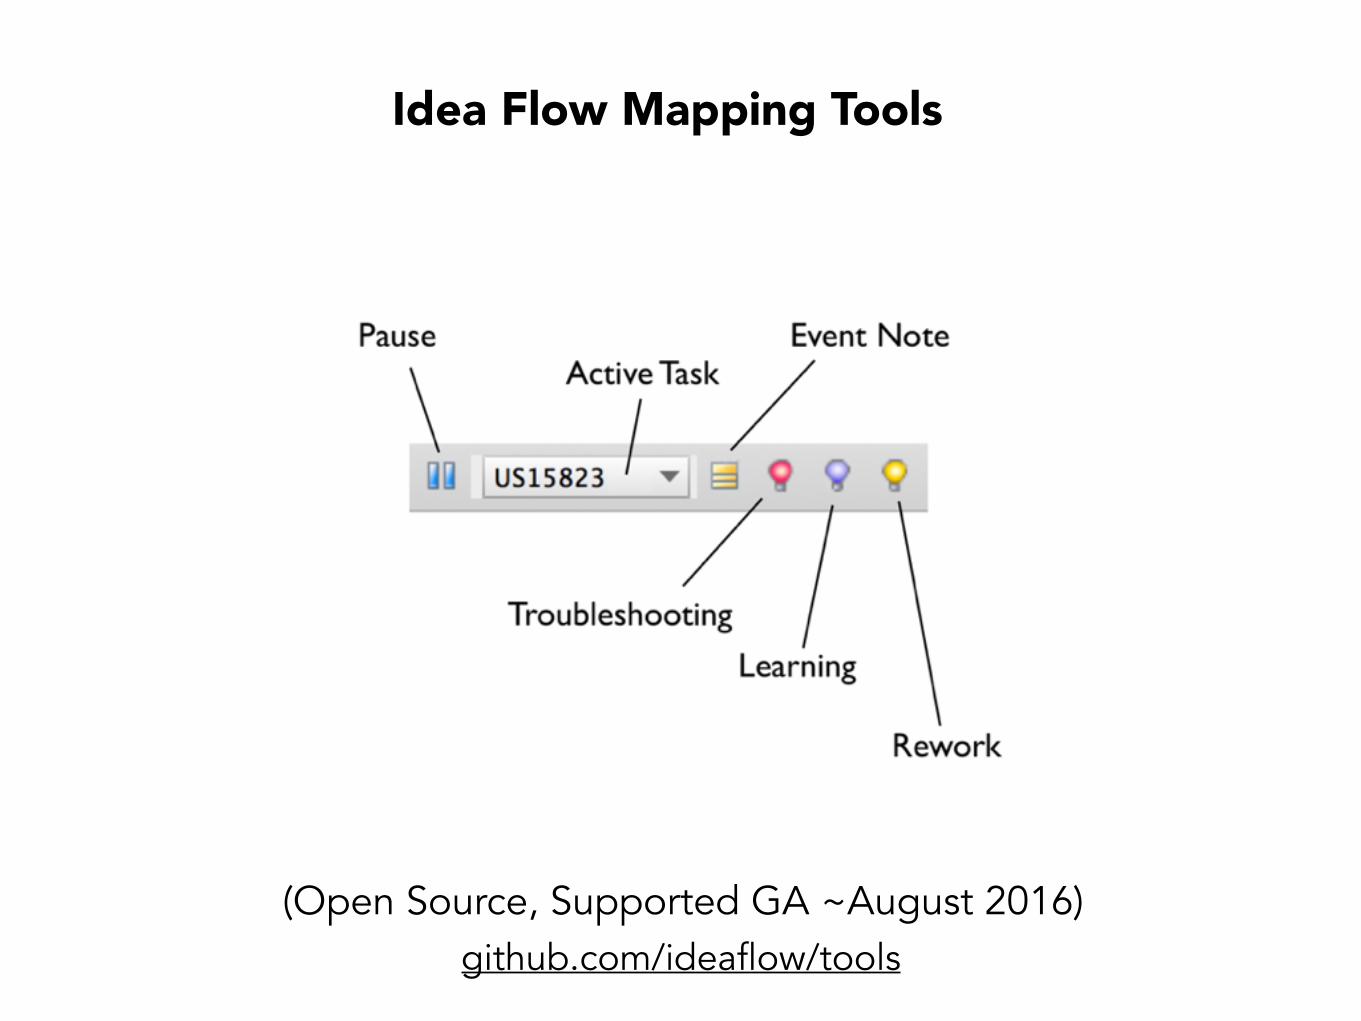
Idea Flow Mapping Tools
(Open Source, Supported GA ~August 2016)github.com/ideaflow/tools
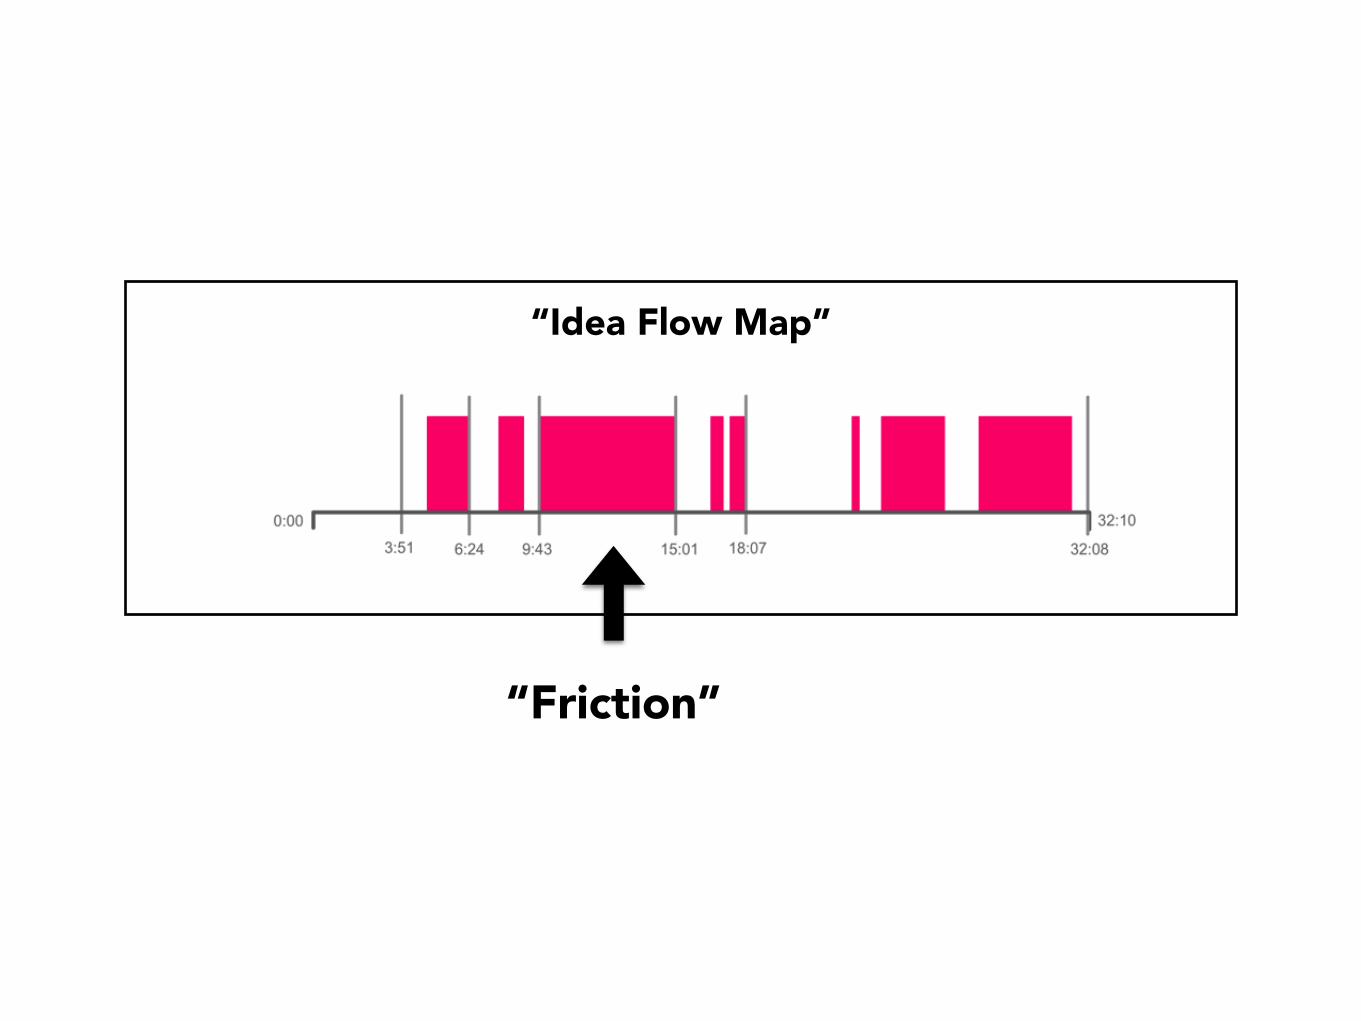
“Idea Flow Map”
“Friction”
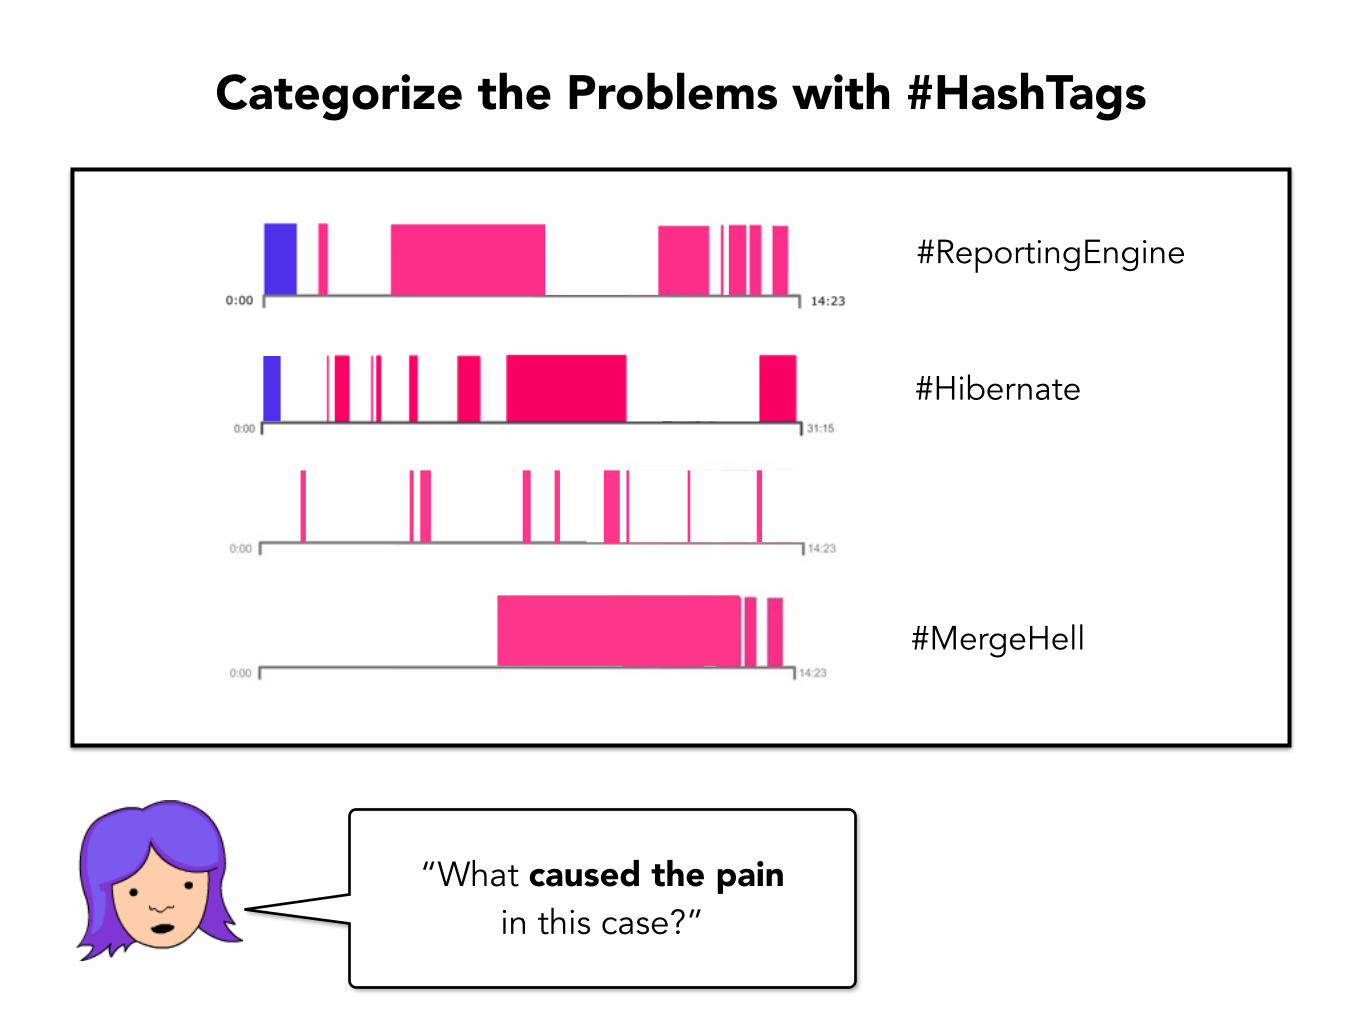
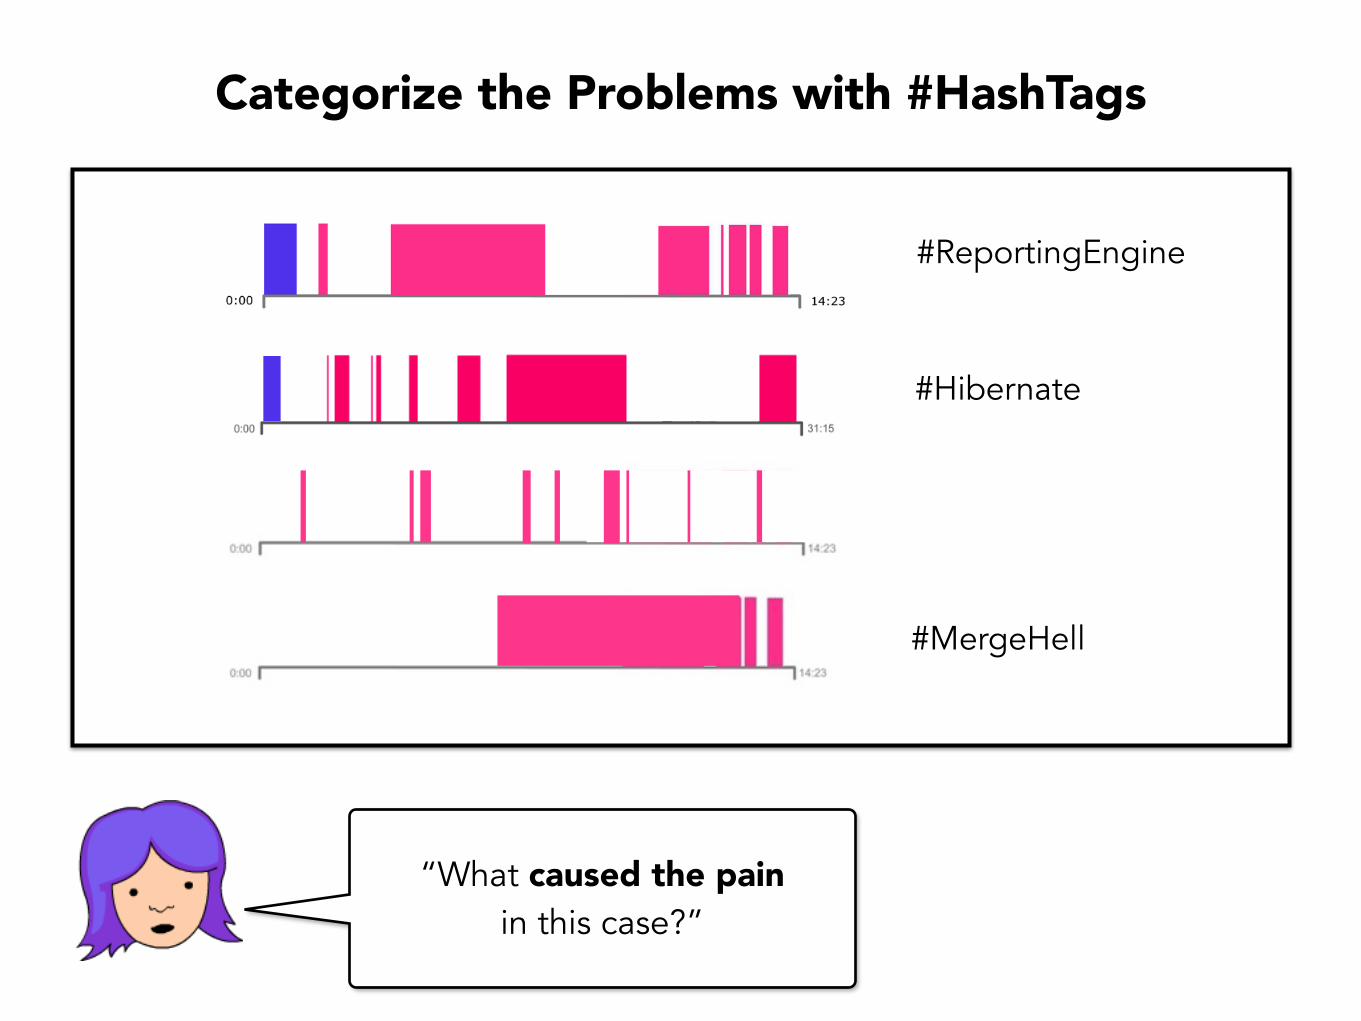
“What caused the pain in this case?”
Categorize the Problems with #HashTags
#ReportingEngine
#Hibernate
#MergeHell
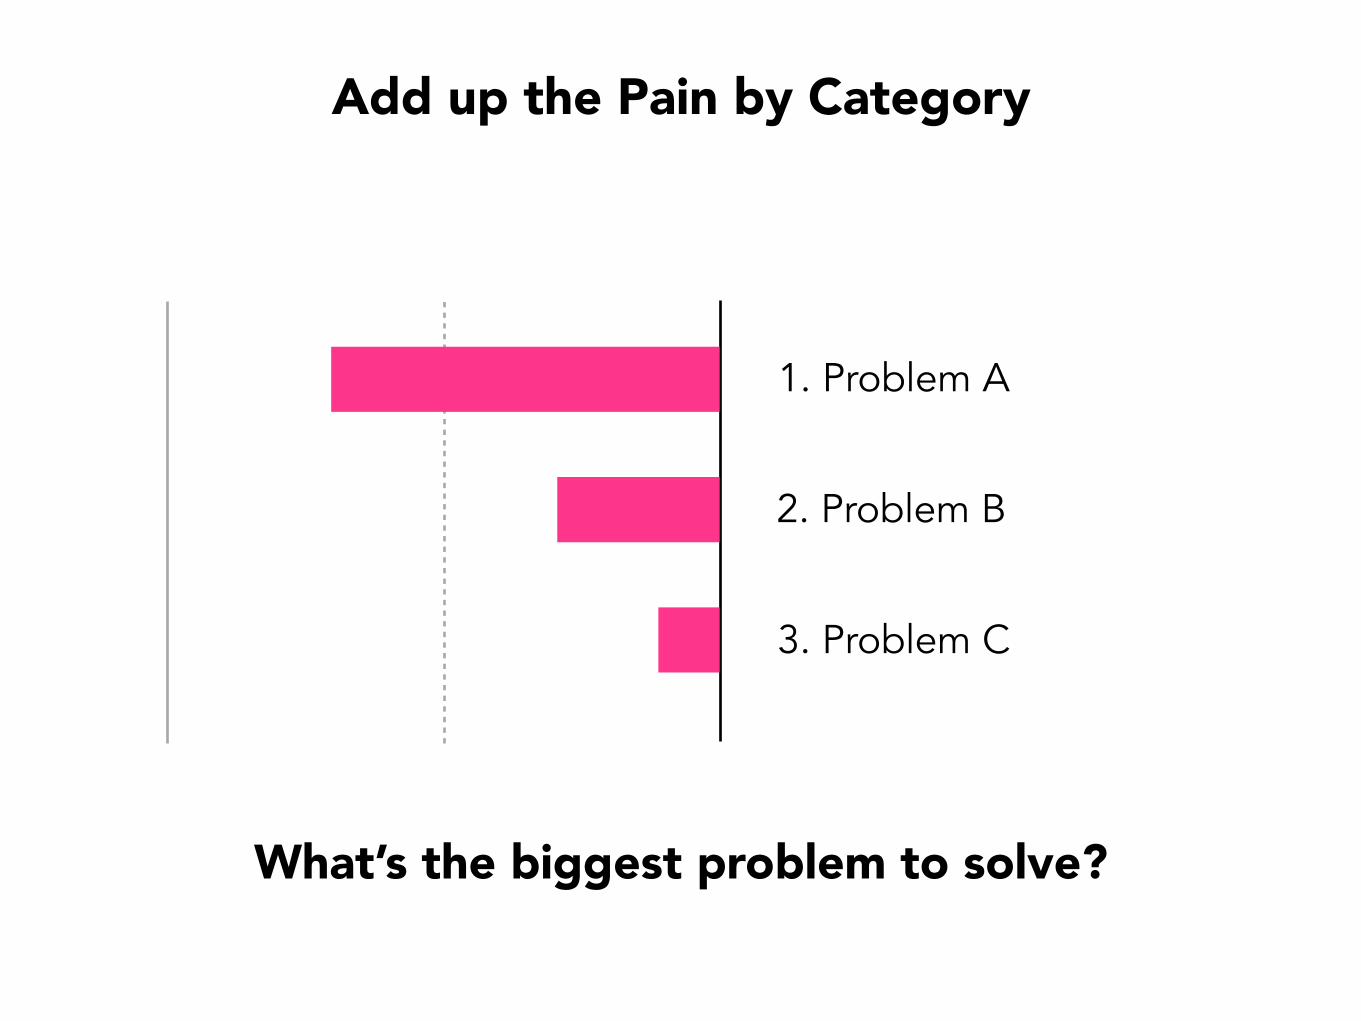
1. Problem A
2. Problem B
3. Problem C
Add up the Pain by Category
What’s the biggest problem to solve?

Demo
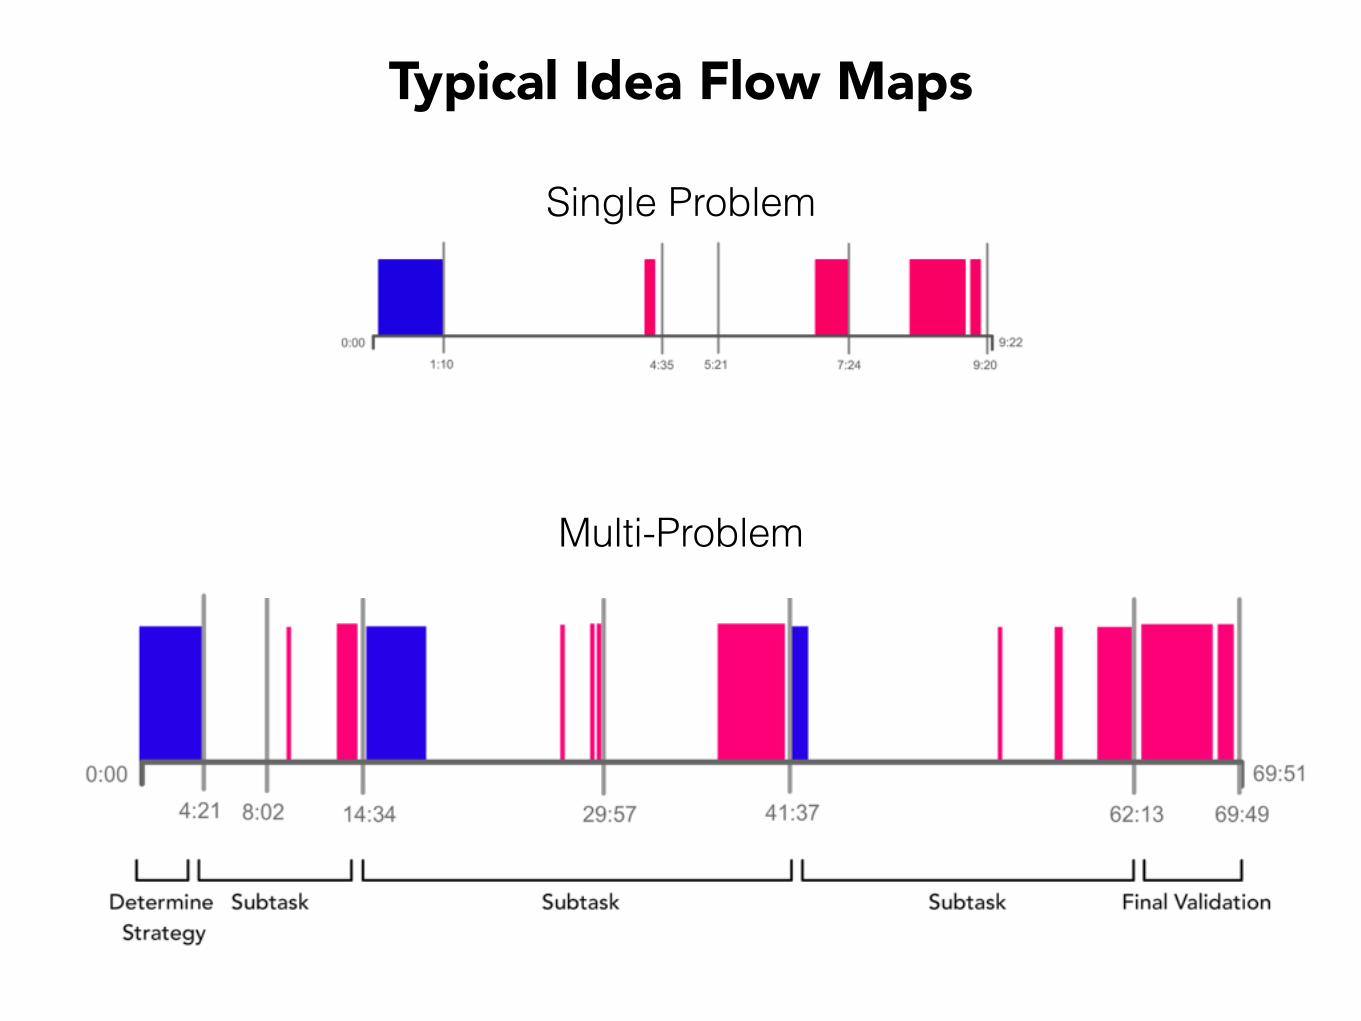
Typical Idea Flow Maps
Single Problem
Multi-Problem
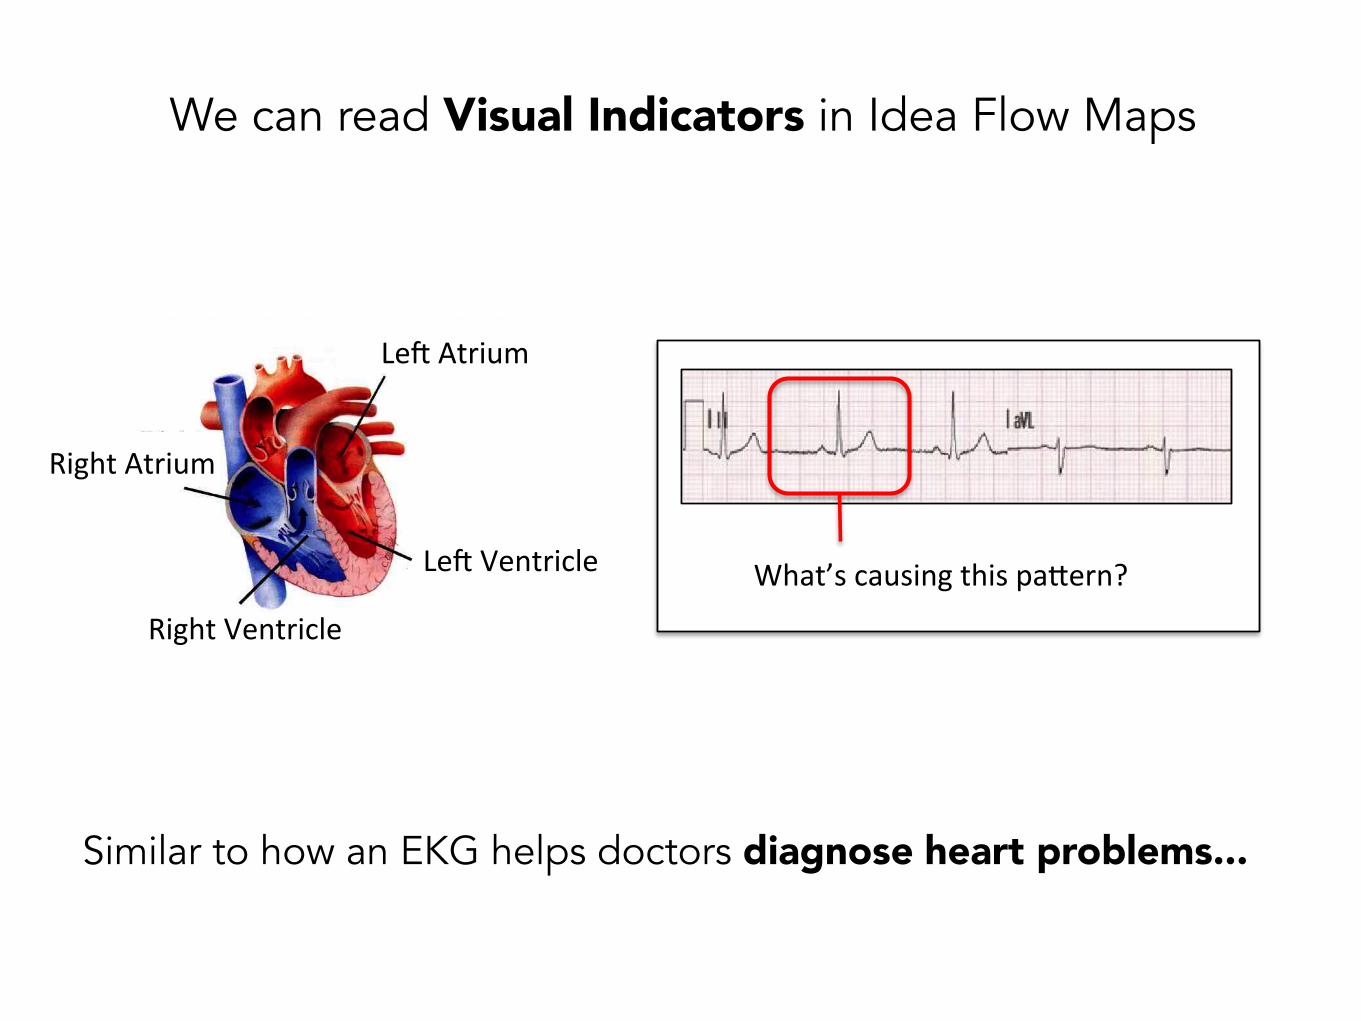
We can read Visual Indicators in Idea Flow Maps
Le#$Atrium$
Le#$Ventricle$
Right$Ventricle$
Right$Atrium$
What’s$causing$this$pa7ern?$
Similar to how an EKG helps doctors diagnose heart problems...
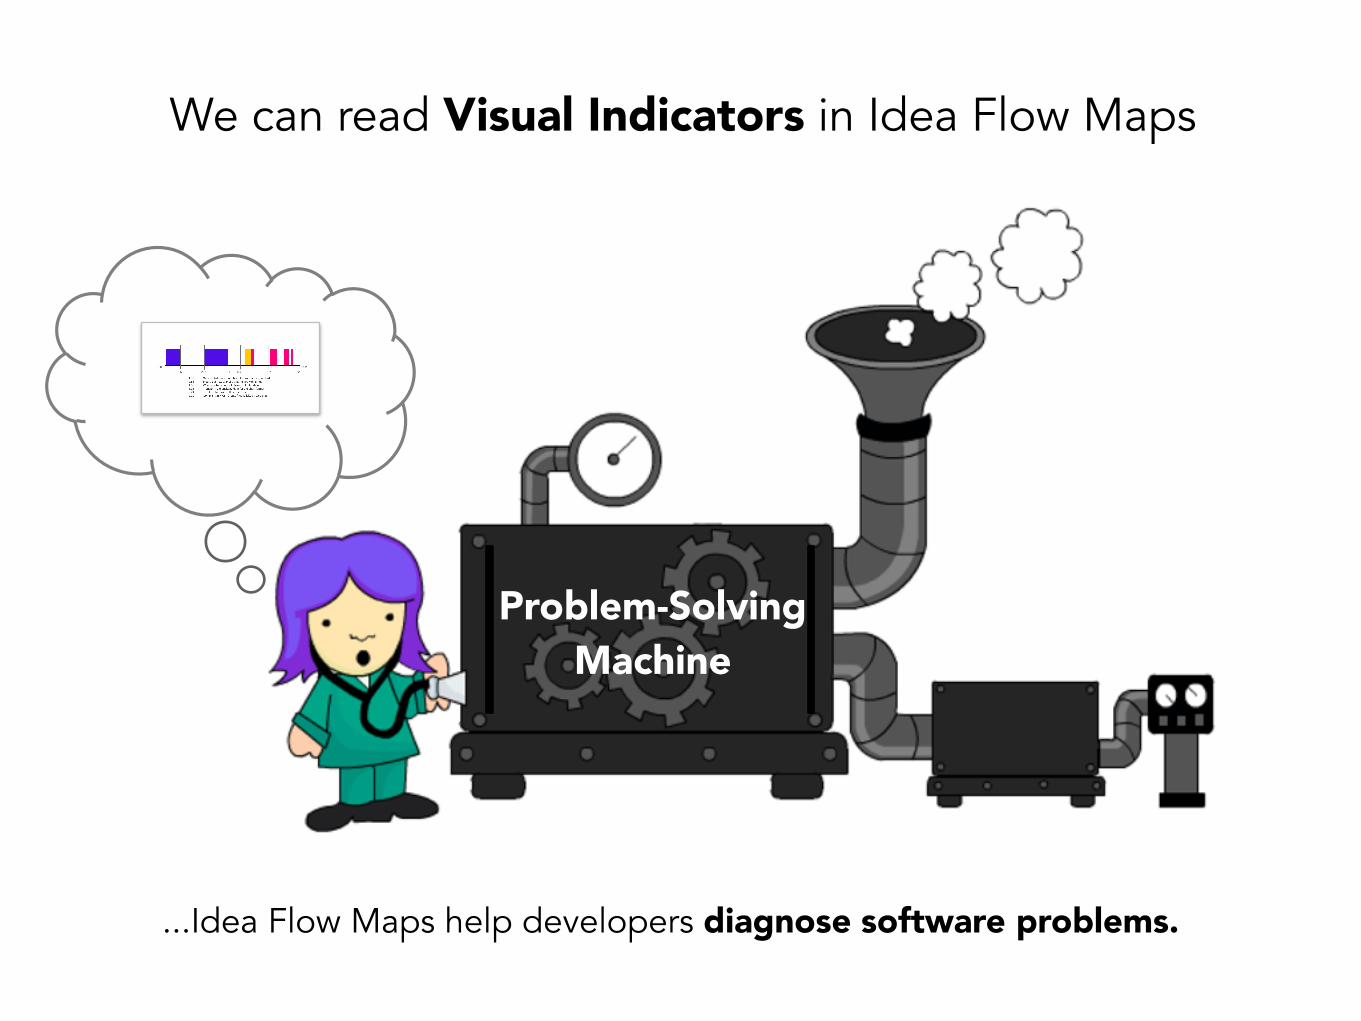
...Idea Flow Maps help developers diagnose software problems.
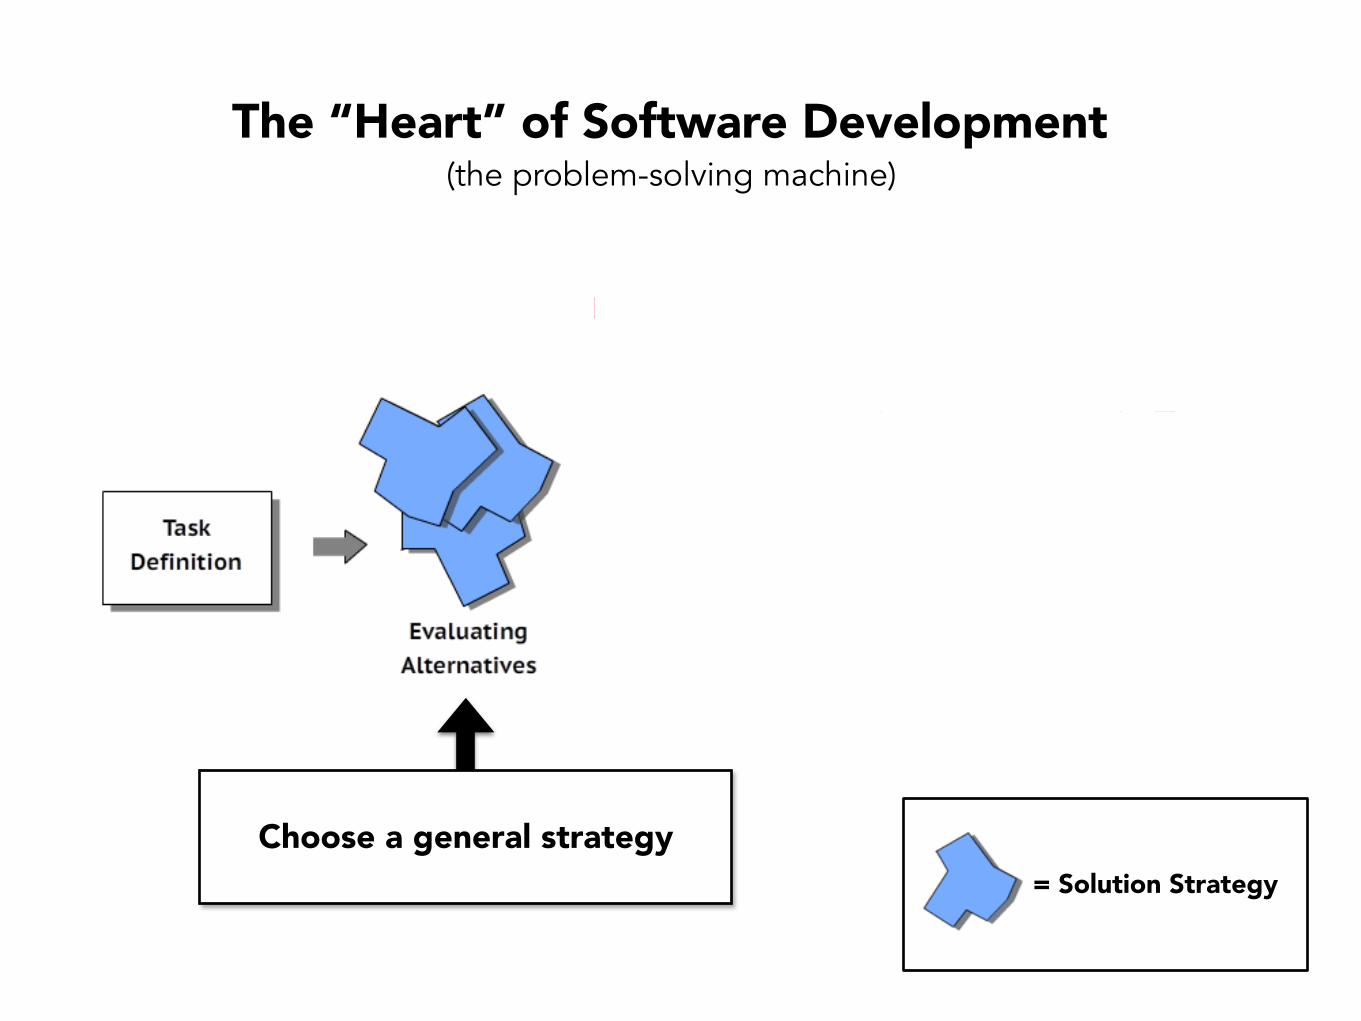
Problem-Solving Machine
We can read Visual Indicators in Idea Flow Maps
= Solution Strategy
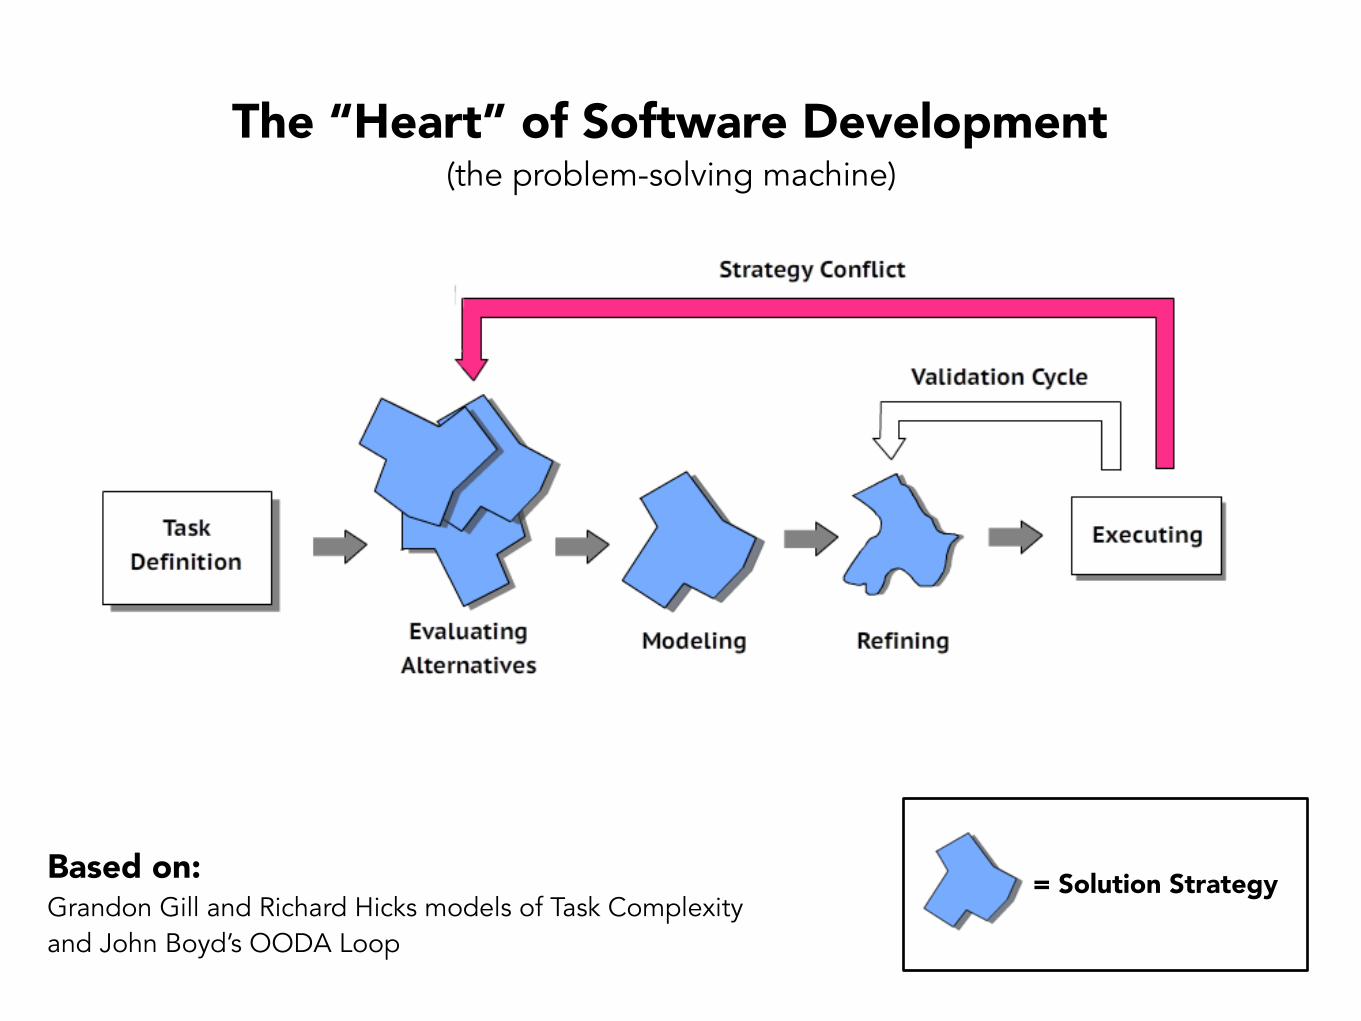
The “Heart” of Software Development(the problem-solving machine)
Based on: Grandon Gill and Richard Hicks models of Task Complexity and John Boyd’s OODA Loop
= Solution Strategy
The “Heart” of Software Development(the problem-solving machine)
Choose a general strategy
= Solution Strategy
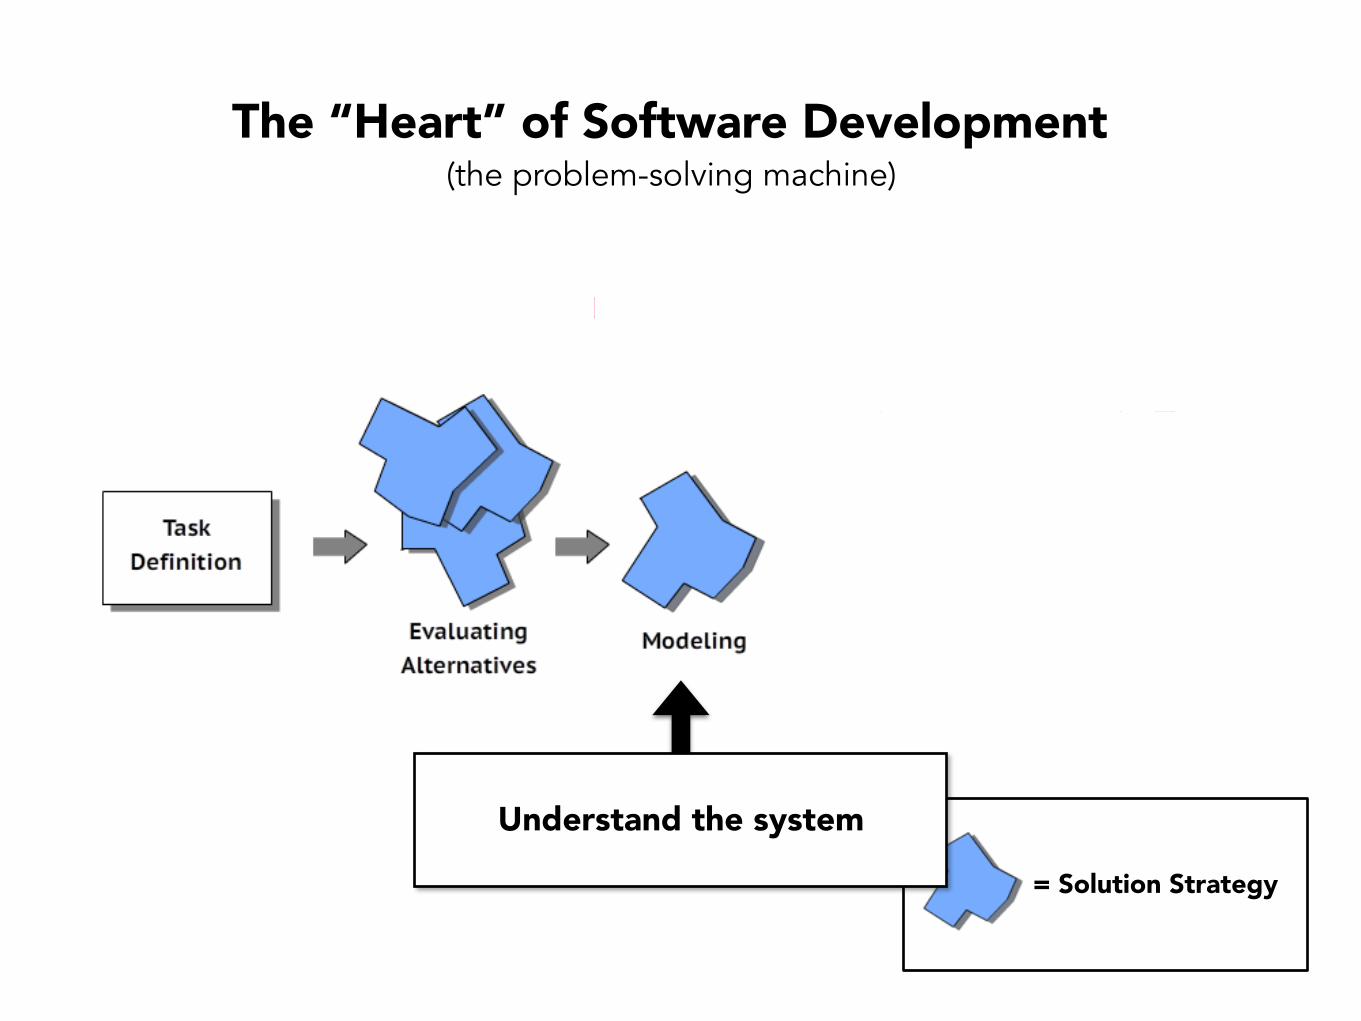
The “Heart” of Software Development(the problem-solving machine)
Understand the system

= Solution Strategy
The “Heart” of Software Development(the problem-solving machine)
Code & work out the kinks
= Solution Strategy
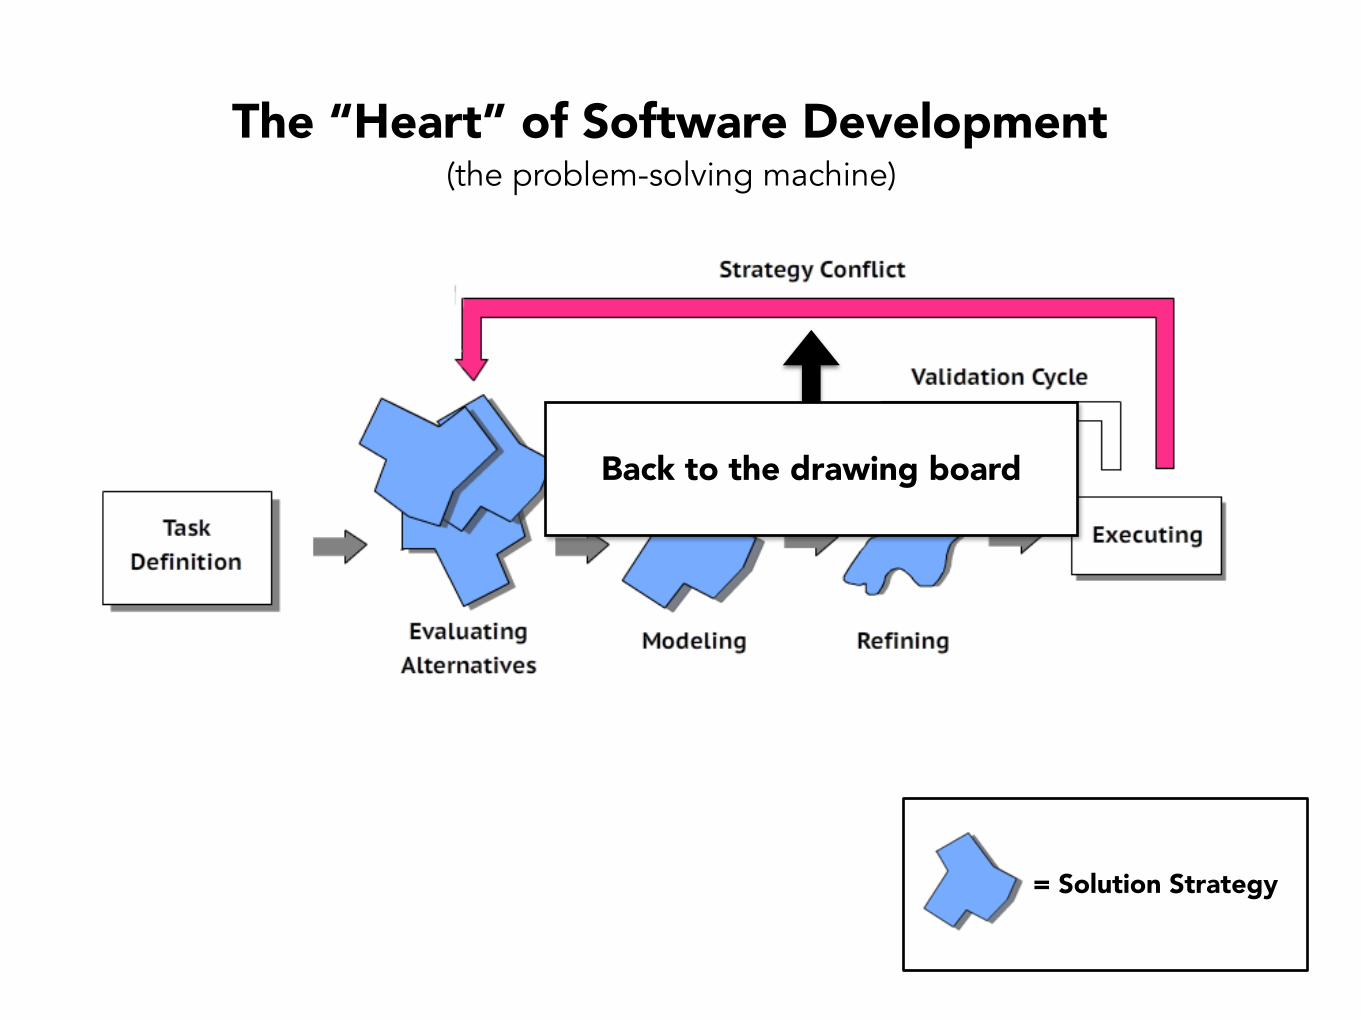
The “Heart” of Software Development(the problem-solving machine)
Back to the drawing board
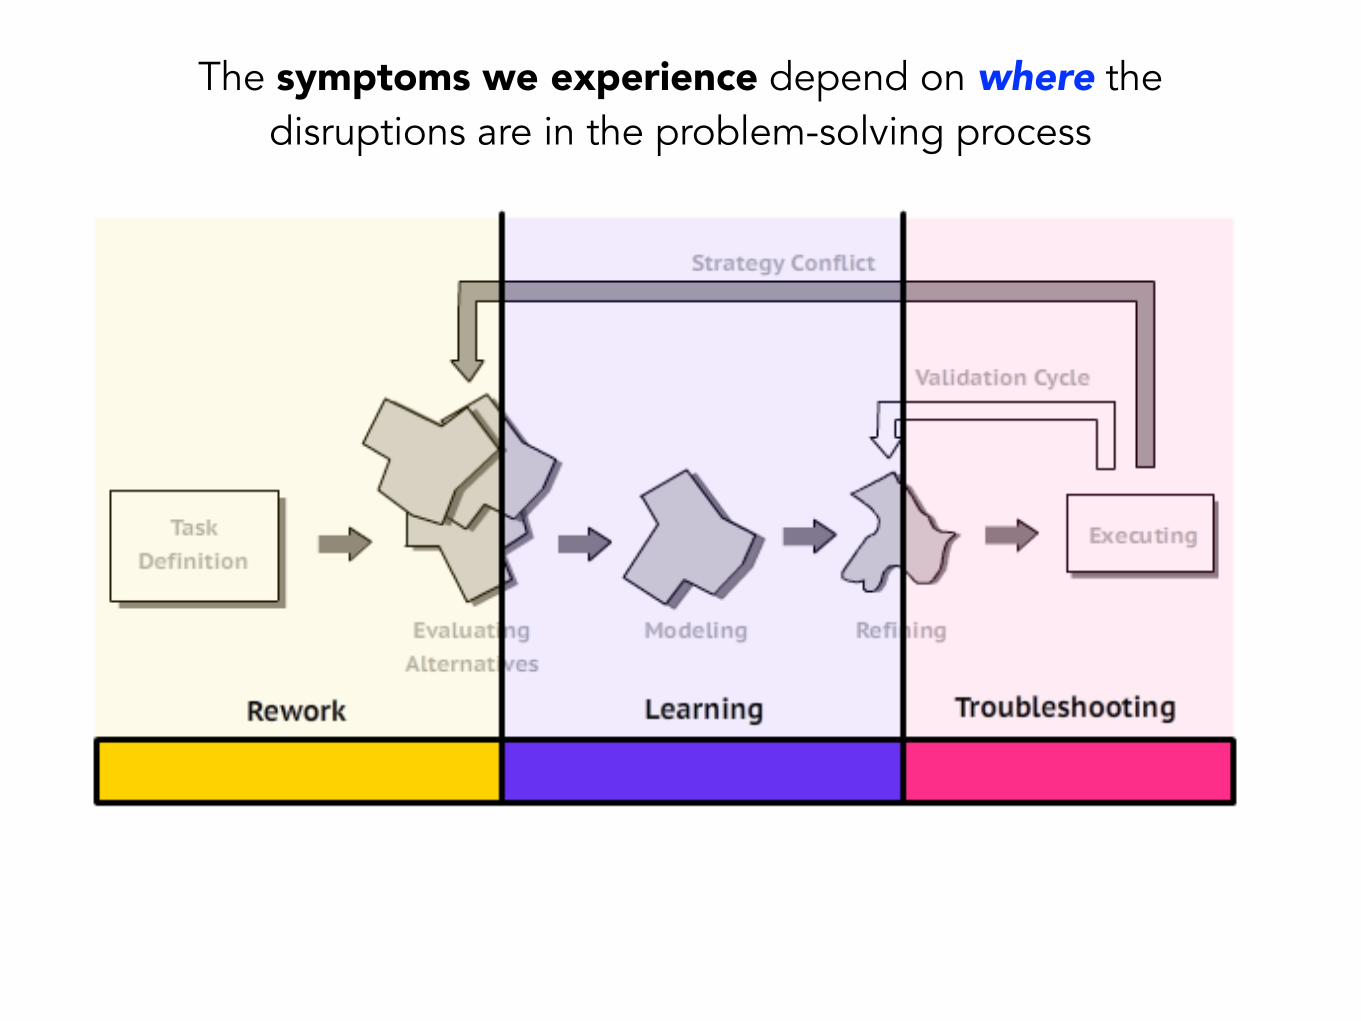
The symptoms we experience depend on where the disruptions are in the problem-solving process
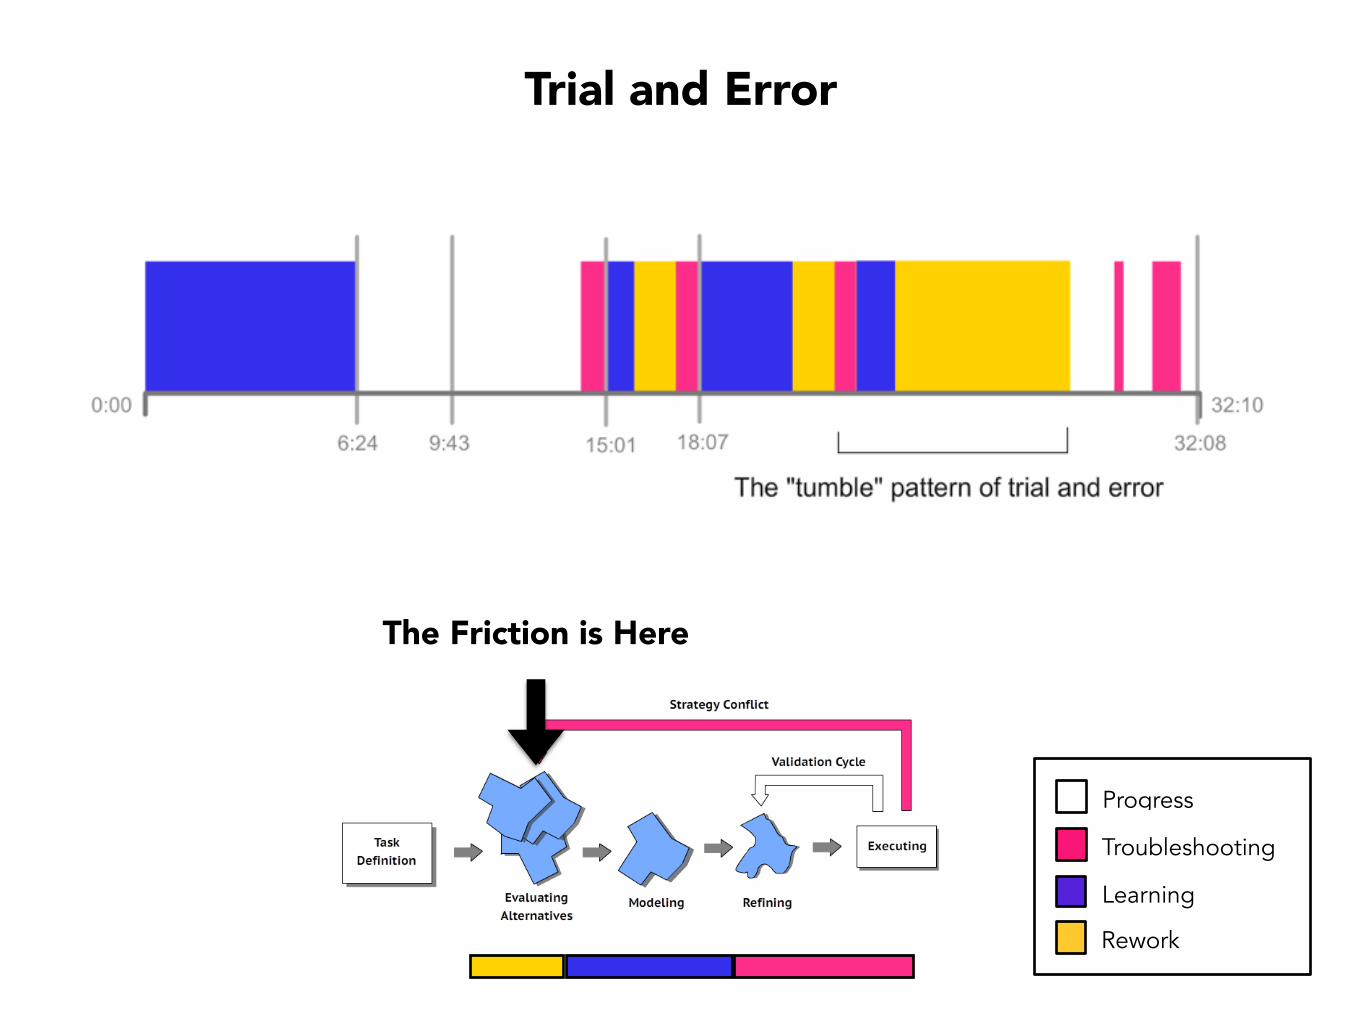
Trial and Error
The Friction is Here
Troubleshooting
Progress
Learning
Rework
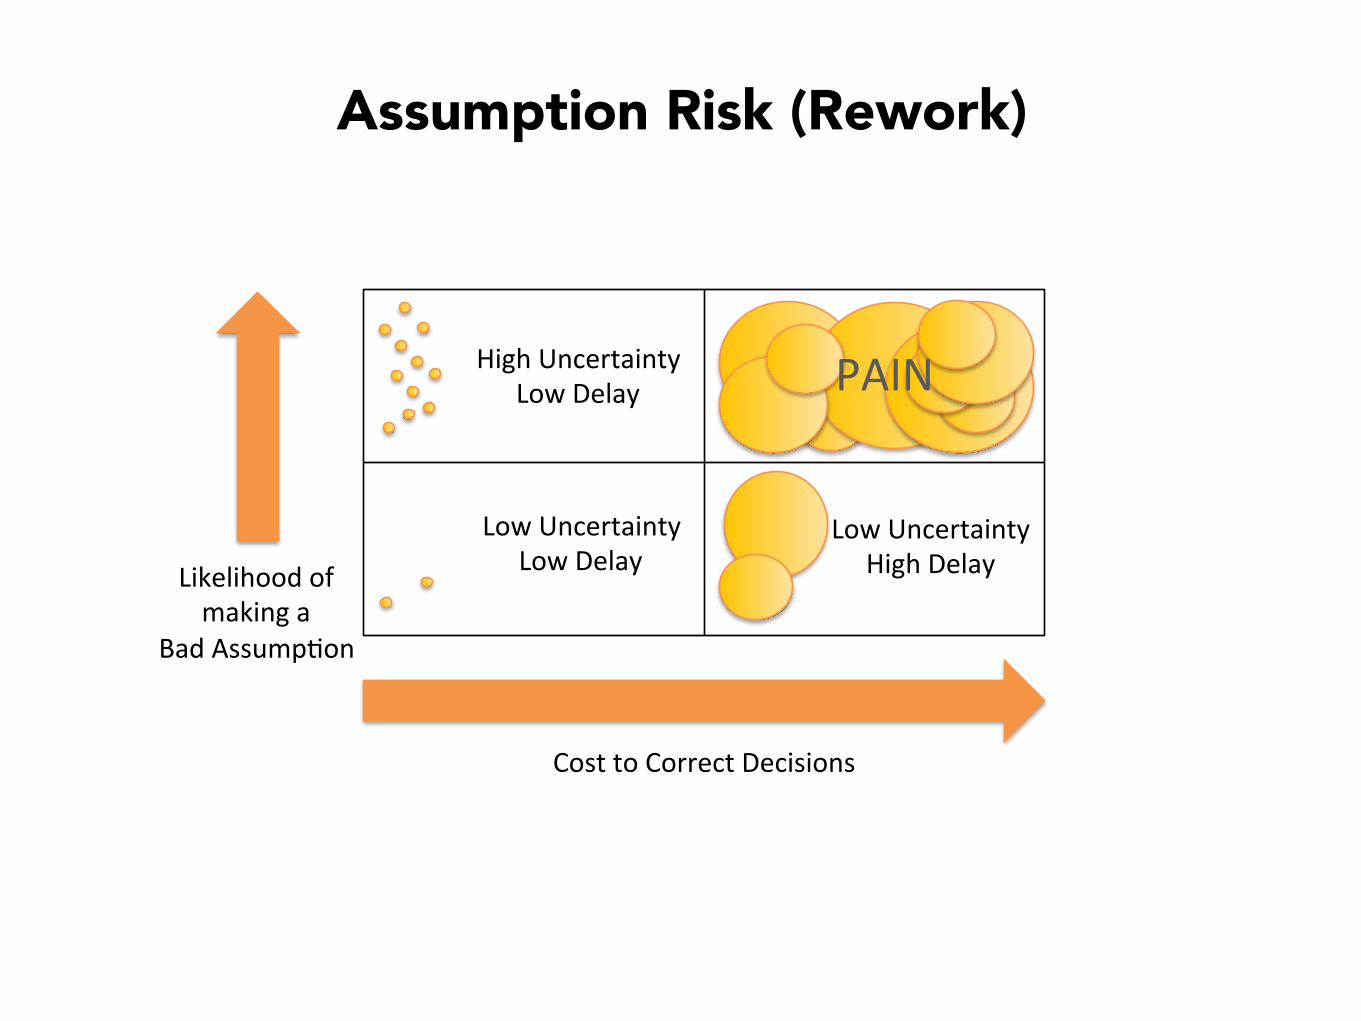
Assumption Risk (Rework)
Likelihood)of))making)a))
Bad)Assump4on)
Cost)to)Correct)Decisions)
High)Uncertainty)Low)Delay)
Low)Uncertainty)Low)Delay)
Low)Uncertainty)High)Delay)
PAIN)
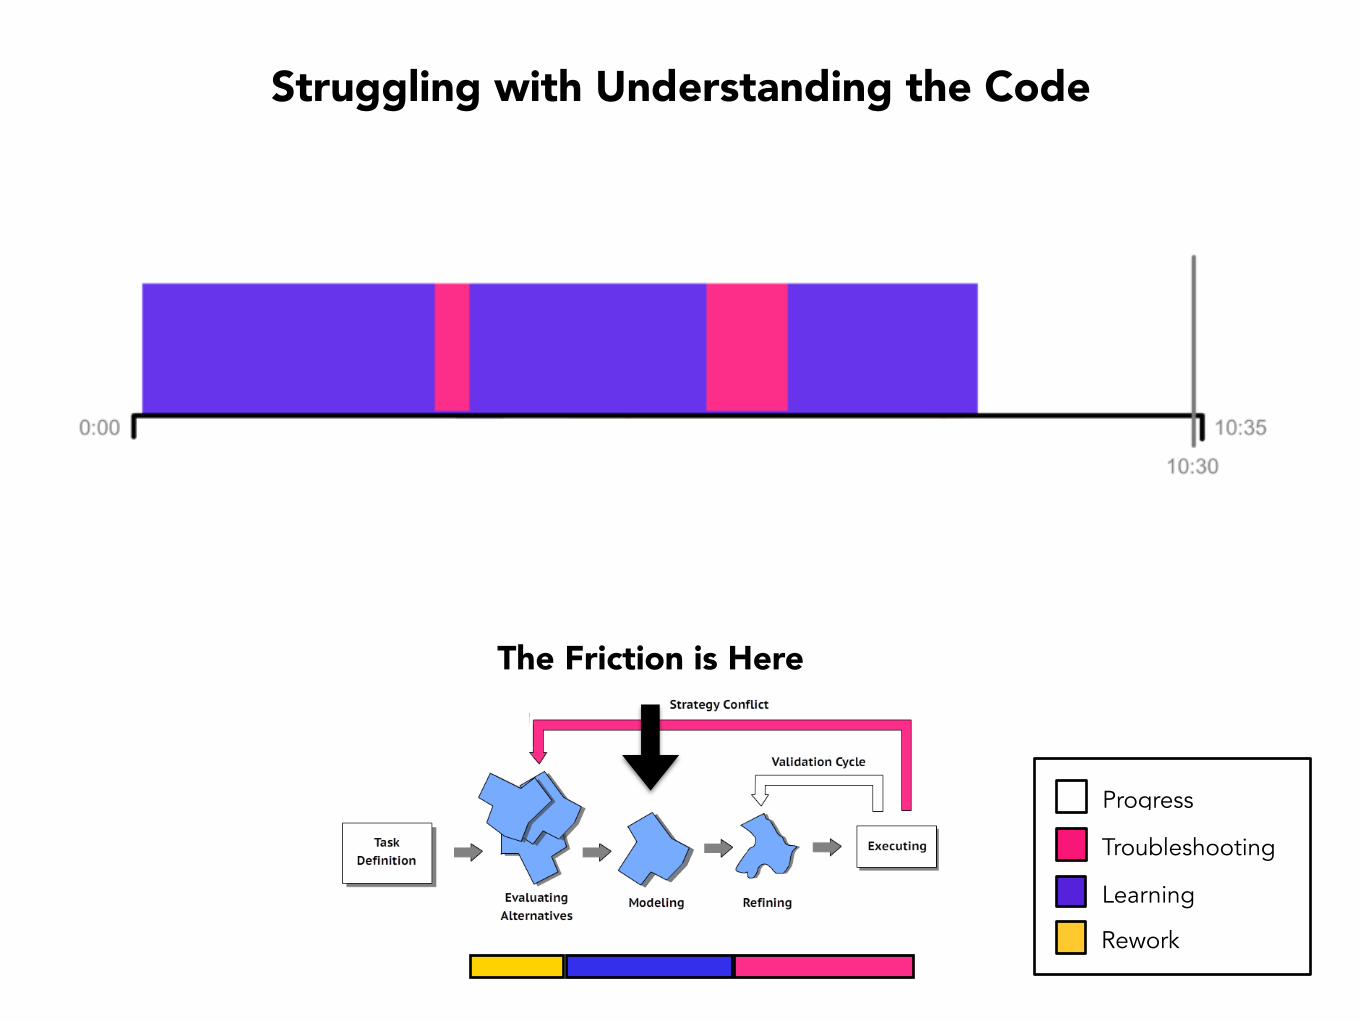
Struggling with Understanding the Code
The Friction is Here
Troubleshooting
Progress
Learning
Rework
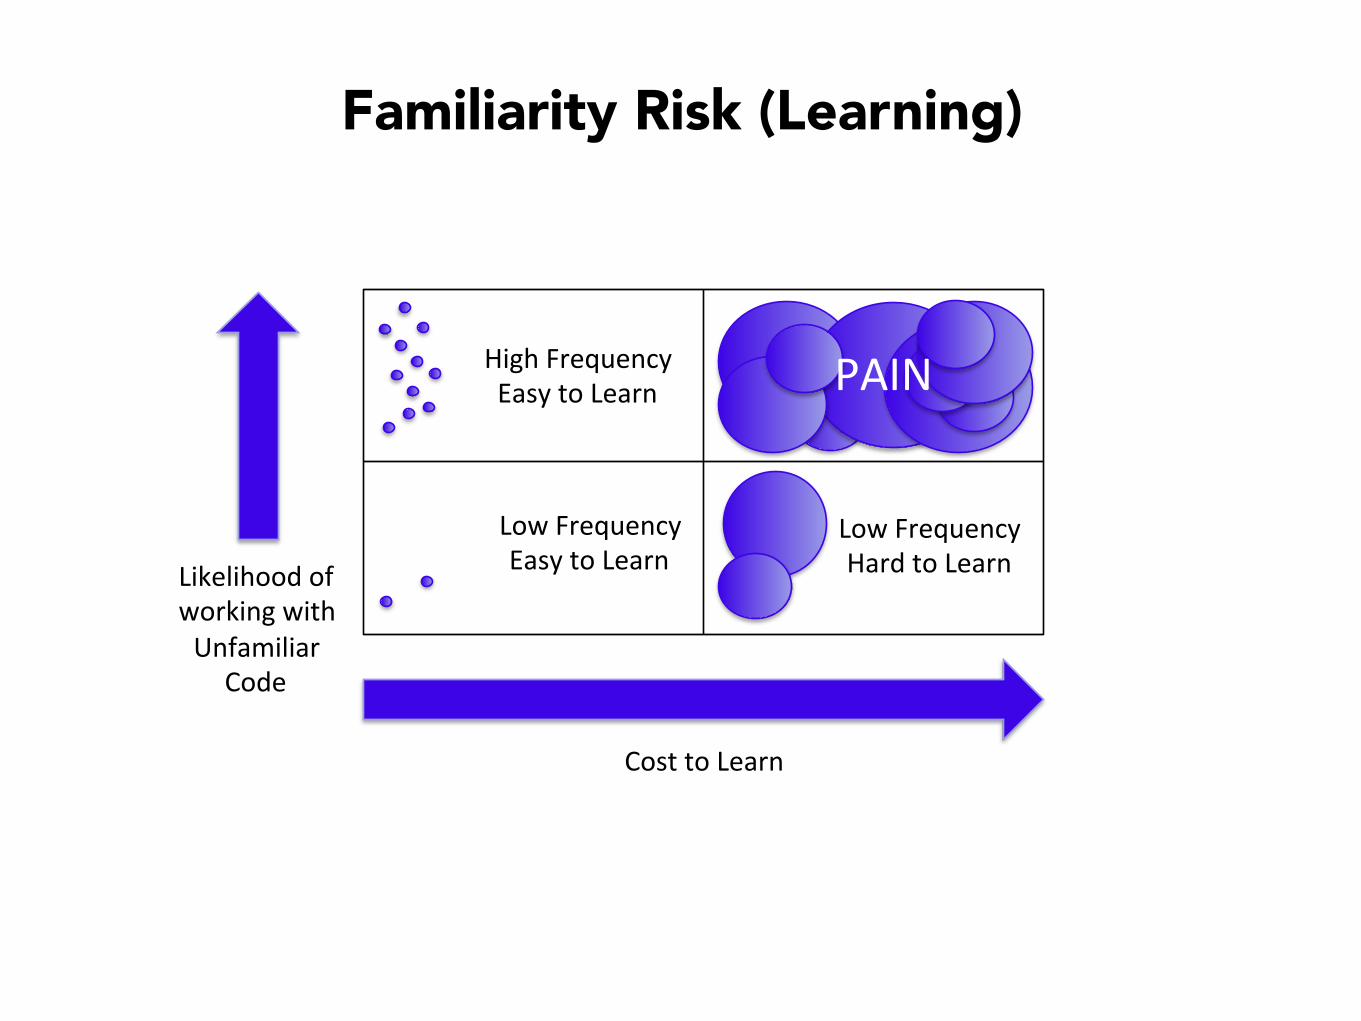
Familiarity Risk (Learning)
Likelihood)of))working)with)Unfamiliar)
Code)
Cost)to)Learn)
High)Frequency)Easy)to)Learn)
Low)Frequency)Easy)to)Learn)
Low)Frequency)Hard)to)Learn)
PAIN)
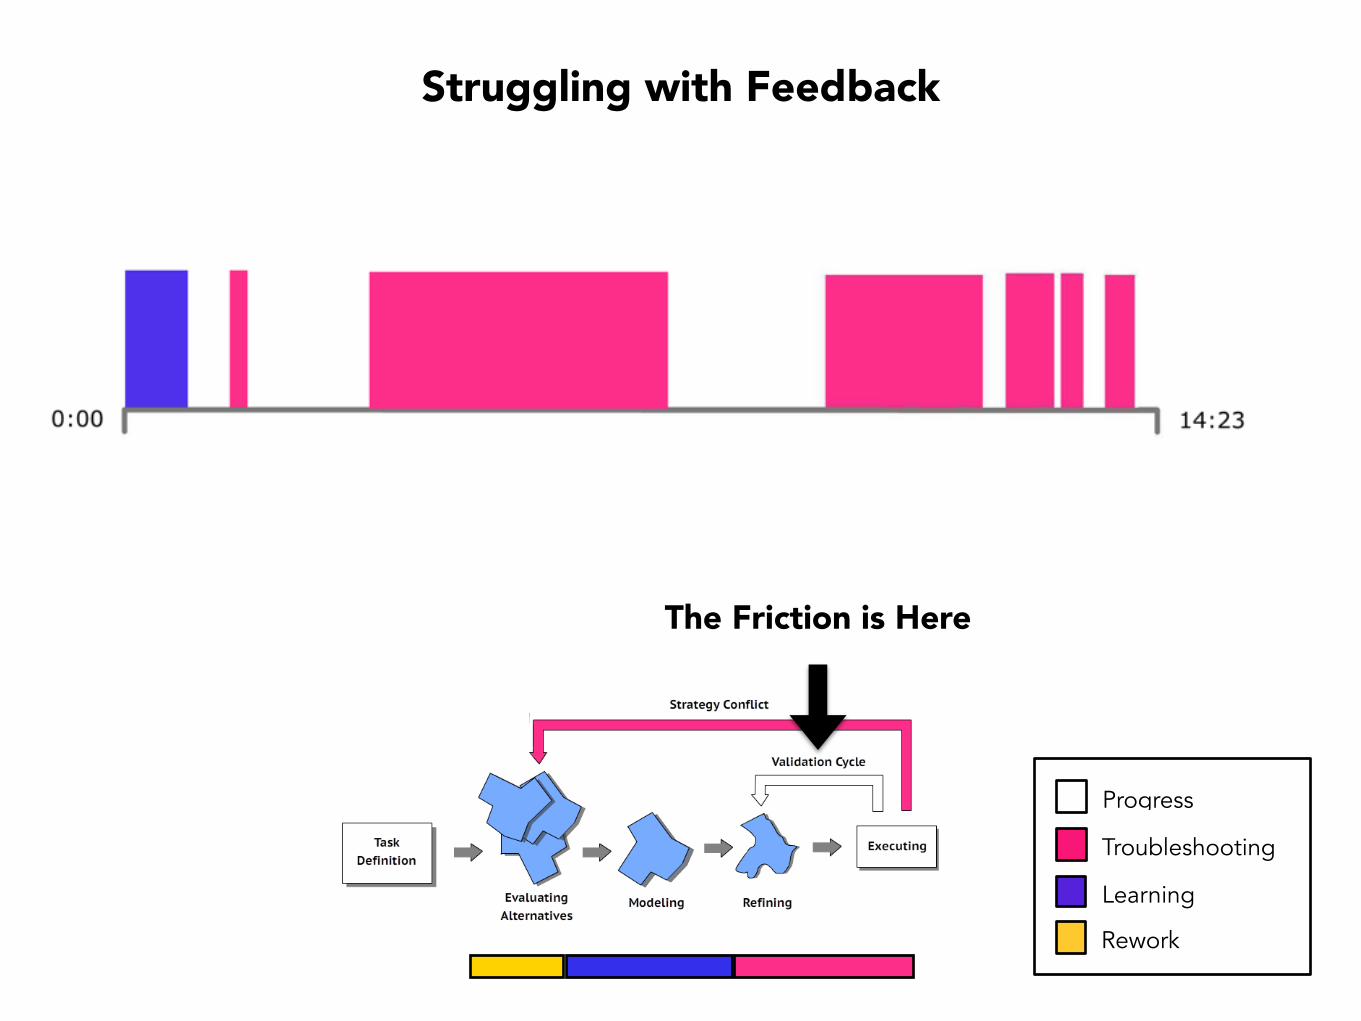
Struggling with Feedback
The Friction is Here
Troubleshooting
Progress
Learning
Rework
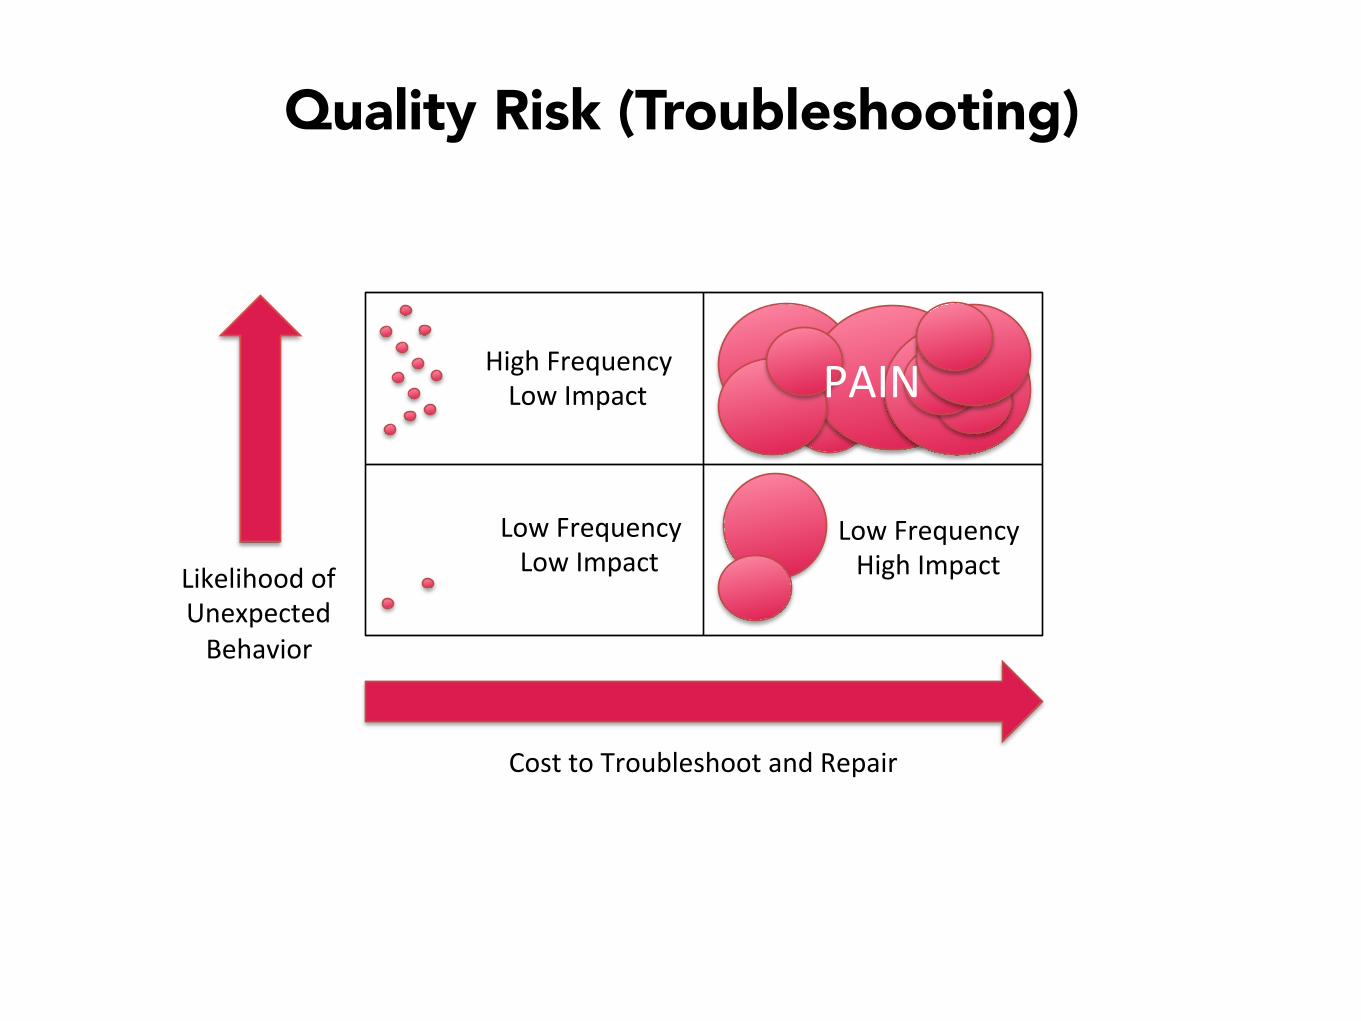
Quality Risk (Troubleshooting)
Likelihood)of))Unexpected)Behavior)
Cost)to)Troubleshoot)and)Repair)
High)Frequency)Low)Impact)
Low)Frequency)Low)Impact)
Low)Frequency)High)Impact)
PAIN)
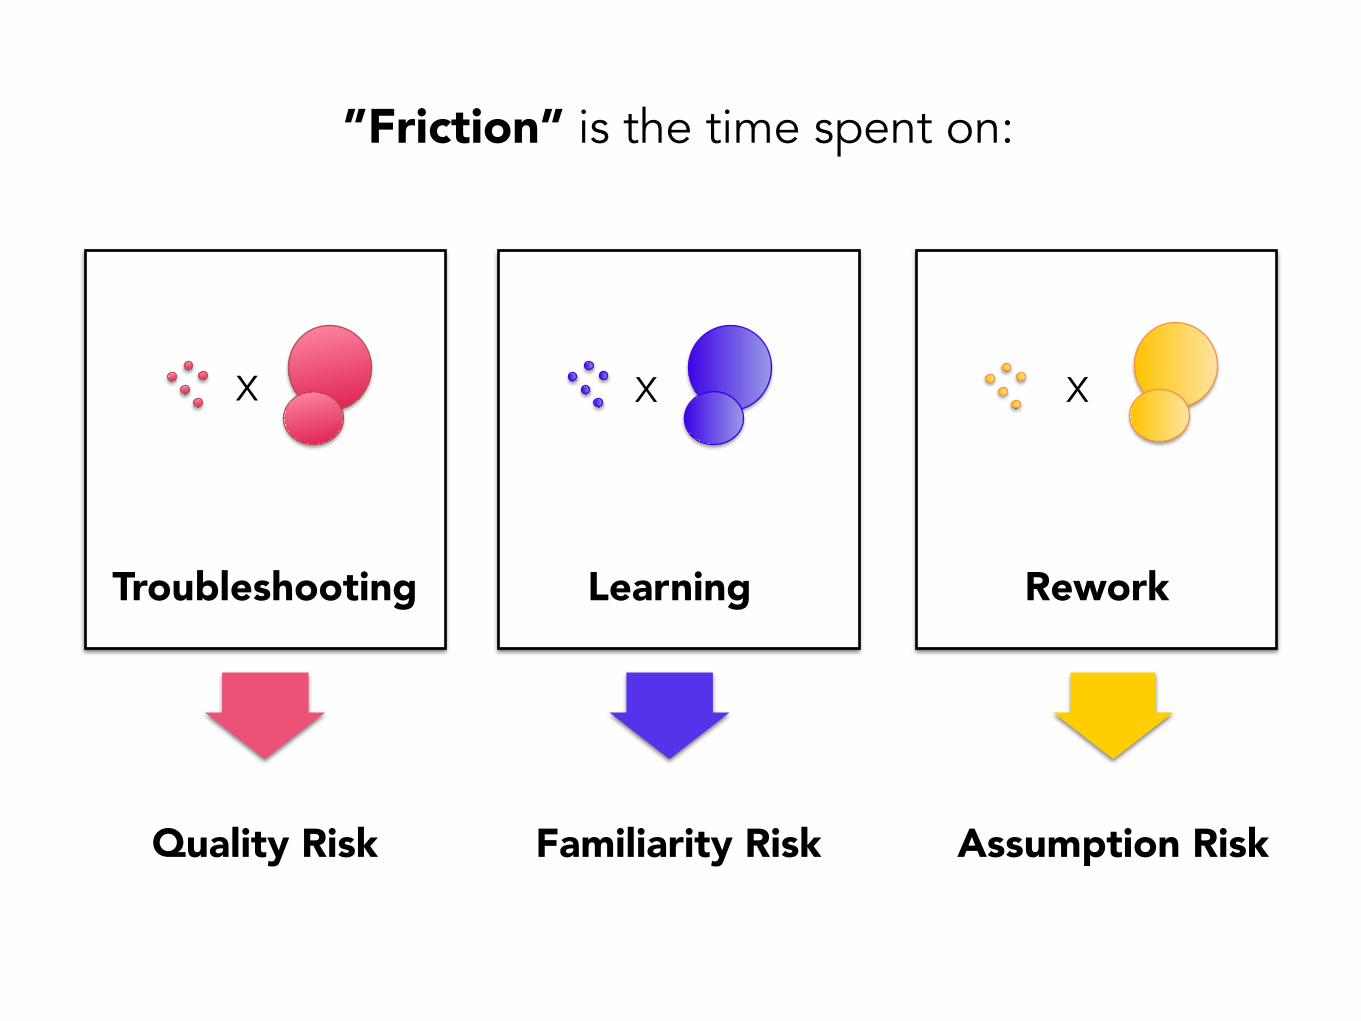
”Friction” is the time spent on:
x
Troubleshooting
x
Learning
x
Rework
Quality Risk Familiarity Risk Assumption Risk
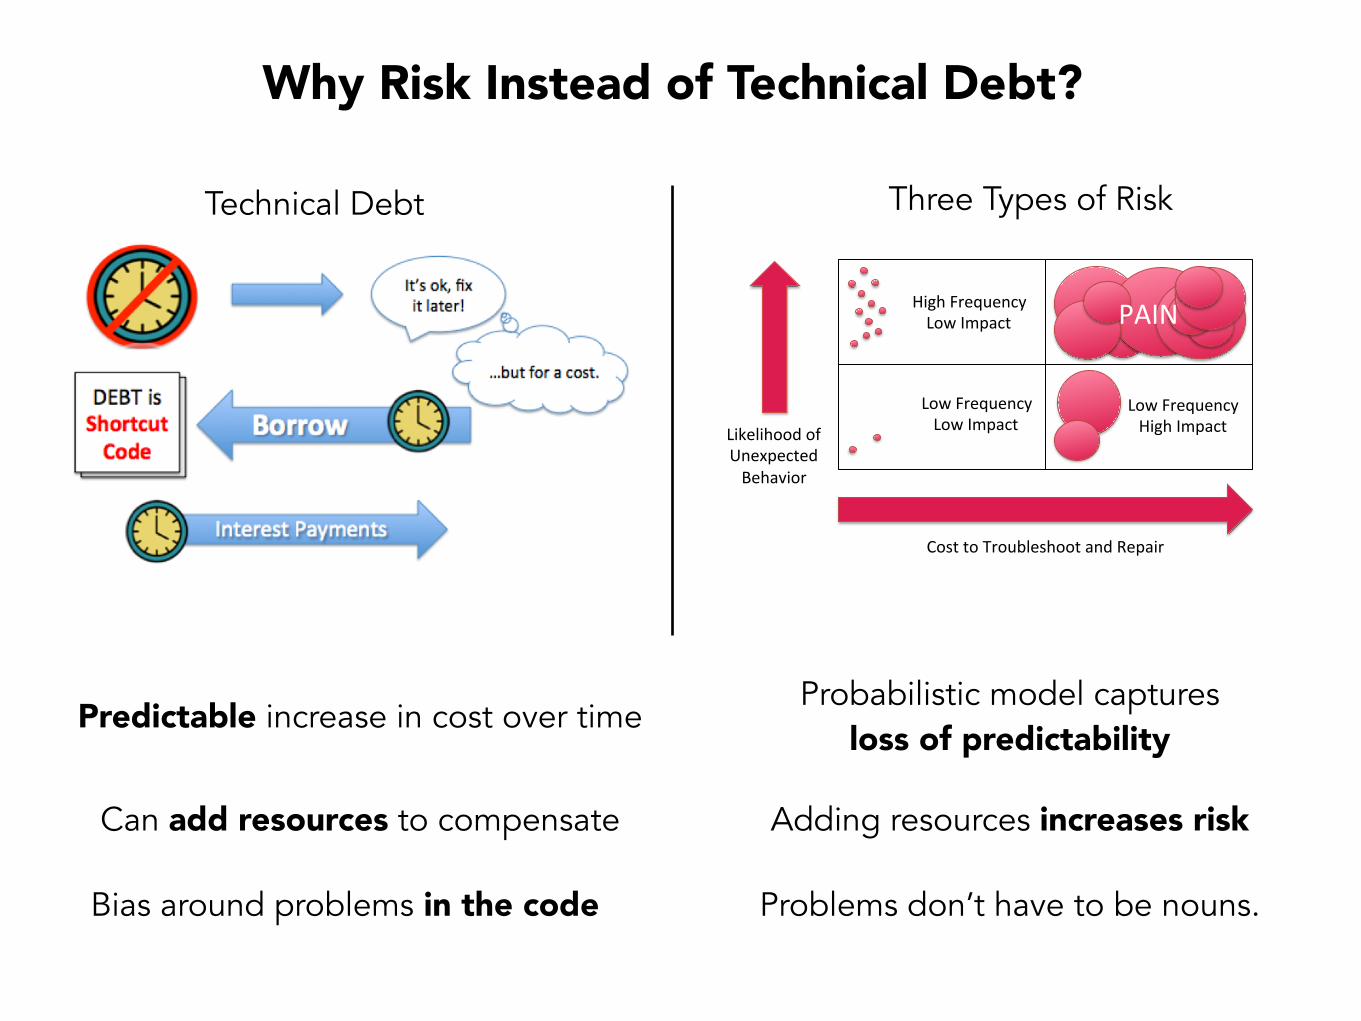
Why Risk Instead of Technical Debt?
Likelihood)of))Unexpected)Behavior)
Cost)to)Troubleshoot)and)Repair)
High)Frequency)Low)Impact)
Low)Frequency)Low)Impact)
Low)Frequency)High)Impact)
PAIN)
Predictable increase in cost over time
Can add resources to compensate
Bias around problems in the code
Probabilistic model captures loss of predictability
Adding resources increases risk
Problems don’t have to be nouns.
Technical Debt Three Types of Risk

Case Studies
Troubleshooting
Progress
Learning
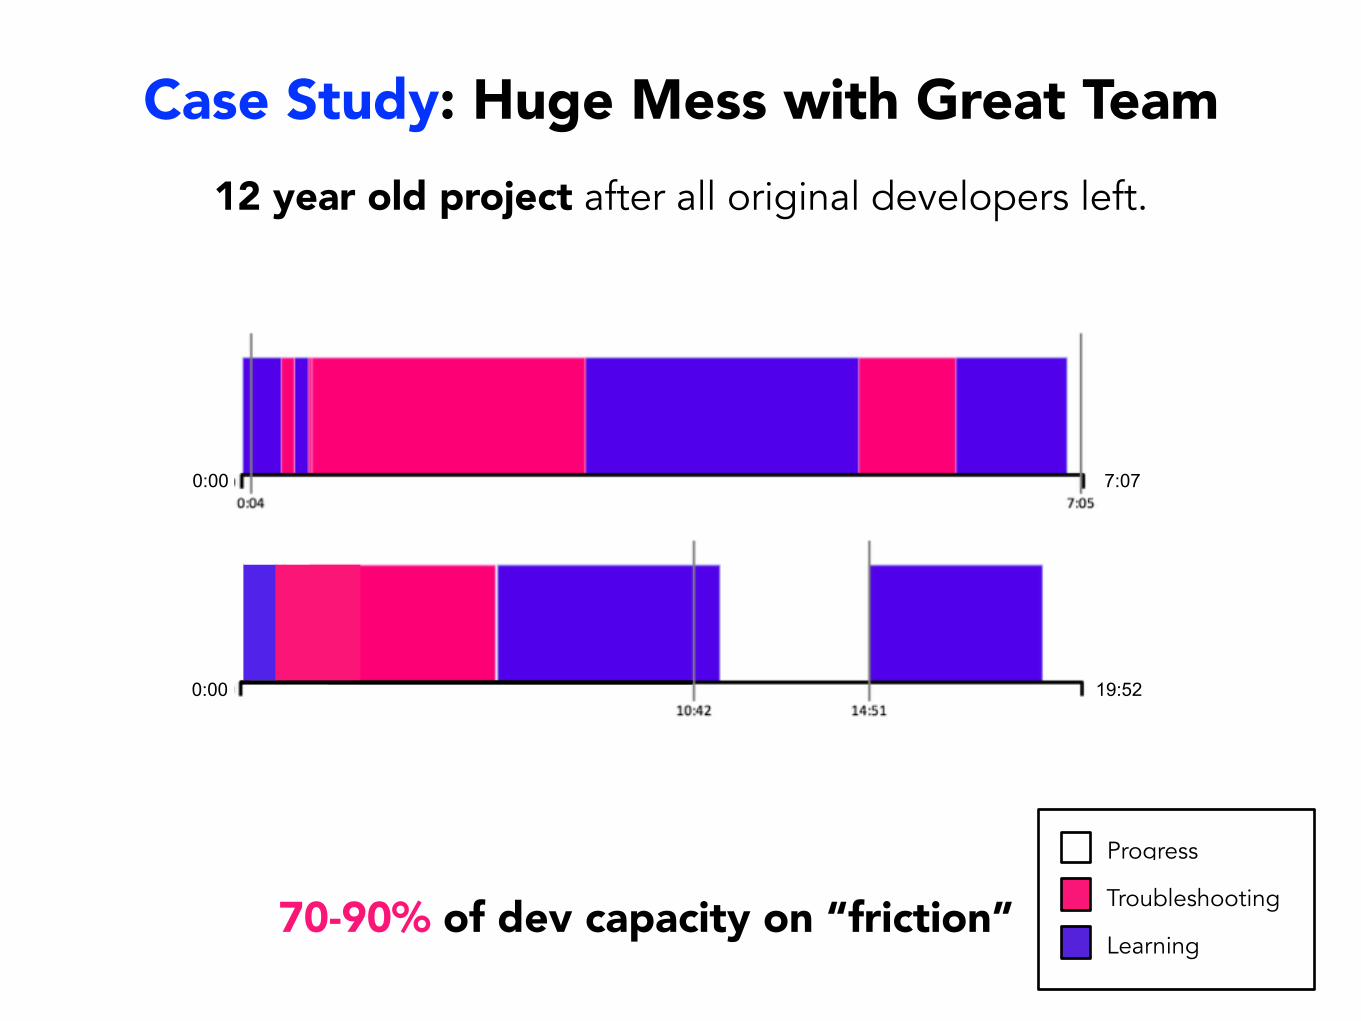
7:070:00
0:00 19:52
12 year old project after all original developers left.
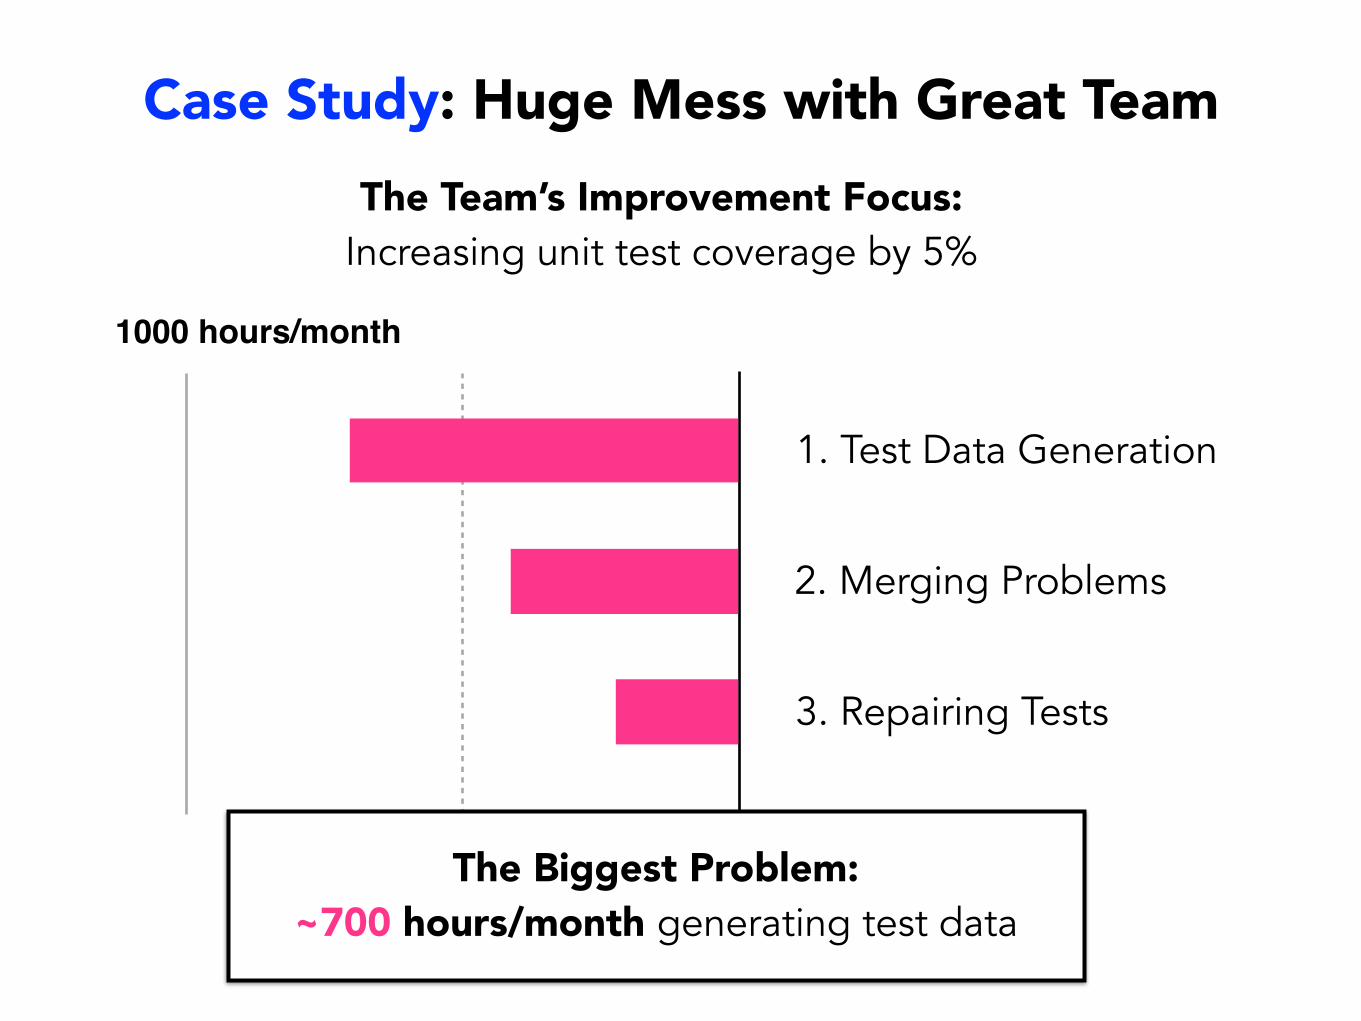
Case Study: Huge Mess with Great Team
70-90% of dev capacity on “friction”
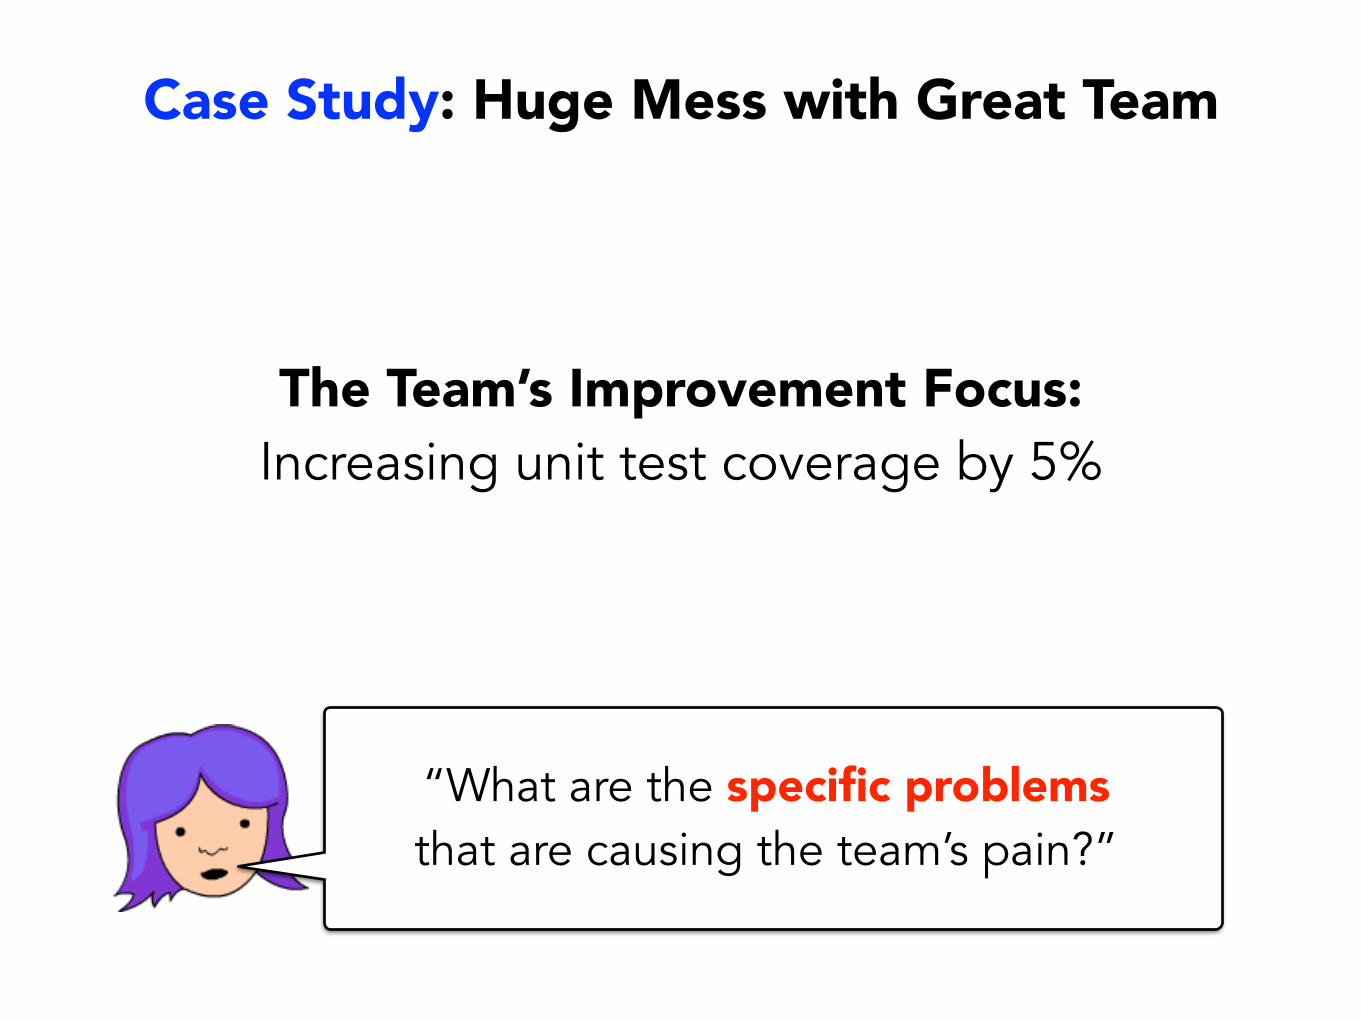
The Team’s Improvement Focus: Increasing unit test coverage by 5%
Case Study: Huge Mess with Great Team
“What are the specific problems that are causing the team’s pain?”
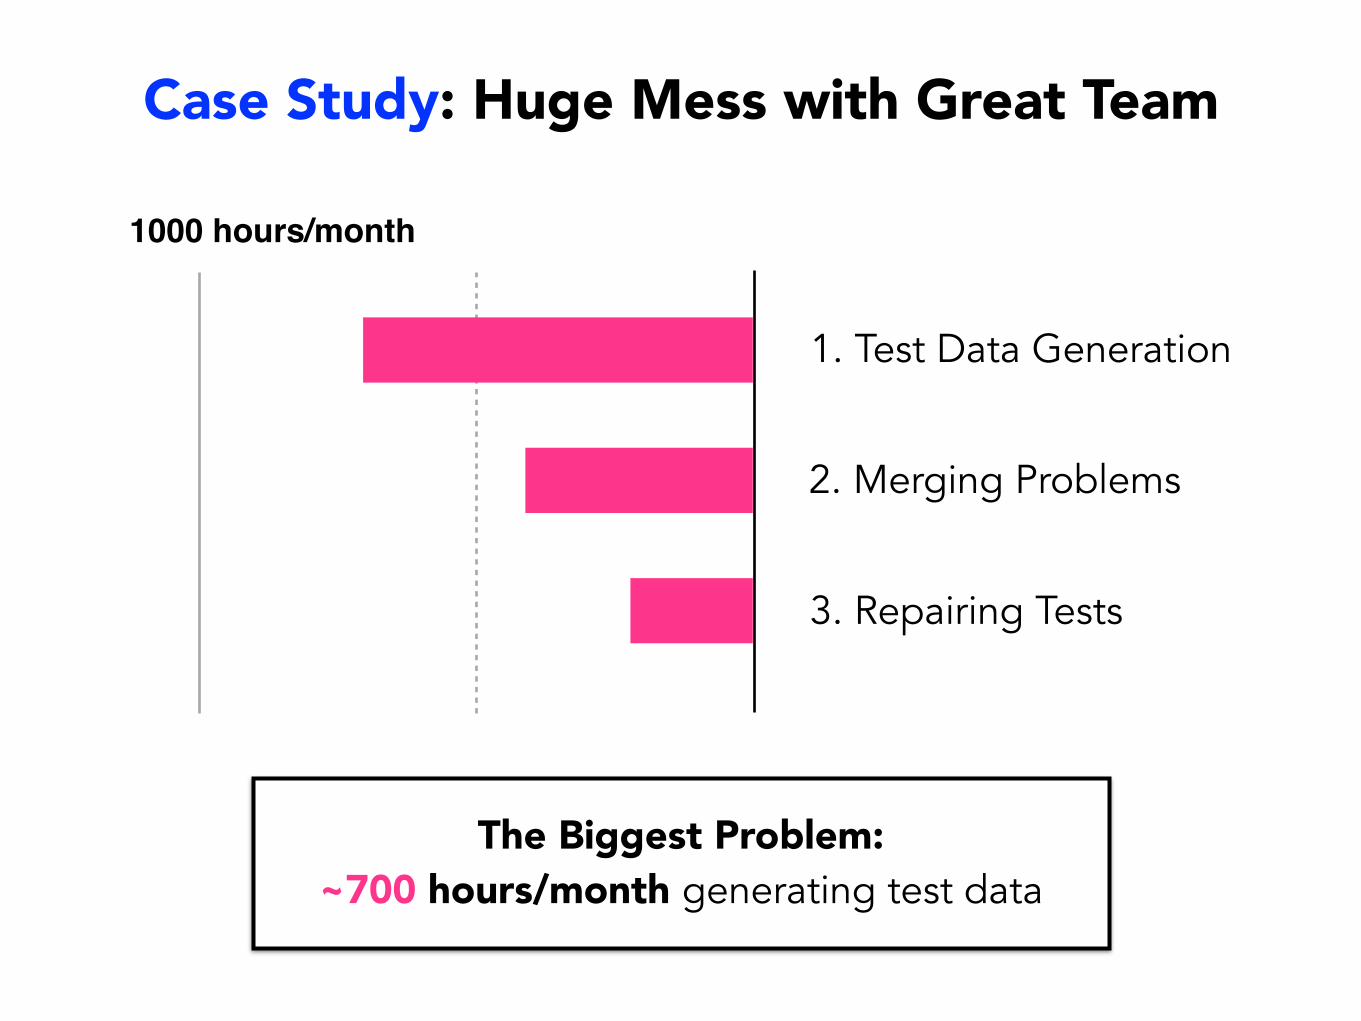
Case Study: Huge Mess with Great Team
1. Test Data Generation
2. Merging Problems
3. Repairing Tests
1000 hours/month
The Biggest Problem: ~700 hours/month generating test data
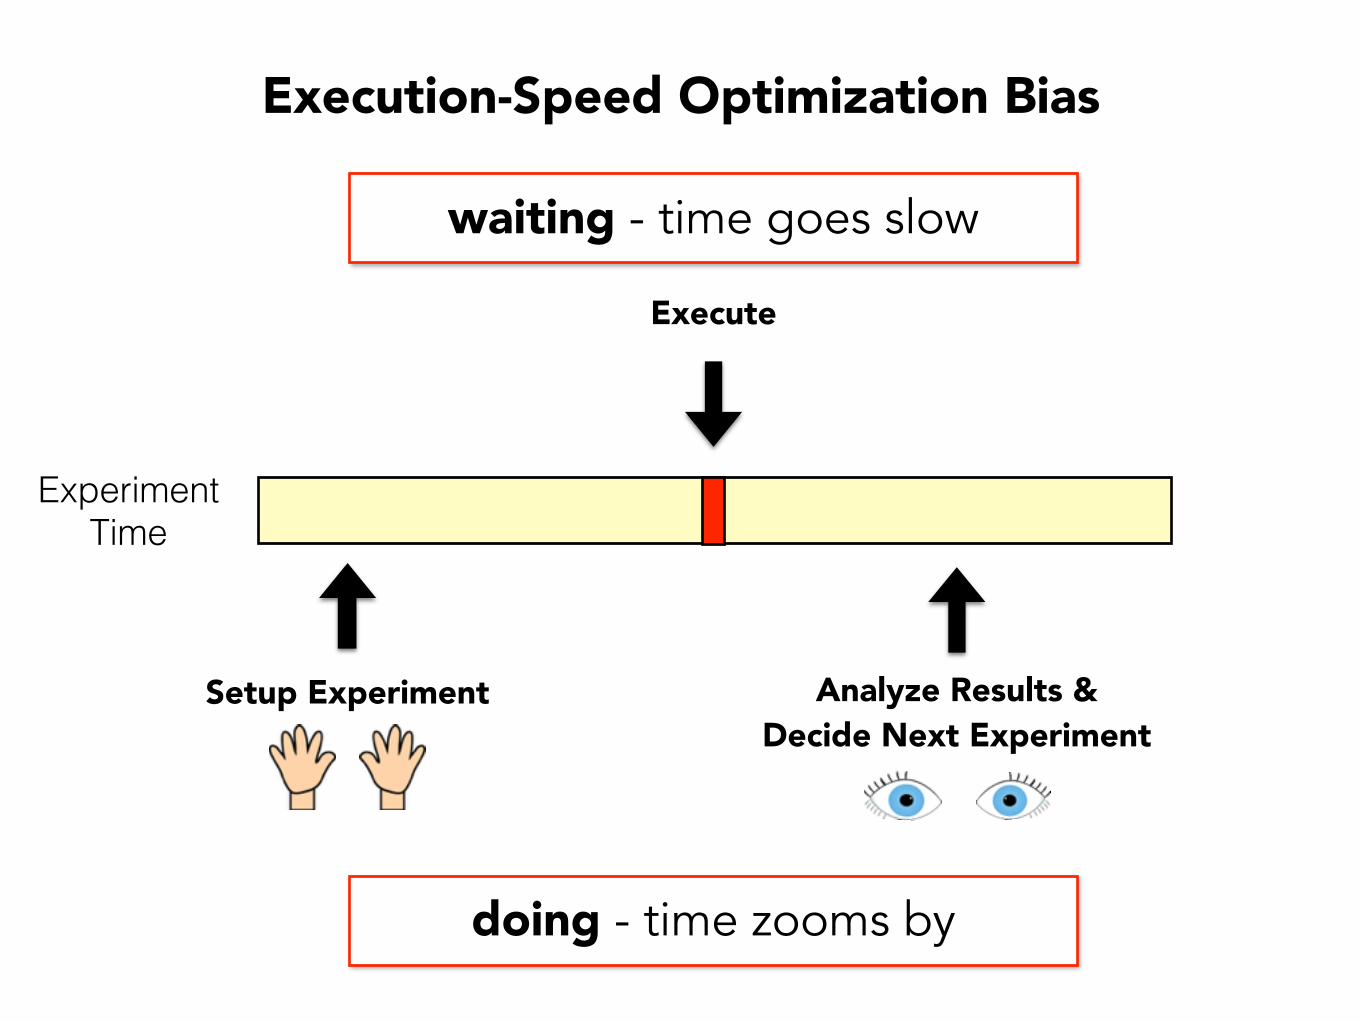
Experiment Time
Setup Experiment Analyze Results & Decide Next Experiment
Execute
waiting - time goes slow
doing - time zooms by
Execution-Speed Optimization Bias
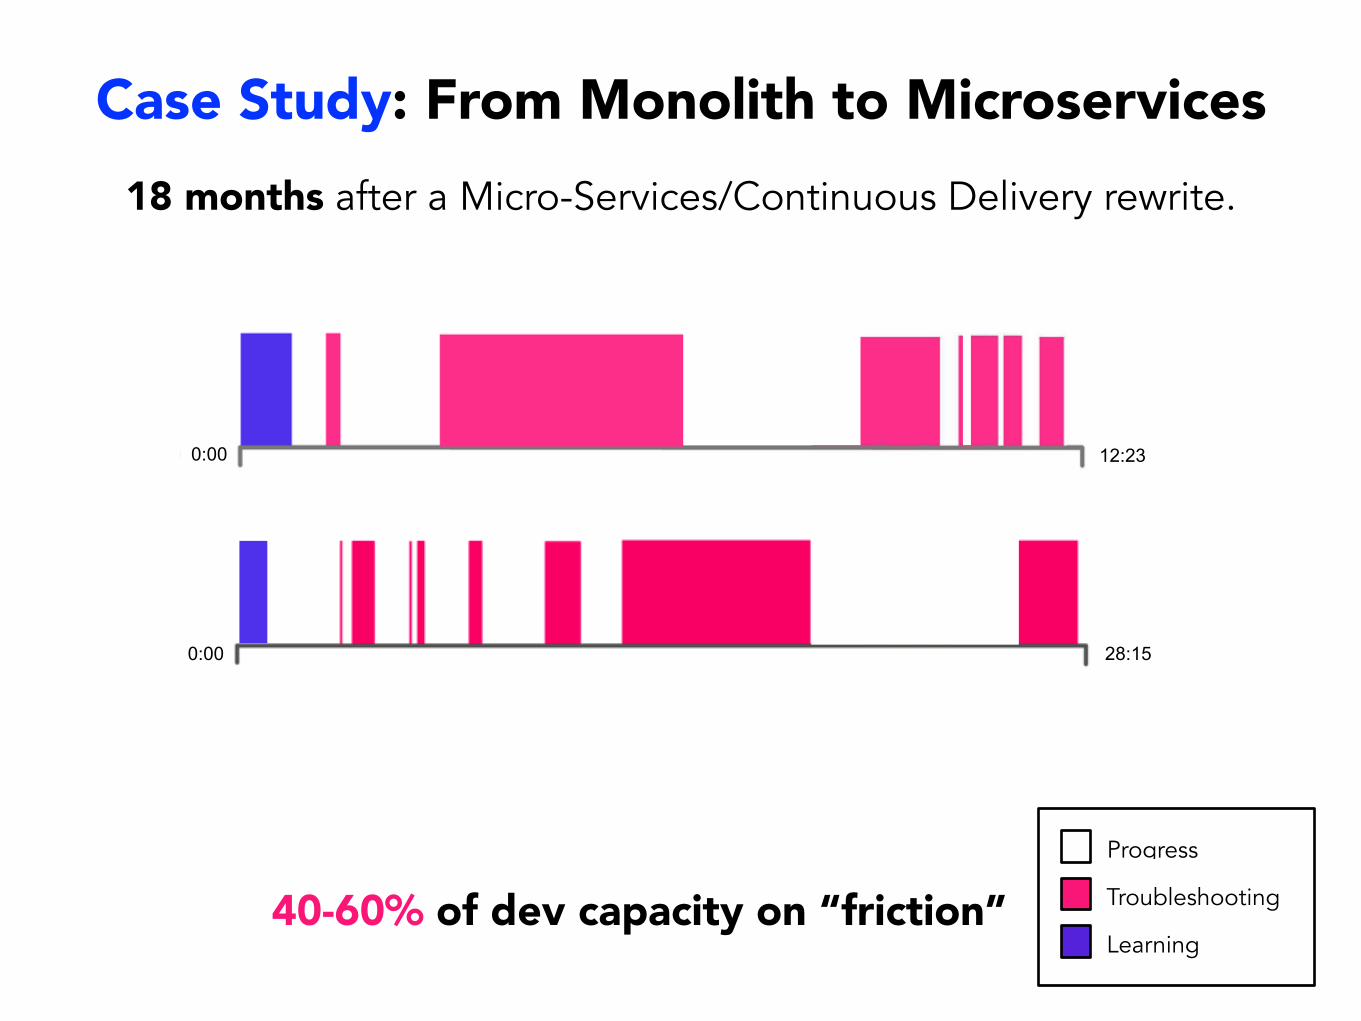
18 months after a Micro-Services/Continuous Delivery rewrite.
Troubleshooting
Progress
Learning40-60% of dev capacity on “friction”
0:00 28:15
12:230:00
Case Study: From Monolith to Microservices
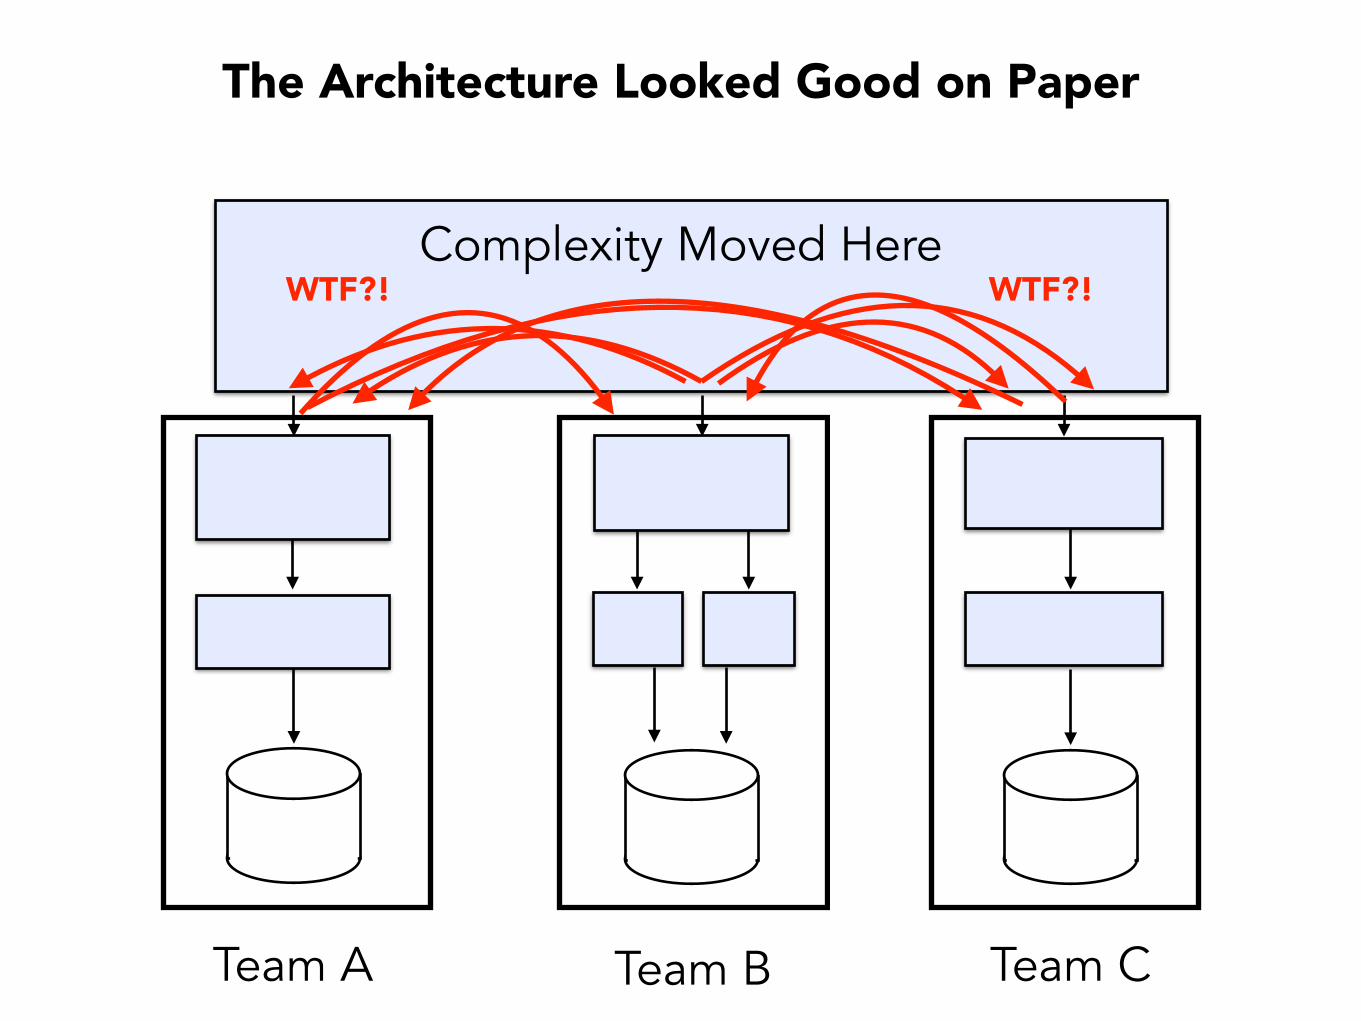
The Architecture Looked Good on Paper
Team A Team B Team C
Complexity Moved HereWTF?! WTF?!
We Don’t Have TIME To Fix It!

Time%Pressure%
Compromise%Safety%for%
Speed%
Increase%Number%&%Severity%of%Hazards%
%
More%Pain%and%Higher%Task%Effort%
Constant'Urgency'
Cycle of Chaos High-Risk Decision Habits
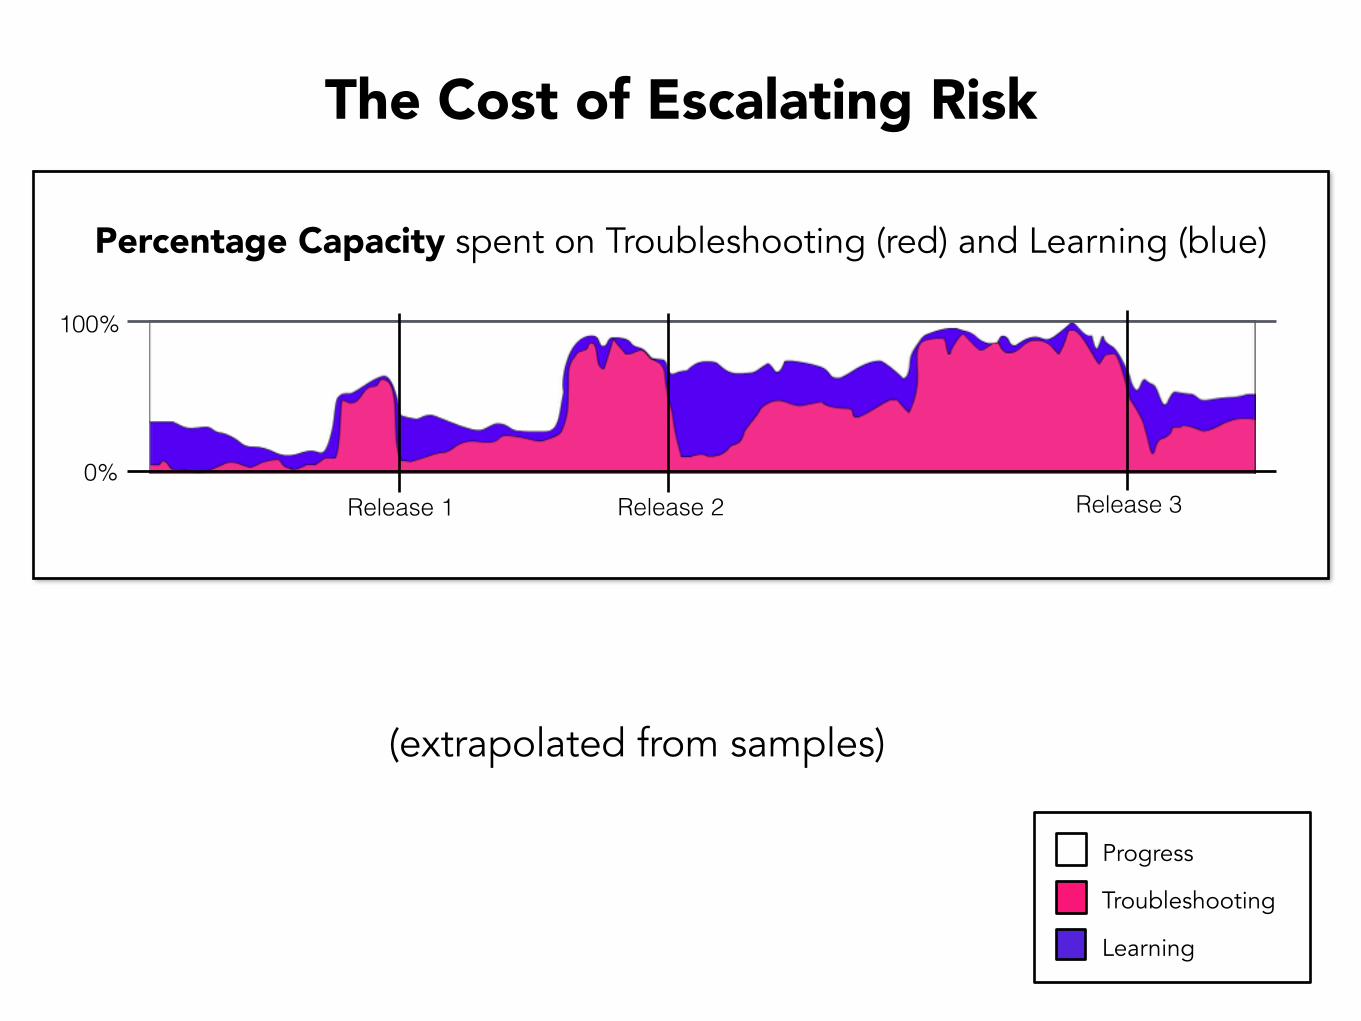
The Cost of Escalating Risk
0%
100%
Release 1 Release 2 Release 3
Troubleshooting
Progress
Learning
Percentage Capacity spent on Troubleshooting (red) and Learning (blue)
(extrapolated from samples)
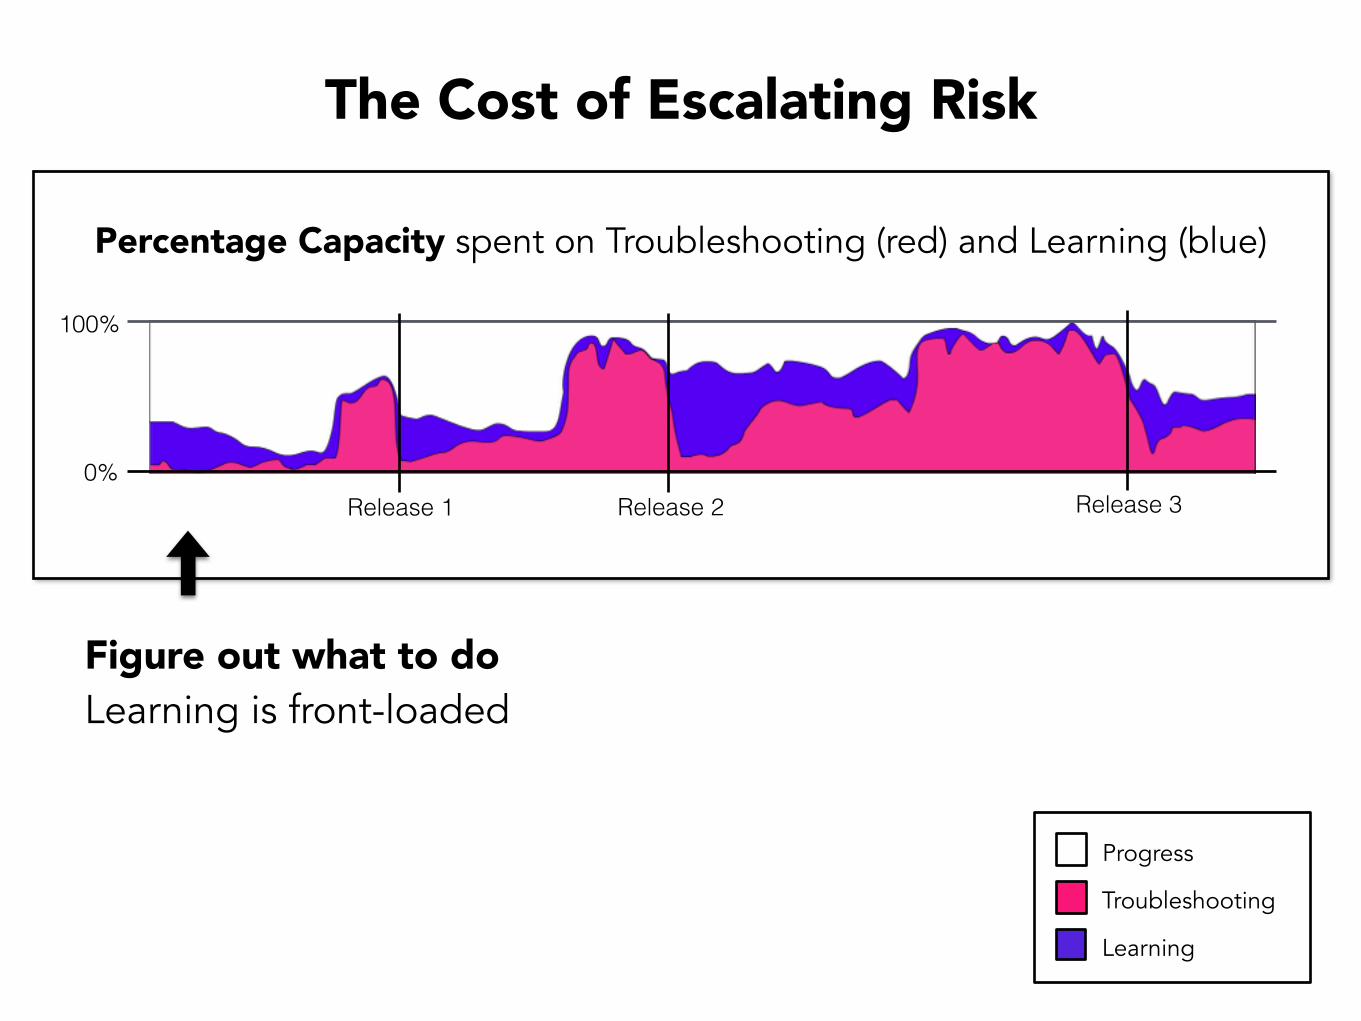
0%
100%
Release 1 Release 2 Release 3
Percentage Capacity spent on Troubleshooting (red) and Learning (blue)
Figure out what to do Learning is front-loaded
Troubleshooting
Progress
Learning
The Cost of Escalating Risk
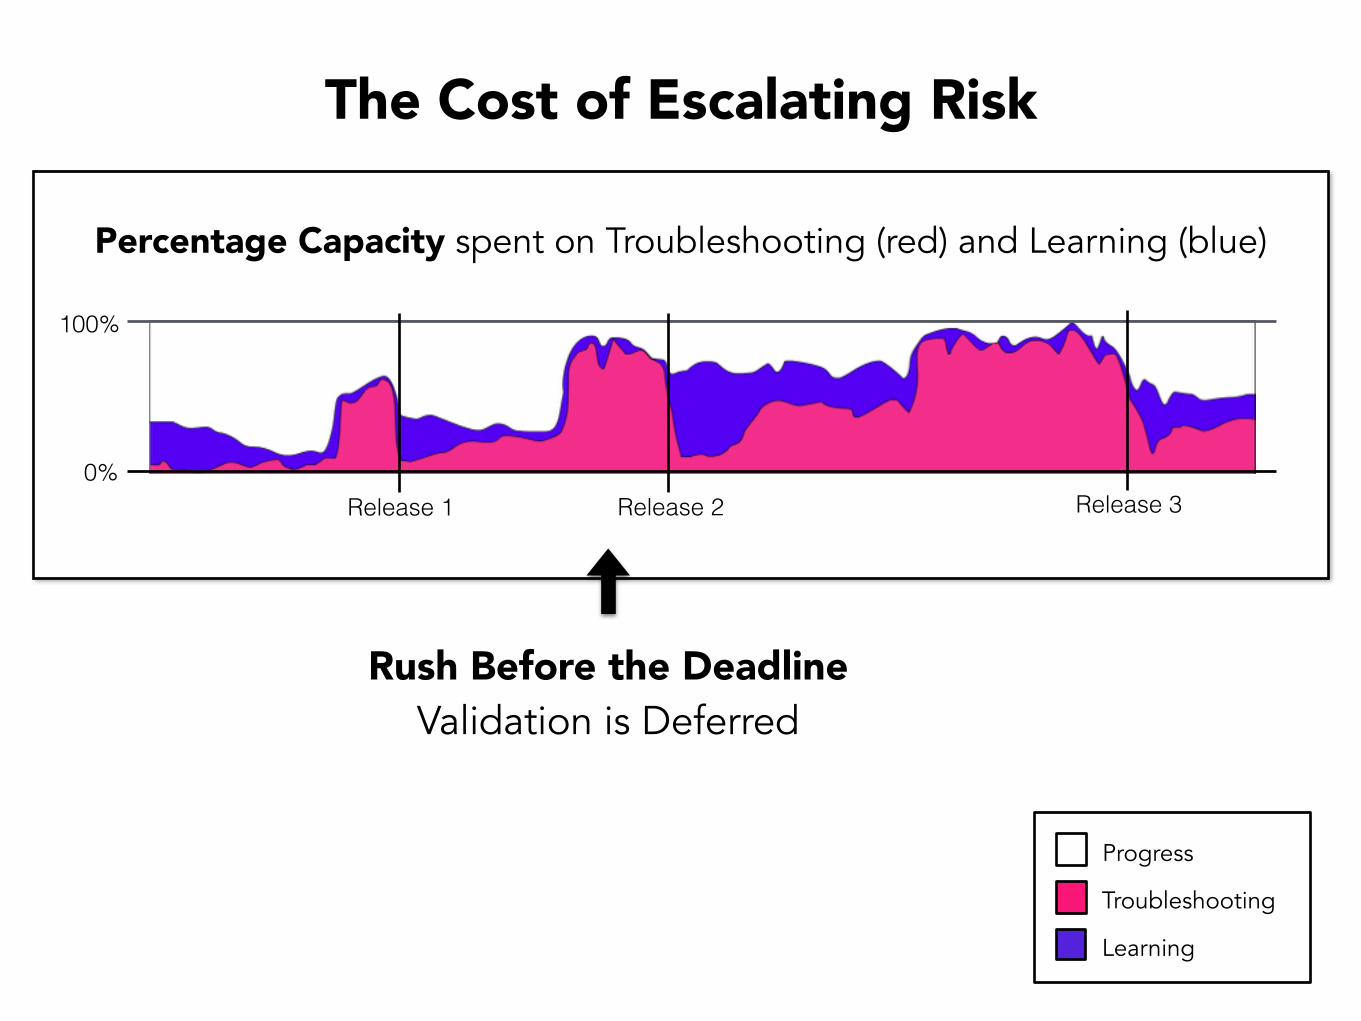
0%
100%
Release 1 Release 2 Release 3
Percentage Capacity spent on Troubleshooting (red) and Learning (blue)
Rush Before the Deadline Validation is Deferred
Troubleshooting
Progress
Learning
The Cost of Escalating Risk
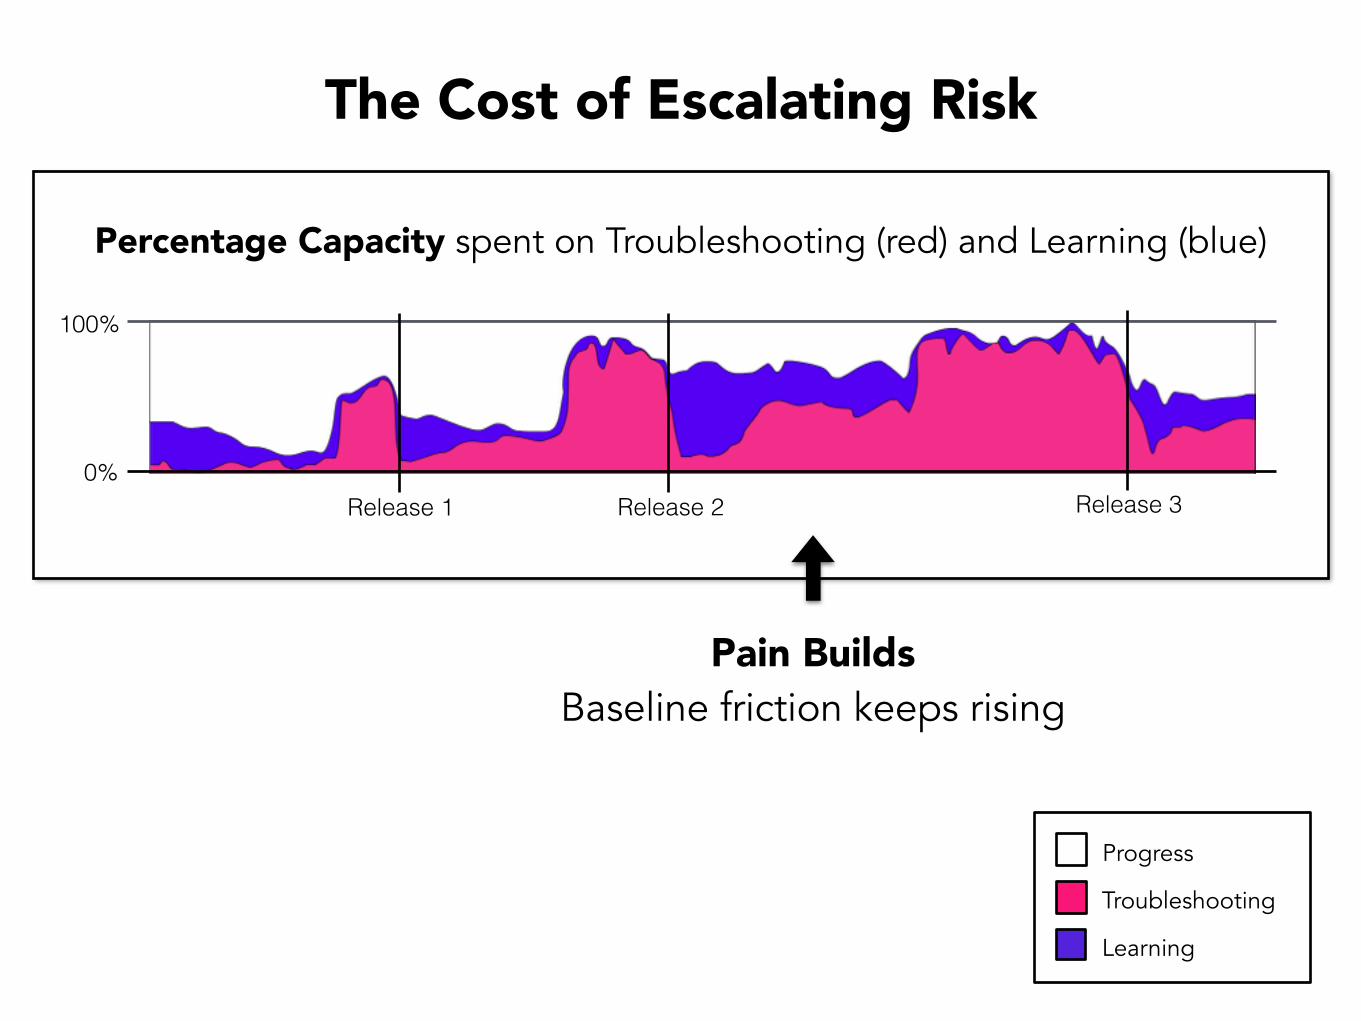
0%
100%
Release 1 Release 2 Release 3
Percentage Capacity spent on Troubleshooting (red) and Learning (blue)
Pain Builds Baseline friction keeps rising
Troubleshooting
Progress
Learning
The Cost of Escalating Risk
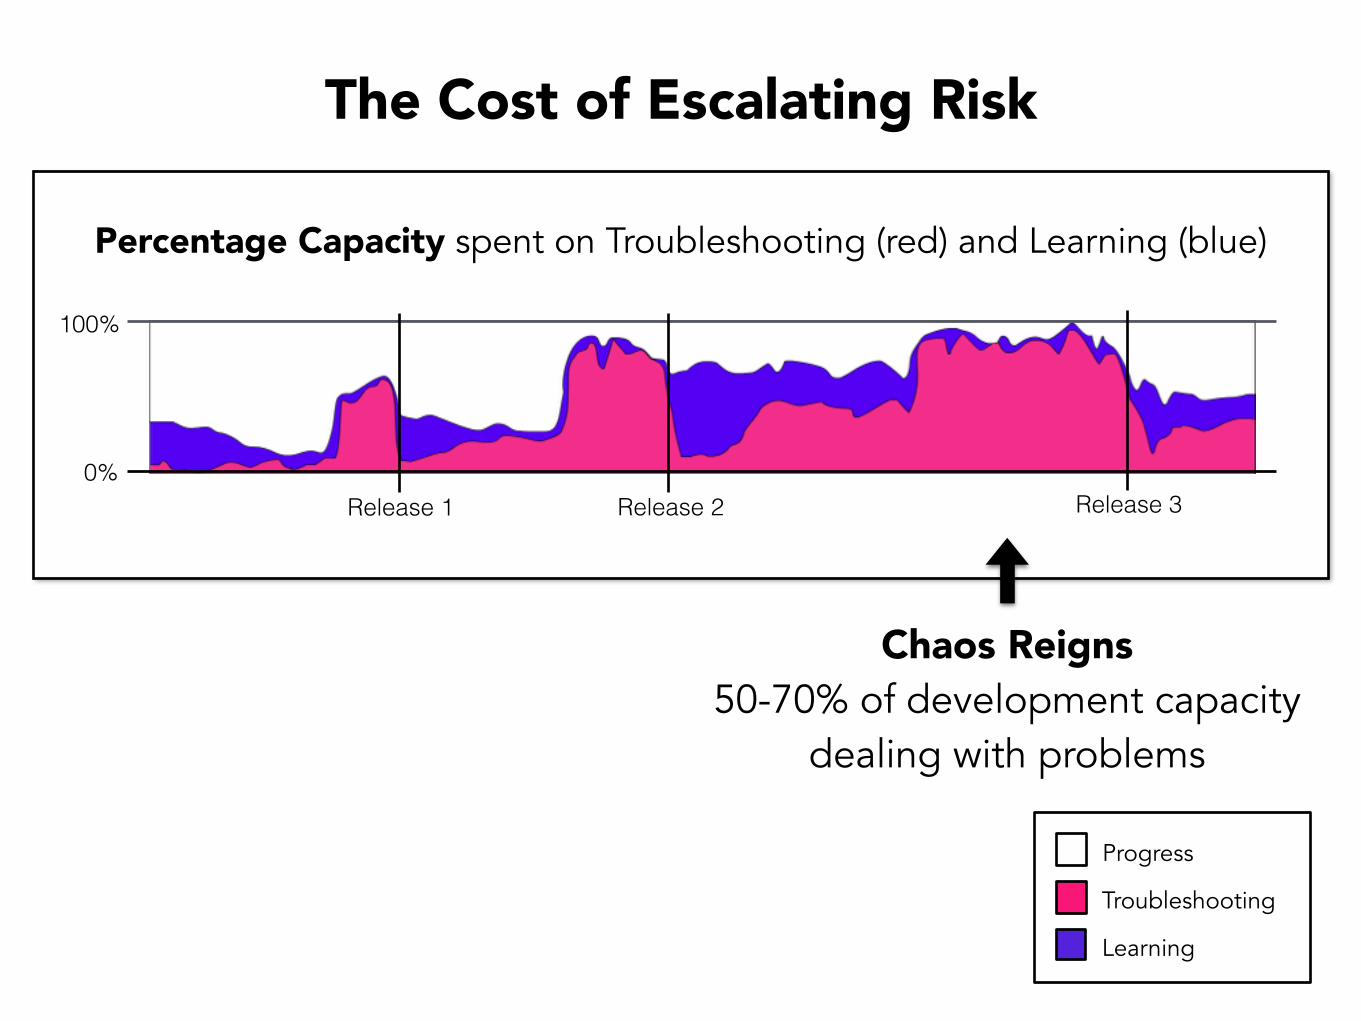
0%
100%
Release 1 Release 2 Release 3
Percentage Capacity spent on Troubleshooting (red) and Learning (blue)
Chaos Reigns 50-70% of development capacity
dealing with problems
Troubleshooting
Progress
Learning
The Cost of Escalating Risk
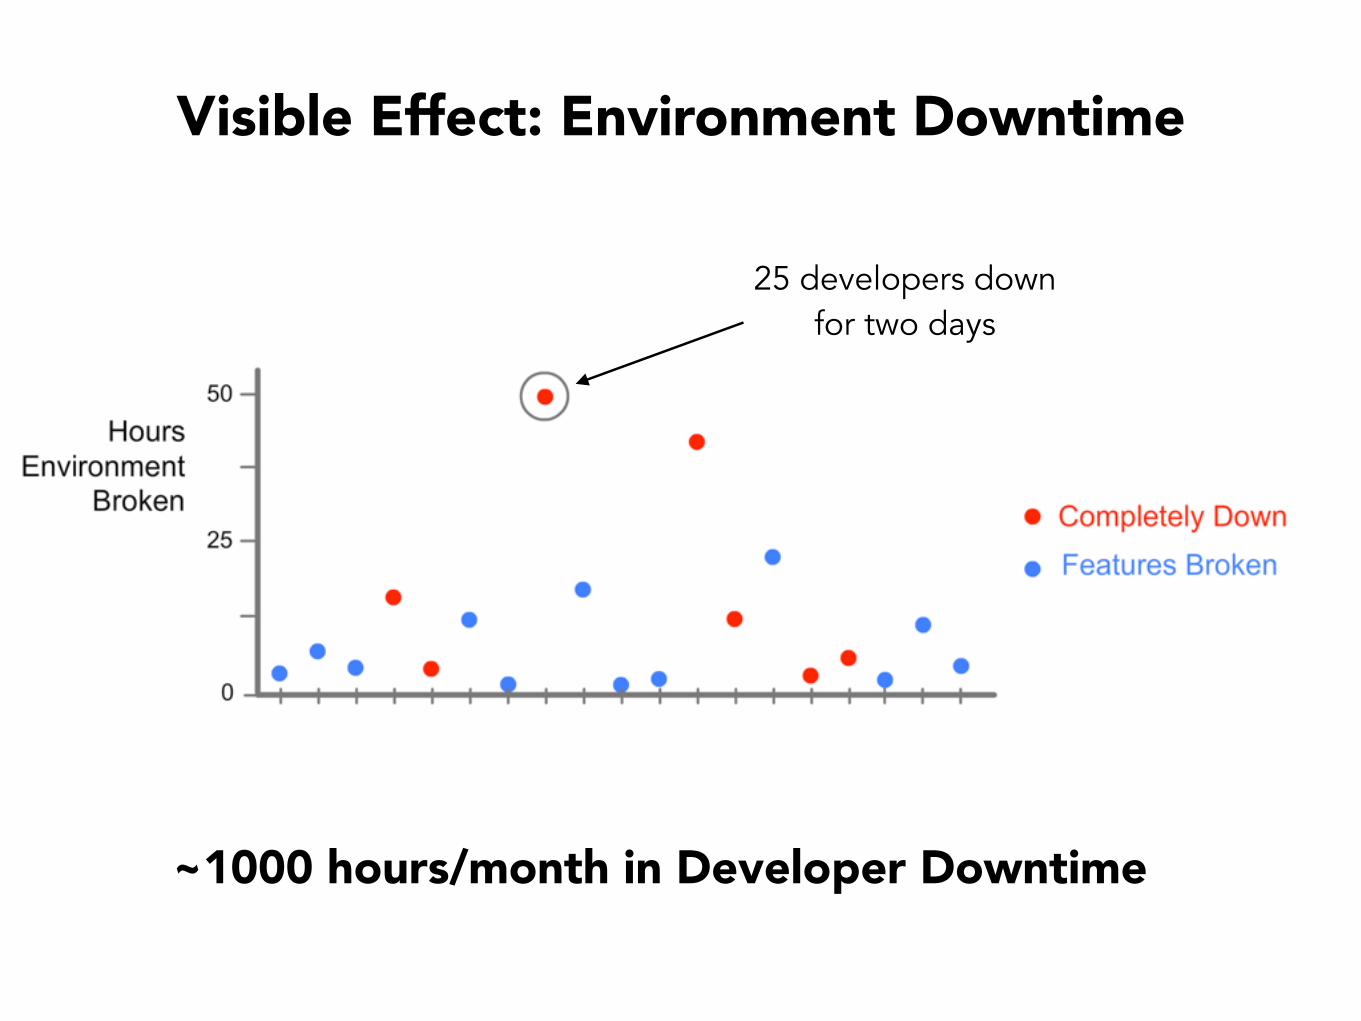
Visible Effect: Environment Downtime
~1000 hours/month in Developer Downtime
25 developers down for two days
The Teams got THREE MONTHS to work on improvements
Case Study: From Monolith to Microservices

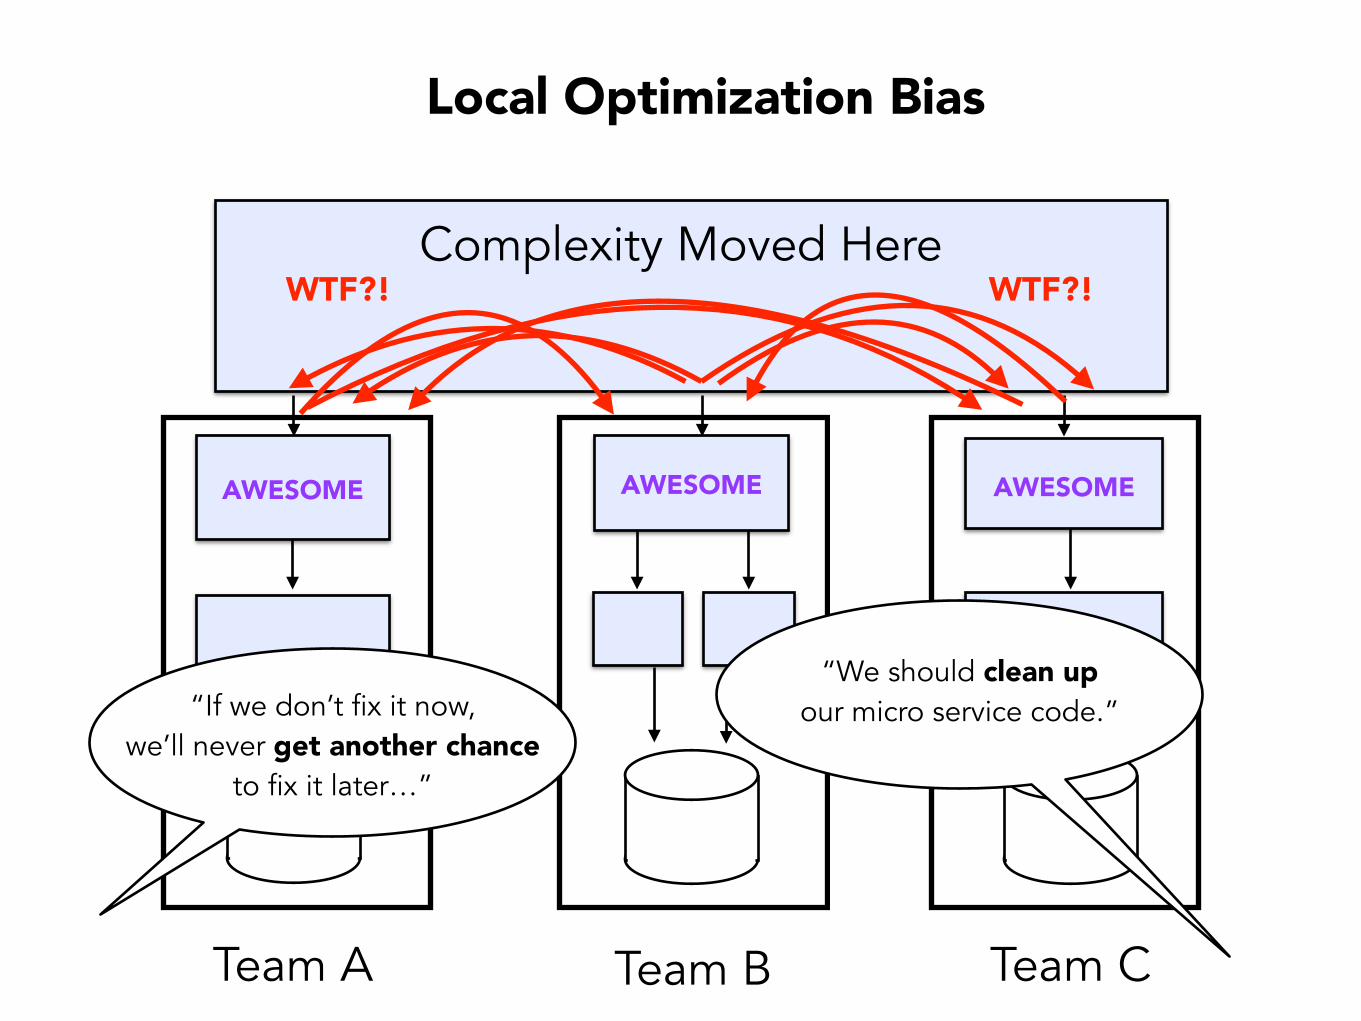
Local Optimization Bias
Team A Team B Team C
Complexity Moved HereWTF?! WTF?!
AWESOME AWESOME AWESOME
“If we don’t fix it now, we’ll never get another chance
to fix it later…”
“We should clean up our microservices code.”
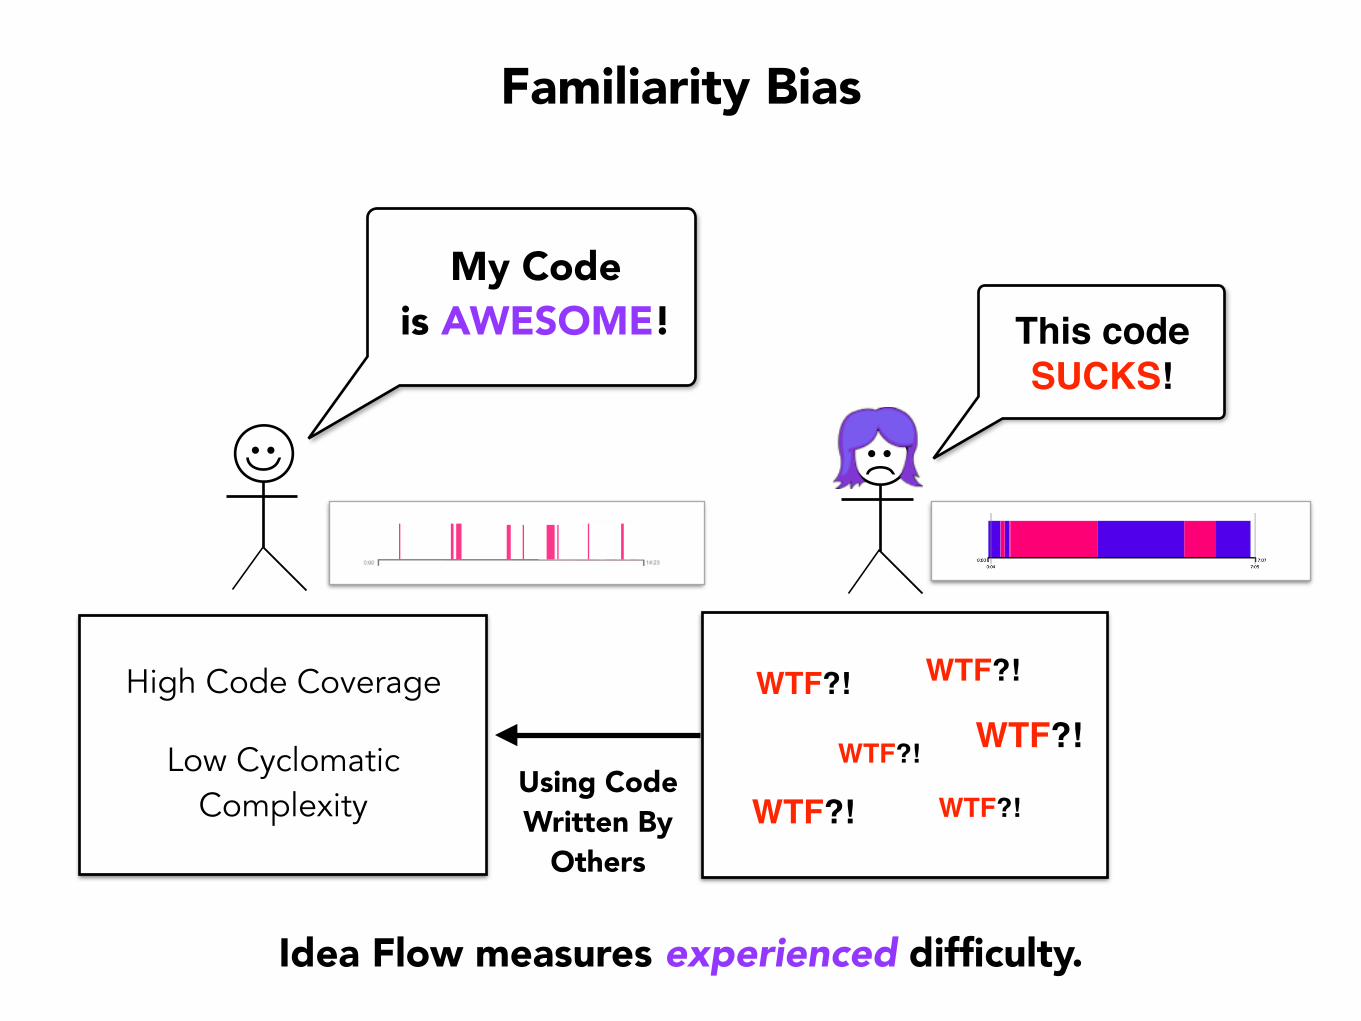
Familiarity Bias
My Code is AWESOME!
High Code Coverage
Low Cyclomatic Complexity
This code SUCKS!
Using Code Written By
Others
WTF?!
WTF?!
WTF?!
WTF?!
WTF?! WTF?!
Idea Flow measures experienced difficulty.
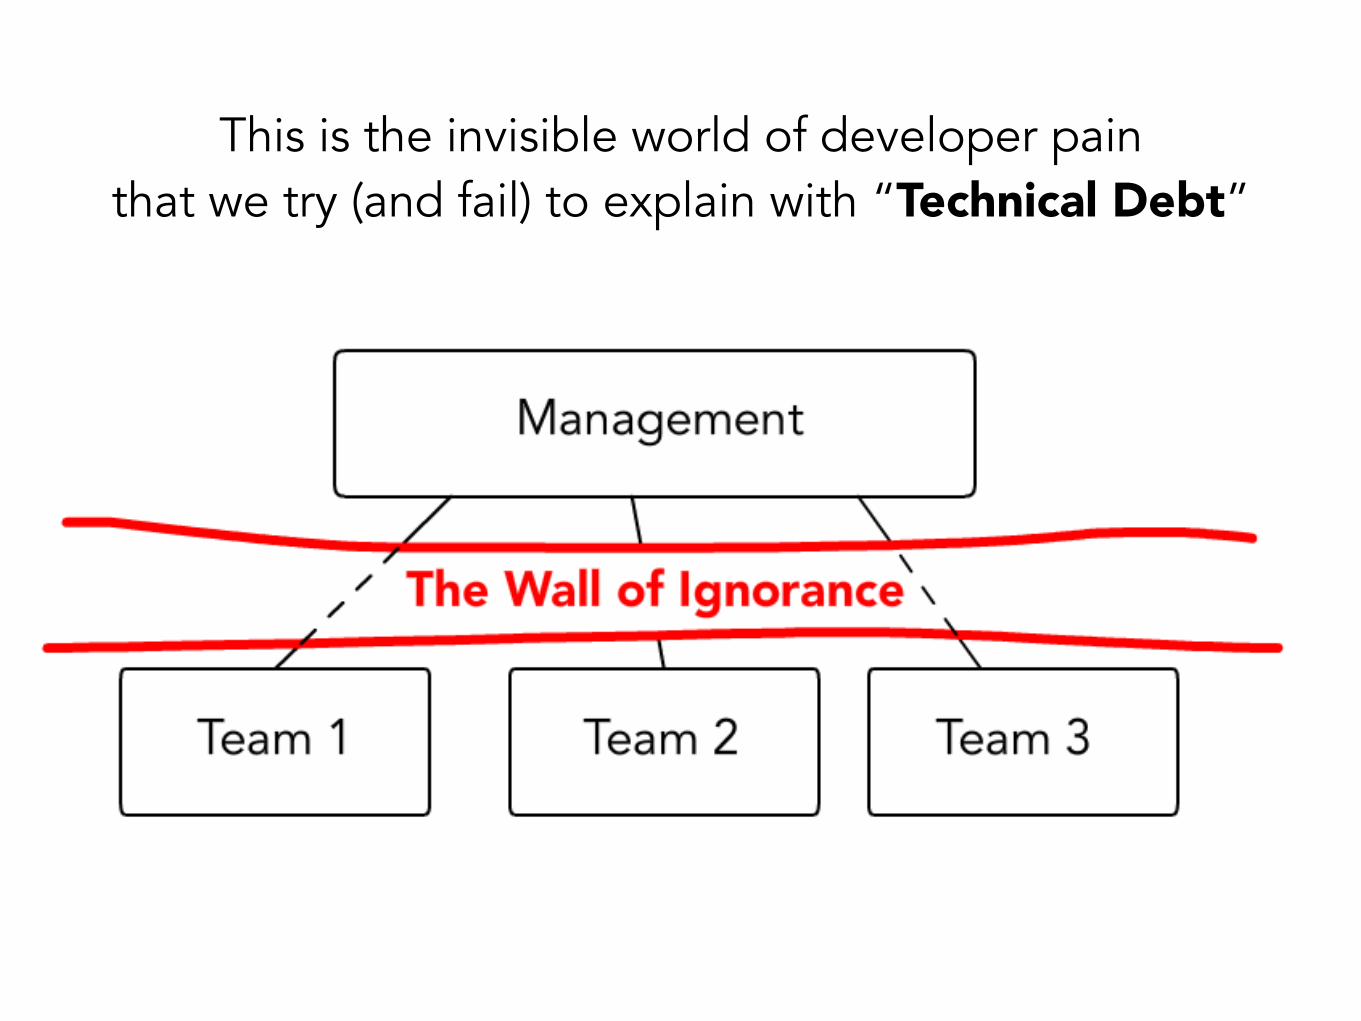
This is the invisible world of developer pain that we try (and fail) to explain with “Technical Debt”
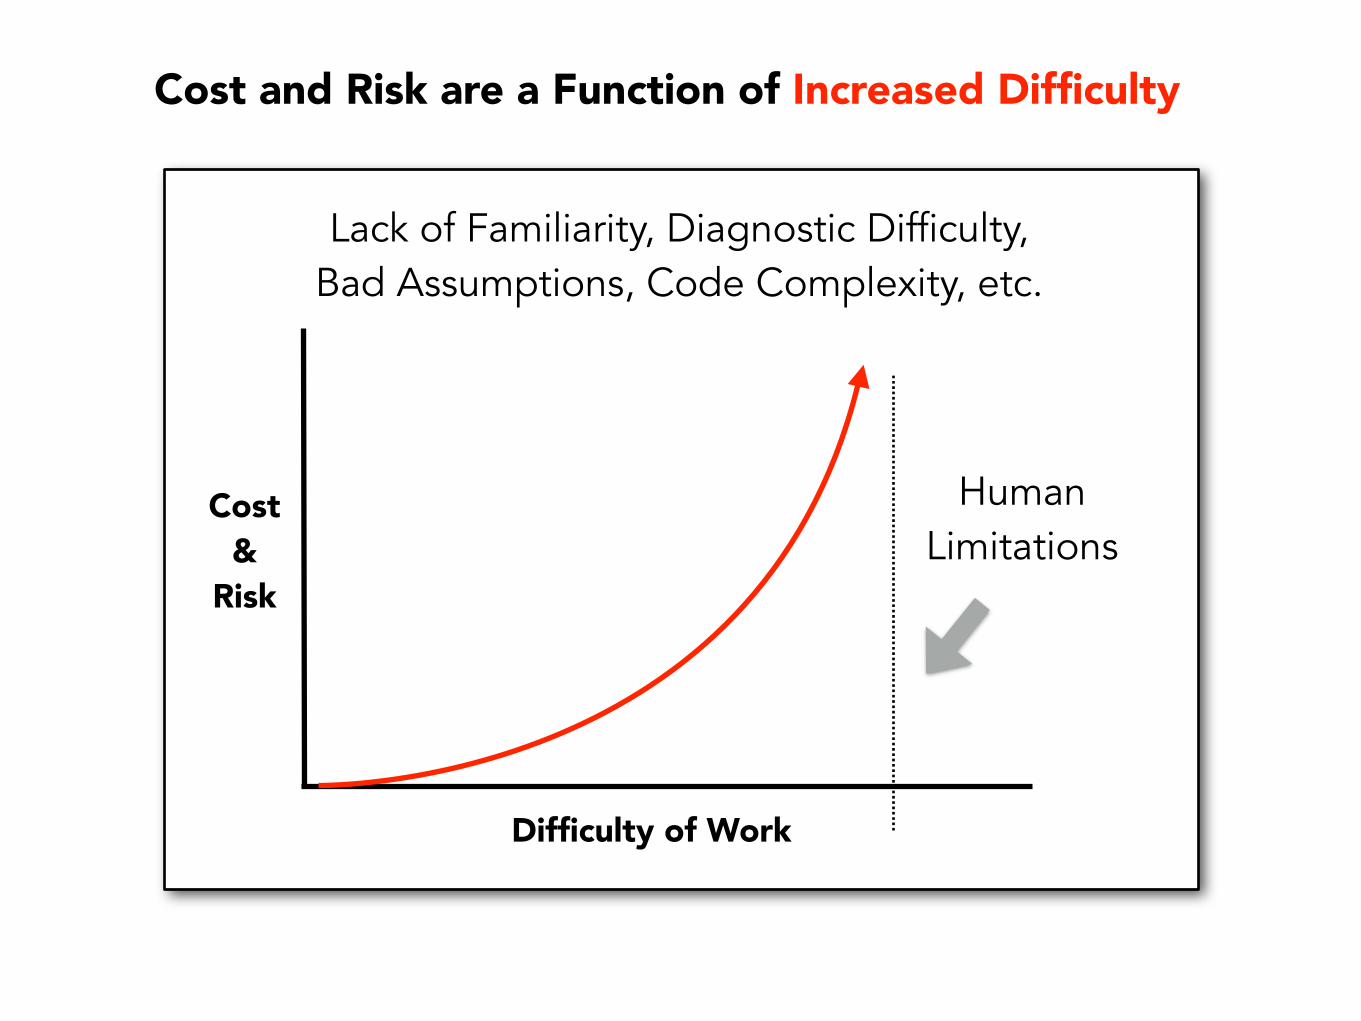
Cost and Risk are a Function of Increased Difficulty
Cost &
Risk
Human Limitations
Difficulty of Work
Lack of Familiarity, Diagnostic Difficulty, Bad Assumptions, Code Complexity, etc.
Time%Pressure%
Compromise%Safety%for%
Speed%
Increase%Number%&%Severity%of%Hazards%
%
More%Pain%and%Higher%Task%Effort%
Constant'Urgency'
Cycle of Chaos High-Risk Decision Habits
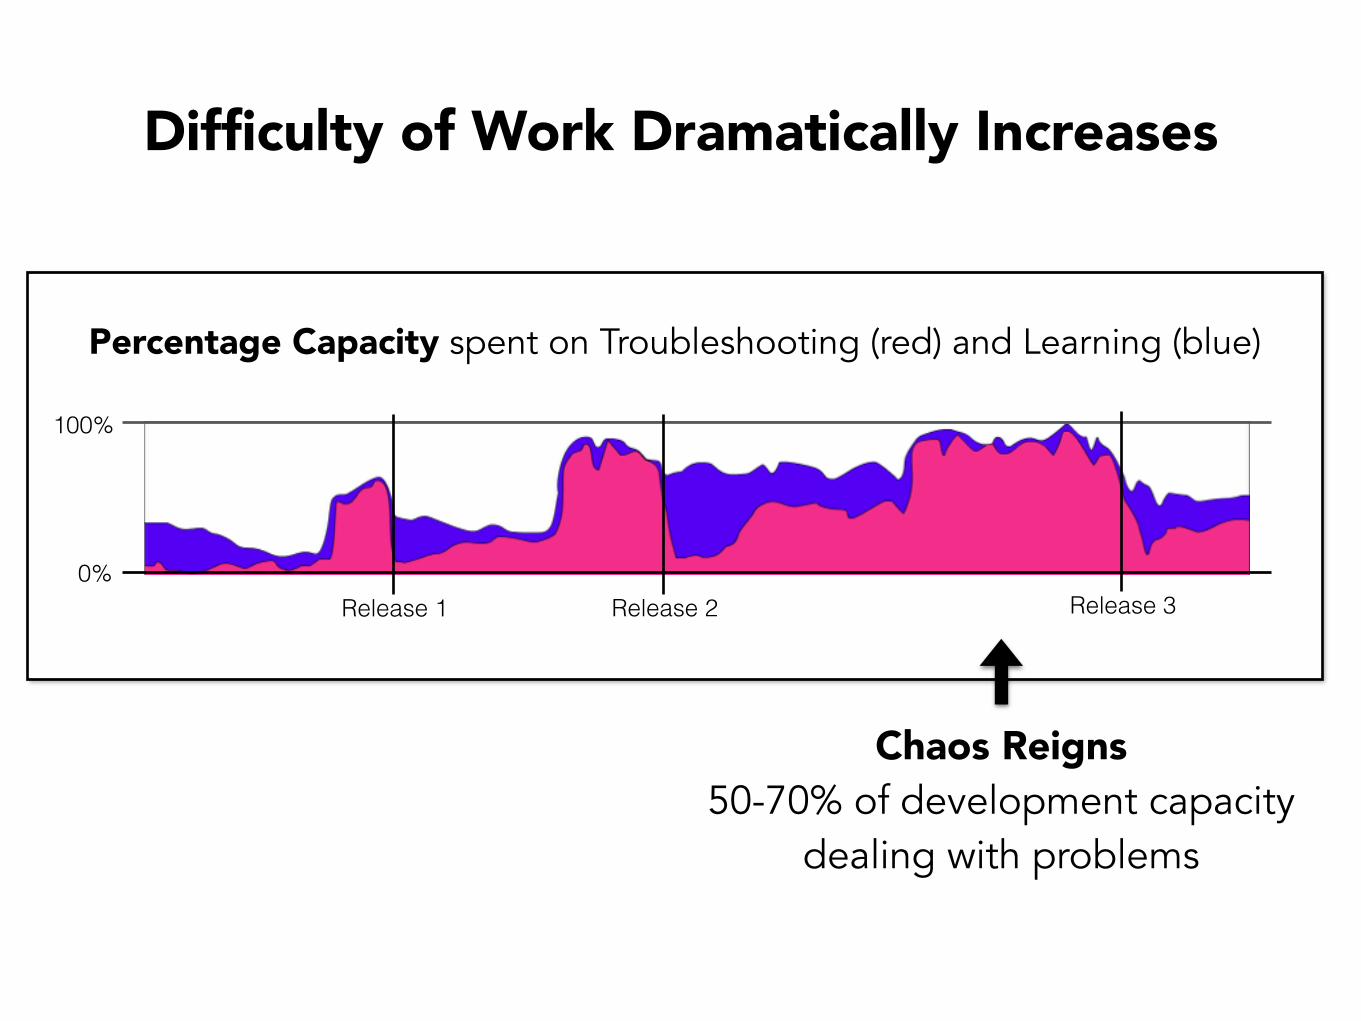
Difficulty of Work Dramatically Increases
0%
100%
Release 1 Release 2 Release 3
Percentage Capacity spent on Troubleshooting (red) and Learning (blue)
Chaos Reigns 50-70% of development capacity
dealing with problems
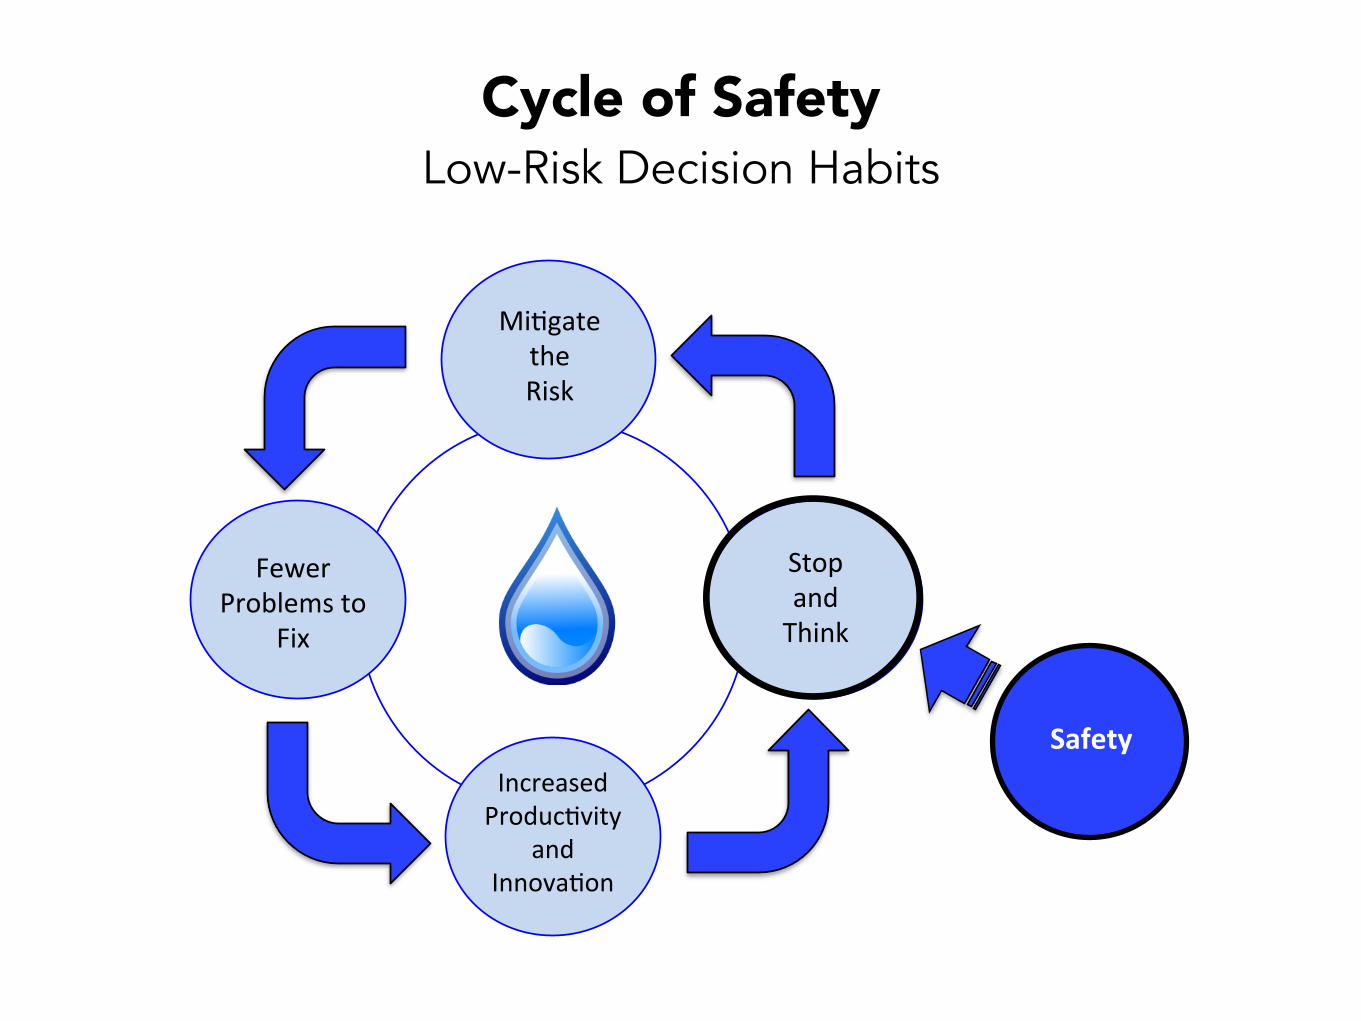
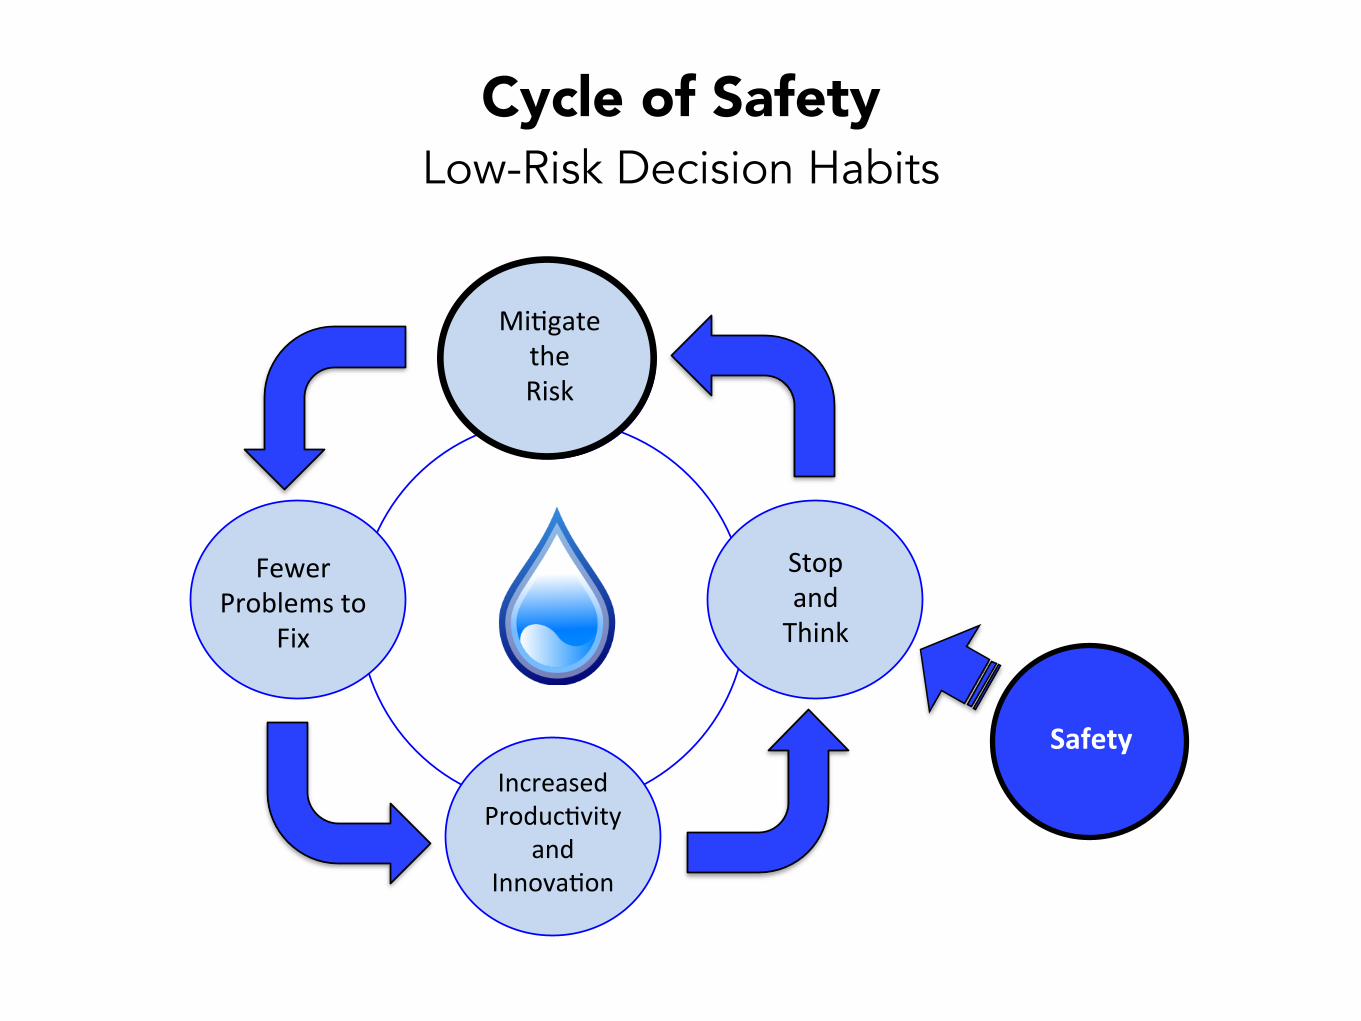
Fewer%Problems%to%
Fix%
Stop%%and%Think%
Mi8gate%the%Risk%
Increased%Produc8vity%
and%Innova8on%
Safety'
Cycle of Safety Low-Risk Decision Habits
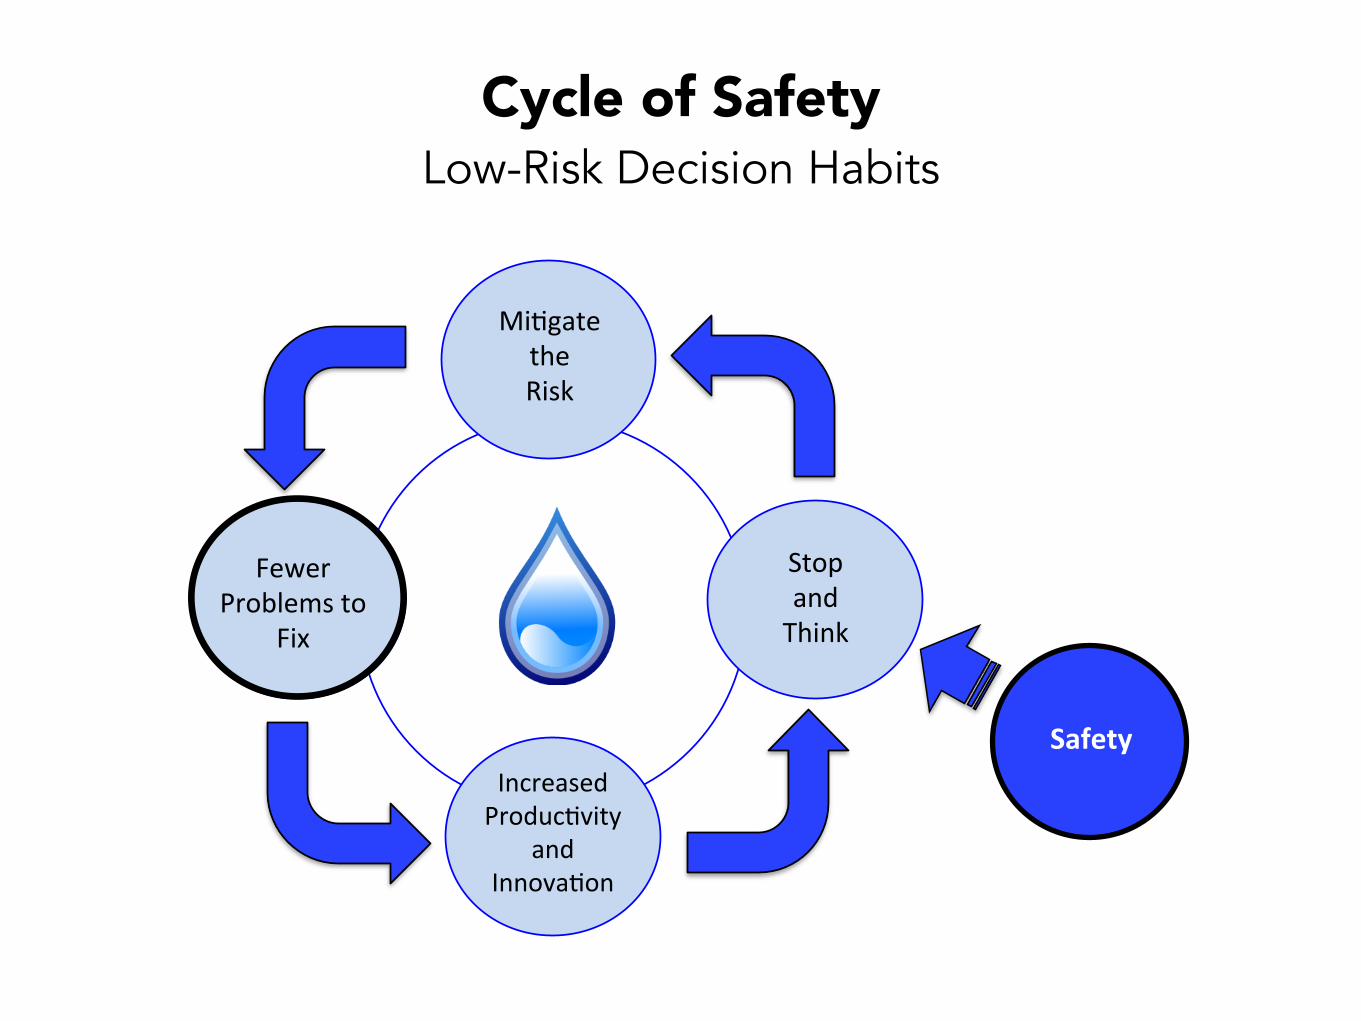
Fewer%Problems%to%
Fix%
Stop%%and%Think%
Mi8gate%the%Risk%
Increased%Produc8vity%
and%Innova8on%
Safety'
Cycle of Safety Low-Risk Decision Habits
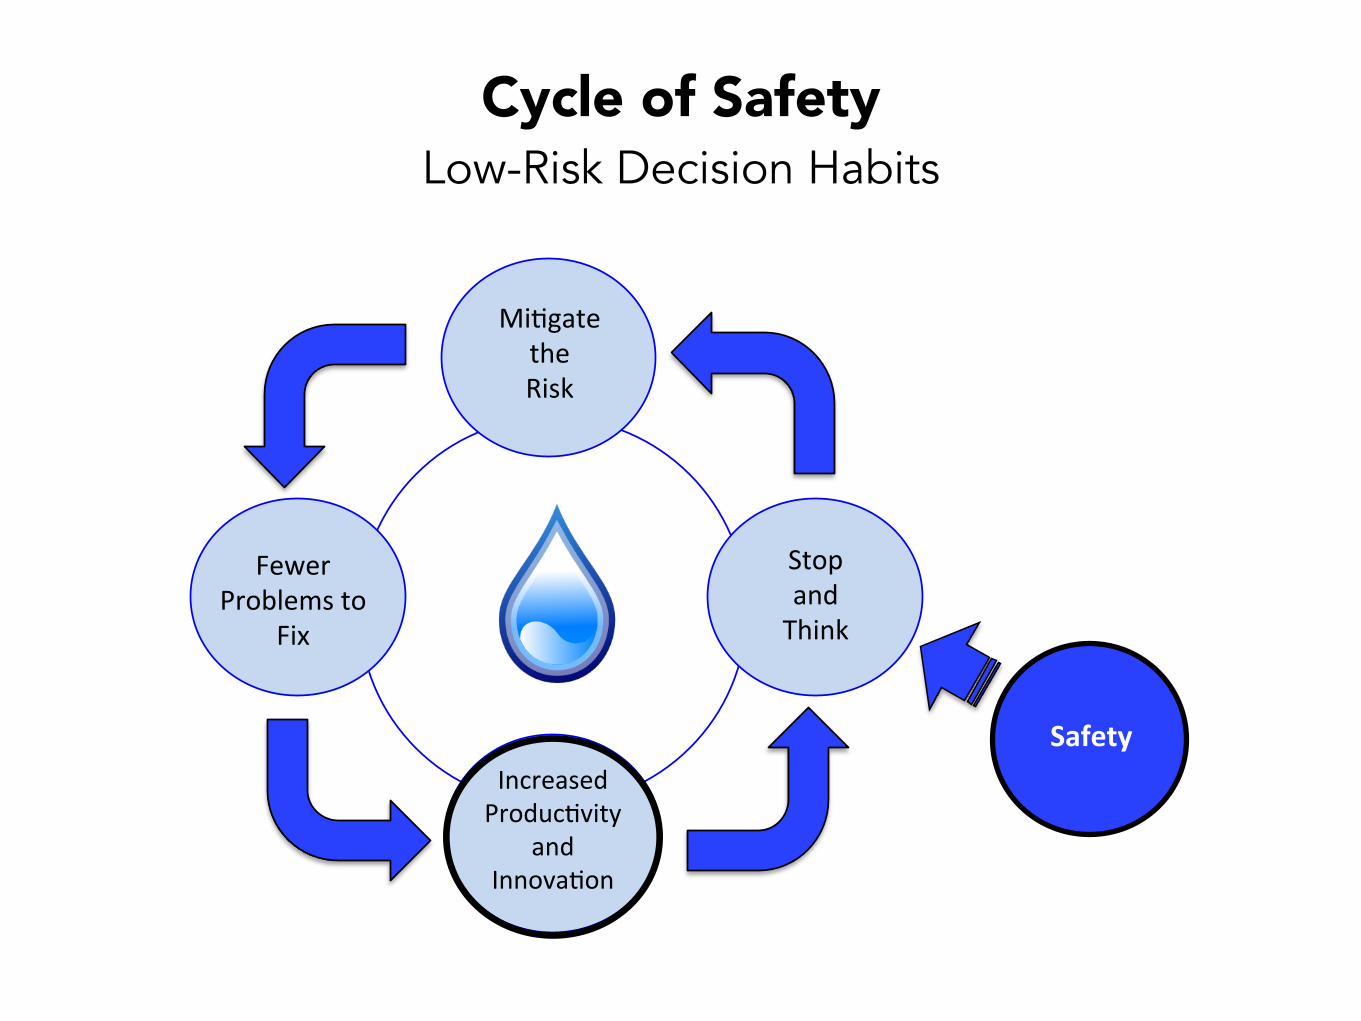
Fewer%Problems%to%
Fix%
Stop%%and%Think%
Mi8gate%the%Risk%
Increased%Produc8vity%
and%Innova8on%
Safety'
Cycle of Safety Low-Risk Decision Habits
Fewer%Problems%to%
Fix%
Stop%%and%Think%
Mi8gate%the%Risk%
Increased%Produc8vity%
and%Innova8on%
Safety'
Cycle of Safety Low-Risk Decision Habits
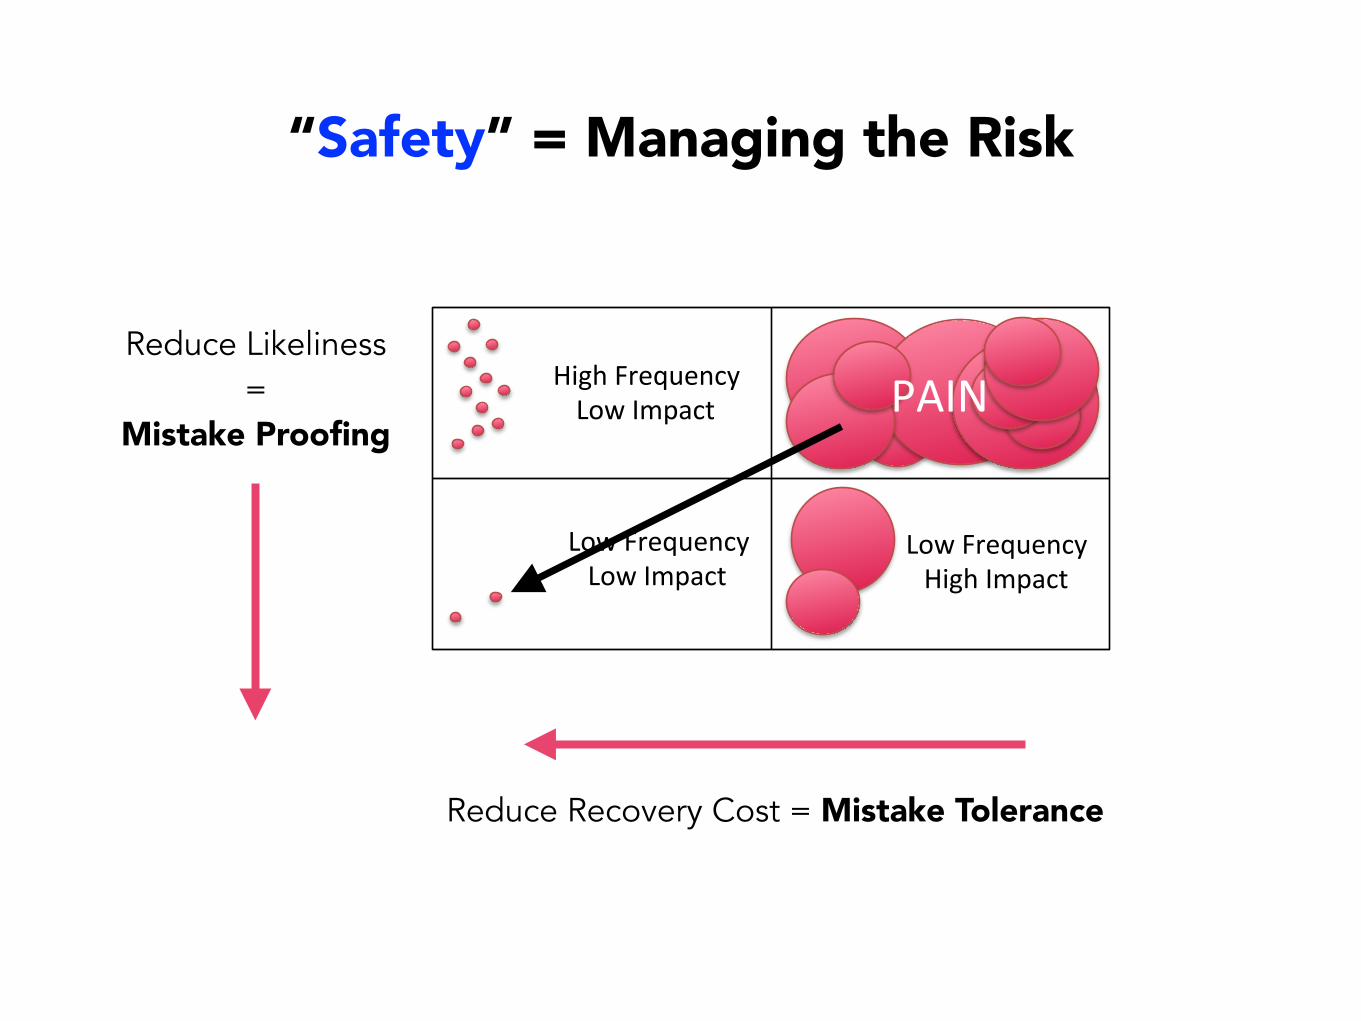
Likelihood)of))Unexpected)Behavior)
Cost)to)Troubleshoot)and)Repair)
High)Frequency)Low)Impact)
Low)Frequency)Low)Impact)
Low)Frequency)High)Impact)
PAIN)
“Safety” = Managing the Risk
Reduce Likeliness =
Mistake Proofing
Reduce Recovery Cost = Mistake Tolerance
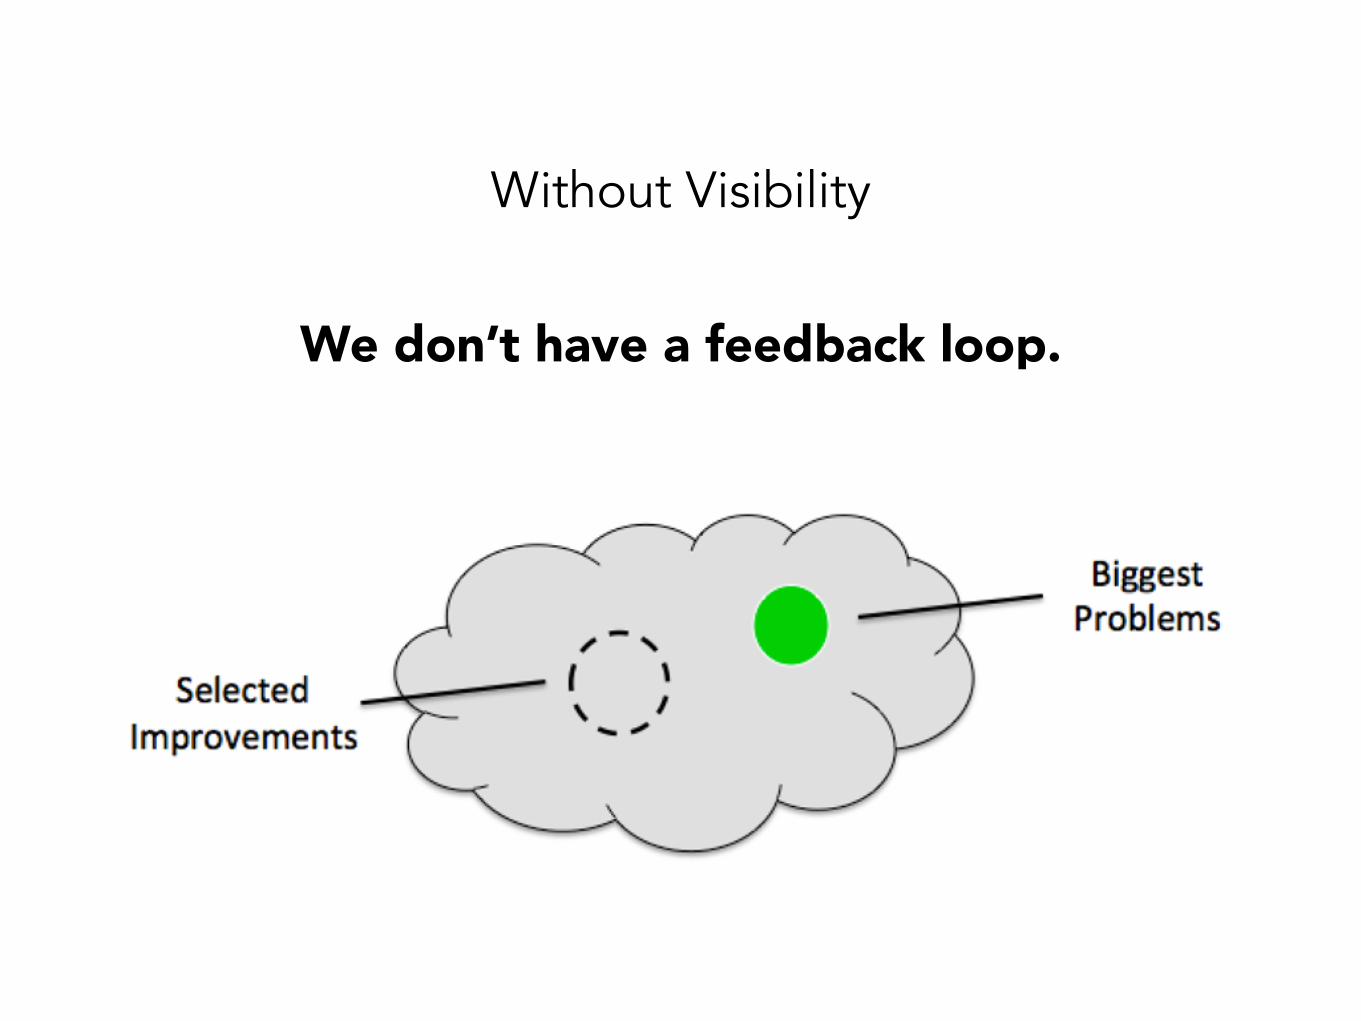
Without Visibility
We don’t have a feedback loop.
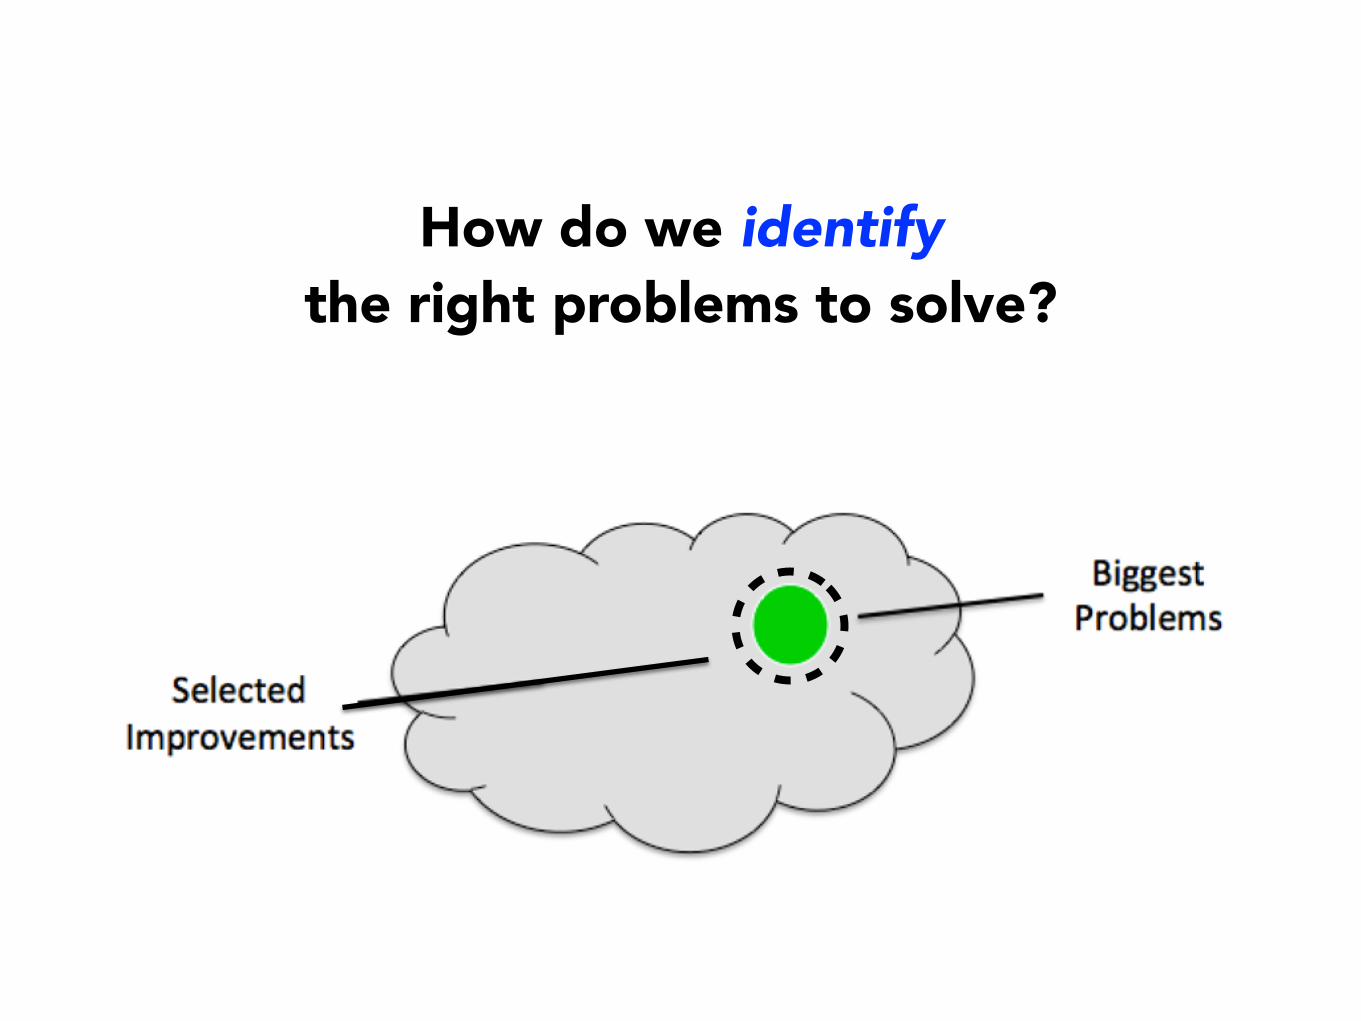
How do we identify the right problems to solve?
“What caused the pain in this case?”
Categorize the Problems with #HashTags
#ReportingEngine
#Hibernate
#MergeHell
The Team’s Improvement Focus: Increasing unit test coverage by 5%
Case Study: Huge Mess with Great Team
1. Test Data Generation
2. Merging Problems
3. Repairing Tests
1000 hours/month
The Biggest Problem: ~700 hours/month generating test data
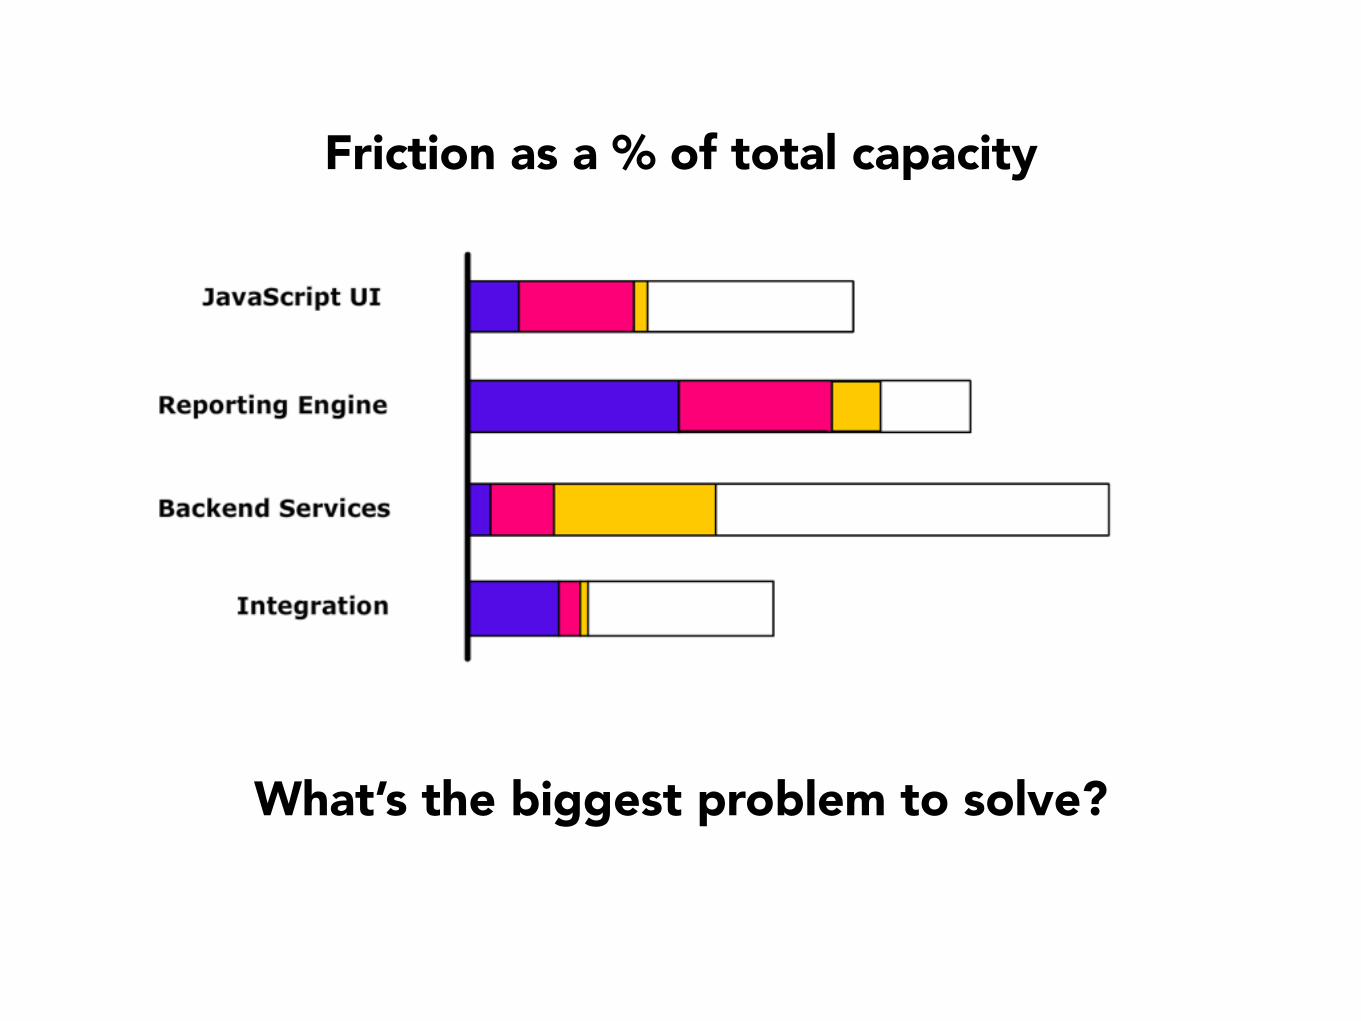
Friction as a % of total capacity
What’s the biggest problem to solve?
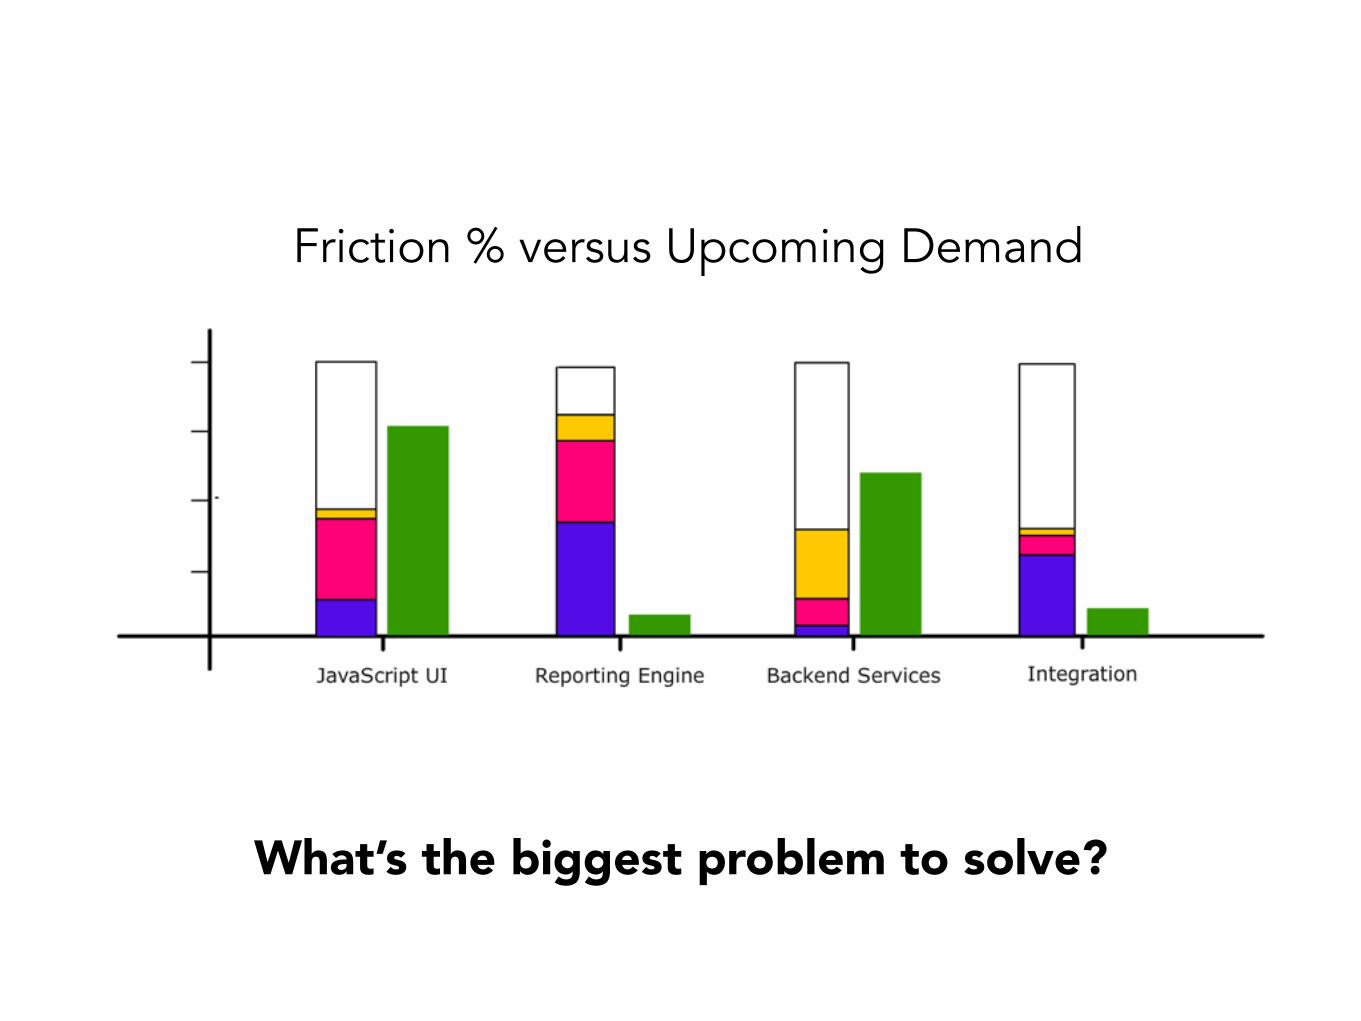
Friction % versus Upcoming Demand
What’s the biggest problem to solve?
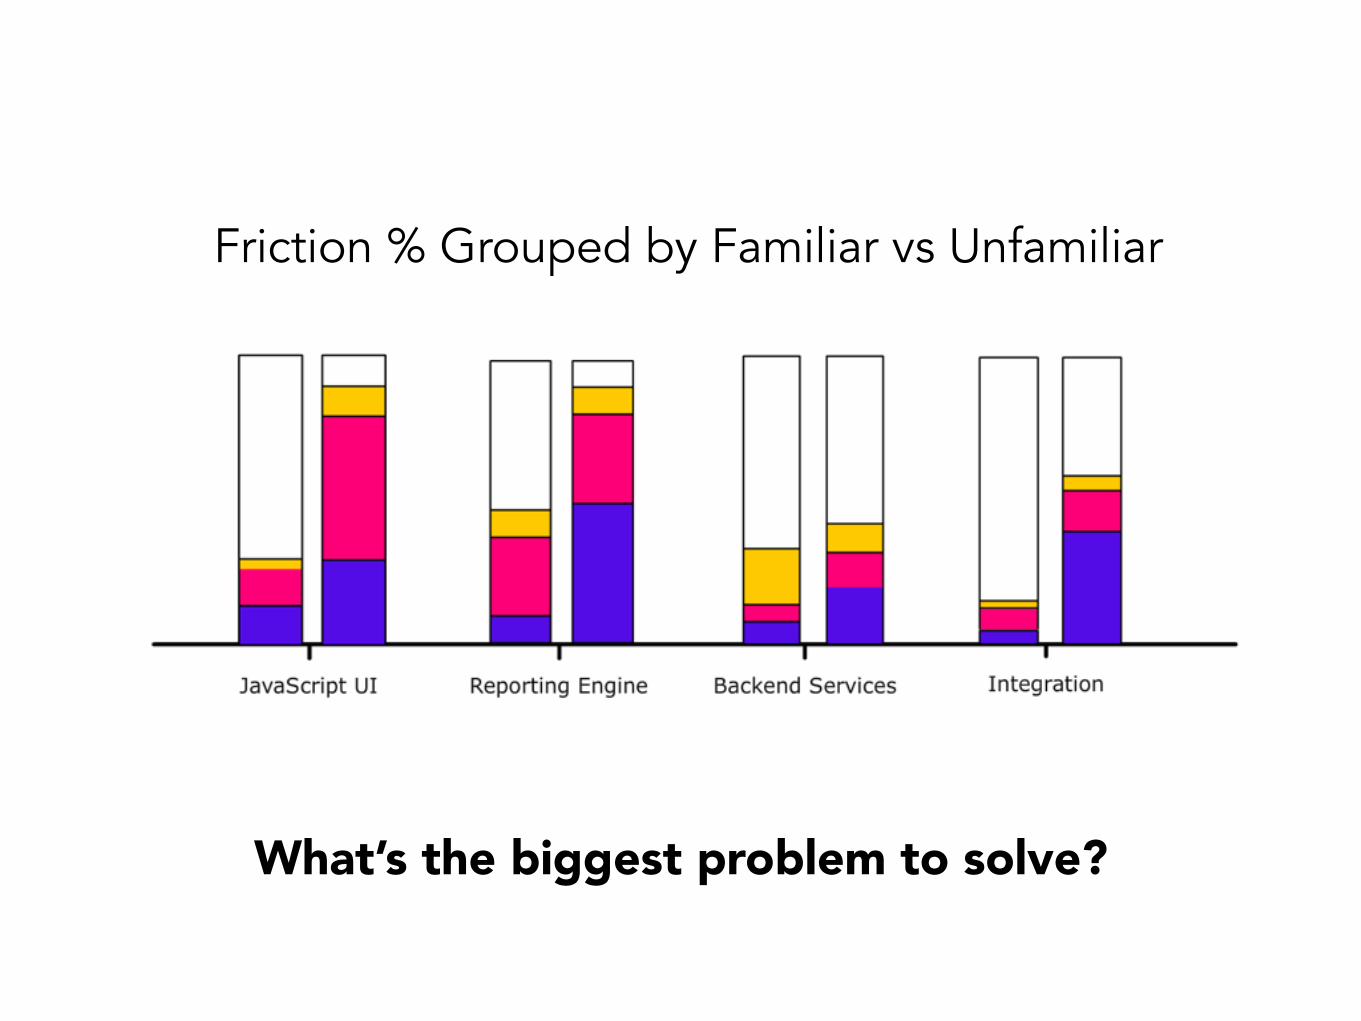
Friction % Grouped by Familiar vs Unfamiliar
What’s the biggest problem to solve?
Local Optimization Bias
Team A Team B Team C
Complexity Moved HereWTF?! WTF?!
AWESOME AWESOME AWESOME
“If we don’t fix it now, we’ll never get another chance
to fix it later…”
“We should clean up our micro service code.”
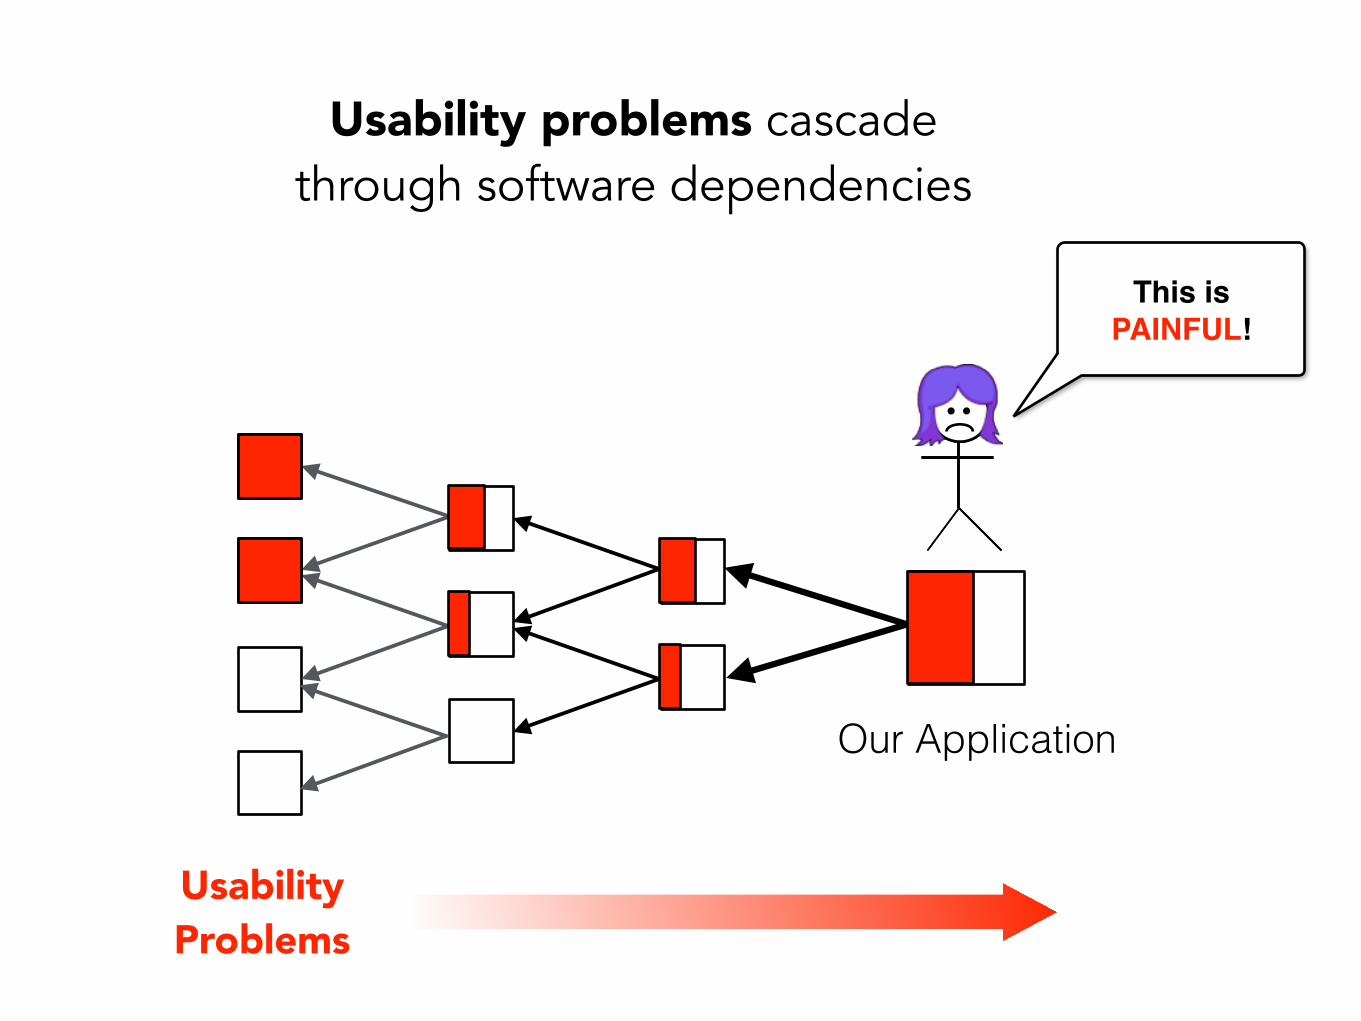
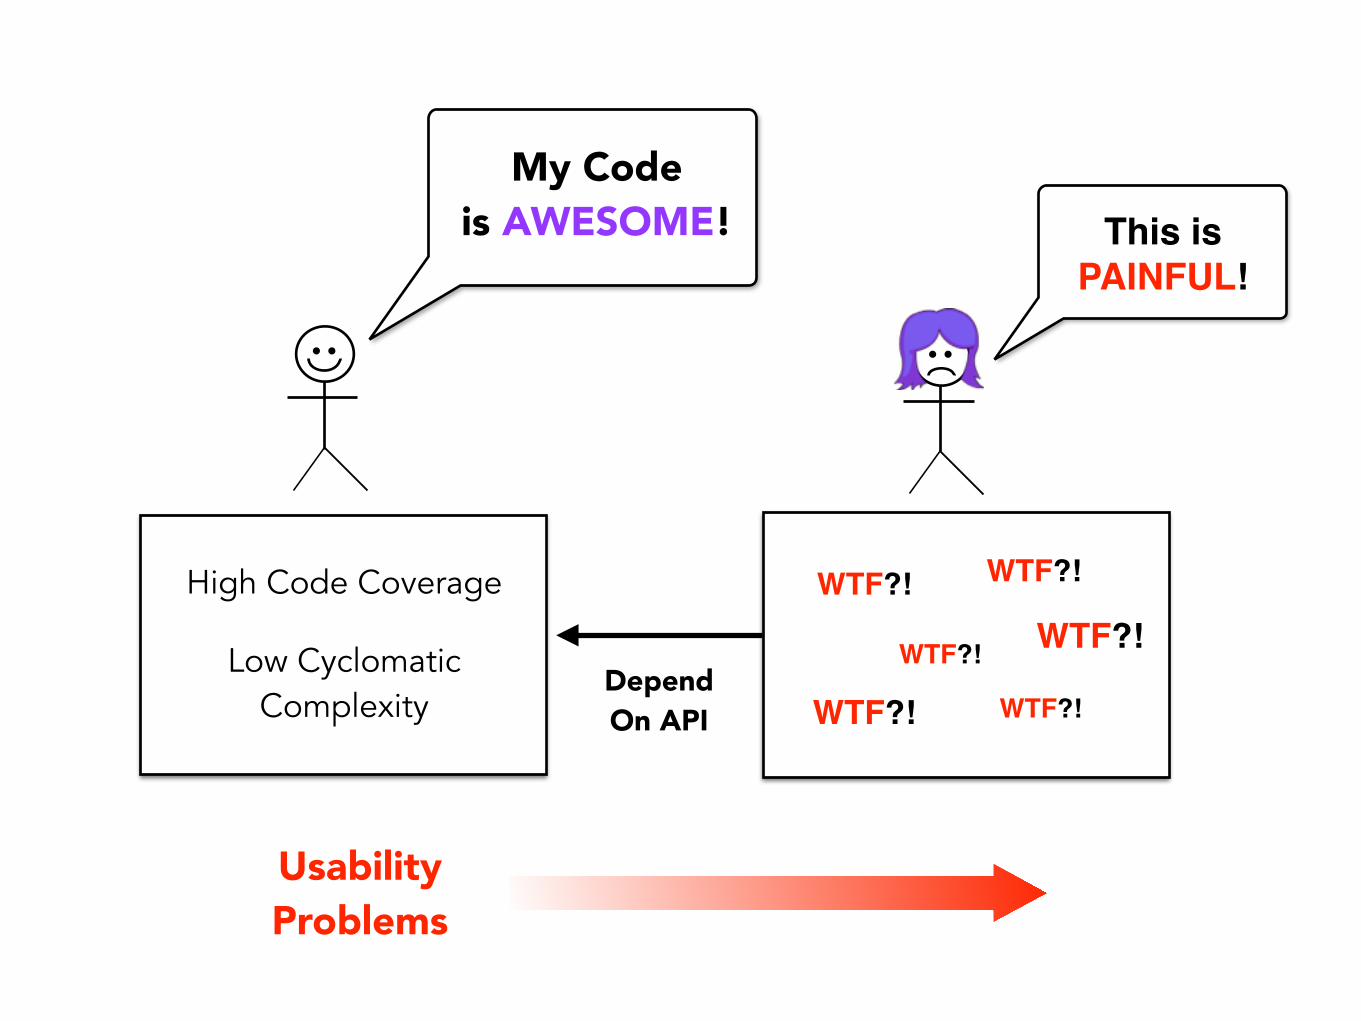
Usability problems cascade through software dependencies
Our Application
This is PAINFUL!
Usability Problems
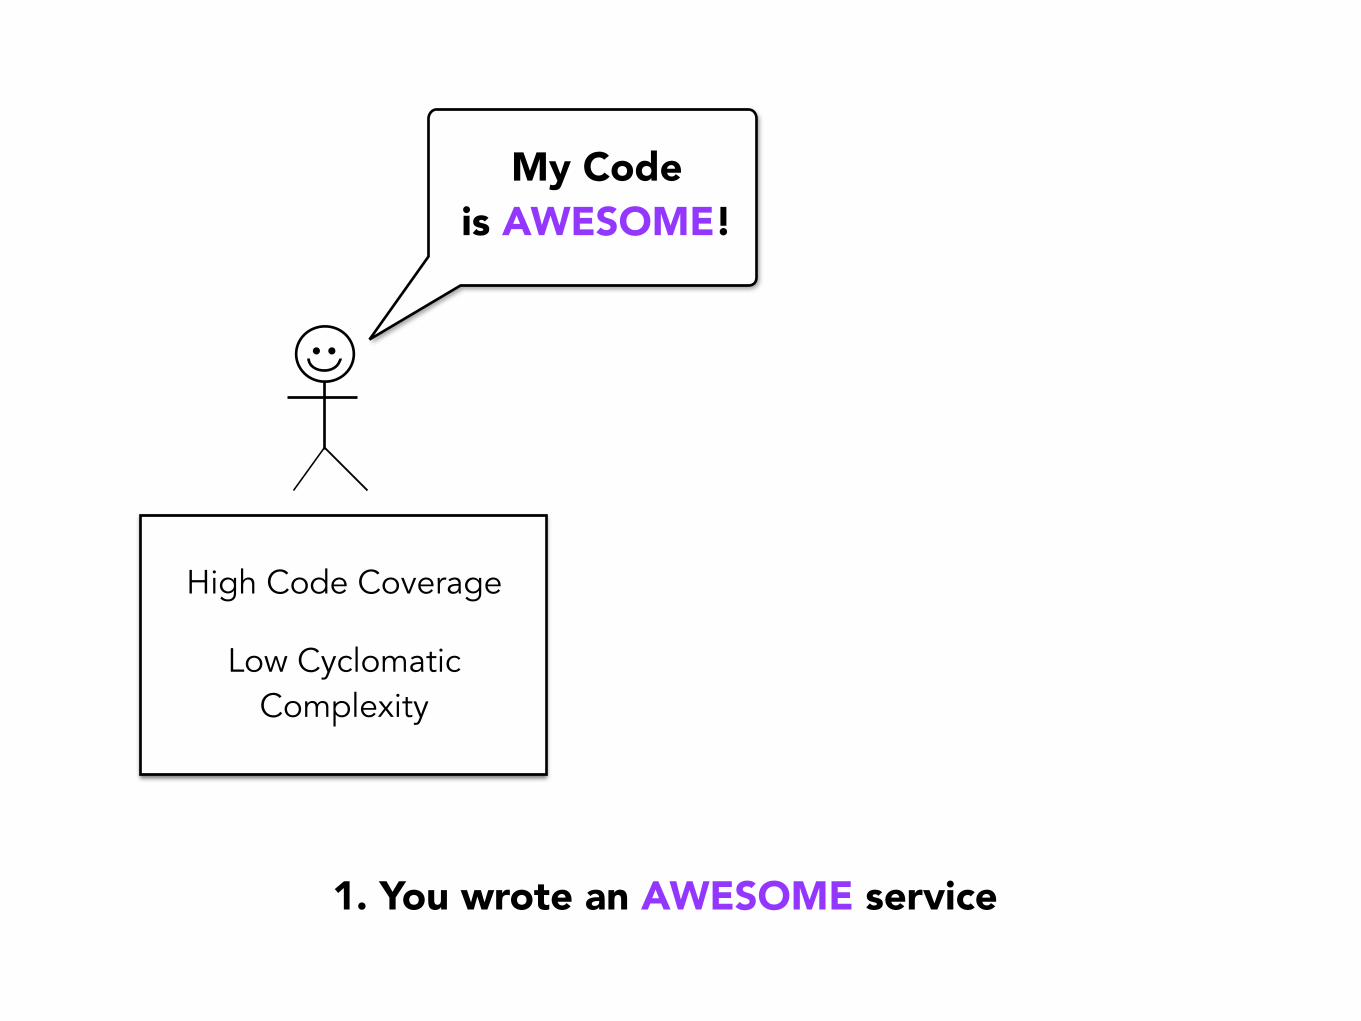
My Code is AWESOME!
High Code Coverage
Low Cyclomatic Complexity
1. You wrote an AWESOME service
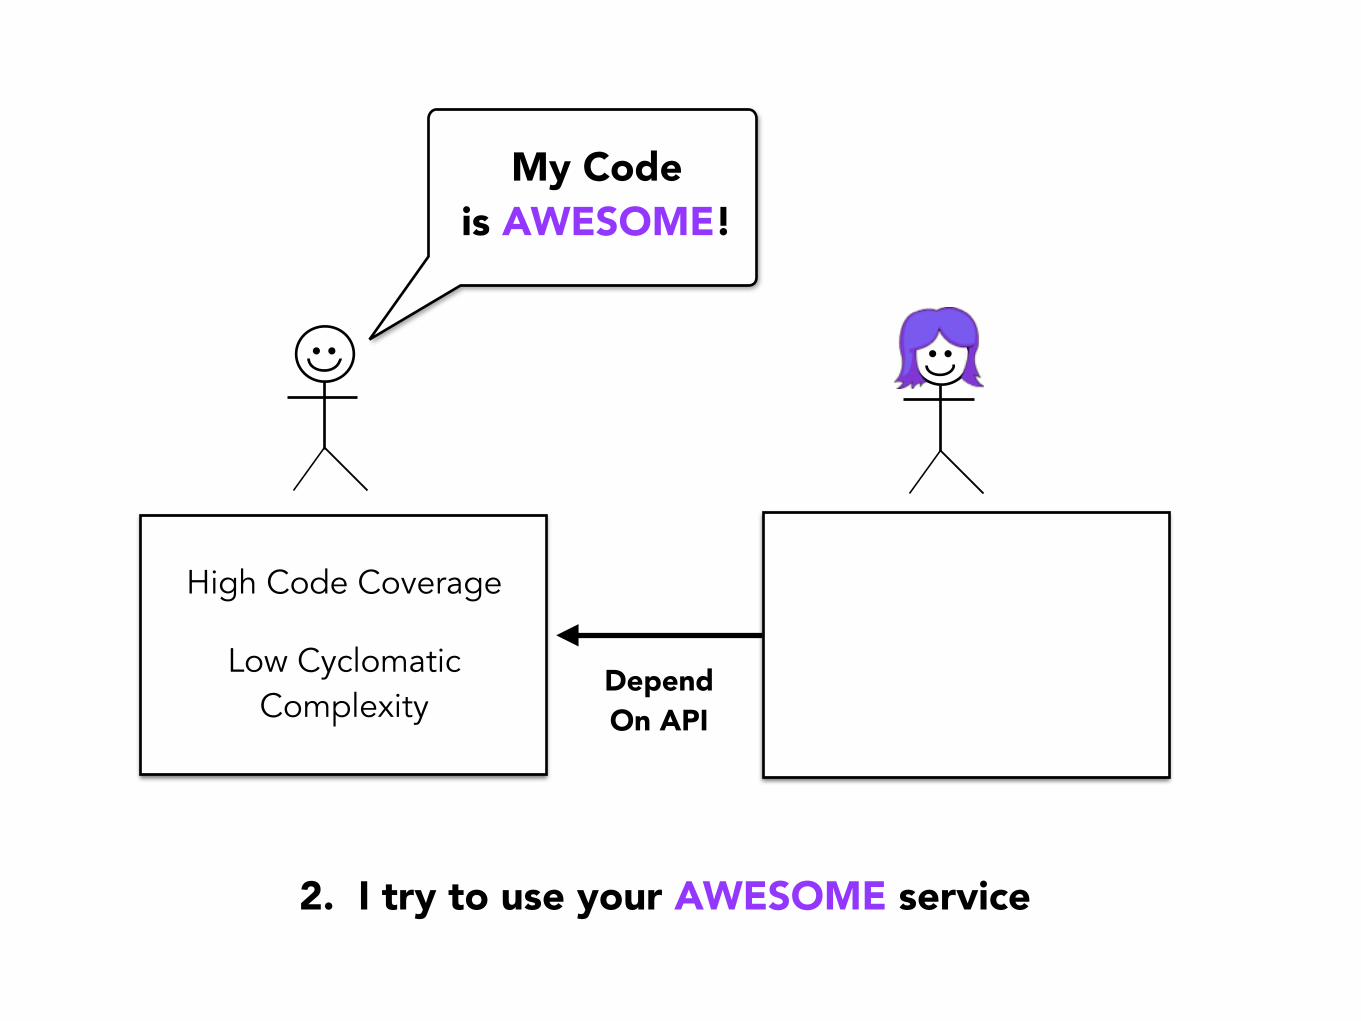
My Code is AWESOME!
High Code Coverage
Low Cyclomatic Complexity
2. I try to use your AWESOME service
Depend On API
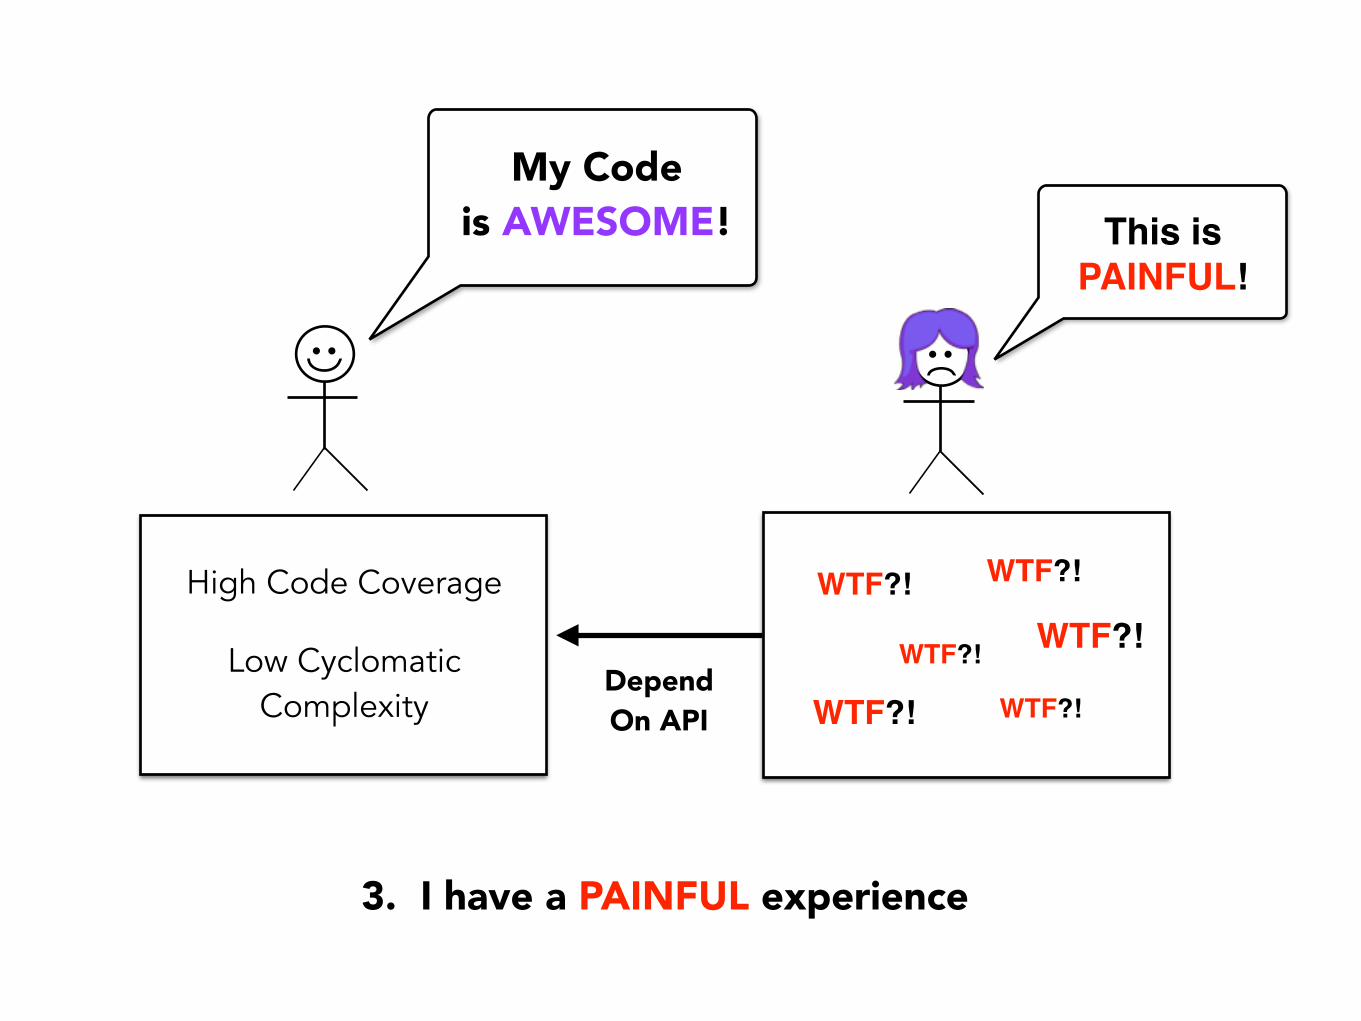
My Code is AWESOME!
High Code Coverage
Low Cyclomatic Complexity
This is PAINFUL!
Depend On API
WTF?!
WTF?!
WTF?!
WTF?!
WTF?! WTF?!
3. I have a PAINFUL experience
My Code is AWESOME!
High Code Coverage
Low Cyclomatic Complexity
This is PAINFUL!
Depend On API
WTF?!
WTF?!
WTF?!
WTF?!
WTF?! WTF?!
Usability Problems
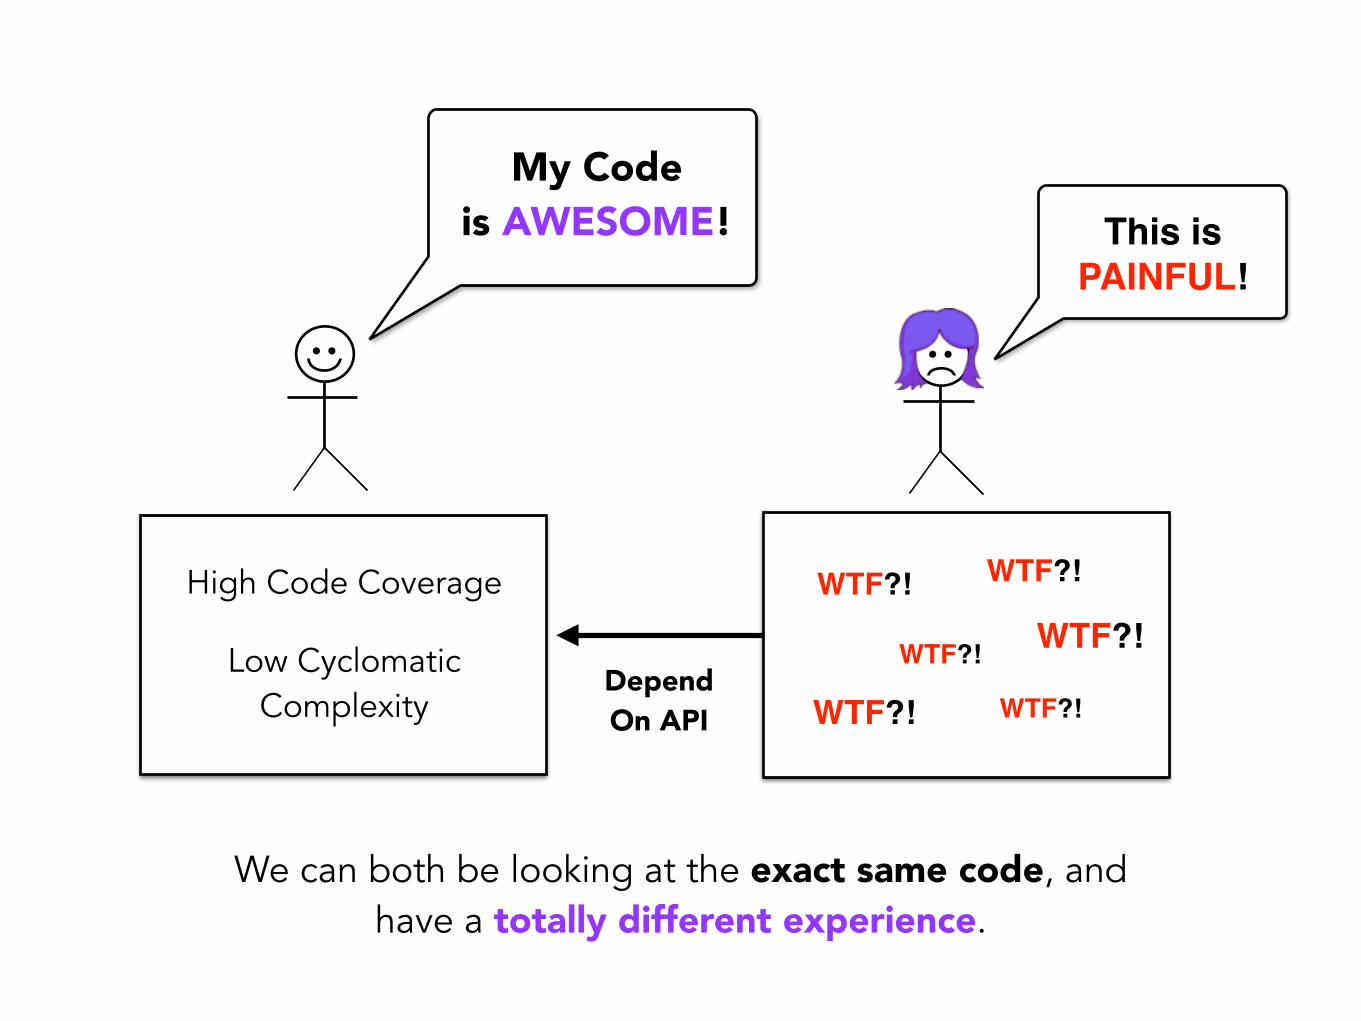
My Code is AWESOME!
High Code Coverage
Low Cyclomatic Complexity
This is PAINFUL!
Depend On API
WTF?!
WTF?!
WTF?!
WTF?!
WTF?! WTF?!
We can both be looking at the exact same code, and have a totally different experience.
High Code Coverage
Low Cyclomatic Complexity
Depend On API
WTF?!
WTF?!
WTF?!
WTF?!
WTF?! WTF?!
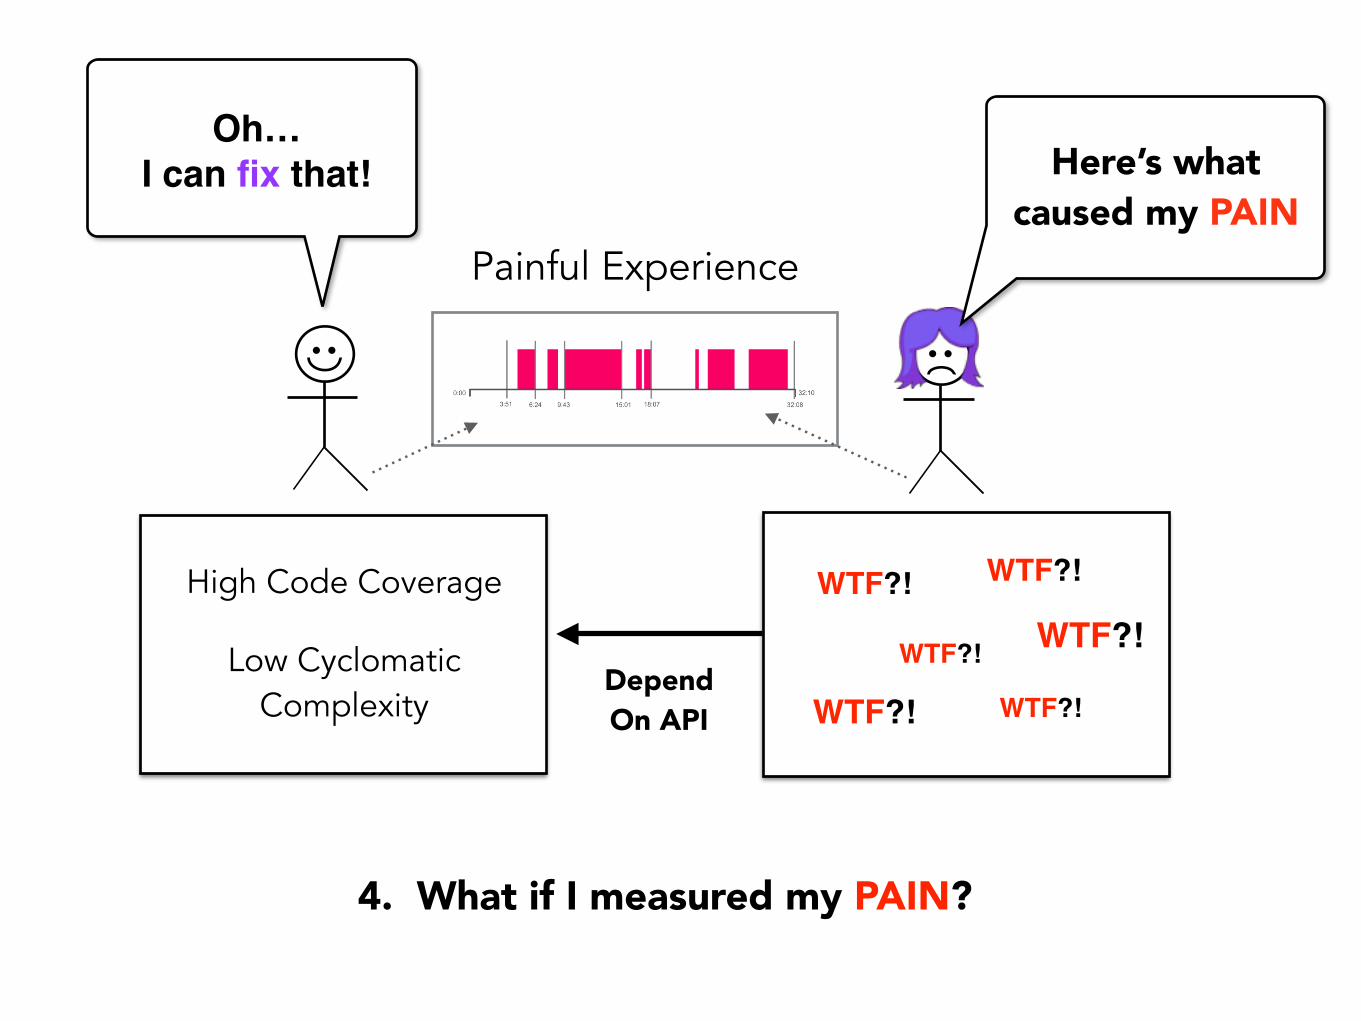
Here’s what caused my PAIN
Painful Experience
Oh…I can fix that!
4. What if I measured my PAIN?
High Code Coverage
Low Cyclomatic Complexity
Depend On API
WTF?!
WTF?!
WTF?!
WTF?!
WTF?! WTF?!
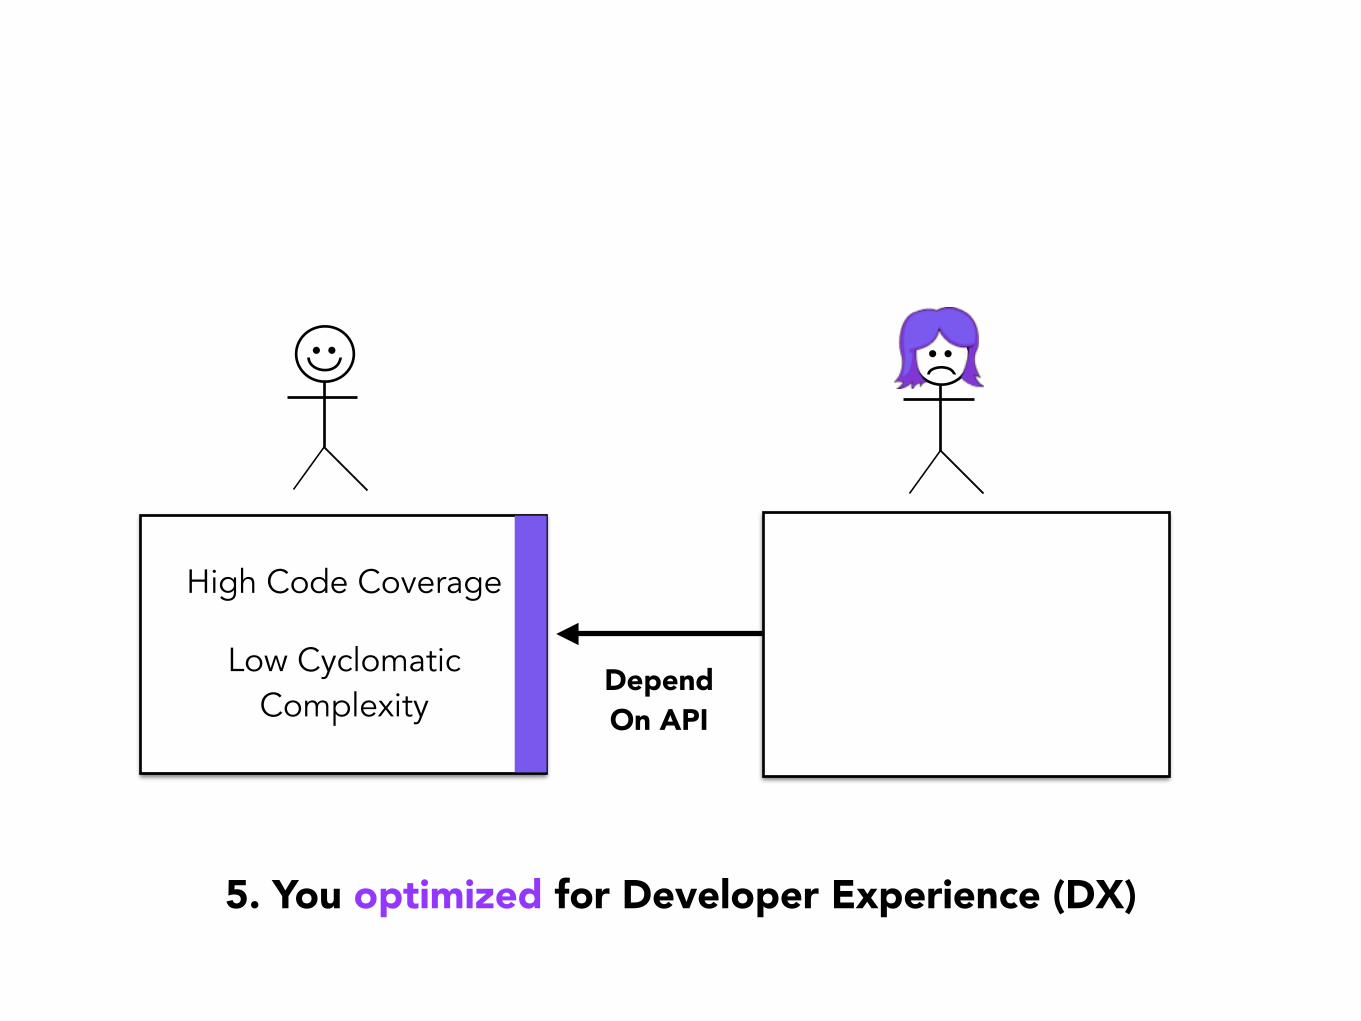
5. You optimized for Developer Experience (DX)
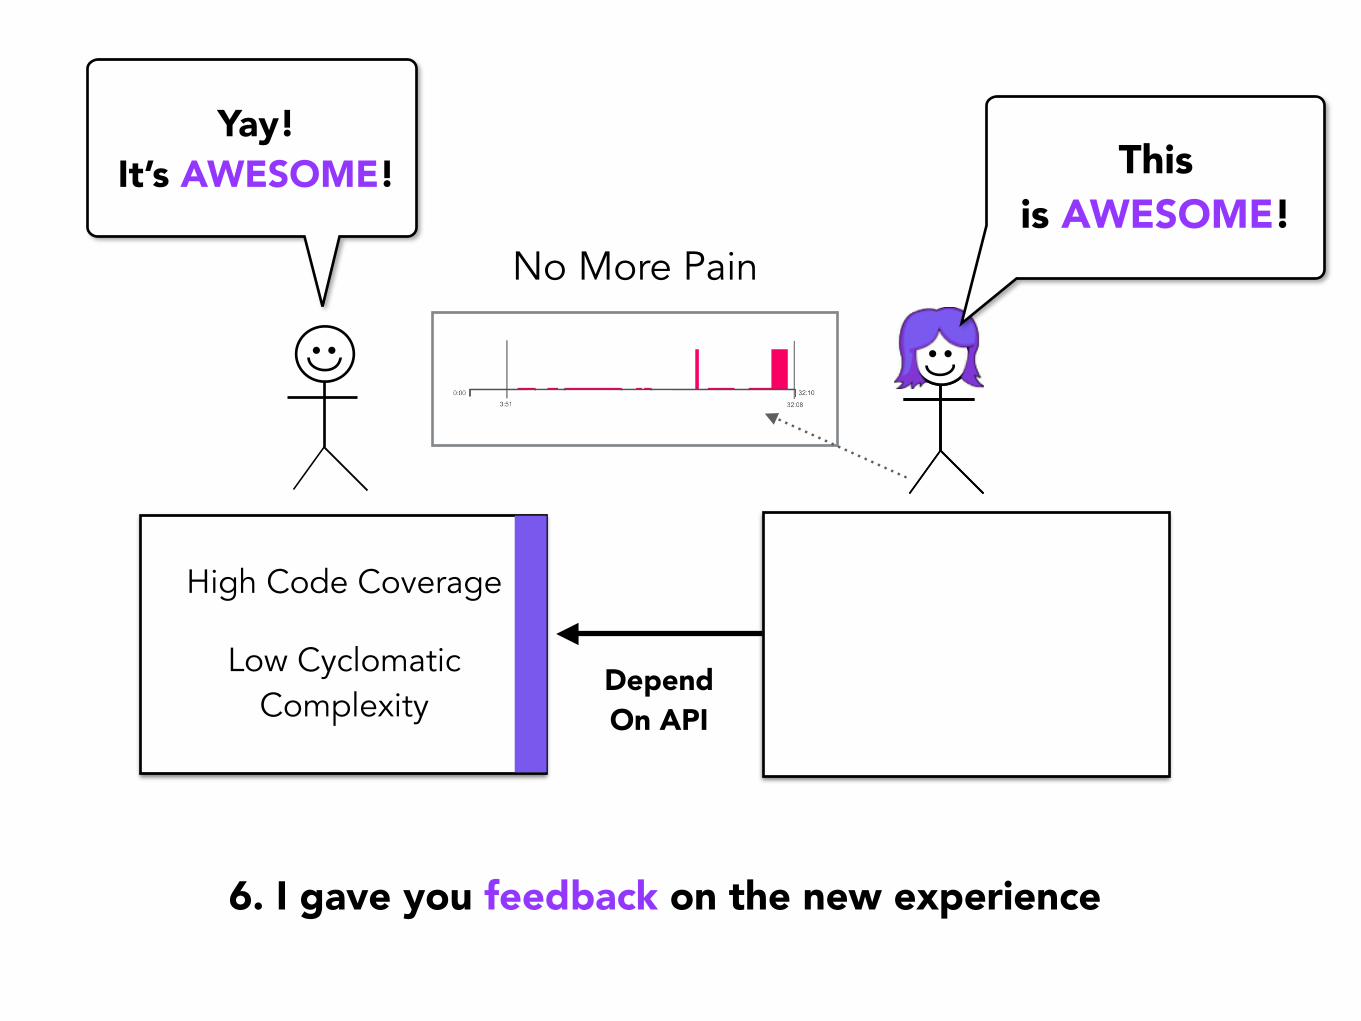
High Code Coverage
Low Cyclomatic Complexity
Depend On API
No More Pain
This is AWESOME!
6. I gave you feedback on the new experience
Yay! It’s AWESOME!
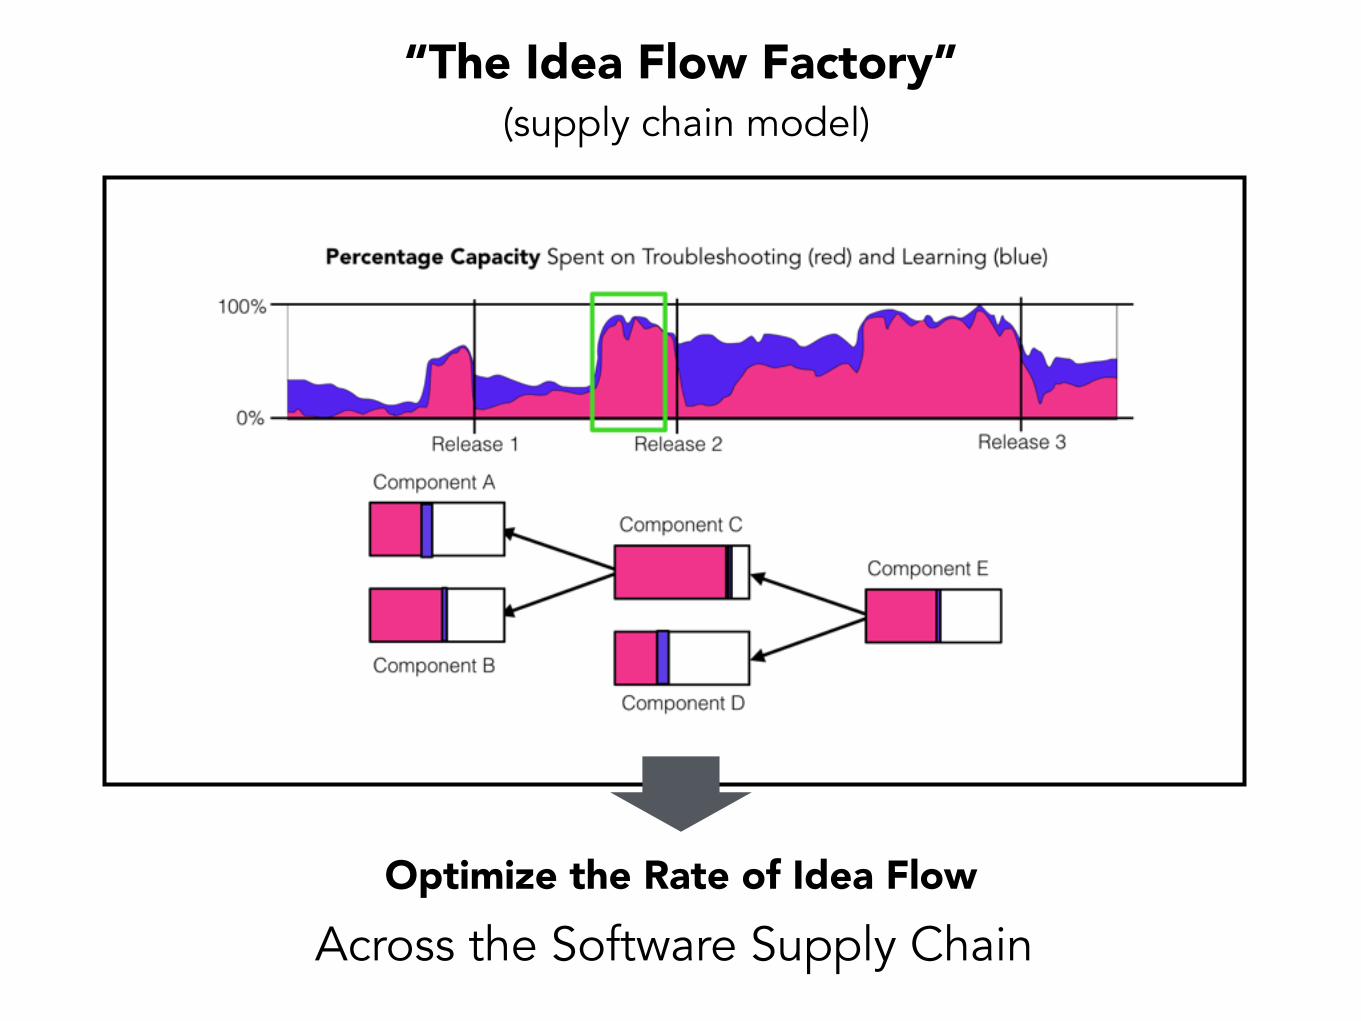
“The Idea Flow Factory” (supply chain model)
Optimize the Rate of Idea Flow
Across the Software Supply Chain
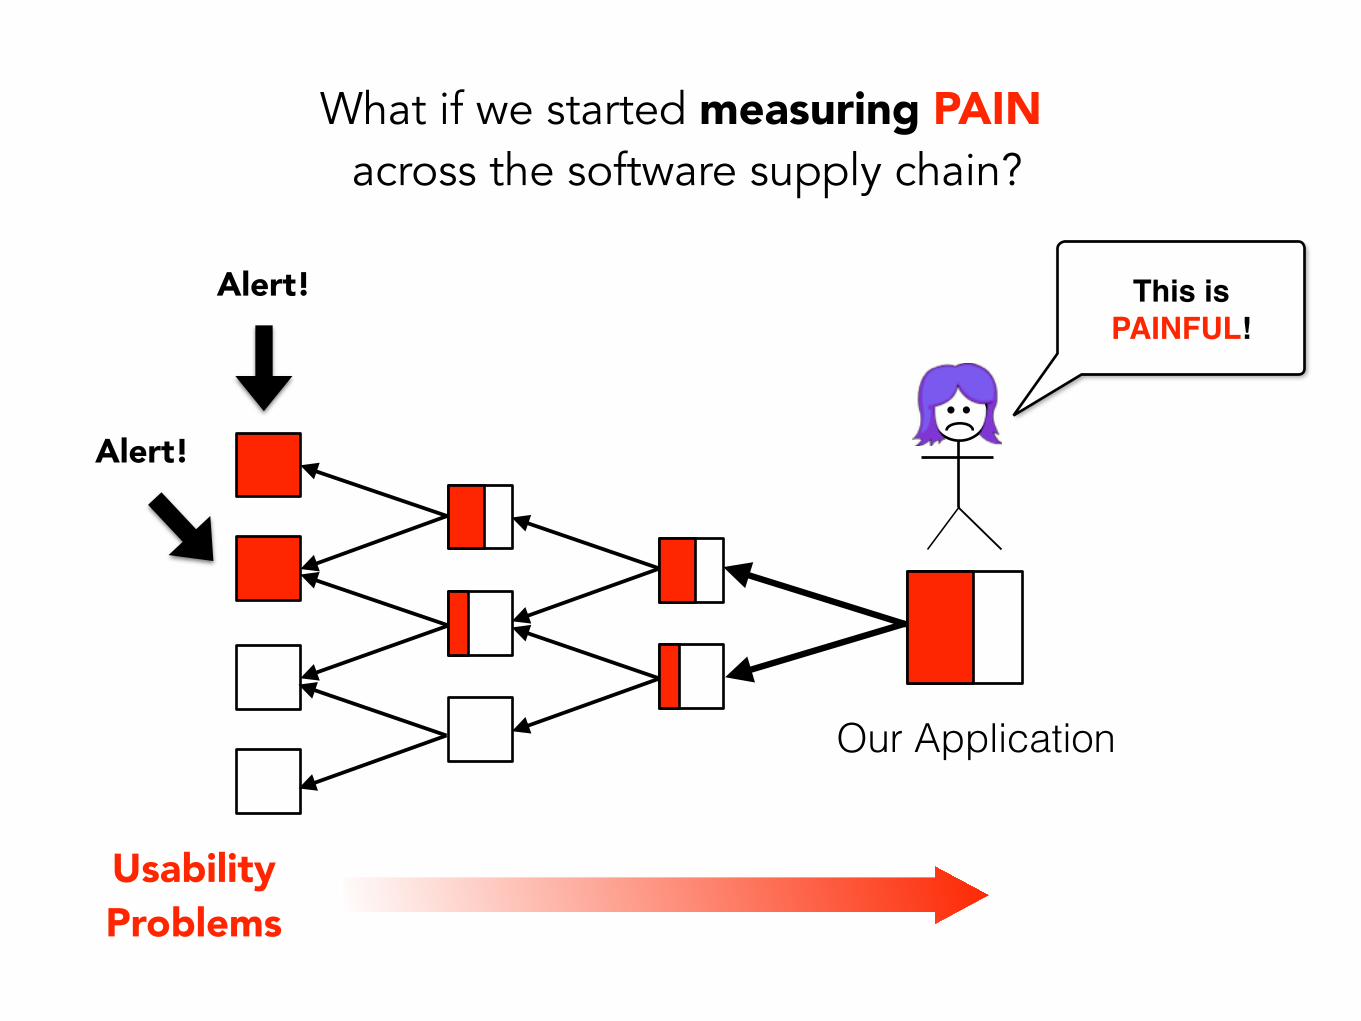
Alert!
Alert!
Our Application
What if we started measuring PAIN across the software supply chain?
This is PAINFUL!
Usability Problems
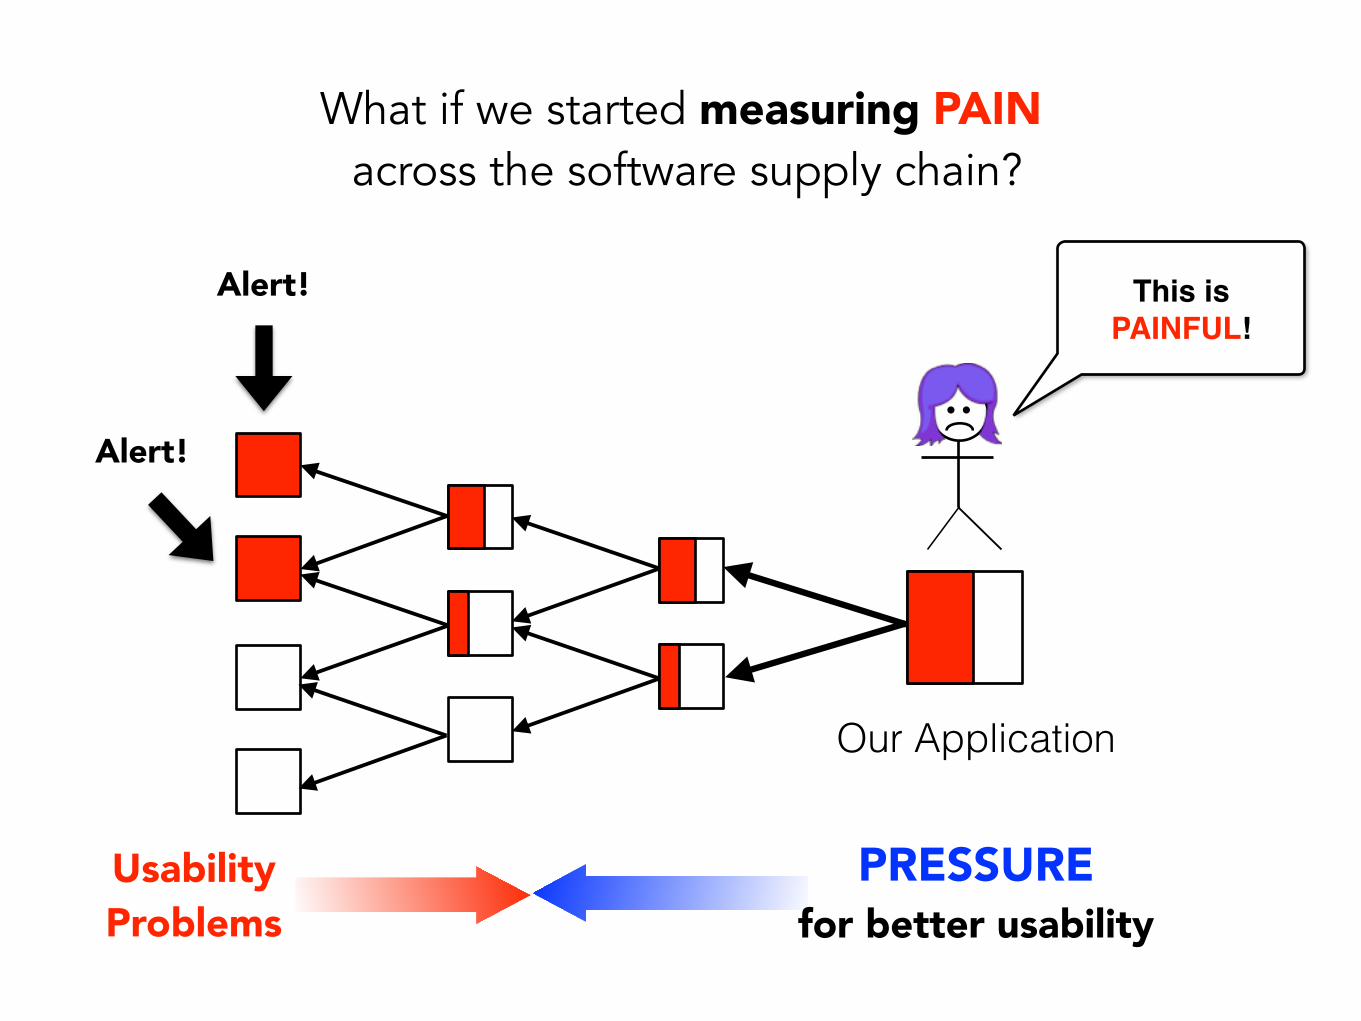
Alert!
Alert!
Our Application
PRESSURE for better usability
What if we started measuring PAIN across the software supply chain?
This is PAINFUL!
Usability Problems
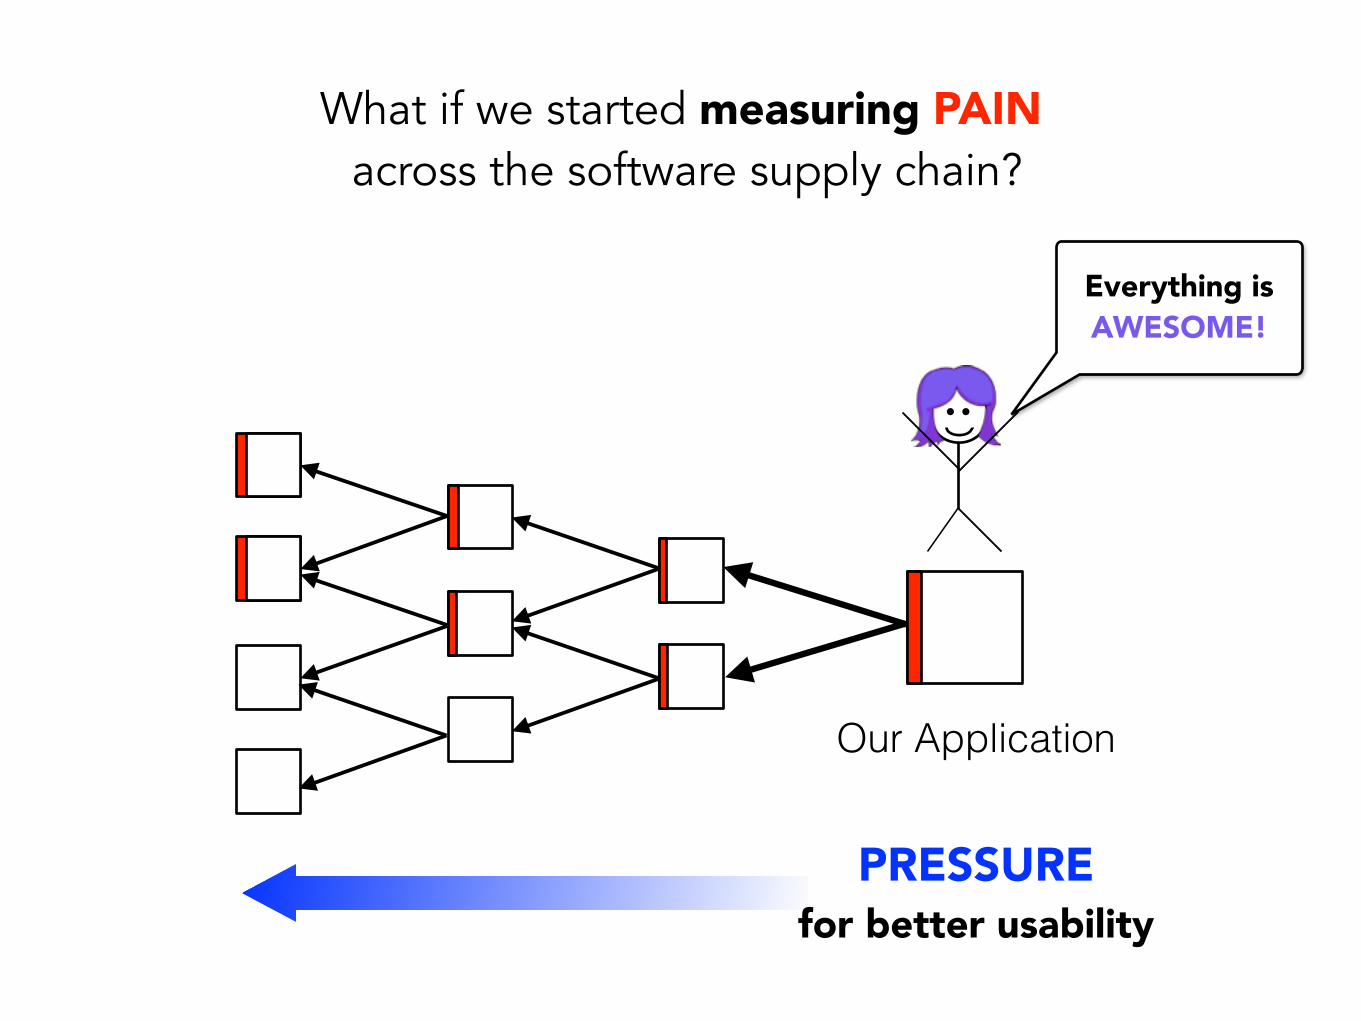
Everything is AWESOME!
Our Application
PRESSURE for better usability
What if we started measuring PAIN across the software supply chain?
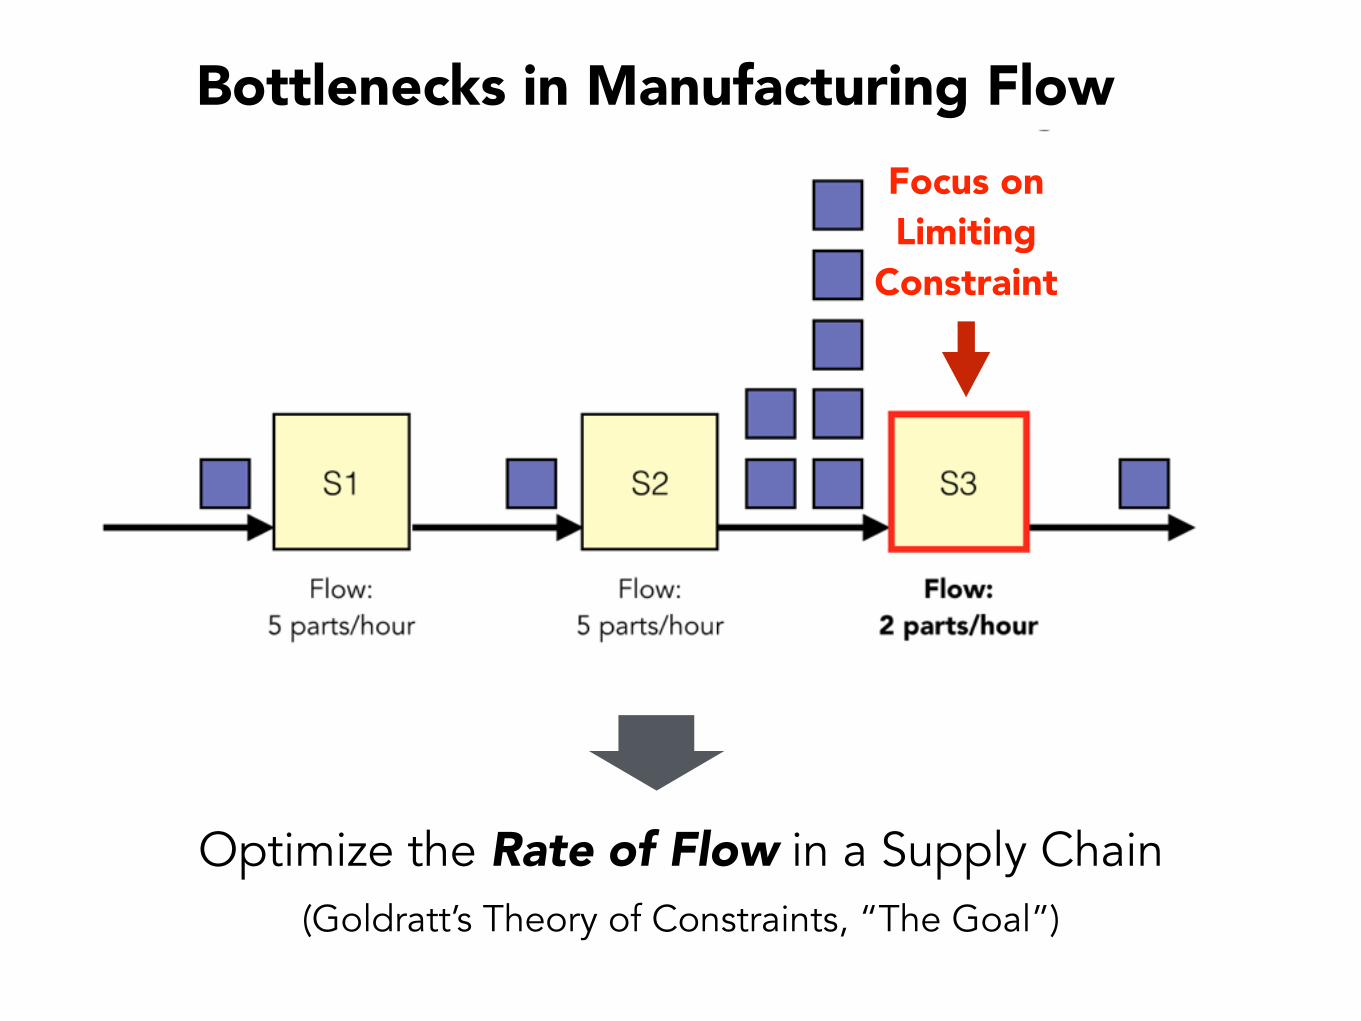
Focus on Limiting
Constraint
Optimize the Rate of Flow in a Supply Chain(Goldratt’s Theory of Constraints, “The Goal”)
Bottlenecks in Manufacturing Flow
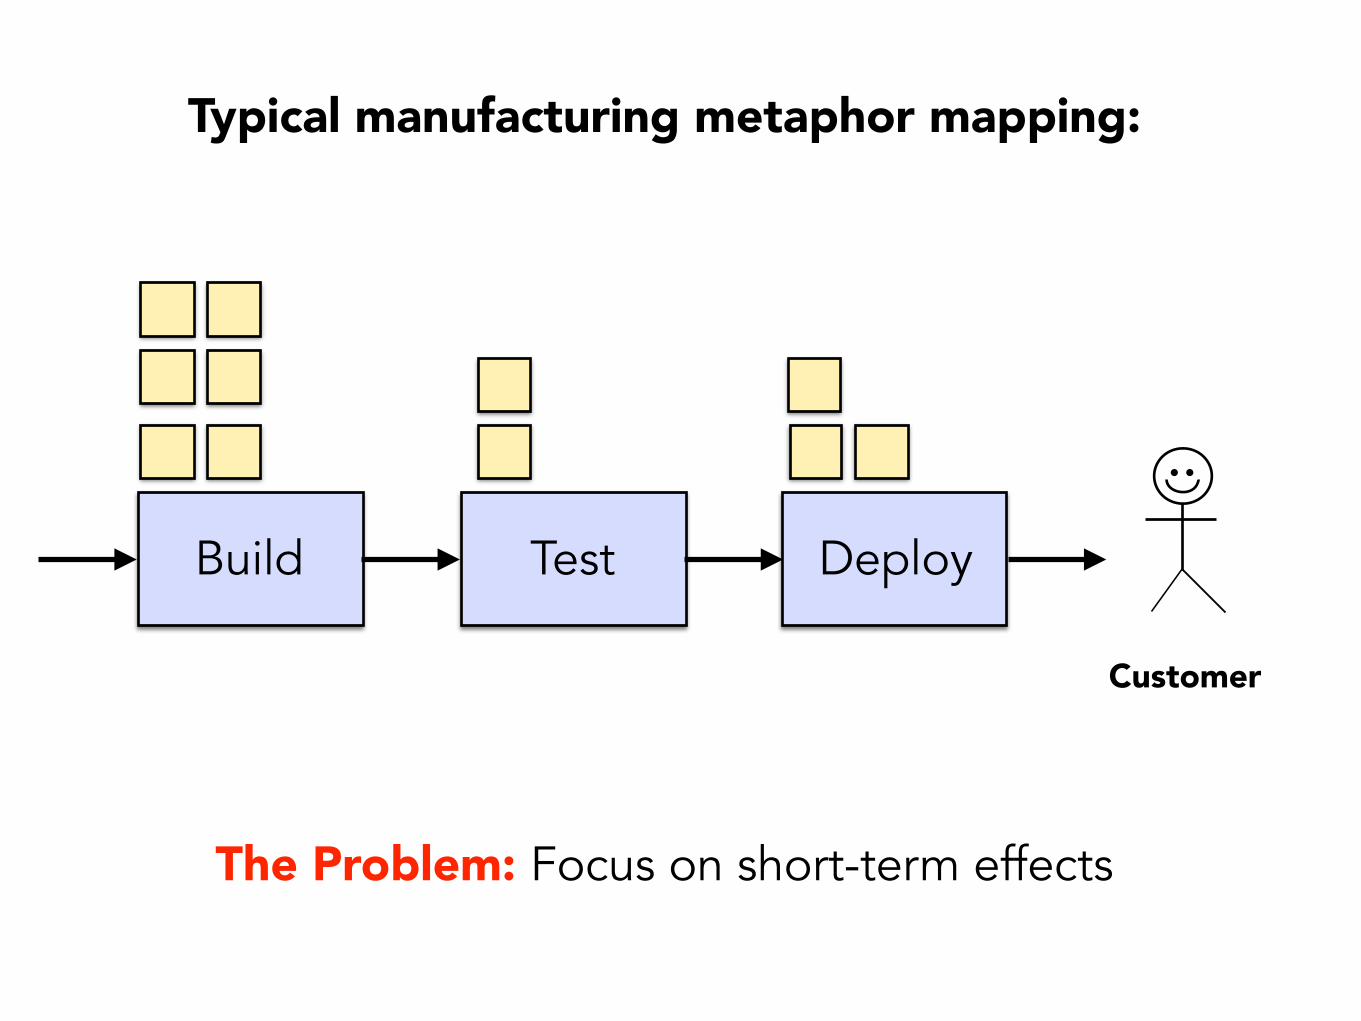
Build Test Deploy
Typical manufacturing metaphor mapping:
Customer
The Problem: Focus on short-term effects
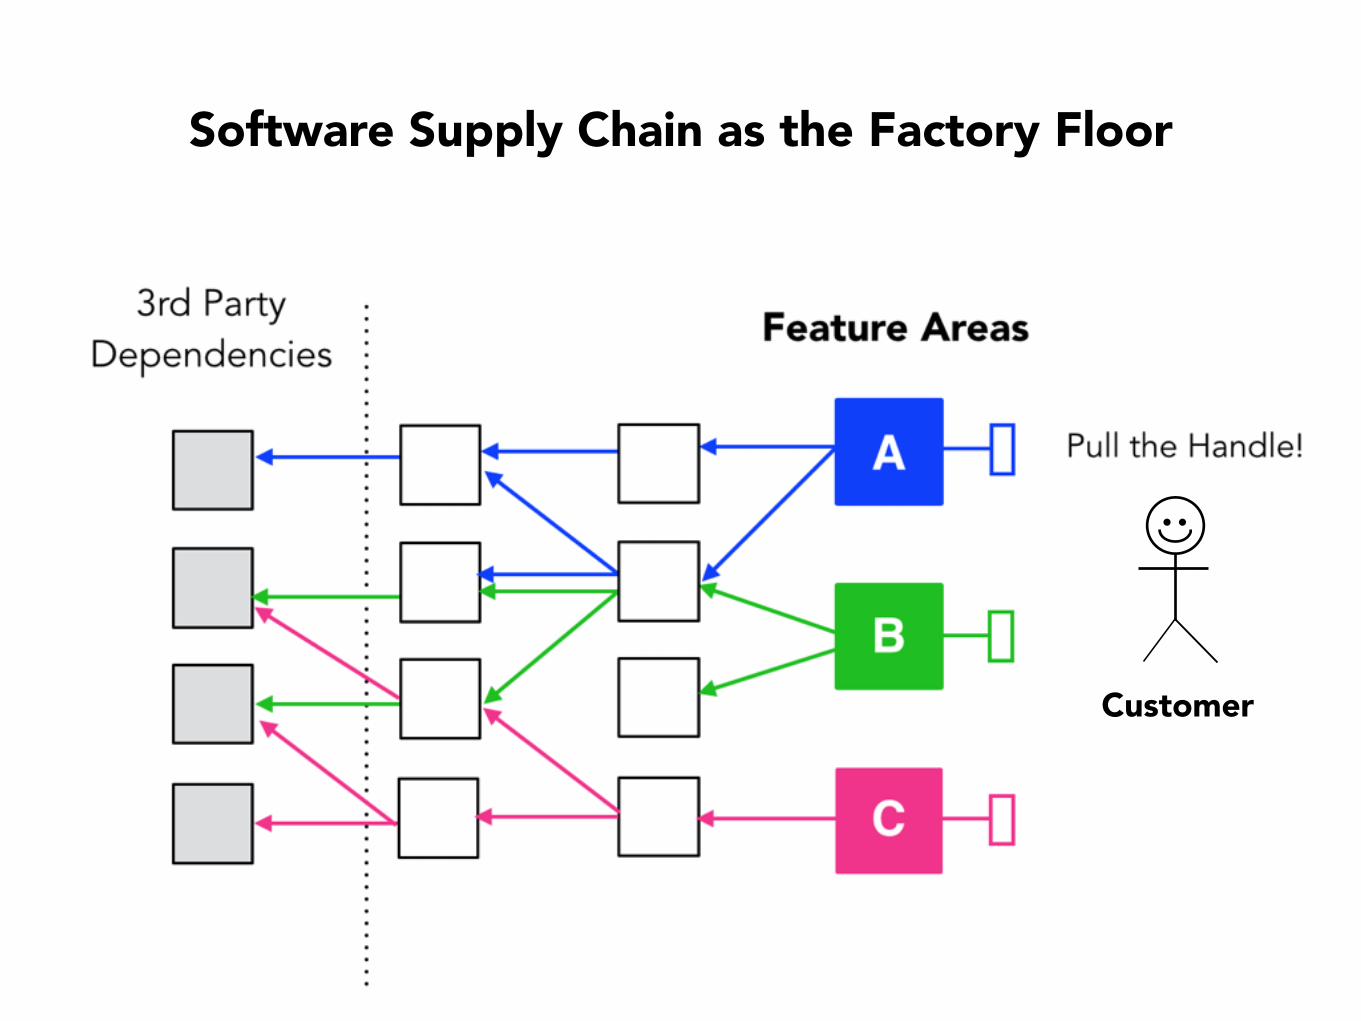
Software Supply Chain as the Factory Floor
Customer
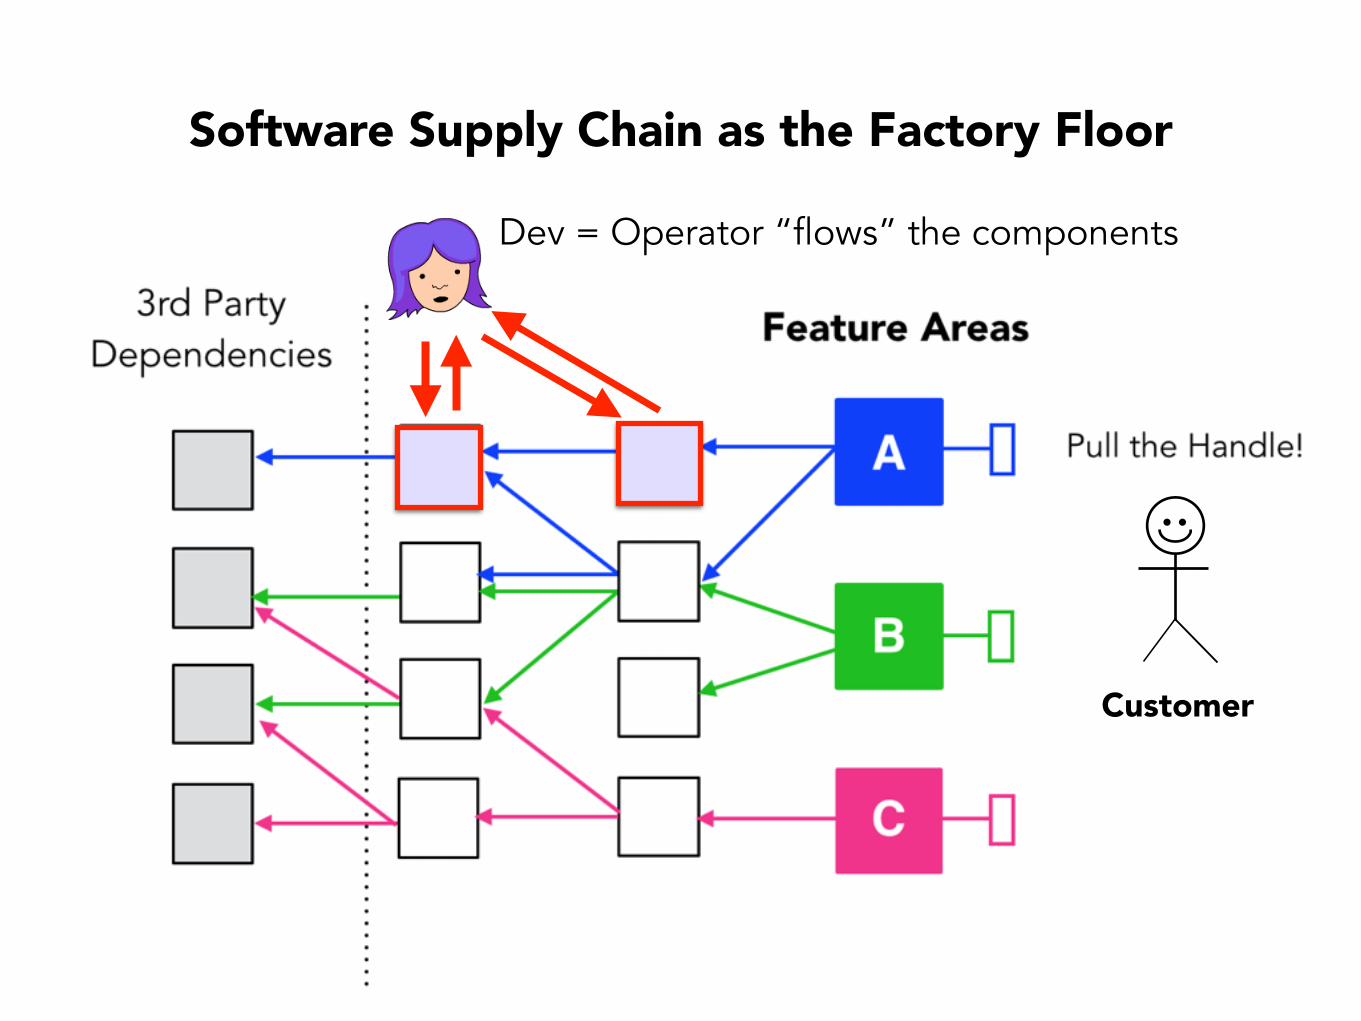
Software Supply Chain as the Factory Floor
Customer
Dev = Operator “flows” the components
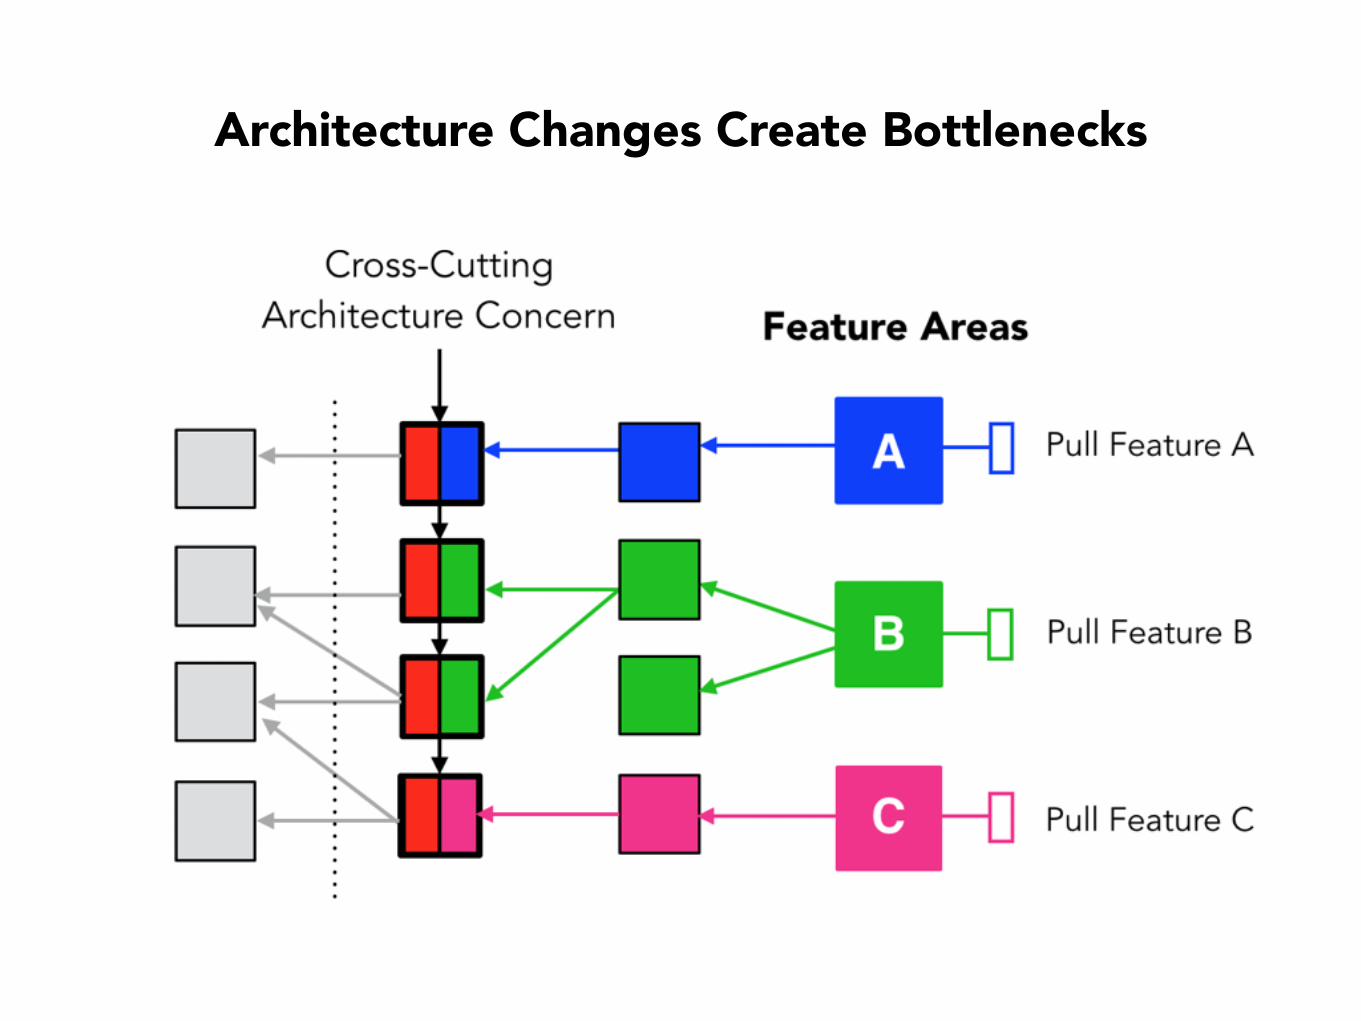
Architecture Changes Create Bottlenecks
Customer
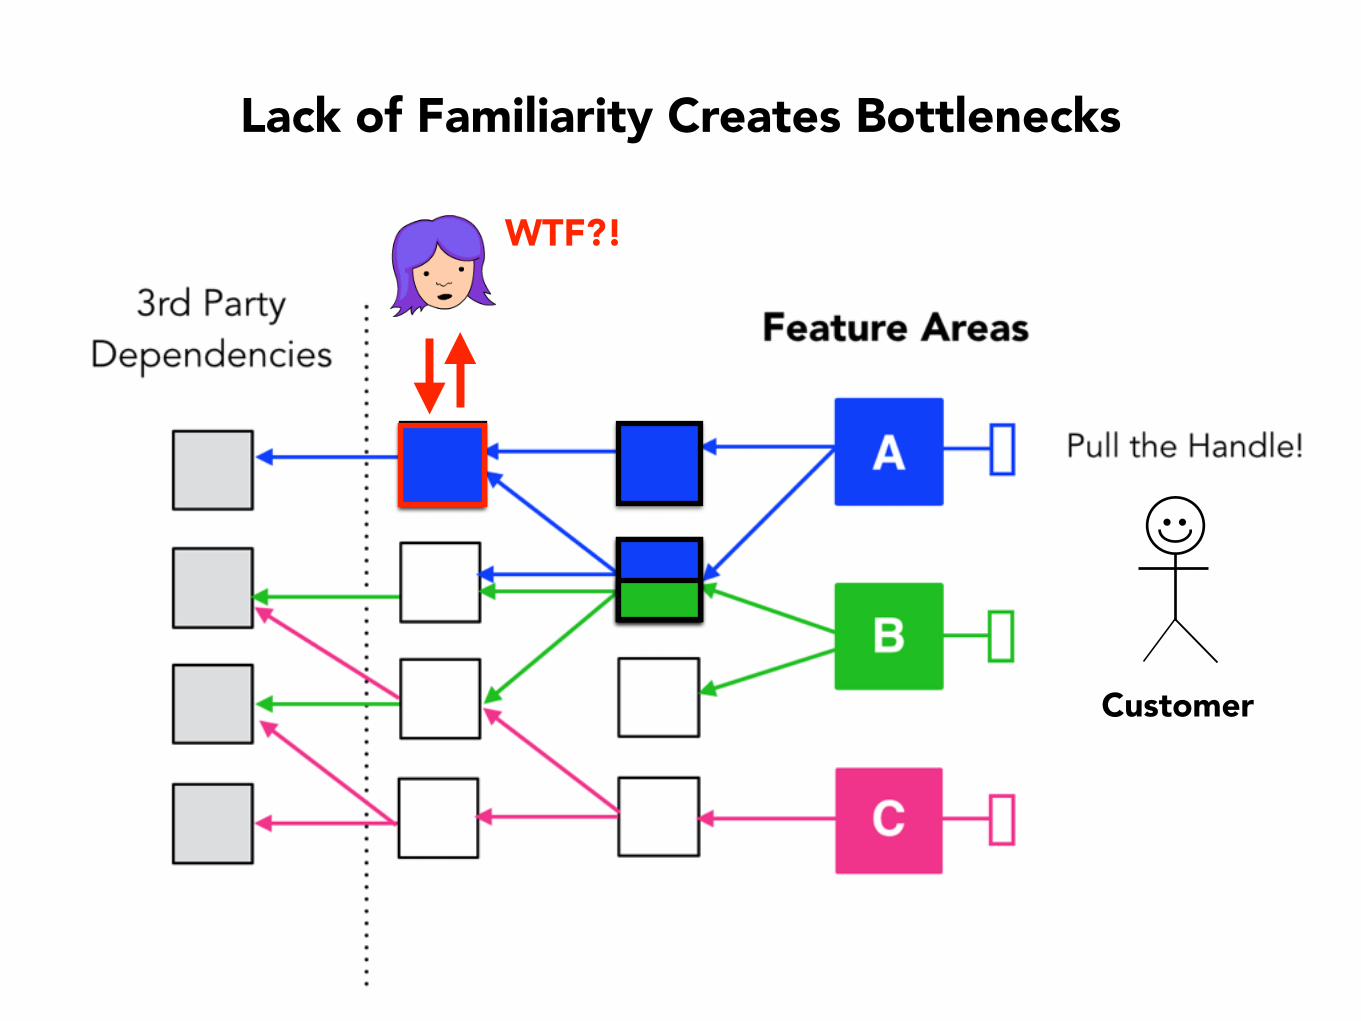
Lack of Familiarity Creates Bottlenecks
WTF?!
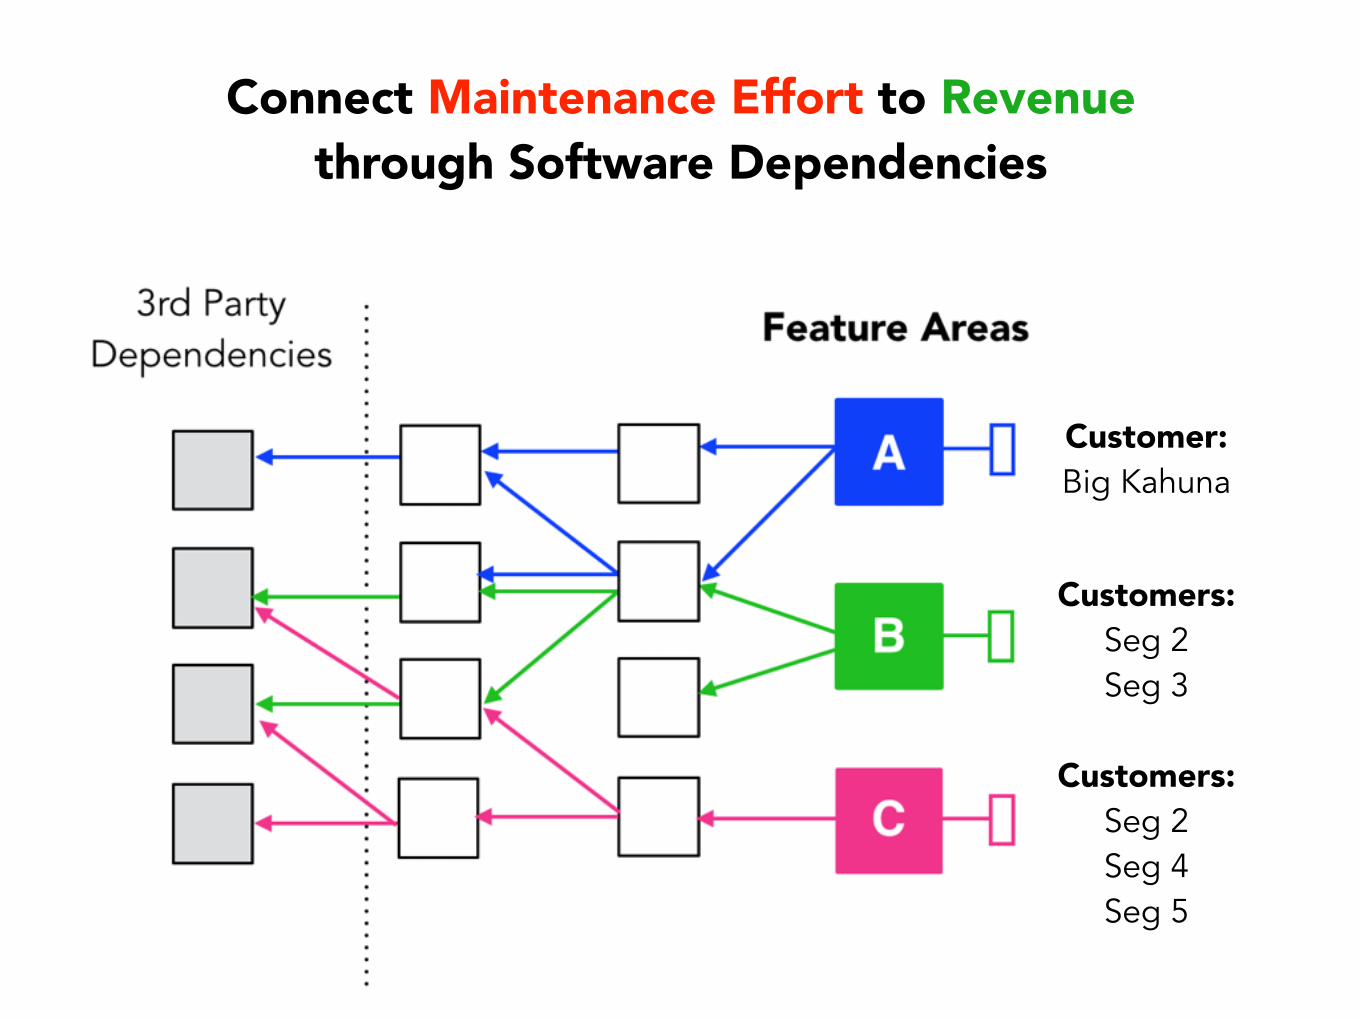
Customer: Big Kahuna
Customers: Seg 2 Seg 3
Customers: Seg 2 Seg 4 Seg 5
Connect Maintenance Effort to Revenue through Software Dependencies
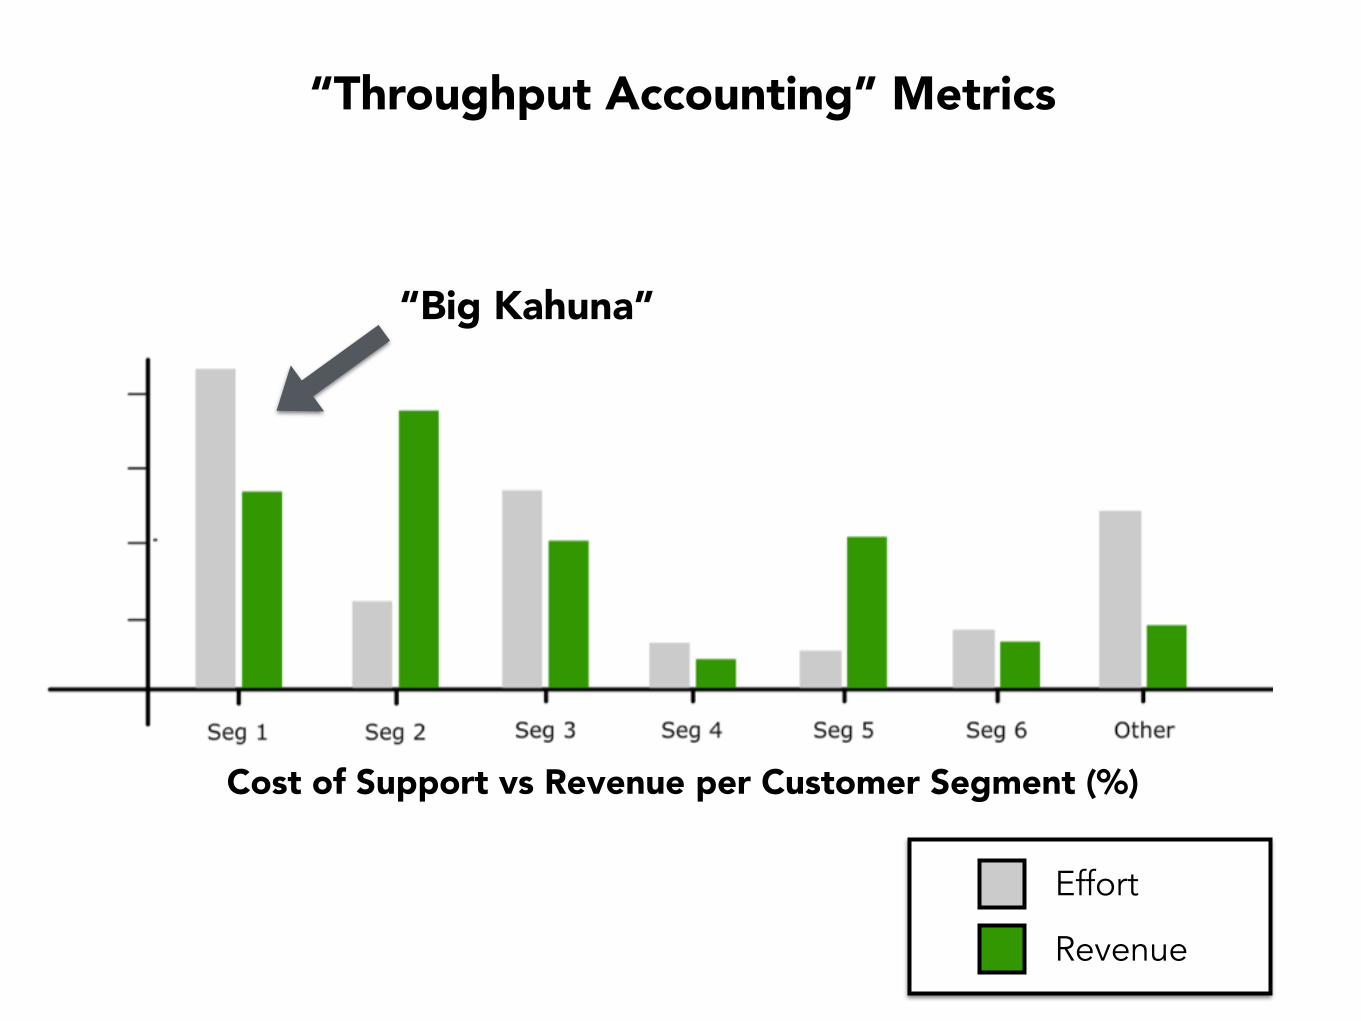
“Big Kahuna”
Effort
Revenue
“Throughput Accounting” Metrics
Cost of Support vs Revenue per Customer Segment (%)
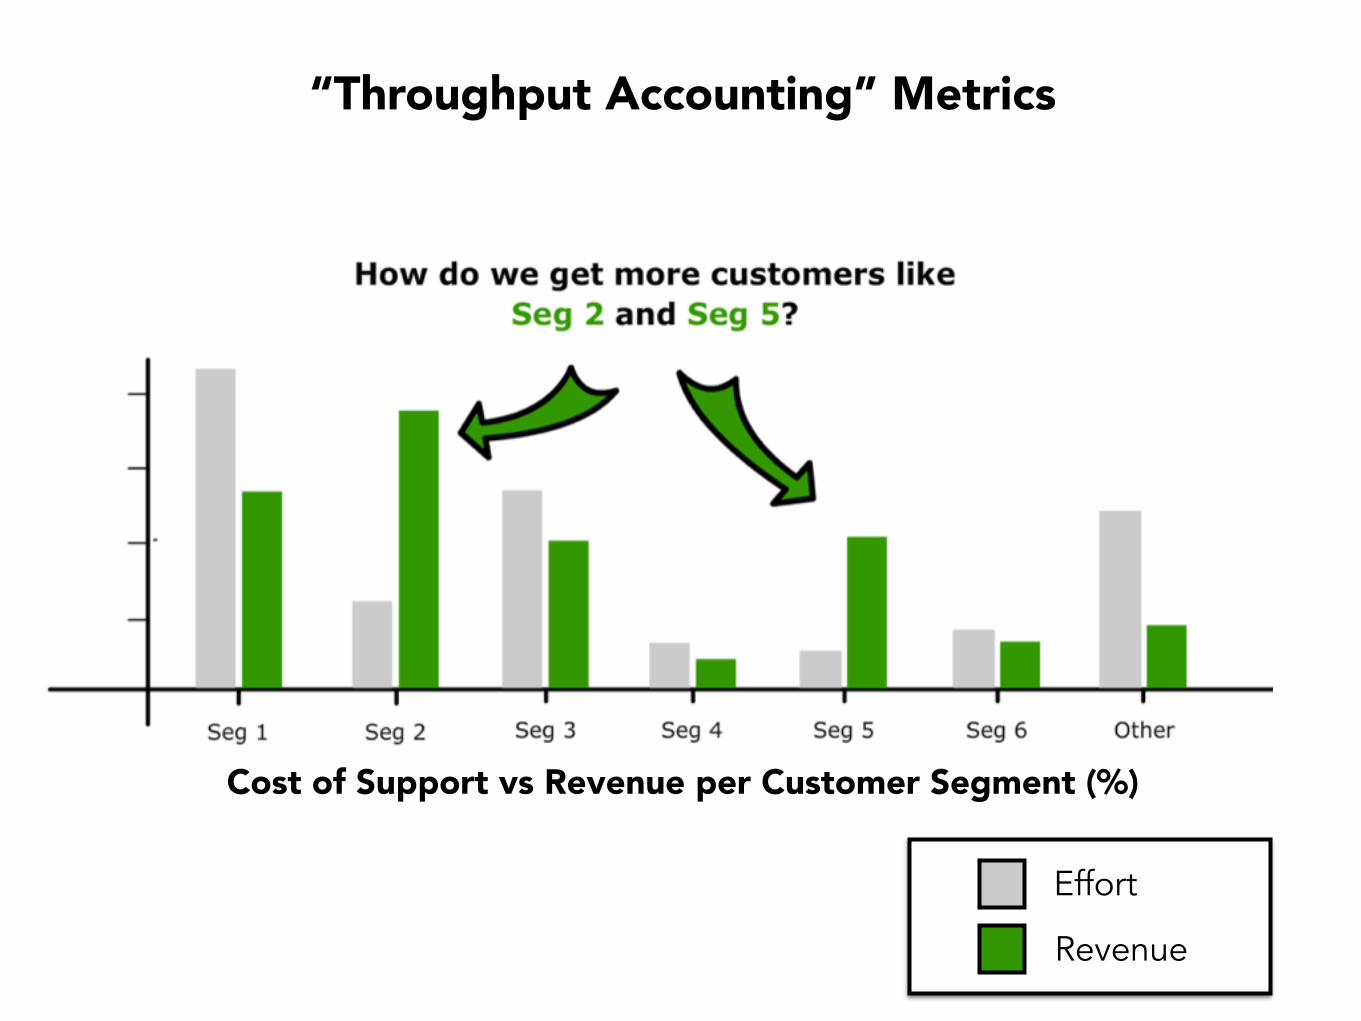
Effort
Revenue
“Throughput Accounting” Metrics
Cost of Support vs Revenue per Customer Segment (%)
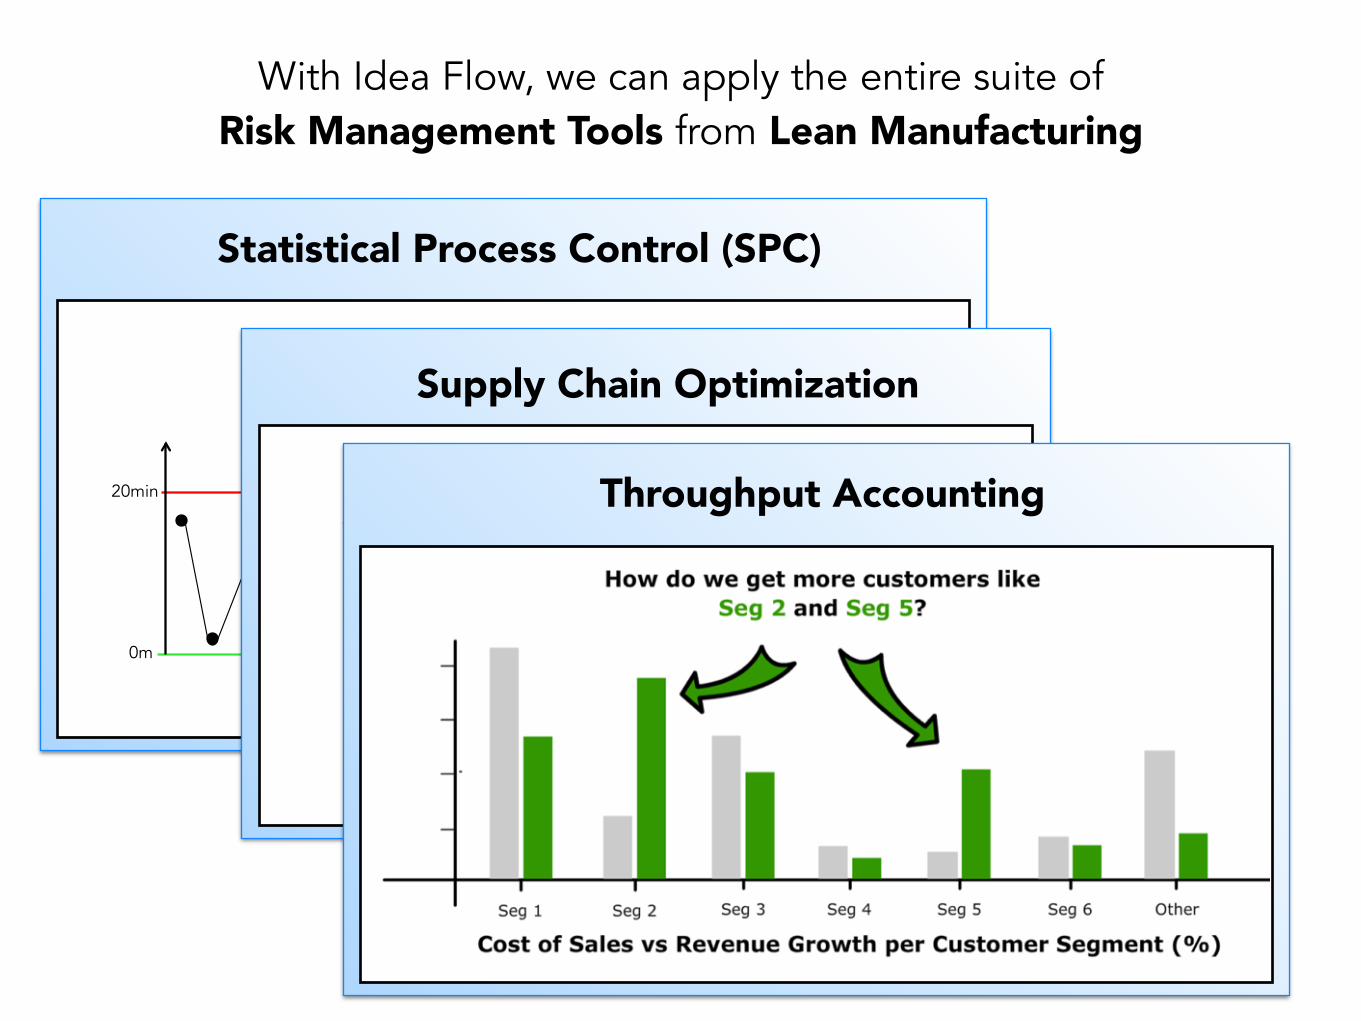
With Idea Flow, we can apply the entire suite of Risk Management Tools from Lean Manufacturing
Statistical Process Control (SPC)
Optimal Friction
Upper Control Limit X"
“Out of Control”
20min
0m
Average Pain per Incident
Target
Control Limit
Supply Chain Optimization
Throughput Accounting
Summary
Idea Flow gives us a universal definition of effective practice.
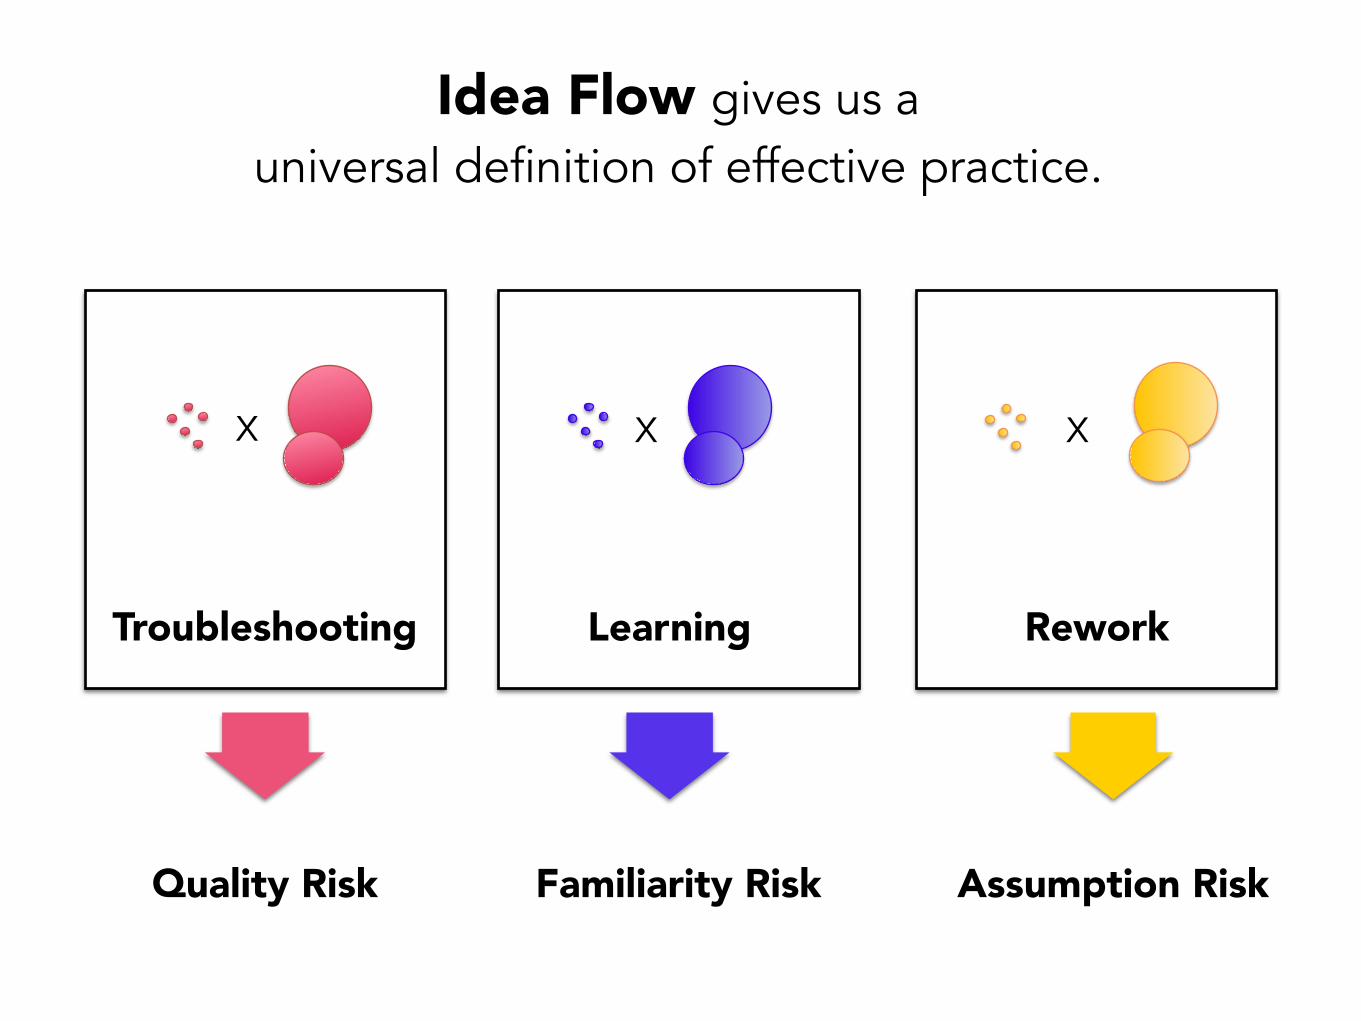
x
Troubleshooting
x
Learning
x
Rework
Quality Risk Familiarity Risk Assumption Risk
Idea Flow gives us a universal definition of effective practice.
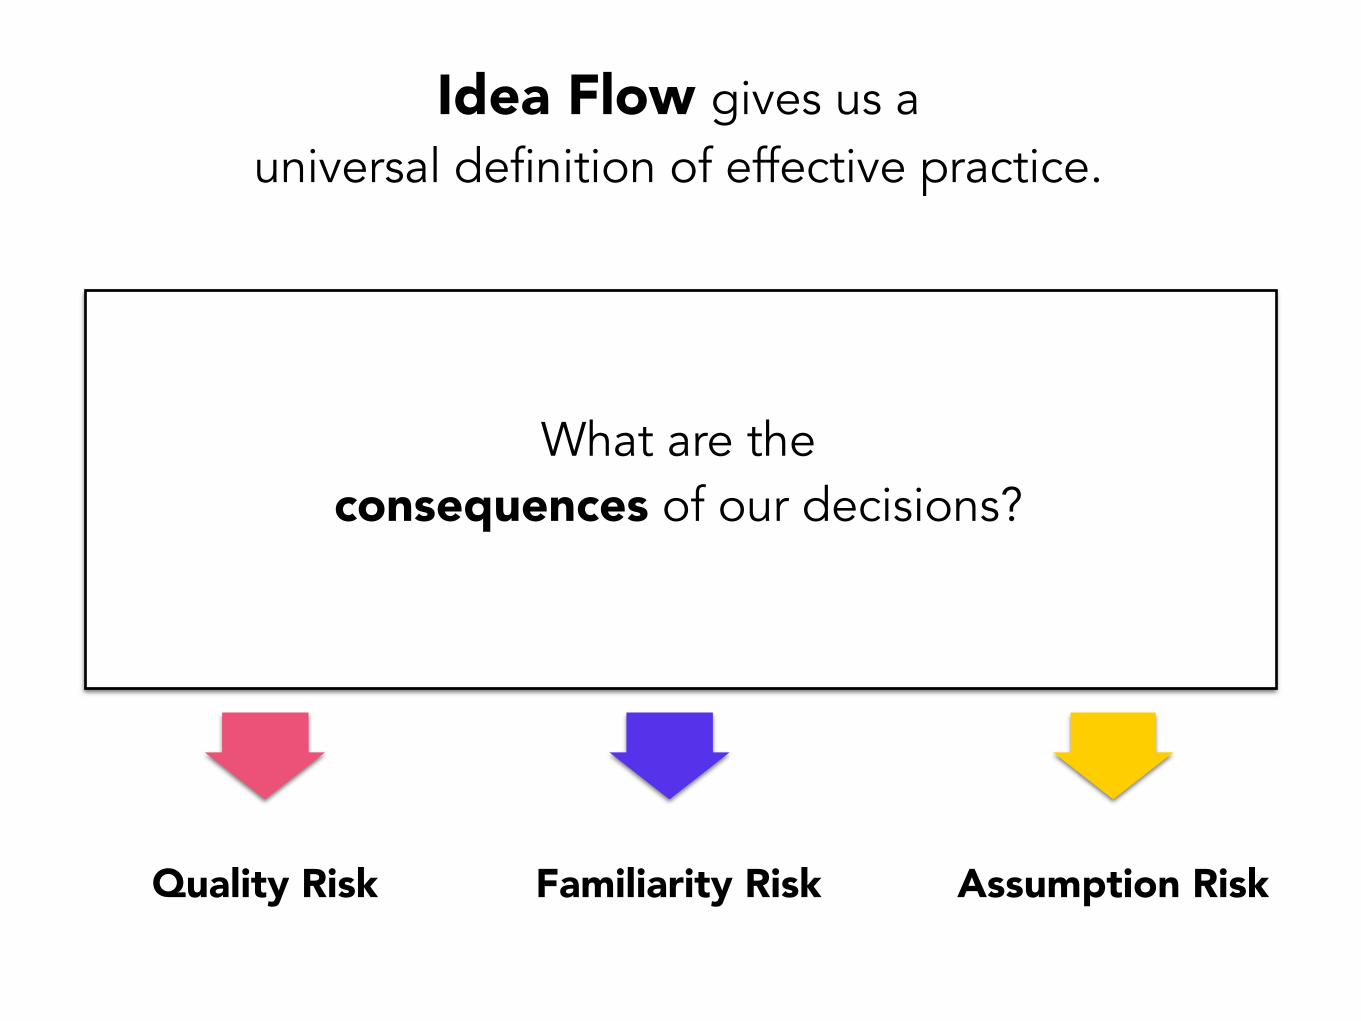
Quality Risk Familiarity Risk Assumption Risk
What are the consequences of our decisions?
Idea Flow gives us a universal definition of effective practice.
Idea Flow gives us a universal language for sharing our experiences.
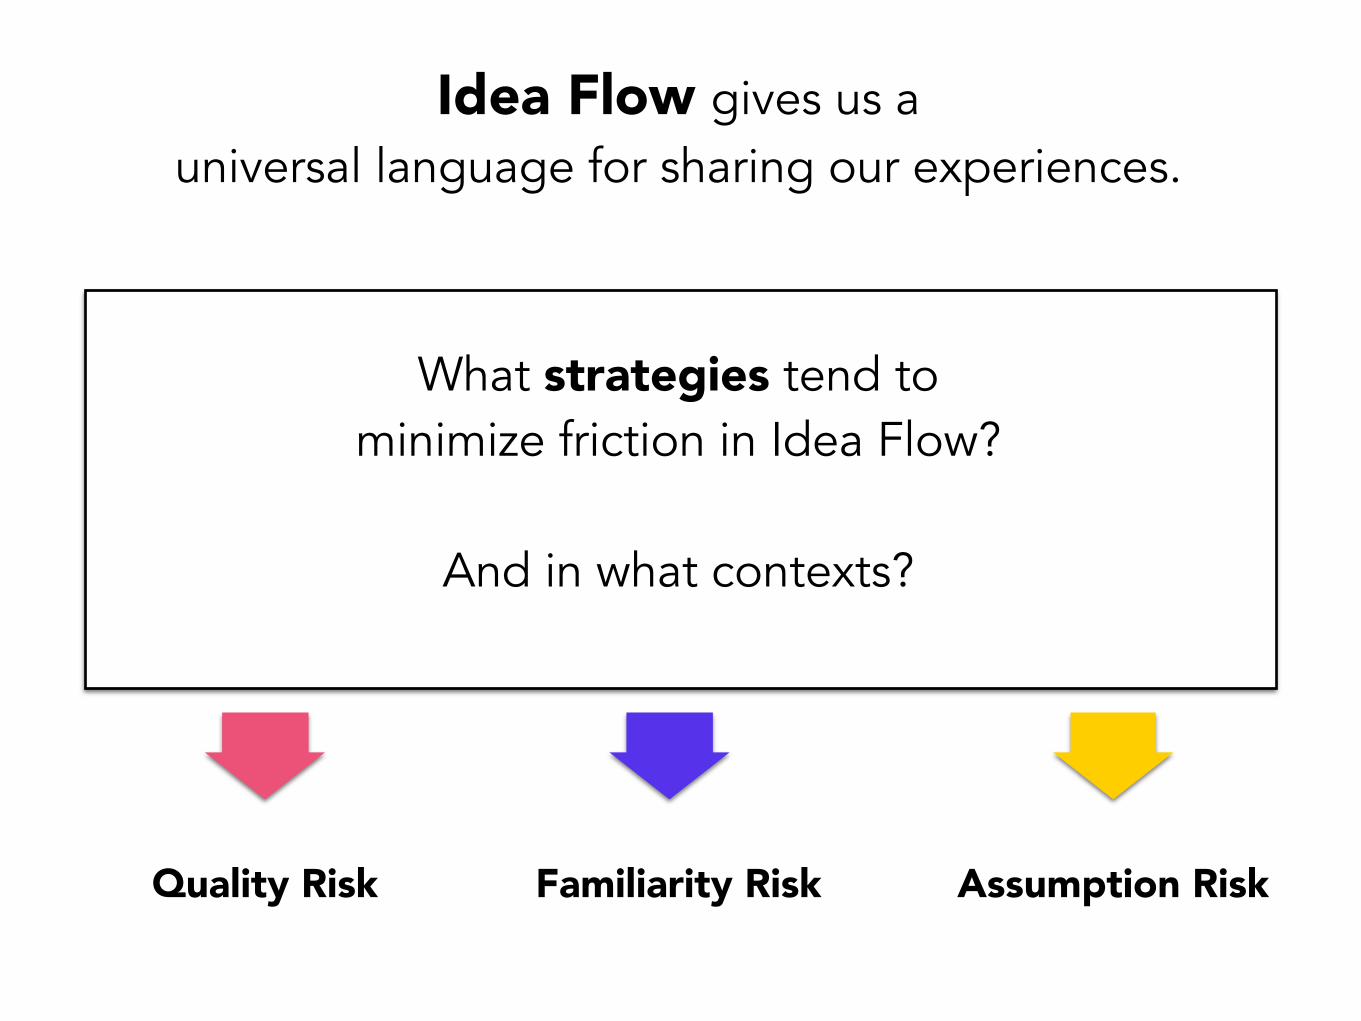
Quality Risk Familiarity Risk Assumption Risk
What strategies tend to minimize friction in Idea Flow?
Idea Flow gives us a universal language for sharing our experiences.
And in what contexts?
Idea Flow gives us the capability to learn together as an industry.
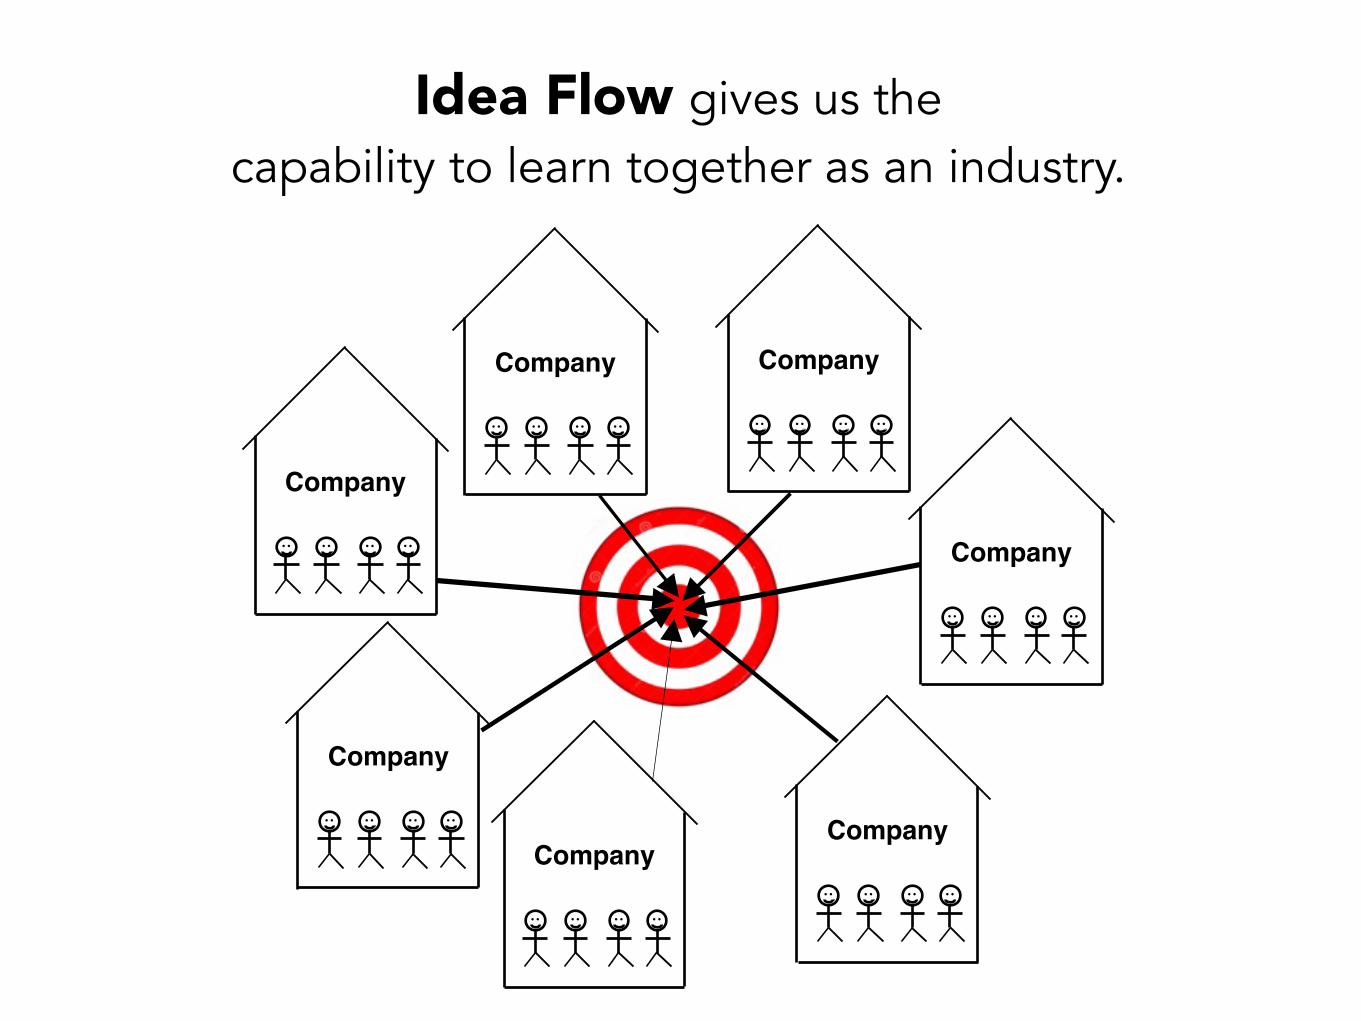
Idea Flow gives us the capability to learn together as an industry.
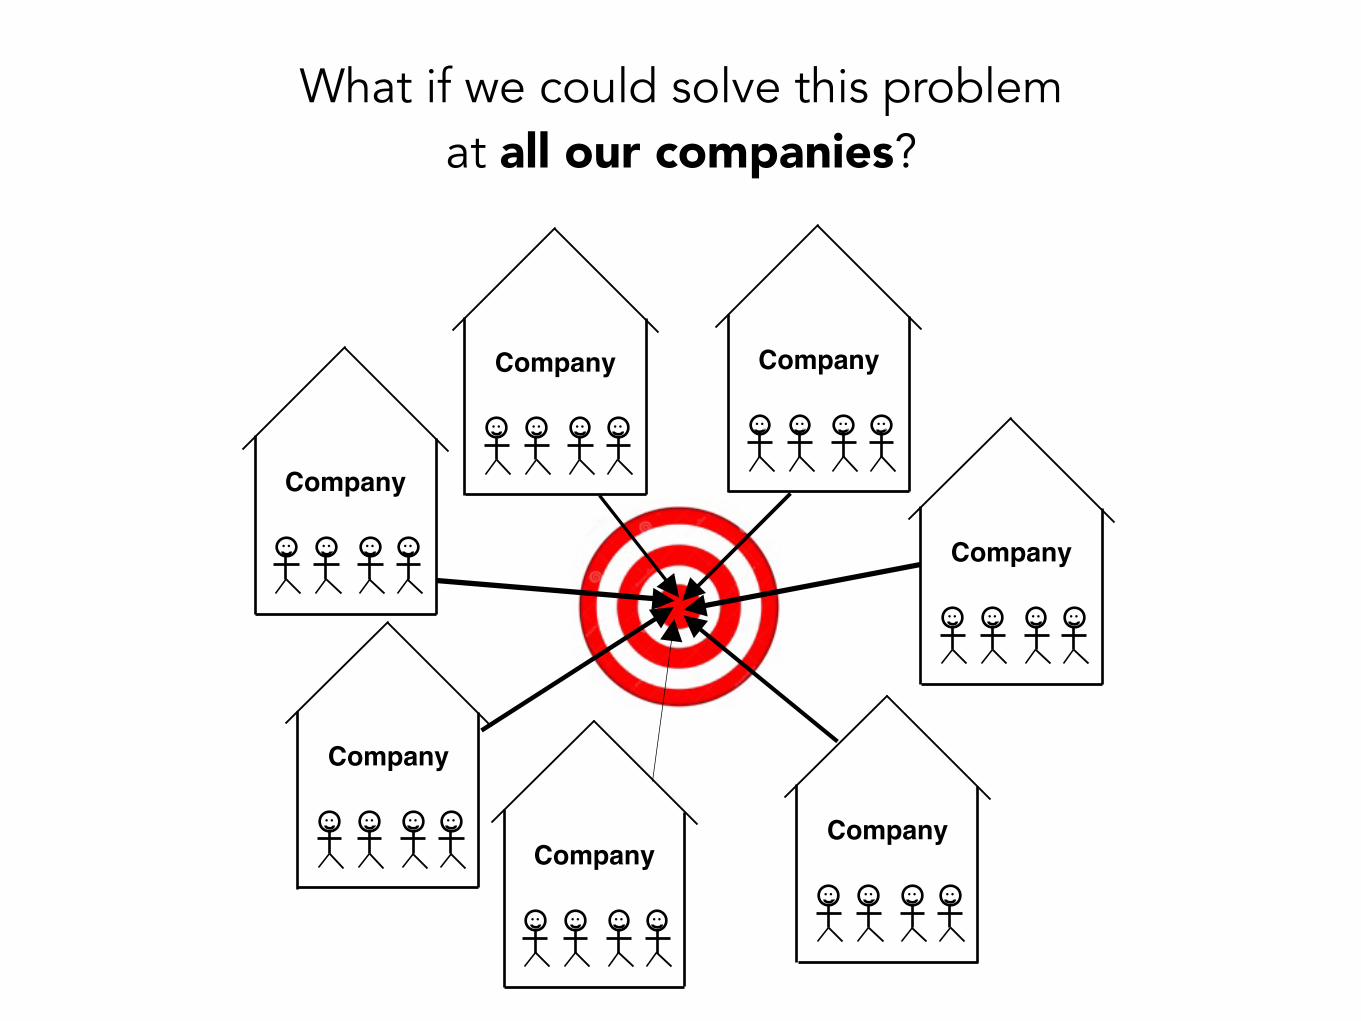
CompanyCompany
Company
Company
Company
Company Company
We have the opportunity to take our industry to a whole new level of effectiveness
If we choose to do it.
I Came Here to Say:
Why? Because this REALLY SUCKS!
“Better”“Better”
What if we could get managers and developers all pulling the same direction?
ManagersDevelopers

What if we could get everyone in our organization pulling the same direction?
CompanyCompany
Company
Company
Company
Company Company
What if we could solve this problem at all our companies?

#IdeaFlowAn Open Standard for Measuring PAIN
(Specification for Data Collection)
Universal Optimization Target
LEARN YOUR WAY TO AWESOME.
Free to Join Industry Peer Mentorship Network
openmastery.org
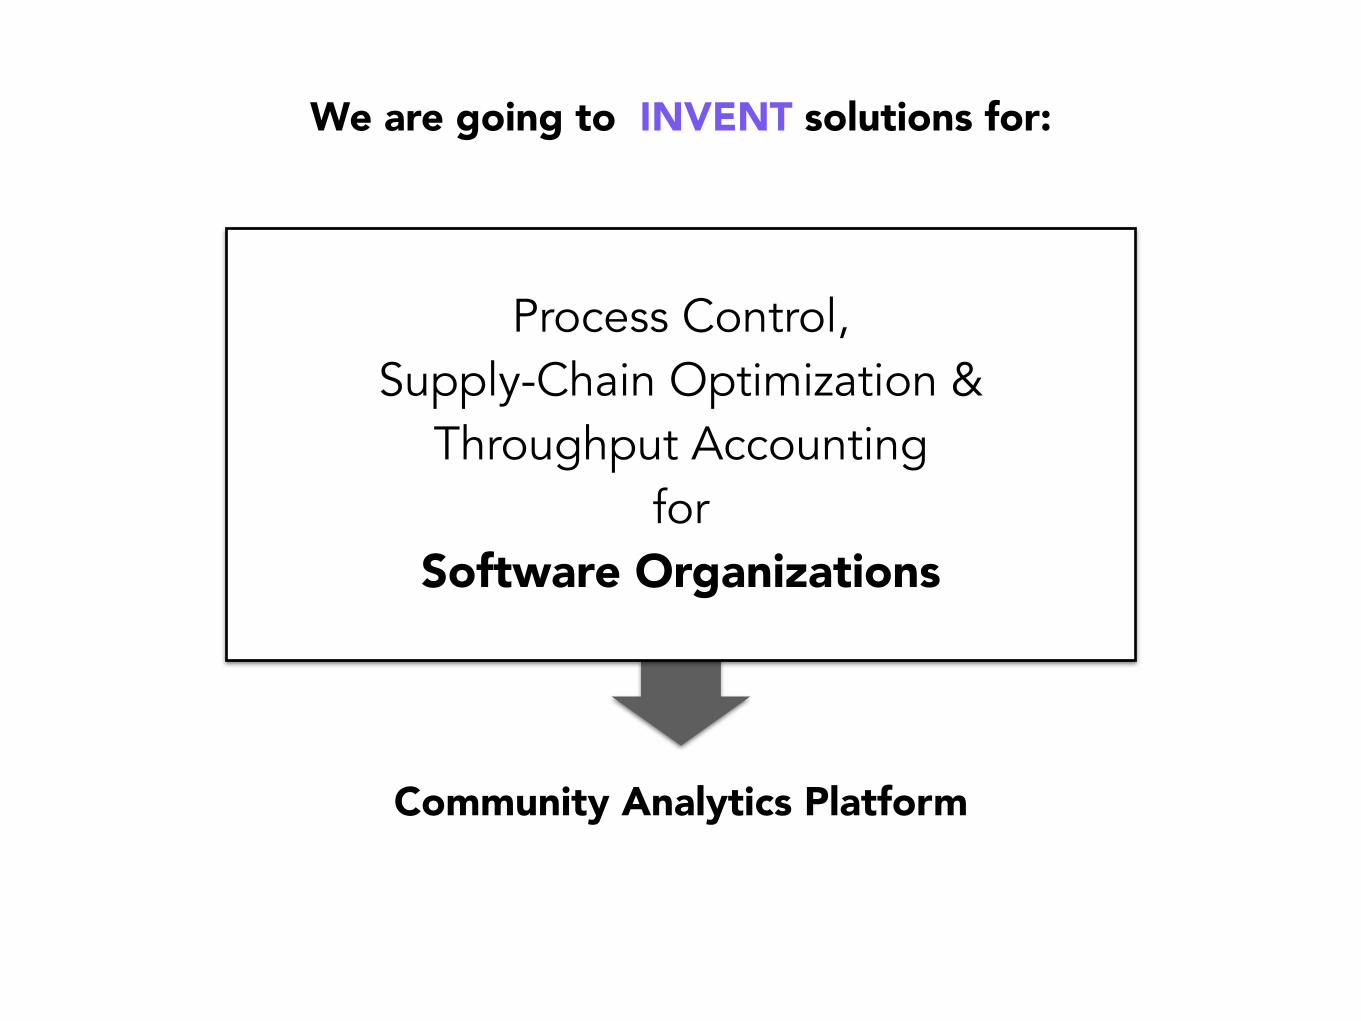
We are going to INVENT solutions for:
Community Analytics Platform
Process Control, Supply-Chain Optimization &
Throughput Accounting for
Software Organizations
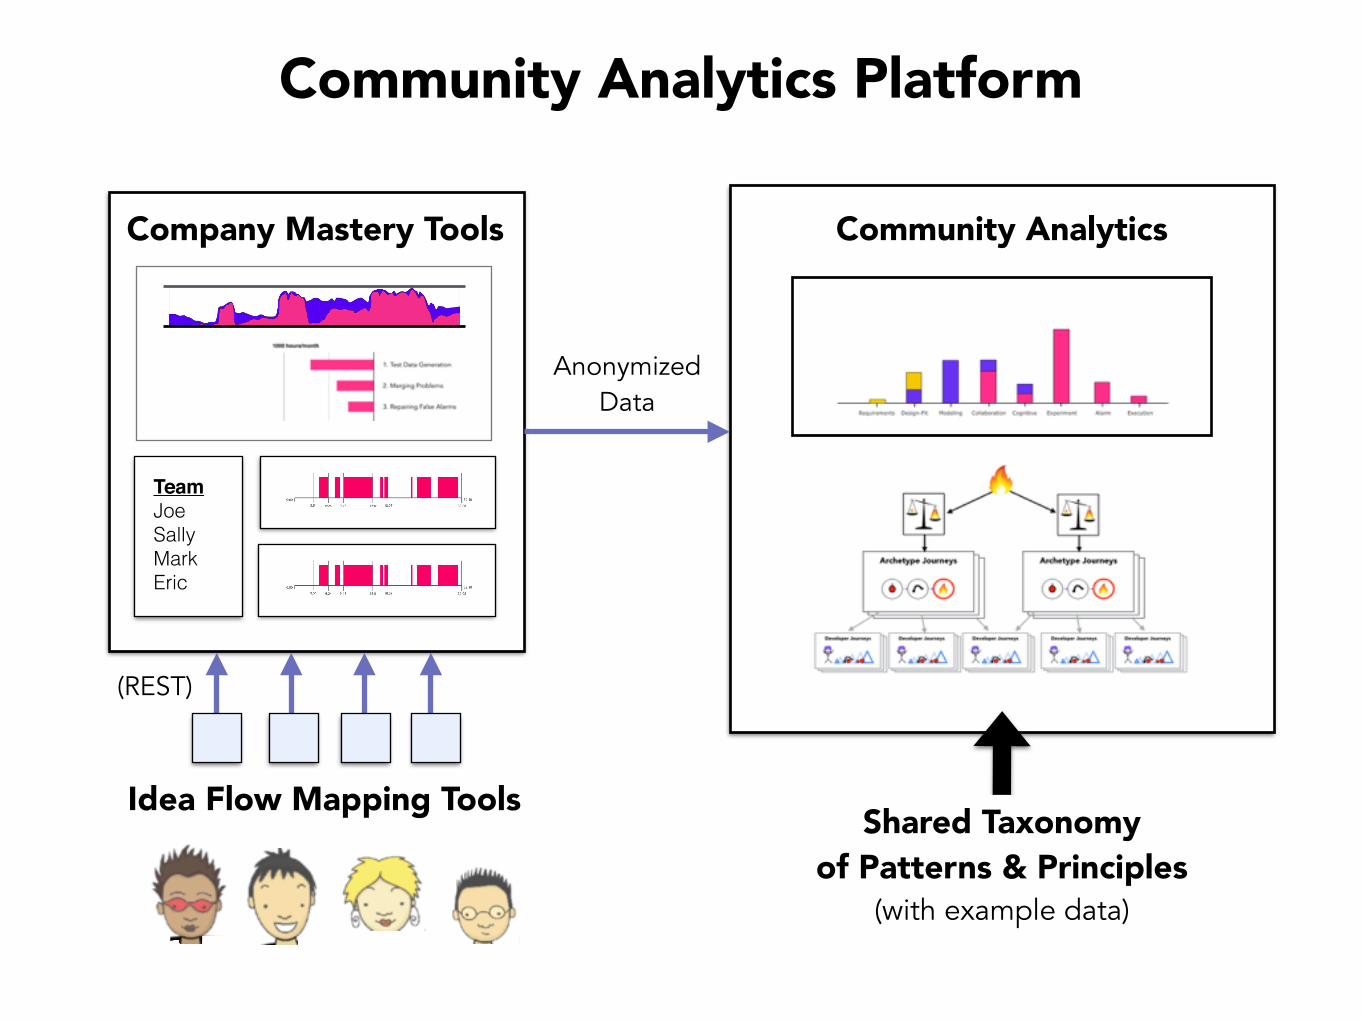
Community Analytics Platform
Idea Flow Mapping Tools
Company Mastery Tools
TeamJoe Sally Mark Eric
Community Analytics
Anonymized Data
(REST)
Shared Taxonomy of Patterns & Principles
(with example data)
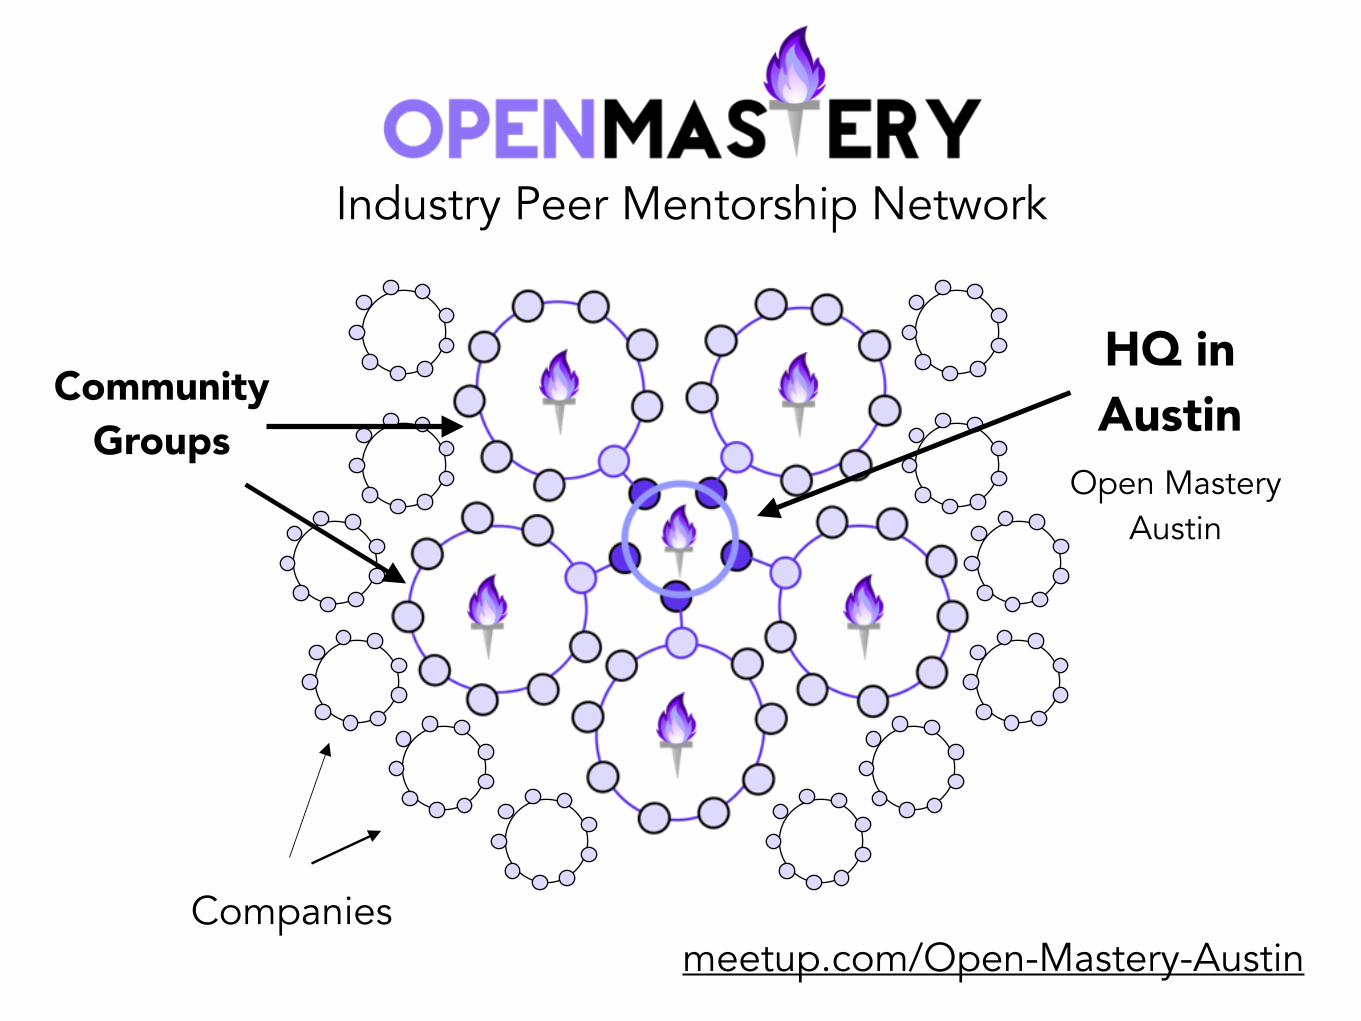
Industry Peer Mentorship Network
Companies
Community Groups
HQ in Austin
Open Mastery Austin
meetup.com/Open-Mastery-Austin

This isn’t about me.
This is about ALL OF US.

This is about Leading the Industry in solving this problem:
By working together.
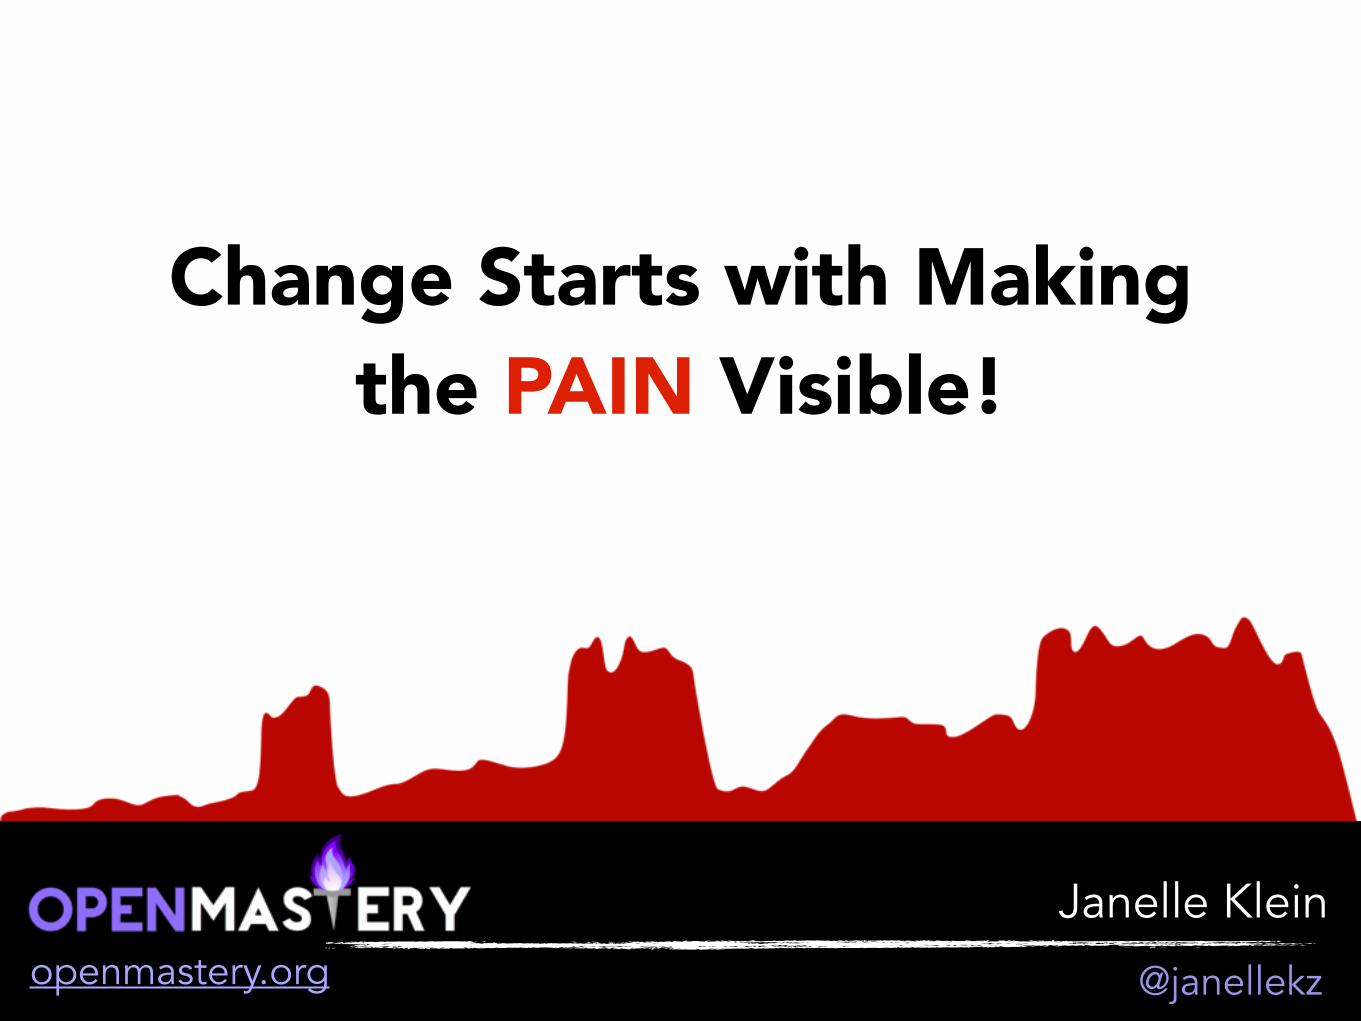
Change Starts with Making the PAIN Visible!
Janelle Kleinopenmastery.org @janellekz

Read my Book.
Think About It.
FREE with MembershipBuy It
How to Measure the PAIN in Software Development
Janelle Klein
Janelle Kleinopenmastery.org @janellekz
First Reading Group Discussion on August 11th
meetup.com/Open-Mastery-Austin
2. Stop getting crushed by business pressure
Janelle Kleinopenmastery.org @janellekz
Lunch & Learn Talks
4. A programmer’s guide to humans
5. Learn your way to AWESOME
1. Top 5 Reasons Why Improvement Efforts Fail
3. Let’s talk about PAIN!