lessons learned from the scos97 upper-air meteorology ... · pdf filechairman’s air...
TRANSCRIPT
Chairman’s Air Pollution Seminar Series -- January 9, 2003
Lessons Learned from the SCOS97 Upper-Air Meteorology Measurement Program –
Applications to Current and Future Programs
Clinton P. MacDonaldSonoma Technology, Inc.
Petaluma, CA
Robert A. Baxter, CCMTechnical & Business Systems, Inc.
Valencia, CA
Chairman’s Air Pollution Seminar Series -- January 9, 2003
Acknowledgments
Cooperative effort of
� California Air Resources Board
� South Coast Air Quality Management District
� National Oceanic and Atmospheric Administration
Chairman’s Air Pollution Seminar Series -- January 9, 2003
Presentation Overview
� Background– Field program overview– Instruments and data processing– Data validation project
� Project review– Quality assurance – Data processing – Data merging – Data validation
� Recommendations� Audit, processing, and data product ideas
Chairman’s Air Pollution Seminar Series -- January 9, 2003
Field Program Overview
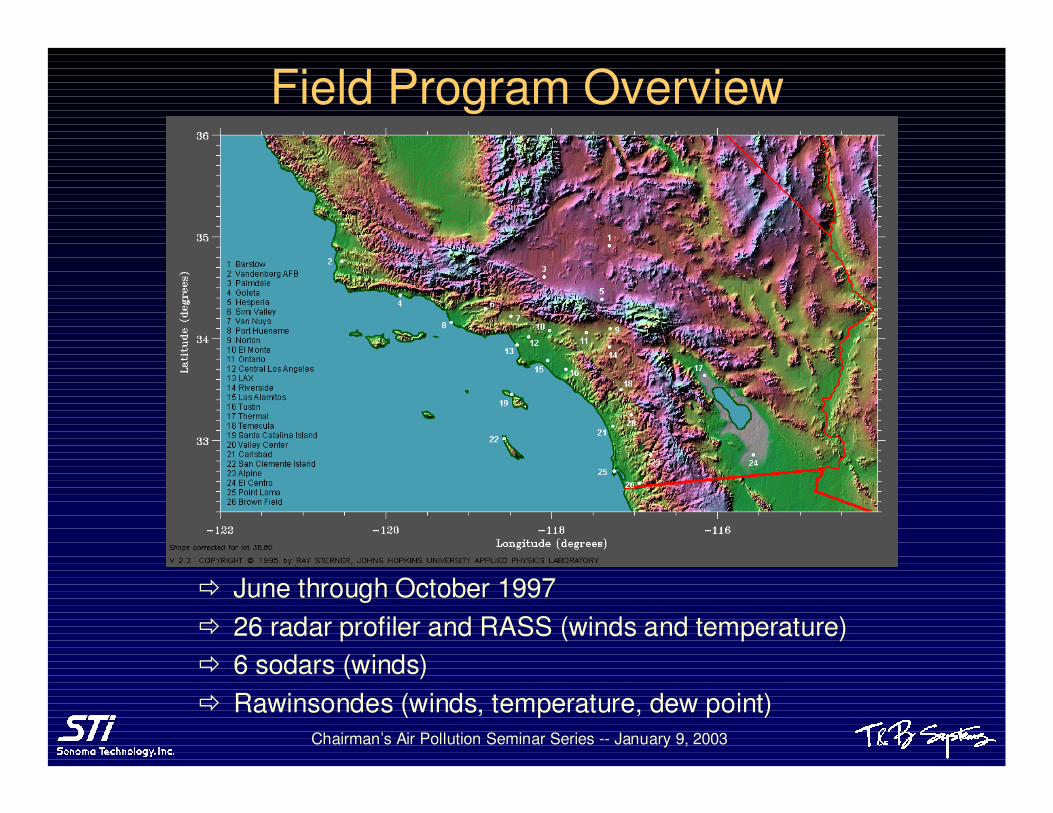
� June through October 1997� 26 radar profiler and RASS (winds and temperature)� 6 sodars (winds)� Rawinsondes (winds, temperature, dew point)
Chairman’s Air Pollution Seminar Series -- January 9, 2003
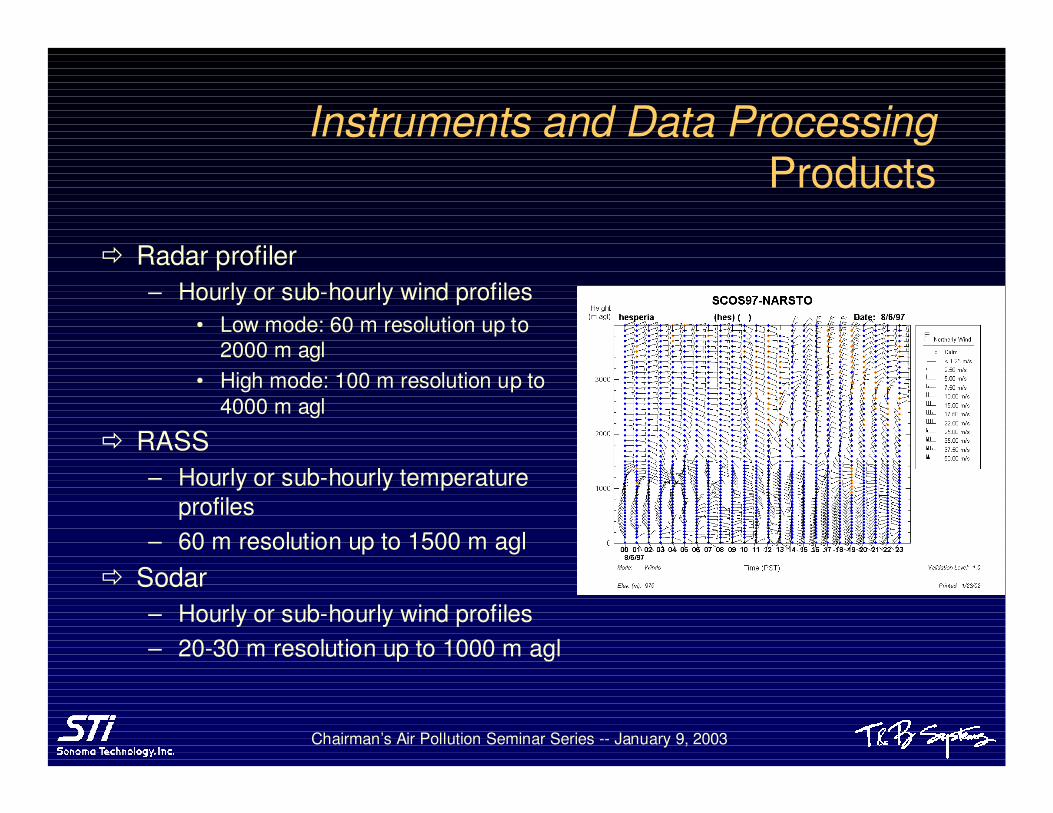
� Radar profiler– Hourly or sub-hourly wind profiles
• Low mode: 60 m resolution up to 2000 m agl
• High mode: 100 m resolution up to 4000 m agl
� RASS– Hourly or sub-hourly temperature
profiles– 60 m resolution up to 1500 m agl
� Sodar – Hourly or sub-hourly wind profiles– 20-30 m resolution up to 1000 m agl
Instruments and Data ProcessingProducts
Chairman’s Air Pollution Seminar Series -- January 9, 2003
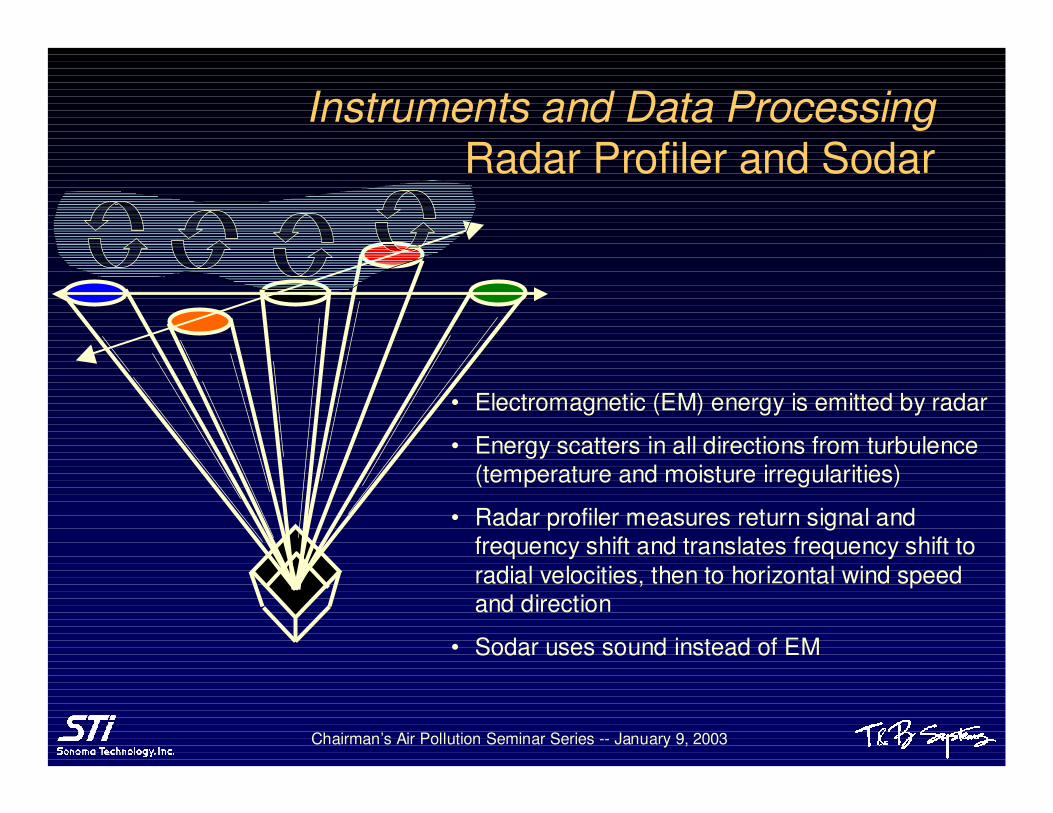
Instruments and Data Processing Radar Profiler and Sodar
• Electromagnetic (EM) energy is emitted by radar
• Energy scatters in all directions from turbulence (temperature and moisture irregularities)
• Radar profiler measures return signal and frequency shift and translates frequency shift to radial velocities, then to horizontal wind speed and direction
• Sodar uses sound instead of EM
Chairman’s Air Pollution Seminar Series -- January 9, 2003
Radar Profiler
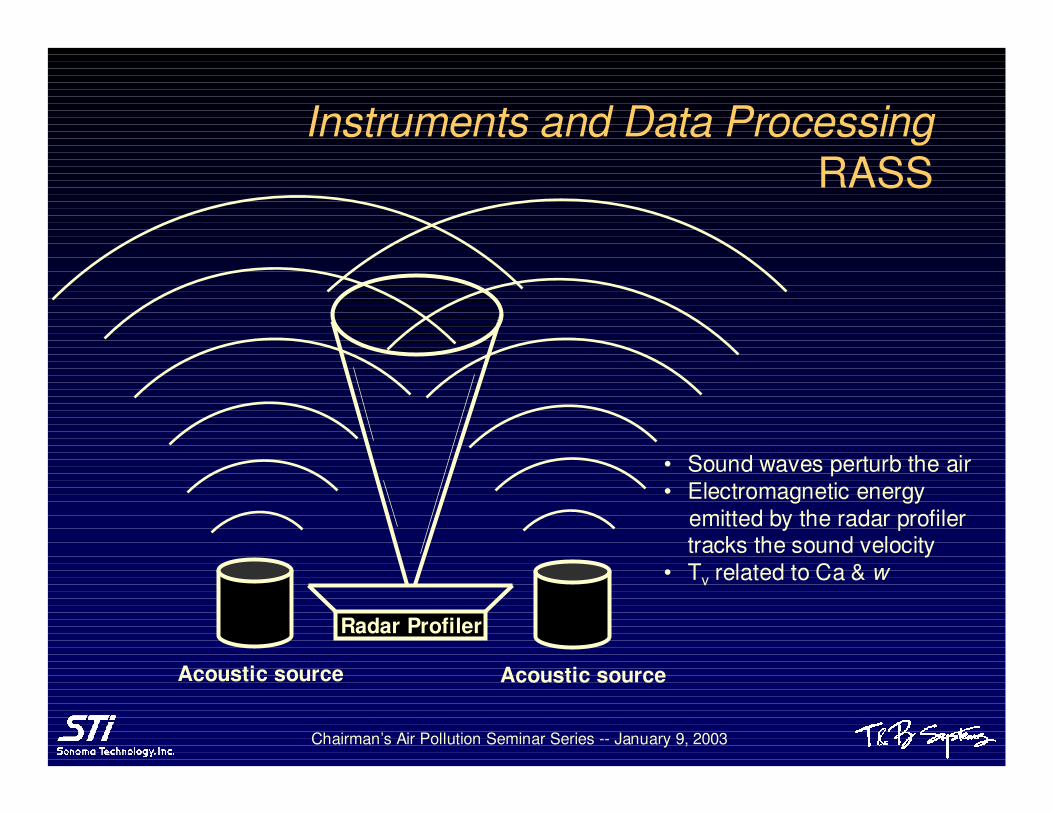
• Sound waves perturb the air• Electromagnetic energy
emitted by the radar profiler tracks the sound velocity
• Tv related to Ca & w
Acoustic source Acoustic source
Instruments and Data Processing RASS
Chairman’s Air Pollution Seminar Series -- January 9, 2003
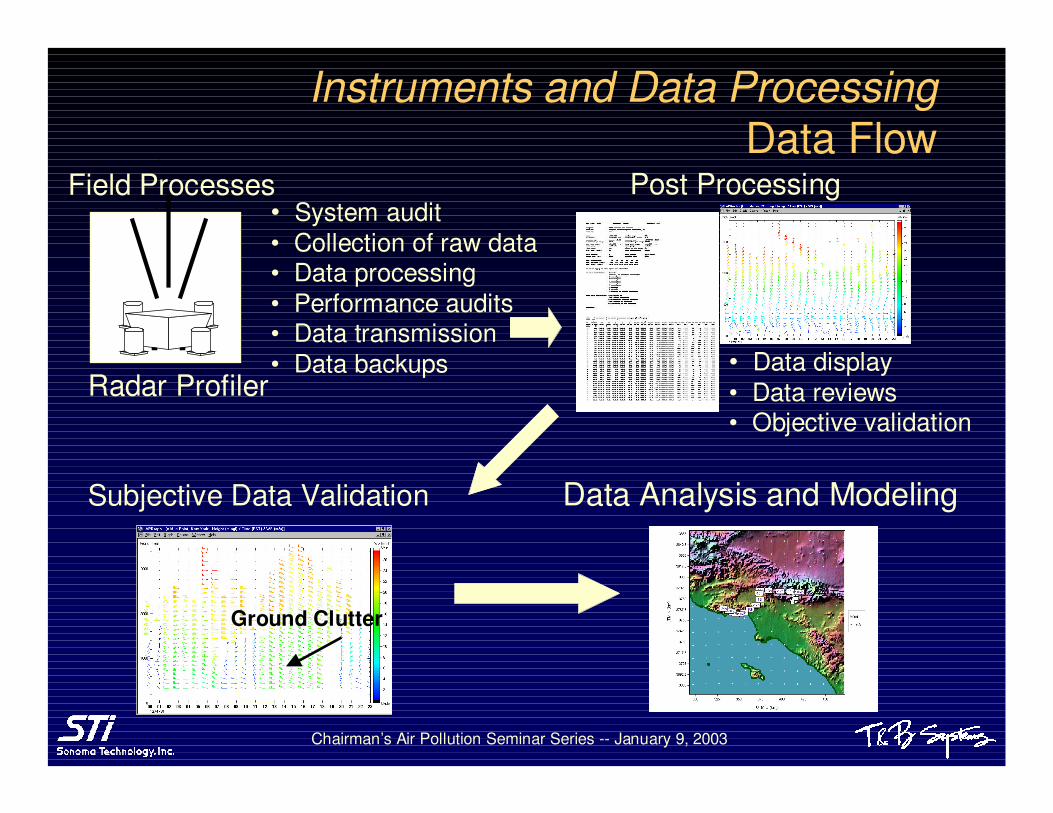
Instruments and Data Processing Data Flow
Field Processes
Radar Profiler
• System audit• Collection of raw data• Data processing• Performance audits• Data transmission• Data backups
Post Processing
• Data display• Data reviews• Objective validation
Subjective Data Validation
Ground Clutter
Data Analysis and Modeling

Chairman’s Air Pollution Seminar Series -- January 9, 2003
Data Validation Project
� Audits revealed configuration problems with instruments
� Preliminary analyses revealed bad data� Data from two processing methods (Met_0,
Met_1) were submitted, with no determination as to which is best
� Separate low- and high-mode data were submitted
� Met_0 and Met_1 produced data when consensus did not
� Objective QC alone was used, removing only some bad data
Chairman’s Air Pollution Seminar Series -- January 9, 2003
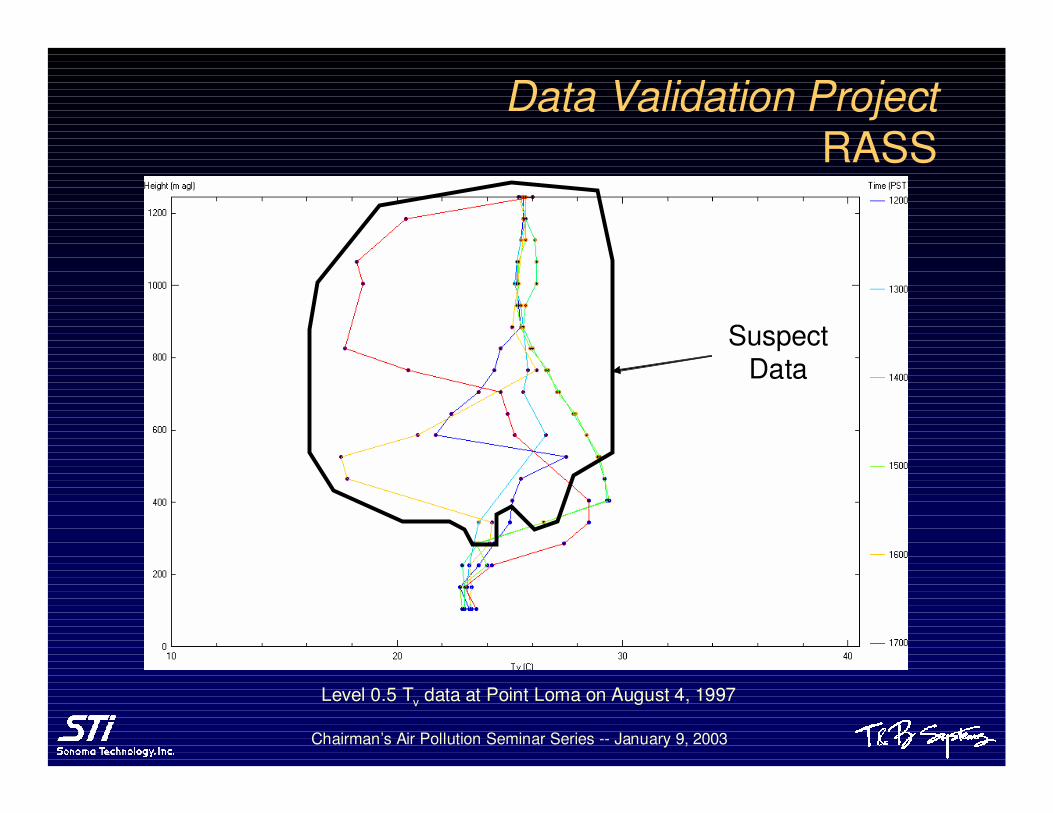
SuspectData
SuspectData
Level 0.5 Tv data at Point Loma on August 4, 1997
Data Validation ProjectRASS
Chairman’s Air Pollution Seminar Series -- January 9, 2003
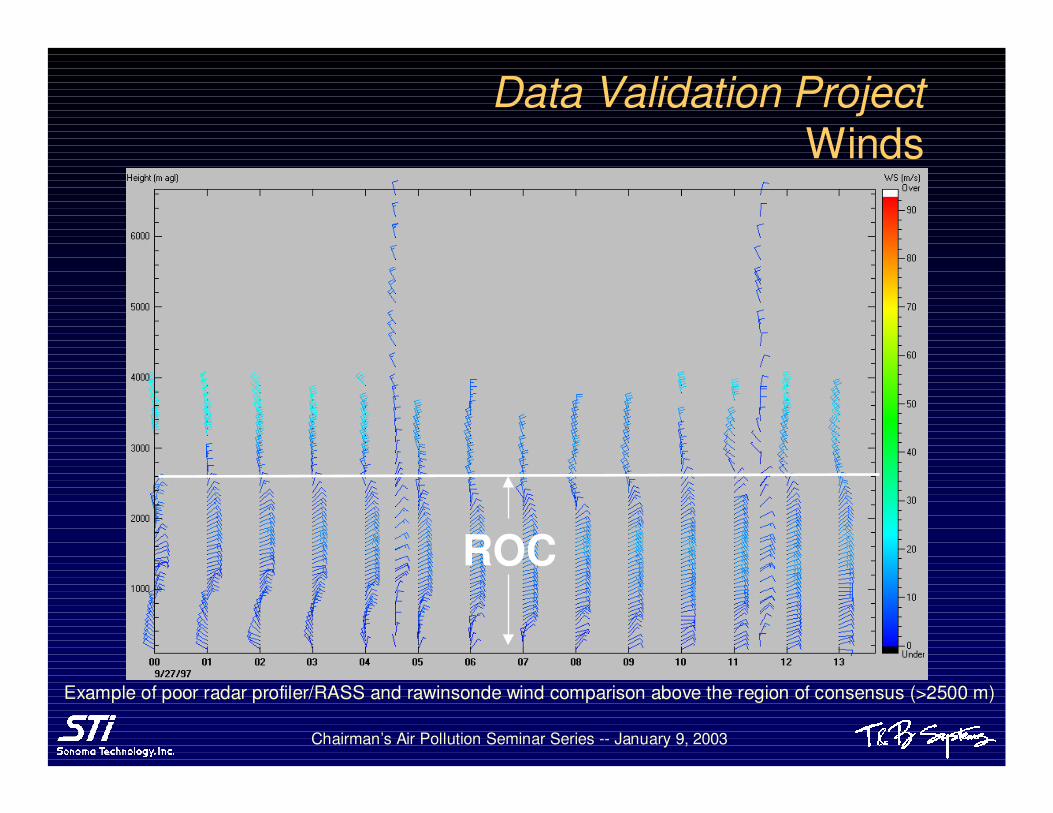
Example of poor radar profiler/RASS and rawinsonde wind comparison above the region of consensus (>2500 m)
ROC
Data Validation ProjectWinds
Chairman’s Air Pollution Seminar Series -- January 9, 2003
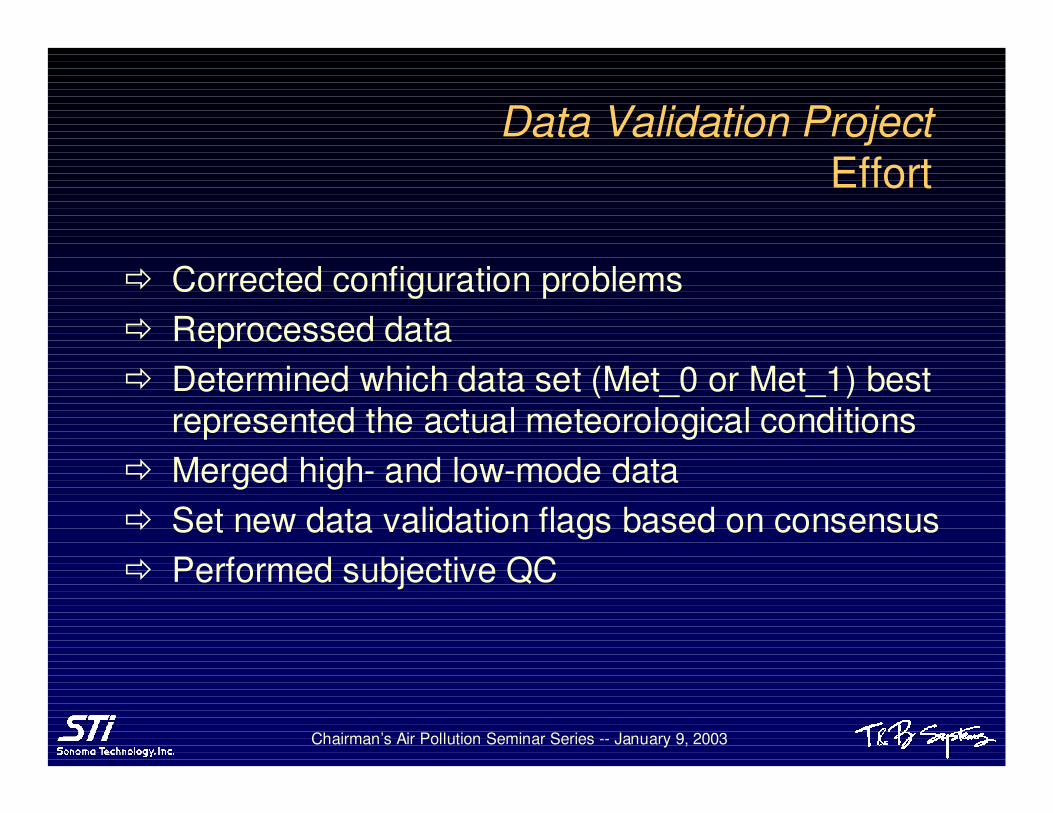
� Corrected configuration problems� Reprocessed data� Determined which data set (Met_0 or Met_1) best
represented the actual meteorological conditions� Merged high- and low-mode data� Set new data validation flags based on consensus� Performed subjective QC
Data Validation Project Effort
Chairman’s Air Pollution Seminar Series -- January 9, 2003
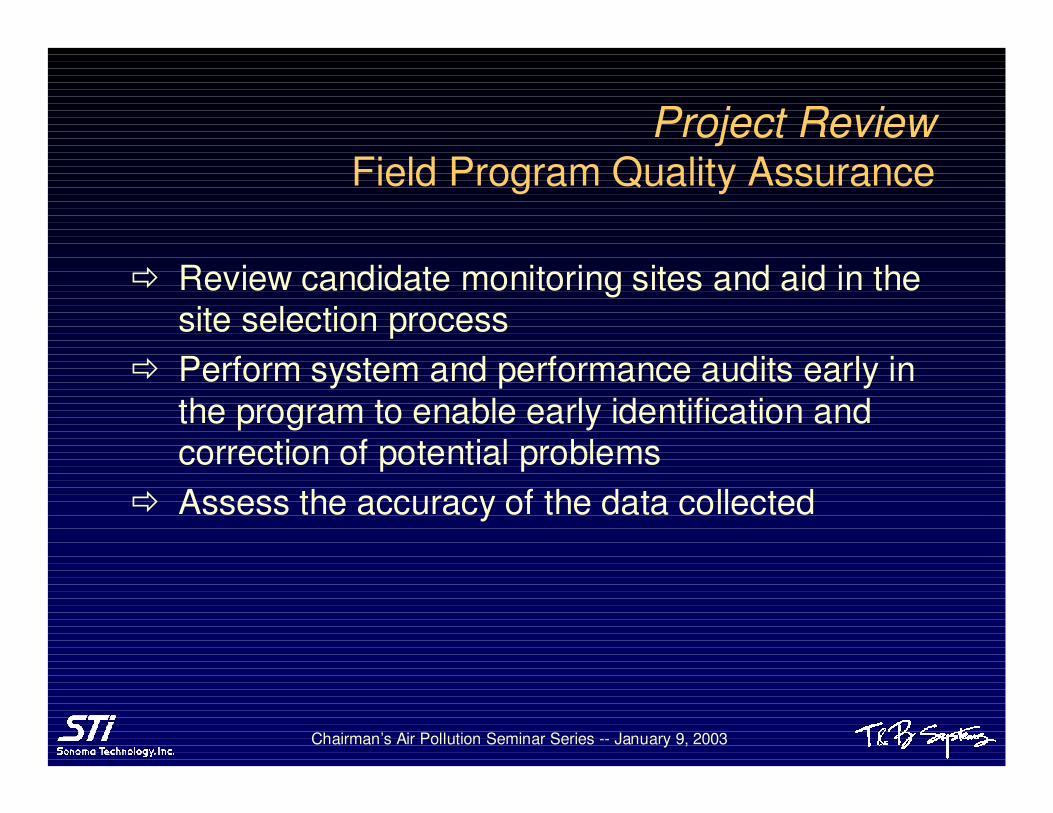
� Review candidate monitoring sites and aid in the site selection process
� Perform system and performance audits early in the program to enable early identification and correction of potential problems
� Assess the accuracy of the data collected
Project Review Field Program Quality Assurance
Chairman’s Air Pollution Seminar Series -- January 9, 2003
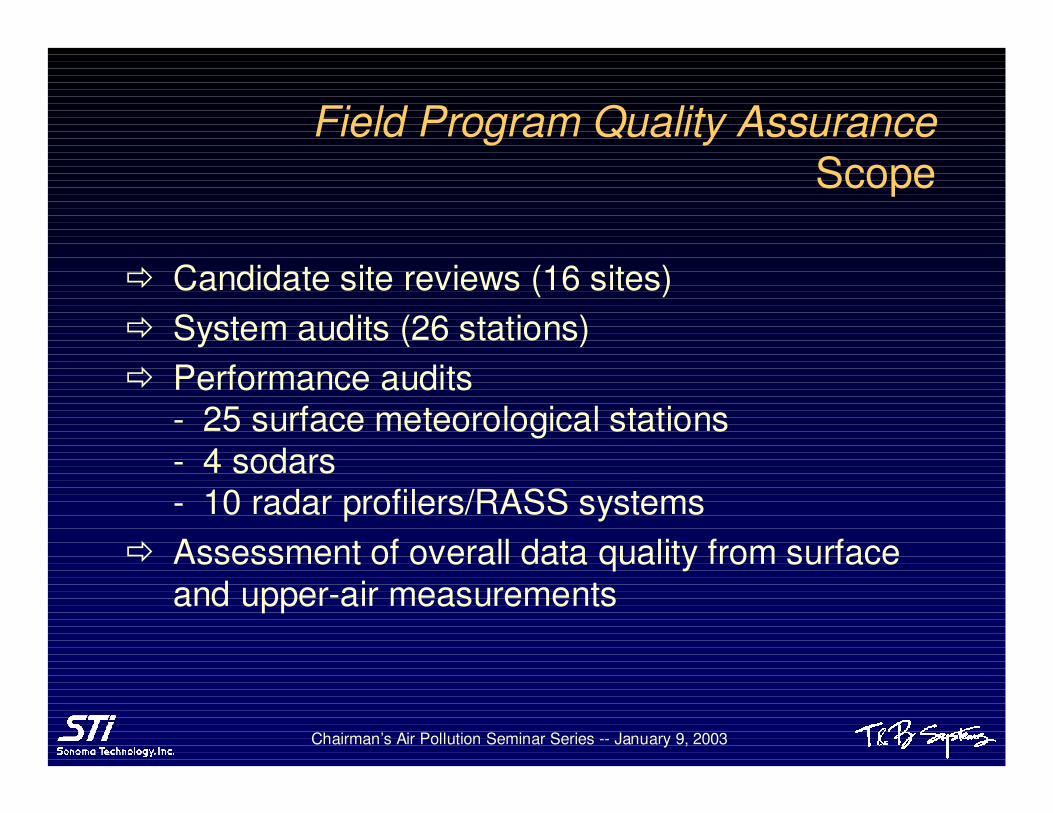
� Candidate site reviews (16 sites)� System audits (26 stations)� Performance audits
- 25 surface meteorological stations- 4 sodars- 10 radar profilers/RASS systems
� Assessment of overall data quality from surface and upper-air measurements
Field Program Quality AssuranceScope
Chairman’s Air Pollution Seminar Series -- January 9, 2003
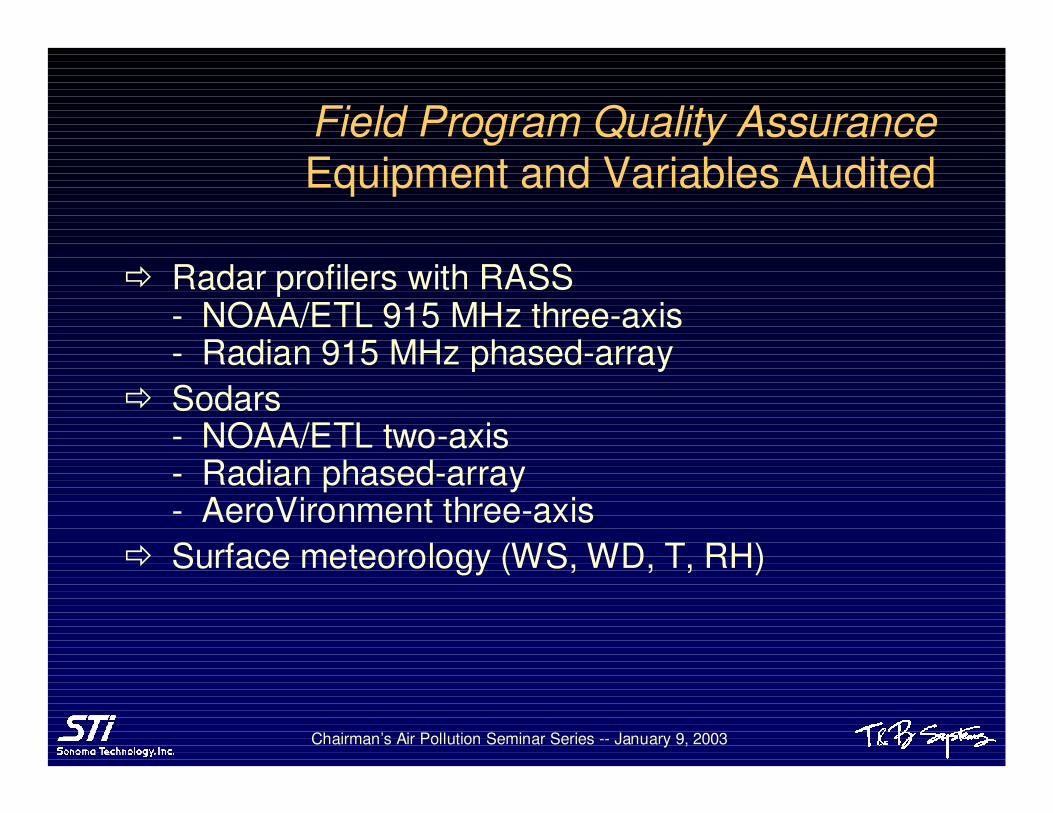
� Radar profilers with RASS- NOAA/ETL 915 MHz three-axis- Radian 915 MHz phased-array
� Sodars- NOAA/ETL two-axis- Radian phased-array- AeroVironment three-axis
� Surface meteorology (WS, WD, T, RH)
Field Program Quality Assurance Equipment and Variables Audited
Chairman’s Air Pollution Seminar Series -- January 9, 2003
Ap
r
May Ju
n
Jul
Aug
Sep Oct
Nov
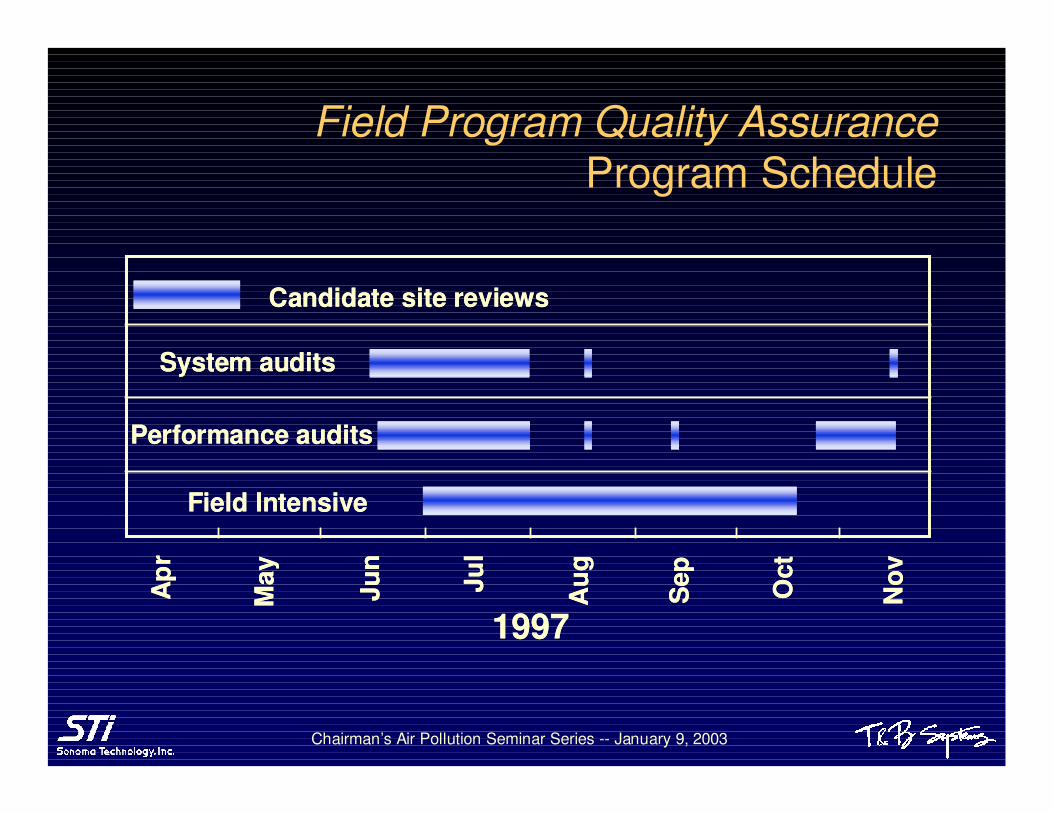
1997
Candidate site reviews
System audits
Field Intensive
Performance audits
Ap
r
May Ju
n
Jul
Aug
Sep Oct
Nov
1997
Candidate site reviews
System audits
Field Intensive
Performance audits
Field Program Quality AssuranceProgram Schedule
Chairman’s Air Pollution Seminar Series -- January 9, 2003
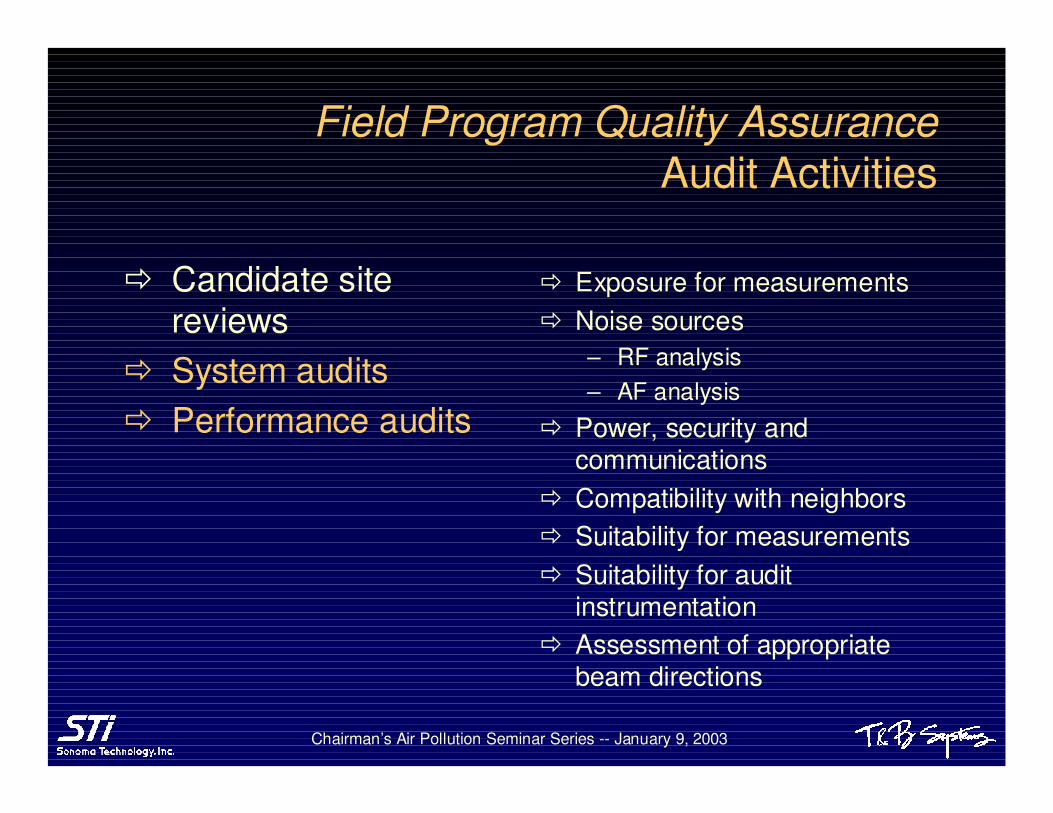
� Exposure for measurements� Noise sources
– RF analysis– AF analysis
� Power, security and communications
� Compatibility with neighbors� Suitability for measurements� Suitability for audit
instrumentation� Assessment of appropriate
beam directions
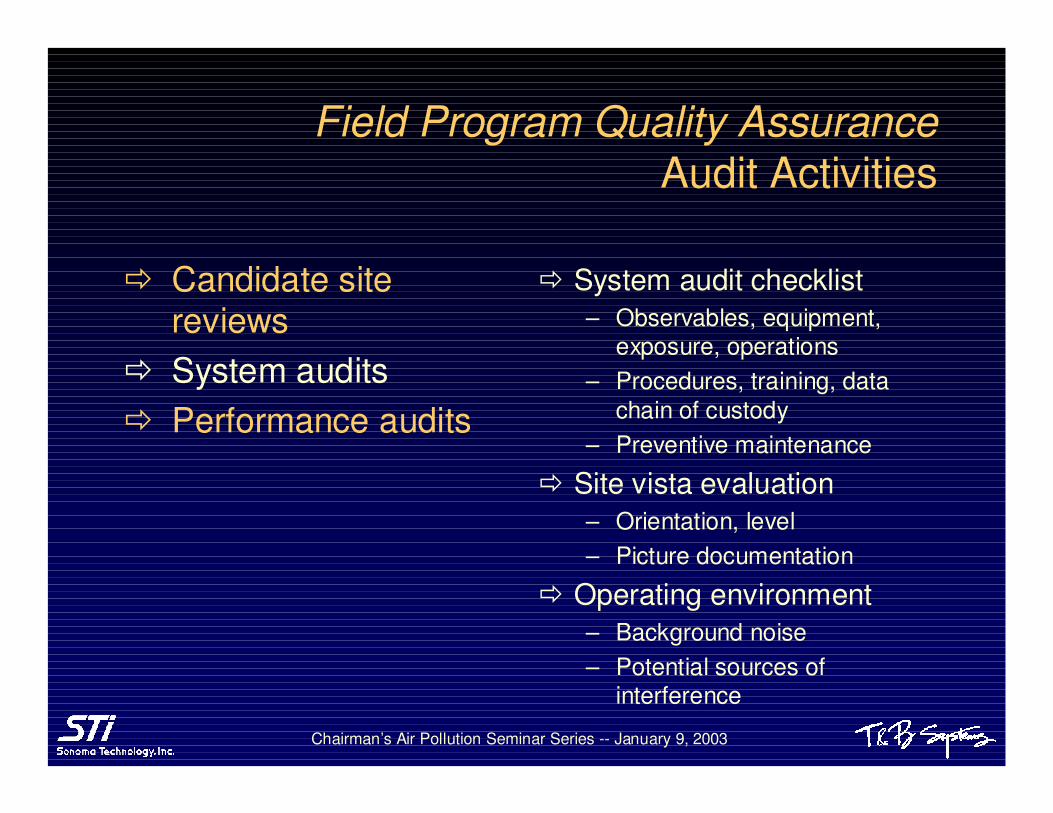
Field Program Quality AssuranceAudit Activities
� Candidate site reviews
� System audits� Performance audits
Chairman’s Air Pollution Seminar Series -- January 9, 2003
� System audit checklist– Observables, equipment,
exposure, operations– Procedures, training, data
chain of custody– Preventive maintenance
� Site vista evaluation– Orientation, level– Picture documentation
� Operating environment– Background noise– Potential sources of
interference
Field Program Quality AssuranceAudit Activities
� Candidate site reviews
� System audits� Performance audits
Chairman’s Air Pollution Seminar Series -- January 9, 2003
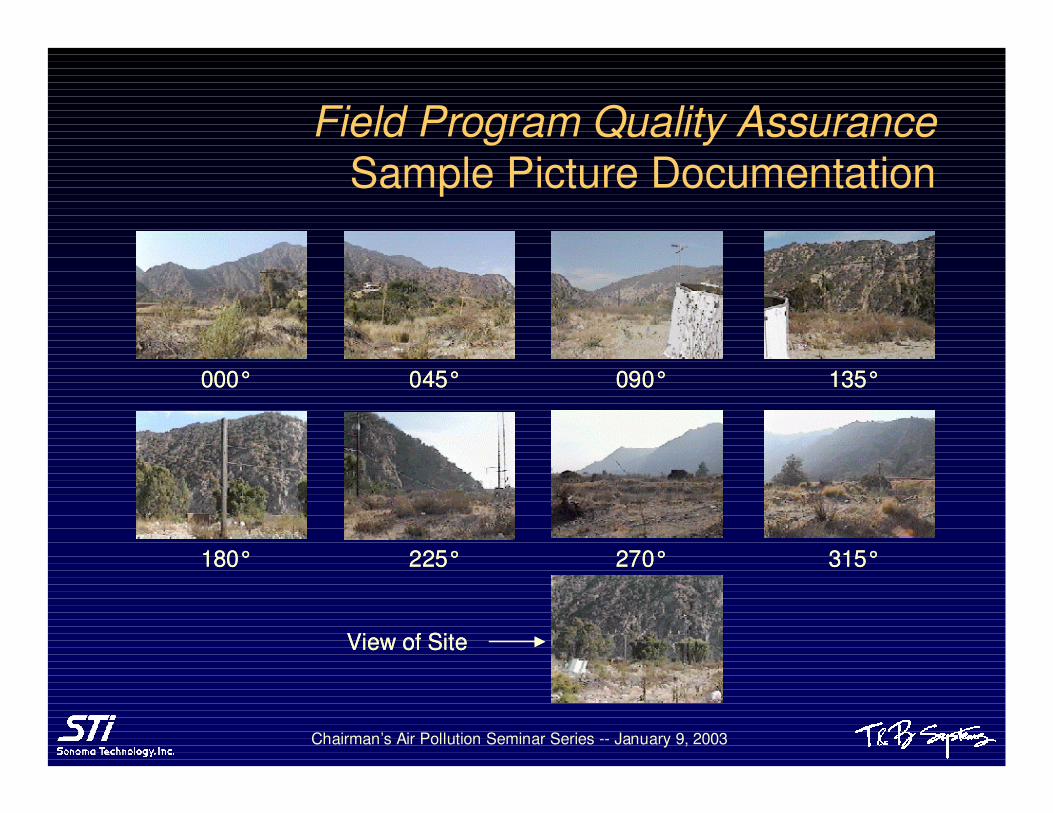
000° 045° 090° 135°
180° 225° 270° 315°
View of Site
000° 045° 090° 135°
180° 225° 270° 315°
View of Site
Field Program Quality AssuranceSample Picture Documentation
Chairman’s Air Pollution Seminar Series -- January 9, 2003
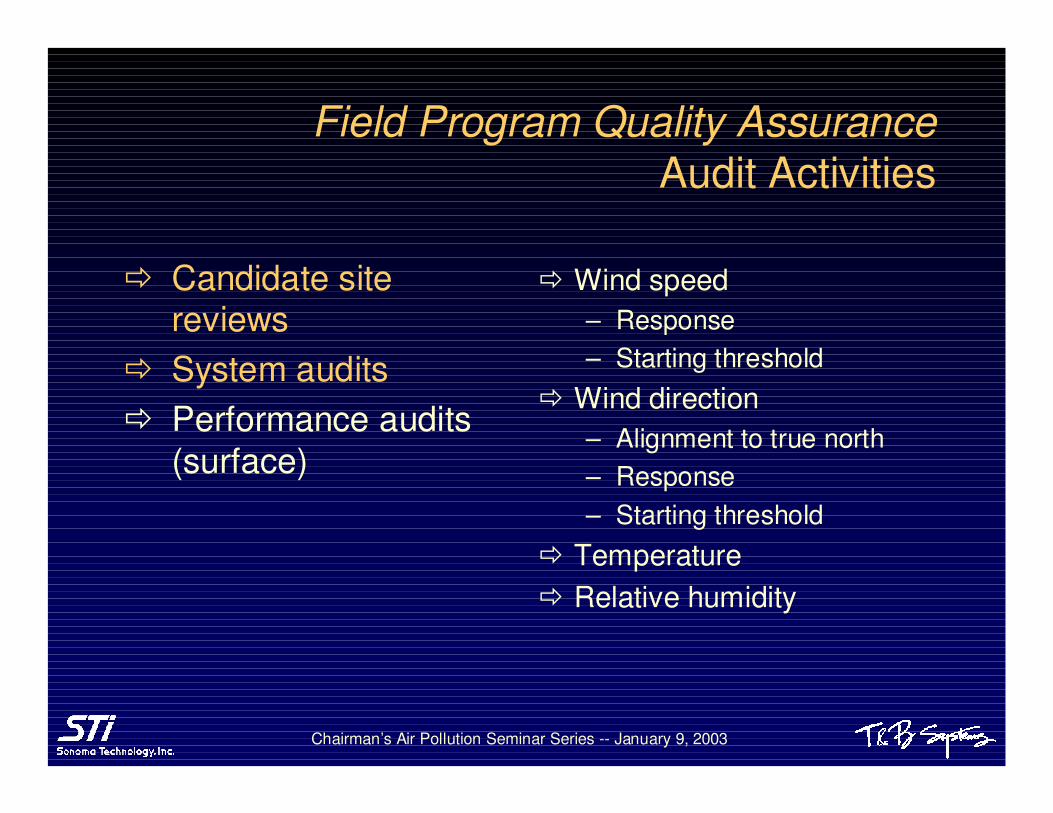
� Candidate site reviews
� System audits� Performance audits
(surface)
� Wind speed– Response– Starting threshold
� Wind direction– Alignment to true north – Response– Starting threshold
� Temperature� Relative humidity
Field Program Quality Assurance Audit Activities
Chairman’s Air Pollution Seminar Series -- January 9, 2003
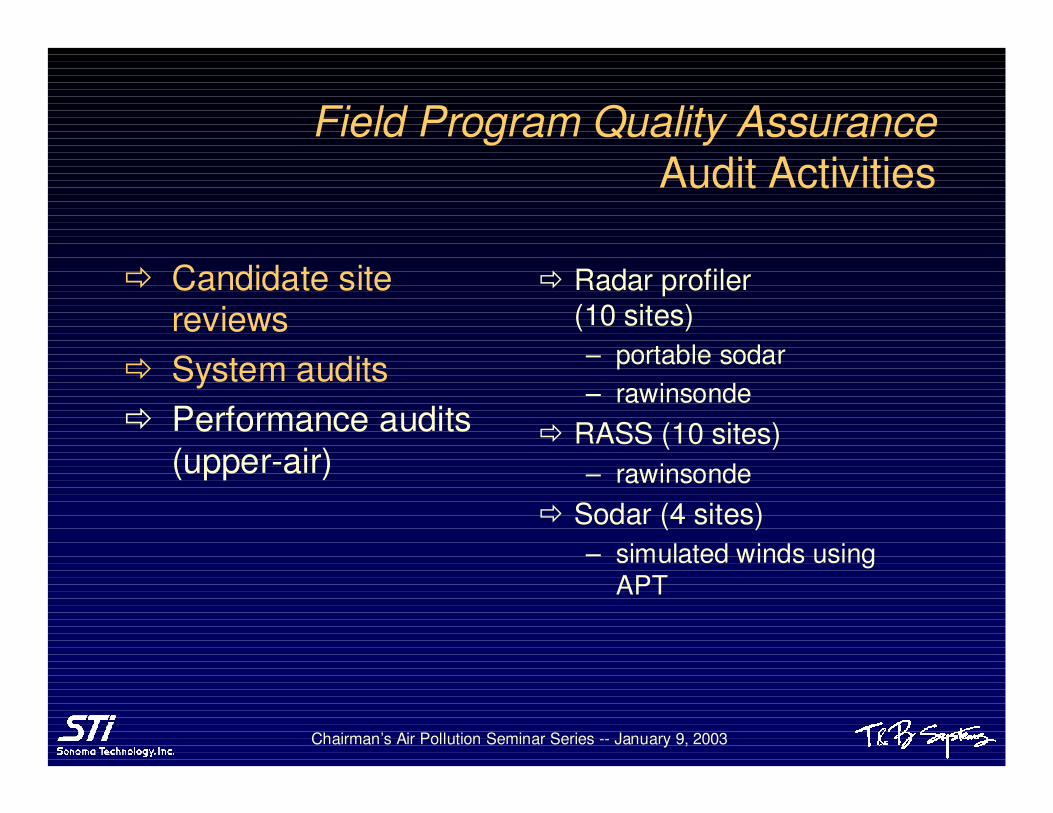
� Radar profiler (10 sites)– portable sodar– rawinsonde
� RASS (10 sites)– rawinsonde
� Sodar (4 sites)– simulated winds using
APT
Field Program Quality Assurance Audit Activities
� Candidate site reviews
� System audits� Performance audits
(upper-air)

Chairman’s Air Pollution Seminar Series -- January 9, 2003
� Site operation differences among contractors� Systematic problems with equipment alignment� Equipment orientation errors in the data� Differences in data validation procedures among
reporting groups� Time zone differences among contractors� Antenna orientation documentation problems� Noise contamination of sodar data� Processing methodology questions
Field Program Quality Assurance Audit Program Results
Chairman’s Air Pollution Seminar Series -- January 9, 2003
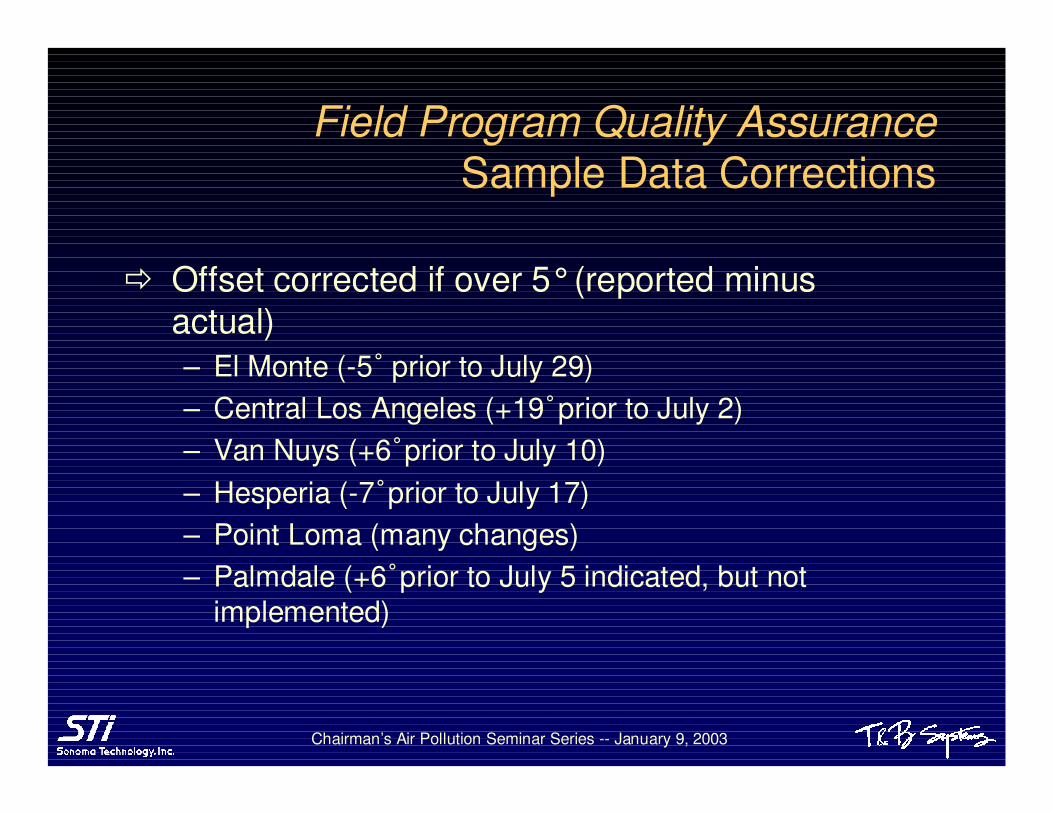
� Offset corrected if over 5°(reported minus actual)– El Monte (-5° prior to July 29)– Central Los Angeles (+19° prior to July 2)– Van Nuys (+6° prior to July 10)– Hesperia (-7° prior to July 17)– Point Loma (many changes)– Palmdale (+6° prior to July 5 indicated, but not
implemented)
Field Program Quality Assurance Sample Data Corrections
Chairman’s Air Pollution Seminar Series -- January 9, 2003
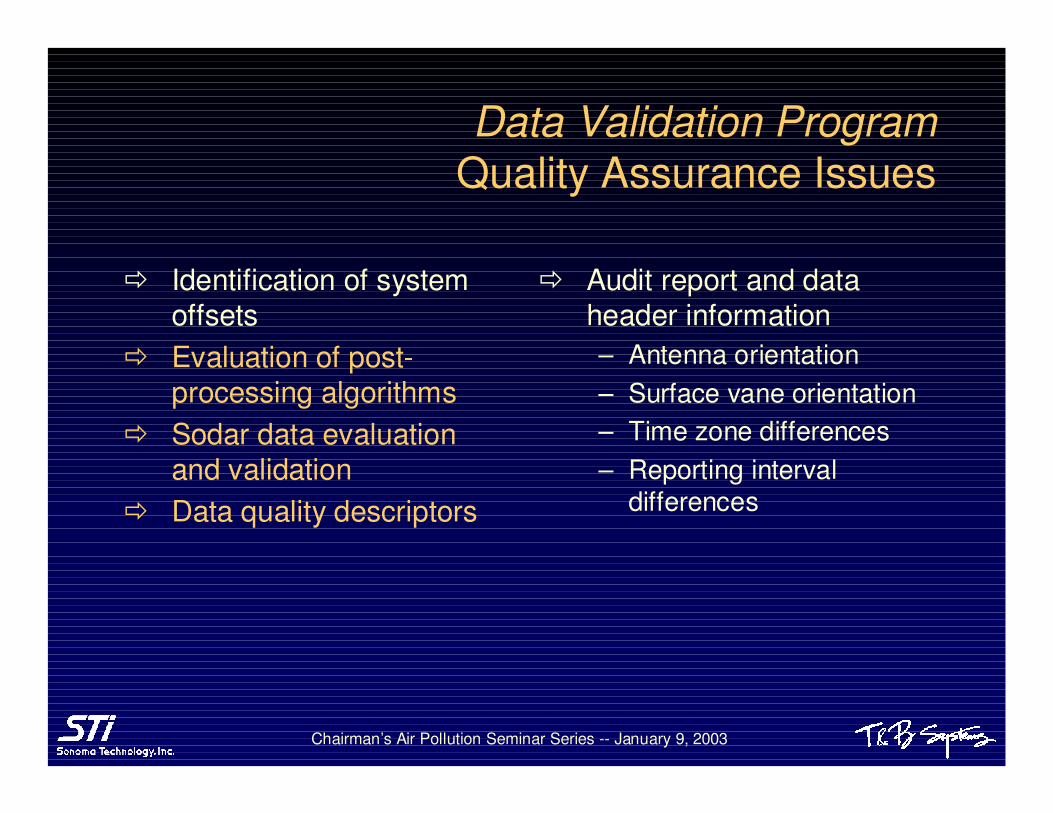
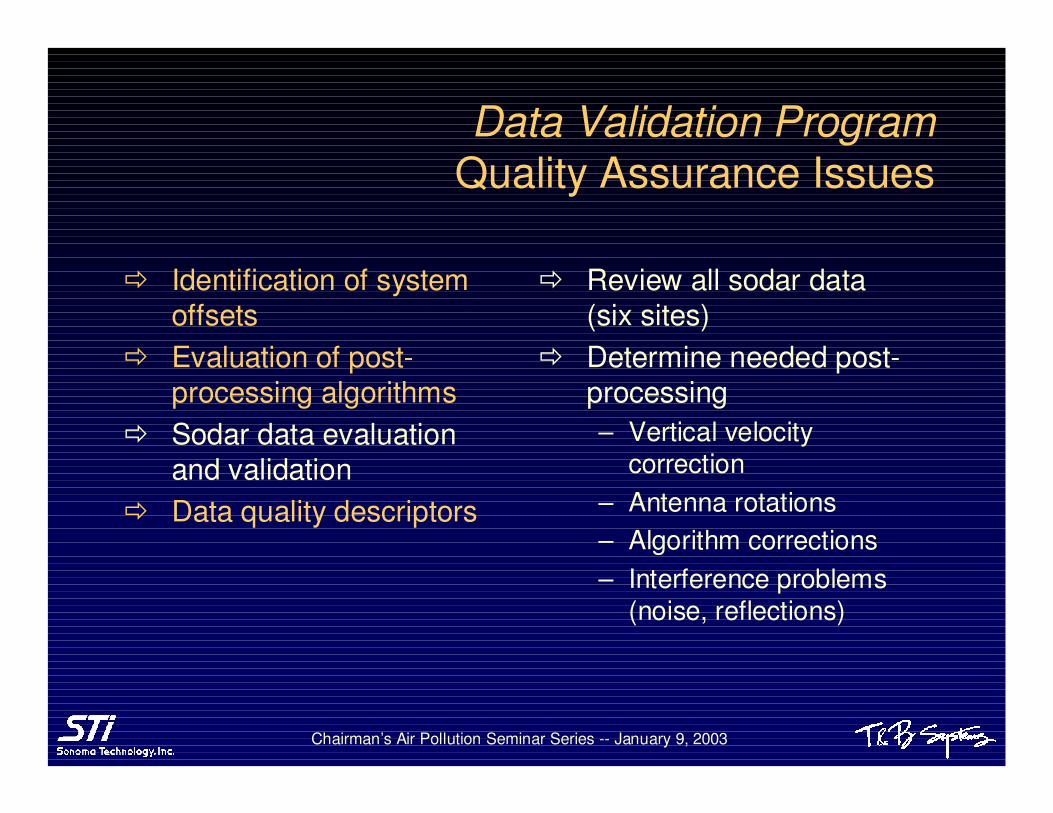
� Identification of system offsets
� Evaluation of post-processing algorithms
� Sodar data evaluation and validation
� Data quality descriptors
� Audit report and data header information– Antenna orientation– Surface vane orientation– Time zone differences– Reporting interval
differences
Data Validation ProgramQuality Assurance Issues
Chairman’s Air Pollution Seminar Series -- January 9, 2003
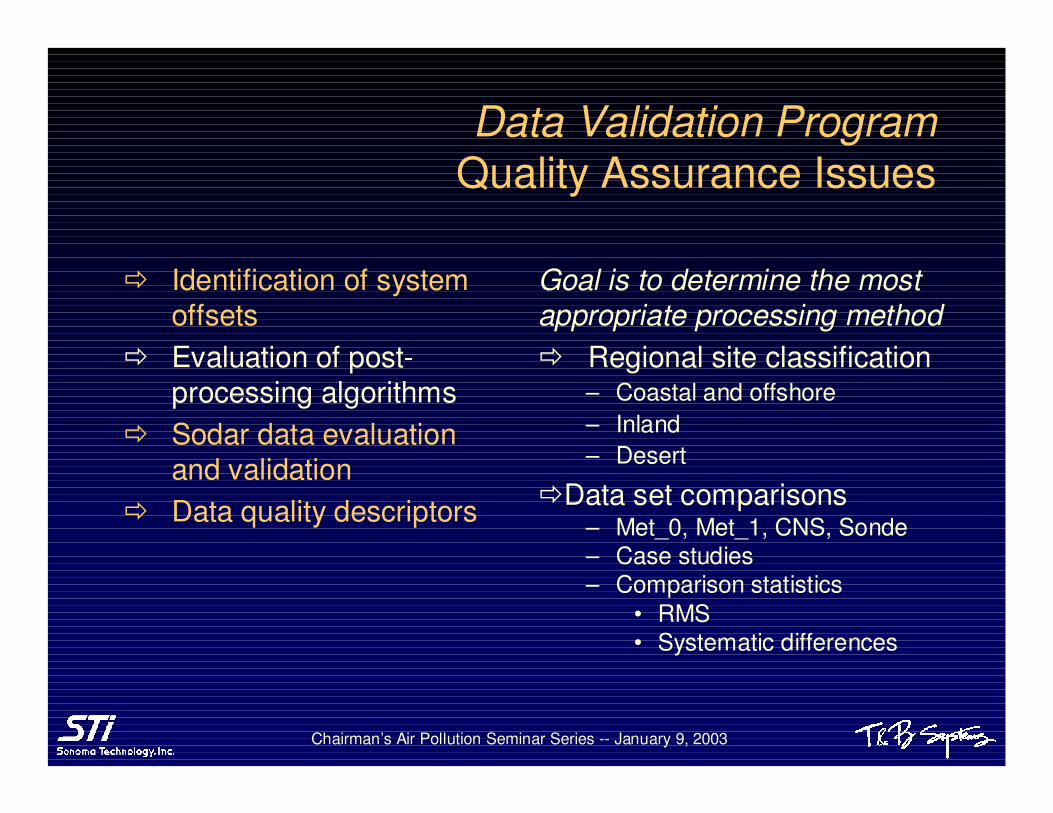
� Identification of system offsets
� Evaluation of post-processing algorithms
� Sodar data evaluation and validation
� Data quality descriptors
Goal is to determine the most appropriate processing method� Regional site classification
– Coastal and offshore– Inland– Desert
�Data set comparisons– Met_0, Met_1, CNS, Sonde– Case studies– Comparison statistics
• RMS• Systematic differences
Data Validation ProgramQuality Assurance Issues
Chairman’s Air Pollution Seminar Series -- January 9, 2003
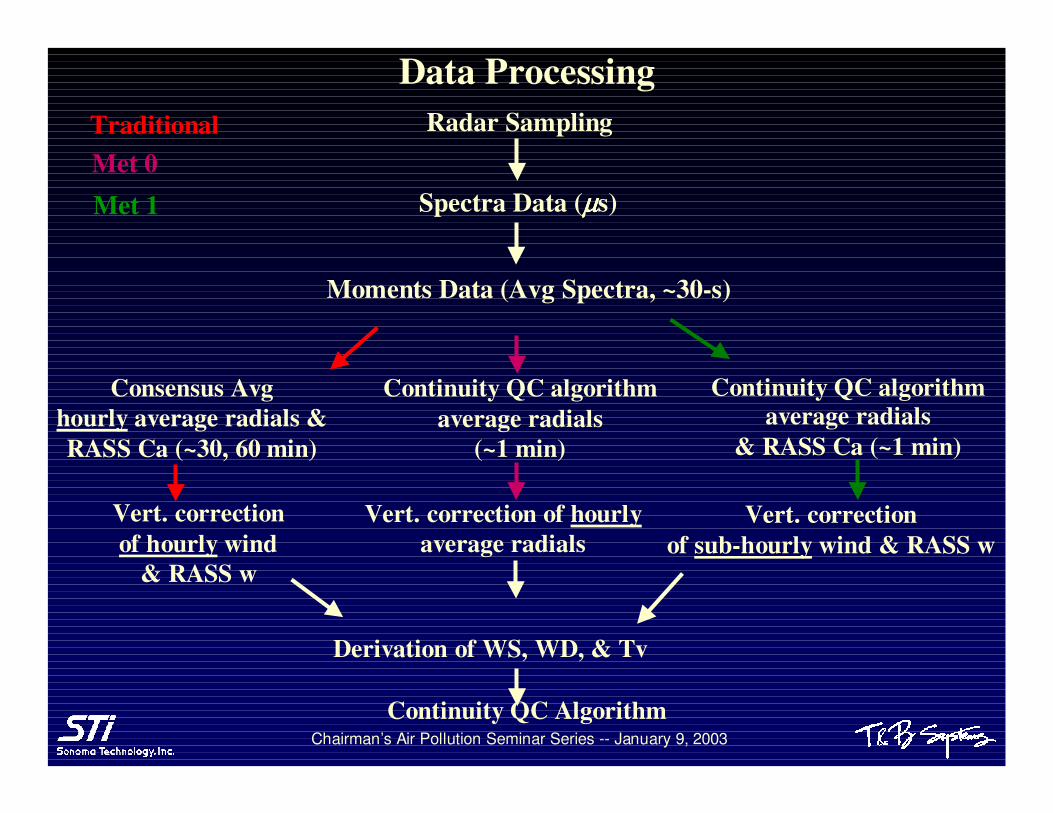
Data ProcessingRadar Sampling
Spectra Data (µµµµs)
Moments Data (Avg Spectra, ~30-s)
Consensus Avghourly average radials & RASS Ca (~30, 60 min)
Vert. correction of hourly wind
& RASS w
Traditional
Continuity QC Algorithm
Met 0
Vert. correction of hourlyaverage radials
Met 1
Continuity QC algorithmaverage radials
& RASS Ca (~1 min)
Derivation of WS, WD, & Tv
Vert. correction of sub-hourly wind & RASS w
Continuity QC algorithmaverage radials
(~1 min)
Chairman’s Air Pollution Seminar Series -- January 9, 2003
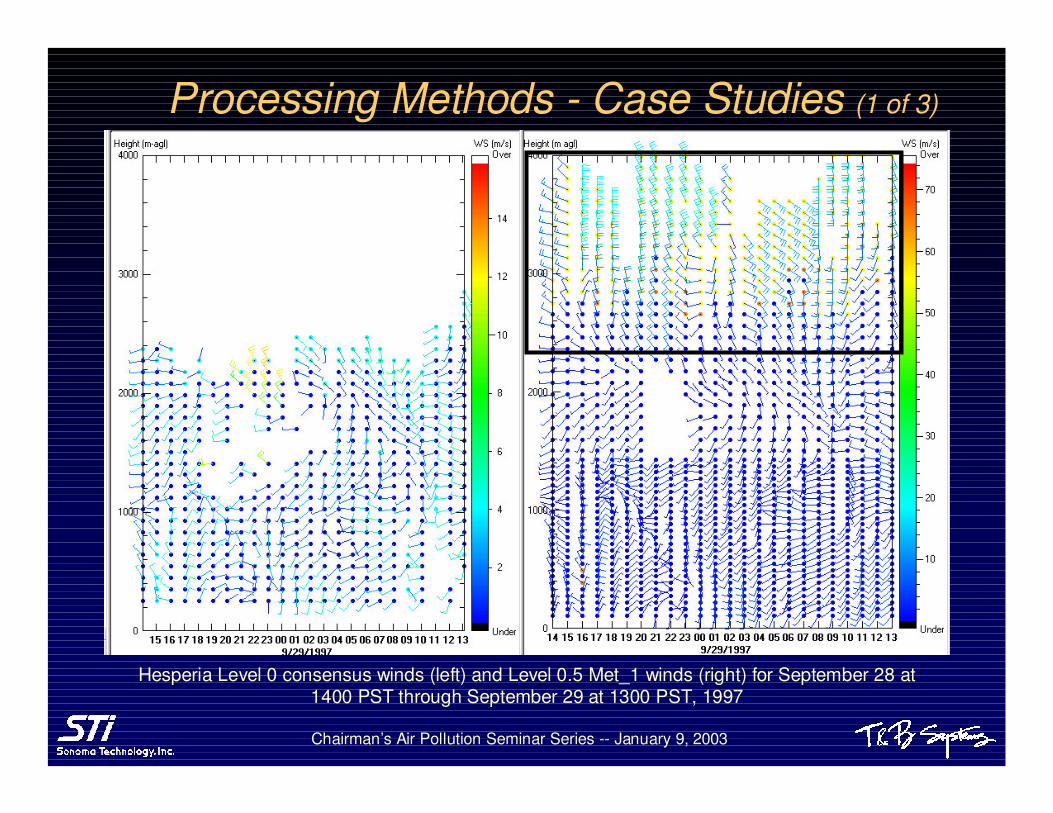
Processing Methods - Case Studies (1 of 3)
Hesperia Level 0 consensus winds (left) and Level 0.5 Met_1 winds (right) for September 28 at 1400 PST through September 29 at 1300 PST, 1997
Chairman’s Air Pollution Seminar Series -- January 9, 2003
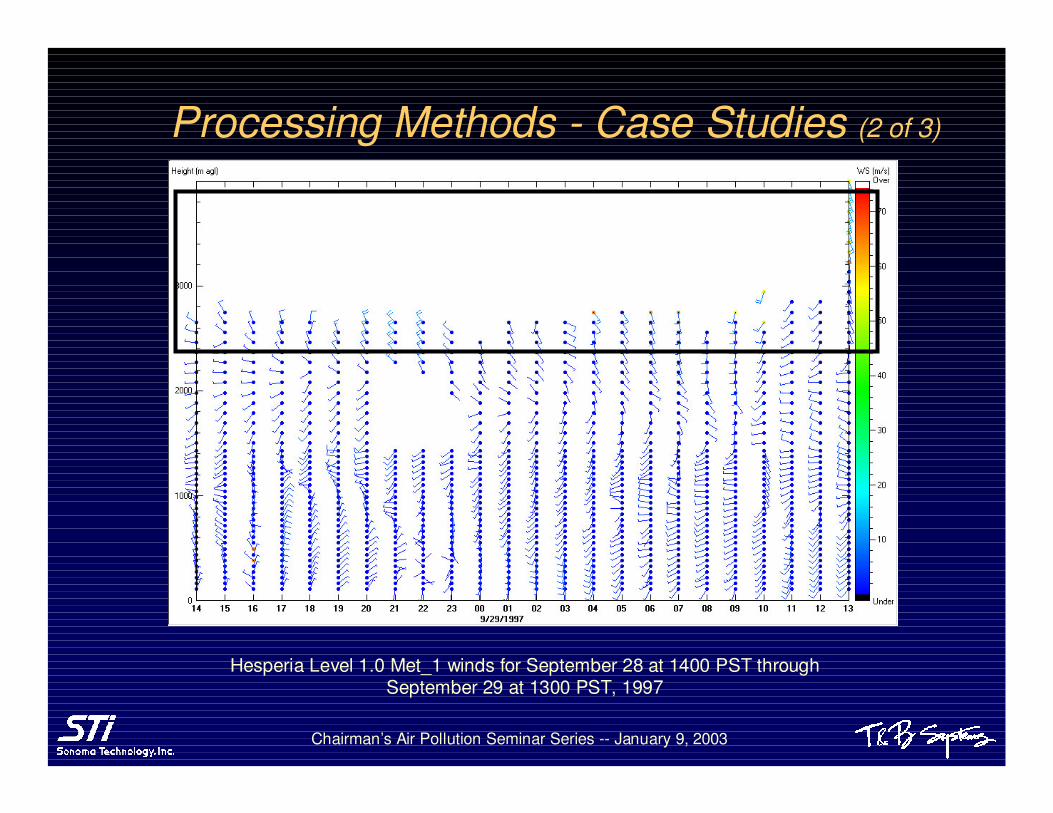
Hesperia Level 1.0 Met_1 winds for September 28 at 1400 PST through September 29 at 1300 PST, 1997
Processing Methods - Case Studies (2 of 3)
Chairman’s Air Pollution Seminar Series -- January 9, 2003
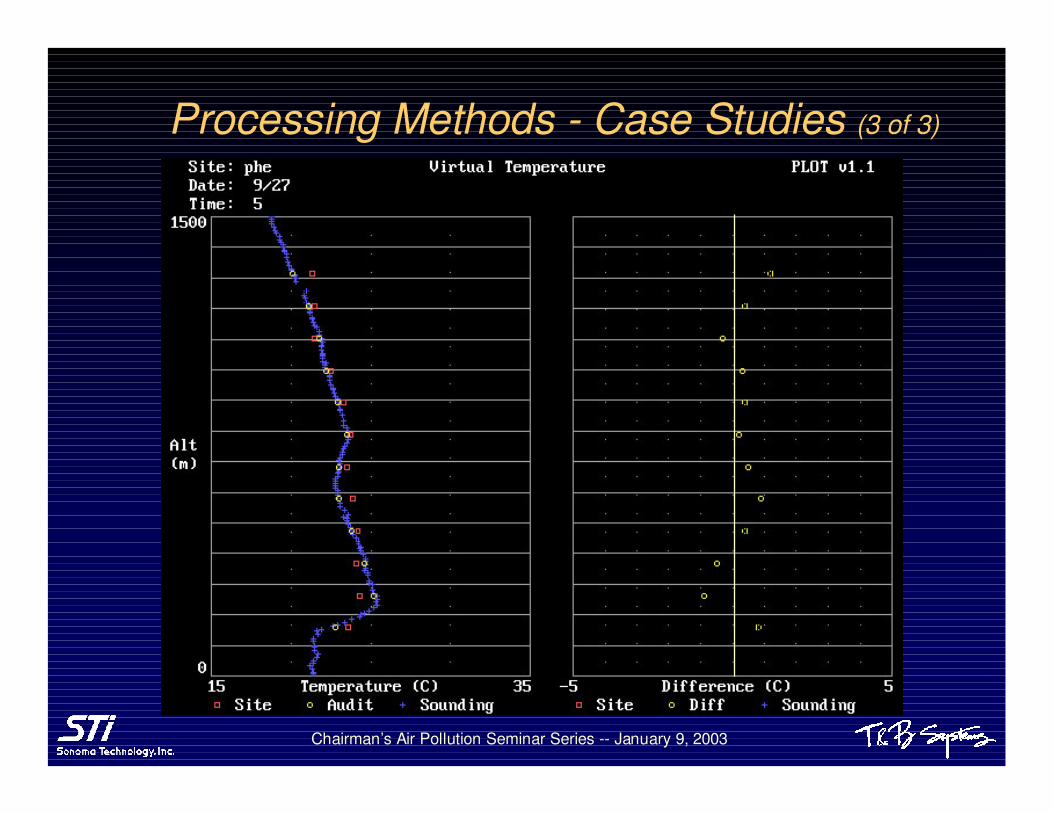
Processing Methods - Case Studies (3 of 3)
Chairman’s Air Pollution Seminar Series -- January 9, 2003
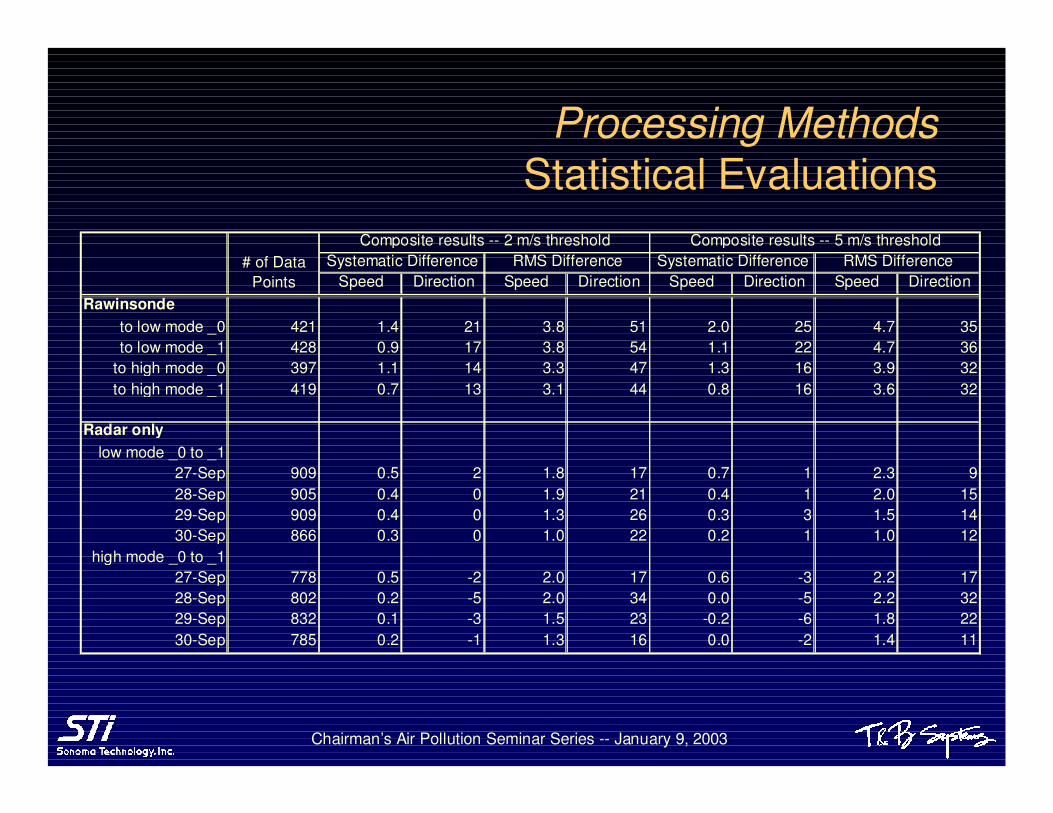
Speed Direction Speed Direction Speed Direction Speed DirectionRawinsonde
to low mode _0 421 1.4 21 3.8 51 2.0 25 4.7 35to low mode _1 428 0.9 17 3.8 54 1.1 22 4.7 36
to high mode _0 397 1.1 14 3.3 47 1.3 16 3.9 32to high mode _1 419 0.7 13 3.1 44 0.8 16 3.6 32
Radar onlylow mode _0 to _1
27-Sep 909 0.5 2 1.8 17 0.7 1 2.3 928-Sep 905 0.4 0 1.9 21 0.4 1 2.0 1529-Sep 909 0.4 0 1.3 26 0.3 3 1.5 1430-Sep 866 0.3 0 1.0 22 0.2 1 1.0 12
high mode _0 to _127-Sep 778 0.5 -2 2.0 17 0.6 -3 2.2 1728-Sep 802 0.2 -5 2.0 34 0.0 -5 2.2 3229-Sep 832 0.1 -3 1.5 23 -0.2 -6 1.8 2230-Sep 785 0.2 -1 1.3 16 0.0 -2 1.4 11
# of Data Points
Systematic Difference RMS DifferenceComposite results -- 2 m/s threshold Composite results -- 5 m/s threshold
Systematic Difference RMS Difference
Processing MethodsStatistical Evaluations

Chairman’s Air Pollution Seminar Series -- January 9, 2003
Processing MethodsOverall Conclusions
� Met_1 processing technique provided the most robust data set with the smallest differences when compared to the rawinsonde values for both winds and temperature in each geographic region
� Subsequent processing and data validation were performed using only the Met_1 data for each site,and additional flagging was implemented based on consensus and other criteria
Chairman’s Air Pollution Seminar Series -- January 9, 2003
� Identification of system offsets
� Evaluation of post-processing algorithms
� Sodar data evaluation and validation
� Data quality descriptors
� Review all sodar data (six sites)
� Determine needed post-processing– Vertical velocity
correction– Antenna rotations– Algorithm corrections– Interference problems
(noise, reflections)
Data Validation ProgramQuality Assurance Issues
Chairman’s Air Pollution Seminar Series -- January 9, 2003
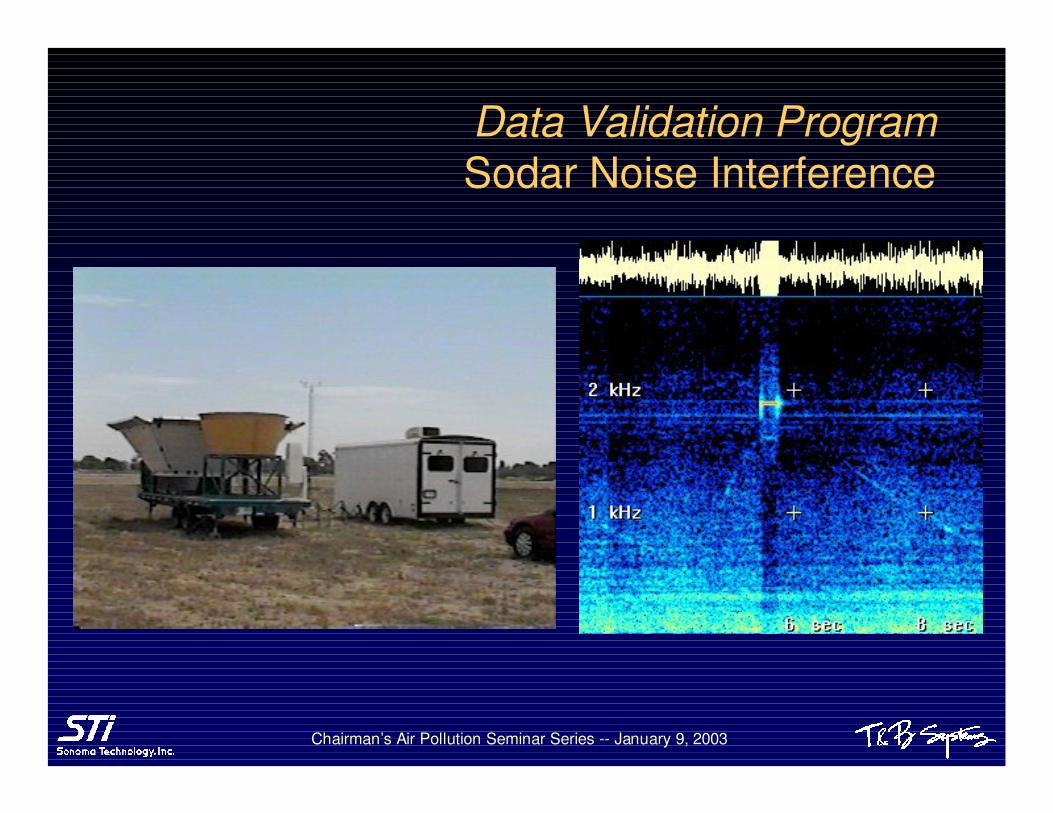
Data Validation ProgramSodar Noise Interference
Chairman’s Air Pollution Seminar Series -- January 9, 2003
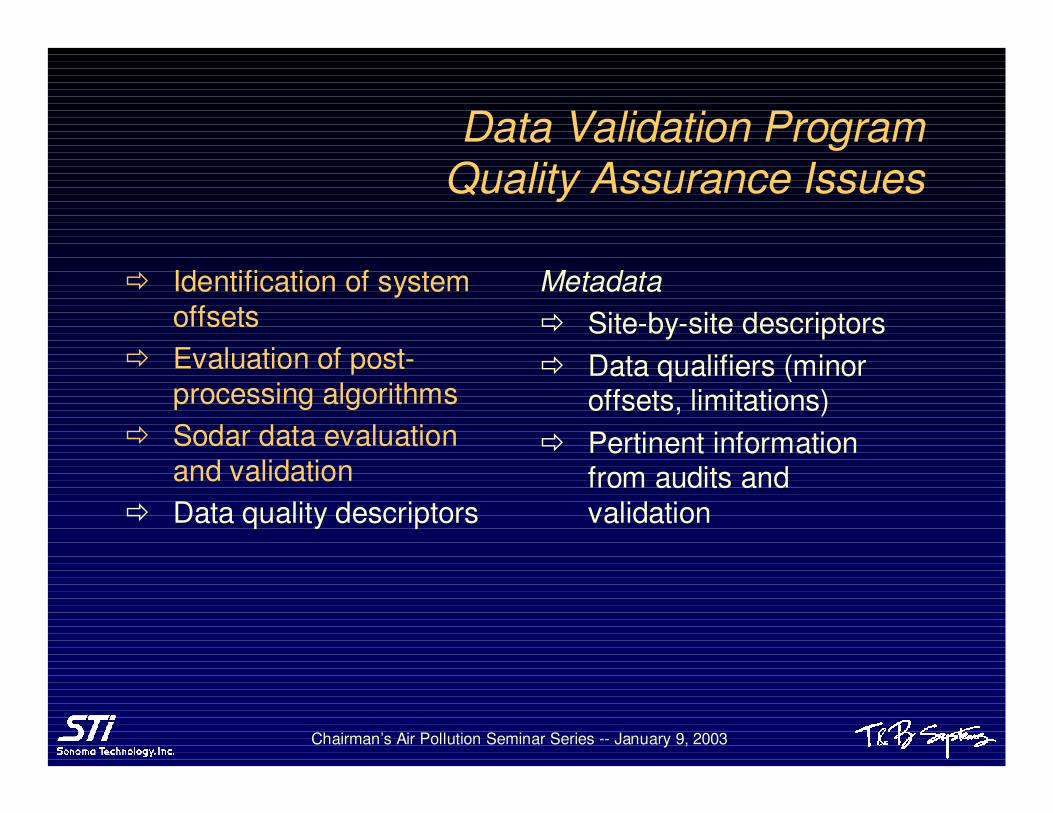
� Identification of system offsets
� Evaluation of post-processing algorithms
� Sodar data evaluation and validation
� Data quality descriptors
Metadata� Site-by-site descriptors� Data qualifiers (minor
offsets, limitations)� Pertinent information
from audits and validation
Data Validation ProgramQuality Assurance Issues
Chairman’s Air Pollution Seminar Series -- January 9, 2003
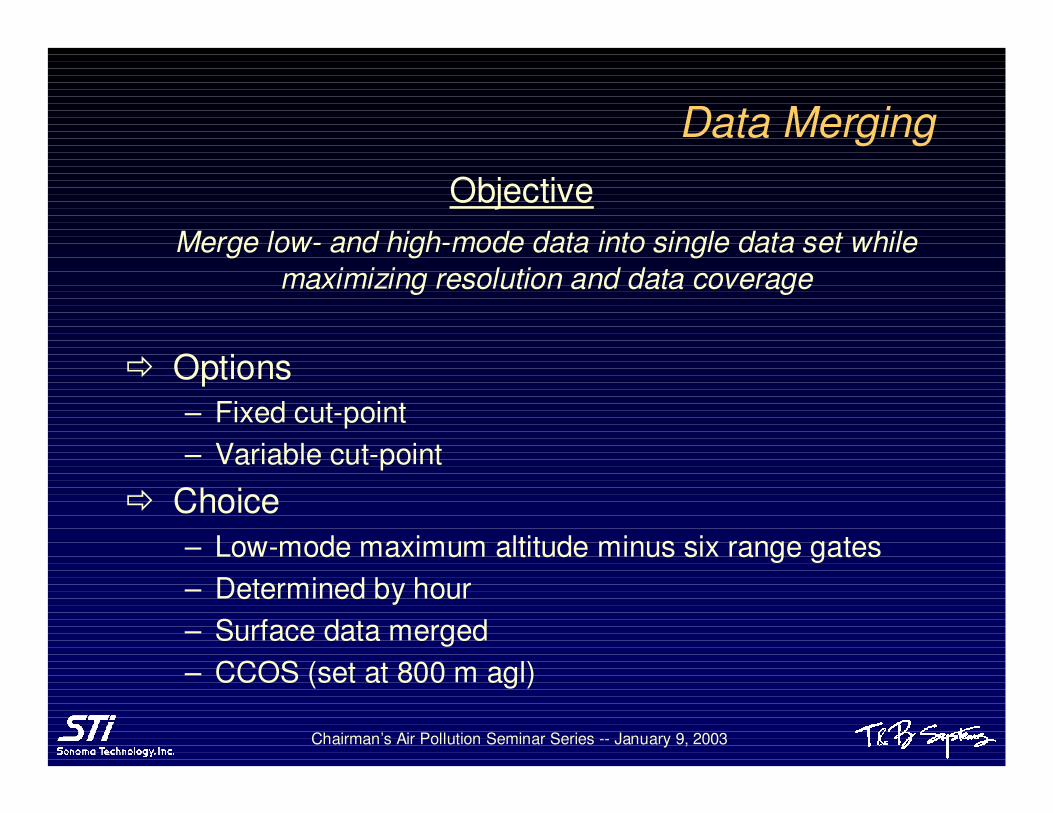
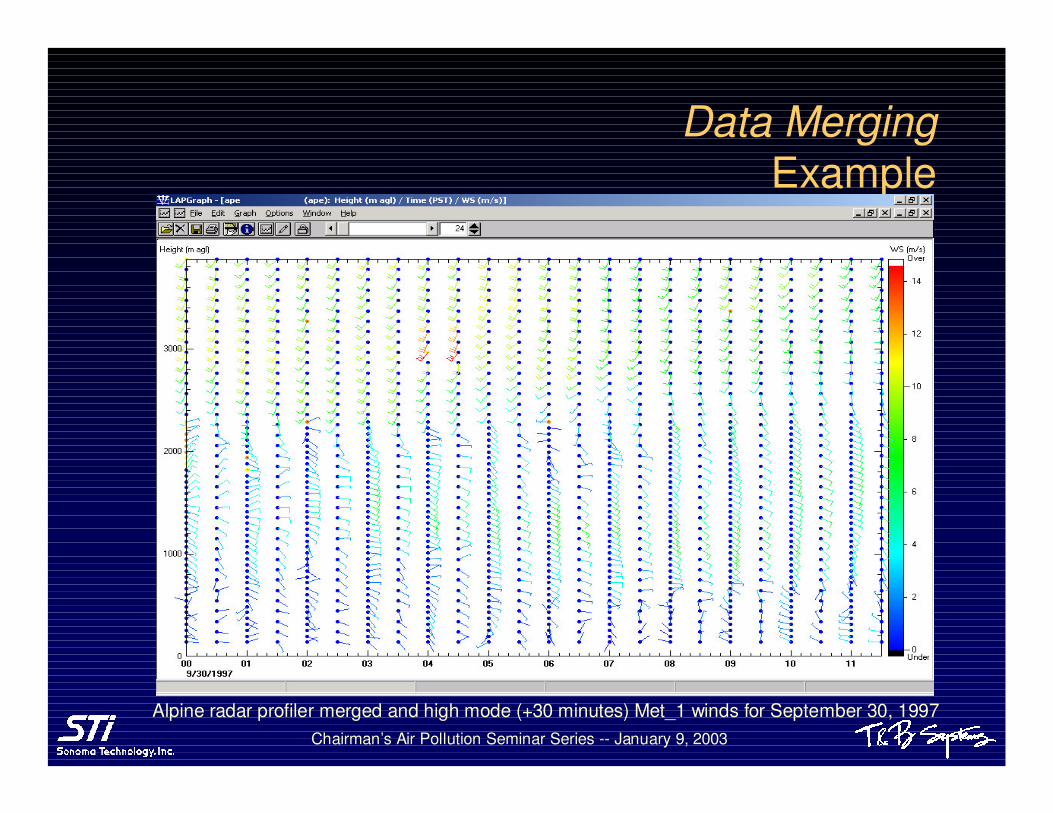
Data MergingObjective
Merge low- and high-mode data into single data set while maximizing resolution and data coverage
� Options– Fixed cut-point – Variable cut-point
� Choice– Low-mode maximum altitude minus six range gates– Determined by hour– Surface data merged– CCOS (set at 800 m agl)
Chairman’s Air Pollution Seminar Series -- January 9, 2003
Data MergingExample
Alpine radar profiler merged and high mode (+30 minutes) Met_1 winds for September 30, 1997
Chairman’s Air Pollution Seminar Series -- January 9, 2003
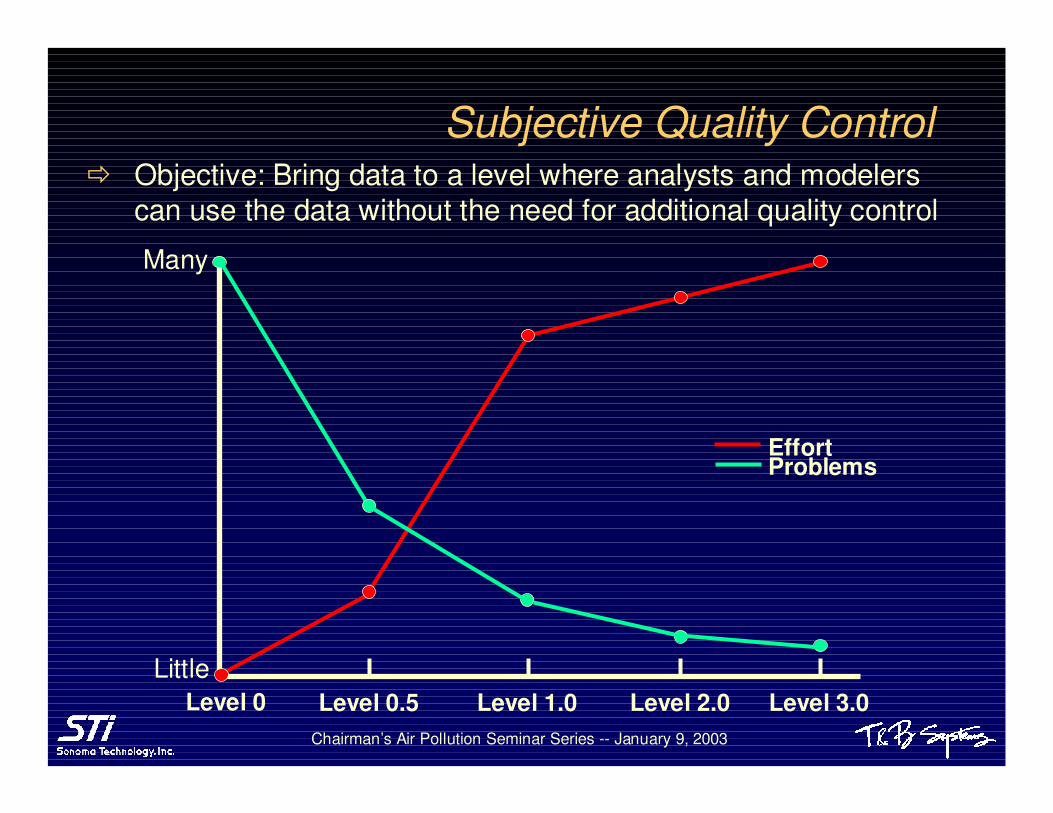
Subjective Quality Control� Objective: Bring data to a level where analysts and modelers
can use the data without the need for additional quality control
Level 0 Level 0.5 Level 1.0 Level 2.0 Level 3.0
EffortProblems
Little
Many
Chairman’s Air Pollution Seminar Series -- January 9, 2003
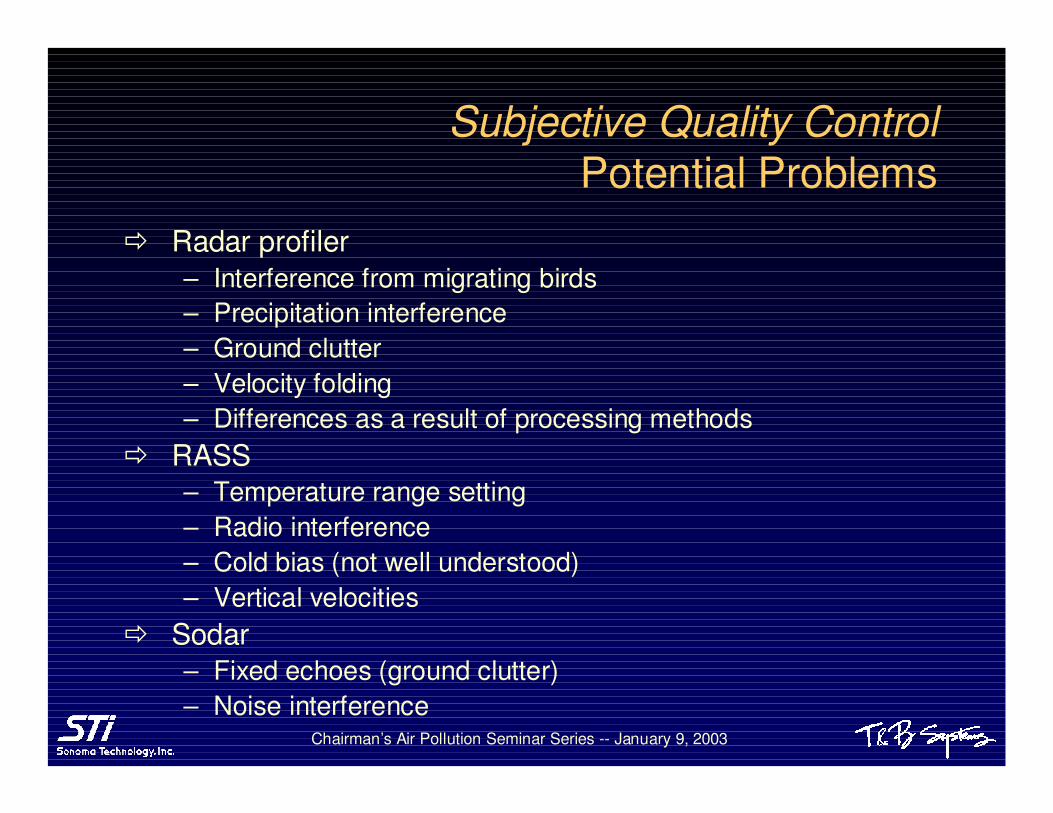
� Radar profiler– Interference from migrating birds– Precipitation interference– Ground clutter– Velocity folding – Differences as a result of processing methods
� RASS– Temperature range setting– Radio interference– Cold bias (not well understood)– Vertical velocities
� Sodar– Fixed echoes (ground clutter)– Noise interference
Subjective Quality ControlPotential Problems
Chairman’s Air Pollution Seminar Series -- January 9, 2003
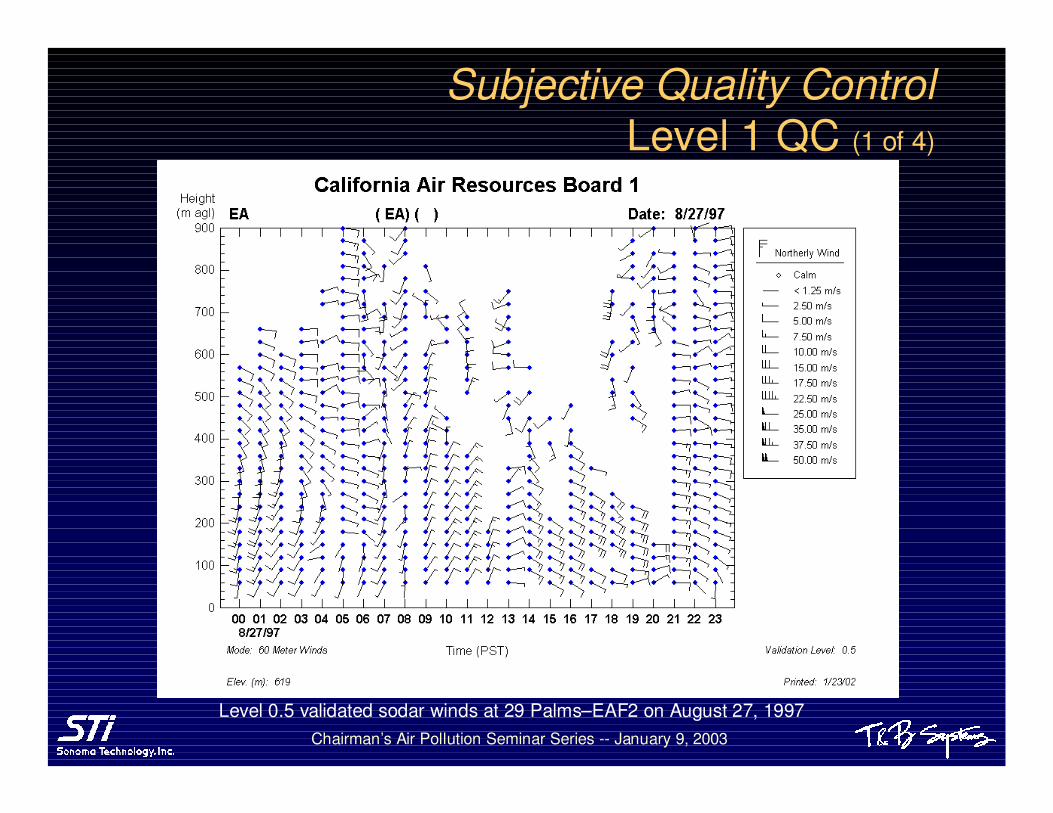
Subjective Quality ControlLevel 1 QC (1 of 4)
Level 0.5 validated sodar winds at 29 Palms–EAF2 on August 27, 1997
Chairman’s Air Pollution Seminar Series -- January 9, 2003
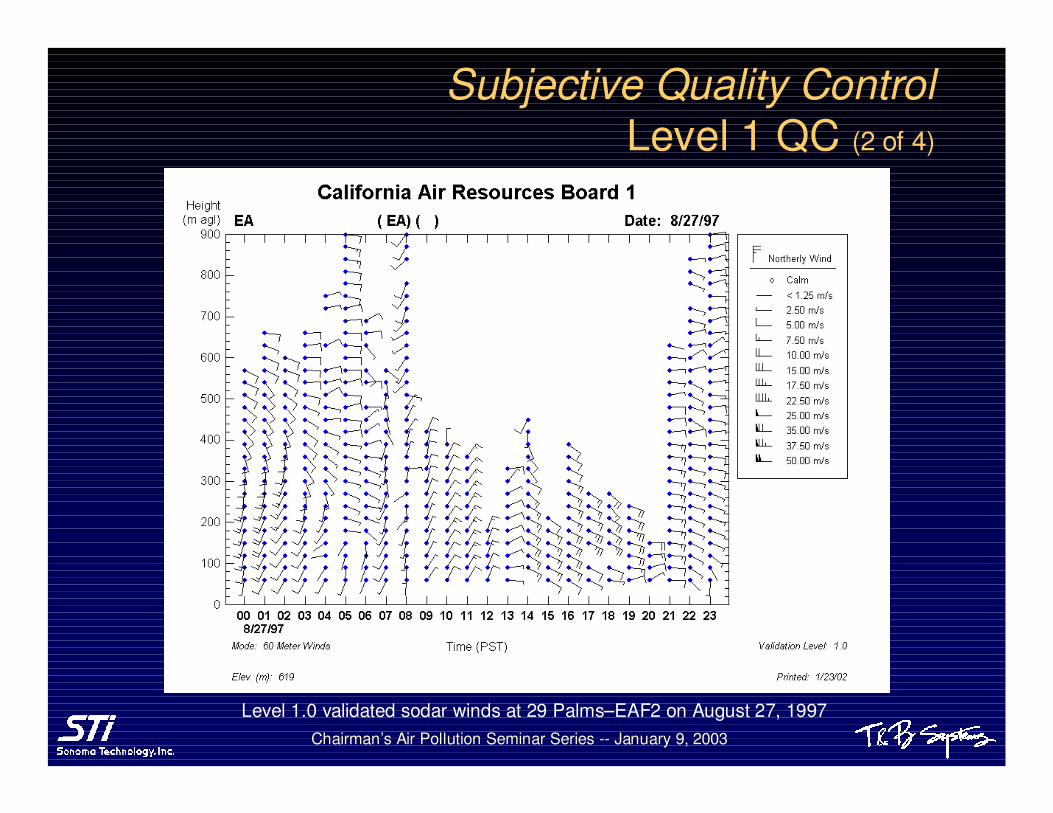
Level 1.0 validated sodar winds at 29 Palms–EAF2 on August 27, 1997
Subjective Quality ControlLevel 1 QC (2 of 4)
Chairman’s Air Pollution Seminar Series -- January 9, 2003
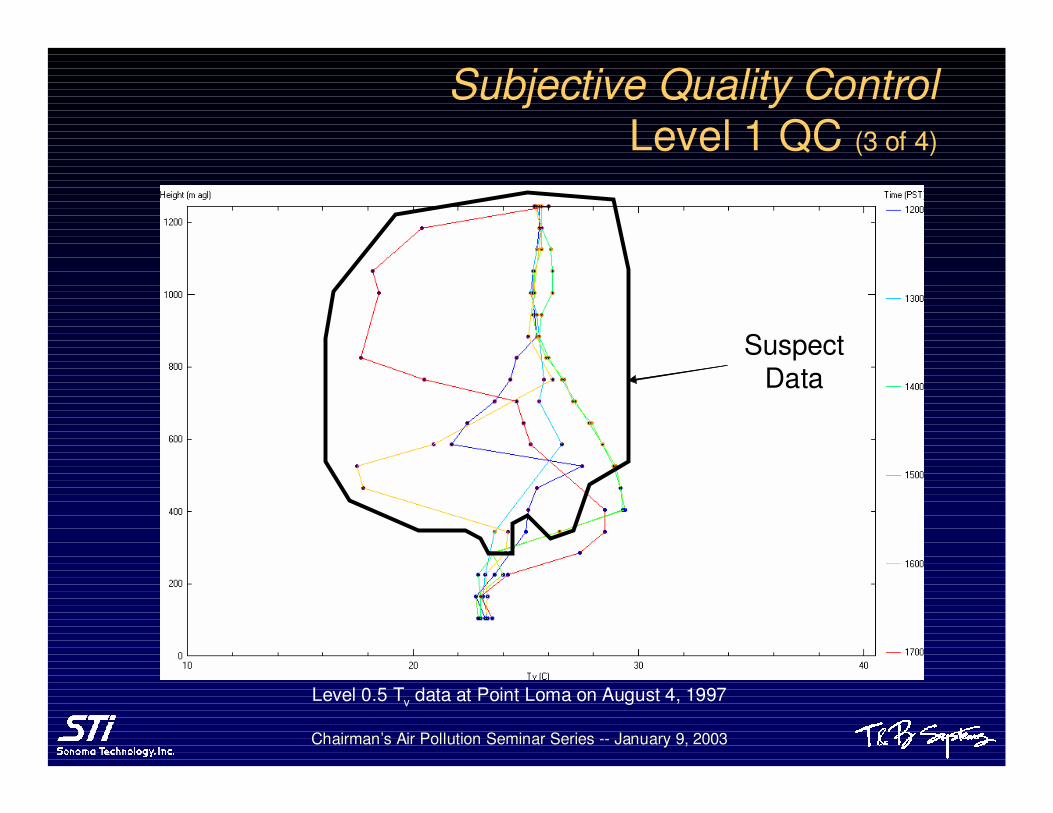
SuspectData
SuspectData
Level 0.5 Tv data at Point Loma on August 4, 1997
Subjective Quality ControlLevel 1 QC (3 of 4)
Chairman’s Air Pollution Seminar Series -- January 9, 2003
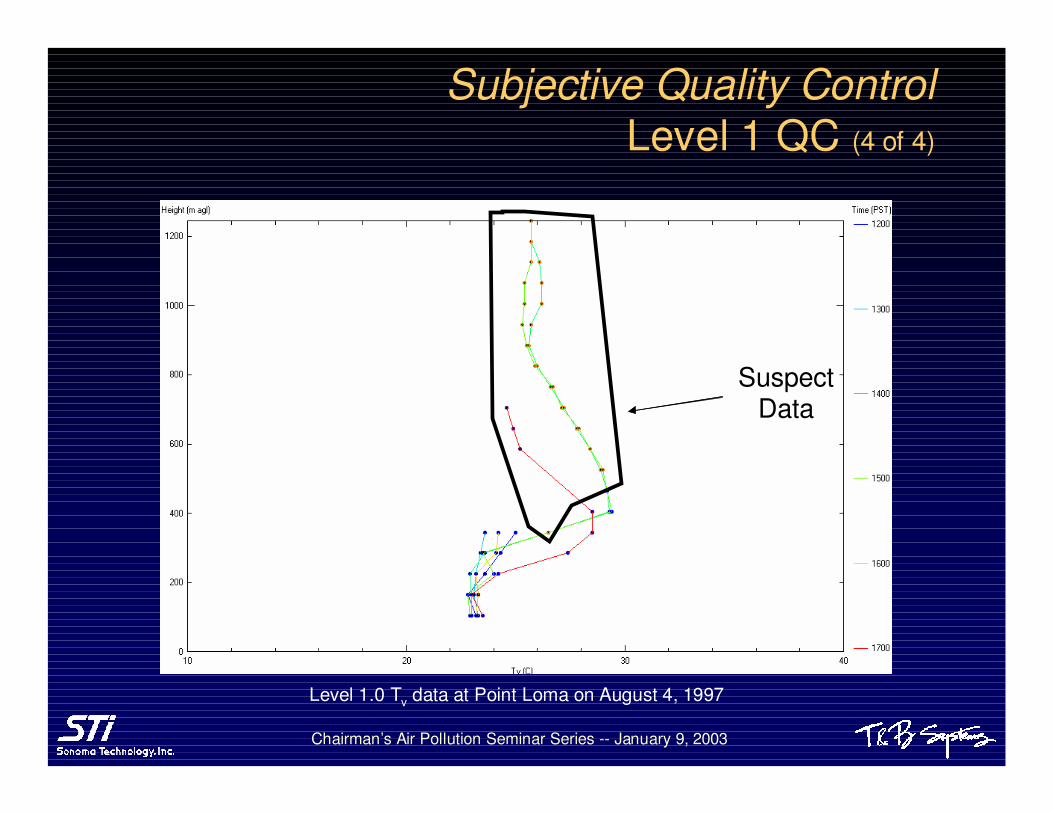
SuspectData
SuspectData
Level 1.0 Tv data at Point Loma on August 4, 1997
Subjective Quality ControlLevel 1 QC (4 of 4)
Chairman’s Air Pollution Seminar Series -- January 9, 2003
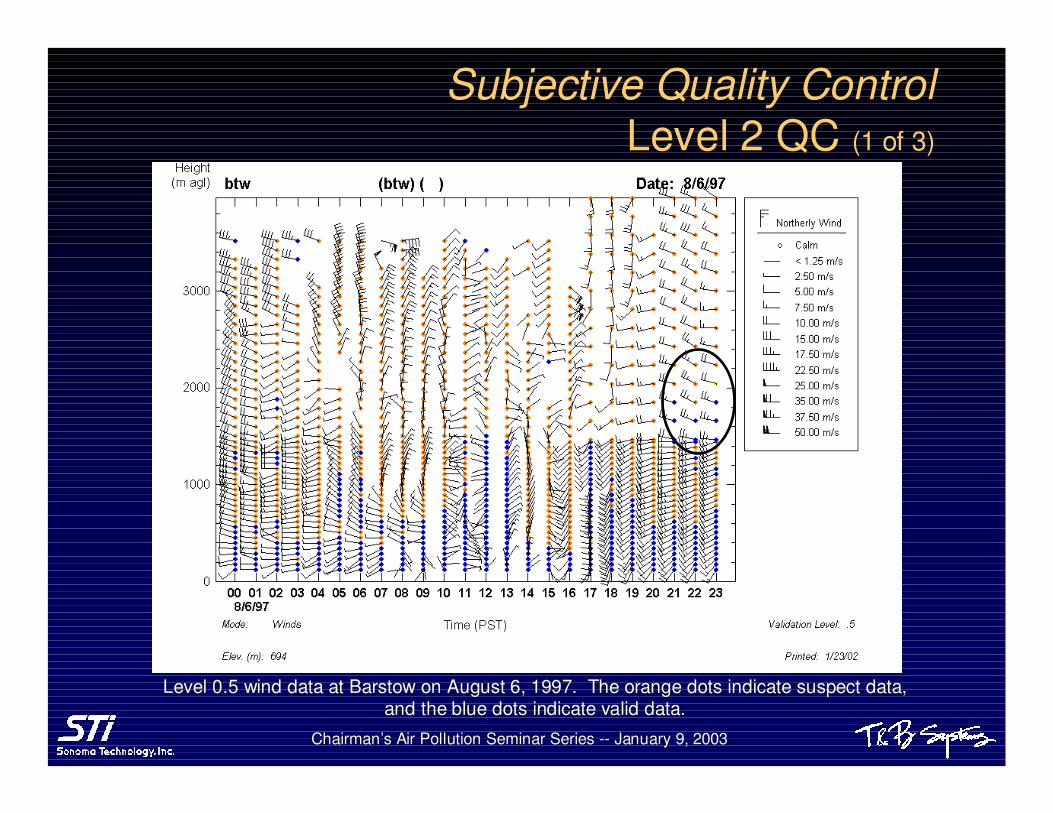
Level 0.5 wind data at Barstow on August 6, 1997. The orange dots indicate suspect data, and the blue dots indicate valid data.
Subjective Quality ControlLevel 2 QC (1 of 3)

Chairman’s Air Pollution Seminar Series -- January 9, 2003
EDAS model wind data at 0600 UTC (2200 PST) at 800 mb (right) and Level 1.0 wind data at Hesperia on August 6, 1997 (left).
Subjective Quality ControlLevel 2 QC (2 of 3)
Chairman’s Air Pollution Seminar Series -- January 9, 2003
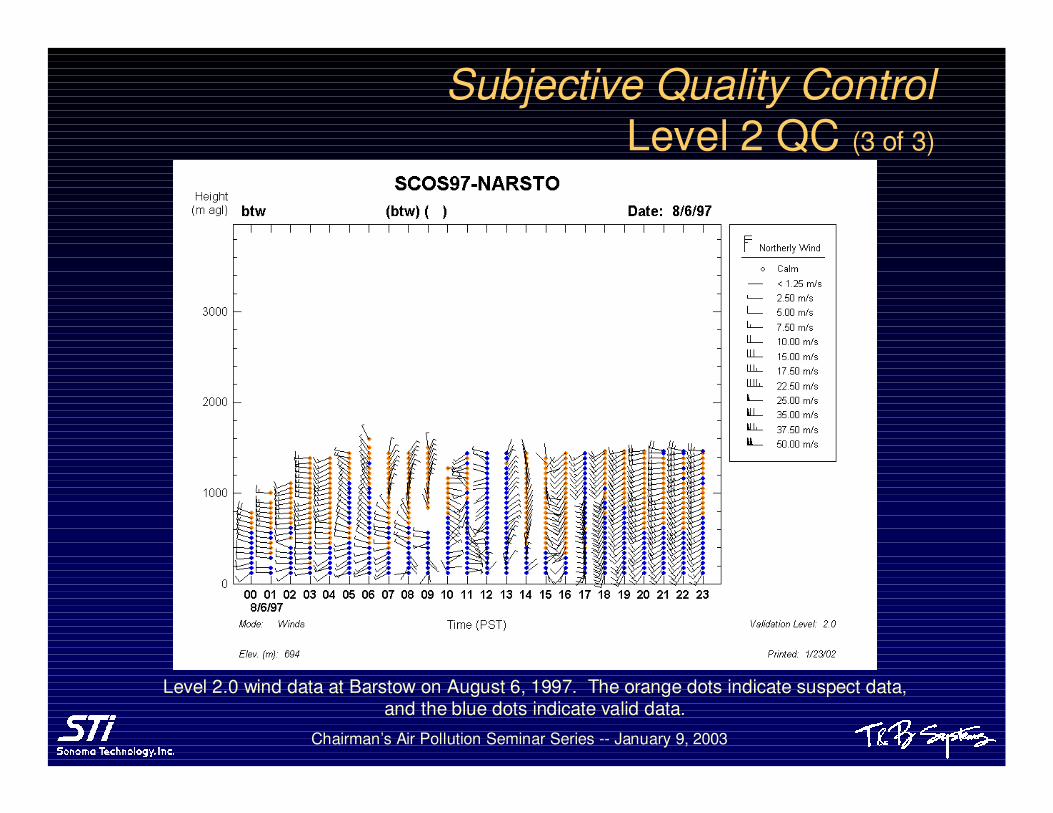
Level 2.0 wind data at Barstow on August 6, 1997. The orange dots indicate suspect data, and the blue dots indicate valid data.
Subjective Quality ControlLevel 2 QC (3 of 3)

Chairman’s Air Pollution Seminar Series -- January 9, 2003
Subjective Quality ControlFlags
QC Flag Meaning Criteria Notes Recommendation for
use of data
0 Valid Passed all subjective and objective QC.
Can be used with high confidence at Level 1.0 and Level 2.0 validation*.
5 Suspect
Passed initial QC processing. Collected above 2000 m agl. Collocated consensus data was invalid. Passed signal-to-noise criteria. Passed all subjective QC.
Data below 2000 m agl was not addressed by this code because consensus might fail due to significant sub-hourly wind shifts often observed within the boundary layer.
Can be used with moderate confidence at Level 1.0 validation* and higher confidence at Level 2.0 validation*.
6 Suspect
Passed initial QC processing. Collocated consensus data invalid. Failed signal-to-noise criteria. Passed all subjective QC.
Can be used with moderate confidence at Level 1.0 validation* and higher confidence at Level 2.0 validation*.
7 Suspect
Passed all objective QC. Not clearly invalid or valid based on subjective QC or data appears valid but with unresolved processing issues.
Can be used with moderate confidence at Level 1.0 validation* and higher confidence at Level 2.0 validation*.
8 Invalid Failed either objective or subjective QC. Data values are –980.0. Do not use.
9 Missing Data values are –999.0. Do not use.
Chairman’s Air Pollution Seminar Series -- January 9, 2003
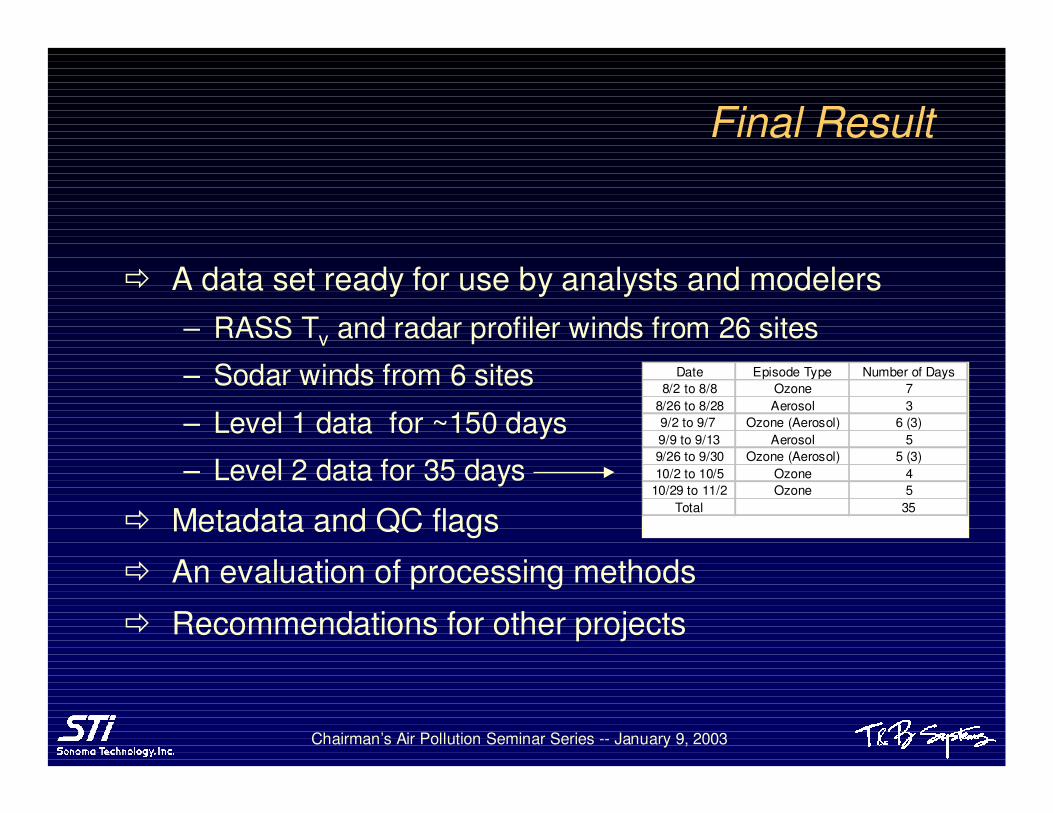
Final Result
� A data set ready for use by analysts and modelers– RASS Tv and radar profiler winds from 26 sites
– Sodar winds from 6 sites
– Level 1 data for ~150 days
– Level 2 data for 35 days
� Metadata and QC flags
� An evaluation of processing methods
� Recommendations for other projects
Date Episode Type Number of Days8/2 to 8/8 Ozone 7
8/26 to 8/28 Aerosol 39/2 to 9/7 Ozone (Aerosol) 6 (3)9/9 to 9/13 Aerosol 59/26 to 9/30 Ozone (Aerosol) 5 (3)10/2 to 10/5 Ozone 4
10/29 to 11/2 Ozone 5Total 35

Chairman’s Air Pollution Seminar Series -- January 9, 2003
Data Validation ProgramOverall Recommendations
� Audits at each station
� Consistent procedures implemented by each audit group
� Implementation and adherence to SOPs by all study organizations
� Thorough on-site documentation process in both the operations and QA
� Use of proven data processing methods
� Review of data in “real-time”
� Frequent objective and subjective quality control
� Production of one unified data set

Chairman’s Air Pollution Seminar Series -- January 9, 2003
Specific IdeasPlans and Audits
� Realistic monitoring plans– Checklists– SOPs– Audit program
� Cost-effective, alternative audit methods– Systems audits of all sites– Network assessment for number of
performance audits– Simple pibal soundings– Simple tethered sensors – Adjacent towers or soundings
Chairman’s Air Pollution Seminar Series -- January 9, 2003
Specific Ideas Advanced Data Processing Techniques
�Uses the SCOS97 processing lessons learned� Implements techniques to recover data lost in the
traditional (consensus) methods�Can be implemented in real-time to increase the
efficiency in data collection and analysis

Chairman’s Air Pollution Seminar Series -- January 9, 2003
Specific Ideas Processing Techniques - Consensus Data

Chairman’s Air Pollution Seminar Series -- January 9, 2003
Specific Ideas Processing Techniques - Met_1 Data
Chairman’s Air Pollution Seminar Series -- January 9, 2003
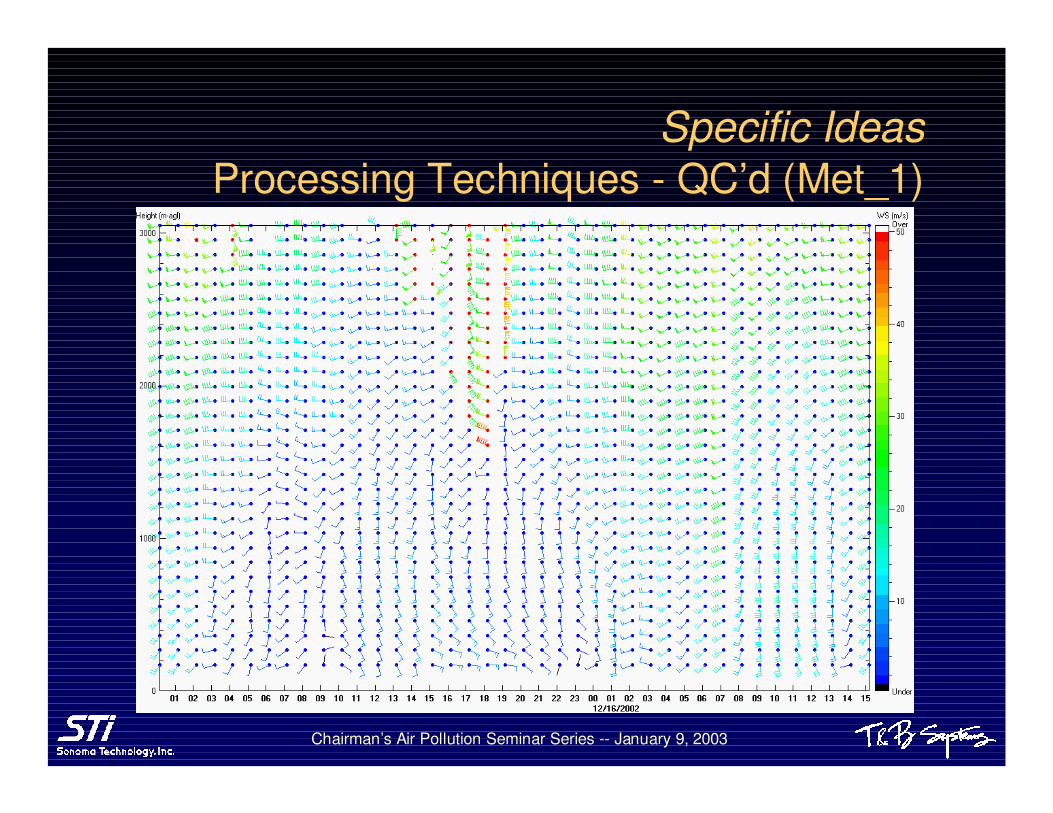
Specific Ideas Processing Techniques - QC’d (Met_1)
Chairman’s Air Pollution Seminar Series -- January 9, 2003
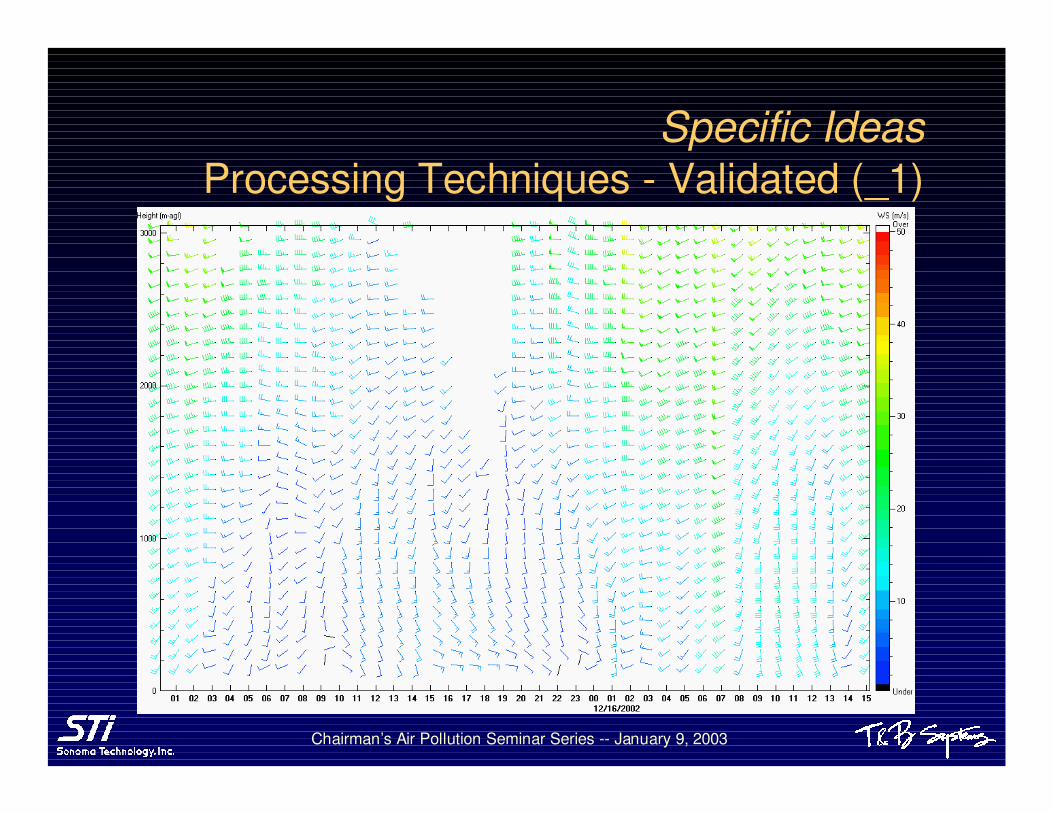
Specific Ideas Processing Techniques - Validated (_1)
Chairman’s Air Pollution Seminar Series -- January 9, 2003
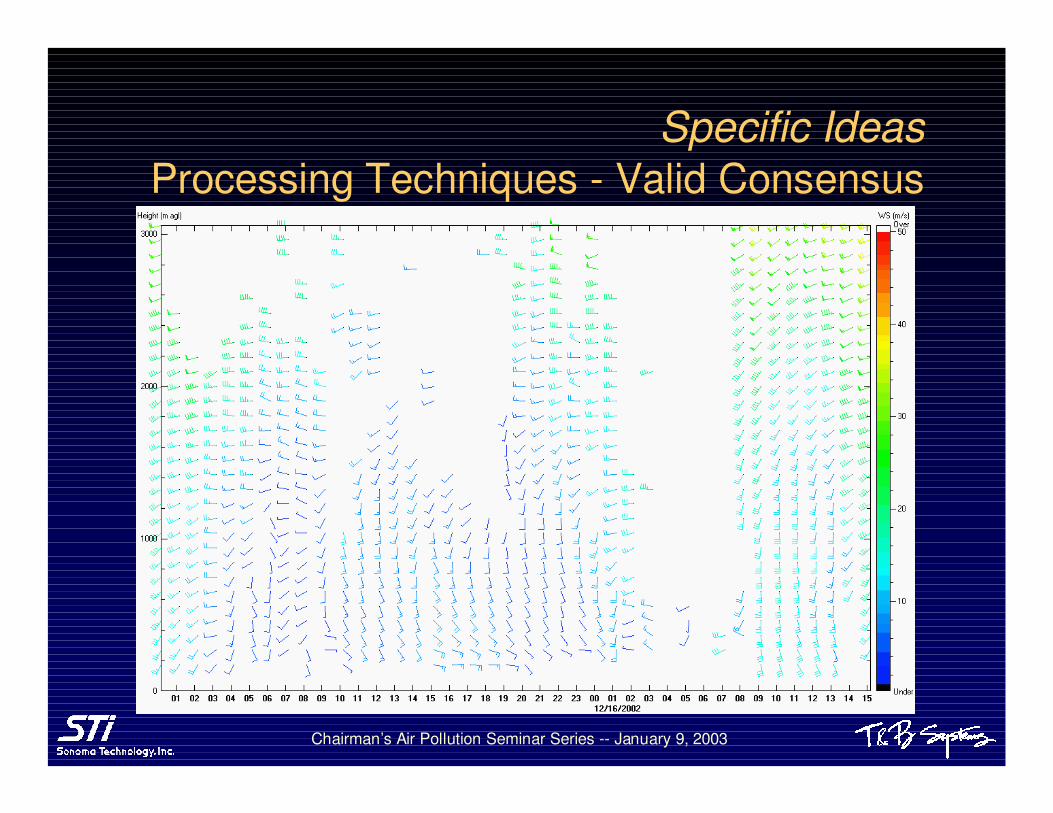
Specific Ideas Processing Techniques - Valid Consensus
Chairman’s Air Pollution Seminar Series -- January 9, 2003
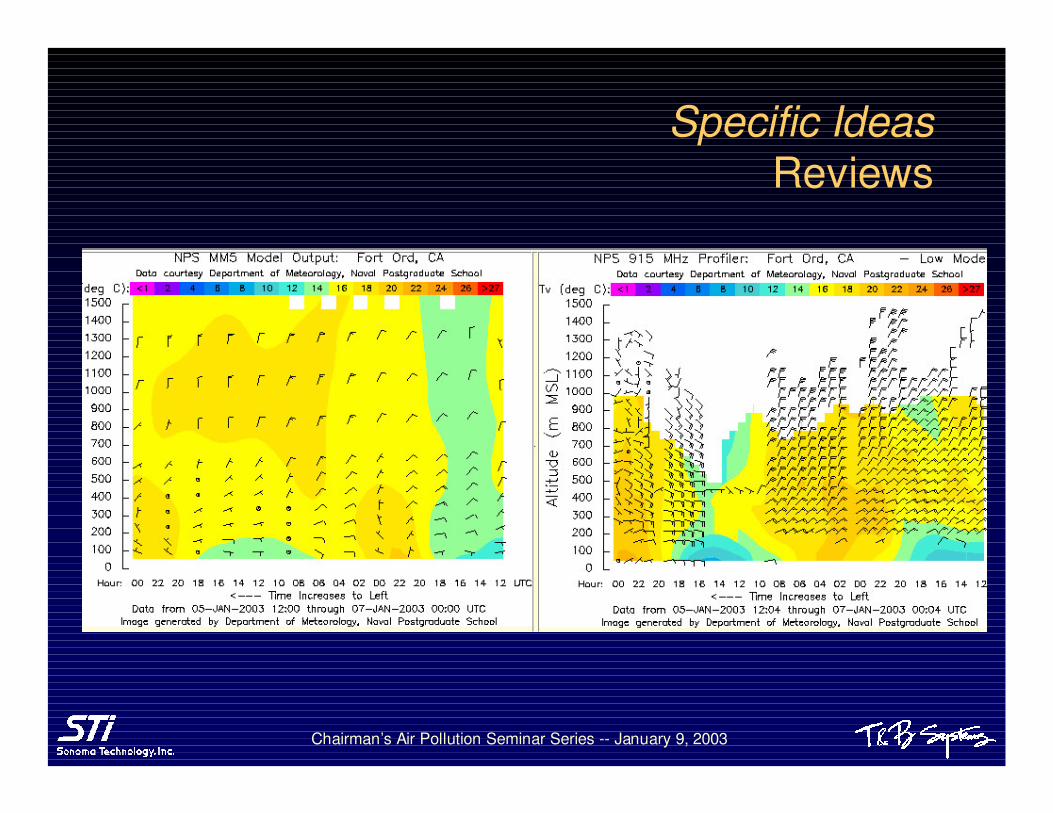
� Real-time data reviews (objective and subjective)– Automatic site-to-site comparisons– Model-to-site comparisons
� Additional products (real-time and historic)– Site analyses
• Wind runs• Mixing
– Spatial analyses • Modeling (prognostic nudging or diagnostic)• Trajectories• Mixing
Specific IdeasReviews and Products
Chairman’s Air Pollution Seminar Series -- January 9, 2003
Specific Ideas Reviews
Chairman’s Air Pollution Seminar Series -- January 9, 2003
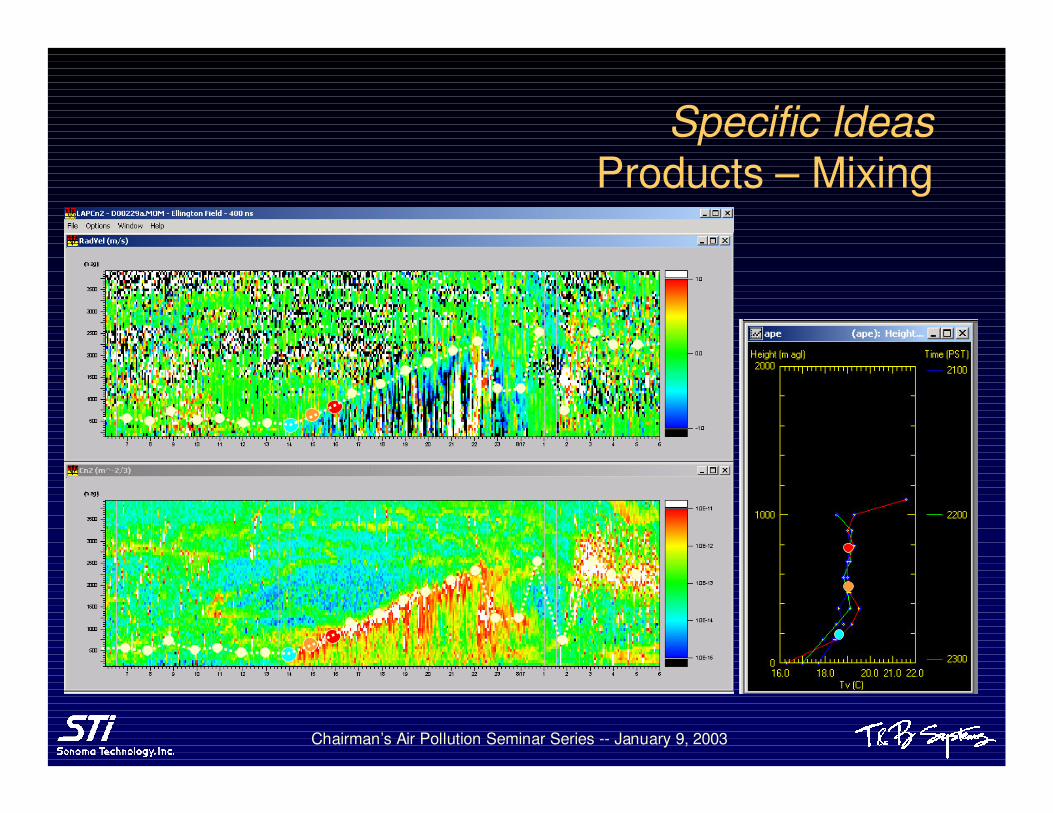
Specific Ideas Products – Mixing
Chairman’s Air Pollution Seminar Series -- January 9, 2003
9/4/97 at 0300 PST
9/4/97 at 1000 PST
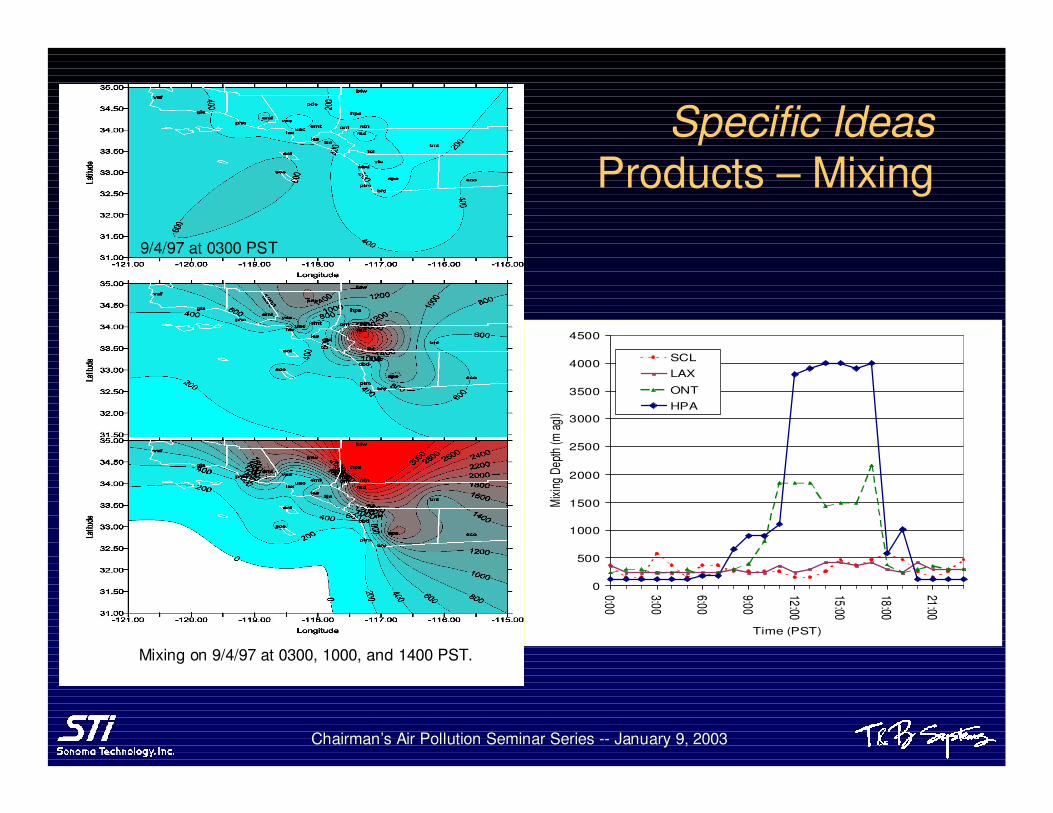
Mixing on 9/4/97 at 0300, 1000, and 1400 PST.
0
500
1000
1500
2000
2500
3000
3500
4000
4500
0:00
3:00
6:00
9:00
12:00
15:00
18:00
21:00
Time (PST)
Mixi
ng D
epth
(m ag
l)
SCL
LAX
ONT
HPA
Specific Ideas Products – Mixing
Chairman’s Air Pollution Seminar Series -- January 9, 2003
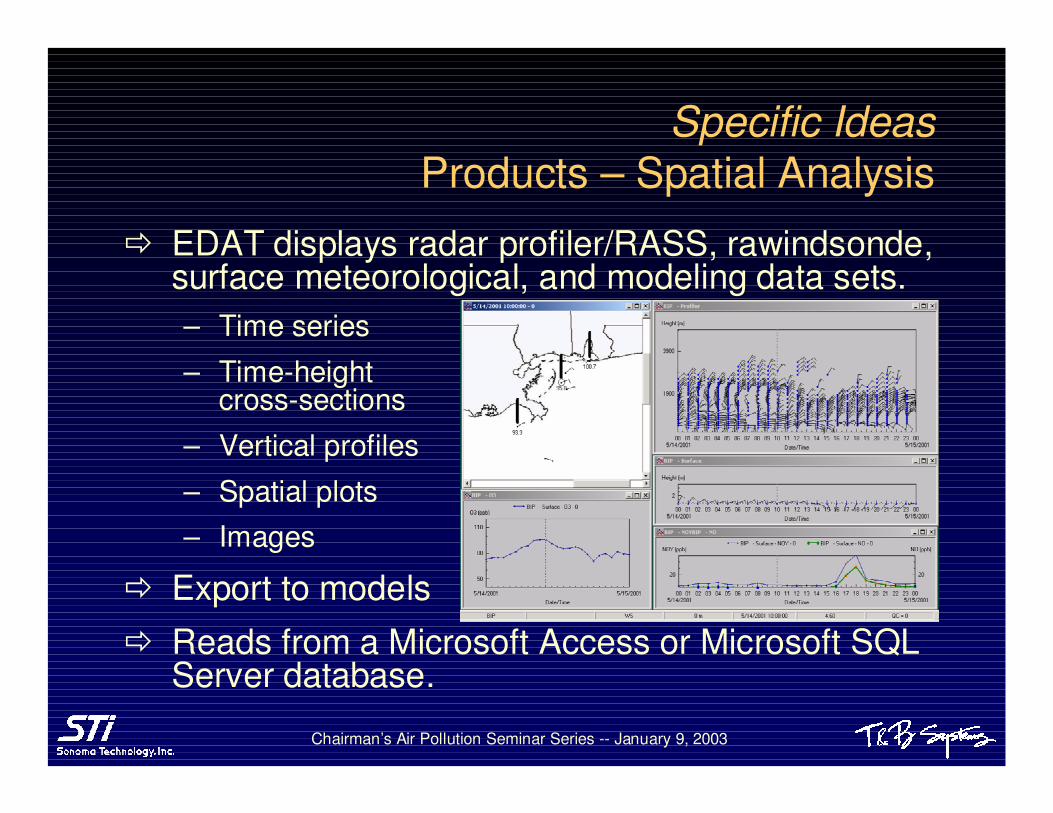
� EDAT displays radar profiler/RASS, rawindsonde, surface meteorological, and modeling data sets. – Time series
– Time-height cross-sections
– Vertical profiles
– Spatial plots– Images
� Export to models
� Reads from a Microsoft Access or Microsoft SQL Server database.
Specific Ideas Products – Spatial Analysis
Chairman’s Air Pollution Seminar Series -- January 9, 2003
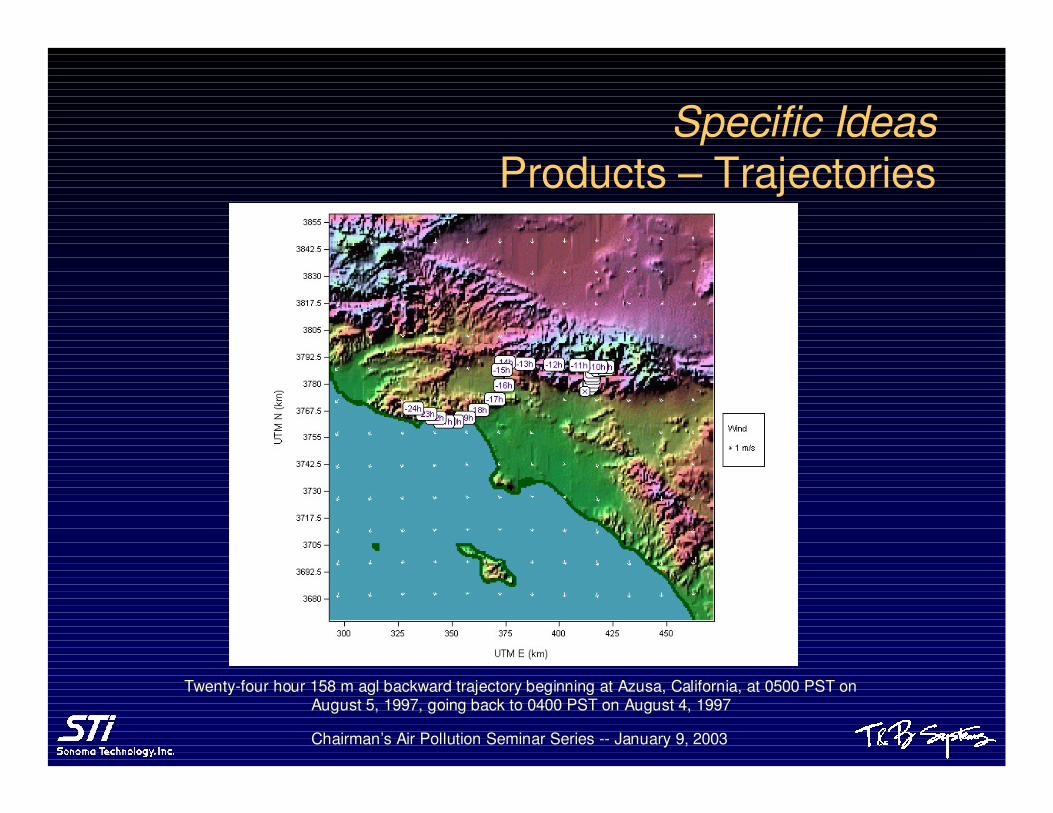
Specific Ideas Products – Trajectories
Twenty-four hour 158 m agl backward trajectory beginning at Azusa, California, at 0500 PST on August 5, 1997, going back to 0400 PST on August 4, 1997