lessons from a sector-wide approach (swap)€¦ · lessons from a sector-wide approach (swap)...
TRANSCRIPT
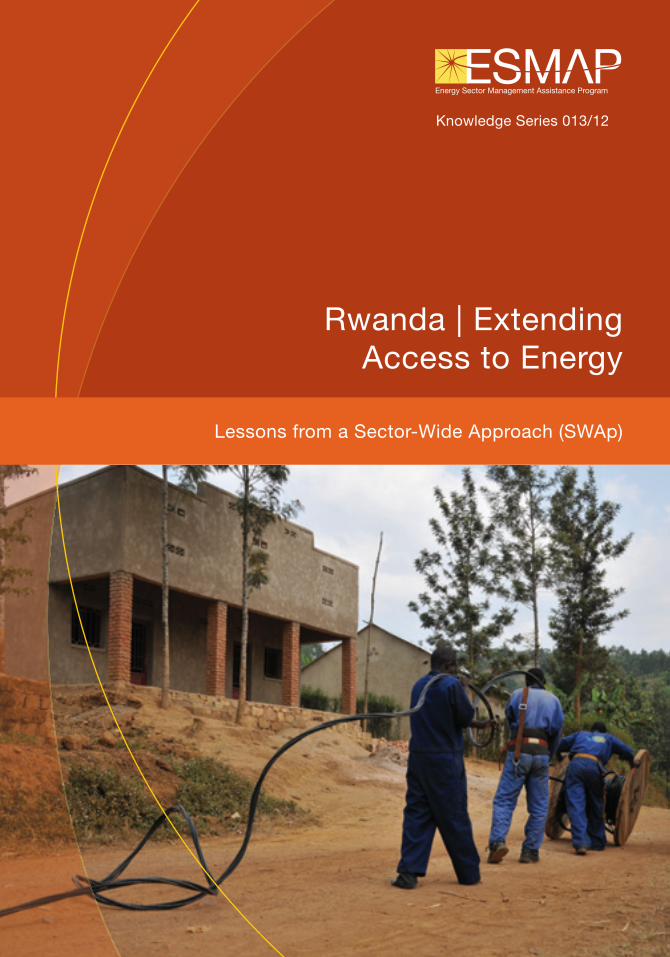
Knowledge Series 013/12
Rwanda | Extending
Access to Energy
Lessons from a Sector-Wide Approach (SWAp)
8709-Rwanda-ESMAP.pdf A8709-Rwanda-ESMAP.pdf A 2/6/13 11:38 AM2/6/13 11:38 AM
8709-Rwanda-ESMAP.pdf B8709-Rwanda-ESMAP.pdf B 2/6/13 11:38 AM2/6/13 11:38 AM
TA B L E O F C O N T E N T S
E X E C U T I V E S U M M A R Y 1
T H E VA L U E O F A S E C T O R - W I D E A P P R O A C H 3
Key Characteristics of a SWAp 3
Background on SWAps 3
P R O J E C T D E S C R I P T I O N A N D D E S I G N 6
The Rwanda Energy SWAp 6
Planning the SWAp Framework 7
Spatial Network Plan 7
Addressing the Issue of Affordability 8
C O S T I N G , F I N A N C I N G , B E N E F I T S , A N D R E S U LT S 11
Financing Plan 11
Funding the Energy Access Program 11
Benefi ts of Employing a SWAp 12
Results 13
Monitoring and Implementation 14
R E C O M M E N D AT I O N S 15
Lessons Learned 16
C O N C L U S I O N 17
E N D N O T E S 18
R E F E R E N C E S 18
A C R O N Y M S A N D A B B R E V I AT I O N S 18
L I S T O F B O X E S , F I G U R E S , A N D TA B L E S
Box 1 | SWAp Project Details 1
Box 2 | Evaluating the Affordability of Electricity in Rwanda 9
Figure 1 | Spatial Planning Approach 8
Figure 2 | Energy Access Program through 2020 14
Table 1 | Approaches to Development Assistance 4
Table 2 | Summary of Access Program Support Required 11
Table 3 | Electrifi cation Results in Rwanda 13
Table 4 | Monitoring and Evaluation of Rwanda SWAp 15
iRwanda | Extending Access to Energy
8709-Rwanda-ESMAP.pdf i8709-Rwanda-ESMAP.pdf i 2/6/13 11:38 AM2/6/13 11:38 AM
8709-Rwanda-ESMAP.pdf ii8709-Rwanda-ESMAP.pdf ii 2/6/13 11:38 AM2/6/13 11:38 AM
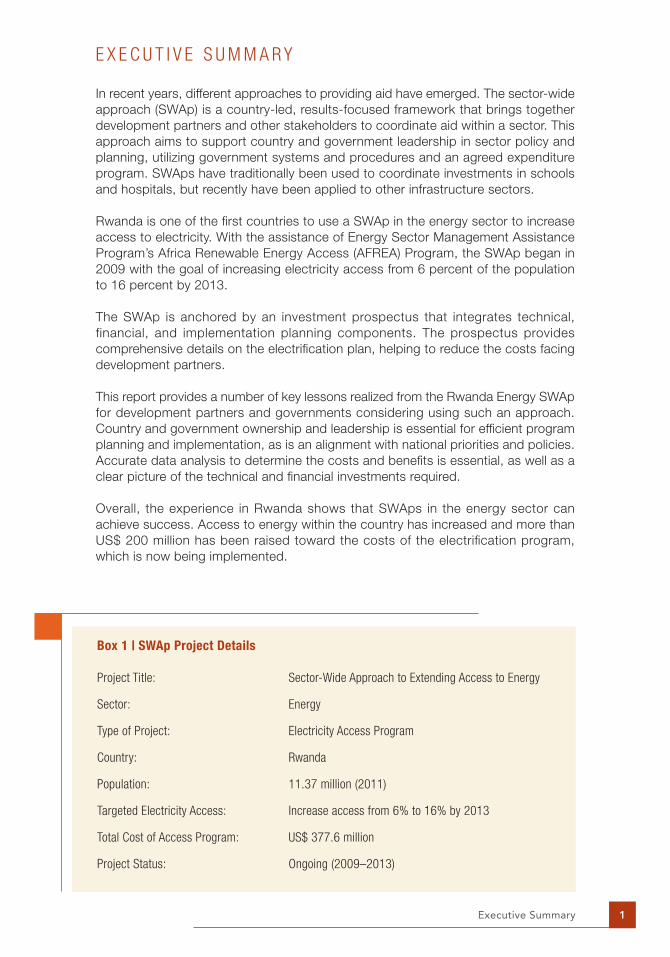
E X E C U T I V E S U M M A R Y
In recent years, different approaches to providing aid have emerged. The sector-wide
approach (SWAp) is a country-led, results-focused framework that brings together
development partners and other stakeholders to coordinate aid within a sector. This
approach aims to support country and government leadership in sector policy and
planning, utilizing government systems and procedures and an agreed expenditure
program. SWAps have traditionally been used to coordinate investments in schools
and hospitals, but recently have been applied to other infrastructure sectors.
Rwanda is one of the fi rst countries to use a SWAp in the energy sector to increase
access to electricity. With the assistance of Energy Sector Management Assistance
Program’s Africa Renewable Energy Access (AFREA) Program, the SWAp began in
2009 with the goal of increasing electricity access from 6 percent of the population
to 16 percent by 2013.
The SWAp is anchored by an investment prospectus that integrates technical,
financial, and implementation planning components. The prospectus provides
comprehensive details on the electrifi cation plan, helping to reduce the costs facing
development partners.
This report provides a number of key lessons realized from the Rwanda Energy SWAp
for development partners and governments considering using such an approach.
Country and government ownership and leadership is essential for effi cient program
planning and implementation, as is an alignment with national priorities and policies.
Accurate data analysis to determine the costs and benefi ts is essential, as well as a
clear picture of the technical and fi nancial investments required.
Overall, the experience in Rwanda shows that SWAps in the energy sector can
achieve success. Access to energy within the country has increased and more than
US$ 200 million has been raised toward the costs of the electrifi cation program,
which is now being implemented.
Box 1 | SWAp Project Details
Project Title: Sector-Wide Approach to Extending Access to Energy
Sector: Energy
Type of Project: Electricity Access Program
Country: Rwanda
Population: 11.37 million (2011)
Targeted Electricity Access: Increase access from 6% to 16% by 2013
Total Cost of Access Program: US$ 377.6 million
Project Status: Ongoing (2009–2013)
Executive Summary 1
8709-Rwanda-ESMAP.pdf 18709-Rwanda-ESMAP.pdf 1 2/7/13 10:29 AM2/7/13 10:29 AM
8709-Rwanda-ESMAP.pdf 28709-Rwanda-ESMAP.pdf 2 2/6/13 11:38 AM2/6/13 11:38 AM
T H E V A L U E O F A S E C T O R - W I D E A P P R O A C H
The sector-wide approach (SWAp) emerged in the 1990s as an alternative to
traditional development aid. The SWAp—based on a country-led, results-focused
framework—encourages engagement across all sector stakeholders to ensure that
investments work together to contribute to desired outcomes.
This approach emphasizes government and donor partnerships, with govern-
ment assuming a leadership role and working with partners to formulate policy.
The use of existing government systems and processes and the achievement of
specifi c goals and outcomes are key to this approach. In addition, donors and other
stakeholders assist with fi nancing, drawing on diverse channels of funding, and
bringing ongoing projects in line with sector priorities. A SWAp can help promote
local involvement, accountability, and capacity in the countries in which they are
implemented.
In 2009, Rwanda initiated a SWAp in the energy sector to help achieve its target of
increasing access to electricity from 6 percent of the population to 16 percent over
a fi ve-year period, through 2013. The ongoing program also focuses on providing
off-grid access to electricity for schools, hospitals, and administrative buildings
that would not have electricity otherwise. A comprehensive investment prospectus
provides development partners and local stakeholders with the technical and fi nancial
implementation plans for the program.
The experience in Rwanda suggests that using SWAps in the energy sector is a viable
and attractive option. The successes and lessons learned, which are detailed in this
report, can help inform the use of future SWAps across the energy sector.
K E Y C H A R A C T E R I S T I C S O F A S W A P
A SWAp differs from other approaches used to plan, finance, and implement
development projects. For some countries and sectors, SWAps provide a more
effective means of delivering development assistance than a traditional project-by-
project approach. Through a SWAp approach, governments, donors, and other
stakeholders join together within a particular sector to coordinate sector-specific
policy, funding, and goals. Under government leadership, the approach involves
movement over time toward common goals and more coordination for funding and
procurement.
The traditional approach, in contrast, relies on donors to coordinate and implement
aid on a project-by-project basis, with less government integration and leadership.
Table 1 compares and contrasts the SWAp framework to a project-specifi c approach.
B A C K G R O U N D O N S W A P S
SWAps have most commonly been used in the social infrastructure sectors, particu-
larly healthcare and education. Recently, the approach has been extended to other
sectors, including trade, agriculture, justice and law, and energy. Although middle-
income countries, such as Brazil, have begun to use the framework, low-income
countries have the most experience with SWAps and provide many important
lessons. Education and health-sector SWAps have improved information sharing
and increased the effectiveness of educational training and resource mobilization.1
The Value of a Sector-Wide Approach 3
8709-Rwanda-ESMAP.pdf 38709-Rwanda-ESMAP.pdf 3 2/6/13 11:38 AM2/6/13 11:38 AM
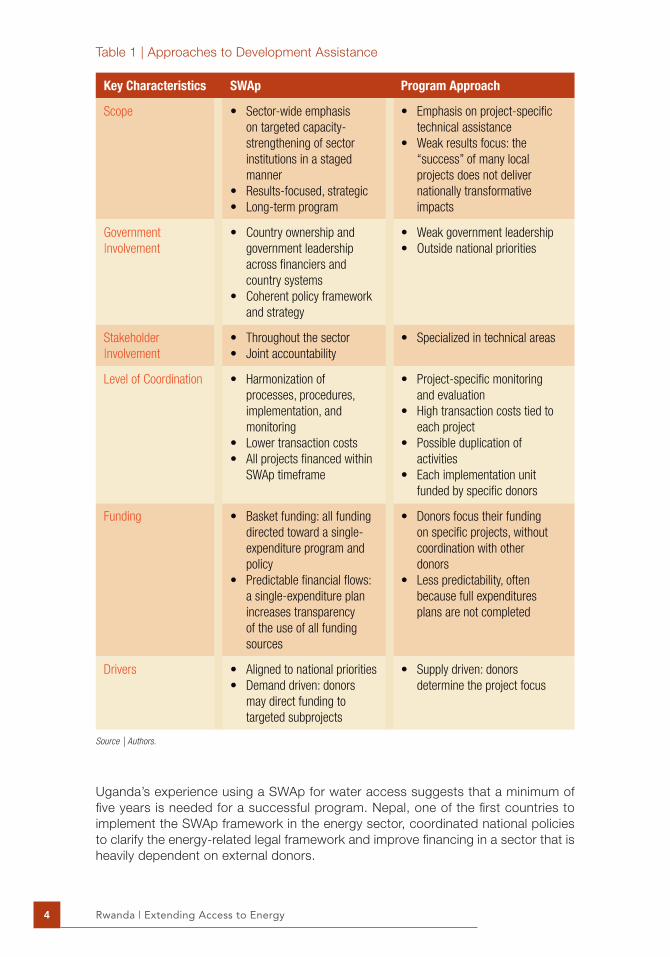
Uganda’s experience using a SWAp for water access suggests that a minimum of
fi ve years is needed for a successful program. Nepal, one of the fi rst countries to
implement the SWAp framework in the energy sector, coordinated national policies
to clarify the energy-related legal framework and improve fi nancing in a sector that is
heavily dependent on external donors.
Key Characteristics SWAp Program Approach
Scope • Sector-wide emphasis
on targeted capacity-
strengthening of sector
institutions in a staged
manner
• Results-focused, strategic
• Long-term program
• Emphasis on project-specifi c
technical assistance
• Weak results focus: the
“success” of many local
projects does not deliver
nationally transformative
impacts
Government
|nvolvement
• Country ownership and
government leadership
across fi nanciers and
country systems
• Coherent policy framework
and strategy
• Weak government leadership
• Outside national priorities
Stakeholder
|nvolvement
• Throughout the sector
• Joint accountability
• Specialized in technical areas
Level of Coordination • Harmonization of
processes, procedures,
implementation, and
monitoring
• Lower transaction costs
• All projects fi nanced within
SWAp timeframe
• Project-specifi c monitoring
and evaluation
• High transaction costs tied to
each project
• Possible duplication of
activities
• Each implementation unit
funded by specifi c donors
Funding • Basket funding: all funding
directed toward a single-
expenditure program and
policy
• Predictable fi nancial fl ows:
a single-expenditure plan
increases transparency
of the use of all funding
sources
• Donors focus their funding
on specifi c projects, without
coordination with other
donors
• Less predictability, often
because full expenditures
plans are not completed
Drivers • Aligned to national priorities
• Demand driven: donors
may direct funding to
targeted subprojects
• Supply driven: donors
determine the project focus
Source | Authors.
Table 1 | Approaches to Development Assistance
Rwanda | Extending Access to Energy4
8709-Rwanda-ESMAP.pdf 48709-Rwanda-ESMAP.pdf 4 2/6/13 11:38 AM2/6/13 11:38 AM
8709-Rwanda-ESMAP.pdf 58709-Rwanda-ESMAP.pdf 5 2/6/13 11:38 AM2/6/13 11:38 AM
P R O J E C T D E S C R I P T I O N A N D D E S I G N
The Rwanda Energy SWAp arose out of a combination of different factors, including
a low electrifi cation rate of 6 percent (approximately 65,000 connections in 2008), a
severe drought period that led to supply shortages, and a low available generation
capacity of 41 MW. Together these preconditions highlighted the need for energy
diversifi cation and better power planning and implementation.
Against this backdrop, the Economic Development and Poverty Reduction Strategy
set a target to increase connections from 100,000 in 2008 to 350,000 by 2012, with
a special emphasis on electrifi cation for social infrastructure.
To execute a comprehensive, inclusive strategy, the Ministers of Finance and Energy
and senior development partners launched the energy SWAp with the main objectives
of meeting basic energy needs, providing electricity for accelerated growth, and
powering the social sectors.
New legislation encouraged a signifi cant role for private-sector investment and
management in developing the sector. This support, combined with a regulatory
environment to enable cost recovery for investors and protection of consumer
interests, is vital to the implementation of the program.
The SWAp’s main objectives include:
■ determining a high-level investment and capacity building plan for sustainable and
predictable fi nancing over the term of the program;
■ enabling electricity access expansion to meet Rwanda’s national targets; and
■ attaining supply adequacy by expanding generation capacity by qualifi ed indepen-
dent power producers.
From the broader perspective of powering growth and improving the quality of life of
the population, the SWAp is designed to identify the lowest cost network rollout over
the next 20 years, with a medium-term target for 2014. Specifi cally, the fi rst fi ve-year
time period of the program aims to increase electricity connections from 100,000 to
350,000 and to substantially increase access to electricity for social infrastructure
facilities in health and education sectors.
T H E R W A N D A E N E R G Y S W A P
A sector working group was formed in 2008 to implement the SWAp in Rwanda. A
secretariat within the working group actively coordinated the interactions between
government offi cials and development partners. Members include:
■ Energy, Water, And Sanitation Authority2 (EWSA), formerly Electrogaz, the organi-
zation responsible for all power-sector operations;
■ Central government;
■ Ministry of Infrastructure (MININFRA);
■ Ministry of Finance and Economic Planning (MINECOFIN);
■ Other line ministries, including the Ministry of Local Government (MINALOC),
Ministry of Health (MINISANTE), and the Ministry of Education (MINEDUC);
Rwanda | Extending Access to Energy6
8709-Rwanda-ESMAP.pdf 68709-Rwanda-ESMAP.pdf 6 2/6/13 11:38 AM2/6/13 11:38 AM
■ Rwanda Utilities Regulatory Agency (RURA);
■ Local government; and
■ Development partners, including the African Development Bank, the World Bank,
the International Finance Corporation, and the governments of Belgium and the
Netherlands.
P L A N N I N G T H E S W A P F R A M E W O R K
The Electricity Sector Access Program Investment Prospectus presents a fi ve-year
plan for extending electricity access that achieves Rwanda’s targets and integrates
technical, fi nancial, and implementation planning components.
The prospectus was developed in efforts to raise US$ 250 million from development
partners to cofi nance the gap in funding for access program investments and focuses
on the period from 2009 to 2013. The technical, fi nancial, and implementation
planning, however, is developed on a longer horizon through 2020. The prospectus
presents a transparent and sustainable fi nancing platform through a combination
of in-country funds (via tariffs, revenues from connection charges, and government
contributions) and the balance, to be funded from development partner contributions
via their respective program agreements. Aiming to ease the analytical burden on
development partners by providing credible information on Rwanda’s electrifi cation
plans, the prospectus presents all relevant information and analysis in one document.
The prospectus:
■ describes the role of electricity sector institutions, the relevant policy background,
and the legal environment;
■ provides the physical plan for extending lowest cost network access, taking into
account implementation capacity and sustainability, and addressing required fi nancing
based on credible estimates of capital expenditure costs and fi nancial infl ows;
■ considers the social and economic characteristics of each sublocation within the
country, as well as demand conditions;
■ addresses the technical and economic aspects of access expansion and energy
supply alternatives—grid-based and off-grid, as well as decentralized service
options—and affordability to new benefi ciaries; and
■ provides a framework for monitoring and evaluating program outcomes.
The prospectus was presented at the donor roundtable in March 2009 and proved a
successful path to rallying stakeholders, support, and fi nancing for the fi rst phase of
the national electrifi cation program.
S PAT I A L N E T W O R K P L A N
This technical plan identifi es the best way for electricity to be extended over the next
20 years, based on social and economic characteristics of different locations within
the country, and the supply and demand conditions in each sublocation, geospa-
tially speaking. An overview of the spatial planning approach is provided in Figure 1.
The country was divided into 9,300 planning cells and a simple demand forecast was
computed for each, in addition to the capital and operating costs of different methods
of providing electricity. The least-cost option for electrifi cation was selected for each
7Project Description and Design
8709-Rwanda-ESMAP.pdf 78709-Rwanda-ESMAP.pdf 7 2/6/13 11:38 AM2/6/13 11:38 AM
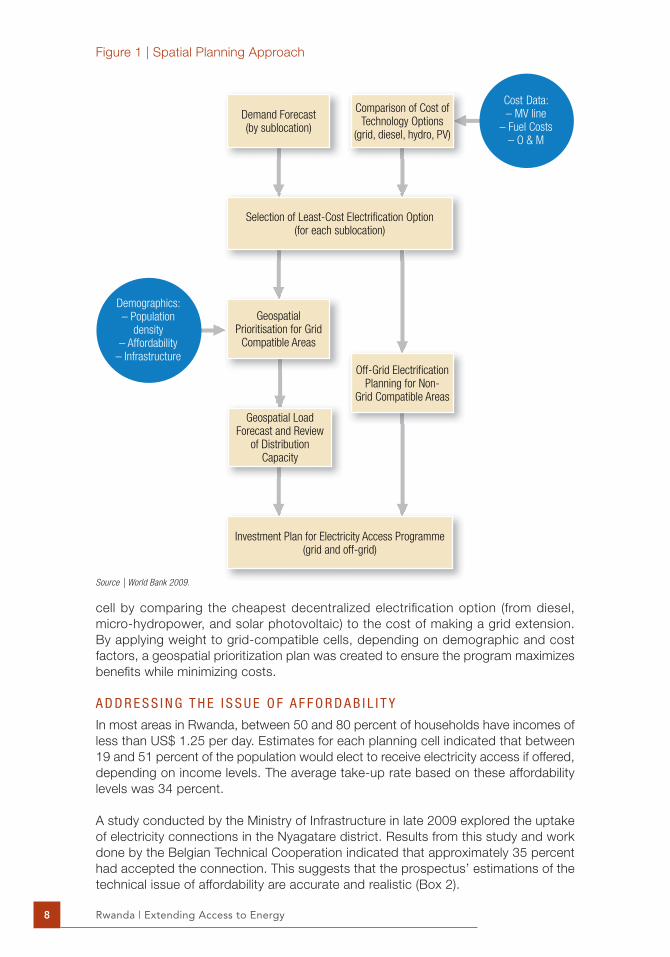
cell by comparing the cheapest decentralized electrifi cation option (from diesel,
micro-hydropower, and solar photovoltaic) to the cost of making a grid extension.
By applying weight to grid-compatible cells, depending on demographic and cost
factors, a geospatial prioritization plan was created to ensure the program maximizes
benefi ts while minimizing costs.
A D D R E S S I N G T H E I S S U E O F A F F O R D A B I L I T Y
In most areas in Rwanda, between 50 and 80 percent of households have incomes of
less than US$ 1.25 per day. Estimates for each planning cell indicated that between
19 and 51 percent of the population would elect to receive electricity access if offered,
depending on income levels. The average take-up rate based on these affordability
levels was 34 percent.
A study conducted by the Ministry of Infrastructure in late 2009 explored the uptake
of electricity connections in the Nyagatare district. Results from this study and work
done by the Belgian Technical Cooperation indicated that approximately 35 percent
had accepted the connection. This suggests that the prospectus’ estimations of the
technical issue of affordability are accurate and realistic (Box 2).
Figure 1 | Spatial Planning Approach
Source | World Bank 2009.
Cost Data:– MV line
– Fuel Costs– O & M
Demand Forecast(by sublocation)
GeospatialPrioritisation for Grid
Compatible Areas
Geospatial LoadForecast and Review
of DistributionCapacity
Selection of Least-Cost Electrifi cation Option(for each sublocation)
Investment Plan for Electricity Access Programme(grid and off-grid)
Comparison of Cost ofTechnology Options
(grid, diesel, hydro, PV)
Off-Grid Electrifi cationPlanning for Non-
Grid Compatible Areas
Demographics:– Population
density– Affordability
– Infrastructure
Rwanda | Extending Access to Energy8
8709-Rwanda-ESMAP.pdf 88709-Rwanda-ESMAP.pdf 8 2/6/13 11:38 AM2/6/13 11:38 AM
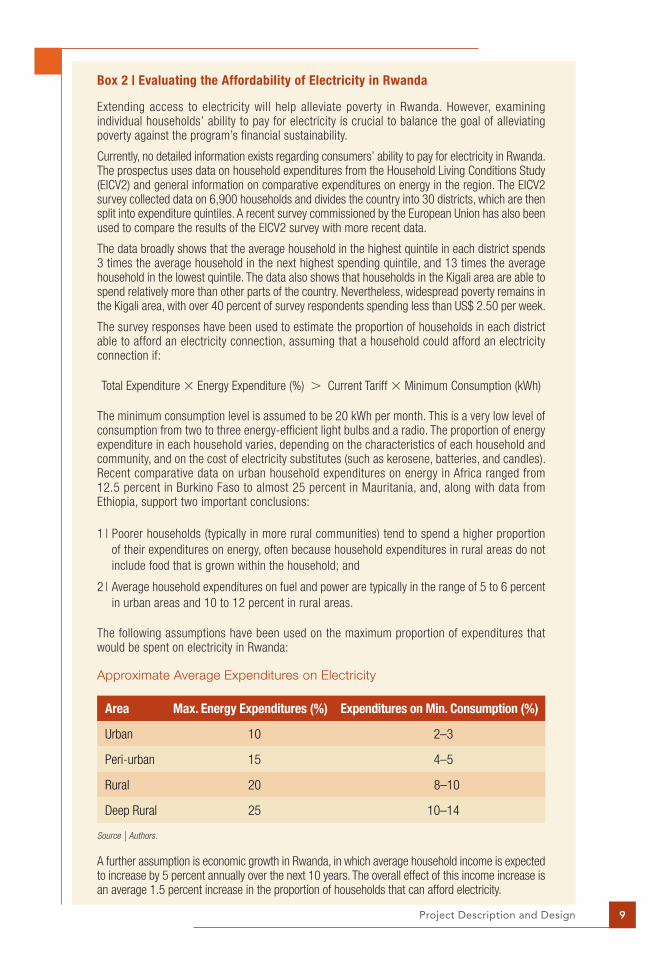
Box 2 | Evaluating the Affordability of Electricity in Rwanda
Extending access to electricity will help alleviate poverty in Rwanda. However, examining individual households’ ability to pay for electricity is crucial to balance the goal of alleviating poverty against the program’s fi nancial sustainability.
Currently, no detailed information exists regarding consumers’ ability to pay for electricity in Rwanda. The prospectus uses data on household expenditures from the Household Living Conditions Study (EICV2) and general information on comparative expenditures on energy in the region. The EICV2 survey collected data on 6,900 households and divides the country into 30 districts, which are then split into expenditure quintiles. A recent survey commissioned by the European Union has also been used to compare the results of the EICV2 survey with more recent data.
The data broadly shows that the average household in the highest quintile in each district spends 3 times the average household in the next highest spending quintile, and 13 times the average household in the lowest quintile. The data also shows that households in the Kigali area are able to spend relatively more than other parts of the country. Nevertheless, widespread poverty remains in the Kigali area, with over 40 percent of survey respondents spending less than US$ 2.50 per week.
The survey responses have been used to estimate the proportion of households in each district able to afford an electricity connection, assuming that a household could afford an electricity connection if:
Total Expenditure � Energy Expenditure (%) � Current Tariff � Minimum Consumption (kWh)
The minimum consumption level is assumed to be 20 kWh per month. This is a very low level of consumption from two to three energy-efficient light bulbs and a radio. The proportion of energy expenditure in each household varies, depending on the characteristics of each household and community, and on the cost of electricity substitutes (such as kerosene, batteries, and candles). Recent comparative data on urban household expenditures on energy in Africa ranged from 12.5 percent in Burkino Faso to almost 25 percent in Mauritania, and, along with data from Ethiopia, support two important conclusions:
1 | Poorer households (typically in more rural communities) tend to spend a higher proportion
of their expenditures on energy, often because household expenditures in rural areas do not
include food that is grown within the household; and
2 | Average household expenditures on fuel and power are typically in the range of 5 to 6 percent
in urban areas and 10 to 12 percent in rural areas.
The following assumptions have been used on the maximum proportion of expenditures that would be spent on electricity in Rwanda:
Approximate Average Expenditures on Electricity
Area Max. Energy Expenditures (%) Expenditures on Min. Consumption (%)
Urban 10 2–3
Peri-urban 15 4–5
Rural 20 8–10
Deep Rural 25 10–14
Source | Authors.
A further assumption is economic growth in Rwanda, in which average household income is expected to increase by 5 percent annually over the next 10 years. The overall effect of this income increase is an average 1.5 percent increase in the proportion of households that can afford electricity.
9Project Description and Design
8709-Rwanda-ESMAP.pdf 98709-Rwanda-ESMAP.pdf 9 2/6/13 11:38 AM2/6/13 11:38 AM
8709-Rwanda-ESMAP.pdf 108709-Rwanda-ESMAP.pdf 10 2/6/13 11:38 AM2/6/13 11:38 AM
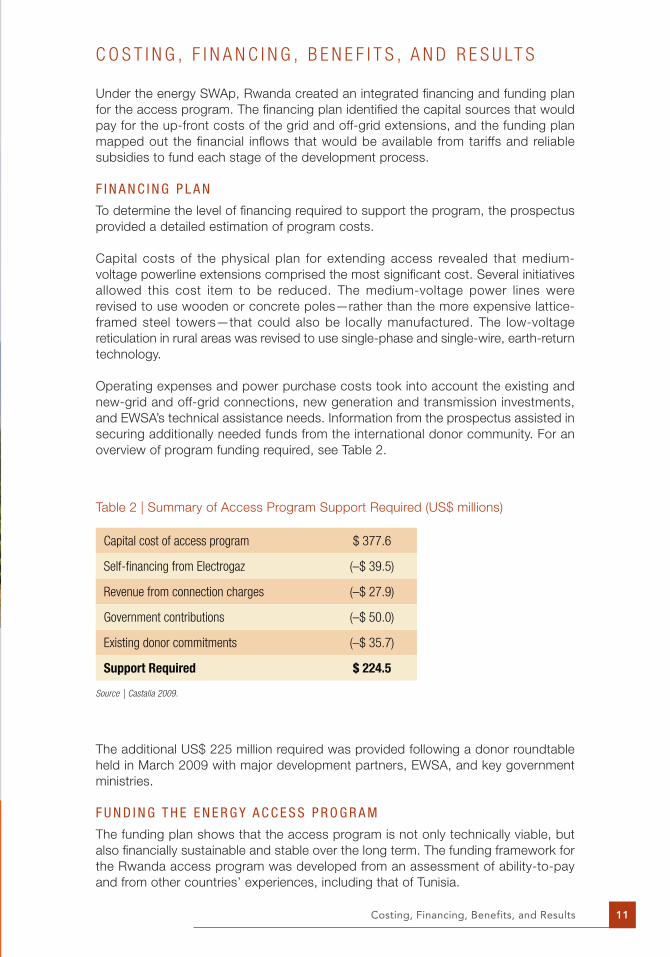
C O S T I N G , F I N A N C I N G , B E N E F I T S , A N D R E S U LT S
Under the energy SWAp, Rwanda created an integrated fi nancing and funding plan
for the access program. The fi nancing plan identifi ed the capital sources that would
pay for the up-front costs of the grid and off-grid extensions, and the funding plan
mapped out the fi nancial infl ows that would be available from tariffs and reliable
subsidies to fund each stage of the development process.
F I N A N C I N G P L A N
To determine the level of fi nancing required to support the program, the prospectus
provided a detailed estimation of program costs.
Capital costs of the physical plan for extending access revealed that medium-
voltage powerline extensions comprised the most signifi cant cost. Several initiatives
allowed this cost item to be reduced. The medium-voltage power lines were
revised to use wooden or concrete poles—rather than the more expensive lattice-
framed steel towers—that could also be locally manufactured. The low-voltage
reticulation in rural areas was revised to use single-phase and single-wire, earth-return
technology.
Operating expenses and power purchase costs took into account the existing and
new-grid and off-grid connections, new generation and transmission investments,
and EWSA’s technical assistance needs. Information from the prospectus assisted in
securing additionally needed funds from the international donor community. For an
overview of program funding required, see Table 2.
Capital cost of access program $ 377.6
Self-fi nancing from Electrogaz (–$ 39.5)
Revenue from connection charges (–$ 27.9)
Government contributions (–$ 50.0)
Existing donor commitments (–$ 35.7)
Support Required $ 224.5
Source | Castalia 2009.
Table 2 | Summary of Access Program Support Required (US$ millions)
The additional US$ 225 million required was provided following a donor roundtable
held in March 2009 with major development partners, EWSA, and key government
ministries.
F U N D I N G T H E E N E R G Y A C C E S S P R O G R A M
The funding plan shows that the access program is not only technically viable, but
also fi nancially sustainable and stable over the long term. The funding framework for
the Rwanda access program was developed from an assessment of ability-to-pay
and from other countries’ experiences, including that of Tunisia.
Costing, Financing, Benefits, and Results 11
8709-Rwanda-ESMAP.pdf 118709-Rwanda-ESMAP.pdf 11 2/6/13 11:38 AM2/6/13 11:38 AM
Financially sound utility. EWSA was expected to contribute 10 percent to capital
costs from retained earnings. Cost-recovery tariffs in Rwanda were an important
aspect of making this funding contribution credible to development partners, as
Rwanda has among the highest electricity tariffs in Sub-Saharan Africa.
Connection charges based on ability to pay. Consumers were expected to pay
a nominal US$ 100 connection charge or about 10 percent of the average connec-
tion cost.
Government and donor support through grants. Support of this nature is required
to meet 80 percent of program costs.
The sector operating costs will be met through operating revenues. Forecasted cash
fl ows suggest that this will be achievable for every quarter of the access program.
Within the SWAp framework, funds can be dispersed from development partners in
a number of ways, including:
■ Budget support | All funds are combined for the sector and the Ministry of Finance
disburses funds across the sector according to government priorities
■ Basket funding, or pooled funding | Development partners deposit all their funds
into a dedicated account, either with the sector ministry or the Ministry of Finance,
established to specifi cally fund all, or individual activities of the SWAp
■ Nonpooled funding | Funding provided to fi nance specifi c projects within the SWAp
program
The experience in Rwanda suggests that keeping options open for wide participation
has benefi ts in attracting program support.
B E N E F I T S O F E M P L O Y I N G A S W A P
The SWAp framework is expected to bring a number of benefi ts, regardless of the sector
in which it is applied. The degree to which these benefi ts are achieved will depend on the
characteristics of the sector in addition to the quality of the design, implementation, and
monitoring processes. Key benefi ts of employing the SWAp framework include:
■ Clear leadership by government, guided by national policy and knowledge of
available resources;
■ Increased predictability of funding, especially when using a public expenditure plan;
■ The ability to secure additional fi nancing as a result of the investment prospectus
and coordinated approach to the project, increasing the awareness of complemen-
tary investments;
■ Improved accountability and transparency of resource use and a more simple
means to disperse funds from a centralized authority;
■ Reduced transaction costs resulting from the coordinated approach to activities,
funding, and implementation between donors, government, and recipients;
■ Effective partnerships and increased coordination of donor assistance, made
possible through the efforts of the stakeholder working group and centralized
program management; and
■ Greater infl uence over policies, priorities, and implementation plans through the
centralized stakeholder working group.
Rwanda | Extending Access to Energy12
8709-Rwanda-ESMAP.pdf 128709-Rwanda-ESMAP.pdf 12 2/6/13 11:38 AM2/6/13 11:38 AM
SWAps in the energy sector also benefi t from the coordination of all participants in the
sector. For example, the SWAp approach coordinates the supply chain to ensure that
infrastructure is expanded effi ciently, without duplication. In contrast, the traditional
project-by-project approach may have focused entirely on extending distribution
services, without regard to capacity in transmission networks and generation assets.
R E S U LT S
Thus far, the access program focuses on the communities close to the existing grid,
with more than 95 percent of planned new connections through 2012 to take place
within 5 kilometers of the existing grid. Such planning has helped minimize program
costs and maximize economic opportunities while setting the stage to increase
EWSA’s annual implementation rate capacity. In remote areas of the country, social
facilities will gain access to electricity by solar PV units.
Implementation results to date are positive in that EWSA is meeting or exceeding the
targets set for investment and new connections, as well as for unit-cost reduction
targets in the investment cost per new connection.
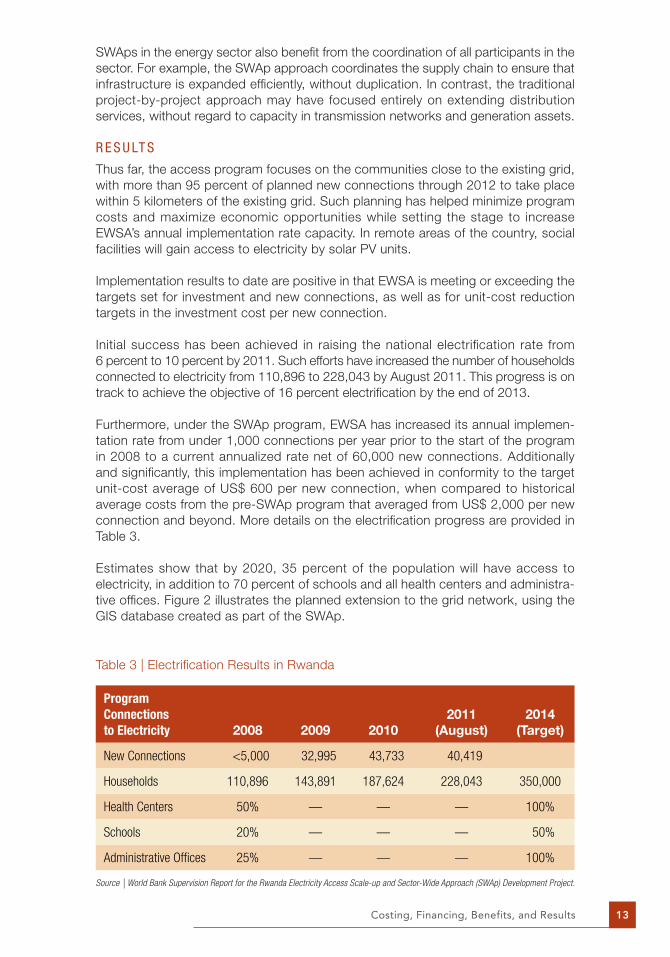
Initial success has been achieved in raising the national electrifi cation rate from
6 percent to 10 percent by 2011. Such efforts have increased the number of households
connected to electricity from 110,896 to 228,043 by August 2011. This progress is on
track to achieve the objective of 16 percent electrifi cation by the end of 2013.
Furthermore, under the SWAp program, EWSA has increased its annual implemen-
tation rate from under 1,000 connections per year prior to the start of the program
in 2008 to a current annualized rate net of 60,000 new connections. Additionally
and signifi cantly, this implementation has been achieved in conformity to the target
unit-cost average of US$ 600 per new connection, when compared to historical
average costs from the pre-SWAp program that averaged from US$ 2,000 per new
connection and beyond. More details on the electrifi cation progress are provided in
Table 3.
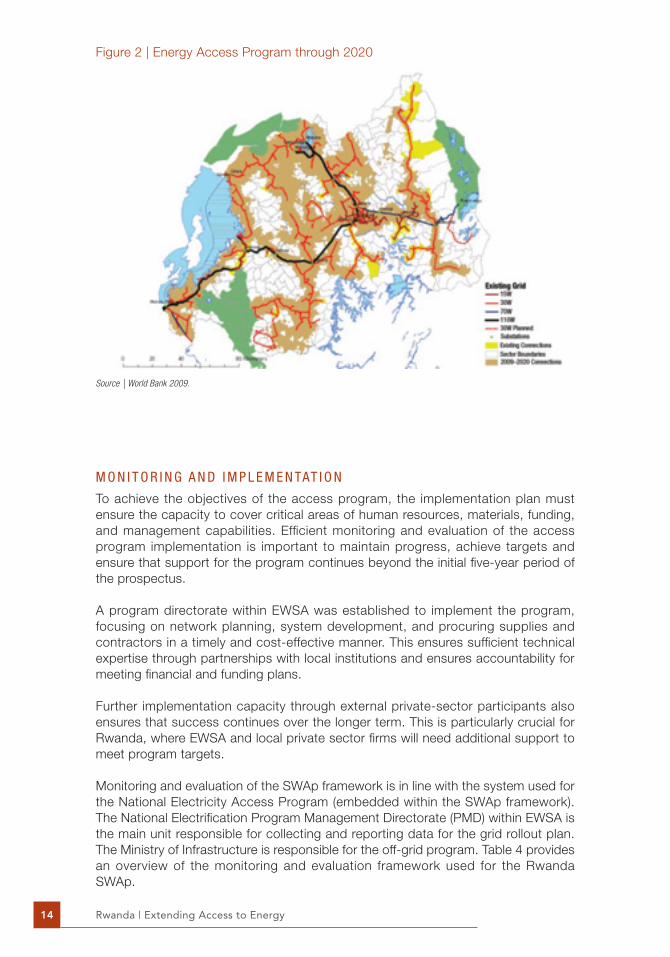
Estimates show that by 2020, 35 percent of the population will have access to
electricity, in addition to 70 percent of schools and all health centers and administra-
tive offi ces. Figure 2 illustrates the planned extension to the grid network, using the
GIS database created as part of the SWAp.
Program
Connections
to Electricity 2008 2009 2010
2011
(August)
2014
(Target)
New Connections <5,000 32,995 43,733 40,419
Households 110,896 143,891 187,624 228,043 350,000
Health Centers 50% — — — 100%
Schools 20% — — — 50%
Administrative Offi ces 25% — — — 100%
Source | World Bank Supervision Report for the Rwanda Electricity Access Scale-up and Sector-Wide Approach (SWAp) Development Project.
Table 3 | Electrifi cation Results in Rwanda
Costing, Financing, Benefits, and Results 13
8709-Rwanda-ESMAP.pdf 138709-Rwanda-ESMAP.pdf 13 2/6/13 11:38 AM2/6/13 11:38 AM
M O N I T O R I N G A N D I M P L E M E N TAT I O N
To achieve the objectives of the access program, the implementation plan must
ensure the capacity to cover critical areas of human resources, materials, funding,
and management capabilities. Effi cient monitoring and evaluation of the access
program implementation is important to maintain progress, achieve targets and
ensure that support for the program continues beyond the initial fi ve-year period of
the prospectus.
A program directorate within EWSA was established to implement the program,
focusing on network planning, system development, and procuring supplies and
contractors in a timely and cost-effective manner. This ensures suffi cient technical
expertise through partnerships with local institutions and ensures accountability for
meeting fi nancial and funding plans.
Further implementation capacity through external private-sector participants also
ensures that success continues over the longer term. This is particularly crucial for
Rwanda, where EWSA and local private sector fi rms will need additional support to
meet program targets.
Monitoring and evaluation of the SWAp framework is in line with the system used for
the National Electricity Access Program (embedded within the SWAp framework).
The National Electrifi cation Program Management Directorate (PMD) within EWSA is
the main unit responsible for collecting and reporting data for the grid rollout plan.
The Ministry of Infrastructure is responsible for the off-grid program. Table 4 provides
an overview of the monitoring and evaluation framework used for the Rwanda
SWAp.
Source | Castalia 2009.
Figure 2 | Energy Access Program through 2020
Source | World Bank 2009.
Rwanda | Extending Access to Energy14
8709-Rwanda-ESMAP.pdf 148709-Rwanda-ESMAP.pdf 14 2/6/13 11:38 AM2/6/13 11:38 AM
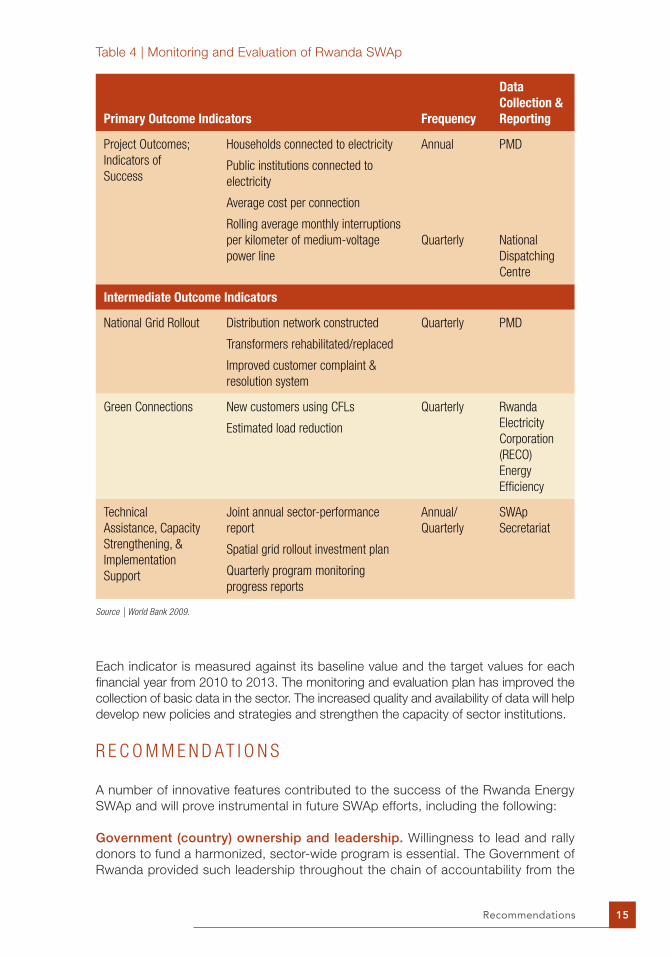
Table 4 | Monitoring and Evaluation of Rwanda SWAp
Primary Outcome Indicators Frequency
Data
Collection &
Reporting
Project Outcomes;
Indicators of
Success
Households connected to electricity
Public institutions connected to
electricity
Average cost per connection
Rolling average monthly interruptions
per kilometer of medium-voltage
power line
Annual
Quarterly
PMD
National
Dispatching
Centre
Intermediate Outcome Indicators
National Grid Rollout Distribution network constructed
Transformers rehabilitated/replaced
Improved customer complaint &
resolution system
Quarterly PMD
Green Connections New customers using CFLs
Estimated load reduction
Quarterly Rwanda
Electricity
Corporation
(RECO)
Energy
Effi ciency
Technical
Assistance, Capacity
Strengthening, &
Implementation
Support
Joint annual sector-performance
report
Spatial grid rollout investment plan
Quarterly program monitoring
progress reports
Annual/
Quarterly
SWAp
Secretariat
Source | World Bank 2009.
Each indicator is measured against its baseline value and the target values for each
fi nancial year from 2010 to 2013. The monitoring and evaluation plan has improved the
collection of basic data in the sector. The increased quality and availability of data will help
develop new policies and strategies and strengthen the capacity of sector institutions.
R E C O M M E N D AT I O N S
A number of innovative features contributed to the success of the Rwanda Energy
SWAp and will prove instrumental in future SWAp efforts, including the following:
Government (country) ownership and leadership. Willingness to lead and rally
donors to fund a harmonized, sector-wide program is essential. The Government of
Rwanda provided such leadership throughout the chain of accountability from the
Recommendations 15
8709-Rwanda-ESMAP.pdf 158709-Rwanda-ESMAP.pdf 15 2/6/13 11:38 AM2/6/13 11:38 AM
cabinet (the Ministry of Infrastructure and Ministry of Finance and Economic Planning),
through other line ministries (Health, Education, and Environment) to EWSA.
Alignment with national priorities and policies. Such alignment proved critical to
achieve objectives and move away from the fragmented, project-by-project approach.
Stakeholder buy-in. Commitment and support from donors and EWSA from the
outset of the SWAp has ensured suffi cient fi nancing, as well as technical and manage-
ment support. Enabling partners to select the target of their funding contributions—in
terms of scope, fi nancing, instrument, and timing—in addition to providing a “menu”
of investment options consistent with Rwanda’s priorities as identifi ed in the SWAp
prospectus has enhanced this process.
Utilization of data. In light of limited data availability, the approach taken to using data
was instrumental in achieving credible estimates of program costs and outcomes.
Data was collected from a variety of sources, including EWSA, government ministries,
and the Centre for Geographic Information System and Remote Sensing at the
National University of Rwanda. The quality of this data varied signifi cantly. However,
working with the local university to evaluate the data and improve future information
collection was a success factor for the program. Calculations regarding the afford-
ability of electricity and the expected take-up rates of the new connections proved
to be accurate.
Realistic assessment of risk. To allow donors to make informed decisions regarding
their contributions to the program, changes within the sector and policy risks were
detailed with results from sensitivity testing. The key risks identifi ed included a change
in political support, insuffi cient demand from consumers, failure to achieve capital-
cost reductions or operating effi ciencies, and an inability to mobilize funding from
customer payments due to nonpayment.
Credible prospectus. The SWAp investment prospectus served as a rallying point for
donor involvement. The technical and fi nancial analysis that supported the prospectus
was robust and reliable, and reduced the due-diligence costs for donors, resulting in
US$ 225 million of funds pledged to support the new connections. The prospectus
also identifi ed the appropriate technical assistance and targeted the capacity building
required for effective implementation.
South-South cooperation. Finding the most appropriate technical designs and
implementing successful techniques from other “South” countries were crucial
elements of this SWAp. The Tunisian Company of Electriticy and Gas (STEG), provided
assistance regarding low-cost techniques for distributing electricity, particularly in
rural areas, to help lower costs by at least 16 percent. This included using a combina-
tion of locally made wooden and concrete poles in place of the traditional steel
lattice frame towers, and using single-phase, single-wire earth-return technology, a
cost-effective and reliable technique.3 As such, South-South cooperation should be
encouraged in other SWAps.
L E S S O N S L E A R N E D
To date, the Rwanda Energy SWAp has achieved a number of objectives despite
being only halfway through the initial fi ve-year implementation period. Lessons
learned from this experience are crucial to improve future SWAps and to fi nd more
effi cient and effective methods of extending access to essential infrastructure.
Rwanda | Extending Access to Energy16
8709-Rwanda-ESMAP.pdf 168709-Rwanda-ESMAP.pdf 16 2/6/13 11:38 AM2/6/13 11:38 AM
The donor roundtable conference, held in March 2009, encouraged donors to pledge
funds toward the program and provided a forum for the presentation of the invest-
ment prospectus to the donor community. A total of US$ 225 million in donations
was pledged towards the fi rst phase of the program (2009–13), supporting the funds
already pledged by the Government of Rwanda, revenues from connection charges,
and self-fi nancing from EWSA.
During the first two years of implementation, new electrical connections were
achieved within the budgeted unit-cost estimates of US$ 1,000 per connection. This
is substantially lower than the pre-SWAp average project costs, and was possible due
to the commitment to reduce connection costs by introducing lower cost technical
designs and equipment.
Staffi ng of key stakeholder groups is important for an effective SWAp. During the
implementation of the Rwanda SWAp, establishment of the program management
department within EWSA proved to be a major challenge, due to the limited pool of
suitably qualifi ed professionals available and diffi culties paying market rates for key
staff salaries. As a result, deployment of monitoring and evaluation systems has been
slower than anticipated.
Obtaining a clear picture of how fi nancing will be achieved is vital to a successful
SWAp. Development partners and the Government of Rwanda pledged enough to
complete the funding needs of the SWAp program at the donor roundtable. However,
diffi culties were later encountered in ensuring a consistent fl ow of funds to fi nance
various project stages.
C O N C L U S I O N
Effi ciently raising funds to meet program costs is an important feature of the SWAp.
Funding from the Government of Rwanda and development partners reached
US$ 320 million in 2009, helping to effectively accelerate growth and reduce poverty
in the nation. As household income levels rise over time, the power sector in Rwanda
is expected to become fi nancially sustainable.
In terms of monitoring and evaluation, the existing framework has improved the
collection and measurement of performance indicators, increasing EWSA’s capacity
in this area. Such efforts are essential to track progress, support timely decisions,
and implement corrective actions. In addition, through the SWAp, EWSA employs the
same monitoring and evaluation frameworks for both their own utility and the SWAp,
avoiding parallel systems.
The Rwanda Energy SWAp has increased access to energy throughout the country
and has increased the size of the market for EWSA, making a positive impact on
the Rwandan economy and social outcomes. Although not yet complete, the SWAp
serves as an instructive example for other countries considering using the approach
in the energy sector.
Conclusion 17
8709-Rwanda-ESMAP.pdf 178709-Rwanda-ESMAP.pdf 17 2/6/13 11:38 AM2/6/13 11:38 AM
R E F E R E N C E SCastalia Strategic Advisors. 2009. Rwanda
Electricity Sector Access Programme Volume I: Investment Prospectus. Castalia Strategic Advisors, Washington, DC.
Karekezi, S. 2002. Renewables in Africa—Meeting the Energy Needs of the Poor. In Energy Policy, Vol. 30 Nos. 11–12. Special Issue—Africa: Improving Modern Energy Service for the Poor. Elsevier Ltd., Oxford.
Kenya Ministry of Water and Irrigation. 2007. Focus on Sector-Wide Approaches to Planning (SWAps). Kisima, 4: 1–8.
Meier, U., Holtedahl, T., and Pradhan, B. 2003. Rural Electrifi cation in Nepal and Possibilities for a Sector-Wide Approach.
Rwanda Ministry of Infrastructure. 2010. Rapport de Mission 14: ACP—Energy.
World Bank. 2009. Project Appraisal Report for Rwanda Electricity Access Scale-up and Sector-Wide Approach (SWAp) Development Project (P111567). Washington, DC.
E N D N O T E S1 http://www.adb.org/education/cam-swap.pdf2 Founded in 1939, Electrogaz was the national
utility supplying water, electricity, and gas in Rwanda. The company was split into Rwanda Electricity Corporation (RECO) and Rwanda Water
Sanitation Authority (RWASCO) in 2008. In 2010, these companies merged to become EWSA, and EWSA was given additional respon-sibilities for sector policy and planning.
3 http://www.ruralpower.org
A C R O N Y M S A N D A B B R E V I AT I O N S
CFL compact fl uorescent lamp
EICV2 Household Living Conditions Study
EWSA Energy, Water, and Sanitation Authority of Rwanda
kWh kilowatt hour
MINALOC Rwanda Ministry of Local Government
MINECOFIN Rwanda Ministry of Finance and Economic Planning
MINEDUC Rwanda Ministry of Education
MININFRA Rwanda Ministry of Infrastructure
MINISANTE Rwanda Ministry of Health
MV medium voltage
MW megawatt
O&M operations and maintenance
PMD Rwanda National Electrifi cation Program Management Directorate
PV photovoltaic
RECO Rwanda Electricity Corporation
RURA Rwanda Utilities Regulatory Agency
RWASCO Rwanda Water Sanitation Authority
STEG Tunisian Company of Electricity and Gas
SWAp sector-wide approach
US$ United States dollar
Rwanda | Extending Access to Energy18
8709-Rwanda-ESMAP.pdf 188709-Rwanda-ESMAP.pdf 18 2/6/13 11:38 AM2/6/13 11:38 AM
Written by | Arun Sanghvi (Consultant, World Bank Africa
Energy Unit), and Ben Gerritsen
(Castalia Strategic Advisors)
Energy Sector Management Assistance Program |
The World Bank
Production Credits
Production Editor | Heather Austin
Typesetting | Shepherd Incorporated
Reproduction | District Creative Printing, Inc.
Copyright © December 2012
The International Bank for Reconstruction
And Development / THE WORLD BANK GROUP
1818 H Street, NW | Washington DC 20433 | USA
The text of this publication may be reproduced in whole or in
part and in any form for educational or nonprofi t uses, without
special permission provided acknowledgement of the source is
made. Requests for permission to reproduce portions for resale
or commercial purposes should be sent to the ESMAP Manager at
the address above. ESMAP encourages dissemination of its work
and normally gives permission promptly. The ESMAP Manager
would appreciate receiving a copy of the publication that uses this
publication for its source sent in care of the address above.
All images remain the sole property of their source and may not be
used for any purpose without written permission from the source.
Photo Credits
All images courtesy of the Energy Access Rollout Project.
8709-Rwanda-ESMAP.pdf C8709-Rwanda-ESMAP.pdf C 2/6/13 11:38 AM2/6/13 11:38 AM
The Energy Sector Management Assistance
Program (ESMAP) is a global knowledge and
technical assistance program administered
by the World Bank. It provides analytical and
advisory services to low- and middle-income
countries to increase their know-how and
institutional capacity to achieve environmen-
tally sustainable energy solutions for poverty
reduction and economic growth. ESMAP
is funded by Australia, Austria, Denmark,
Finland, France, Germany, Iceland, Lithuania,
the Netherlands, Norway, Sweden, and the
United Kingdom, as well as the World Bank.
For more information about ESMAP’s energy
access work, please visit us at
www.esmap.org or write to us at:
Energy Sector Management
Assistance Program
The World Bank
1818 H Street, NW
Washington, DC 20433 USA
email: [email protected]
web: www.esmap.org
8709-Rwanda-ESMAP.pdf D8709-Rwanda-ESMAP.pdf D 2/6/13 11:38 AM2/6/13 11:38 AM