lecture 9: parity models and foreign exchange rates
DESCRIPTION
Lecture 9: Parity Models and Foreign Exchange Rates. Evaluating Current Spot Rates and Forecasting Rates with Parity Models: International Fisher Effect. Where is this?. What Else is Egypt Noted For? 4,000 year old Pyramids of Giza. Also Noted for Strange Behavior: At the Top -- 455 Ft. - PowerPoint PPT PresentationTRANSCRIPT

Lecture 9: Parity Models and Foreign Exchange Rates
Evaluating Current Spot Rates and Forecasting Rates with
Parity Models: International Fisher Effect

Where is this?

What Else is Egypt Noted For? 4,000 year old Pyramids of Giza

Also Noted for Strange Behavior: At the Top -- 455 Ft

View From the Top

Islamic Law (Sharia)
Sharia, or Islamic law, influences the legal code in most Muslim countries. Sharia (an Arabic word meaning "the right path“)
originated as an important part of the Islamic religion.
It is estimated that 1.3 billion people in the world practice the Islamic religion, second only to Christianity (with 2.5 billion people).
Saudi Arabia and Iran apply Islamic law most extensively, and other countries uses it to varying degrees (including Egypt).
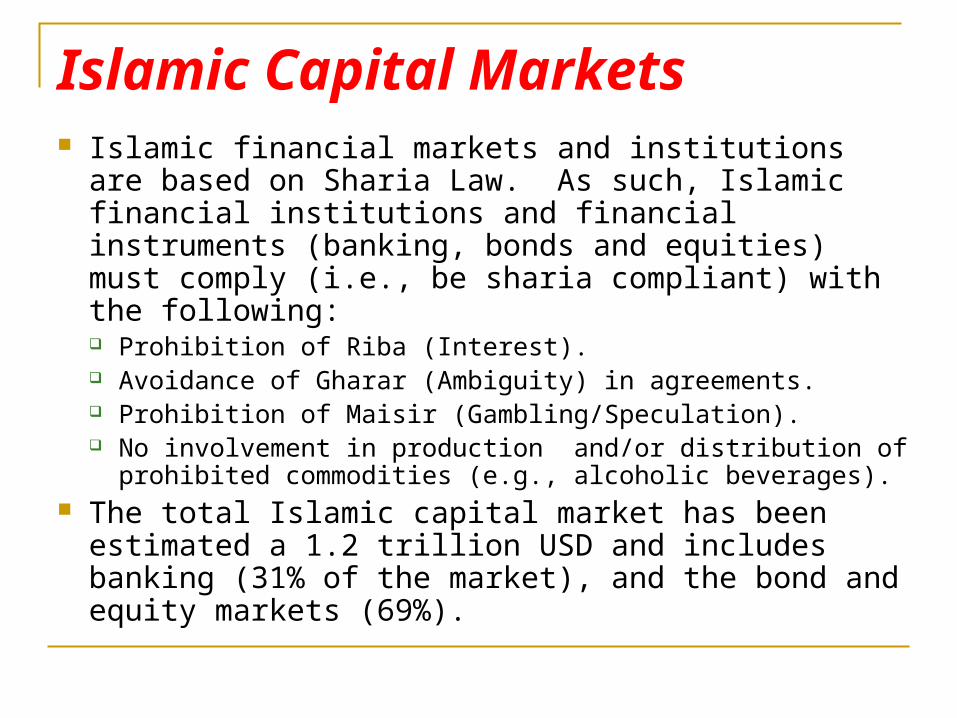
Islamic Capital Markets Islamic financial markets and institutions are based
on Sharia Law. As such, Islamic financial institutions and financial instruments (banking, bonds and equities) must comply (i.e., be sharia compliant) with the following: Prohibition of Riba (Interest). Avoidance of Gharar (Ambiguity) in agreements. Prohibition of Maisir (Gambling/Speculation). No involvement in production and/or distribution of
prohibited commodities (e.g., alcoholic beverages). The total Islamic capital market has been estimated a
1.2 trillion USD and includes banking (31% of the market), and the bond and equity markets (69%).
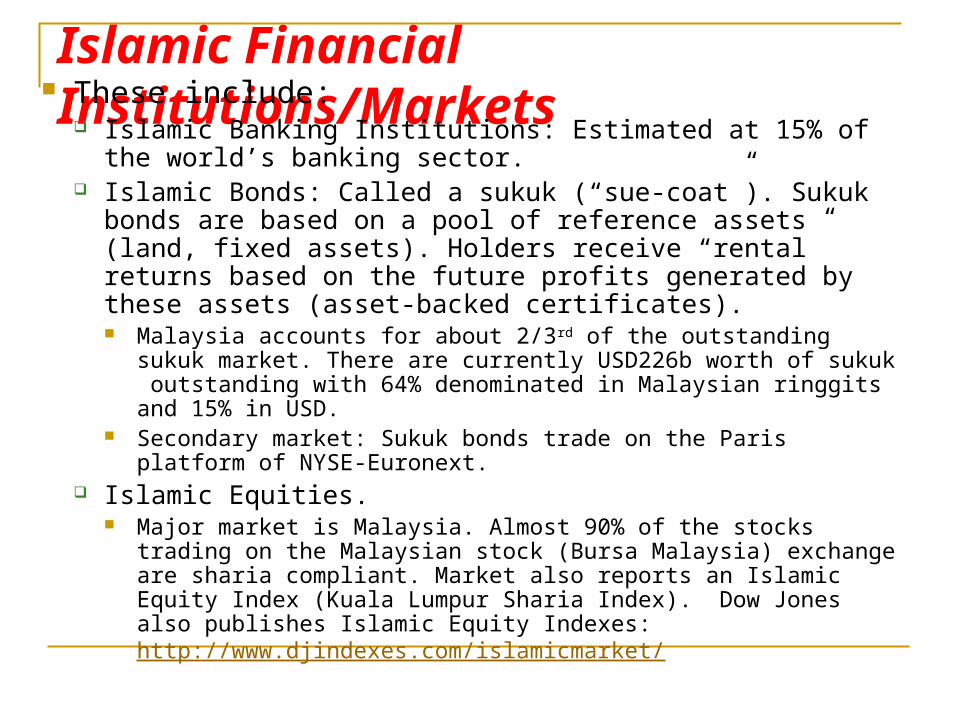
Islamic Financial Institutions/Markets These include:
Islamic Banking Institutions: Estimated at 15% of the world’s banking sector.
Islamic Bonds: Called a sukuk (“sue-coat”). Sukuk bonds are based on a pool of reference assets (land, fixed assets). Holders receive “rental” returns based on the future profits generated by these assets (asset-backed certificates). Malaysia accounts for about 2/3rd of the outstanding sukuk market.
There are currently USD226b worth of sukuk outstanding with 64% denominated in Malaysian ringgits and 15% in USD.
Secondary market: Sukuk bonds trade on the Paris platform of NYSE-Euronext.
Islamic Equities. Major market is Malaysia. Almost 90% of the stocks trading on the
Malaysian stock (Bursa Malaysia) exchange are sharia compliant. Market also reports an Islamic Equity Index (Kuala Lumpur Sharia Index). Dow Jones also publishes Islamic Equity Indexes: http://www.djindexes.com/islamicmarket/

Islamic Bonds (Sukuk) Issued by sovereigns (e.g., Malaysia, Saudi
Arabia, Kuwait) and corporates (e.g., Dana Gas based in the UAE).
Like conventional bonds subject to: Interest rate risk
Need to adjust to changes in the “opportunity” cost of investing (thus inverse relationship).
Default risk Investors need to assess the value of the reference assets.
Exchange rate risk: Results from a mismatch of the currency of the reference assets and the currency of denomination of the Sukuk.
And can be insured through the CDS market.

Recall: Two Major Spot FX Parity Forecasting Models Purchasing Power Parity (PPP)
Model assumes relative rates of inflation between two countries as the major determinant of the future spot exchange rate.
International Fisher Effect (IFE) Model assumes relative rates of long term
interest between two countries as the major determinant of the future spot exchange rate. This is the subject of this lecture.
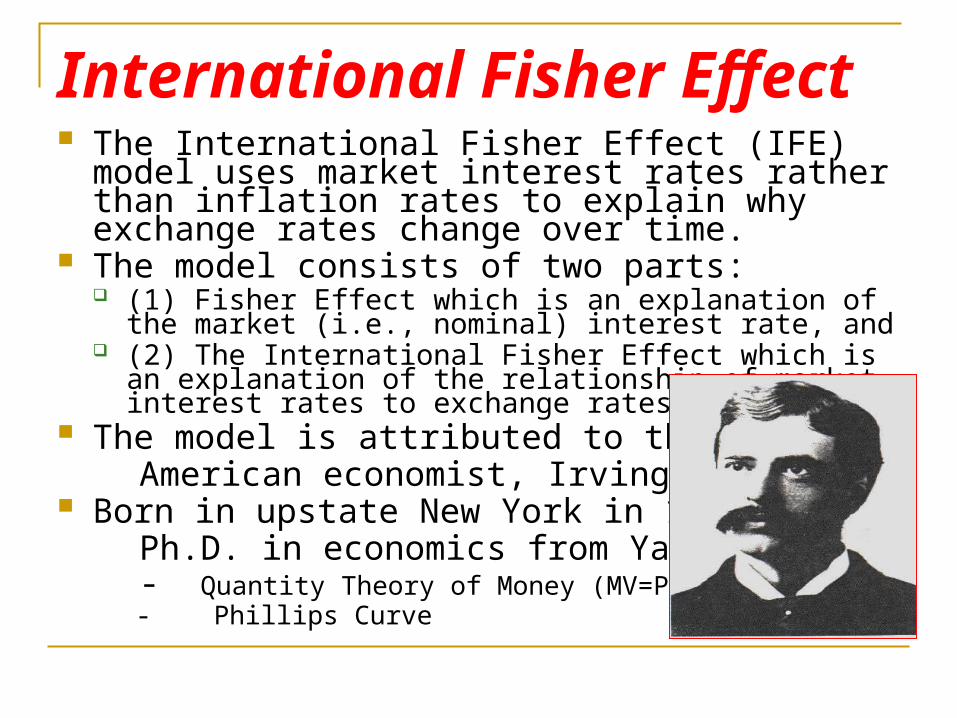
International Fisher Effect The International Fisher Effect (IFE) model uses
market interest rates rather than inflation rates to explain why exchange rates change over time.
The model consists of two parts: (1) Fisher Effect which is an explanation of the market (i.e.,
nominal) interest rate, and (2) The International Fisher Effect which is an explanation
of the relationship of market interest rates to exchange rates.
The model is attributed to the American economist, Irving Fisher. Born in upstate New York in 1867. Ph.D. in economics from Yale. - Quantity Theory of Money (MV=PT) - Phillips Curve

Explanation of Market Interest Rate Fisher market interest rate model developed in his
book the Theory of Interest (1930) Fisher’s interest rate model states that the market
rate of interest on a default free bond is the sum of: (1) a real rate requirement.
The real rate requirement reflects the reward that should accrue to a lender for “lending to a productive economy.”
(2) the market’s expected rate of inflation (i.e., an inflation premium which represents the markets’ expectation of future rates of inflation). This inflation premium protects investors against a loss of
purchasing power. Market (nominal) interest rate on a default free bond
= real rate requirement + inflation expectations.

Fisher Real Rate Requirement Defined by Fisher as “The reward for lending into a
productive economy.” Problem: This real rate requirement is much easier to
conceptualize than it is to actually measure. Conceptually, however, it is probably related to economic growth
theory, with an economy’s growth dependent upon the productivity of its workforce, capital stock, and population.
While the real rate requirement cannot be observed, different estimation methods relying on theoretical “growth” models have suggested: A range of 2-3% for both the United States and the euro area. A rate of 3% for the United Kingdom
Sources: Manrique and Manuel Marques (2004), Laubach and Williams (2003), Giammarioli and Valla (2003), Larsen and McKeown (2004)
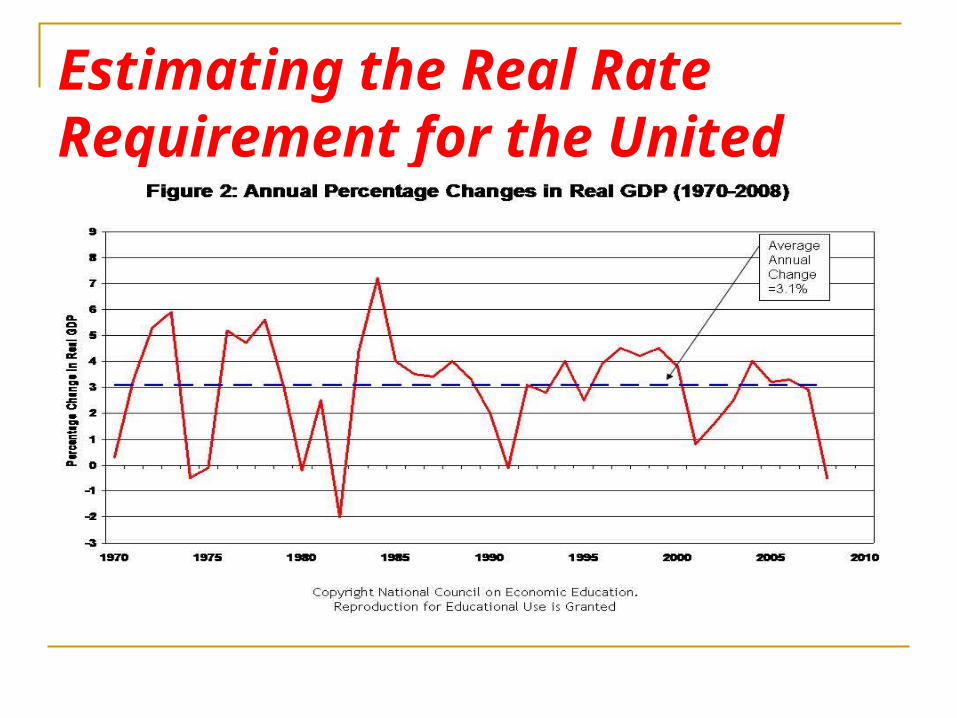
Estimating the Real Rate Requirement for the United States
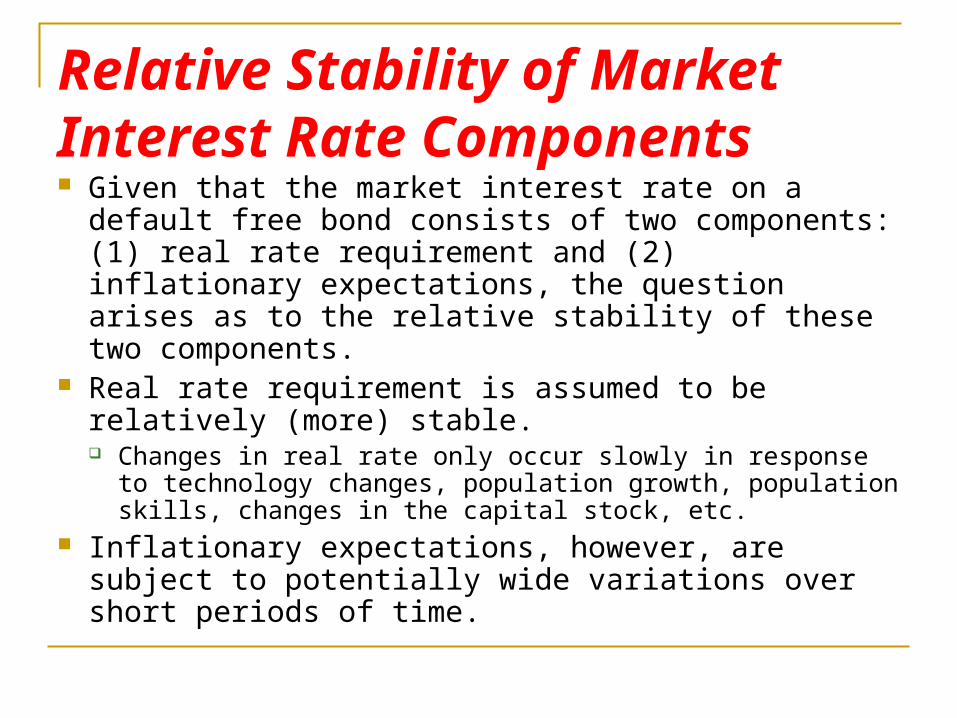
Relative Stability of Market Interest Rate Components Given that the market interest rate on a default free
bond consists of two components: (1) real rate requirement and (2) inflationary expectations, the question arises as to the relative stability of these two components.
Real rate requirement is assumed to be relatively (more) stable. Changes in real rate only occur slowly in response to
technology changes, population growth, population skills, changes in the capital stock, etc.
Inflationary expectations, however, are subject to potentially wide variations over short periods of time.
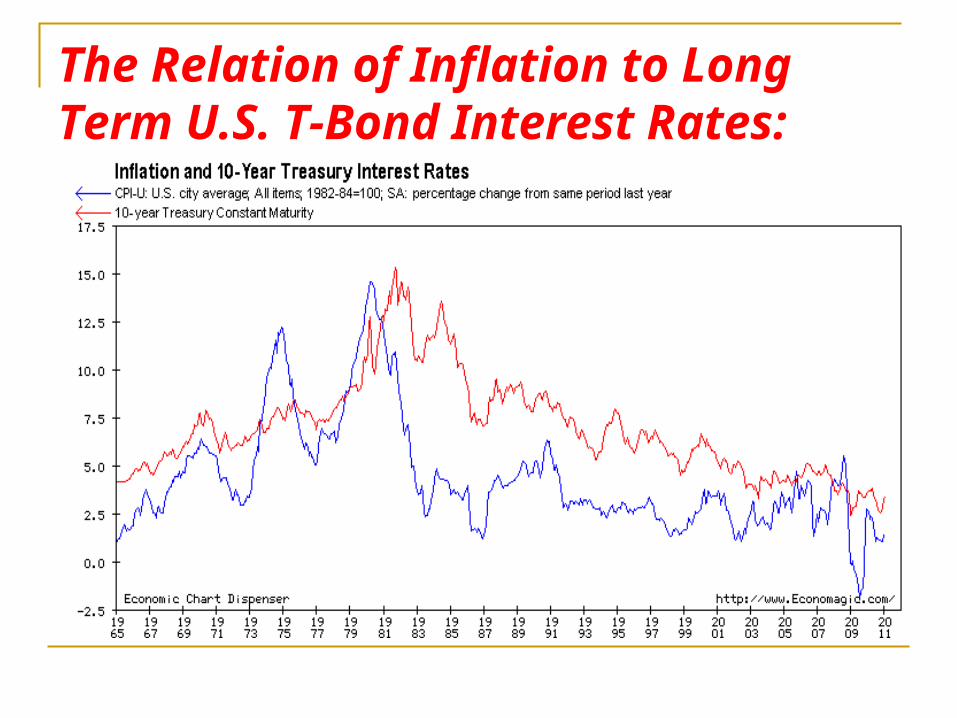
The Relation of Inflation to Long Term U.S. T-Bond Interest Rates: 1965 – 2011
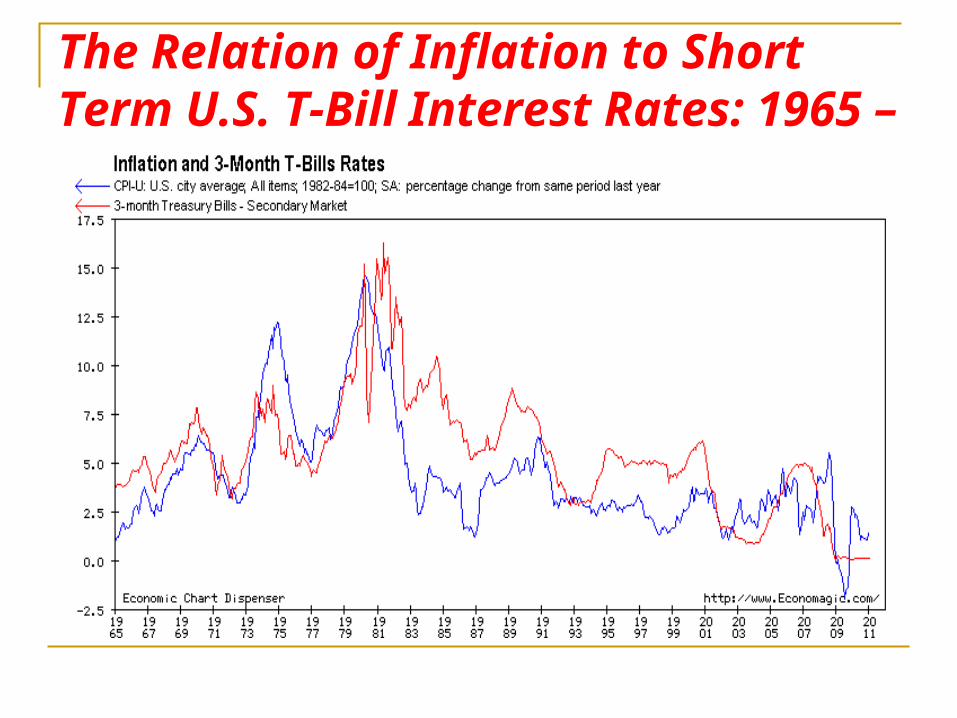
The Relation of Inflation to Short Term U.S. T-Bill Interest Rates: 1965 – 2011
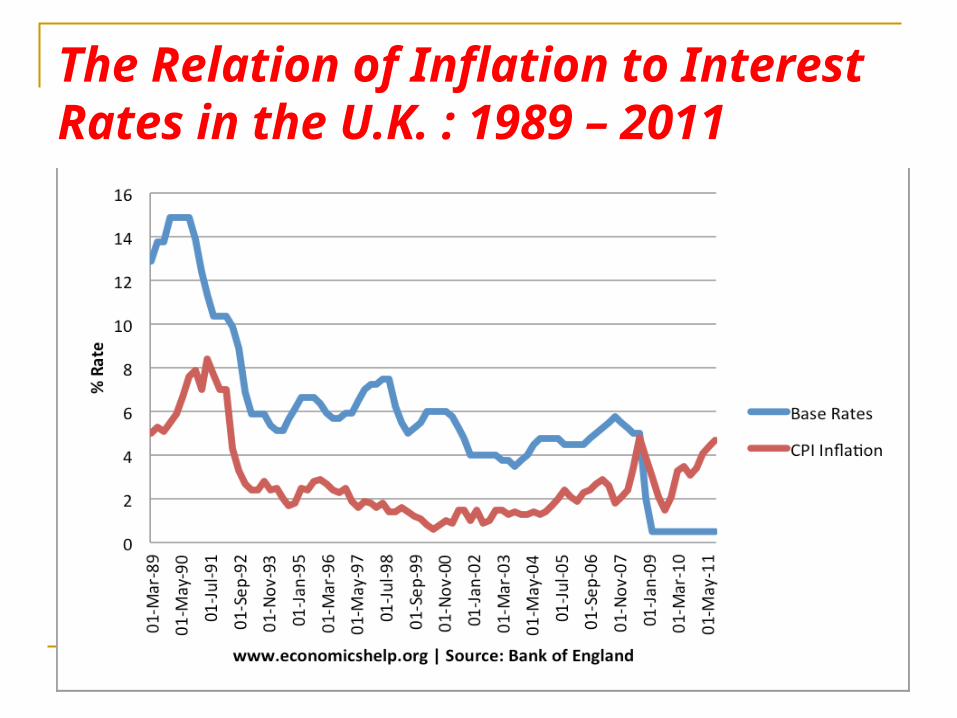
The Relation of Inflation to Interest Rates in the U.K. : 1989 – 2011
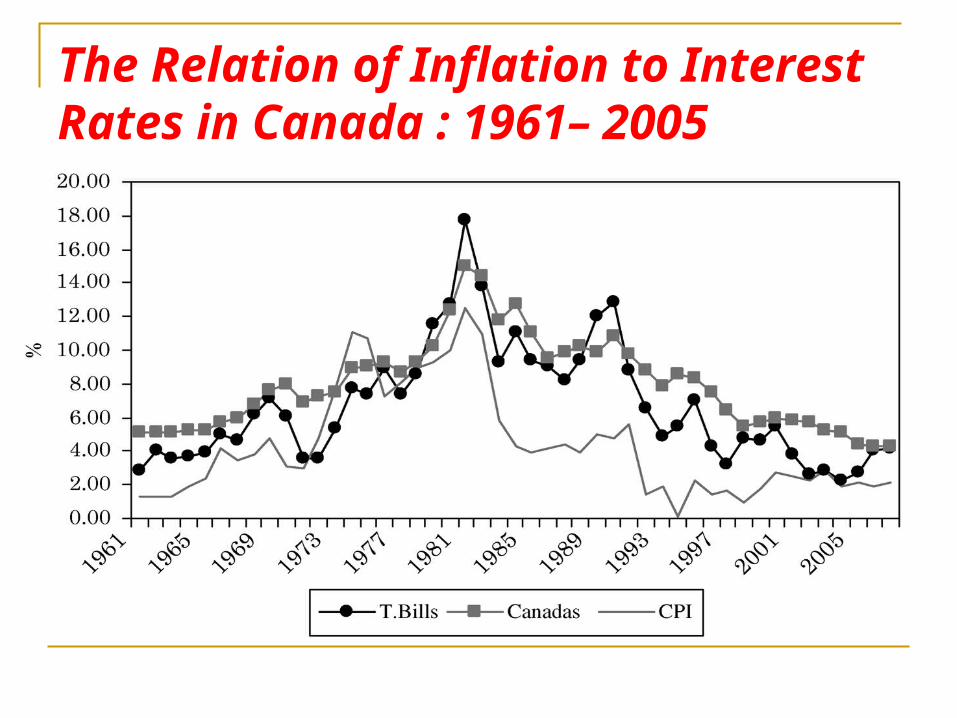
The Relation of Inflation to Interest Rates in Canada : 1961– 2005
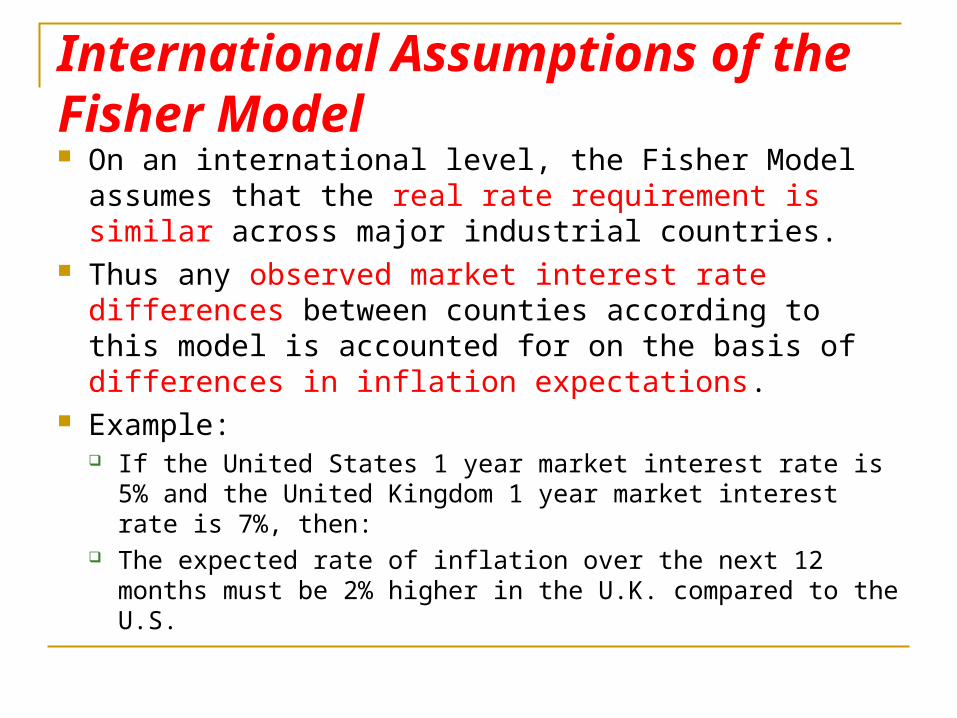
International Assumptions of the Fisher Model On an international level, the Fisher Model assumes
that the real rate requirement is similar across major industrial countries.
Thus any observed market interest rate differences between counties according to this model is accounted for on the basis of differences in inflation expectations.
Example: If the United States 1 year market interest rate is 5% and
the United Kingdom 1 year market interest rate is 7%, then: The expected rate of inflation over the next 12 months must
be 2% higher in the U.K. compared to the U.S.

The International Fisher Effect The second part of the Fisher model, the International
Fisher (IFE) effect assumes that: Changes in spot exchange rates are related to
differences in market interest rates between countries. Reason: Because differences in interest rates capture
differences in expected inflation, and inflation is assumed to be the major determinant of future exchange rates.
IFE relationship to Exchange Rates Currencies of high interest rate countries will weaken.
Why: These countries have high inflationary expectations The annual depreciation of the currency will be equal to the
observed interest rate differential. Currencies of low interest rate countries will strengthen.
Why: These countries have low inflationary expectations. The annual appreciation of the currency will be equal to the
observed interest rate differential.
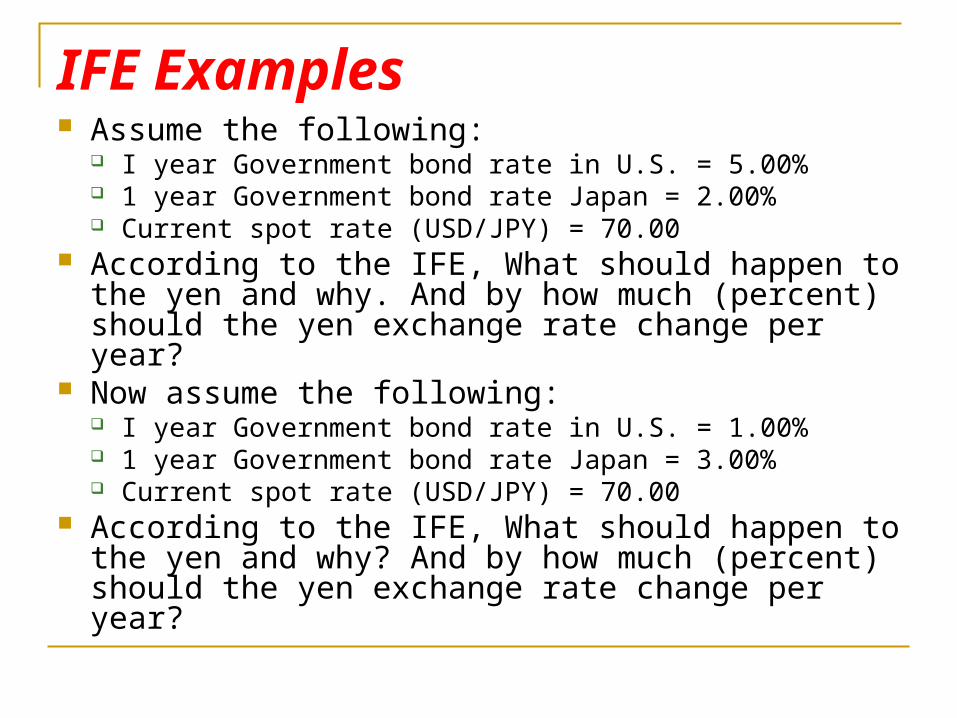
IFE Examples Assume the following:
I year Government bond rate in U.S. = 5.00% 1 year Government bond rate Japan = 2.00% Current spot rate (USD/JPY) = 70.00
According to the IFE, What should happen to the yen and why. And by how much (percent) should the yen exchange rate change per year?
Now assume the following: I year Government bond rate in U.S. = 1.00% 1 year Government bond rate Japan = 3.00% Current spot rate (USD/JPY) = 70.00
According to the IFE, What should happen to the yen and why? And by how much (percent) should the yen exchange rate change per year?

Answers Given:
1 year Government bond rate in U.S. = 5.00% 1 year Government bond rate Japan = 2.00% Spot rate (USD/JPY) = 70.00
According to the IFE, the yen should appreciate 3.0% per year against the U.S. dollar.
Why: Lower rate of inflation in Japan. 1 year from now the spot rate will equal:
70 - (70 x .03) = 70 – 2.1 = 67.90 This represents a appreciation of 3% over the current spot rate,
and is an amount which is equal to the interest rate differential. Second example (2% higher interest rate in Japan) According to the IFR, the yen should depreciate 2% per year
against the U.S. dollar. Why: Higher rate of inflation in Japan.
70 + (70 x .02) = 70 + 1.4 = 71.40 This represents a depreciation of 2% over the current spot rate,
and is an amount which is equal to the interest rate differential.
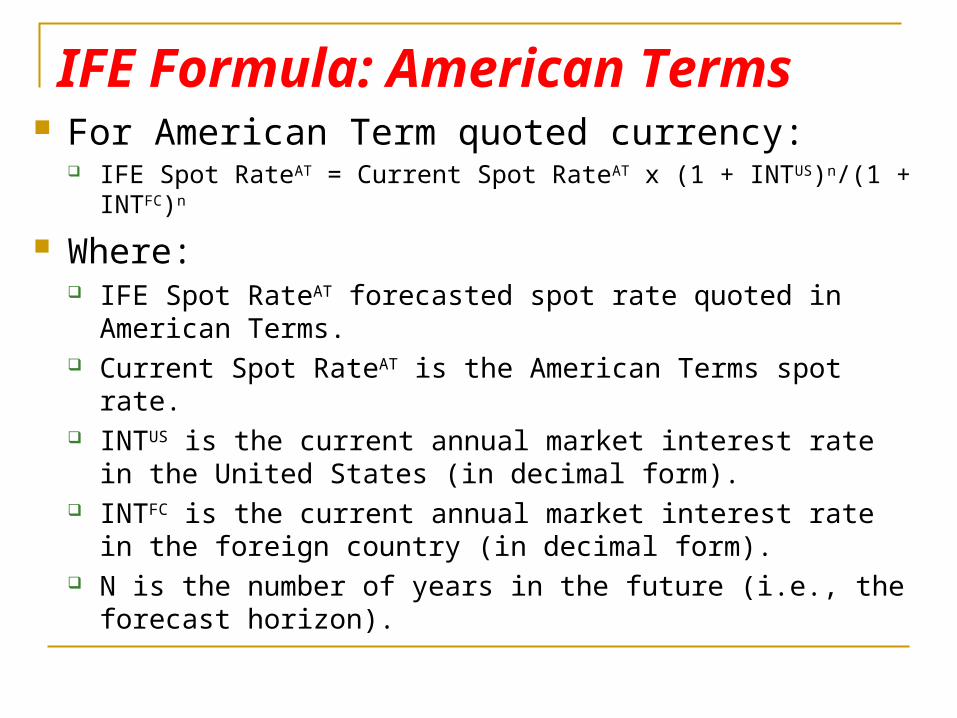
IFE Formula: American Terms For American Term quoted currency:
IFE Spot RateAT = Current Spot RateAT x (1 + INTUS)n/(1 + INTFC)n
Where: IFE Spot RateAT forecasted spot rate quoted in American
Terms. Current Spot RateAT is the American Terms spot rate. INTUS is the current annual market interest rate in the United
States (in decimal form). INTFC is the current annual market interest rate in the foreign
country (in decimal form). N is the number of years in the future (i.e., the forecast
horizon).

Example: IFE American Terms Forecast
Assume: Current spot rate for British pounds:
GBP/USD 1.5560 Annual rate of interest on 5 year Government bonds:
United States = 1.07% United Kingdom = 1.37%
Use the IFE formula below to calculate the spot pound 5 years from now:
IFE Spot RateAT = Current Spot RateAT x (1 + INTUS)n/(1 + INTFC)n
Insert data and solve.

Answer Given:
Current spot rate for British pounds: GBP/USD 1.5560 Annual rate of interest on 5 year Government bonds:
United States = 1.07% United Kingdom = 1.37%
Use the IFE formula to calculate the spot pound 5 years from now: IFE Spot RateAT = Current Spot RateAT x (1 + INTUS)n/(1 + INTFC)n
IFE Spot RateAT= 1.5560 x (1 + 0.0107)5/(1 + 0.0137)5
IFE Spot RateAT = 1.5560 x (1.0107)5/(1.0137)5
IFE Spot RateAT = 1.5560 x (1.05466/1.0704) IFE Spot RateAT = 1.5560 x .9853 IFE Spot RateAT = 1.5331 (This is the forecasted spot rate 5 years
from now; is the pound expected to appreciate or depreciate and why?)

IFE Formula: European Terms For European Term quoted currency:
IFE Spot RateET = Current Spot RateET x (1 + INTFC)n/(1 + INTUS)n
Where: IFE Spot RateET is the forecasted spot rate quoted in European
Terms. Current spot rateET is the European terms spot rate. INTFC is the current annual market interest rate in the foreign
country (in decimal form). INTUS is the current annual market interest rate in the United
State (in decimal form). N is the number of years in the future (i.e., the forecast
horizon).
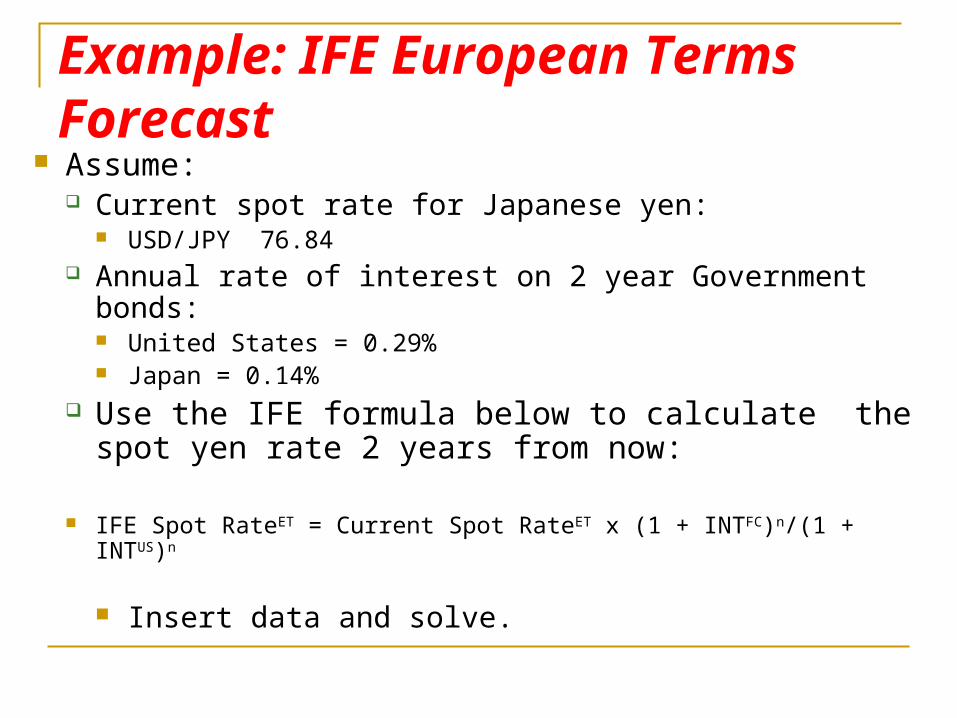
Example: IFE European Terms Forecast
Assume: Current spot rate for Japanese yen:
USD/JPY 76.84 Annual rate of interest on 2 year Government bonds:
United States = 0.29% Japan = 0.14%
Use the IFE formula below to calculate the spot yen rate 2 years from now:
IFE Spot RateET = Current Spot RateET x (1 + INTFC)n/(1 + INTUS)n
Insert data and solve.
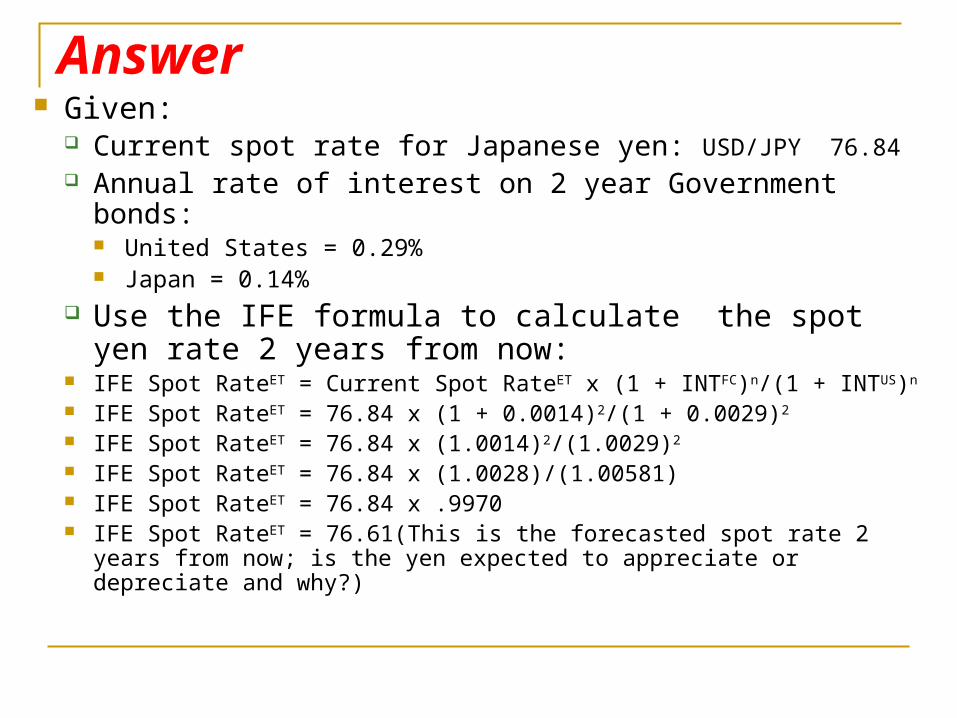
Answer Given:
Current spot rate for Japanese yen: USD/JPY 76.84 Annual rate of interest on 2 year Government bonds:
United States = 0.29% Japan = 0.14%
Use the IFE formula to calculate the spot yen rate 2 years from now:
IFE Spot RateET = Current Spot RateET x (1 + INTFC)n/(1 + INTUS)n
IFE Spot RateET = 76.84 x (1 + 0.0014)2/(1 + 0.0029)2
IFE Spot RateET = 76.84 x (1.0014)2/(1.0029)2
IFE Spot RateET = 76.84 x (1.0028)/(1.00581) IFE Spot RateET = 76.84 x .9970 IFE Spot RateET = 76.61(This is the forecasted spot rate 2 years from
now; is the yen expected to appreciate or depreciate and why?)
Empirical Tests of IFE Empirical tests of the long term relationship lend
some support to the relationship postulated by the international Fisher effect. See slides which follow
Over the short term substantial deviations can occur: Emil Sundqvist, 2002 study of 1993 – 2000 data,
correlating quarterly interest rate differentials to quarterly exchange rate changes found the following R-squares: Swedish krona: 11.5%, Japanese yen: 8.9%, British pound:
3.6%, Canadian dollar: 1.4%, German mark: 1.4%
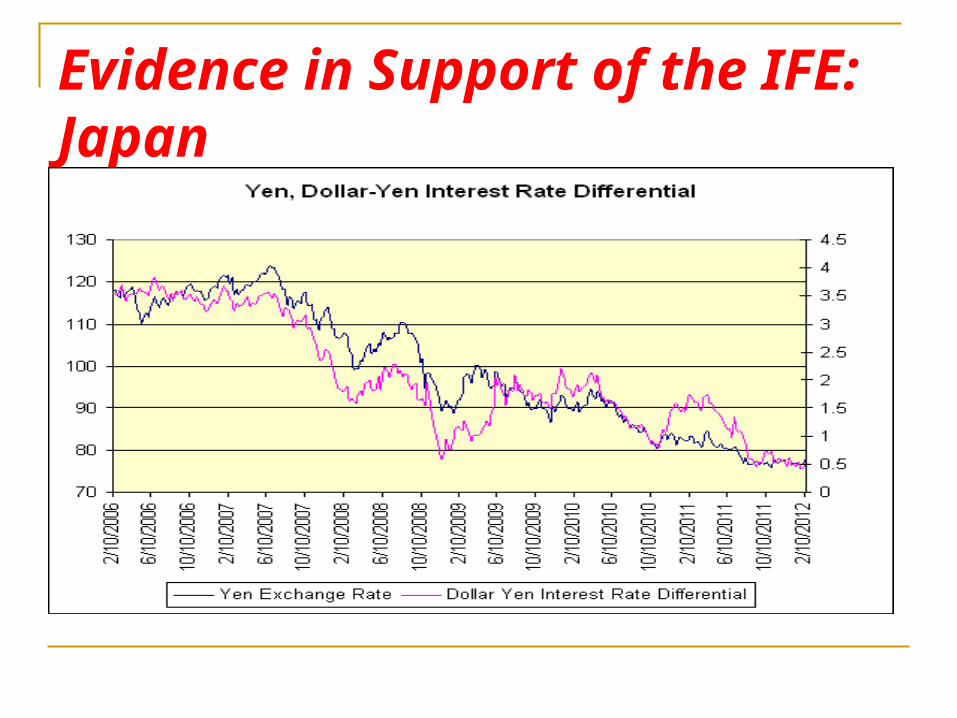
Evidence in Support of the IFE: Japan
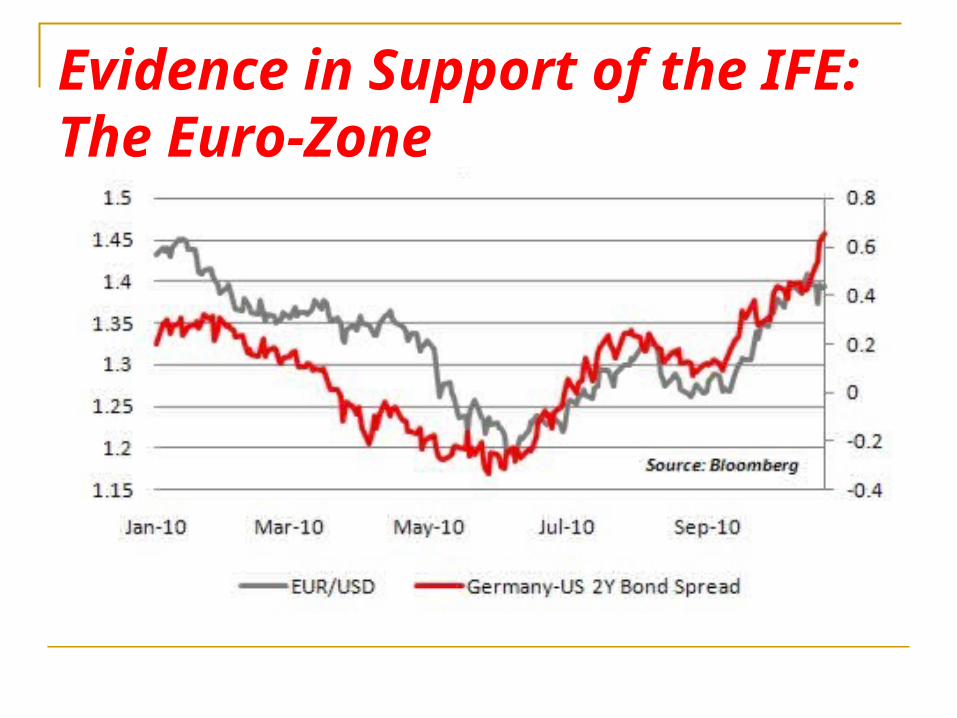
Evidence in Support of the IFE: The Euro-Zone
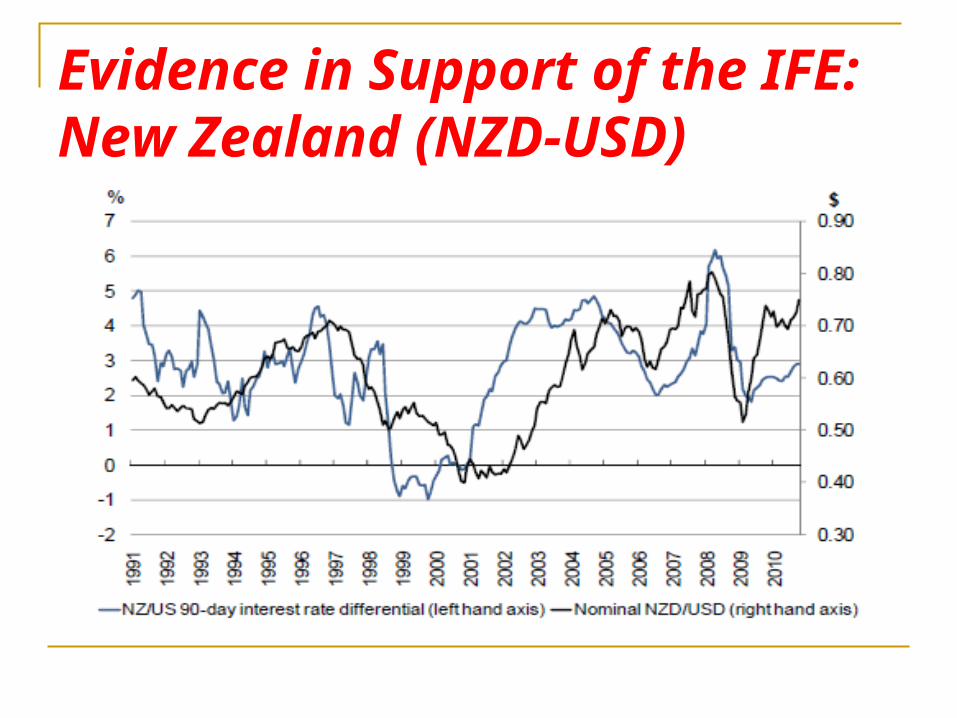
Evidence in Support of the IFE: New Zealand (NZD-USD)
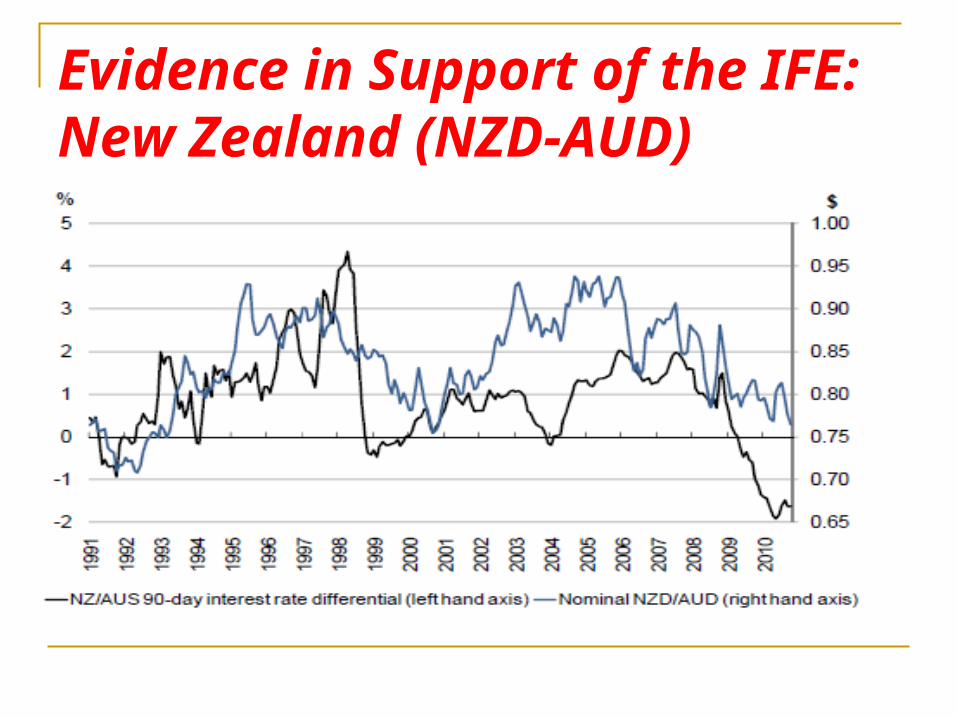
Evidence in Support of the IFE: New Zealand (NZD-AUD)
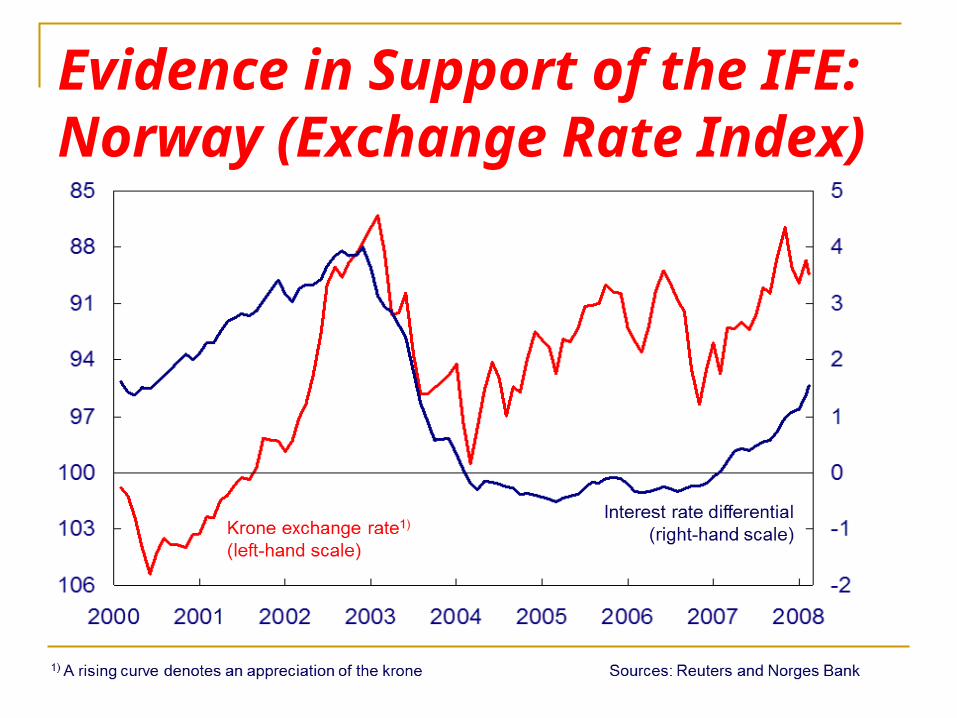
Evidence in Support of the IFE: Norway (Exchange Rate Index)

Problematic Issues Regarding the PPP and IFE PPP model issues:
User needs to “forecast” the future rates of inflation. How does one do this for very long periods of time? Perhaps it is easier for shorter time periods (e.g., 1 year).
IFE model issues: User relies on market interest rate data to “proxy” for future
inflation. However, are real rates similar across countries?
See slide next page.
Do real rates change over time? Inflationary expectations during the forecasted horizon are
subject to change.
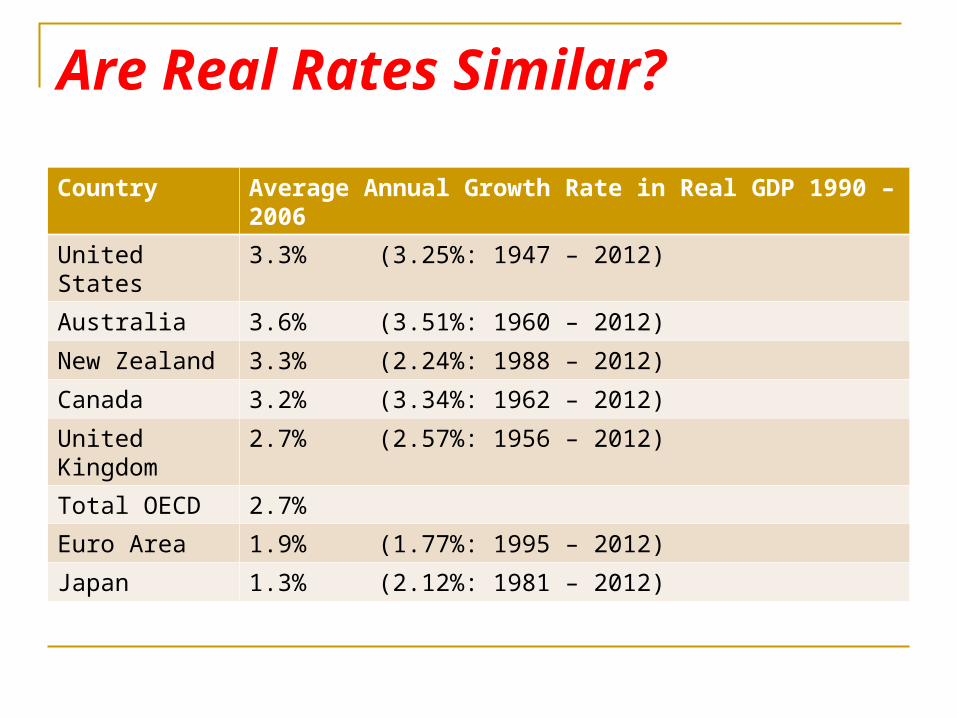
Are Real Rates Similar?
Country Average Annual Growth Rate in Real GDP 1990 – 2006
United States 3.3% (3.25%: 1947 – 2012)
Australia 3.6% (3.51%: 1960 – 2012)
New Zealand 3.3% (2.24%: 1988 – 2012)
Canada 3.2% (3.34%: 1962 – 2012)
United Kingdom 2.7% (2.57%: 1956 – 2012)
Total OECD 2.7%
Euro Area 1.9% (1.77%: 1995 – 2012)
Japan 1.3% (2.12%: 1981 – 2012)
Practical Use of PPP and IFE Neither model appears appropriate for short
term forecasting (less than 1 year). Both models work better for the long term
and in this regard appear to be good indicators of the long term trend in the exchange rate: Relatively high (low) inflation currencies will
exhibit long term depreciation (appreciation). Relatively high (low) interest rate currencies will
exhibit long term depreciation (appreciation).