learning to learn from benchmark assessment data: … · learning to learn from benchmark...
TRANSCRIPT

PEABODY JOURNAL OF EDUCATION, 85: 226–245, 2010Copyright C© Taylor & Francis Group, LLCISSN: 0161-956X print / 1532-7930 onlineDOI: 10.1080/01619561003688688
Learning to Learn From Benchmark Assessment Data:How Teachers Analyze Results
Leslie Nabors OlahUniversity of Pennsylvania
Nancy R. LawrenceThe 21st Century Partnership for STEM Education Advancing Science, Technology,
Engineering and Math Education
Matthew RigganUniversity of Pennsylvania
Although interim assessments are currently promoted as a mechanism for improving teaching andstudent learning, we know little about how teachers use this data to modify instruction. This articlepresents findings from a larger study on teachers’ use of interim assessment information in elementarymathematics. We address the following questions: (a) How do the Philadelphia teachers in our sampleanalyze benchmark assessment results, (b) how do they plan instruction based on these results, and(c) what are their reported instructional responses to such results? To answer these questions, weinterviewed all 3rd- and 5th-grade teachers in five average- and above-average-performing elementaryschools three times during the 2006–07 school year. We found that although the teachers in our studyused interim assessment results to gain information about students’ learning in mathematics, teachersdid not use interim assessments to make sense of students’ conceptual understanding. Furthermore,teachers’ tendency to interpret student errors as procedural missteps was paralleled by a trend towardprocedural instructional responses.
Although the rhetoric around formative assessment asserts the utility of everything fromteacher-made assignments and quizzes to district-mandated benchmark testing for diagnostic andother instructional purposes, few studies have been conducted of how interim assessments areused. Although such assessments may be effective in improving student achievement and students
Research for this article was supported by a National Science Foundation Grant (#REC-0529485) to the Consortiumfor Policy Research in Education at the University of Pennsylvania. This research was made possible, in part, by thesupport of the School District of Philadelphia. Opinions contained in this article reflect those of the authors and do notnecessarily reflect those of the School District of Philadelphia. An earlier version of this article was presented at theannual meeting of the 2008 American Educational Research Association in New York City, New York. We thank theparticipating district and schools for their cooperation.
Correspondence should be sent to Leslie Nabors Olah, Graduate School of Education, University of Pennsylvania,3440 Market Street, Suite 560, Philadelphia, PA 19104. E-mail: [email protected]

LEARNING TO LEARN FROM BENCHMARK DATA 227
benefit from meaningful feedback, we know little about how educators use the data or about theconditions that support their ability to use the data to improve instruction.
A number of reviews and meta-analyses of formative feedback have found significant, positiveeffects on student learning (e.g., Black & Wiliam, 1998; Kluger & DeNisi, 1996), yet theseeffects are highly dependent on a number of factors. For example, Bangert-Drowns, Kulik, andMorgan (1991) found in a meta-analysis of 58 experiments that although periodic feedbackgenerally improved student performance, the type of feedback students received had the largesteffect on performance. In a meta-analysis of 21 studies, teachers who had distinct instructionalprocesses to follow based on test outcomes and who had received explicit directions about how toshare information with students based on the data from the assessments demonstrated significantlyhigher growth in student achievement than those teachers who used their own judgment about howto respond to the data (Fuchs & Fuchs, 1986). These studies illustrate the importance of learningabout teacher use of assessments before making claims about their impact on student outcomes.
The purpose of this study is to learn more about the impacts of interim assessments on teacherpractice. By “interim assessments,” we mean assessments that (a) evaluate student knowledgeand skills, typically within a limited time frame, and (b) have results that can be easily aggregatedand analyzed across classrooms, schools, or even districts (Perie, Marion, Gong, & Wurtzel,2007). In an understandable desire to limit instructional time taken for testing, districts have optedfor interim assessments that are quick to administer and score. In particular, they are opting forall multiple-choice formats and for restricting the number of items given on any one assessment.From an efficiency standpoint, this makes sense. The question is how these interim assessmentsare used by teachers. This article addresses the following questions: (a) How do the Philadelphiateachers in our sample analyze benchmark assessment results, (b) how do they plan instructionbased on these results, and (c) what are their reported instructional responses to such results?
SITE DESCRIPTION AND ASSESSMENT
Since 2003, the School District of Philadelphia has been using a “Core Curriculum” in mathemat-ics that supports the Pennsylvania Mathematics Standards. In grades K–5, the scope and sequenceof this curriculum is closely aligned with the organization of the Everyday Mathematics (EM)program. The Core Curriculum follows a tightly sequenced “Planning and Scheduling Timeline,”or pacing guide, that details the content and types of activities that each lesson should include.With the adoption of the Core Curriculum, the district also instituted a benchmark assessmentsystem designed to give teachers and principals feedback on student performance every 6 weeks.In the year of our study, 2006–07, these multiple-choice assessments were cocreated by the districtand Princeton Review in the weeks prior to administration and were aligned to the PennsylvaniaAssessment Anchors (and, therefore, to the content of the state assessment) as well as to thecontent of EM.
Since 2003, the school district has used interim assessments in grades K–8 in a multiple-choice format to give teachers feedback relative to the students’ mastery of the topics taught in6-week intervals. In each 6-week cycle, the teacher is encouraged to use 25 of the 30 days fordirect teaching and the other 5 days for review and/or extended development of topics basedon results from the interim assessment. The district has contracted with SchoolNet Instructional

228 L. NABORS OLAH, N. R. LAWRENCE, AND M. RIGGAN
Management Solutions to make assessment data immediately accessible to each teacher and fam-ily to facilitate improved instruction and communication with parents/guardians. (For additionalbackground on the School District’s interim assessment system, please see Bulkley, Christman,Goertz, & Lawrence, 2010/this issue.)
SAMPLING AND DATA SOURCES
In this article, we present data from five Philadelphia elementary schools.1 Schools were purpose-fully selected according to three criteria. First, all schools made adequate yearly progress in schoolyear 2004–05, the planning year of the study. Second, although all schools met this minimumlevel of achievement, we chose schools to reflect a range of average mathematics performance,with one to two schools posting district-average third- and fifth-grade mathematics scores andtwo to three schools posting above district average third- and fifth-grade math scores. Finally,schools were chosen to reflect the ethnic and socioeconomic diversity within the School Districtof Philadelphia. That is, the schools ranged from 48.8% to 93.4% low-income and from 76.5%to 99.4% minority. Two of the schools had a majority of students who were English LanguageLearners.
We focused this study on Grades 3 and 5 as these were the only elementary grades tested bythe state at the start of our study. Hence, we could examine the interplay of interim assessmentswith the so-called high-stakes testing mandated by No Child Left Behind. These are also focalgrades for elementary mathematics instruction in that it is at these levels that the mathematicalperformance landmarks in computation become critical for students’ academic progress. Thirdgrade typically marks the time at which students are expected to show mastery of core addition andsubtraction concepts and procedures with whole numbers and of fundamental knowledge of placevalue. Fifth grade is the point in the curriculum when students are expected to have masteredmultiplication and division and to have developed fraction concepts and skills. Fractions arecrucial as foundations for continued work with rational numbers as well as algebra.
Within each of the five schools, all third- and fifth-grade teachers participated in our study,for a total of 25 teachers. The preliminary findings discussed in this article are based on threerounds of teacher interviews (conducted in fall, winter, and spring) and relevant artifacts fromtheir practice. These sources are described in detail next.
TEACHER INTERVIEWS
Our visits to the schools were scheduled to coincide with the district’s “reteaching week,”the time in each 6-week curricular cycle in which teachers were allotted 5 days to “revisit,reteach, practice, [and] enrich” content that had been covered in the previous 5 weeks (SchoolDistrict of Philadelphia, 2006). During each visit, members of our research team observed eachteacher for one mathematics lesson and conducted an individual hour-long interview followingthe observation. In the fall and winter, these interviews took place right after, or a couple ofhours after, the observed lesson. Our spring interviews with Philadelphia teachers, however, tookplace 2 weeks after classroom observations due to the administration of the state test in the days
1These included three K–8, one K–6, and one K–5 school.

LEARNING TO LEARN FROM BENCHMARK DATA 229
immediately following the classroom observations. Although further analysis will investigateteachers’ instruction during these periods, this analysis presented here draws on the interviewdata and artifacts only. All teacher interviews were audio recorded and transcribed.
Fall Interviews
The fall teacher interviews consisted of two parts: semistructured questions and a Data AnalysisScenario. We asked several questions that helped provide context for the lesson that we had justobserved and that were designed to tap into the different ways in which teachers monitor studentunderstanding of mathematical content.
The Data Analysis Scenario consisted of a hypothetical mockup of student results based oneach grade’s interim assessment. The items on each of the third- and fifth-grade Scenarios weretaken directly from the district’s original interim assessments following a unit on fractions. Thepurpose of the Scenario was to present teachers in our sample with a common set of results toobserve their process of interpreting those results and to analyze the extent to which they wereable to identify patterns or student misconceptions in the data.
Although we believe that the Data Analysis Scenario provided important information on theways in which classroom teachers analyze and interpret assessment results, we also realize itspotential limitations. Foremost among these is the fact that because the assessment results arefictional, teachers are unable to bring contextual knowledge to bear on interpreting results forindividual students. For example, with a hypothetical set of results, a teacher cannot attributelow performance to potentially contributory factors such as the student’s language status, healthstatus, or other disciplinary or familial problems that occur in real life. For this reason, we believethat the Data Analysis Scenario is best used in conjunction with a semistructured interview withthe teacher about her own assessment results, which we did in the winter interviews.
Winter Interviews
The winter teacher interviews consisted of questions focused on planning for and teachingduring the allotted reteaching days embedded in the 6-week cycle. Many of these questionsattempted to link teacher behavior observed during our classroom visits with teachers’ intentionsand with teacher use of assessment information. We also asked about professional developmentopportunities available to teachers since the first round of interviews and about other potentialsupports for interim assessment use. As part of this interview, we asked teachers to bring copiesof their most recent interim assessment results with them. In reviewing these, we asked bothabout classwide patterns of performance as well as about mathematical concepts that seemedto present difficulty for students. These questions were designed to closely mirror the previousquestions on the Data Analysis Scenario. In this way, we hoped to get a more complete pictureof teachers’ individual approaches to analyzing interim assessment results, factoring in theirintimate knowledge of individual students and school context. During these interviews, we alsonoted that some teachers had taken extra steps to organize their data beyond the ways in whichthe district presents this information, such as by writing the students’ names next to items thatthey answered incorrectly.

230 L. NABORS OLAH, N. R. LAWRENCE, AND M. RIGGAN
Spring Interviews
The spring teacher interviews gave us an opportunity to confirm trends in teacher formativeassessment use that we had begun to identify. Specifically, we sought to further explore teacheruse of interim assessment results to understand student thinking and to help identify their ownprofessional development needs. We also used this final round of interviews to ask teachersabout the role of classroom assessments in light of the annual state assessment that had just beenadministered.
To gain a broader and deeper understanding of teachers’ use of interim assessment results,we linked several questions to two types of artifacts: (a) an item from the most recent interimassessment and (b) the Benchmark Data Analysis Protocol, a two-page, district-created analysisand reflection worksheet. We chose one item from each of the most recent third- and fifth-gradeinterim assessments by selecting those that we felt offered teachers the most opportunity to learnabout student understanding of mathematical concepts. The two members of our research teamwho had previously taught EM (one of whom had taught in Philadelphia) participated in thisitem vetting. To our surprise, it was actually difficult to identify items for which the distractersoffered meaningful information about student learning. Of 20 items on each assessment, only 2or 3 were identified as potentially informing knowledge about student understanding relative toa learning goal (as opposed to merely indicating, for example, that a student could or could notperform a procedure). We then chose 1 item from these 2 or 3 based on the relative curricularimportance of the mathematical content contained therein (e.g., operations were given precedenceover measurement) and on the perceived difficulty of the item. Much as we had done in the falland winter, we asked teachers to describe what students who got this item incorrect might havebeen thinking, what steps the teachers would take to confirm or disconfirm this hypothesis, andhow they might address student misunderstanding.
We also asked several questions about the Benchmark Data Analysis Protocol. Althoughcompleting this worksheet is officially voluntary, in background interviews with district andschool leaders that we conducted in the spring of 2006, all of our participating principals reportedthat they expected their teachers to complete these forms and hand them in to the principal. TheProtocol is a one-page, two-sided document that presents teachers with guiding questions aimedtoward using the SchoolNet Item Analysis report to group or regroup students and change teachingstrategies, as well as consider testing for mastery of both reading and mathematics. A “teacher’sreflection” section of the Protocol allows teachers to record with whom they have discussedtheir interim assessment results, their strategies for differentiated instruction, and their ownprofessional development needs, among other issues. Our particular interest in the BenchmarkData Analysis Protocol was whether teachers used it to report their own professional developmentneeds, and whether it assisted them in analyzing student results.
COLLECTION OF RELEVANT ARTIFACTS
Because this is a study of assessment use, we collected copies of all third- and fifth-grade interimassessments in mathematics given in the 2006–07 school year. We also purchased the third- andfifth-grade EM program to better understand the learning goals that were to be achieved duringthis study. We acquired copies of both the Philadelphia School District’s pacing guides and ofany additional district-wide assessments that were made available to us. In many cases, we were

LEARNING TO LEARN FROM BENCHMARK DATA 231
also able to collect examples of teacher classroom assessments. In some cases, teachers offeredblinded examples of student work on the interim assessments. As previously mentioned, a fewteachers had constructed their own data organization templates, and, when possible, we collectedcopies of these as well.
TEACHER PROCESSES OF DATA ANALYSIS AND INTERPRETATION
Analyzing benchmark assessments was a universal practice among the teachers in our sample. Ata minimum, all of the teachers had experience looking at printouts of students’ interim assessmentresults, and most were comfortable accessing those results on SchoolNet (see next section onuse of Information Management Systems). In addition, nearly all of the teachers intervieweddemonstrated the ability to link analysis of individual items to curricular content areas and/orstate standards. In the case of the latter, use of SchoolNet appeared to facilitate this process.
Figure 1 illustrates the steps most commonly taken by teachers when looking at their benchmarkresults. In nearly all cases, teachers begin by identifying weak points in their class’ performance,either focusing on items or content that proved challenging and then moving on to individualstudents or vice versa. To better understand these weak points, teachers often validated specificitems to ensure that they accurately reflected their students’ mathematical understanding. Whetherteachers responded to a particular result depended on the personal “thresholds” for acceptableperformance that were embedded—sometimes implicitly—in teachers’ analyses. These thresh-olds (discussed at greater length next) varied considerably and were influenced by a variety ofcontextual factors such as past student performance, teacher background knowledge, or positionof specific content within the district’s curriculum or pacing cycle. These same factors playedan important role in shaping teachers’ overall impression of benchmark results, which in turndirectly informed whether and how they responded instructionally.
ANALYSIS PROCESSES
There was considerable uniformity in the initial steps teachers took in analyzing benchmark data.First, nearly all of the teachers (86%) started by looking for weaknesses. (The rest began by
FIGURE 1 Teacher process for analyzing, interpreting, and acting on benchmark results.

232 L. NABORS OLAH, N. R. LAWRENCE, AND M. RIGGAN
reviewing and assessing the overall performance of the class.) Of all teachers, the majority (59%)began by looking for weak content areas, either by looking directly at the standard to which anitem corresponded or by identifying individual items that covered the same curricular content.Roughly 28% of teachers began by looking for individual low-performing students rather than atweak content areas.
Regardless of sequence, nearly all teachers in the sample (86%) eventually looked at individualitems, content, and students when analyzing the data. Worth noting was the common pattern,demonstrated by 79% of teachers, of moving from analysis of items to content areas/standardsor vice versa. In other words, teachers had little difficulty linking items, content, and standards.This suggests that, at least on a superficial level, the vast majority of teachers were analyzing thisdata in a manner consistent with school district expectations: identifying weaknesses in studentperformance and relating those weaknesses back to instructional content.
Use of Information Management Systems
All of the teachers in our sample were familiar with SchoolNet and had used it at some point,though some were more familiar with specific features of it than others. Generally, teachers usedSchoolNet to facilitate their analysis in two ways. First, they were able to toggle between theitem analysis for their class and the specific problems from the interim assessment. This allowedthem to assess the validity of particular questions (see next section) and to try to make sense ofstudents’ incorrect responses. One third-grade teacher described this process as such:
Let’s see, for number one, a lot of them put B instead of . . . A. And this is why I would . . . go andlook at, there’s a place that you can click on for the question to come up to view the problem. Andso, I could look to see what exactly the problem was, and . . . because it’s geared to Everyday Math, Imight be able to see that little thing that they didn’t get, the way it was set up, it could have possiblybeen more than just the computation of the problem itself. So, I would probably go and look atthat.
Second, teachers used SchoolNet to link assessment items to state content standards. Severalrespondents reported that viewing the data by standard (rather than by item) allowed them tomore easily hone in on the specific content they needed to cover during the reteaching week. Athird-grade teacher spoke about the benefits of this feature:
This is on Align. [The teacher-level component of SchoolNet.] And then also on the Align tab thereis each of the standards, and it gives you a standard mastery by individual benchmark, so then I cantake just a real quick look and say, okay, well I know that the most people need work on, I guess righthere, whatever this is, skip counting, which you think that they would know. So that would definitelybe something that we needed to work on, was the skip counting. So this is another way.
Use of SchoolNet for more complex tasks, such as generating supplemental assessments orlinking to components of the curriculum, was far less common among teachers in our sample.Two teachers specifically referred to using SchoolNet to link back to relevant EM units, and justone discussed generating worksheets based on student performance. Still, teachers were generallyhighly complimentary of SchoolNet, noting that it both saved them time and helped them focus

LEARNING TO LEARN FROM BENCHMARK DATA 233
on students and content areas that most needed their attention. A common opinion was articulatedby one third-grade teacher in this way:
I think it’s really good. I really appreciate having data and having the numbers just done for me. Alot of times, as I alluded to earlier, I have an idea of where they’re struggling, but to actually see itnumerically and get it instantly, it saves me time and it really helps a lot. I think it’s terrific.
Validation of Test Items
In analyzing the benchmark assessment results, we also found that some teachers went back to theactual assessment items to determine the quality of information that could be gleaned from studentperformance on these individual items. Some type of validity check was conducted by at least halfof our teachers, although these actions were not referred to using traditional psychometric jargon.Rather, several teachers mentioned that after looking at students’ performance on the whole testor by standard, they would go through the most problematic items one by one.
From the teachers who mentioned conducting validity checks, the most common questionwas the degree to which an item (or set of items) assessed students’ true understanding ofmathematical concepts and procedures. Teachers spoke of two main threats to validity. First,teachers mentioned that they were far less able to make use of the interim assessment resultswhen the content tested had not yet been taught. During the year of our study, this occurred fortwo reasons: because instruction had fallen behind the Planning and Scheduling Timeline andbecause teachers perceived that items had featured content that was not to have been taught yet.For example, several teachers expressed concern about the first item of the fifth-grade Januaryassessment, which required students to multiply two fractions:
We looked at this and flipped. What I did was I just said—I did it quickly— “Whenever you have 4 ×4, I mean four 4’s, when the numerator . . .” I had already taught that, numerator and denominator arethe same equals one whole. “What is one whole? One times anything, so 1 × 3/11?” That is not theway you teach multiplication, but I was able to do it for this. So that was a problem. We looked atthat and could not believe that this was the very first problem and it was not even in our curriculumat this point.
The second main validity concern that teachers expressed was about item construction. Severalteachers mentioned that the language used in particular items confounded their ability to use theinterim assessments to judge their students’ math knowledge, prompting one third-grade teacher toask, “Are we measuring reading or are we measuring math?” These teachers mentioned vocabularyas the main issue—either new mathematical vocabulary (e.g., probability vs. percentage) orvocabulary that may not be part of the everyday experience of their students. In discussing howher class performed on the January assessment, a third-grade teacher considered:
One thing that became clear to me is that the language in some of the word problems was difficultfor them, and that might have been a hang-up. Like with the greeting cards, if you were observant,you saw that no one in that group knew what a greeting card was except for one girl. It was a mathproblem about a box of greeting cards.
In sum, item validation was used as a first check on class-level benchmark results that wereunexpectedly low, or appeared otherwise anomalous. It is worth noting, however, that questions

234 L. NABORS OLAH, N. R. LAWRENCE, AND M. RIGGAN
about validity were almost never raised when students performed well on an item. As discussedlater, in those instances teachers almost always assumed that their students had mastered thecontent and focused on the areas in which they struggled.
TEACHER INTERPRETATIONS OF INTERIM DATA
Teachers’ processes for interpreting data were influenced by a variety of factors, including theirknowledge about specific students’ background or past performance, student performance inrelation to their peers, the position of the specific assessment (or item) within the school district’scurriculum and pacing cycle, or teacher perceptions about which mathematical content wasespecially challenging for students. These factors contributed to the development of implicitteacher “thresholds”—criteria for determining whether student performance (at the individual orclassroom level) required an instructional response during the reteaching week—and shaped theiroverall evaluation of their students’ progress.
Individual “Thresholds” for Interim Assessments
Teachers’ interpretations of interim assessment results revealed the existence of personal “thresh-olds”2 that influenced their interpretation of the data. That is, teachers had in mind a minimumscore on the mathematics assessment that, to them, indicated whether their students had masteredthe concepts introduced during the previous 5 weeks. These personal thresholds were individuallydefined by teachers and influenced by their knowledge of their students and their abilities, aswell as by teachers’ beliefs about content difficulty and how children learn mathematics. Thesethresholds appeared to vary by student, by class, by time (when during the year the assessmentwas given), and by range of students’ responses on the assessments.
In one school, teachers referenced a “green,” “yellow,” and “red” system whereby a greenindicated a score of 85 to 100 (“mastery” or “proficient”), yellow indicated scores between65 and 80 (“strategic”), and red scores of 65 or less were considered “at risk.” These termsseemed to be school defined. Yet, even at this school, teachers appeared to construct their ownpersonal thresholds. Across all the schools, teachers frequently used the terms “advanced” and“proficient” when discussing their students’ scores on the mathematics assessments, even thoughthese terms were not officially used by the district or by schools to indicate levels of studentperformance. Although teachers’ thresholds might also have been influenced by the these morefixed distinctions, their own thresholds appeared more mutable and fluid; they could fluctuate upor down depending on content, context, student, and even from assessment to assessment. It wasclear that teacher thresholds were not haphazardly selected but were shaped by several factors.
2It is worth noting that the term “threshold” was introduced by the research team; it was not native to the teacherlexicon. We used the term in questions included in the data scenario: Are there any students who appear to have masteredthe material? . . . What would you consider the “threshold” for mastery . . . ? Probe: Are there any students who appearto having trouble with this material? . . . What would you consider the “threshold” for recognizing a child as havingdifficulty?

LEARNING TO LEARN FROM BENCHMARK DATA 235
In this section we examine the significance of teachers’ individual thresholds, the ranges of thesethresholds, and the factors that informed them.
The Significance of Teachers’ Thresholds
Given limited time (5 days or less per instructional cycle) for reteaching, teachers must prioritizehow they will spend that time. Thresholds help teachers make hard decisions about where and onwhom to focus. As such, thresholds serve as a critical link between interpretation and action inthe formative assessment cycle. They are a cognitive mechanism that triggers a decision based onindividual teachers’ interpretation of the data. Teachers’ personal thresholds for mastery variedconsiderably, but for most teachers the marker fell between 60% and 80%. Several teachersexplained the meaning of these thresholds:
I always look at 80% or above, which really means that they understand it. . . . If they’re really havingtrouble, I would say below 60, because they’re not passing at all. The ones who are in between are,like, average. They’re kind of getting it, but maybe still having problems. (third-grade teacher)
I would like 75 or higher . . . [70] is still borderline to me, so that’s not enough, not giving me enough.(third-grade teacher)
I think if they’re 70, that’s not good enough. . . . Seventy, to me, means you’re just getting by, by theskin of your teeth. (third-grade teacher)
I would say any one with . . . 80% or higher [has mastery]. And the kids at . . . 70 and 75, are makingprogress. (fifth-grade teacher)
Four primary factors appeared to influence teachers’ personal thresholds: individual student back-ground and characteristics, class characteristics, curriculum design and content, and curriculumpacing.
Student Characteristics
Many teachers maintained a sliding threshold of sorts, adjusting their personal thresholdsdepending on the student. For example, when a third-grade teacher was asked to explain her useof the term “good job” on the mathematics assessment, she said that although she personally“like[s] the 80% or above, depending on the child, if they got a 70%,” she would be satisfied.In interpreting their students’ scores, many teachers relied on their background knowledge ofindividual students, as represented by these two teachers:
If that [student’s benchmark score] seems in line with what I know that the student can do, then I’mhappy. And if it’s not, if I have a student here who’s done, like, 70 or something, then that’s kind ofwhere my focus would be. I’d hone in right there and figure out, “Well, what did he or she do wrong?Normally an A student, [gets a] 70%? What’s going on?” And then try to figure out what [happened].(fifth-grade teacher)
I would look at individual students. And, of course, I would have already made my classroomobservations and all through my unit. And I pretty much know where I expect my higher studentsto be scoring, where I expect my middle students, and so on. . . . But if I saw my higher students,
236 L. NABORS OLAH, N. R. LAWRENCE, AND M. RIGGAN
and they’re scoring down in the 60th percentile, then I would know—send up a little red flag thatsomething’s not right here. (fifth-grade teacher)
Class Characteristics
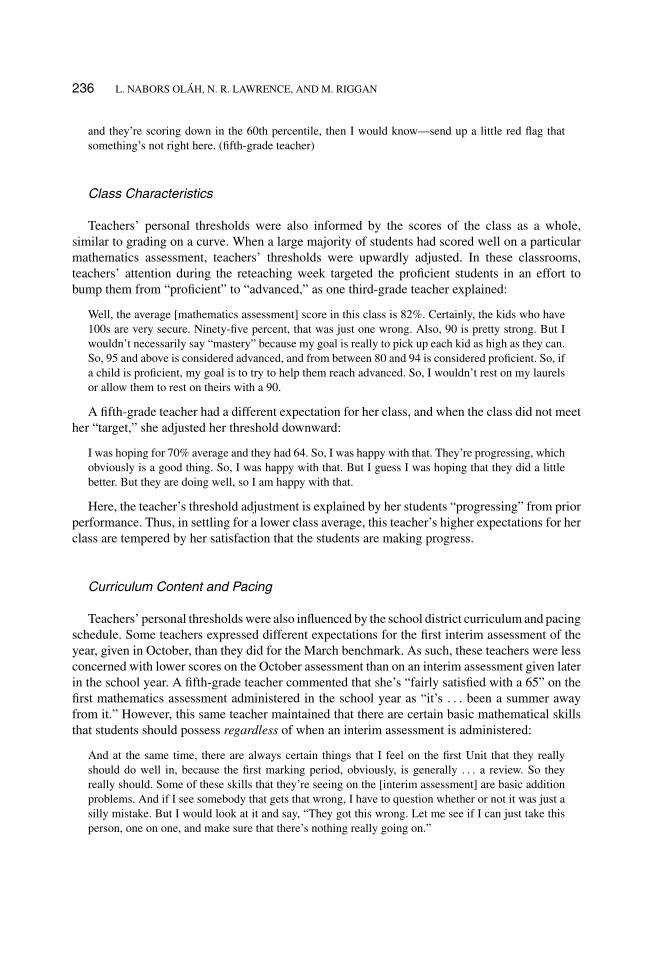
Teachers’ personal thresholds were also informed by the scores of the class as a whole,similar to grading on a curve. When a large majority of students had scored well on a particularmathematics assessment, teachers’ thresholds were upwardly adjusted. In these classrooms,teachers’ attention during the reteaching week targeted the proficient students in an effort tobump them from “proficient” to “advanced,” as one third-grade teacher explained:
Well, the average [mathematics assessment] score in this class is 82%. Certainly, the kids who have100s are very secure. Ninety-five percent, that was just one wrong. Also, 90 is pretty strong. But Iwouldn’t necessarily say “mastery” because my goal is really to pick up each kid as high as they can.So, 95 and above is considered advanced, and from between 80 and 94 is considered proficient. So, ifa child is proficient, my goal is to try to help them reach advanced. So, I wouldn’t rest on my laurelsor allow them to rest on theirs with a 90.
A fifth-grade teacher had a different expectation for her class, and when the class did not meether “target,” she adjusted her threshold downward:
I was hoping for 70% average and they had 64. So, I was happy with that. They’re progressing, whichobviously is a good thing. So, I was happy with that. But I guess I was hoping that they did a littlebetter. But they are doing well, so I am happy with that.
Here, the teacher’s threshold adjustment is explained by her students “progressing” from priorperformance. Thus, in settling for a lower class average, this teacher’s higher expectations for herclass are tempered by her satisfaction that the students are making progress.
Curriculum Content and Pacing
Teachers’ personal thresholds were also influenced by the school district curriculum and pacingschedule. Some teachers expressed different expectations for the first interim assessment of theyear, given in October, than they did for the March benchmark. As such, these teachers were lessconcerned with lower scores on the October assessment than on an interim assessment given laterin the school year. A fifth-grade teacher commented that she’s “fairly satisfied with a 65” on thefirst mathematics assessment administered in the school year as “it’s . . . been a summer awayfrom it.” However, this same teacher maintained that there are certain basic mathematical skillsthat students should possess regardless of when an interim assessment is administered:
And at the same time, there are always certain things that I feel on the first Unit that they reallyshould do well in, because the first marking period, obviously, is generally . . . a review. So theyreally should. Some of these skills that they’re seeing on the [interim assessment] are basic additionproblems. And if I see somebody that gets that wrong, I have to question whether or not it was just asilly mistake. But I would look at it and say, “They got this wrong. Let me see if I can just take thisperson, one on one, and make sure that there’s nothing really going on.”

LEARNING TO LEARN FROM BENCHMARK DATA 237
Teachers’ knowledge of the district’s mathematics curriculum, EM, also appeared to helpshape and determine their personal thresholds. The second edition of EM, in use at the timeof this study, is a spirally structured program, and students receive ongoing opportunities toreview and practice skills and concepts after they are first introduced. Because different skills andconcepts are introduced at different times, the second edition of EM recognized and distinguishedbetween “beginning,” “developing,” and “secure” skills. In discussing their personal thresholds,some teachers expressed less concern for a lower score on a beginning and developing skill thanon a secure skill. One fifth-grade teacher explained:
I would say maybe about 75% of them . . . got it. . . . And plus, I don’t think this was a secure goal atthis time. So, since this is a spiraling program, all of them weren’t supposed to be able to master it.
These so-called beginning skills were recently introduced concepts that the teacher had not de-voted a lot of instructional time to during the 5 weeks that preceded a particular mathematicsassessment. These EM distinctions—beginning, developing, and secure—coupled with the spi-raling nature of EM indicated to the teacher (and the students) that mastery was not expected atthis time. However, the mathematics interim assessments make no such explicit distinctions. Itwas the teachers’ knowledge of EM, of the curriculum’s scope and sequence, and of the pacingguide, that helped them determine how much “weight” and what threshold to set on particularassessment items.
Context of Interpretation
The same set of factors that influenced teachers’ personal thresholds also colored their overallinterpretation of student performance. Teachers interpreted student assessment scores in thecontext of their expectations, both for individual students and for the class as a whole. As discussedin a previous analysis (Nabors Olah et al., 2007), teachers frequently used the interim assessmentsto validate their impressions of student strengths and weaknesses based on other assessments,performance on previous interim assessments, informal observations, or nonacademic backgroundinformation. According to one third-grade teacher:
I can’t say [interim assessment results are] a big surprise, because as we’re going through EverydayMath, we kind of know where kids are, if the interest is there, if the hands are up. You kind of knowif you’re got them, if they’re understanding it.
In contrast, a fifth-grade teacher reflected on being “surprised” by the results of the benchmarkassessments:
Q: If you look at these results from the last thing, is there anything on here that kind of surprises youor jumps out at you?A: Yes. I actually had one student that did surprisingly well compared to how she has done in thepast. So that was something going through this data that really jumped out at me.
Next, a third-grade teacher explains a child’s poor performance on the interim assessment:
This child is the only child that did poorly in my class, but basically because he doesn’t come toschool until 10:00 and we teach math in the morning. So he misses math everyday. So obviously, it’snot a learning problem. It’s a not showing up to school problem.

238 L. NABORS OLAH, N. R. LAWRENCE, AND M. RIGGAN
Diagnosis of Student Understanding and Misconceptions
A crucial question about teacher analysis of interim assessment scores concerns any deeperanalysis that teachers do once they have looked at overall patterns of scores. To investigate thetypes of “diagnoses” that teachers perform, we interviewed all of our teachers about both theirown assessment results and a select number of other items (the misconception probes detailed inthe previous Sampling and Data Sources section). In the latter case, the important question weasked of teachers was “What might the student be thinking?” (when the student answered thequestion incorrectly). We see this moment of analysis as a critical juncture between the reportingof interim assessment data and modification of instruction. In this section, we describe the waysin which teachers attributed diagnostic information to individual student performance on specificitems. We recognize that the four categories detailed next may simplify what is, for many teachers,a very complex decision-making process, and we do not claim that these categories are mutuallyexclusive. In fact, teachers may attribute student performance to multiple factors simultaneouslyor the difference between some categories may not be as discrete as researchers have assumed itto be (Baroody, Feil, & Johnson, 2007). We therefore view this analysis as a starting point forfurther inquiry.
By far the most common diagnosis of student error on actual benchmark assessment items fellinto what we call the procedural category. Diagnoses of this type focused on missteps in applyingalgorithms or on computational error. More than half of teacher diagnoses included some kindof procedural diagnosis; students were seen to have particular difficulty with items that requiredmultiple steps to reach an answer. For example, one third-grade teacher, considering her students’performance on the January benchmark assessment, commented that “doing the double-digitsubtraction problems with regrouping, that was the most problematic, I thought, because theywere still having trouble with that process of doing the regrouping.”
A less frequently mentioned set of diagnoses fell into a conceptual category, in which teachersmentioned problems in students understanding basic definitions or more complex ideas. Forinstance, when speaking about their own class’ results, third-grade teachers mentioned that itemsfeaturing place value were some of the most difficult for students, whereas fifth-grade teacherspointed to fractions as the one subcontent area that the interim assessments drew attention to.One fifth-grade teacher explained her interpretation of some students’ responses to a fractionidentification item that used an area model:
I remember there was one question, it had four boxes and the first three were shaded in, and the lastone, it didn’t have individual boxes inside shaded in. It just had three-fourths of it. And I think someof the students thought—I don’t think they put together that each one of those [the big boxes] couldbe divided up into four, so that the denominator would have been 20, because there were four in eachof the five boxes. They were thinking of them as wholes.
A few teachers mentioned that word problems also had the potential to pose conceptual problemsfor students in that students must know about different algorithms and be able to choose thecorrect one to apply.
Many teachers also attributed student errors to other cognitive weaknesses. These includeda list of possible causes for student underperformance, including, but not limited to, weakreading ability, difficulty maintaining attention, and low levels of English language proficiency.As might be expected, errors on word problems and on multistep procedural problems most

LEARNING TO LEARN FROM BENCHMARK DATA 239
frequently elicited this type of diagnosis. For example, a third-grade teacher in a school with ahigh proportion of English Language Learner students believed that a subtraction word problemthat ended with the words “how many more marbles does he need?” had posed difficulty becausewhen her students saw the word more, they summed the minuend and subtrahend instead ofsubtracting the latter from the former. She believed that her students “just say, Oh, ‘more,’altogether, let’s add.” Although our questions focused on teacher response to student error, onefifth-grade teacher attributed a student’s superior performance to increased attention to task inthat, as the teacher explained, “he usually doesn’t do quite that well. . . . It goes to show you whathe can do when he is paying attention, because he did exceptionally well.”
Finally, teachers also offered contextual or external diagnoses, according to which studentmathematical performance fell short due to factors that were seen to be outside of the teacher’s orschool’s realm of influence. These tended to consist of perceived distal causes of the other proximaldiagnoses. For example, several teachers mentioned students’ lack of background knowledge ascontributing to difficulties in comprehending word problems. A teacher who taught two classesof mathematics mentioned that one class was “calmer” than the other class, giving all studentsthe opportunity to “get more into the work . . . [taking] more time to look things over.” We arevery interested in examining teacher planning in response to contextual/external diagnoses sinceit seems that a teacher’s concept of his or her role in facing this type of challenge can vary greatly.For example, some teachers may use diagnoses of this type to demonstrate the lack of influencethat their instruction can have on student performance, while other teachers may believe that itis primarily because of these external obstacles that they must try even harder to increase theirstudents’ learning.
INSTRUCTIONAL RESPONSE TO INTERIM ASSESSMENT DATA
Philadelphia teachers appear to have some latitude in planning their lessons and activities duringthe 6th week of the district’s instruction and assessment cycle, the reteaching week. The district’sexpectations for how teachers should address their instruction are guided, at least on paper, bythe Benchmark Data Analysis Protocol. The district-created protocol is designed to help teachersidentify weak points in their students’ performance; and articulate strategies for regrouping,reteaching, and reassessment. In addition, it asks teachers to reflect on how they can betterdifferentiate their instruction to meet the needs of all students. (For more detail on the DataAnalysis Protocol, please see Bulkley et al., 2001/this issue.)
Beyond the Benchmark Data Analysis Protocol, there seemed to be little guidance for teachersabout how to act upon their analyses of interim assessment data. Still, it appeared that many third-and fifth-grade teachers adopted common instructional responses and strategies. Next we detailteachers’ instructional responses to the interim assessment results and their approaches takenduring the reteaching week.
A “TRIAGE” APPROACH
During the reteaching week, third- and fifth-grade teachers generally seemed to follow a “triage”approach to instructional planning on the basis of interim assessment results, devoting the greatest

240 L. NABORS OLAH, N. R. LAWRENCE, AND M. RIGGAN
amount of time and effort to those students and content areas that most urgently required theirattention. A fifth-grade teacher succinctly summed up this approach saying, “I can’t reteach everysingle thing.” Using their personal thresholds as barometers for their students’ mathematicalmastery and understanding, teachers decided whom to target and what to emphasize during the 5days that followed the administration and scoring of the benchmark. In moving from analyzingthe interim assessment results to planning instruction, many teachers looked for particular itemsthat gave the class trouble and also determined if each was challenging for just a few students orfor many. According to a third-grade teacher,
If it’s half the class . . . I’ll just reteach the whole thing. But if it’s a few children, . . . then I woulddefinitively pull them out and get some special homework for them to work on.
In general, teachers targeted the lower performing students and those content areas that provedthe most problematic for students. Or, put another way, in the words of a fifth-grade teacher,“I’m not going to waste a whole lesson reteaching something that 90% of the students got. That’sjust not beneficial for the other students.” Many teachers described a similar approach. Next, afifth-grade teacher described how she begins to decide what content needs to be retaught and towhom:
A lot of kids got the same ones wrong. Like, for example, [item] 5. There’s a lot of kids who got[item] 5 wrong. And a lot of kids who got [item] 14 wrong. So, then I go back and I see, “Well, whatwas that question and what was it that the question was asking?” . . . So, then, I would take a look atthat and see, “OK, well, I need to reteach that.”
At the same time, many teachers took note of what they apparently had taught well and, basedon the results of the assessment, that their students had understood. According to one fifth-gradeteacher, “OK, [items] six and seven look good. . . . So, these two tell me that they’re pretty solidon this. So, this isn’t something that I necessarily have to go over.”
HIGH-SCORING STUDENTS
Overall, there seemed to be less direct instructional attention given to students who had scored highon the mathematics assessments. Although teachers mentioned their high scorers in interviews,in planning for the reteaching week their focus was on the students who had not done well.“Enrichment” for high-scoring students often consisted of short-term activities, extra worksheets,more EM game time, and time on the computer. There was evidence from both third- and fifth-grade teachers that high-scoring students received less direct instruction during the district’sreteaching week. A fifth-grade teacher remarked,
I don’t want to say [high-scoring students] get busy work, but they would be the ones who I mightgive an independent or a small group project to do, creating a graph. Everyday Math, our math series,has games. They’re . . . educational games.
Teachers often turned to their high scorers for instructional support in the form of peer teaching.It was not uncommon for these higher scoring students to be paired with their lower performingpeers during the reteaching week. As one fifth-grader teacher noted, “[Students scoring in] the50s and [the student who scored] 65, I think I would definitely have them working maybe with
LEARNING TO LEARN FROM BENCHMARK DATA 241
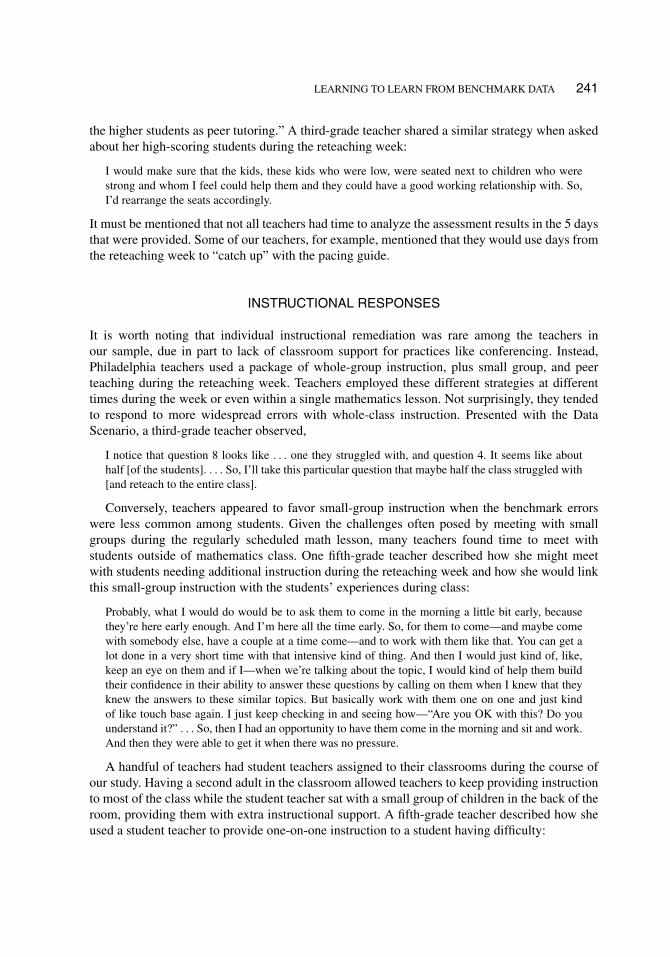
the higher students as peer tutoring.” A third-grade teacher shared a similar strategy when askedabout her high-scoring students during the reteaching week:
I would make sure that the kids, these kids who were low, were seated next to children who werestrong and whom I feel could help them and they could have a good working relationship with. So,I’d rearrange the seats accordingly.
It must be mentioned that not all teachers had time to analyze the assessment results in the 5 daysthat were provided. Some of our teachers, for example, mentioned that they would use days fromthe reteaching week to “catch up” with the pacing guide.
INSTRUCTIONAL RESPONSES
It is worth noting that individual instructional remediation was rare among the teachers inour sample, due in part to lack of classroom support for practices like conferencing. Instead,Philadelphia teachers used a package of whole-group instruction, plus small group, and peerteaching during the reteaching week. Teachers employed these different strategies at differenttimes during the week or even within a single mathematics lesson. Not surprisingly, they tendedto respond to more widespread errors with whole-class instruction. Presented with the DataScenario, a third-grade teacher observed,
I notice that question 8 looks like . . . one they struggled with, and question 4. It seems like abouthalf [of the students]. . . . So, I’ll take this particular question that maybe half the class struggled with[and reteach to the entire class].
Conversely, teachers appeared to favor small-group instruction when the benchmark errorswere less common among students. Given the challenges often posed by meeting with smallgroups during the regularly scheduled math lesson, many teachers found time to meet withstudents outside of mathematics class. One fifth-grade teacher described how she might meetwith students needing additional instruction during the reteaching week and how she would linkthis small-group instruction with the students’ experiences during class:
Probably, what I would do would be to ask them to come in the morning a little bit early, becausethey’re here early enough. And I’m here all the time early. So, for them to come—and maybe comewith somebody else, have a couple at a time come—and to work with them like that. You can get alot done in a very short time with that intensive kind of thing. And then I would just kind of, like,keep an eye on them and if I—when we’re talking about the topic, I would kind of help them buildtheir confidence in their ability to answer these questions by calling on them when I knew that theyknew the answers to these similar topics. But basically work with them one on one and just kindof like touch base again. I just keep checking in and seeing how—“Are you OK with this? Do youunderstand it?” . . . So, then I had an opportunity to have them come in the morning and sit and work.And then they were able to get it when there was no pressure.
A handful of teachers had student teachers assigned to their classrooms during the course ofour study. Having a second adult in the classroom allowed teachers to keep providing instructionto most of the class while the student teacher sat with a small group of children in the back of theroom, providing them with extra instructional support. A fifth-grade teacher described how sheused a student teacher to provide one-on-one instruction to a student having difficulty:

242 L. NABORS OLAH, N. R. LAWRENCE, AND M. RIGGAN
And now I have a student teacher, so I can have her work with students that really just are not gettingthis. What we are working on today, one student just was not getting it at all. So I sent her into thehallway with the student teacher and they just worked on it. And then I’m in here, working with theothers.
In two of the schools, we observed regular volunteers in the classroom. These volunteers, oftenretired citizens who helped out in the same scheduled classrooms for as much as 4 hours a day,three to four times a week, would also work with a small group of children needing additionalinstructional help.
As alluded to previously, an additional strategy, often used to supplement whole-group andsmall-group instruction, was peer teaching. In part, we suspect that peer teaching proved such apopular instructional strategy for teachers because of limited resources. That is, many teacherswere pretty much “on their own” in their classrooms and relied on stronger students to help teachthe students who had performed less well on the interim assessments.
A fifth-grade teacher described her approach:
A lot of times I’ll get another student to help with that, because a lot of times students are better withother students. And if you get a student who’s really good at letting another student learn, not to showthem, “This is the answer. Write that down,” but explain. . . . I have a couple students that are reallygood at that, with explaining stuff.
At least one teacher expressed concerns about peer teaching, cautioning that “buddy work is fine,but sometimes it doesn’t work. The other kids don’t want to do it, they’re tired of doing it, they’retired of helping.”
Procedural Emphasis
Just as teachers’ diagnoses emphasized procedural challenges, teachers’ reteaching activities ap-peared to focus first on retracing and correcting procedural steps. A third-grade teacher describedhow she would focus on “step-by-step” procedures and also on test-taking strategies:
Tell them to look for, like, key words and clue words and things like that. Underline and pull out yourinformation. And a lot of time they just . . . they add it up. They’re not reading what the question isasking. So, that’s another big thing that I take my time and teach . . . step by step. . . . It could take usa half hour to do one problem because I make sure that they pull out the information.
Another third-grade teacher referenced and credited the district’s mathematics program fordirecting their instructional attention to procedural missteps:
Another nice thing I like about Everyday Math is that they structure so many things and they give youso many nice sheets that you can give the students where they are encouraged to answer a questionin a certain way so that, for instance with this kind of a problem, they have a sheet that’s set up witha tenths column, a hundredths, a one, and so forth. And I need to see them answer it in a certain way,if for no other reason that, if it simply comes down to a student adding 3 and 4 incorrectly, I can seethat otherwise, they knew exactly which steps to do. And you know, 3 and 4 incorrectly, that’s oneissue. That could have just been moving quickly. But there’s the process in place. And that’s whylooking at the particular missed answers is so important.

LEARNING TO LEARN FROM BENCHMARK DATA 243
Again, it appears that evident patterns in teachers’ analysis of interim assessment data (in thiscase an emphasis on procedural diagnosis) were paralleled in their instructional responses. Intending to students’ procedural mistakes first during the reteaching week, teachers themselvesappeared to be observing a sequential, step-by-step response.
Changes in Instructional Practice
Despite this procedural emphasis, analyzing these assessments appeared to prompt a few teachersto adopt new or different instructional practices. Many teachers held the belief that “teachingcontent another way” would help lower performing students acquire skills and concepts thesecond time around. A third-grade teacher noted,
I would definitely try a different approach, because, obviously, they didn’t get it the first way I did it.Or some kids develop at different stages. So, they might get it the second time I teach it. I would tryand do it . . . a little bit differently.
When another third-grade teacher was asked if her teaching would vary during the reteachingweek, she responded,
It depends. If most of the class got it right, got certain questions right, then I would feel that it was apretty effective way to teach that, and that these children might just need a little extra push, a littlemore support, to get it. And if they didn’t, the reason I would be in a small group with them is to tryto find out why that technique didn’t work for them, and whether I need to change the vocabulary orthe way I’m presenting it, or give them more visual aids and more strategies.
Many times, this “other way” featured the use of visualization or manipulatives, almost as ascripted response. Moreover, use of these approaches did not seem to depend on the contentbeing taught, or even the errors that were made, but rather the belief that variety of presentation,or exposure to multiple representations, is beneficial to learning. When a fifth-grade teacherwas asked how she would correct a misconception about comparing the size of fractions, sheresponded,
Different ways of looking at fractions, like maybe cups of water. Maybe not so much 7/12 as maybegoing back to just doing 1/3, 1/2, and 1/4, like simply benchmark fractions that they might know.Because ask a kid to give a fraction and they invariably say, “Oh, one half!” And everything is onehalf. That’s their idea of a fraction. . . . Of course, it is a fraction, but they don’t really know whatthat represents. And so what I would do is probably go back to easy ones and start with that and thenwork up. I would probably try to get them to give me the definition of what that denominator is, andwhat that really means, and then go back and ask them again if they thought that that was—they’d behappy with that part of the pie. I might ask them to draw me a picture of what it is that that they werelooking at. “Draw me 7/12 of a pie. Draw all of these and show me what this ate.” I might ask anotherquestion about how much is one-half of something and three fourths? I think the pictures wouldbe—kind of let me know. And so if they showed me 12, and then shaded in seven twelfths, then I’dbe really stumped, because then I’d really have to talk to them about it. Because that’s a serious—Ifthey could actually represent 7/12 shaded in and all the pies were the same, I really would have tostep back and say, “What the heck are they thinking?” and then just maybe go back and do—otherthan pies—some kind of manipulative. Maybe Hershey bars or arrays or something like that.

244 L. NABORS OLAH, N. R. LAWRENCE, AND M. RIGGAN
Instructional Follow-Up Beyond the Reteaching Week
As noted elsewhere in this article, the spiraling nature of the second edition of EM guaranteesthat certain concepts and content will be revisited for additional and more detailed instruction atsome point in the future—both within a given school year and from grade to grade. Teachers wellversed in the curriculum knew that students who did not master particular mathematical contentin a specified time would have many more opportunities for mastery later on.
Although a small number of teachers noted that they might give a test or quiz at the end of the6th week to gauge their students’ understanding during the 5 days in which they retaught, theredid not appear to be any common or uniform “measurement” that teachers administered to theirstudents. When one 6-week cycle ended (typically on a Friday), a new cycle began the followingMonday.
CONCLUSION
What is striking in our study of teachers’ use of assessments is just that—teachers’ use. As wehave stated elsewhere, and it bears repeating here, teachers are using these assessments. Althoughteachers may not always be using them in the way the district intends them to be used, the factremains that they are consulting, analyzing, and acting on interim assessment results.
A more significant question is how the interim assessments are being used. Here we findsomething of a mixed picture. On one hand, teachers use these assessments to identify areas ofemphasis (both content and students) during the reteaching week, and they are adept at linkingitems with state standards and academic content areas. This set of practices and competencies isvery much in line with the district’s intent. On the other hand, the teachers by and large did not usethe interim assessments to make sense of students’ conceptual understanding of the content, norwere they helpful for diagnosing errors in anything beyond a procedural way. Future analyses willexplore the extent to which teachers’ conceptual knowledge of mathematics teaching influencedtheir capacity to use the assessments in this manner. What seems clear, however, is that theinterim assessments themselves are, as currently constituted, ill-suited to this purpose. In mostcases, teachers could learn little from students’ incorrect responses to items.
Finally, the tendency to analyze the data in procedural ways was paralleled by a tendencytoward procedural instructional responses. The interim assessments appeared to alert teachers tothe fact that they needed to “teach differently,” but the type of change required did not necessarilyrelate back to anything teachers learned from the assessments. Instead, teachers seemed to drawfrom a set repertoire of instructional strategies; if one did not work, they simply moved toanother. Overall, it appears that the manner in which teachers act on their interpretations ofinterim assessments was aligned in a broad way with their intended use, but that limitations intheir analyses of those data ultimately led to a relatively superficial approach to instructionalplanning and response.
REFERENCES
Bangert-Drowns, R. L., Kulik, J. A., & Morgan, M. T. (1991). The instructional effect of feedback in test-like events.Review of Educational Research, 61, 213–238.

LEARNING TO LEARN FROM BENCHMARK DATA 245
Baroody, A. J., Feil, Y., & Johnson, A. R. (2007). An alternative reconceptualization of conceptual and proceduralknowledge. Journal for Research in Mathematics Education, 38, 115–131.
Black, P., & Wiliam, D. (1998). Assessment and classroom learning. Assessment in Education: Principles, Policy &Practice, 5(1), 7–75.
Bulkley, K. E., Christman, J. B., Goertz, M. E., & Lawrence, N. R. (2010/this issue). Building with benchmarks: Therole of the district in Philadelphia’s benchmark assessment system. Peabody Journal of Education, 85(2), 186–204.
Fuchs, L. S., & Fuchs, D. (1986). Effects of systematic formative evaluation: A meta-analysis. Exceptional Children, 53,199–208.
Kluger, A. N., & DeNisi, A. (1996). The effects of feedback interventions on performance: A historical review, ameta-analysis, and a preliminary feedback intervention theory. Psychological Bulletin, 119, 254–284.
Nabors Olah, L., Lawrence, N., Goertz, M., Weathers, J., Riggan, M., & Anderson, J. (2007, April). Testing to the test?Expectations and supports from interim assessment use. Paper presented at the annual meeting of the AmericanEducational Research Association, Chicago.
Perie, M., Marion, S., Gong, B., & Wurtzel, J. (2007). The role of interim assessments in a comprehensive assessmentsystem: A policy brief. Washington, DC: The Aspen Institute.
School District of Philadelphia. (2006). A year at a glance: Planning and scheduling timelines, 2006-2007. Philadelphia:Author.

Copyright of PJE. Peabody Journal of Education is the property of Taylor & Francis Ltd and its content may not
be copied or emailed to multiple sites or posted to a listserv without the copyright holder's express written
permission. However, users may print, download, or email articles for individual use.