learning organization, organizational innovativeness and … · 2015-01-13 · learning...
TRANSCRIPT

LEARNING ORGANIZATION, ORGANIZATIONALINNOVATIVENESS AND THE PERFORMANCE OF
SMALL AND MEDIUM ENTERPRISEIN BANGKOK, THAILAND
WORALUCK LALITSASIVIMOL
DOCTOR OF BUSINESS ADMINISTRATIONUNIVERSITI UTARA MALAYSIA
February 2014
WO
RA
LU
CK
LE
AR
NIN
G O
RG
AN
IZA
TIO
N, O
RG
AN
IZA
TIO
NA
L IN
NO
VA
TIV
EN
ESS
LA
LIT
SASIV
IMO
L A
ND
TH
E P
ER
FO
RM
AN
CE
OF
SMA
LL
AN
D M
ED
IUM
EN
TE
RP
RISE
IN B
AN
GK
OK
,TH
AIL
AN
D
DBA 2014
LEARNING ORGANIZATION, ORGANIZATIONAL INNOVATIVENESSAND THE PERFORMANCE OF SMALL AND MEDIUM ENTERPRISE
IN BANGKOK, THAILAND
BY
WORALUCK LALITSASIVIMOL
Dissertation Submitted toOthman Yeop Abdullah Graduate School of Business,
Universiti Utara Malaysia,in Fulfillment of the Requirement for the Degree of Doctor of Business Administration
iv
PERMISSION TO USE
In presenting this dissertation in partial fulfillment of the requirements for a PostGraduate degree from the Universiti Utara Malaysia (UUM), I agree that theLibrary of this university may make it freely available for inspection. I furtheragree that permission for copying this dissertation in any manner, in whole or inpart, for scholarly purposes may be granted by my supervisor(s) or, in her absenceby the Dean of Othman Yeop Abdullah Graduate School of Business where I didmy dissertation. It is understood that any copying or publication or use of thisdissertation parts of it for financial gain shall not be allowed without my writtenpermission. It is also understood that due recognition shall be given to me and tothe UUM in any scholarly use which may be made of any material in mydissertation.
Request for permission to copy or to make other use of materials in thisdissertation in whole or in part should be addressed to:
Dean of Othman Yeop Abdullah Graduate School of BusinessUniversiti Utara Malaysia
06010 UUM SintokKedah Darul Aman

v
ABSTRACT
This study investigated the relationship between learning organization,organizational innovativeness and the performance of small and mediumenterprise (SME) in Bangkok, Thailand. Previous research found the learningorganization and performance of large, medium and small firms to havesignificant positive relationships. However, little is known about the mediatingeffects of organizational innovativeness on learning organization andorganizational performance relationships. Therefore, a gap remains in theempirical confirmation. In this study, the independent variables of learningorganization included seven observed variables, namely continuous learning,inquiry and dialogue, team learning, embedded systems, system connection,empowerment and strategic leadership. The dependent variable was organizationalperformance. Organizational innovativeness acts as the mediator between learningorganization constructs and organizational performance. The method ofquantitative data collection was conducted by using mail surveys. A response rateof 39.2 per cent was obtained for the analysis of Thai SMEs throughout Bangkok.Structural Equation Modeling (SEM) was used with the Analysis of MomentStructures (AMOS) 18.0 to analyze the data. This study found four dimensions,namely continuous learning, embedded system, system connection and strategicleadership to have significant impacts on organizational innovativeness. Twodimensions, namely inquiry and dialogue, and team learning were found to havesignificant impacts on organizational performance. Organizational innovativenesshas a significant impact on organizational performance. At the same time,organizational innovativeness also acts as the mediator between four dimensionsof learning organization and organizational performance. The findings will assistSME owners and managers and government policy makers in learning efforts andin fostering innovativeness leading to superior performance.
Keywords: learning organization, organizational innovativeness, organizationalperformance, small and medium enterprise
vi
ABSTRAK
Kajian ini mengkaji tentang hubungan antara organisasi pembelajaran, inovasiorganisasi dan prestasi perusahaan kecil dan sederhana (PKS) di Bangkok,Thailand. Kajian sebelum ini mendapati bahawa organisasi pembelajaran danprestasi perusahaan besar, sederhana dan kecil mempunyai hubungan positifyang ketara. Walau bagaimanapun, hanya sedikit sahaja yang diketahui tentangkesan pengantara inovasi kepada organisasi pembelajaran dan hubungan prestasiorganisasi. Oleh itu, jurangnya masih kekal dalam pengesahan yang empirikal.Dalam kajian ini, pembolehubah bebas bagi organisasi pembelajaran termasuktujuh pembolehubah bersandar yang diperhatikan iaitu, pembelajaran berterusan,siasatan dan dialog, pasukan pembelajaran, sistem terbenam, sambungan sistem,kepimpinan kuasa dan strategik. Pembolehubah bersandar ialah prestasiorganisasi. Inovasi organisasi bertindak sebagai pengantara di antara membinaorganisasi pembelajaran dan prestasi organisasi. Kaedah pengumpulan datakuantitatif telah dijalankan dengan menggunakan kaedah kaji selidik melelektronik. Kadar tindak balas sebanyak 39.2 peratus telah diperolehi bagi analisisPKS Thailand di seluruh Bangkok. Kaedah Structural Equation Modeling (SEM)telah digunakan dengan Analisis Struktur Moment (AMOS) 18.0 untukmenganalisis data. Kajian ini mendapati bahawa empat dimensi iaitupembelajaran berterusan, sistem terbenam, sambungan sistem dan kepimpinanstrategik mempunyai kesan ketara ke atas inovasi organisasi. Manakala duadimensi iaitu siasatan dan dialog, dan pasukan pembelajaran didapati mempunyaiimpak yang ketara ke atas prestasi organisasi. Inovasi organisasi juga mempunyaiimpak yang ketara ke atas prestasi organisasi. Pada masa yang sama, inovasiorganisasi juga bertindak sebagai pengantara di antara empat dimensi organisasipembelajaran dan prestasi organisasi. Hasil kajian akan membantu pemilik danpengurus PKS dan pembuat dasar kerajaan dalam usaha pembelajaran danmemupuk inovasi yang membawa kepada prestasi yang unggul.
Kata kunci: organisasi pembelajaran, inovasi organisasi, prestasi organisasi,perusahaan kecil dan sederhana
vii
ACKNOWLEDGEMENTS
I would like to thank all the people who have contributed their support
throughout the completion of this dissertation
First of all, I would really like to thank my supervisor Associate Professor
Dr.Faudziah Hanim Hj Fadzil, for dedicating her invaluable guidance,
encouragement, comments, patience, faith in me for completing this dissertation.
Last not least, I am truly thankful for the support and love provided by my
husband, Mr. Nukool Chinfuk, and my parents and friends for their everlasting
inspiration and giving me all the opportunities in the world to explore my
potentials and pursue my dreams. Their sincere flow of love has accompanied me
all the way in my long struggle and has pulled me through many obstracles.
Therefore, this dissertation is dedicated to them.

viii
TABLE OF CONTENTS
TITLE PAGE i
CERTIFICATION OF THESIS/DISSERTATION ii
PERMISSION TO USE iv
ABSTRACT v
ABSTRAK vi
ACKNOWLEDGEMENTS vii
TABLE OF CONTENTS viii
LIST OF TABLES xv
LIST OF FIGURES xvii
LIST OF ABBREVIATIONS xviii
CHAPTER ONE INTRODUCTION
1.0 Background of the Study 1
1.1 Problem Statement 10
1.2 Research Questions 13
1.3 Research Objectives 14
1.4 Significance of the Study 15
1.5 Scope and Limitations of the Study 16
1.6 Organization of the Study 17
CHAPTER TWO LITERATURE REVIEW
2.0 Introduction 19
2.1 Overview of Small and Medium Enterprises in Thailand 19
2.2 Conceptualization of Learning Organization 23
2.2.1 Learning Prescriptions by the Organizational Scholars 24
2.2.1.1 Senge’s Prescription 24
2.2.1.2 Watkins and Marsick’s Prescription 26
2.2.1.3 Pedler, Burgoyne, and Boydell’s Prescription 28

ix
2.2.1.4 DiBella and Nevis’s Prescription 30
2.2.1.5 Garvin’s Prescription 32
2.2.1.6 Comparison of Learning Organization Expert’s
Prescription 34
2.2.2 Defining Learning Organization Process 35
2.2.3 Levels of Organizational Learning Process 38
2.2.3.1 Individual Learning Level 38
2.2.3.2 Group or Team Learning Level 39
2.2.3.3 Organizational Learning Level 40
2.2.3.4 Dimensions of the Learning Organization Questionnaire
(DLOQ) 41
2.3 Conceptualization of Organizational Innovativeness 43
2.4 Conceptualization of Organizational Performance 47
2.5 Empirical Studies on Learning Organization and
Organizational Performance 51
2.6 Empirical Studies concerning Learning Organization,
Organizational Innovativeness and Organizational Performance 69
2.7 The Underpinning Theory 85
2.7.1 Resource-Based View of the Firm 85
2.8 Chapter Summary 88
CHAPTER THREE RESEARCH FRAMEWORK AND METHODOLOGY
3.0 Introduction 90
3.1 Research Framework of the Study 90
3.2 Hypotheses Development 92
3.2.1 Learning Organization and Organizational Innovativeness 93
3.2.2 Learning Organization and Organizational Performance 95
3.2.3 Organizational Innovativeness and Organizational Performance 96
3.2.4 Learning Organization, Organizational Innovativeness, and
Organizational Performance 97
3.3 Research Design 99
3.4 Operational Definitions of Variables 100

x
3.5 Measurement of Variables 102
3.5.1 Measurement of Learning organization 102
3.5.2 Measurement of Organizational Innovativeness 103
3.5.3 Measurement of Organizational Performance 103
3.6 Data Collection 103
3.6.1 Population 103
3.6.2 Sampling 104
3.6.2.1 Sample Size 104
3.6.2.2 Sampling Procedure 105
3.6.3 Questionnaire Translation 106
3.6.4 Pilot Study 107
3.6.4.1 Reliability Test 108
3.6.4.2 Validity Test 109
3.6.5 Data Collection Procedure 110
3.6.6 Questionnaire Design 111
3.7 Technique of Data Analysis 113
3.7.1 Examining Data 113
3.7.2 Descriptive Statistic 113
3.7.3 Normality Test 113
3.7.4 Reliability and Validity Test 114
3.7.5 Factor Analysis 114
3.7.6 Structural Equation Modeling (SEM) 115
3.8 Chapter Summary 115
CHAPTER FOUR ANALYSIS AND FINDINGS
4.0 Introduction 117
4.1 Non-Response Bias Test 117
4.2 Data Screening and Outliers 119
4.2.1 Outlier Checking (Mahalanobis Distance) 119
4.2.2 Missing Data 121
4.2.3 Descriptive Statistic 121
4.2.3.1 Demographic Profile of the Respondents 123

xi
4.2.4 Univariate Normality 125
4.2.5 Multicollinearity Tests 125
4.2.6 Reliability Test 126
4.2.7 Validity Test 128
4.3 Goodness of Fit measures 136
4.4 Confirmatory Factor Analysis (CFA) 138
4.4.1 Measurement of the Model using Confirmatory Factor Analysis 138
4.4.1.1 Confirmatory Factor Analysis of Learning Organization 138
4.4.1.2 Confirmatory Factor Analysis of Organizational
Innovativeness 142
4.4.1.3 Confirmatory Factor Analysis of Organizational
Performance 144
4.5 Hypothesized Model 146
4.5.1 Goodness of Fit Analysis – Hypothesized Model 146
4.5.2 Direct Impact of Hypothesized Model 147
4.6 Modified Model 149
4.6.1 Goodness of Fit Analysis – Modified Model 149
4.6.2 Hypotheses Test 150
4.7 Mediating Variable 159
4.7.1 Mediating Effects of Organizational Innovativeness on
Learning Organization and Organizational Performance 160
4.8 Chapter Summary 162
CHAPTER FIVE CONCLUSION AND RECOMMENDATION
5.0 Introduction 164
5.1 Summary of the Study 164
5.2 Recapitulation of Major Findings 169
5.3 Discussions to Hypotheses 170
5.3.1 Hypothesis 1: Relationship between continuous learning
and organizational innovativeness 170
5.3.2 Hypothesis 2: Relationship between inquiry and dialogue
and organizational innovativeness 170
xii
5.3.3 Hypothesis 3: Relationship between team learning and
organizational innovativeness 171
5.3.4 Hypothesis 4: Relationship between embedded system
and organizational innovativeness 171
5.3.5 Hypothesis 5: Relationship between empowerment and
organizational innovativeness 171
5.3.6 Hypothesis 6: Relationship between system connection
and organizational innovativeness 172
5.3.7 Hypothesis 7: Relationship between strategic leadership
and organizational innovativeness 172
5.3.8 Hypothesis 8: Relationship between continuous learning
and organizational performance 173
5.3.9 Hypothesis 9: Relationship between inquiry and dialogue
and organizational performance 173
5.3.10 Hypothesis 10: Relationship between team learning
and organizational performance 174
5.3.11 Hypothesis 11: Relationship between embedded system
and organizational performance 175
5.3.12 Hypothesis 12: Relationship between empowerment
and organizational performance 175
5.3.13 Hypothesis 13: Relationship between system connection
and organizational performance 176
5.3.14 Hypothesis 14: Relationship between strategic leadership
and organizational performance 177
5.3.15 Hypothesis 15: Relationship between organizational
innovativeness and organizational performance 177
5.3.16 Hypothesis 16: Organizational innovativeness mediates
the relationship between continuous learning and
organizational performance 178
5.3.17 Hypothesis 17: Organizational innovativeness mediates
the relationship between inquiry and dialogue and
organizational performance 178

xiii
5.3.18 Hypothesis 18: Organizational innovativeness mediates
the relationship between team learning and
organizational performance 179
5.3.19 Hypothesis 19: Organizational innovativeness mediates
the relationship between embedded system and
organizational performance 179
5.3.20 Hypothesis 20: Organizational innovativeness mediates
the relationship between empowerment and
organizational performance 180
5.3.21 Hypothesis 21: Organizational innovativeness mediates
the relationship between system connection and
organizational performance 180
5.3.22 Hypothesis 22: Organizational innovativeness mediates
the relationship between strategic leadership and
organizational performance 181
5.4 Implications of the Study 184
5.4.1 Theoretical Implications 184
5.4.2 Practical and Policy Implications 186
5.5 Recommendations for Future Research 187
5.6 Conclusions 189
REFERENCES 190
APPENDICES
Appendix A Permission to Use the DLOQ 216
Appendix B Cover Letter 219
Appendix C Questionnaire 221
Appendix D Chi-square Value 232
Appendix E Missing Data 234

xiv
Appendix F Descriptive Statistics of Variables 236
Appendix G Assessment of Normality 239
Appendix H Reliability Test and Composite Reliability 241
Appendix I Variance Extracted and Correlation Matrix 249
Appendix J Normal P-P Plots and Q-Q Plots 252
Appendix K Measurement Model 270
Appendix L Structural Model 274

xv
LIST OF TABLES
Table Page
Table 2.1 Definition of SMEs in Thailand 21
Table 2.2 Summary of Literature on Learning Organziation and
Organizational Performance 63
Table 2.3 Summary of Literature concerning Learning Organization,
Organizational Innovativeness, and Organizational Performnace 80
Table 3.1 Operational Definition of Variables 100
Table 3.2 Reliability Analysis of the Pilot Study 108
Table 3.3 Summary of Survey Response Rate 111
Table 4.1 Test of Non-Response Bias between Group Differences of
Early 40 percent and Late 60 percent 118
Table 4.2 Outlier Detection (Mahalanobis Distance) 120
Table 4.3 Descritive Statistics of Variables 122
Table 4.4 The Demographic Profile of the Respondents consist of
the Seven Major Items 123
Table 4.5 Multicollinearity Test – Variance Inflation Factor (VIF)
and Tolerance 126
Table 4.6 Descriptive Statistic of Reliability 126
Table 4.7 Convergent Validity – Confirmatory Factor Analysis (CFA) 130
Table 4.8 Average Variance Extracted (AVE) of Variables 134
Table 4.9 Correlation Square Matrix between Variables 135
Table 4.10 Goodness of Fit Indices and Acceptable of Cutoff Value 138

xvi
Table 4.11 Summary Finding – Confirmatory Factor Analysis of
Learning Organization 139
Table 4.12 Model Fit Results – Confirmatory Factor Analysis of
Learning Organization 140
Table 4.13 Summary Finding – Confirmatory Factor Analysis of
Organizational Innovativeness 142
Table 4.14 Model Fit Results – Confirmatory Factor Analysis of
Organizational Innovativeness 143
Table 4.15 Summary Finding – Confirmatory Factor Analysis of
Organizational Performnace 144
Table 4.16 Model Fit Results – Confirmatory Factor Analysis of
Organizational Performnace 145
Table 4.17 Goodness of Fit Analysis – Hypothesized Model 146
Table 4.18 Direct Impact of Hypothesized Model 147
Table 4.19 Goodness of Fit Analysis – Modified Model 149
Table 4.20 Hypotheses Test of Modified Model 150
Table 4.21 Summary of Hypotheses Test of Modified Structural Model 156
Table 4.22 Indirect Effect of Variables Interaction 161
Table 5.1 Summary of Major Findings 169
xvii
LIST OF FIGURES
Figure Page
Figure 3.1 Research Framework incorporate the Relationship between
Learning Organization (LO), Organizational Innovativeness (OI),
and Organizational Performance (OP) 92

xviii
LIST OF ABBREVIATIONS
SMEs Small and Medium Enterprises
OSMEP Office of Small and Medium Enterprises Promotion
ISMED Institute of Small and Medium Enterprise Development
DLOQ Dimensions of the Learning Organization Questionnaire
LO Learning Organization
OI Organizational Innovativeness
OP Organizational Performance
CL Continuous Learning
ID Inquiry and Dialogue
TL Team Learning
ES Embedded System
EM Empowerment
SC System Connection
SL Strategic Leadership

1
CHAPTER ONE
INTRODUCTION
1.0 Background of the Study
The small and medium enterprises (SMEs) of Thailand are significant to its
economy, which account, in total, for 99 percent of all enterprises. Therefore, it
can be understood how critical they are in sustaining the development of the
country and acting as a fundamental mechanism in promoting the revitalization
and progress of the country’s economy as well as contributing towards poverty
alleviation (OSMEP, 2012). Moreover, most SMEs have systems and procedures
which are relatively simple and flexible providing immediate response, a short
decision-making process, better understanding and faster response to the needs of
customers. In spite of these supporting characteristics, the SMEs face significant
challenges in maintaining their competitiveness both domestically and globally. It
is vital that SMEs leverage their competitive advantages against large
multinational companies, whether they compete in existing markets or attempt to
expand into new global markets (Porter, 1985).
In the 1990s, the Thai government came to the realization that for economic
development, SMEs played a critical role with their potential to contribute toward
improving the distribution of income, creating greater employment, reducing
poverty, expanding exports and developing rural economy entrepreneurship and
industry. Additionally, after the 1997, economic downturn revealed that SMEs

The contents of
the thesis is for
internal user
only
190
REFERENCES
Akhtar, S., Arif, A., Rubi, E., & Naveed, S. (2011). Impact of organizational
learning on organizational performance: Study of higher education institutes.
International Journal of Academic Research, 3(5), 327-331.
Alchian, A., & Demsetz, H. (1972). Production, information costs, and economic
organization. American Economic Review, 62, 777-795.
Ali, A., Krapfel, R., & Labahn, D. (1995). Product innvativeness and entry strategy:
impact on cycle time and break-even time. Journal of Product Innovation
Management, 12, 54-69.
Amit, R., & Shoemaker, P.J.H. (1993). Strategic assets and organizational rent.
Strategic Management Journal, 14(1), 33-46.
Anderson, J.A. (2006). Leadership, personality and effectiveness. Journal of Socio-
economics, 35(6), 1078-1091.
Anderson, J.C., & Gerbing, D.W. (1988). Structural equation modeling in practice:
A review and recommended two-step approach. Psychological Bulletin,
103(3), 411-423.
Anderson, R.L., & Ortinau, D.J. (1988). Exploring consumers’ postadoption
attitudes and use behaviors in monitoring the diffusion of technology-based
discontinuous innovation. Journal of Business Research, 17, 283-298.
Argyris, C. (1964). Integrating the individual and the organization. New York:
Wiley.
Argyris, C. (1993). Knowledge for Action: A guide to overcoming barriers to
organizational change. San Francisco: Jossey-Bass.
191
Argyris, C. (1999). Overcoming organizational defenses: Facilitating
organizational learning. Upper Saddle River, NJ: Prentice-Hall.
Argyris, C. (2004). Reasons and rationalizations: The limits to organizational
knowledge. Oxford: Oxford University Press.
Argyris, C., & Schon, D.A. (1996). Organizational learning II: Theory, method,
and practice. Reading, MA: Addison Wesley Publishing.
Armstrong, J.S., & Overton, T.S. (1977). Estimating nonresponse bias in mail
surveys. Journal of Marketing Research, 14, 396-402.
Awasthy, R., & Gupta, R.K. (2011). Is learning orientation in manufacturing and
service firms different in India?. The Learning Organization, 18(5), 392-408.
Aziz, R.A. (2010). The mediating effects of entrepreneurial orientation on the
relationship between leadership styles and performance of SMEs in Malaysia.
Unpubished Doctoral Dissertation, Universiti Utara Malaysia, Malaysia.
Baker, W.E., & Sinkula, J.M. (1999a). Learning orientation, market orientation, and
innovation: Integrating and extending models of organizational performance.
Journal of Market-Focused Management, 4, 295-308.
Baker, W.E., & Sinkula, J.M. (2002). Market orientation, learning orientation and
product innovation: Delving into the organization’s black box. Journal of
Market-focused Management, 5(1), 5-23.
Balkin, D.B., Markaman, G.D., & Gomez-Mejia, L.R. (2000). Is CEO pay in high-
technology firms related to innovation?. Academy of Management Journal,
43(6), 1118-1129.
192
Banbury, C.M., & Mitchell, W. (1995). The effect of introducing important
incremental innovations on market share and business survival. Strategic
Management Journal, 16, 161-182.
Barney, J.B. (1991). Firm resources and sustained competitive advantage. Journal
of Management, 17(1), 99-120.
Barney, J.B. (2001). Is the resource-based view a useful perspective for strategic
management research? Yes. The Academy of Management Review, 26(1), 41-
56.
Barney, J.B. (2002). Gaining and sustaining competitive advantage (2nd ed.). Upper
Saddle River, NJ: Pearson Education, Inc.
Bennis, W.G. (1966). Changing organizations: Essays on the development and
evolution of human organizations. New York: McGraw Hill.
Bertini, G., & Tomassini, M. (1996). Auditing the organizational learning
processes in small working teams (Unpublished paper).
Bharadwaj, A.S. (2000). A resource-based perspective on information technology
capability and firm Performance: An empirical investigation. MIS Quarterly,
24(1), 169-196.
Boisot, M.H. (1995). Information space: A framework for learning in
organizations, institutions, and culture. London: Routledge.
Bouchikhi, H. (1993). A constructivist framework for understanding
entrepreneurship performance. Organization Studies, 14(4), 549-570.
Brockman, Beverly, K., Morgan, & Robert, M. (2003). The role of existing
knowledge in new product innovativeness and performance. Decision Sciences,
34(2), 385-419.
193
Bucklin, L., & Sengupta, S. (1993). Organizing successful co-marketing alliances.
Journal of Marketing, 57(2), 32-46.
Buhler, B.M. (2002). Managing the new millennium: Building the learning
organization for the 21st century: A necessary challenge. Supervision, 63(12),
20-23.
Burns, A.C., & Bush, R.F. (1995). Marketing research. Upper Saddle River, NJ:
Prentice-Hall.
Byrne, B.M. (2005). Factor analytic models: Viewing structure of an assessment
instrument from three different perspectives. Journal of Personality
Assessment, 85, 17-32.
Byrne, B.M. (2010). Structural equation modeling with AMOS; Basic concepts,
application and programming (2nd ed.). New York: Routledge Taylor and
Francis Group.
Calantone, R.J., Cavusgil, S.T., & Zhao, Y. (2002). Learning orientation, firm
innovation capability, and firm performance. Industrial Marketing
Management, 31(6), 515-524.
Capon, N., Farley, J.U., Hulbert, J.M., & Lehmann, D.R. (1992). Profiles of
product innovators among large U.S. manufacturers. Management Science,
38(2), 157-169.
Casebeer, L.A., & Verhoef, J.M. (1997). Combining qualitative and quantitative
research methods: Considering the possibilities for enhancing the study of
chronic diseases. 18(3), retrieved from www.articles\Combining Qualitative
and Quantitative Research Methods Considering the Possibilities for
Enhancing the Study of Chronic Diseases.mht.
194
Cavana, R., Delahaye, B.L., & Sekaran, U. (2001). Applied business research:
Qualitative and quantitative methods. Singapore: Markono Print Media Ltd.
Chajnacki, G.M. (2007). Characteristics of learning organizations and multi-
dimensional organizational performance indicators: A survey of large,
publicly-owned companies (Unpublished doctoral dissertation). The
Pennsylvania State University, United States.
Chen, K.N. (2006). Institutional evaluation and its influence on organizational
learning. Aslib Proceeding: New Information Perspectives, 59(1), 5-25.
Cheungsuvadee, K. (2006). Business adaptation strategies used by small and
medium retail and increasingly competitive environment: A study of Ubon
Ratchathani, Thailand. Edith Cowan University, 230.
Child, C., Faulkner, D., & Tallman, S. (2005). Cooperative strategy. Oxford:
Oxford University Press.
Chirico, F. (2008). Knowledge accumulation in family firms: Evidence from four
case studies. International Small Business Journal, 26(4), 433-462.
Chittithaworn, C., Islam, M.A., Keawchana, T., & Yusuf, D.H.M. (2011). Factors
affecting business success of small and medium enterprises (SMEs) in
Thailand. Asian Social Science, 7(5), 180-190.
Chong, H. (2008). Measuring performance of small-and-medium sized enterprises:
The grounded theory approach. Journal of Business and Public Affairs, 2(1), 1-
10.
Churchill, G.A., & Brown, T.J. (2004). Basic marketing research (5th ed.). Ohio:
South-Western.
195
Covin, J.G. , & Slevin, D.P. (1989). Strategic management of small firms in hostile
and benign environments. Strategic Management Journal,10(1), 75-87.
Creswell, J.W. (2003). Research design: Qualitative, quantitative, and mixed
methods approaches (2nd ed.). Sage, CA: Thousand Oaks.
Cronbach, I.J. (1951). Coefficient alpha and the internal structure tests.
Psychometrika, 16, 297-334.
Cronbach, L.J., & Meehl, P.E. (1955). Construct validity of psychological tests.
Psychological Bulletin, 52, 281-302.
Crossan, M.M., Lane, H.W., & White, R.E. (1999). An organizational learning
framework: From intuition to institution. Academy of Management Review,
24(3), 522-537.
Damanpour, F. (1991). Organizational innovation: A meta-analysis of effects of
determinants and moderators. Academy of Management Journal, 34(3), 555-
590.
Darroch, J., & McNaugton, R. (2002). Examining the link between knowledge
management practices and types of innovation. Journal of Intellectual Capital,
3(3), 210-222.
Davidsson, P. (1991). Continued entrepreneurship: Ability, need and opportunity as
determinants of small firm growth. Journal of Business Venturing, 6, 405-429.
Davis, D. (2000). Business research for decision making (5th ed.). USA: Duxbury.
Davis, D. (2005). The learning organization and its dimensions as key factors in
firm performance (Unpublished doctoral dissertation). The University of
Wisconsin-Milwaukee, United States.

196
Davis, D., & Daley, B.J. (2008). The learning organization and its dimensions as
key factors in firms’ performance. Human Resource Development
International, 11(1), 51-66.
Davis, D., Morris, M., & Allen, J. (1991). Perceived environmental turbulence and
its effect on selected entrepreneurship, marketing, and organizational
characteristics in industrial firms. Journal of the Academy of Marketing
Science, 19(1), 43-51.
Day, G.S. (1994). The capabilities of the market-driven organizations. Journal of
Marketing, 58(4), 37-52.
DeGeus, A.P. (1988). Planning as learning. Harvard Business Review, 88(2), 70-74.
Demers, D.L. (2009). The relationship between perceptions of learning
organization characteristics and firm performance (Unpublished doctoral
dissertation). The Pennsylvania State University, United States.
Dhamadasa, P. (2009). Organizational learning, innovation and performance in
family-controlled manufacturing small and medium-sized enterprises (SMEs)
in Australia (Unpublished doctoral dissertation). Bond University, Queensland,
Australia.
DiBella, A., & Narvis, E. (1998). How organizations learn: An integrated strategy
for building learning capability. San Francisco: Jossey-Bass.
Dierickx, I., & Cool, K. (1989). Asset stock accumulation and sustainability of
competitive advantage. Management Science, 35(12), 1504-1511.
Dixon, N.M. (1994). The organizational learning cycle: How we can learn
collectively. London: McGraw-Hill,.
197
Dodgson, M. (1993). Organizational learning: A review of some literatures.
Organization Studies, 14(3), 375-394.
Drucker, P.F. (2002). The discipline of innovation. Harvard Business Review, 80,
95-102.
Duncan, R., & Weiss, A. (1979). Organizational learning: Implications for
organizational design. Research in Organizational Behavior, 1.
Eisenhardt, K.M., & Martin, J.A. (2000). Dynamic capabilities what are they?.
Strategic Management Journal, 21, 1105-21.
Ellinger, A.D., Ellinger, A.F., Yang, B., & Howton, S.W. (2002). The relationship
between the learning organization concept and firm’s financial performance:
An empirical assessment. Human Resource Development Quarterly, 13(1), 5-
21.
Eris, E.D., & Ozmen, O.N.T. (2012). The effect of market orientation, learning
orientation and innovativeness on firm performance: A research from Turkish
logistics sector. International Journal of Economic Sciences and Applied
Research, 5(1), 77-108.
Eshlaghy, A.T., & Maatofi, A. (2011). Learning orientation, innovation and
performance: Evidence from small-sized business firms in Iran. European
Journal of Social Sciences, 19(1), 114-122.
Ettlie, J.E., Bridges, W.P., & O’Keefe, R.D. (1984). Organization strategy and
structural differences for radical versus incremental innovation. Management
Science, 30, 682-685.
Etzioni, A.A. (1964). Modern organizations. Englewood Cliffs, NJ: Prentice-Hall.

198
Fiol, C.M., & Lyles, M.A. (1985). Organizational learning. Academy of
Management Review, 10(4), 803-813.
Flint, G.D., & Van Fleet, D.D. (2005). A comparison and contrast of strategic
management and classical economic concepts: Definitions, comparisons, and
pursuit of advantages. Journal of Business Inquiry, Utah Valley State College,
USA.
Fornell, C., & Larcker, D.F. (1981). Evaluating structural equation models with
unobservable variables and measurements errors. Journal of Marketing
Research, 18, 39-50.
Garcia-Morales, V.J., Ruiz Moreno, A., & Liorens-Montes, F.J. (2006). Strategic
capabilities and their effects on performance: Entrepreneurial, learning,
innovator and problematic SMEs’. International Journal of Management and
Enterprise Development, 3(3), 191-211.
Garvin, D.A. (2000). Learning in action: A guide to putting the learning
organization to work. Boston, MA: Harvard Business School Press.
Garvin, D.A., Edmondson, A.C., & Gino, F. (2008). Is yours a learning
organization?. Harvard Business Review, 86(3), 109-116.
George, D., & Mallery, P. (2003). SPSS for windows step by step: A simple guide
and reference 12.0 update. Needham Heights, MA, USA: Allyn & Bacon, Inc.
Gephart, M.A., Marsick, V.J., Van Buren, M.E., & Spiro, M.S. (1996). Learning
organizations come alive. Training and Development, 50(12), 34-46.
Goh, S.C. (1998). Toward a learning organization: The strategic building blocks.
S.A.M. Advanced Management Journal, 63(2), 15-20.
199
Graham, G.P. (1999). Small business participation in global economy. European
Journal of Marketing, 33(1/2), 88-96.
Grant, R. (1991). A resource-based theory of competitive advantage: Implications
for strategy formulation. California Management Review, 33(3), 114-135.
Grant, R. (1996). Prospering in dynamically-competitive environments:
Organizational capability as knowledge creation. Organization Science, 7, 375-
387.
Grant, R. (2005). Contemporary strategy analysis. Malden, MA: Blackwell
Publishers.
Greve, H.R. (2005). Interorganizational learning and heterogeneous social
structure. Organization Studies, 26, 1025-1047.
Griego, O.V., Geroy, G.D., & Wright, P.C. (2000). Predictors of learning
organizations: A human resource development practitioner’s perspective. The
Learning Organization, 7(1), 5-12.
Hage, J. (1980). Theories of organization: Form, process, and transformation. New
York: John Wiley & Sons, Inc.
Hair, Jr.J.F., Black, W.C., Babin, B.J., & Anderson, R.E. (2010). Multivariate data
analysis: A global perspective (7th ed.).. New York: Pearson Prentice Hall,
Harper Collins College.
Hair, Jr.J.F., Celsi, M.W., Money, A.H., Samouel, P., & Page, M.J. (2011).
Essentials of business research methods (2nd ed.). New York: M.E. Sharpe, Inc.
Hall, R. (1992). The strategic analysis of intangible resources. Strategic
Management Journal, 13(2), 135-144.

200
Hamon, T.T. (2003). Organizational effectiveness as explained by social structure
in a faith-based business network organization (Unpublished doctoral
dissertation). Regent University, Virginia Beach, VA.
Han, J.K., Kim, N., & Srivastava, R.K. (1998). Market orientation and
organizational performance: Is innovation a missing link?. Journal of
Marketing, 62(4), 30-45.
Hancott, D.E. (2005). The relationship between transformational leadership and
organizational performance in the largest public companies in Canada
(Unpublished doctoral dissertation). Capella University, Minneapolis, MN.
Hanna, N. (2010). Enabling enterprise transformation business and grassroots
innovation for the knowledge economy. New York: Springer.
Harrison, D.A., & McLaughlin, M.E. (1993). Cognitive processes in self-report
responses: Tests of item context effects in work attitude measures. Journal of
Applied Psychology, 78, 129-140.
Hau, K.T., & Marsh, H.W. (2004). The use of item parcels in structural equation
modeling: Non-normal data and small sample sizes. British Journal of
Mathermatical & Statistical Psychology, 57, 327-351.
Hedberg, B. (1981). How organizations learn and unlearn. In P.C. Nystrom & W.H.
Starbuck (eds.), Handbook of organizational design. London: Oxford
University Press, 3-27.
Helfat, C.E., & Peteraf, M.A. (2003). The dynamic resource-based view: Capability
lifecycles. Strategic Management Journal, 24, 997-1010.
201
Herrera, A.D. (2007). A validation of the learning organization as a driver of
performance improvement (Unpublished Doctoral Dissertation). Capella
University, United States.
Holmes-Smith, P. (2007). An applied introductory course in structural equation
modeling using AMOS. Melbourne: School Reserch Evaluation and
Measurement Services (SREAMS).
Huber, G.P. (1991). Organizational learning the contributing processes and the
literatures. Organization Science, 2(1), 88-115.
Huber, G.P. (1996). Organizational learning: The contributing processes and the
literatures. In M.D. Cohen & L.S. Sproull (eds.), Organizational learning, 124-
162, Sage: Thousand Oaks.
Hult, G.T.M., Hurley, R.F., & Knight, G.A. (2004). Innovativeness: Its antecedents
and impact on business performance, Industrial Marketing Management, 33(5),
429-438.
Hunt, S.D., & Morgan, R.M. (1996). The resource-advantage theory of
competition: Dynamics, path dependencies, and evolutionary dimensions.
Journal of Marketing, 60, 107-114.
Hurley, R.F., & Hult, G.T.M. (1998). Innovation, market orientation and
organizational learning: An integration and empirical examination. Journal of
Marketing, 62(3), 42-54.
Huselid, M.A., Jackson, S.E., & Schuler, R.S. (1997). Technical and strategic
human resource management effectiveness as determinants of firm
performance. Academy of Management Journal, 40(1), 171-188.
202
ISMED. (2011). SME Annual report 2011. Retrieved December 12, 2011, from
www.ismed.go.th.
Jaccard, J., & Wan, C.K. (1996). LISREL approaches to interaction effects in
multiple regression, Quantitative applications in the social sciences.
California: Sage University papers series, Sage Publications, Thousand Oaks.
Jaworski, B.J., & Kohli, A.K. (1993). Market orientation: Antecedents and
consequences. Journal of Marketing, 57(3), 53-70.
Jensen, M., & Meckling, W. (1976). Theory of the firm: Managerial behavior,
agency costs, and ownership structure. Journal of Financial Economics, 305-
360.
Jimenez-Jimenez, D., Valle, R.S., & Hernandez-Espallardo, M. (2008). Fostering
innovation: The role of market orientation and organizational learning.
European Journal of Innovation Management, 11(3), 389-412.
Johannisson, B. (1993). Designing supportive contexts for emerging enterprises, in
C. Karlsson, B. Johannisson, and D. Storey (eds.), Small Business Dynamics:
International, National and Regional Perspectives, London: Routhledge.
Jones, M. (2002). Globalization and organizational restructuring: A strategic
perspective. Thunderbird International Business Review, 44(3), 325-351.
Jones, O., & Craven, M. (2000). Expanding capabilities in a mature manufacturing
firm: Absorptive capacity and the TCS. International Small Business Journal,
19, 39-55.
Keiser, A., & Koch, I. (2008). Bounded rationally and organizational learning
based on rule changes. Management Learning, 39(3), 329-347.
203
Keizer, J.A., Halman, J.I.M., & Song, M. (2002). Applying the risk diagnosing
methodology RDM. Journal of Product Innovation Management, 19(3), 213-
233.
Keskin, H. (2006). Market orientation, learning orientation, and innovation
capabilities in SMEs. European Journal of Innovation Management, 9(4),
396-417.
Kim, D.H. (1993). The link between individual and organizational learning. Sloan
Management Review, 35(1), 37-50.
King, A.W. (2007b). Disentangling interfirm and intrafirm causal ambiguity: A
conceptual model of causal ambiguity and sustainable competitive advantage.
Academy of Management Review, 32(1), 156-178.
Kline, R.B. (1998). Principles and practice of structural equation modeling:
Methodology in the social sciences. New York: Guiford Press.
Kogut, B., & Zander, U. (1992). Knowledge of the firm, combinative capabilities,
and the replication of technology. Organization Science, 3(3), 383-97.
Koonsri, S. (2005). Organizational development with information technology.
Retrieved February 2, 2014 from
http://www.hrcenter.co.th/column_detail.php?column_id=440&page=1
Korth, K. (2007). Re-establishing the importance of the learning organization.
Automotive Design and Production, 19(11), 12-15.
Kumar, N., & Idris, K. (2006). An examination of educational institutions’
knowledge performance: Analysis, implications, and outlines for future
research. The Learning Organization, 13(1), 96-116.
204
Lawton, L., & Parasuraman, A. (1980). The impact of the marketing concept on
new product planning. Journal of Marketing, 44, 19-25.
Leary, M.R. (2004). Introduction to behavioral research methods (4th ed.). USA:
Pearson Education.
Lee, Y.C., & Lee, S.K. (2007). Capability, processes, and performance of
knowledge management: A structural approach. Human Factors and
Ergonomics in Manufacturing, 17(1), 21-41.
Lee, T.S., & Tsai, H.J. (2005). The effects of business operation mode on market
orientation, learning orientation and innovativeness. Industrial Management
and Data Systems, 105(3), 325-348.
Leonard-Barton, D. (1995). Wellsprings of Knowledge: Building and sustaining the
sources of innovation. Boston, MA: Harvard Business School Press,
Leonard-Barton, D., & Sensiper, S. (1998). The role of tacit knowledge in group
innovation. California Management Review, 40, 112-132.
Leseure, M., Shaw, N., & Chapman, G. (2001). Performance measurement in
organizational networks: An exploratory case study. International Journal of
Business Performance Management, 3(1), 30.
Levitt, T. (1966). Innovative imitation. Harvard Business Review, 44, 63-69.
Levitt, B., & March, J.G. (1988). Organizational learning. Annual Review of
Sociology, 14, 319-340.
Levy, B., Berry, A., & Nugent, J.B. (Eds.). (1999). Fulfilling the export potential of
small and medium firms. Boston: Kluwer Academic Publishers.
Lewis, D. (2002). Five years on – the organizational culture saga revisited.
Leadership & Organization Development Journal, 23(5), 280-7.

205
Lien, B.Y.H., Hung, R.Y.Y., Yang, B., & Li, M. (2008). Is the learning
organization a valid concept in the Taiwanese context?. International Journal
of Manpower, 27(2), 189-203.
Likert, R. (1967). The human organization. New York: McGraw-Hill.
Lim, D., & Klobas, J. (2000). Knowledge management in small enterprises. The
Electronic Library, 18(6), 420-32.
Lin, Y.Y. (2006). An examination of the relationships between organizational
learning culture, structure, organizational innovativeness and effectiveness:
Evidence from Taiwanese organizations (Unpublished doctoral dissertation).
University of Minnesota, Taiwan.
Lin, C.Y., & Kuo, T.H. (2007). The mediate effect of learning and knowledge on
organizational performance. Industrial Management and Data Systems, 107(7),
1066-1083.
Lin, C.H., Peng, C.H., & Kao, D.T. (2008). The innovativeness effect of market
orientation and learning orientation on business performance. International
Journal of Manpower, 29(8), 752-772.
Loscocco, K.A., & Leicht, K.T. (1993). Gender, work-family linkages and
economic among small business owners’. Journal of Marriage and The
Family, 5, 875-887.
Lucky, E.O.I. (2011). Entrepreneurial performance and firm performance. Are they
synonymous: A PhD experience. International Journal of Business and
Management Tomorrow, 1(2), 1-6.

206
Lumpkin, G.T., & Dess, G. (1996). Clarifying the entrepreneurial orientation
construct and linking it to performance. Academy of Management Review,
21(1), 135-172.
Lyon, D., & Ferrier, W. (2002). Enhancing performance with product-market
innovation: The influence of the top management team. Journal of Managerial
Issues, 14(14), 452-469.
Ma, H. (2004). Toward global competitive advantage: Creation, competition,
cooperation and co-option. Management Decision, 42(7), 907-924.
Majid, Z.B. (2011). The mediating effects of innovation on the relationship of
market orientation dimensions and ICT small and medium sized enterprises’
performance (Unpublished doctoral dissertation). Universiti Utara Malaysia,
Malaysia.
Makadok, R. (2001). Toward a synthesis of the resource-based and dynamic-
capability views of rent creation. Strategic Management Journal, 22, 387-401.
Malhotra, N.K. (1999). Marketing research: An applied orientation. Upper Saddle
River, NY: Prentice Hall.
Malhotra, N.K., Hall, J., Shaw, M., Oppenheim, P. (2006). Marketing research: An
applied orientation (3rd ed.). Frenchs Forest: Prentice Hall.
March, J.G. (1991). Exploration and exploitation in organizational learning.
Organizational Science, 2(1), 71-87.
Marquardt, M.J. (2002). Building the learning organization: Mastering the 5
elements of corporate learning (2nd ed.). Palo Alto, CA: Davies-Black
Publishing.
207
Marsick, V.J., & Watkins, K.E. (2003). Demonstrating the value of an
organizational learning culture: The dimensions of learning organizations
questionnaire. Advances in Developing Human Resources, 5(2), 132-151.
Mason, E.J., & Bramble, W.J. (1989). Understanding and conducting research.
New York: McGrawHill.
McKee, D. (1992). An organizational learning approach to product innovation.
Journal of Product Innovation Management, 9, 232-245.
McGee, J.E., Dowling, M.J., & Megginson, W.L. (1995). Cooperative strategy and
new venture performance: The role of business strategy and management
experience. Strategic Management Journal, 16, 565-580.
Merz, G.R., & Sauber, M.H. (1995). Profiles of managerial activities in small firms.
Strategic Management Journal, 16, 551-564.
Miller, D., & Friesen, P.H. (1983). Strategy-making and environment: The third
link. Strategic Management Journal, 4, 221-235.
Miller, A., Willson, B., & Adams, M. (1988). Financial performance patterns of
new corporate ventures: An alternative to traditional measures. Journal of
Business Venturing, 3(4), 287-299.
Mills, J., Platts, K., & Bourne, M. (2003). Competence and resource architectures.
International Journal of Operations and Production Management, 23(9), 977-
994.
Mohr, J., & Spekman, R. (1994). Characteristics of partnership success: Partnership
attributes communication behavior, and conflict-resolution techniques.
Strategic Management Journal, 15, 135-142.
208
Moilanen, R. (2005). Diagnosing and measuring learning organizations. The
Learning Organization: An International Journal, 12(1), 71-89.
Montanari, J.R., Morgan, C.P., & Bracker, J. (1990). Strategic management: A
choice approach. Orlando: The Dryden Press.
Narver, J.C., & Slater, S.F. (1990). The effect of a market orientation on business
profitability. Journal of Marketing, 54(3), 20-35.
Neuman, W.L. (2003). Social research methods: Qualitative and quantitative
approaches. Boston: Pearson Education.
Nevis, E., DeBella, A.J., & Gould, J.M. (1995). Understanding organizations as
learning systems. Sloan Management Review, 36(2), 73-85.
Nonaka, I. (1994). A dynamic theory of organizational knowledge creation.
Organization Science, 5, 14-37.
Nootboom, B. (1993). Firm size effects in transaction cost. Small Business
Economics, 5, 283-95.
Nunnally, J.C. (1978). Psychometric theory (2nd ed.). New York: McGraw-Hill.
Nunnally, J.C., & Bernstein, I.H. (1994). Psychometric theory (3rd ed.). New York:
McGraw-Hill.
O’Farell, P. (1986). The nature of new firms in Ireland: Empirical evidence and
policy implications, in D. Keele, and E. Wever (eds.). New Firms and Regional
Development in Europe. London: Croom Helm, 151-183.
O’Leary-Kelly, S.W., & Vokurka, R.J. (1998). The empirical assessment of
construct validity. Journal of Operations Management, 16(4), 387-405.
209
Orser, B., Hogarth-Scott, S., & Riding, A. (2000). Performance, firm size and
management problem solving. Journal of Small Business Management, 38(4),
42-58.
Ortenblad, A. (2001). On differences between organizational learning and learning
organization. The Learning Organization, 8(3), 123-133.
OSMEP. (2012). The white paper on small and medium enterprises of Thailand in
2011 and trends 2012. Retrieved January 25, 2012, from
http://www.sme.go.th/
Pedler, M., Burgoyne, J., & Boydell, T. (1997). The learning company: A strategy
for sustainable development. London: McGraw-Hill.
Penrose, E.T. (1959). The theory of the growth of the firm. New York: Wiley.
Peteraf, M.A. (1993). The cornerstones of competitive advantage: A resource-based
view. Strategic Management Journal, 14(3), 179-191.
Peteraf, M.A., & Bergen, M.E. (2003). Scanning dynamic competitive landscapes:
A market-based and resource-based framework. Strategic Management
Journal, 24, 1027-1041.
Pfeffer, J. (1982). Organizations and organization theory. Boston: Pittman.
Porter, M. (1985). Competitive advantage: Creating and sustaining superior
performance. New York: Free Press.
Prahalad, C.K., & Hamel, G. (1990). The core competence of the corporation.
Harvard Business Review, 68, 79-91.
Price, J.L. (1972). The study of organizational effectiveness. Sociological
Quarterly, 13, 3-15.
Quinn, J.B. (1992). Intelligent Enterprise. New York, NY: The Free Press.
210
Rahman, S.U. (2001). A comparative study of TQM practice and organizational
performance of SMEs with and without ISO 9000 certification. International
Journal of Quality and Reliability Management, 18(1), 35-49.
Rhee, J., Park, T., & Lee D.H. (2010). Drivers of innovativeness and performance
for innovative SMEs in South Korea: Mediation of learning orientation.
Technovation, 30, 65-75.
Robertson, T.S. (1967). The process of innovation and the diffusion of innovation.
Journal of Marketing, 31(1), 14-19.
Robbins, S.P., & Coulter, M. (2002). Management. Upper Saddle River, NJ:
Prentice-Hall.
Robinson, P.B., & Sexton, E.A. (1994). The effect of education and experience on
self-employment success. Journal of Business Venturing, 9(2), 141-156.
Roscoe, J.T. (1975). Fundamental research statistics for the behavioral sciences.
New York: Holt, Rinehart & Winston, Inc.
Rowden, R.W. (2001). The learning organization and strategic change. S.A.M.
Advanced Management Journal, 66(3), 11-24.
Rudder, A., Ainsworth, P., & Holgate, D. (2001). New food product development:
strategies for success?. British Food Journal, 103(9), 657-671.
Ruzzier, M., Hisrich, R.D., & Antoncic, B. (2006). SME international research:
Past, present, and future. Journal of Small Business and Enterprise
Development, 13(4), 476-497.
Salim, I.M., & Sulaiman, M. (2011). Organizational learning, innovation and
performance: A study of Malaysian small and medium sized enterprises.
International Journal of Business and Management, 6(12), 118-125.

211
Saunders, M., Thornhill, A., & Lewis, P. (2007). Research methods for business
students (4th ed.). England: Pearson Prentice Hall Financial Times.
Schermerhorn, J.R., Hunt, Jr, J.M., & Osborn, R.N. (2002). Organizational
behavior, New York, NY: Wiley.
Schumpeter, J. (1934). The theory of economic development: An inquiry into
profits, capital, credit, interest, & the business cycle. Cambridge, Mass:
Harvard University Press.
Schwab, D.P. (1980). Construct validity in organizational behavior. Research in
Organizational Behavior, 2(1), 3-43.
Seashore, S.E., & Yuchtman, E. (1967). Factorial analysis of organizational
performance. Administrative Science Quarterly, 12, 377-395.
Sekaran, U. (2005). Research methods for business: A skill building approach (5th
ed.). Singapore: John Wiley and Sons.
Senge, P.M. (1990). The fifth discipline: The art and practice of the learning
organization. New York: Doubleday.
Shih, Y.Y., & Fang, K. (2004). The use of decomposed theory of planned behavior
to study internet banking in Taiwan. Internet Research, 14(3), 213-223.
Simon, H.A. (1991). Bounded rationality and organizational learning. Organization
Science, 2(1), 125-134.
Simon, N.J. (1999). The learning organization. Competitive Intelligence Magazine,
2(2), 40-42.
Singleton, Jr., & Straits, B.C. (1999). Approaches to social research (3rd ed.). New
York and Oxford: Oxford University Press.
212
Slater, S.F., & Narver, J.C. (1995). Market orientation and the learning
organization. Journal of Marketing, 59(3), 63-74.
Smith, N., Bracker, J., & Miner, J. (1987). Correlates of firms and entrepreneur on
effectiveness of selling partner relationships. Journal of Marketing, 1, 3-17.
Snow, C.C., & Thomas, J.B. (1994). Field research methods in strategic
management: Contributions to theory building and testing. Journal of
Management Studies, 3(4), 457-480.
Song, J.H. (2008). The integrative determinants of organizational performance
improvement: The impacts of dimensions of learning organization and dynamic
knowledge creation (Unpublished doctoral dissertation). The Pennsylvania
State University, USA.
Srinivasan, R., Woo, C.Y., & Cooper, C. (1994). Performance determinants for
men and female entrepreneurs, in N.C. Churchill (eds.). Frontiers of
Entrepreneurship Research, Wesley, MA: Babson College Press.
Stata, R. (1989). Organizational learning: The key to management innovation.
Sloan Management Review, 30(3), 63-74.
Steers, R.M. & Black, J.S. (1993). Organizational behavior (5th ed.). New York:
Harper Collins.
Suliyanto & Rahab. (2012). The role of market orientation and learning orientation
in improving innovativeness and performance of small and medium
enterprises. Asian Social Science, 8(1), 134-145.
Tabachnick, B.G., & Fidell, L.S. (2001). Using multivariate statistics (4th ed.).
Boston: Allyn & Bacon.

213
Teece, D., Pisano, G., & Shuen, A. (1997). Dynamic capabilities and strategic
management. Strategic Management Journal, 18(7), 509-533.
Thianthai, C. (2007). Management: An executive perspective. (3rd ed.). Bangkok:
Mcgraw-Hill.
Tidd, J., Bessant, J., & Pavitt, K. (2001). Managing innovation: Integrating
technological, market and organizational change. (2nd ed.). Chichester: John
Wiley.
Tippins, M.J., & Sohi, R.S. (2003). IT competency and firm performance: Is
organizational learning a missing link. Strategic Management Journal, 24(8),
745-761.
Tseng, C.C. (2010). The effects of learning organization practices on
organizational commitment and effectiveness for small and medium-sized
enterprises in Taiwan (Unpubished doctoral dissertation). The University of
Minnesota, United States.
Turri, A., Maniam, B., & Leavell, H. (2006). Globalization: The good, bad and
ugly. The Business Review, 6(1), 31-48.
Ullman, J.B. (2001). Structural equation modeling. In BG Tabachnick & LS Fidell
(eds), Using multivariate statistics (4th ed.). Allyn & Bacon, 635-771.
Urabe, K. (1988). Innovation and the Japanese Management System. International
Comparisons, de Gruyter, New York, 3-25.
Ussahawanitchakit, P. (2008). Impacts of organizational learning on innovation
orientation and firm efficiency: An empirical assessment of accounting firms in
Thailand. International Journal of Business Research, 8(4), 1-12.
Utterback, J.M. (2001). Dinamica de la innovacion tecnologica. Madrid: Cotec.
214
Venkatraman, N., & Ramanujam, V. (1986). Measurement of business performance
in strategy research: A comparison of approaches. The Academy of
Management Review, 11(4), 801-814.
Wanapaibool. W. (2009). Impact of technology on organizational culture and office
space planning: A case study of provincial police division building and police
station buildin (Unpublished master thesis). Thammasat University, Bangkok,
Thailand.
Wang, C.L., & Ahmed, P.K. (2004). The development and validation of the
organizational innovativeness construct using confirmatory factor analysis.
European Journal of Innovation Management, 7(4), 303-313.
Wang, X., & Yang, B. (2007). The culture of learning organizations in Chinese
state-owned and privately-owned enterprises: an empirical study. Front. Bus.
Res. China, 1(2), 275-299.
Watkins, K.E., & Golembiewski, R.T. (1995). Rethinking organizational
development for the learning organization. The international Journal of
Organizational Analysis, 3(1), 86-101.
Watkins, K.E., & Marsick, V.J. (1996), In action: Creating the learning
organization. Alexandria, VA: American Society for Training and
Development Press.
Watkins, K.E. & Marsick, V.J. (1997). Dimensions of the learning organization
questionnaire (DLOQ). Warwick, RI: Partners for the Learning Organization
(Instrument used with permission of the authors).
Watkins, K.E., & Marsick, V.J. (2003). Making learning count! Diagnosing the
learning culture in organizations. Sage, CA: Thousand Oaks.
215
Weldy, T.G. (2009). Learning organization and transfer: Strategies for improving
performance. The Learning Organization, 16(1), 58-68.
Weldy, T.G., & Gillis, W.E. (2010). The learning organization: Variations at
different organizational levels. The Learning Organization, 17(5), 455-470.
Wernerfelt, B. (1984). A resource-based view of the firm. Strategic Management
Journal, 5(2), 171-180.
Wickramasinghe, N., & Schaffer, J. (2005). Creating knowledge driven healthcare
processes with the intelligence continuum. In press International Journal of
Electronic Healthcare (IJEH).
Yamane, T. (1967). Statistics: An introductory analysis (2nd ed.). New York:
Harper and Row.
Yang, B. (2003). Identifying valid and reliable measures for dimensions of a
learning culture. Advances in Developing Human Resources, 5(2), 152-162.
Yang, B., Watkins, K.E., & Marsick, V.J. (2004). The construct of the learning
organization: Dimensions, measurement, and validation. Human Resource
Development Quarterly, 15(1), 31-55.
Zikmund, W.G. (2003). Business research method (7th ed.). Ohio, USA: Thomson.
216
Appendix A
Permission to Use the DLOQ

217
Dear, Prof. Watkins
I am a doctoral (DBA) student at the Universiti Utara Malaysia. I am currentlyworking on my dissertation title "Learning Organization, OrganizationalInnovativeness and the Performance of Small and Medium Enterprises in Bangkok,Thailand". As I will be using the DLOQ for my dissertation, I wish to seek yourpermission to use the instrument of learning organization to gather survey data formy dissertation.I would very much appreciate if you could kindly indicate your permissions byreturn this email.Thank you for your considering this request and I am ready to respond to anyquestions you might have.
Sincerely yours,
Woraluck LalitsasivimolStudent ID: 91361Universiti Utara Malaysia06010 UUM, SintokKedah, MalaysiaContract No: +6689-468-7408 (Mobile)
From:"Karen Watkins" <[email protected]>To: "jinny 2008" <[email protected]>
We are happy to grant permission for you to use the DLOQ in your dissertationresearch. Please cite the survey as attached and include this citation in the surveyyou distribute. We would love to hear what you find out in your study.
Best wishes,
Karen E. Watkins, ProfessorThe University of GeorgiaDepartment of Lifelong Education, Administration & Policy406 River's CrossingAthens, GA 30605

218
Dear, Prof. Marsick.
I am a doctoral (DBA) student at the Universiti Utara Malaysia. I am currentlyworking on my dissertation title "Learning Organization, OrganizationalInnovativeness and the Performance of Small and Medium Enterprises in Bangkok,Thailand". As I will be using the DLOQ for my dissertation, I wish to seek yourpermission to use the instrument of learning organization to gather survey data formy dissertation.I would very much appreciate if you could kindly indicate your permissions byreturn this email.Thank you for your considering this request and I am ready to respond to anyquestions you might have.
Sincerely yours,
Woraluck LalitsasivimolStudent ID: 91361Universiti Utara Malaysia06010 UUM, SintokKedah, MalaysiaContract No: +6689-468-7408 (Mobile)
From:"Marsick, Victoria" <[email protected]>To: "jinny 2008" <[email protected]>
Hello,
We allow students to use the DLOQ without charge for their studies. I'm attaching acopy for your use. I'm also attaching the appropriate copyright information.Please let us know your study's results. Good luck with your studies.
Regards,
Prof Marsick

219
Appendix B
Cover Letter

220
Dear Respondents,
I am conducting a survey of owners or managers of SMEs in Thailand to gather thefinal information for my dissertation entitled "Learning Organization,Organizational Innovativeness and the Performance of Small and MediumEnterprises in Bangkok, Thailand". This research is being conducted as part of therequirements of Doctor of Business Administration at Universiti Utara Malaysia(UUM).
I would like to request your kind assistance in this academic study which endeavorsto provide strategic comprehension for learning organization, organizationalinnovativeness and maintenance of organizational performance. I am confident thatthe result of my study will be beneficial for your organization and others who areinterested in this topic.
I would greatly appreciate you taking the time and making the effort to carefullyanswer every item. There is no right or wrong answers. I assure you that you willremain completely anonymous.
Thank you very much for your kindness.
Yours sincerely,
For Universiti Utara MalaysiaWoraluck LalitsasivimolStudent id: 91361HP: +66894687408Email: [email protected]

221
Appendix C
Questionnaire

222
Learning Organization, Organizational Innovativeness and the Performance of
Small and Medium Enterprises in Bangkok, Thailand
This questionnaire asks about your company’s learning organization, innovativeness and Performance.
It should take no more than 10 to 15 minutes of your time to complete this questionnaire.
The questions have no right or wrong answers and only indicate your belief.
Please send the complete questionnaire back to the researcher by ………………………If you have any questions about this questionnaire, please contact Woraluck LalitsasivimolTel. (089) 468-7408
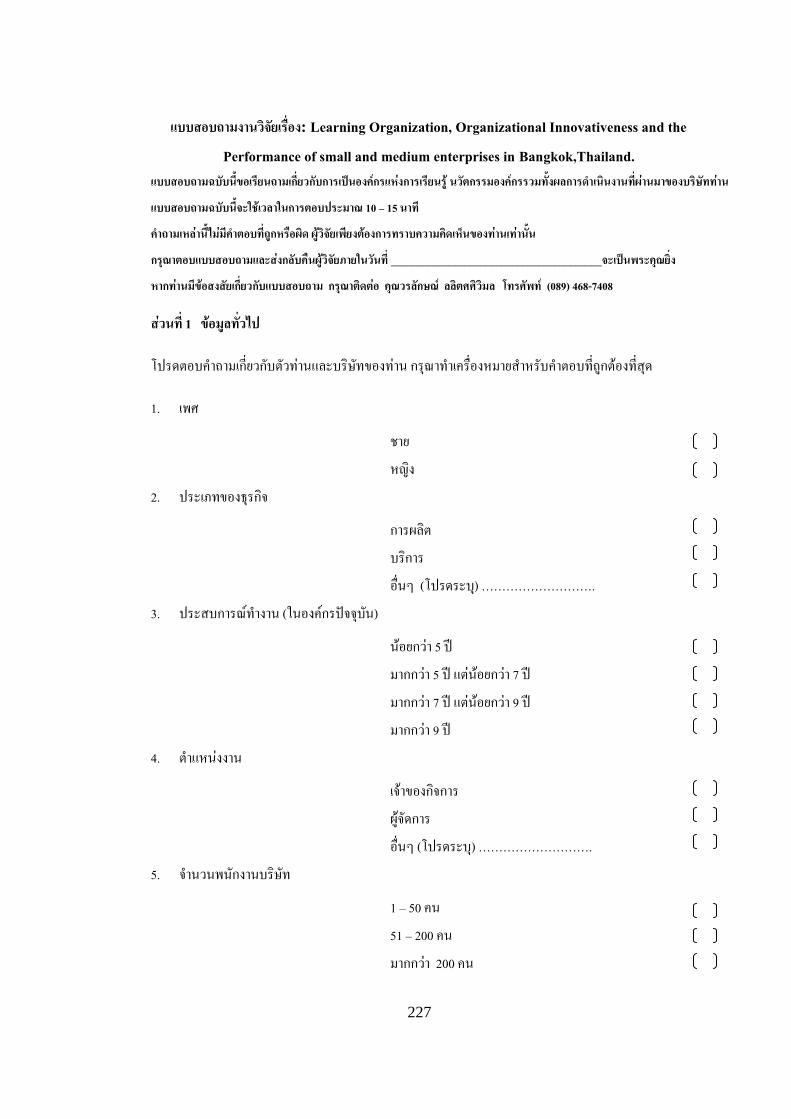
PART I (Demographic Information)
Please provide general information about you and your company. Please mark yourresponse accurately.
1. Gender
Male
Female
2. Type of Business
Manufacturing
Service
Others (please indicate) ………………..
3. Work Experience (in this organization)
Less than 5 years
More than 5 but less than 7 years
More than 7 but less than 9 years
More than 9 years
4. Position
Owner
Manager
Others (please indicate) ………………..
5. Number of employees
1 - 50
51 - 200
More than 200
223
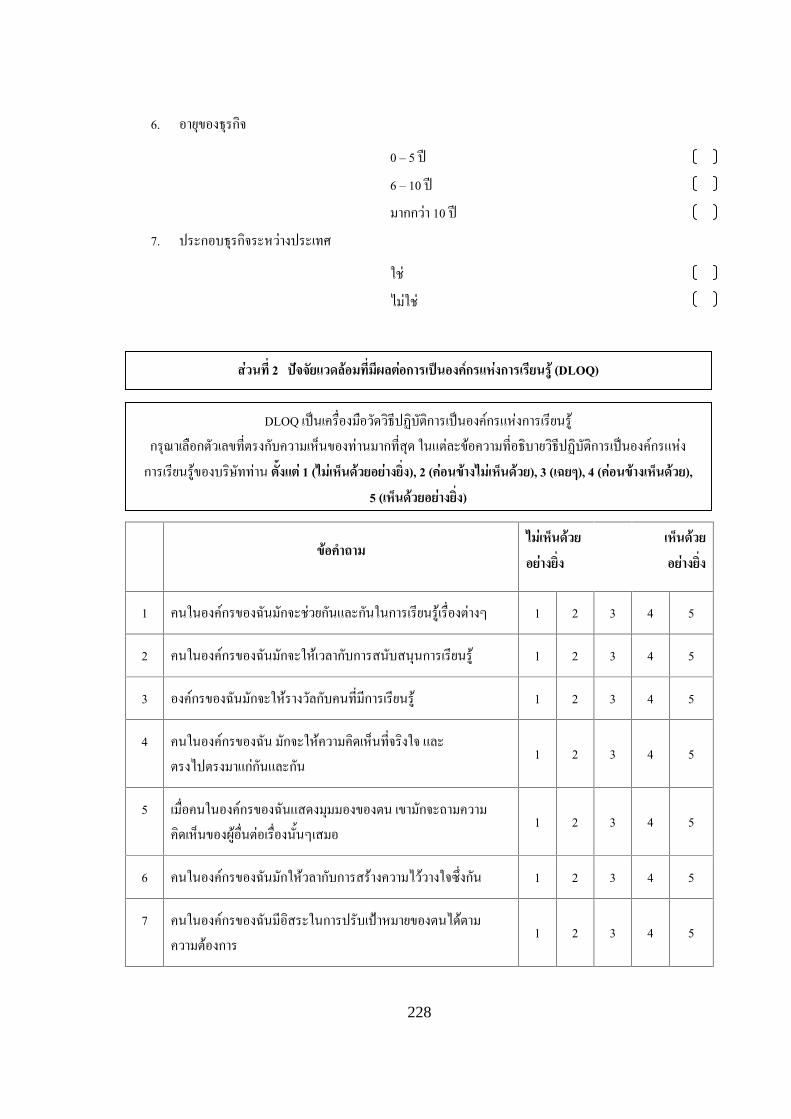
6. Age of Business
0 – 5 years
6 – 10 years
More than 10 years
7. International Business
Yes
No
QuestionsAbsolutelyDisagree
AbsolutelyAgree
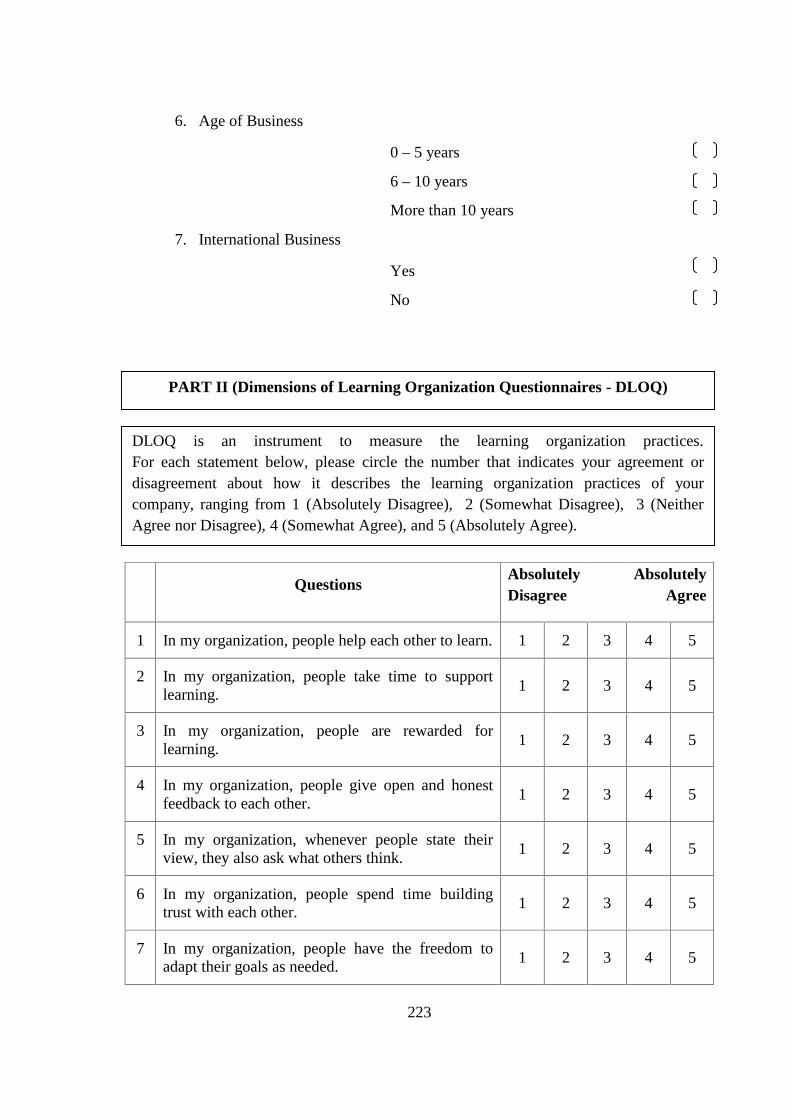
1 In my organization, people help each other to learn. 1 2 3 4 5
2 In my organization, people take time to supportlearning.
1 2 3 4 5
3 In my organization, people are rewarded forlearning.
1 2 3 4 5
4 In my organization, people give open and honestfeedback to each other.
1 2 3 4 5
5 In my organization, whenever people state theirview, they also ask what others think.
1 2 3 4 5
6 In my organization, people spend time buildingtrust with each other.
1 2 3 4 5
7 In my organization, people have the freedom toadapt their goals as needed.
1 2 3 4 5
PART II (Dimensions of Learning Organization Questionnaires - DLOQ)
DLOQ is an instrument to measure the learning organization practices.For each statement below, please circle the number that indicates your agreement ordisagreement about how it describes the learning organization practices of yourcompany, ranging from 1 (Absolutely Disagree), 2 (Somewhat Disagree), 3 (NeitherAgree nor Disagree), 4 (Somewhat Agree), and 5 (Absolutely Agree).
.

224
QuestionsAbsolutelyDisagree
AbsolutelyAgree
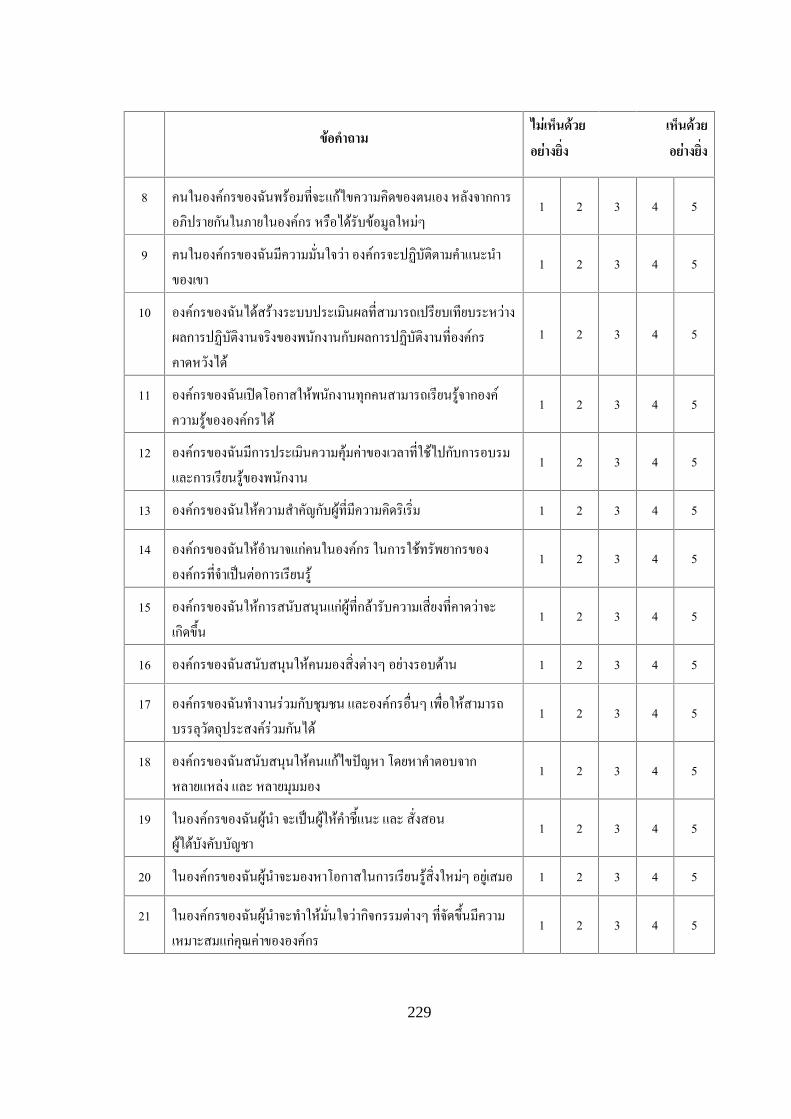
8 In my organization, people revise thinking as aresult of organization discussions or informationcollected.
1 2 3 4 5
9 In my organization, we are confident that theorganization will act on our recommendations.
1 2 3 4 5
10 My organization creates systems to measure gapbetween current and expected performance.
1 2 3 4 5
11 My organization makes its lessons learnedavailable to all employees.
1 2 3 4 5
12 My organization measures the results of the timeand resources spent on training and learning.
1 2 3 4 5
13 My organization recognizes people for takinginitiative.
1 2 3 4 5
14 My organization gives people control over theresources they need to accomplish their work.
1 2 3 4 5
15 My organization supports members who takecalculated risks.
1 2 3 4 5
16 My organization encourages people to think froma global perspective.
1 2 3 4 5
17 My organization works together with the outsidecommunity or other outside resources to meetmutual needs.
1 2 3 4 5
18 My organization encourages people to get answersfrom multiple locations and perspectives whensolving problems.
1 2 3 4 5
19 In my organization, leaders mentor and coach thosethey lead.
1 2 3 4 5
20 In my organization, leaders continually look foropportunities to learn.
1 2 3 4 5
21 In my organization, leaders ensure that theorganization’s actions are consistent with itsvalues.
1 2 3 4 5

225
QuestionsAbsolutelyDisagree
AbsolutelyAgree
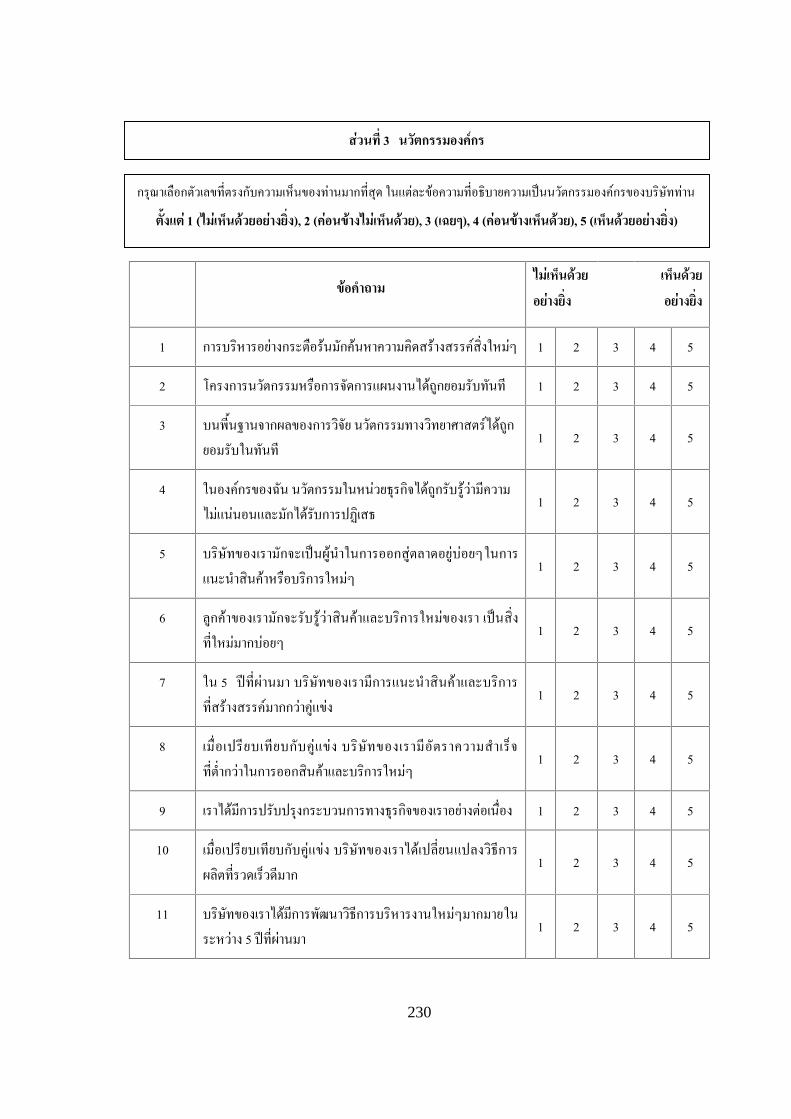
1 Management team dynamically searches fornew ideas.
1 2 3 4 5
2 Program or project management eagerlyaccepts innovation.
1 2 3 4 5
3 Scientific innovation derived from study resultsis enthusiastically agreed to.
1 2 3 4 5
4 In this organization, innovation is consideredexcessively uncertain and is therefore denied.
1 2 3 4 5
5 Our firm is usually the first in the market tointroduce new products and services.
1 2 3 4 5
6 Our customers always regard our newly-launched products and services as highlyinnovative.
1 2 3 4 5
7 In the past five years, our firm has launchedmore new products and services than ourcompetitors.
1 2 3 4 5
8 Compared to our competitors, our firm gainsless achievement in the introduction of newproducts and services.
1 2 3 4 5
9 We continue to better our business procedures. 1 2 3 4 5
10 Compared with our competitors, our firm altersthe techniques of production more rapidly.
1 2 3 4 5
11 Our firm has improved several new approachesin management in the past five years.
1 2 3 4 5
PART III (Organizational Innovativeness)
For each statement below, please circle the number that indicates your agreement ordisagreement about how it describes the organizational innovativeness of your company,ranging from 1 (Absolutely Disagree), 2 (Somewhat Disagree), 3 (Neither Agree norDisagree), 4 (Somewhat Agree), and 5 (Absolutely Agree).
226
QuestionsAbsolutelyDisagree
AbsolutelyAgree
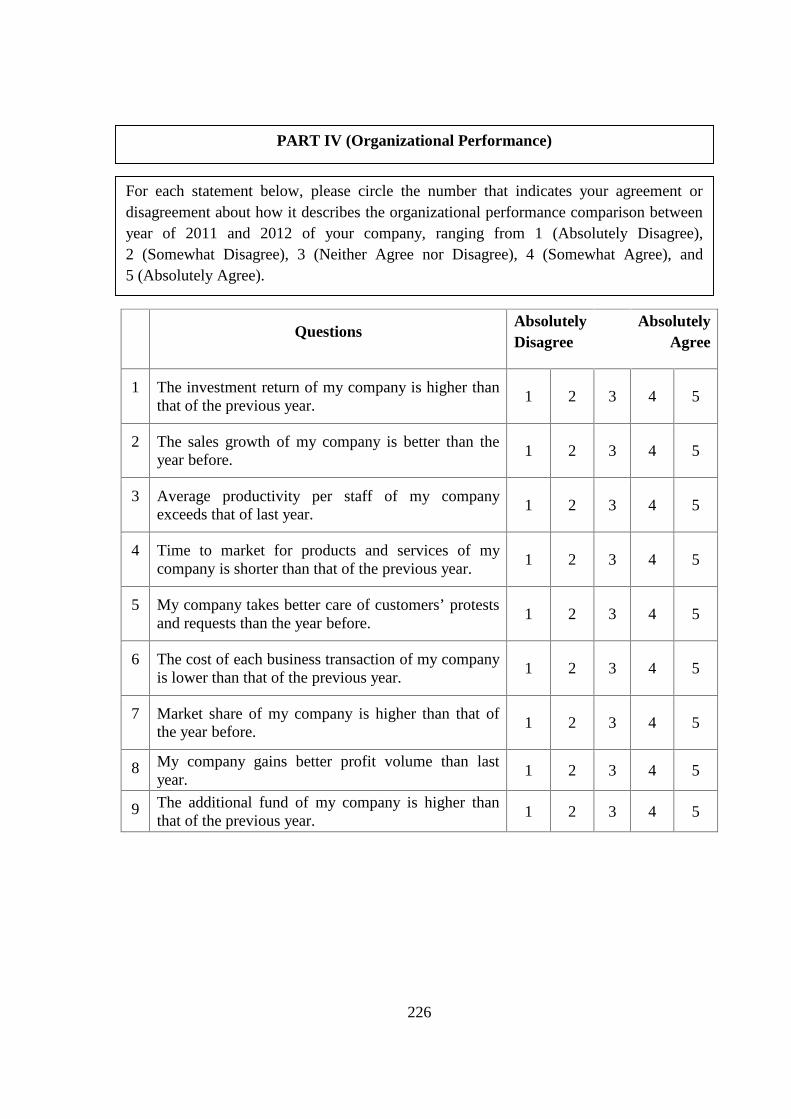
1 The investment return of my company is higher thanthat of the previous year.
1 2 3 4 5
2 The sales growth of my company is better than theyear before.
1 2 3 4 5
3 Average productivity per staff of my companyexceeds that of last year.
1 2 3 4 5
4 Time to market for products and services of mycompany is shorter than that of the previous year.
1 2 3 4 5
5 My company takes better care of customers’ protestsand requests than the year before.
1 2 3 4 5
6 The cost of each business transaction of my companyis lower than that of the previous year.
1 2 3 4 5
7 Market share of my company is higher than that ofthe year before.
1 2 3 4 5
8 My company gains better profit volume than lastyear.
1 2 3 4 5
9 The additional fund of my company is higher thanthat of the previous year.
1 2 3 4 5
PART IV (Organizational Performance)
For each statement below, please circle the number that indicates your agreement ordisagreement about how it describes the organizational performance comparison betweenyear of 2011 and 2012 of your company, ranging from 1 (Absolutely Disagree),2 (Somewhat Disagree), 3 (Neither Agree nor Disagree), 4 (Somewhat Agree), and5 (Absolutely Agree).
227
แบบสอบถามงานวิจัยเรื่อง: Learning Organization, Organizational Innovativeness and thePerformance of small and medium enterprises in Bangkok,Thailand.
แบบสอบถามฉบับนี้ขอเรียนถามเก่ียวกับการเปนองคกรแหงการเรียนรู นวัตกรรมองคกรรวมทั้งผลการดําเนินงานที่ผานมาของบริษัททานแบบสอบถามฉบับนี้จะใชเวลาในการตอบประมาณ 10 – 15 นาทีคําถามเหลานี้ไมมีคําตอบที่ถูกหรือผิด ผูวิจัยเพียงตองการทราบความคิดเห็นของทานเทานั้นกรุณาตอบแบบสอบถามและสงกลับคืนผูวิจัยภายในวันที่ ________________________________________จะเปนพระคุณยิ่งหากทานมีขอสงสัยเก่ียวกับแบบสอบถาม กรุณาติดตอ คุณวรลักษณ ลลิตศศิวิมล โทรศัพท (089) 468-7408
สวนท่ี 1 ขอมูลท่ัวไป
โปรดตอบคําถามเก่ียวกับตัวทานและบริษัทของทาน กรุณาทําเครื่องหมายสําหรับคําตอบที่ถูกตองที่สุด
1. เพศ
ชายหญิง
2. ประเภทของธุรกิจ
การผลิตบริการอื่นๆ (โปรดระบ)ุ ……………………….
3. ประสบการณทํางาน (ในองคกรปจจุบนั)
นอยกวา 5 ปมากกวา 5 ป แตนอยกวา 7 ปมากกวา 7 ป แตนอยกวา 9 ปมากกวา 9 ป
4. ตําแหนงงาน
เจาของกิจการผูจัดการอื่นๆ (โปรดระบุ) ……………………….
5. จํานวนพนักงานบริษทั
1 – 50 คน51 – 200 คนมากกวา 200 คน
228
6. อายุของธุรกิจ
0 – 5 ป6 – 10 ปมากกวา 10 ป
7. ประกอบธุรกิจระหวางประเทศ
ใชไมใช
ขอคําถาม ไมเห็นดวยอยางย่ิง
เห็นดวยอยางย่ิง
1 คนในองคกรของฉนัมักจะชวยกันและกันในการเรียนรูเรื่องตางๆ 1 2 3 4 5
2 คนในองคกรของฉนัมักจะใหเวลากับการสนับสนุนการเรียนรู 1 2 3 4 5
3 องคกรของฉันมักจะใหรางวัลกับคนที่มีการเรียนรู 1 2 3 4 5
4 คนในองคกรของฉนั มักจะใหความคิดเห็นทีจ่ริงใจ และตรงไปตรงมาแกกันและกัน
1 2 3 4 5
5 เม่ือคนในองคกรของฉันแสดงมุมมองของตน เขามักจะถามความคิดเห็นของผูอืน่ตอเรื่องนั้นๆเสมอ
1 2 3 4 5
6 คนในองคกรของฉนัมักใหวลากับการสรางความไววางใจซ่ึงกัน 1 2 3 4 5
7 คนในองคกรของฉนัมีอิสระในการปรับเปาหมายของตนไดตามความตองการ
1 2 3 4 5
สวนท่ี 2 ปจจัยแวดลอมท่ีมีผลตอการเปนองคกรแหงการเรียนรู (DLOQ)
DLOQ เปนเครื่องมือวัดวิธีปฏิบตักิารเปนองคกรแหงการเรียนรูกรุณาเลือกตัวเลขที่ตรงกับความเห็นของทานมากที่สุด ในแตละขอความที่อธิบายวิธีปฏิบตัิการเปนองคกรแหง
การเรียนรูของบรษิัททาน ตั้งแต 1 (ไมเห็นดวยอยางย่ิง), 2 (คอนขางไมเห็นดวย), 3 (เฉยๆ), 4 (คอนขางเห็นดวย),5 (เห็นดวยอยางย่ิง)
ถ
229
ขอคําถาม ไมเห็นดวยอยางย่ิง
เห็นดวยอยางย่ิง
8 คนในองคกรของฉนัพรอมทีจ่ะแกไขความคิดของตนเอง หลังจากการอภิปรายกันในภายในองคกร หรอืไดรับขอมูลใหมๆ
1 2 3 4 5
9 คนในองคกรของฉนัมีความม่ันใจวา องคกรจะปฏบิัติตามคําแนะนําของเขา
1 2 3 4 5
10 องคกรของฉันไดสรางระบบประเมินผลที่สามารถเปรียบเทียบระหวางผลการปฏิบตัิงานจริงของพนักงานกับผลการปฏบิัติงานที่องคกรคาดหวังได
1 2 3 4 5
11 องคกรของฉันเปดโอกาสใหพนกังานทุกคนสามารถเรียนรูจากองคความรูขององคกรได
1 2 3 4 5
12 องคกรของฉันมีการประเมินความคุมคาของเวลาที่ใชไปกับการอบรมและการเรียนรูของพนักงาน
1 2 3 4 5
13 องคกรของฉันใหความสําคัญกับผูที่มีความคดิริเริ่ม 1 2 3 4 5
14 องคกรของฉันใหอํานาจแกคนในองคกร ในการใชทรัพยากรขององคกรทีจ่ําเปนตอการเรียนรู
1 2 3 4 5
15 องคกรของฉันใหการสนับสนุนแกผูที่กลารับความเส่ียงที่คาดวาจะเกิดขึ้น
1 2 3 4 5
16 องคกรของฉันสนับสนนุใหคนมองส่ิงตางๆ อยางรอบดาน 1 2 3 4 5
17 องคกรของฉันทํางานรวมกับชุมชน และองคกรอื่นๆ เพ่ือใหสามารถบรรลุวัตถุประสงครวมกันได
1 2 3 4 5
18 องคกรของฉันสนับสนนุใหคนแกไขปญหา โดยหาคําตอบจากหลายแหลง และ หลายมุมมอง
1 2 3 4 5
19 ในองคกรของฉนัผูนํา จะเปนผูใหคําช้ีแนะ และ ส่ังสอนผูใตบงัคบับัญชา
1 2 3 4 5
20 ในองคกรของฉนัผูนําจะมองหาโอกาสในการเรียนรูส่ิงใหมๆ อยูเสมอ 1 2 3 4 5
21 ในองคกรของฉนัผูนําจะทําใหม่ันใจวากิจกรรมตางๆ ทีจ่ัดขึน้มีความเหมาะสมแกคุณคาขององคกร
1 2 3 4 5
230
ขอคําถาม ไมเห็นดวยอยางย่ิง
เห็นดวยอยางย่ิง
1 การบริหารอยางกระตือรนมักคนหาความคิดสรางสรรคส่ิงใหมๆ 1 2 3 4 5
2 โครงการนวัตกรรมหรอืการจัดการแผนงานไดถูกยอมรับทันที 1 2 3 4 5
3 บนพ้ีนฐานจากผลของการวิจัย นวัตกรรมทางวิทยาศาสตรไดถูกยอมรับในทันที
1 2 3 4 5
4 ในองคกรของฉนั นวัตกรรมในหนวยธุรกิจไดถูกรับรูวามีความไมแนนอนและมักไดรบัการปฏเิสธ
1 2 3 4 5
5 บริษัทของเรามักจะเปนผูนําในการออกสูตลาดอยูบอยๆในการแนะนําสินคาหรือบริการใหมๆ
1 2 3 4 5
6 ลูกคาของเรามักจะรับรูวาสินคาและบริการใหมของเรา เปนส่ิงที่ใหมมากบอยๆ
1 2 3 4 5
7 ใน 5 ปที่ผานมา บริษัทของเรามีการแนะนําสินคาและบริการที่สรางสรรคมากกวาคูแขง
1 2 3 4 5
8 เม่ือเปรียบเทียบกับคูแขง บริษัทของเรามีอัตราความสําเร็จที่ต่ํากวาในการออกสินคาและบริการใหมๆ
1 2 3 4 5
9 เราไดมีการปรับปรุงกระบวนการทางธุรกิจของเราอยางตอเนื่อง 1 2 3 4 5
10 เม่ือเปรียบเทียบกับคูแขง บริษัทของเราไดเปล่ียนแปลงวิธีการผลิตที่รวดเร็วดีมาก
1 2 3 4 5
11 บริษัทของเราไดมีการพัฒนาวิธีการบริหารงานใหมๆมากมายในระหวาง 5 ปที่ผานมา
1 2 3 4 5
สวนท่ี 3 นวัตกรรมองคกร
กรุณาเลือกตัวเลขที่ตรงกับความเห็นของทานมากที่สุด ในแตละขอความที่อธิบายความเปนนวัตกรรมองคกรของบริษัททานตั้งแต 1 (ไมเห็นดวยอยางย่ิง), 2 (คอนขางไมเหน็ดวย), 3 (เฉยๆ), 4 (คอนขางเห็นดวย), 5 (เห็นดวยอยางย่ิง)
231
ขอคําถาม ไมเห็นดวยอยางย่ิง
เห็นดวยอยางย่ิง
1 ผลตอบแทนจากการลงทนุในองคกรของฉนัในปนี้สูงกวาปทีผ่านมา 1 2 3 4 5
2 อัตราการเติบโตของยอดขายในองคกรของฉันในปนีด้ีกวาปที่ผานมา 1 2 3 4 5
3 ผลิตผลตอจํานวนพนักงานในองคกรของฉนัในปนี้สูงกวาปทีผ่านมา 1 2 3 4 5
4 เวลาที่ใชในการกระจายสินคาสูตลาดในองคกรของฉนันอยกวาปที่ผานมา 1 2 3 4 5
5 องคกรของฉันการดูแลเอาใจใสตอคํารองเรียน/ความตองการของลูกคามากกวาปที่ผานมา
1 2 3 4 5
6 ตนทุนตอชองทางดําเนินธุรกิจในองคกรของฉันนอยกวาปที่ผานมา 1 2 3 4 5
7 สวนแบงทางการตลาดในองคกรของฉันสูงกวาปทีผ่านมา 1 2 3 4 5
8 องคกรของฉันไดรบัปริมาณผลกําไรในการทําธุรกิจมากกวาปที่ผานมา 1 2 3 4 5
9 เงินทนุทีเ่พ่ิมขึ้นในการทําธุรกิจในองคกรของฉันดีกวาปที่ผานมา 1 2 3 4 5
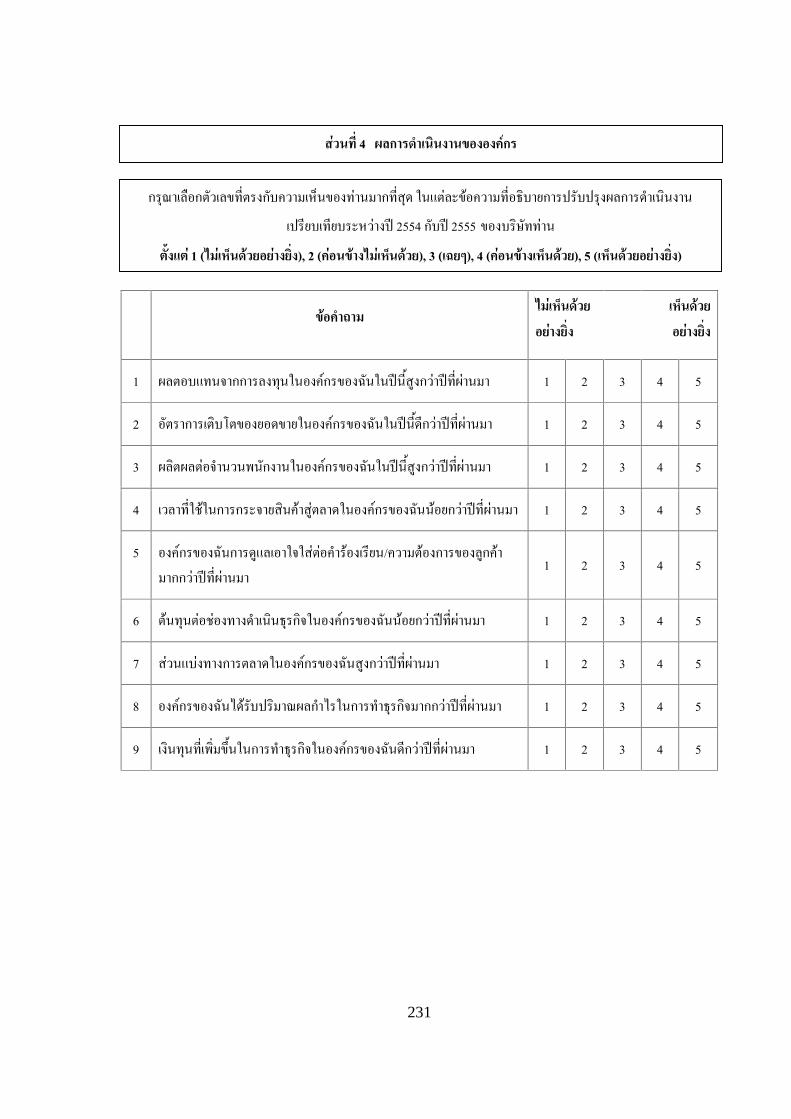
สวนท่ี 4 ผลการดําเนินงานขององคกร
กรุณาเลือกตัวเลขที่ตรงกับความเห็นของทานมากที่สุด ในแตละขอความที่อธิบายการปรับปรุงผลการดําเนินงานเปรียบเทียบระหวางป 2554 กับป 2555 ของบรษิัททาน
ตั้งแต 1 (ไมเห็นดวยอยางย่ิง), 2 (คอนขางไมเหน็ดวย), 3 (เฉยๆ), 4 (คอนขางเห็นดวย), 5 (เห็นดวยอยางย่ิง)

232
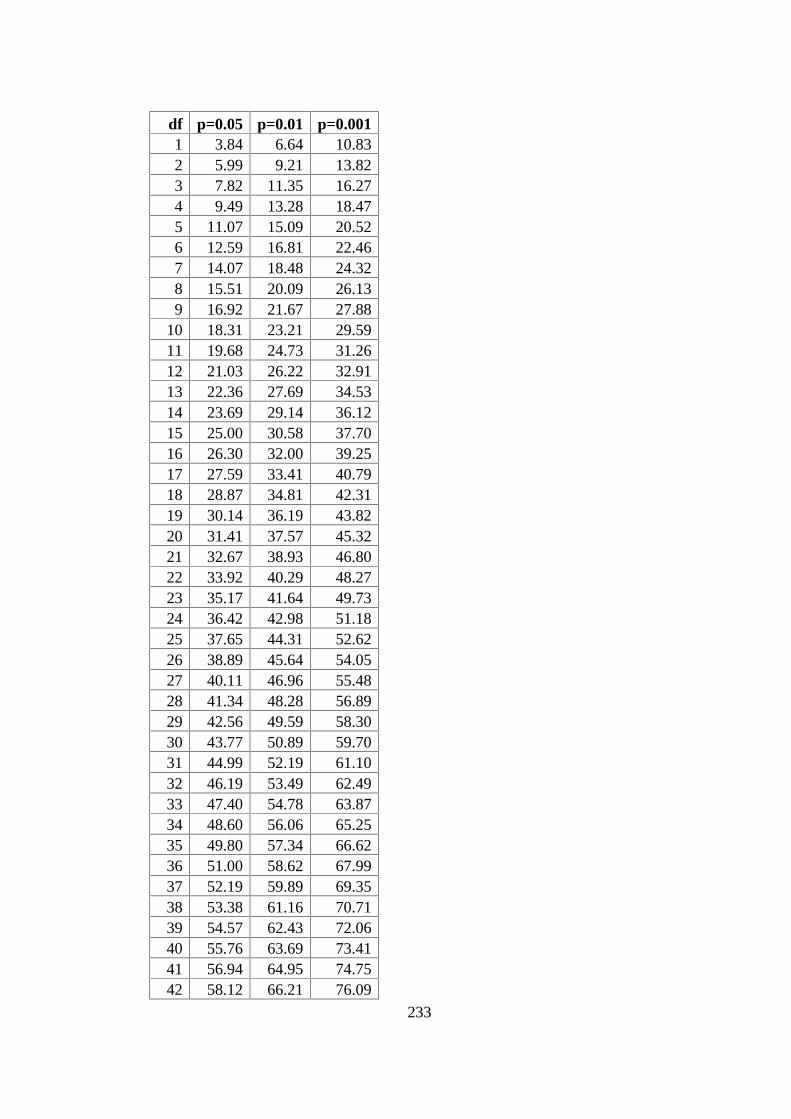
Appendix D
Chi-square Value
233
df p=0.05 p=0.01 p=0.0011 3.84 6.64 10.832 5.99 9.21 13.823 7.82 11.35 16.274 9.49 13.28 18.475 11.07 15.09 20.526 12.59 16.81 22.467 14.07 18.48 24.328 15.51 20.09 26.139 16.92 21.67 27.88
10 18.31 23.21 29.5911 19.68 24.73 31.2612 21.03 26.22 32.9113 22.36 27.69 34.5314 23.69 29.14 36.1215 25.00 30.58 37.7016 26.30 32.00 39.2517 27.59 33.41 40.7918 28.87 34.81 42.3119 30.14 36.19 43.8220 31.41 37.57 45.3221 32.67 38.93 46.8022 33.92 40.29 48.2723 35.17 41.64 49.7324 36.42 42.98 51.1825 37.65 44.31 52.6226 38.89 45.64 54.0527 40.11 46.96 55.4828 41.34 48.28 56.8929 42.56 49.59 58.3030 43.77 50.89 59.7031 44.99 52.19 61.1032 46.19 53.49 62.4933 47.40 54.78 63.8734 48.60 56.06 65.2535 49.80 57.34 66.6236 51.00 58.62 67.9937 52.19 59.89 69.3538 53.38 61.16 70.7139 54.57 62.43 72.0640 55.76 63.69 73.4141 56.94 64.95 74.7542 58.12 66.21 76.09
234
Appendix E
Missing Data
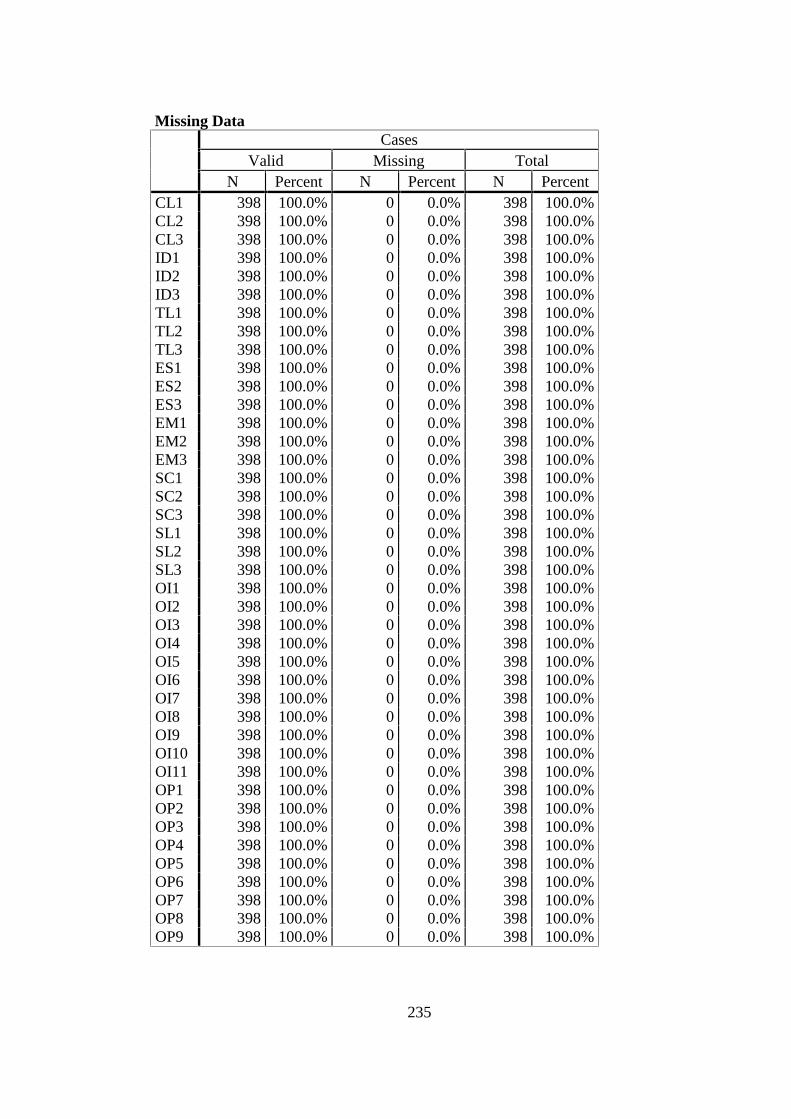
235
Missing DataCases
Valid Missing TotalN Percent N Percent N Percent
CL1 398 100.0% 0 0.0% 398 100.0%CL2 398 100.0% 0 0.0% 398 100.0%CL3 398 100.0% 0 0.0% 398 100.0%ID1 398 100.0% 0 0.0% 398 100.0%ID2 398 100.0% 0 0.0% 398 100.0%ID3 398 100.0% 0 0.0% 398 100.0%TL1 398 100.0% 0 0.0% 398 100.0%TL2 398 100.0% 0 0.0% 398 100.0%TL3 398 100.0% 0 0.0% 398 100.0%ES1 398 100.0% 0 0.0% 398 100.0%ES2 398 100.0% 0 0.0% 398 100.0%ES3 398 100.0% 0 0.0% 398 100.0%EM1 398 100.0% 0 0.0% 398 100.0%EM2 398 100.0% 0 0.0% 398 100.0%EM3 398 100.0% 0 0.0% 398 100.0%SC1 398 100.0% 0 0.0% 398 100.0%SC2 398 100.0% 0 0.0% 398 100.0%SC3 398 100.0% 0 0.0% 398 100.0%SL1 398 100.0% 0 0.0% 398 100.0%SL2 398 100.0% 0 0.0% 398 100.0%SL3 398 100.0% 0 0.0% 398 100.0%OI1 398 100.0% 0 0.0% 398 100.0%OI2 398 100.0% 0 0.0% 398 100.0%OI3 398 100.0% 0 0.0% 398 100.0%OI4 398 100.0% 0 0.0% 398 100.0%OI5 398 100.0% 0 0.0% 398 100.0%OI6 398 100.0% 0 0.0% 398 100.0%OI7 398 100.0% 0 0.0% 398 100.0%OI8 398 100.0% 0 0.0% 398 100.0%OI9 398 100.0% 0 0.0% 398 100.0%OI10 398 100.0% 0 0.0% 398 100.0%OI11 398 100.0% 0 0.0% 398 100.0%OP1 398 100.0% 0 0.0% 398 100.0%OP2 398 100.0% 0 0.0% 398 100.0%OP3 398 100.0% 0 0.0% 398 100.0%OP4 398 100.0% 0 0.0% 398 100.0%OP5 398 100.0% 0 0.0% 398 100.0%OP6 398 100.0% 0 0.0% 398 100.0%OP7 398 100.0% 0 0.0% 398 100.0%OP8 398 100.0% 0 0.0% 398 100.0%OP9 398 100.0% 0 0.0% 398 100.0%
236
Appendix F
Descriptive Statistics of Variables

237
Gender
Frequency Percent Valid Percent Cumulative
Percent
Valid
Male 280 71.4 71.4 71.4
Female 112 28.6 28.6 100.0
Total 392 100.0 100.0
Type of Business
Frequency Percent Valid Percent Cumulative
Percent
Valid
Manufacturing 216 55.1 55.1 55.1
Service 176 44.9 44.9 100.0
Total 392 100.0 100.0
Experience
Frequency Percent Valid Percent Cumulative
Percent
Valid
More than 5 but less than 7
years109 27.8 27.8 27.8
More than 7 but less than 9
years153 39.0 39.0 66.8
More than 9 years 130 33.2 33.2 100.0
Total 392 100.0 100.0
Position
Frequency Percent Valid Percent Cumulative
Percent
Valid
Owner 272 69.4 69.4 69.4
Manager 120 30.6 30.6 100.0
Total 392 100.0 100.0

238
Number of Employees
Frequency Percent Valid Percent Cumulative
Percent
Valid
1 - 50 40 10.2 10.2 10.2
51 - 200 352 89.8 89.8 100.0
Total 392 100.0 100.0
Age of Business
Frequency Percent Valid Percent Cumulative
Percent
Valid
6 – 10 years 180 45.9 45.9 45.9
More than 10 years 212 54.1 54.1 100.0
Total 392 100.0 100.0
International Business
Frequency Percent Valid Percent Cumulative
Percent
Valid
Yes 207 52.8 52.8 52.8
No 185 47.2 47.2 100.0
Total 392 100.0 100.0
239
Appendix G
Assessment of Normality

240
N Minimum Maximum Mean Std.Deviation
Zscore: CL1 392 -1.65532 1.23504 0E-7 1.00000000Zscore: CL2 392 -1.64301 1.44601 0E-7 1.00000000Zscore: CL3 392 -1.68649 1.35307 0E-7 1.00000000Zscore: ID1 392 -1.79653 1.35796 0E-7 1.00000000Zscore: ID2 392 -1.86912 1.46890 0E-7 1.00000000Zscore: ID3 392 -1.86111 1.40312 0E-7 1.00000000Zscore: TL1 392 -1.70790 1.35266 0E-7 1.00000000Zscore: TL2 392 -1.84325 1.30171 0E-7 1.00000000Zscore: TL3 392 -1.76319 1.33276 0E-7 1.00000000Zscore: ES1 392 -1.85586 1.38828 0E-7 1.00000000Zscore: ES2 392 -1.91680 1.38599 0E-7 1.00000000Zscore: ES3 392 -1.90858 1.28529 0E-7 1.00000000Zscore: EM1 392 -1.90925 1.34478 0E-7 1.00000000Zscore: EM2 392 -1.94689 1.32506 0E-7 1.00000000Zscore: EM3 392 -1.91108 1.30758 0E-7 1.00000000Zscore: SC1 392 -1.46387 1.32852 0E-7 1.00000000Zscore: SC2 392 -1.46312 1.51246 0E-7 1.00000000Zscore: SC3 392 -1.63737 1.27022 0E-7 1.00000000Zscore: SL1 392 -1.79581 1.24504 0E-7 1.00000000Zscore: SL2 392 -1.87530 1.29331 0E-7 1.00000000Zscore: SL3 392 -1.87973 1.29979 0E-7 1.00000000Zscore: OI1 392 -1.90333 1.36906 0E-7 1.00000000Zscore: OI2 392 -1.92605 1.29361 0E-7 1.00000000Zscore: OI3 392 -1.90289 1.34736 0E-7 1.00000000Zscore: OI4 392 -1.97785 1.30391 0E-7 1.00000000Zscore: OI5 392 -1.87769 1.32952 0E-7 1.00000000Zscore: OI6 392 -1.94521 1.32742 0E-7 1.00000000Zscore: OI7 392 -1.91575 1.34936 0E-7 1.00000000Zscore: OI8 392 -1.99262 1.43705 0E-7 1.00000000Zscore: OI9 392 -1.90145 1.35699 0E-7 1.00000000Zscore: OI10 392 -1.91746 1.44560 0E-7 1.00000000Zscore: OI11 392 -1.94072 1.42921 0E-7 1.00000000Zscore: OP1 392 -1.52437 1.41924 0E-7 1.00000000Zscore: OP2 392 -1.57504 1.40046 0E-7 1.00000000Zscore: OP3 392 -1.61296 1.51714 0E-7 1.00000000Zscore: OP4 392 -1.32921 1.61874 0E-7 1.00000000Zscore: OP5 392 -1.48989 1.41577 0E-7 1.00000000Zscore: OP6 392 -1.50494 1.53989 0E-7 1.00000000Zscore: OP7 392 -1.48825 1.60258 0E-7 1.00000000Zscore: OP8 392 -1.63833 1.49830 0E-7 1.00000000Zscore: OP9 392 -1.55068 1.45113 0E-7 1.00000000Valid N(listwise)
392
241
Appendix H
Reliability Test and Composite Reliability
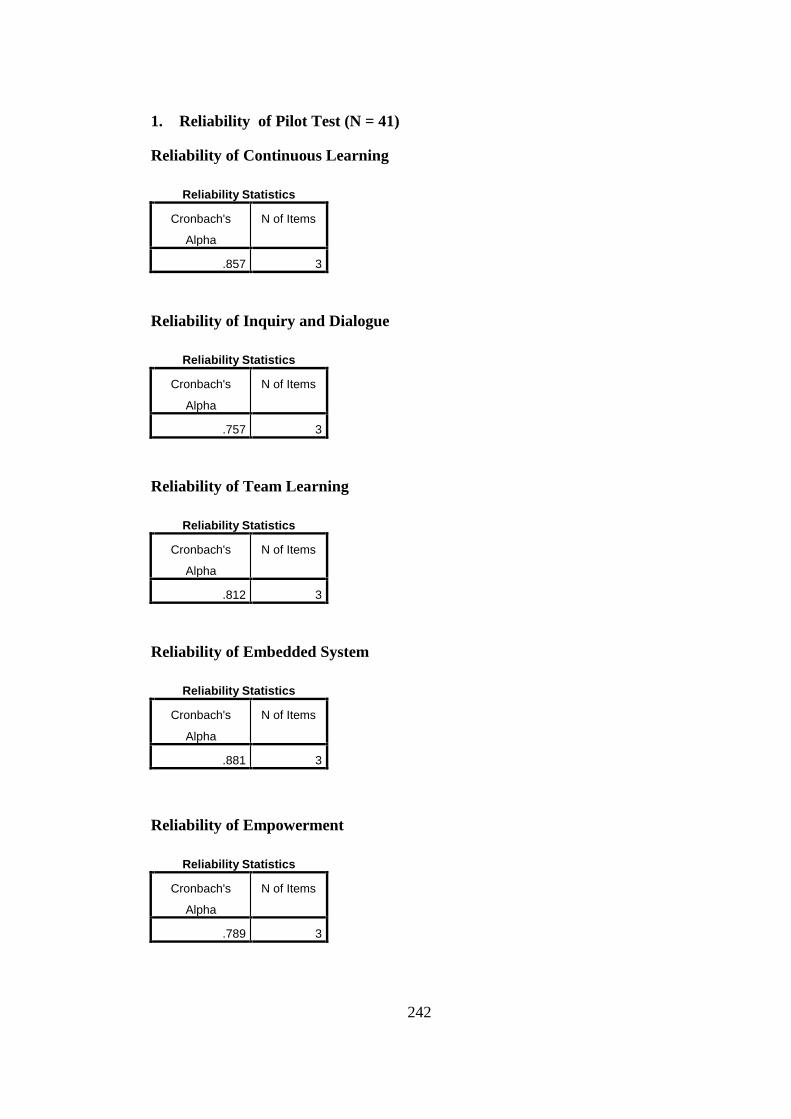
242
1. Reliability of Pilot Test (N = 41)
Reliability of Continuous Learning
Reliability Statistics
Cronbach's
Alpha
N of Items
.857 3
Reliability of Inquiry and Dialogue
Reliability Statistics
Cronbach's
Alpha
N of Items
.757 3
Reliability of Team Learning
Reliability Statistics
Cronbach's
Alpha
N of Items
.812 3
Reliability of Embedded System
Reliability Statistics
Cronbach's
Alpha
N of Items
.881 3
Reliability of Empowerment
Reliability Statistics
Cronbach's
Alpha
N of Items
.789 3
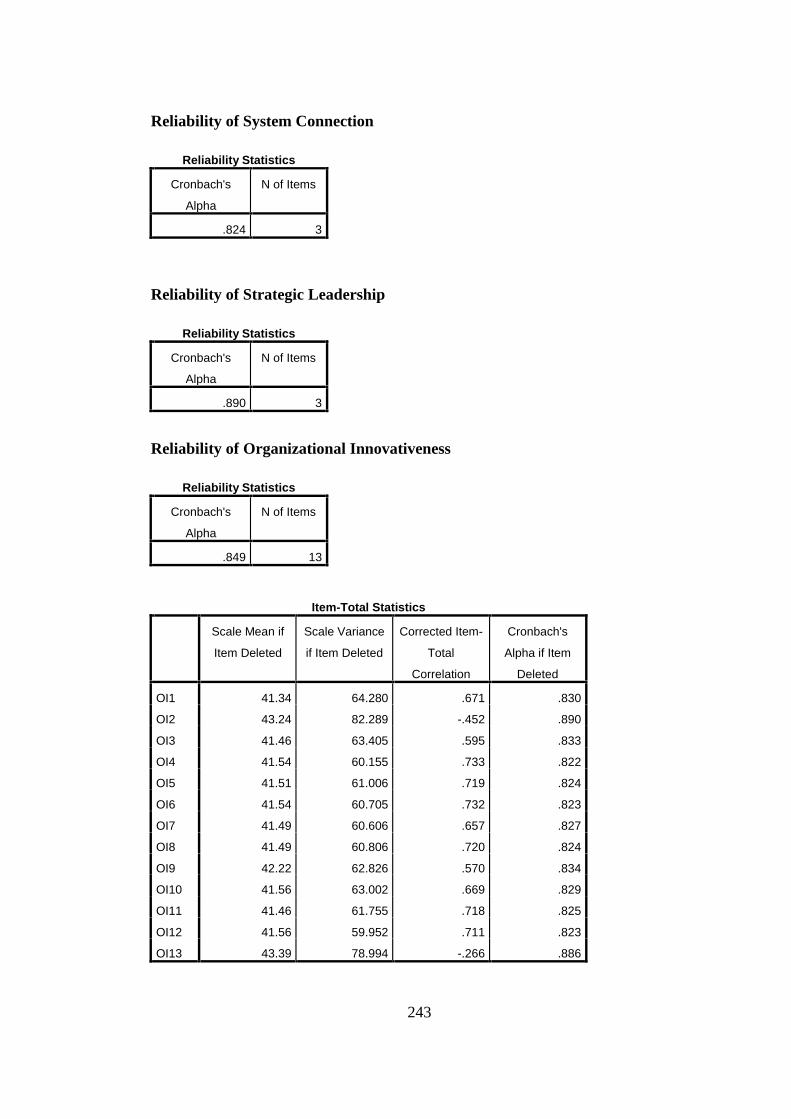
243
Reliability of System Connection
Reliability Statistics
Cronbach's
Alpha
N of Items
.824 3
Reliability of Strategic Leadership
Reliability Statistics
Cronbach's
Alpha
N of Items
.890 3
Reliability of Organizational Innovativeness
Reliability Statistics
Cronbach's
Alpha
N of Items
.849 13
Item-Total Statistics
Scale Mean if
Item Deleted
Scale Variance
if Item Deleted
Corrected Item-
Total
Correlation
Cronbach's
Alpha if Item
Deleted
OI1 41.34 64.280 .671 .830
OI2 43.24 82.289 -.452 .890
OI3 41.46 63.405 .595 .833
OI4 41.54 60.155 .733 .822
OI5 41.51 61.006 .719 .824
OI6 41.54 60.705 .732 .823
OI7 41.49 60.606 .657 .827
OI8 41.49 60.806 .720 .824
OI9 42.22 62.826 .570 .834
OI10 41.56 63.002 .669 .829
OI11 41.46 61.755 .718 .825
OI12 41.56 59.952 .711 .823
OI13 43.39 78.994 -.266 .886
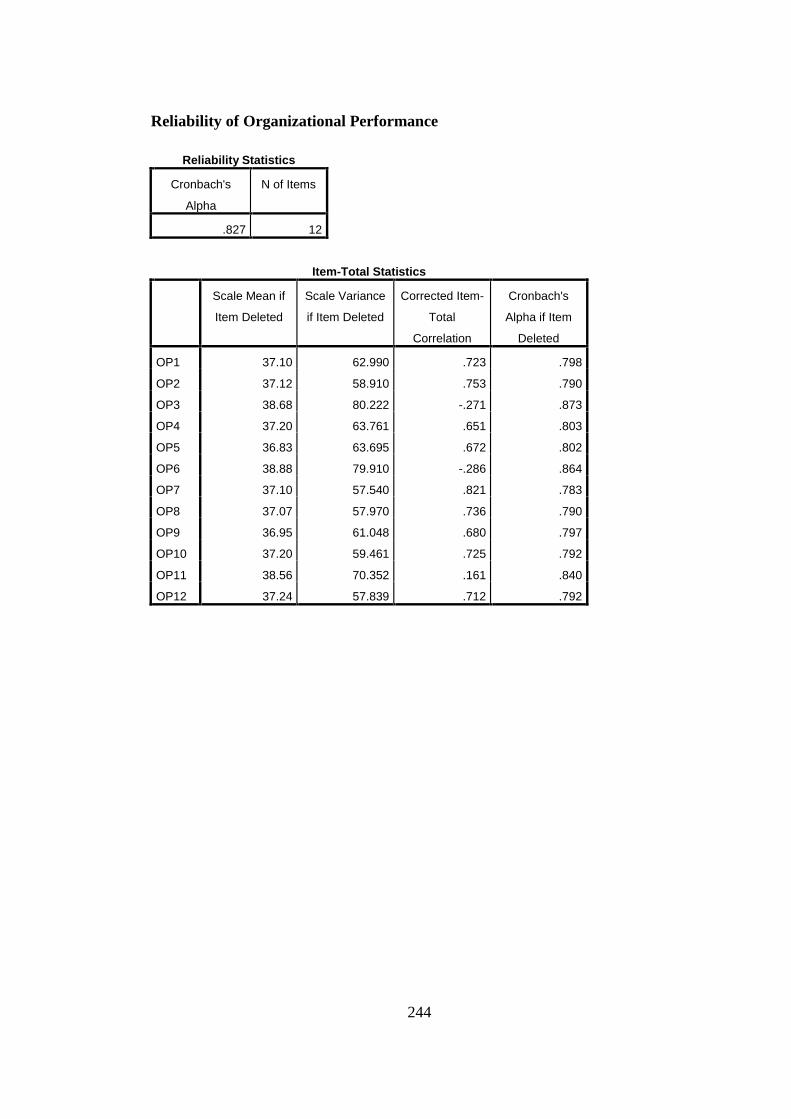
244
Reliability of Organizational Performance
Reliability Statistics
Cronbach's
Alpha
N of Items
.827 12
Item-Total Statistics
Scale Mean if
Item Deleted
Scale Variance
if Item Deleted
Corrected Item-
Total
Correlation
Cronbach's
Alpha if Item
Deleted
OP1 37.10 62.990 .723 .798
OP2 37.12 58.910 .753 .790
OP3 38.68 80.222 -.271 .873
OP4 37.20 63.761 .651 .803
OP5 36.83 63.695 .672 .802
OP6 38.88 79.910 -.286 .864
OP7 37.10 57.540 .821 .783
OP8 37.07 57.970 .736 .790
OP9 36.95 61.048 .680 .797
OP10 37.20 59.461 .725 .792
OP11 38.56 70.352 .161 .840
OP12 37.24 57.839 .712 .792

245
2. Reliability Test Results (N = 392)
Reliability of Continuous Learning
Reliability Statistics
Cronbach's
Alpha
N of Items
.871 3
Reliability of Inquiry and Dialogue
Reliability Statistics
Cronbach's
Alpha
N of Items
.889 3
Reliability of Team Learning
Reliability Statistics
Cronbach's
Alpha
N of Items
.917 3
Reliability of Embedded System
Reliability Statistics
Cronbach's
Alpha
N of Items
.923 3
Reliability of Empowerment
Reliability Statistics
Cronbach's
Alpha
N of Items
.865 3
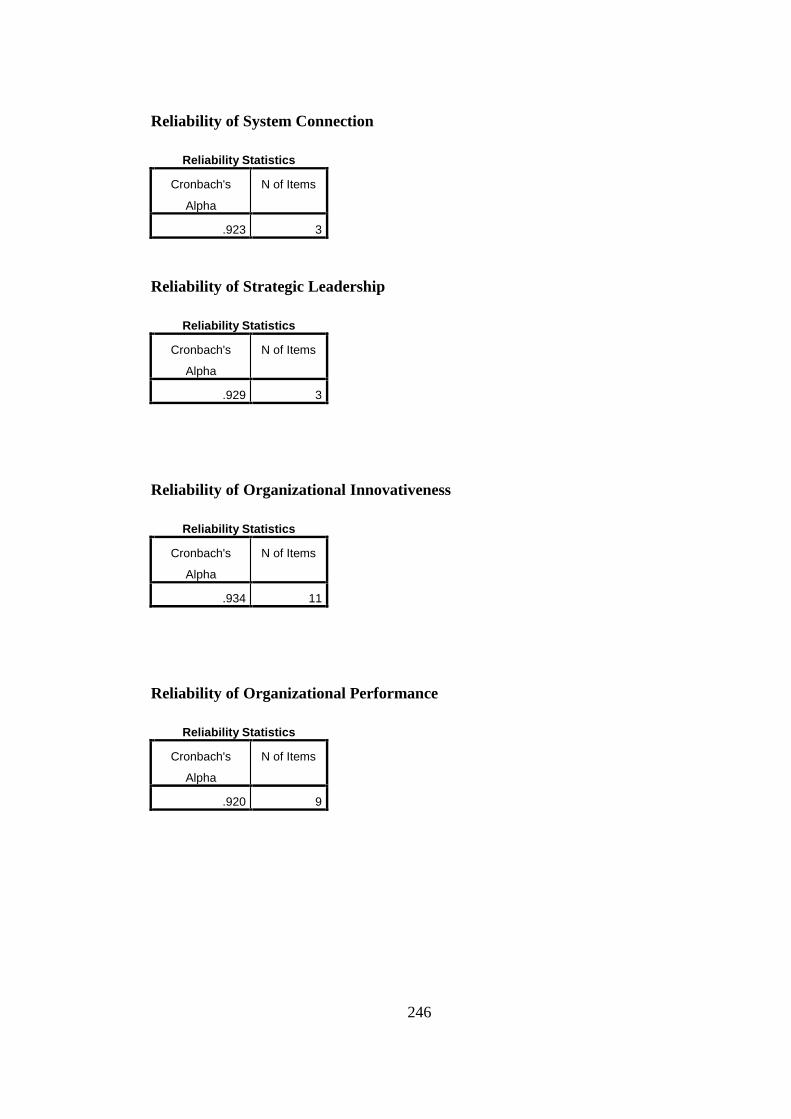
246
Reliability of System Connection
Reliability Statistics
Cronbach's
Alpha
N of Items
.923 3
Reliability of Strategic Leadership
Reliability Statistics
Cronbach's
Alpha
N of Items
.929 3
Reliability of Organizational Innovativeness
Reliability Statistics
Cronbach's
Alpha
N of Items
.934 11
Reliability of Organizational Performance
Reliability Statistics
Cronbach's
Alpha
N of Items
.920 9

247
Composite Reliability
Variable Name Factor Factor S.E. CompositeLoading Loading2 Reliability
CL1 0.821 0.054CL2 0.843 0.054CL3 0.832 0.055
Continuous Learning 2.496 6.230 0.163 0.975ID1 0.912 0.043ID2 0.797 0.047ID3 0.861 0.039
Inquiry and Dialogue 2.570 6.605 0.129 0.981TL1 0.877 0.041TL2 0.939 0.039TL3 0.844 0.043
Team Learning 2.660 7.076 0.123 0.983ES1 0.901 0.039ES2 0.896 0.038ES3 0.886 0.039
Embedded System 2.683 7.198 0.116 0.984EM1 0.852 0.046EM2 0.861 0.047EM3 0.773 0.046
Empowerment 2.486 6.180 0.139 0.978SC1 0.887 0.038SC2 0.918 0.037SC3 0.878 0.039
System Connection 2.683 7.198 0.114 0.984SL1 0.873 0.039SL2 0.927 0.038SL3 0.912 0.039
Strategic Leadership 2.712 7.355 0.116 0.984OI1 0.817 0.054OI2 0.746 0.055OI3 0.760 0.054OI4 0.761 0.054OI5 0.741 0.056OI6 0.747 0.054OI7 0.771 0.054OI8 0.762 0.052
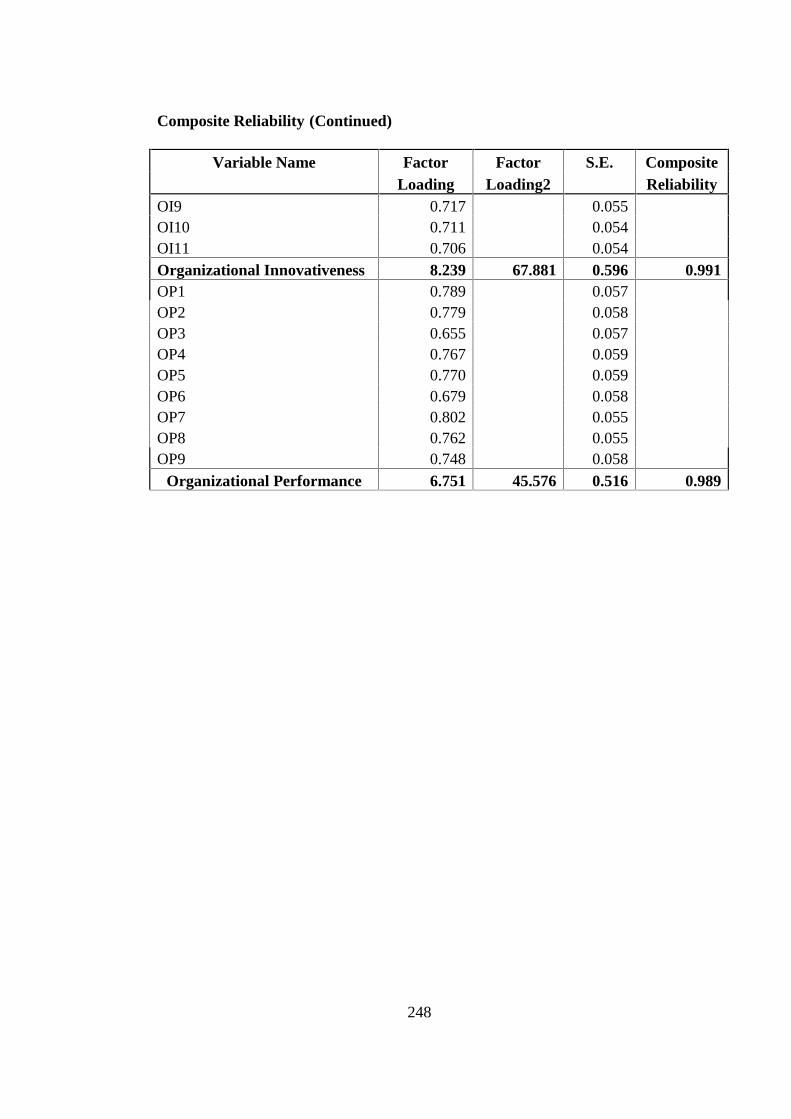
248
Composite Reliability (Continued)
Variable Name Factor Factor S.E. CompositeLoading Loading2 Reliability
OI9 0.717 0.055OI10 0.711 0.054OI11 0.706 0.054Organizational Innovativeness 8.239 67.881 0.596 0.991OP1 0.789 0.057OP2 0.779 0.058OP3 0.655 0.057OP4 0.767 0.059OP5 0.770 0.059OP6 0.679 0.058OP7 0.802 0.055OP8 0.762 0.055OP9 0.748 0.058
Organizational Performance 6.751 45.576 0.516 0.989
249
Appendix I
Variance Extracted and Correlation Matrix
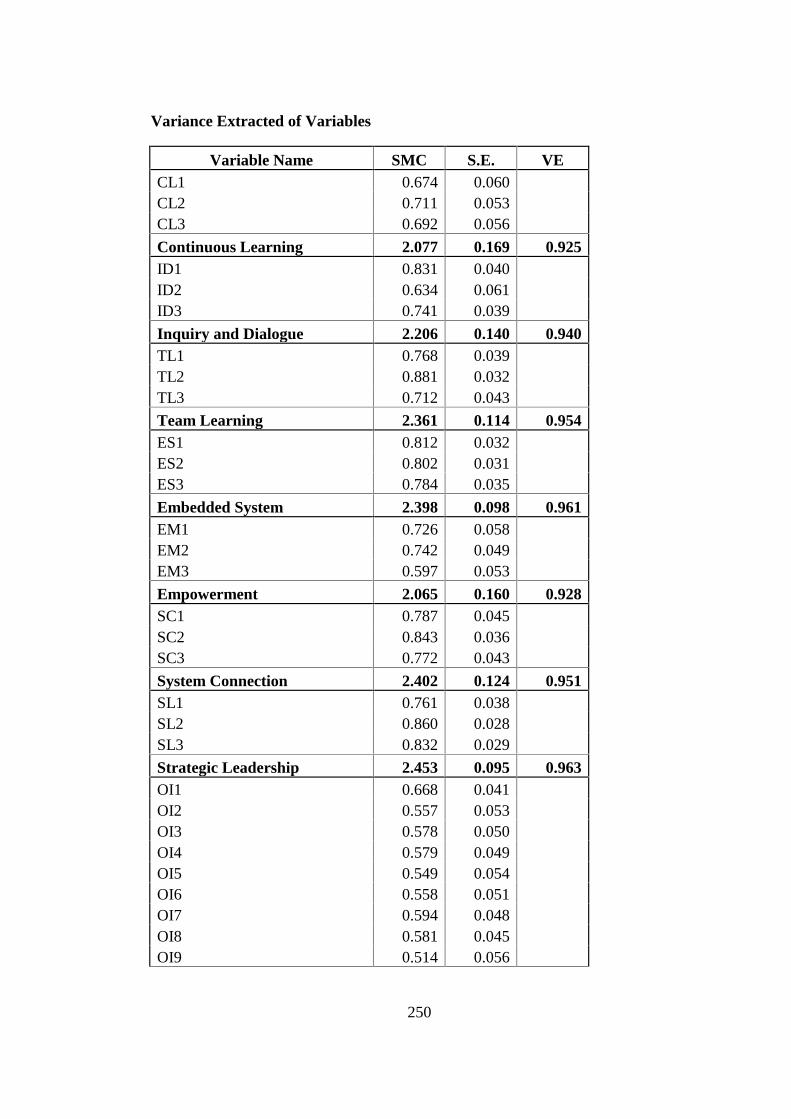
250
Variance Extracted of Variables
Variable Name SMC S.E. VECL1 0.674 0.060CL2 0.711 0.053CL3 0.692 0.056
Continuous Learning 2.077 0.169 0.925ID1 0.831 0.040ID2 0.634 0.061ID3 0.741 0.039
Inquiry and Dialogue 2.206 0.140 0.940TL1 0.768 0.039TL2 0.881 0.032TL3 0.712 0.043
Team Learning 2.361 0.114 0.954ES1 0.812 0.032ES2 0.802 0.031ES3 0.784 0.035
Embedded System 2.398 0.098 0.961EM1 0.726 0.058EM2 0.742 0.049EM3 0.597 0.053
Empowerment 2.065 0.160 0.928SC1 0.787 0.045SC2 0.843 0.036SC3 0.772 0.043
System Connection 2.402 0.124 0.951SL1 0.761 0.038SL2 0.860 0.028SL3 0.832 0.029
Strategic Leadership 2.453 0.095 0.963OI1 0.668 0.041OI2 0.557 0.053OI3 0.578 0.050OI4 0.579 0.049OI5 0.549 0.054OI6 0.558 0.051OI7 0.594 0.048OI8 0.581 0.045OI9 0.514 0.056
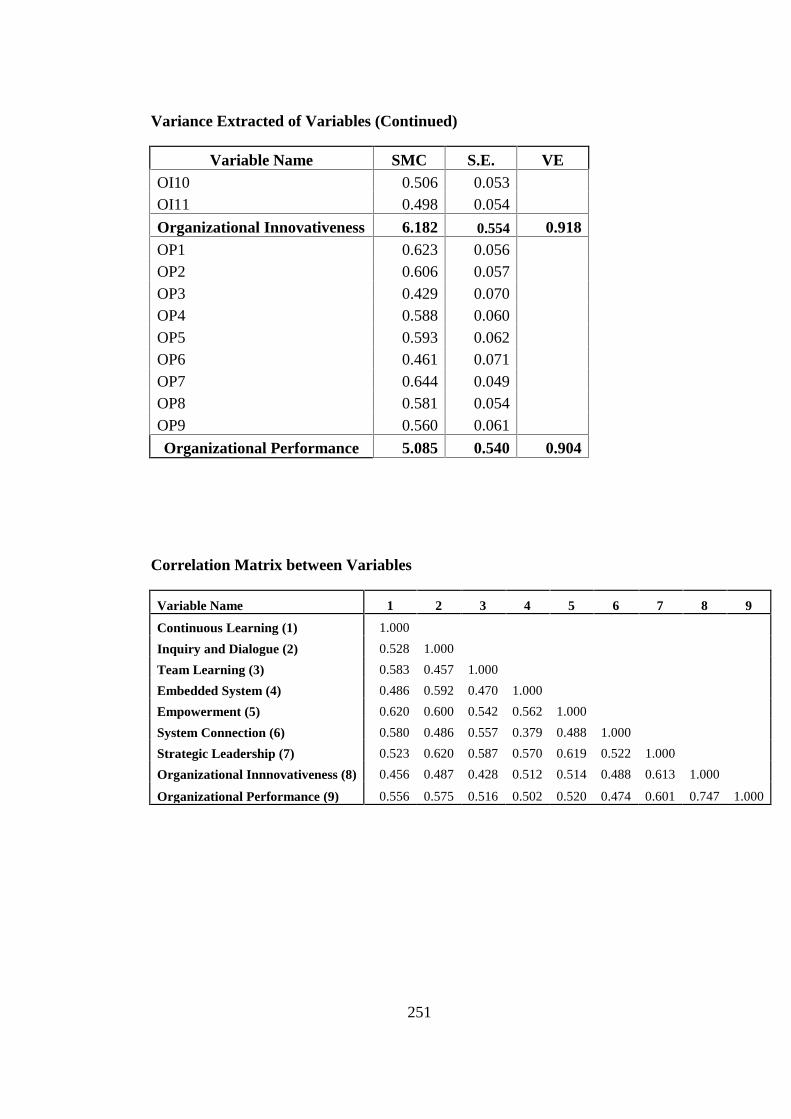
251
Variance Extracted of Variables (Continued)
Variable Name SMC S.E. VEOI10 0.506 0.053OI11 0.498 0.054
Organizational Innovativeness 6.182 0.554 0.918OP1 0.623 0.056OP2 0.606 0.057OP3 0.429 0.070OP4 0.588 0.060OP5 0.593 0.062OP6 0.461 0.071OP7 0.644 0.049OP8 0.581 0.054OP9 0.560 0.061
Organizational Performance 5.085 0.540 0.904
Correlation Matrix between Variables
Variable Name 1 2 3 4 5 6 7 8 9
Continuous Learning (1) 1.000
Inquiry and Dialogue (2) 0.528 1.000
Team Learning (3) 0.583 0.457 1.000
Embedded System (4) 0.486 0.592 0.470 1.000
Empowerment (5) 0.620 0.600 0.542 0.562 1.000
System Connection (6) 0.580 0.486 0.557 0.379 0.488 1.000
Strategic Leadership (7) 0.523 0.620 0.587 0.570 0.619 0.522 1.000
Organizational Innnovativeness (8) 0.456 0.487 0.428 0.512 0.514 0.488 0.613 1.000
Organizational Performance (9) 0.556 0.575 0.516 0.502 0.520 0.474 0.601 0.747 1.000
252
Appendix J
Normal P-P Plots and Q-Q Plots
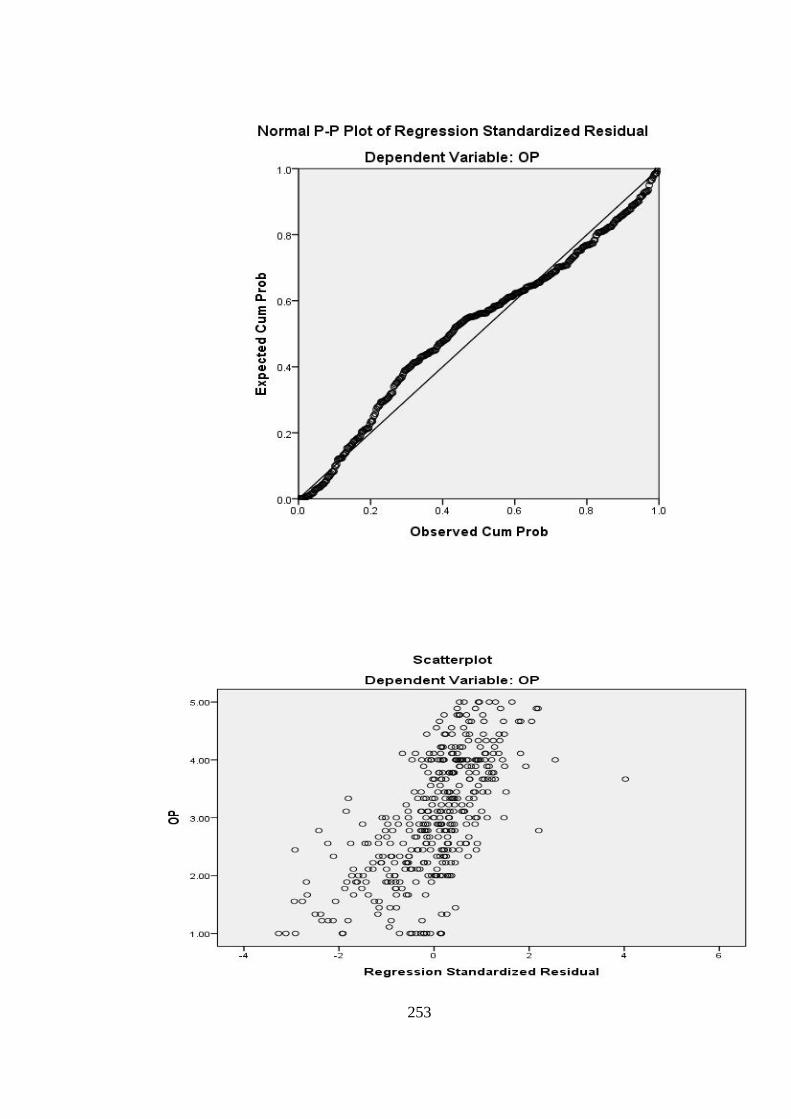
253

254
P-P Plots of Continuous Learning P-P Plots of Inquiry and Dialogue

255
P-P Plots of Team Learning P-P Plots of Embedded System
P-P Plot of Embedded System

256
P-P Plots of Empowerment P-P Plots of System Connection
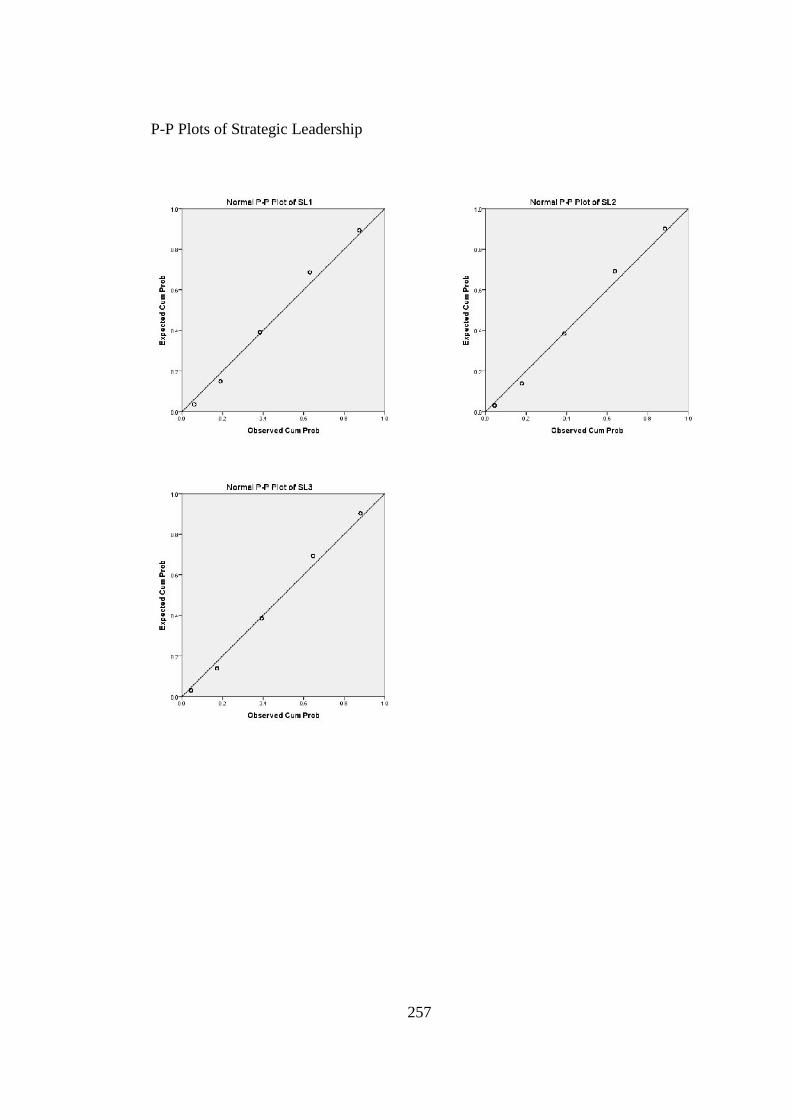
257
P-P Plots of Strategic Leadership

258
P-P Plots of Organizational Innovativeness
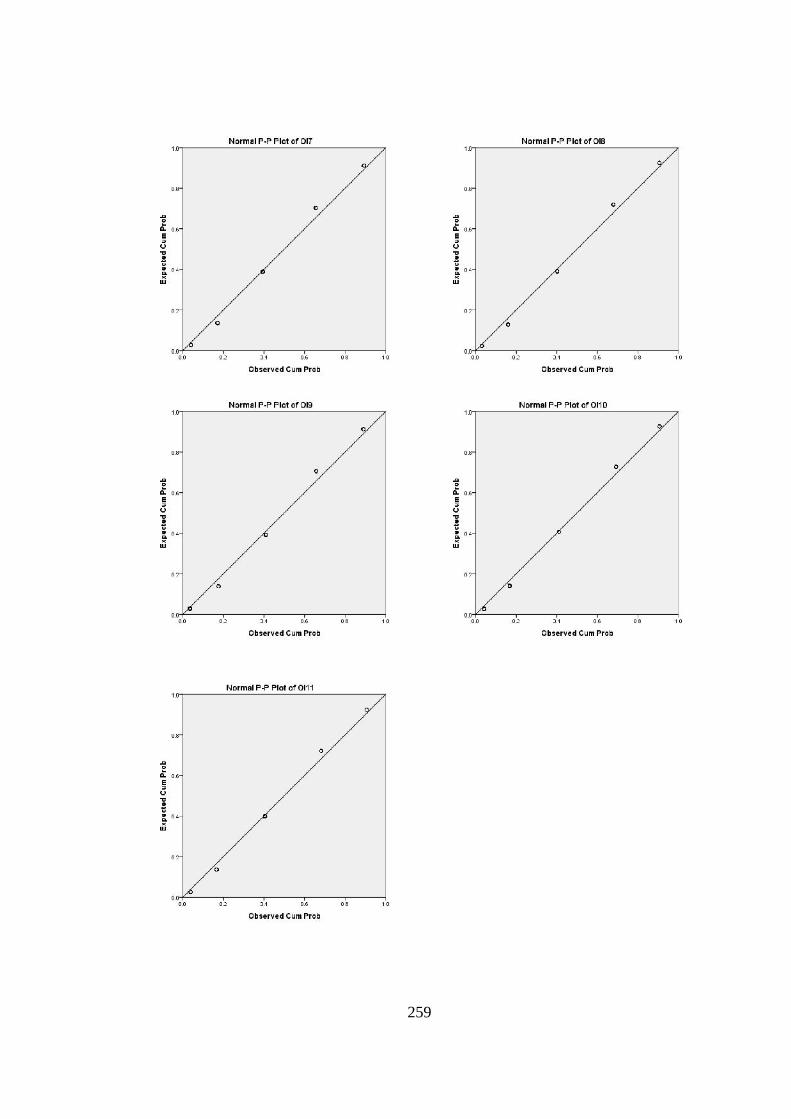
259
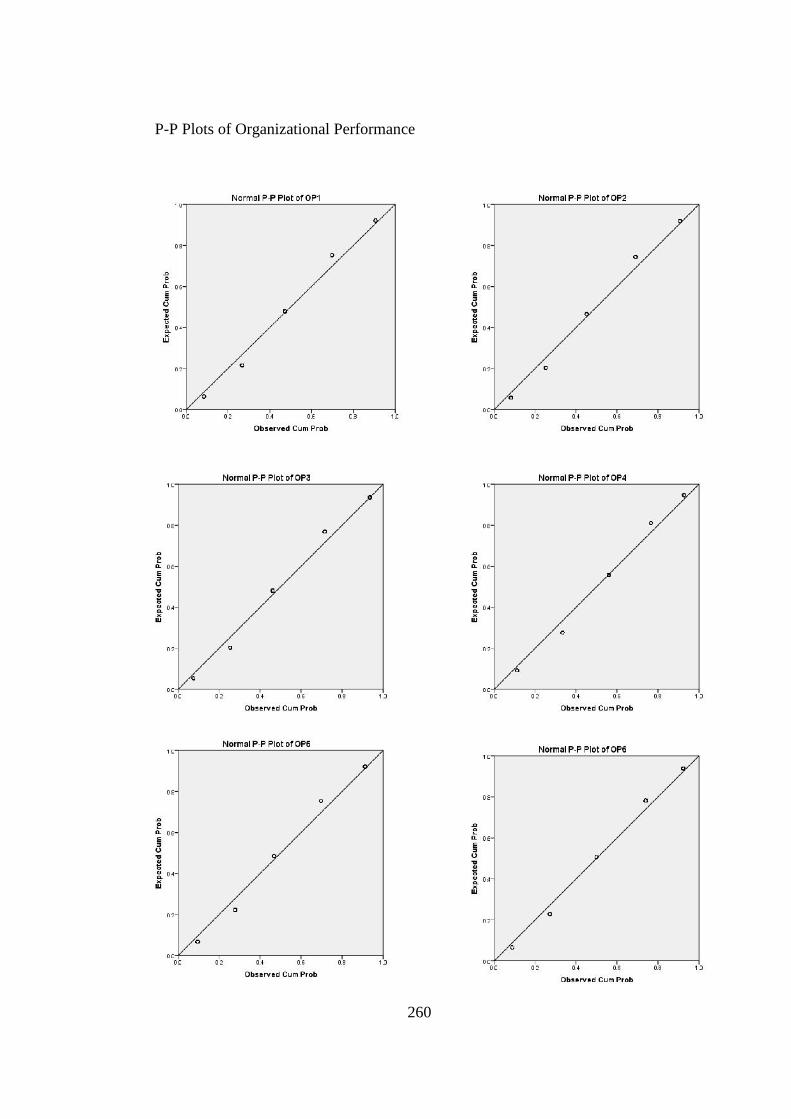
260
P-P Plots of Organizational Performance

261
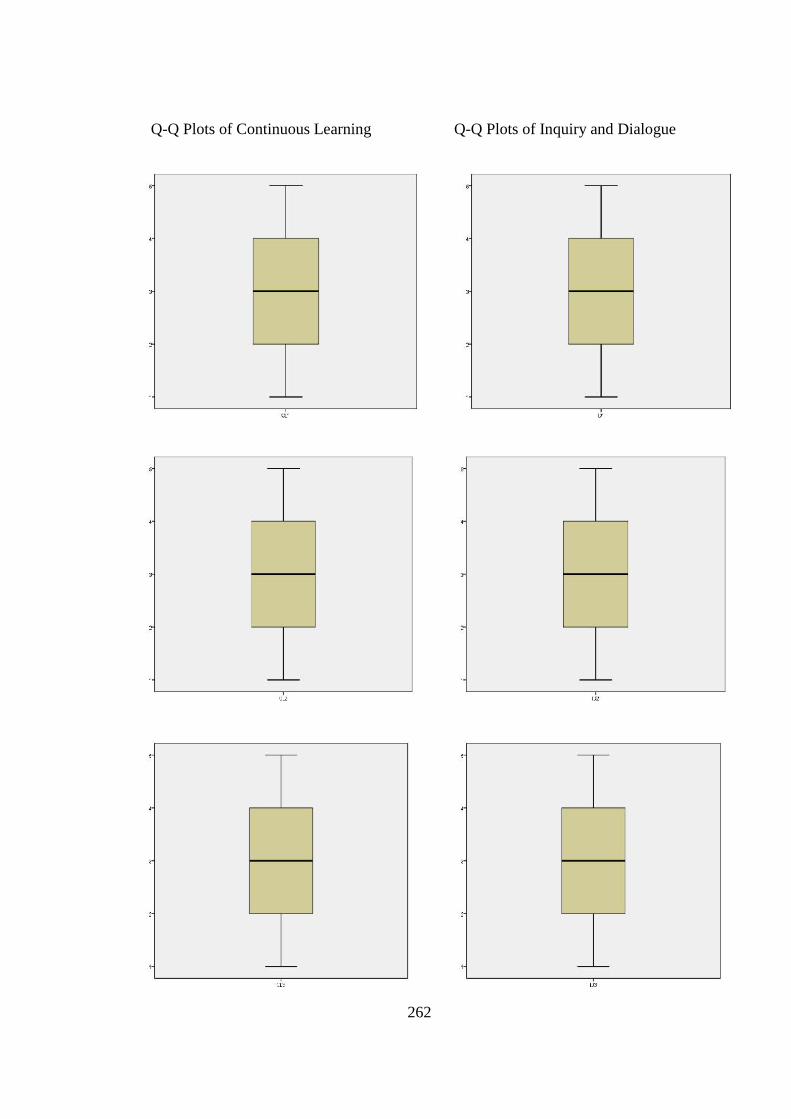
262
Q-Q Plots of Continuous Learning Q-Q Plots of Inquiry and Dialogue
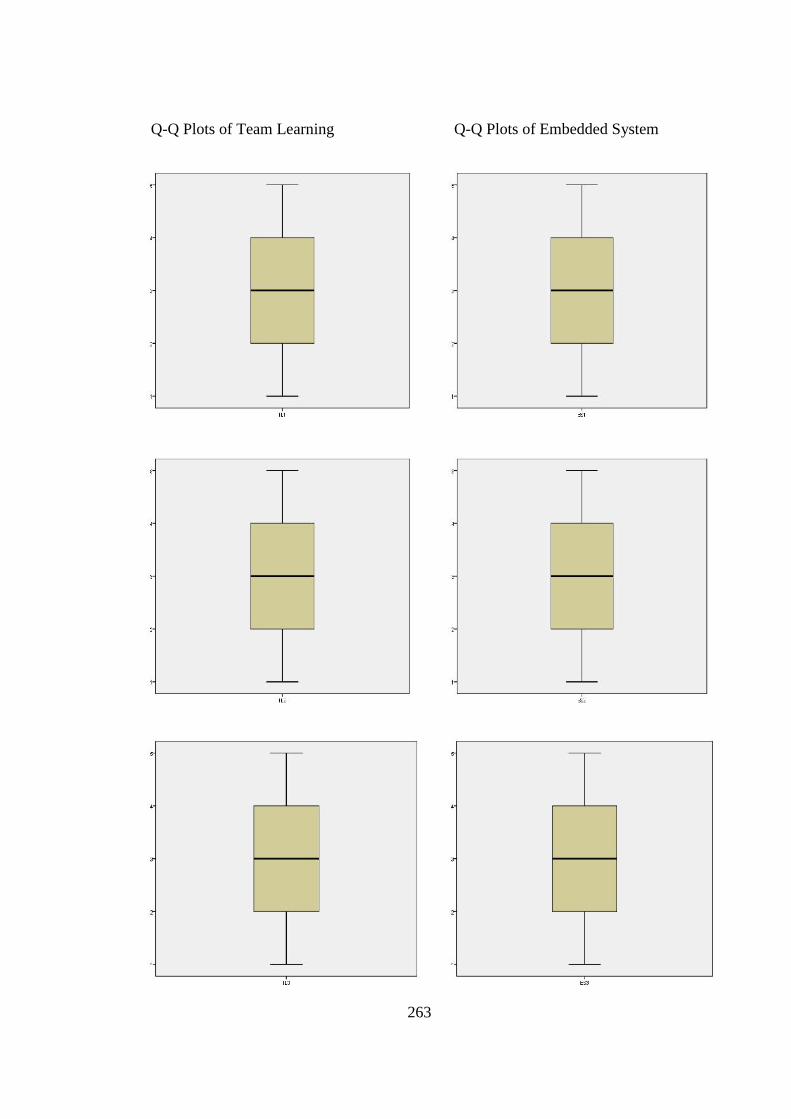
263
Q-Q Plots of Team Learning Q-Q Plots of Embedded System
P-P Plot of Embedded System
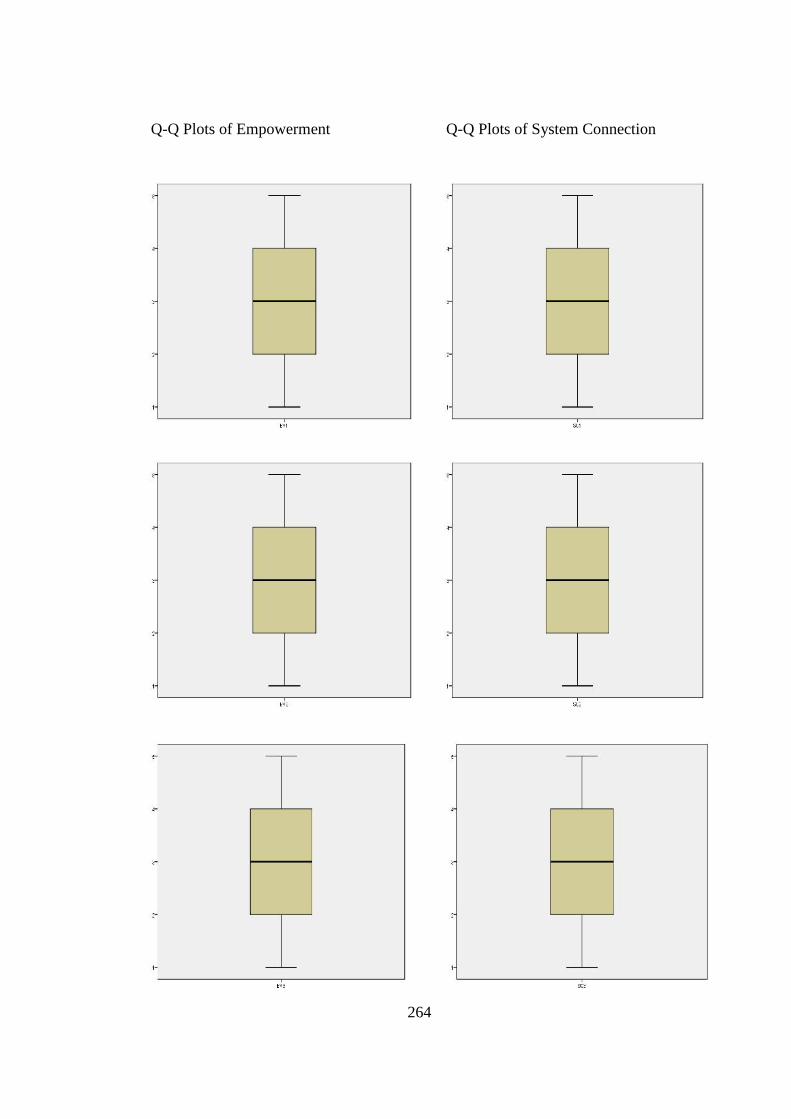
264
Q-Q Plots of Empowerment Q-Q Plots of System Connection
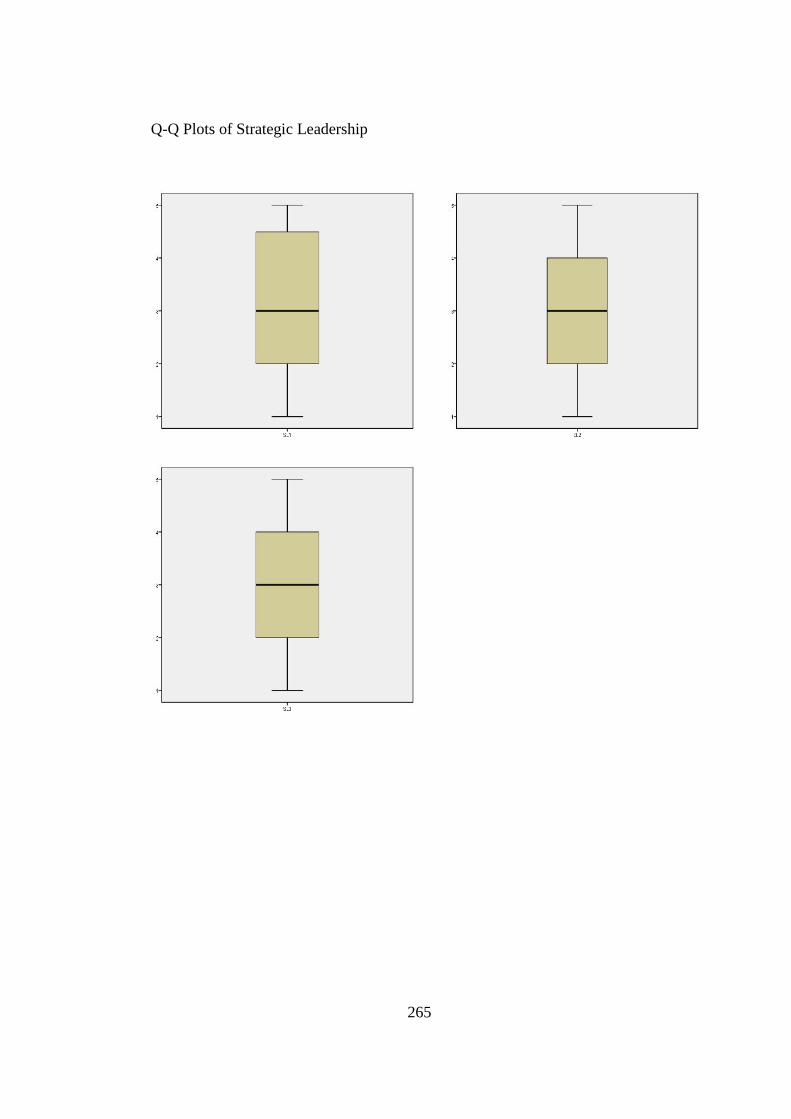
265
Q-Q Plots of Strategic Leadership
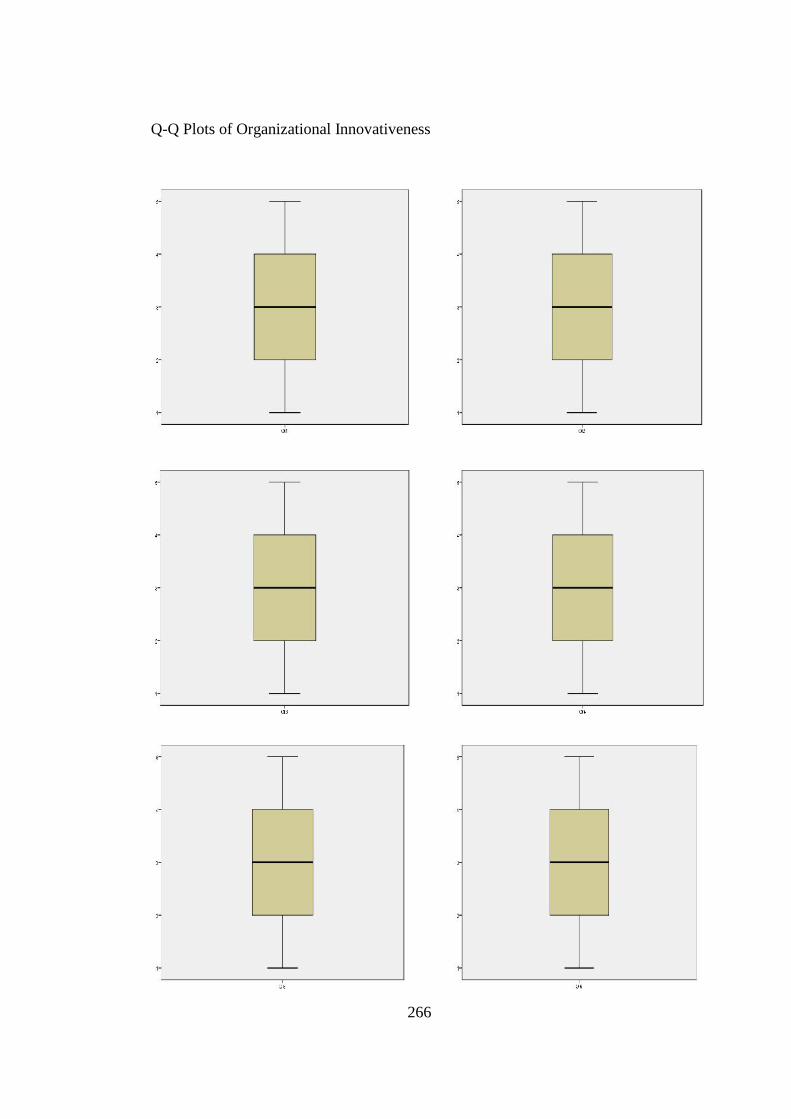
266
Q-Q Plots of Organizational Innovativeness

267
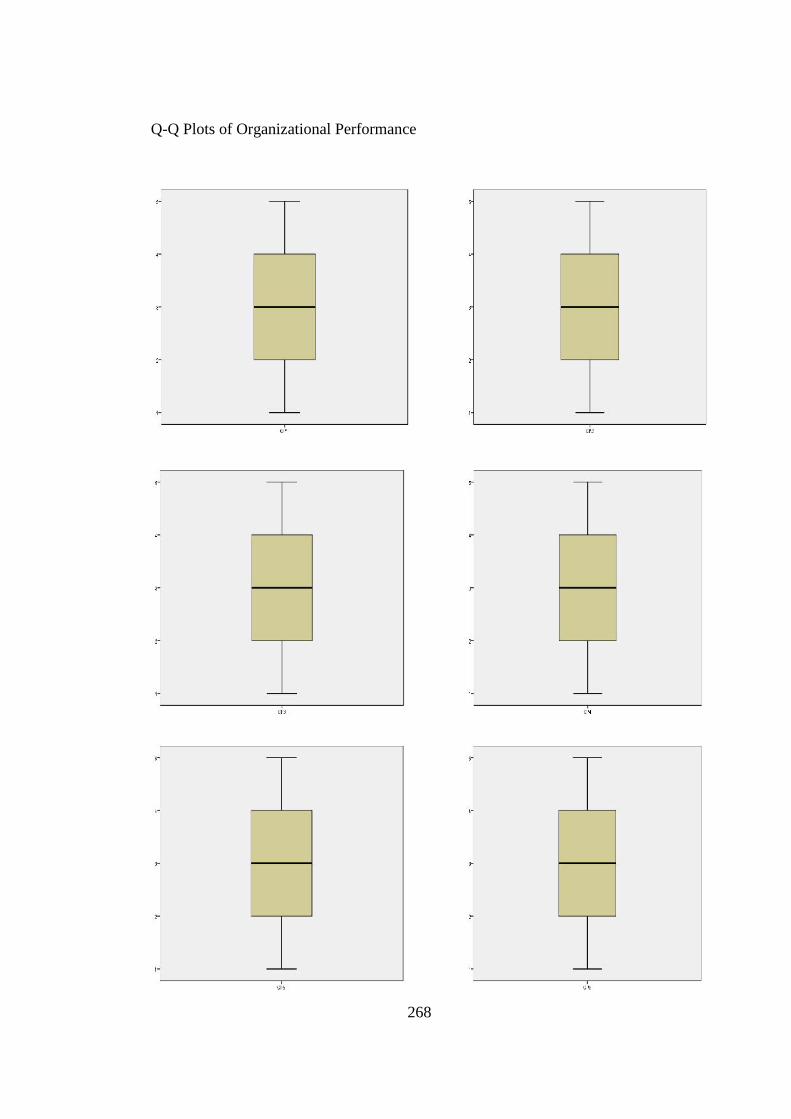
268
Q-Q Plots of Organizational Performance
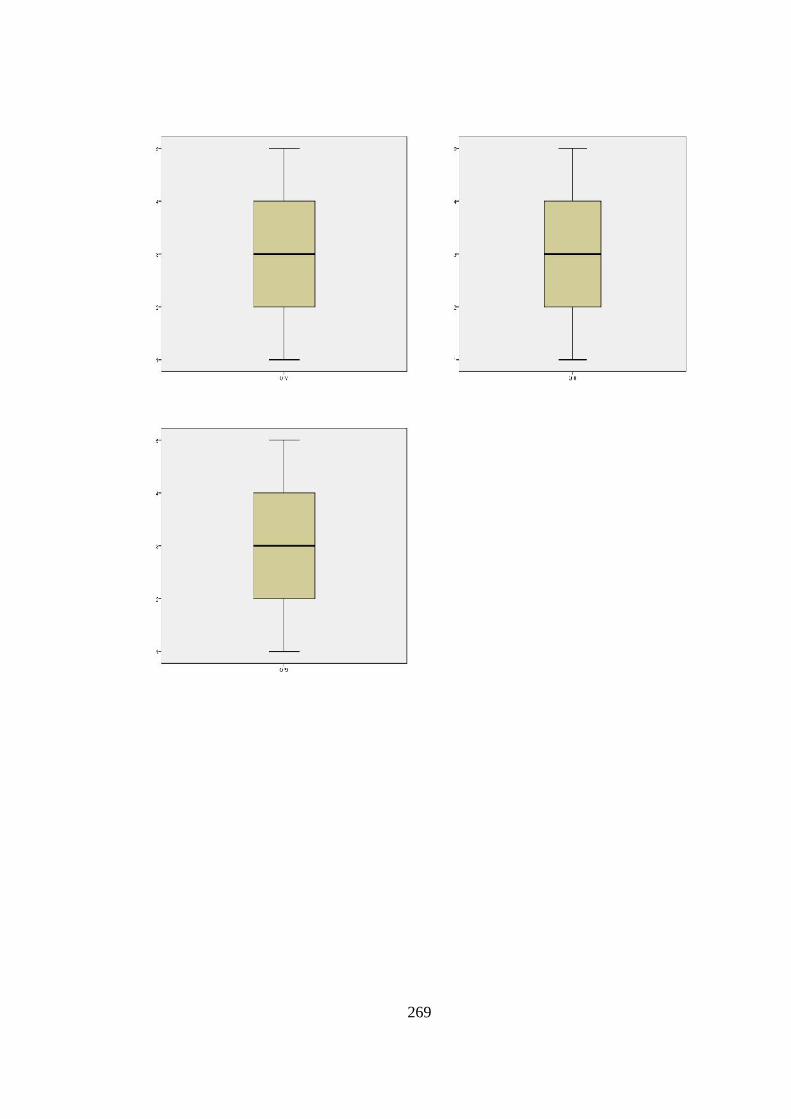
269

270
Appendix K
Measurement Model
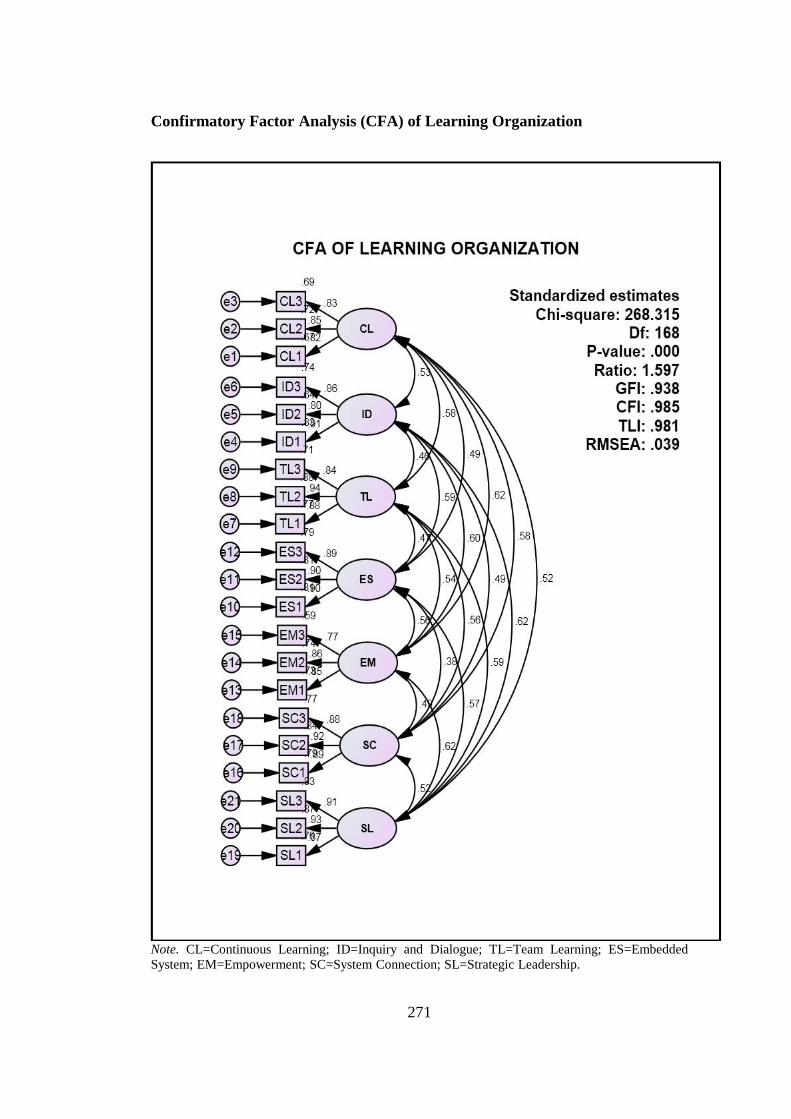
271
Confirmatory Factor Analysis (CFA) of Learning Organization
Note. CL=Continuous Learning; ID=Inquiry and Dialogue; TL=Team Learning; ES=EmbeddedSystem; EM=Empowerment; SC=System Connection; SL=Strategic Leadership.
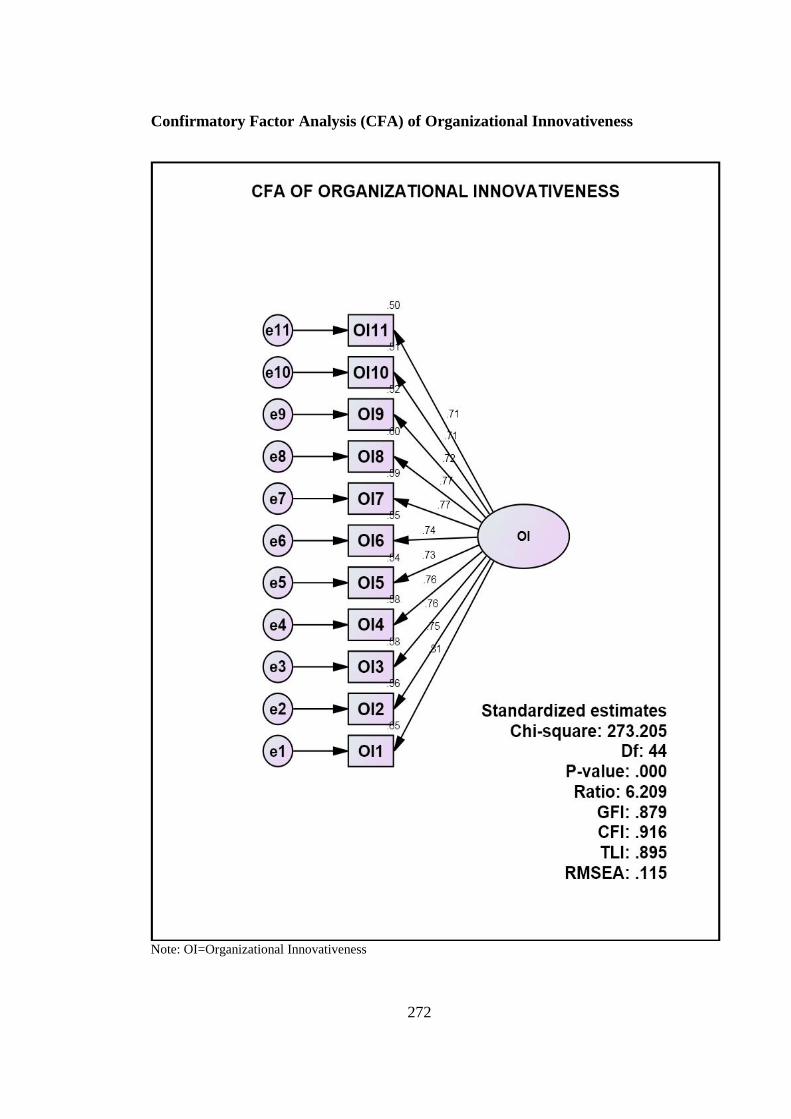
272
Confirmatory Factor Analysis (CFA) of Organizational Innovativeness
Note: OI=Organizational Innovativeness
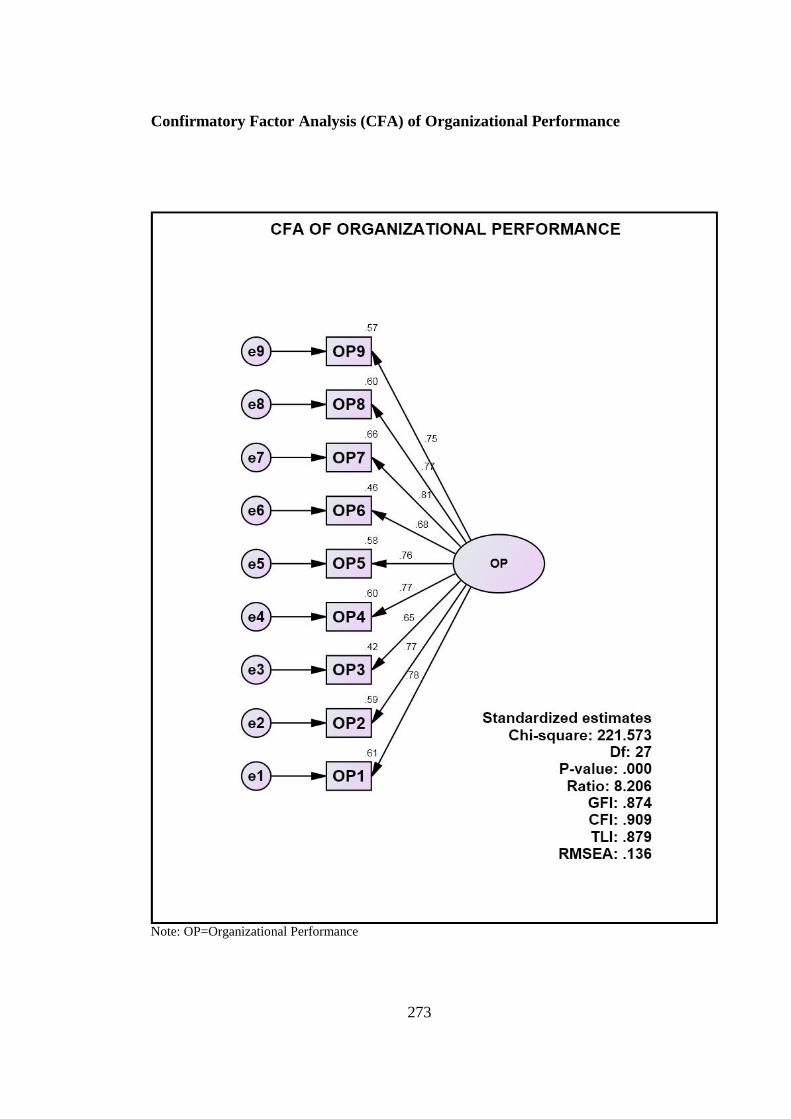
273
Confirmatory Factor Analysis (CFA) of Organizational Performance
Note: OP=Organizational Performance

274
Appendix L
Structural Model

275
Hypothesized Model
Note. CL=Continuous Learning; ID=Inquiry and Dialogue; TL=Team Learning; ES=EmbeddedSystem; EM=Empowerment; SC=System Connection; SL=Strategic Leadership; OI=OrganizationalInnovativeness; OP=Organizational Performance.
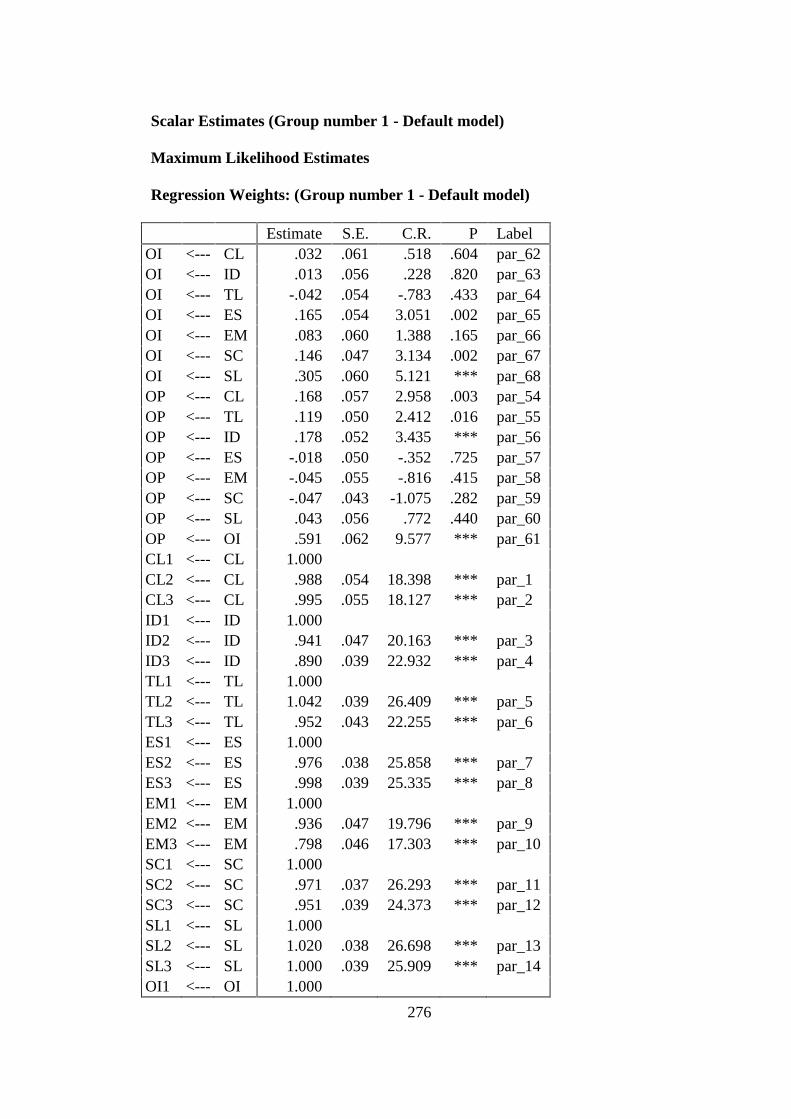
276
Scalar Estimates (Group number 1 - Default model)
Maximum Likelihood Estimates
Regression Weights: (Group number 1 - Default model)
Estimate S.E. C.R. P LabelOI <--- CL .032 .061 .518 .604 par_62OI <--- ID .013 .056 .228 .820 par_63OI <--- TL -.042 .054 -.783 .433 par_64OI <--- ES .165 .054 3.051 .002 par_65OI <--- EM .083 .060 1.388 .165 par_66OI <--- SC .146 .047 3.134 .002 par_67OI <--- SL .305 .060 5.121 *** par_68OP <--- CL .168 .057 2.958 .003 par_54OP <--- TL .119 .050 2.412 .016 par_55OP <--- ID .178 .052 3.435 *** par_56OP <--- ES -.018 .050 -.352 .725 par_57OP <--- EM -.045 .055 -.816 .415 par_58OP <--- SC -.047 .043 -1.075 .282 par_59OP <--- SL .043 .056 .772 .440 par_60OP <--- OI .591 .062 9.577 *** par_61CL1 <--- CL 1.000CL2 <--- CL .988 .054 18.398 *** par_1CL3 <--- CL .995 .055 18.127 *** par_2ID1 <--- ID 1.000ID2 <--- ID .941 .047 20.163 *** par_3ID3 <--- ID .890 .039 22.932 *** par_4TL1 <--- TL 1.000TL2 <--- TL 1.042 .039 26.409 *** par_5TL3 <--- TL .952 .043 22.255 *** par_6ES1 <--- ES 1.000ES2 <--- ES .976 .038 25.858 *** par_7ES3 <--- ES .998 .039 25.335 *** par_8EM1 <--- EM 1.000EM2 <--- EM .936 .047 19.796 *** par_9EM3 <--- EM .798 .046 17.303 *** par_10SC1 <--- SC 1.000SC2 <--- SC .971 .037 26.293 *** par_11SC3 <--- SC .951 .039 24.373 *** par_12SL1 <--- SL 1.000SL2 <--- SL 1.020 .038 26.698 *** par_13SL3 <--- SL 1.000 .039 25.909 *** par_14OI1 <--- OI 1.000
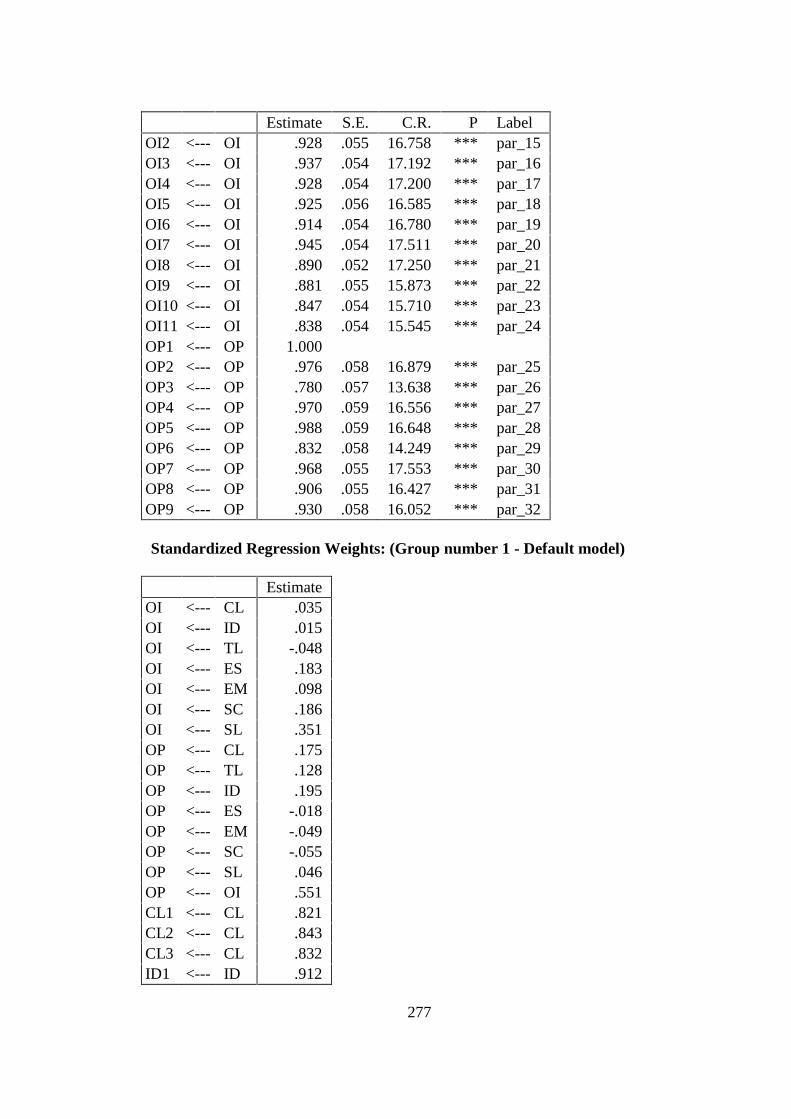
277
Estimate S.E. C.R. P LabelOI2 <--- OI .928 .055 16.758 *** par_15OI3 <--- OI .937 .054 17.192 *** par_16OI4 <--- OI .928 .054 17.200 *** par_17OI5 <--- OI .925 .056 16.585 *** par_18OI6 <--- OI .914 .054 16.780 *** par_19OI7 <--- OI .945 .054 17.511 *** par_20OI8 <--- OI .890 .052 17.250 *** par_21OI9 <--- OI .881 .055 15.873 *** par_22OI10 <--- OI .847 .054 15.710 *** par_23OI11 <--- OI .838 .054 15.545 *** par_24OP1 <--- OP 1.000OP2 <--- OP .976 .058 16.879 *** par_25OP3 <--- OP .780 .057 13.638 *** par_26OP4 <--- OP .970 .059 16.556 *** par_27OP5 <--- OP .988 .059 16.648 *** par_28OP6 <--- OP .832 .058 14.249 *** par_29OP7 <--- OP .968 .055 17.553 *** par_30OP8 <--- OP .906 .055 16.427 *** par_31OP9 <--- OP .930 .058 16.052 *** par_32
Standardized Regression Weights: (Group number 1 - Default model)
EstimateOI <--- CL .035OI <--- ID .015OI <--- TL -.048OI <--- ES .183OI <--- EM .098OI <--- SC .186OI <--- SL .351OP <--- CL .175OP <--- TL .128OP <--- ID .195OP <--- ES -.018OP <--- EM -.049OP <--- SC -.055OP <--- SL .046OP <--- OI .551CL1 <--- CL .821CL2 <--- CL .843CL3 <--- CL .832ID1 <--- ID .912

278
EstimateID2 <--- ID .797ID3 <--- ID .861TL1 <--- TL .877TL2 <--- TL .939TL3 <--- TL .844ES1 <--- ES .901ES2 <--- ES .896ES3 <--- ES .886EM1 <--- EM .852EM2 <--- EM .861EM3 <--- EM .773SC1 <--- SC .887SC2 <--- SC .918SC3 <--- SC .878SL1 <--- SL .873SL2 <--- SL .927SL3 <--- SL .912OI1 <--- OI .817OI2 <--- OI .746OI3 <--- OI .760OI4 <--- OI .761OI5 <--- OI .741OI6 <--- OI .747OI7 <--- OI .771OI8 <--- OI .762OI9 <--- OI .717OI10 <--- OI .711OI11 <--- OI .706OP1 <--- OP .789OP2 <--- OP .779OP3 <--- OP .655OP4 <--- OP .767OP5 <--- OP .770OP6 <--- OP .679OP7 <--- OP .802OP8 <--- OP .762OP9 <--- OP .748

279
Covariances: (Group number 1 - Default model)
Estimate S.E. C.R. P LabelCL <--> ID .688 .086 7.993 *** par_33CL <--> TL .743 .087 8.553 *** par_34CL <--> ES .601 .080 7.537 *** par_35CL <--> EM .817 .094 8.702 *** par_36CL <--> SC .820 .096 8.548 *** par_37CL <--> SL .668 .084 7.944 *** par_38ID <--> TL .612 .082 7.425 *** par_39ID <--> ES .769 .085 9.096 *** par_40ID <--> EM .830 .093 8.879 *** par_41ID <--> SC .722 .092 7.810 *** par_42ID <--> SL .831 .089 9.335 *** par_43TL <--> ES .597 .078 7.621 *** par_44TL <--> EM .733 .089 8.223 *** par_45TL <--> SC .808 .094 8.624 *** par_46TL <--> SL .770 .086 8.939 *** par_47ES <--> EM .738 .087 8.501 *** par_48ES <--> SC .534 .083 6.395 *** par_49ES <--> SL .725 .082 8.820 *** par_50EM <--> SC .733 .096 7.628 *** par_51EM <--> SL .840 .093 9.048 *** par_52SC <--> SL .760 .092 8.251 *** par_53
Correlations: (Group number 1 - Default model)
EstimateCL <--> ID .528CL <--> TL .583CL <--> ES .486CL <--> EM .620CL <--> SC .580CL <--> SL .523ID <--> TL .457ID <--> ES .592ID <--> EM .600ID <--> SC .486ID <--> SL .620TL <--> ES .470TL <--> EM .542TL <--> SC .557TL <--> SL .587ES <--> EM .562

280
EstimateES <--> SC .379ES <--> SL .570EM <--> SC .488EM <--> SL .619SC <--> SL .522
Variances: (Group number 1 - Default model)
Estimate S.E. C.R. P LabelCL 1.243 .131 9.463 *** par_69ID 1.368 .121 11.308 *** par_70TL 1.309 .122 10.765 *** par_71ES 1.232 .109 11.263 *** par_72EM 1.399 .140 10.015 *** par_73SC 1.611 .147 10.986 *** par_74SL 1.314 .122 10.762 *** par_75R01 .545 .059 9.291 *** par_76R02 .398 .049 8.185 *** par_77e1 .602 .060 10.113 *** par_78e2 .493 .053 9.355 *** par_79e3 .548 .056 9.765 *** par_80e4 .278 .040 7.007 *** par_81e5 .698 .061 11.531 *** par_82e6 .379 .039 9.700 *** par_83e7 .395 .039 10.070 *** par_84e8 .192 .032 6.096 *** par_85e9 .479 .043 11.212 *** par_86e10 .285 .032 8.902 *** par_87e11 .290 .031 9.223 *** par_88e12 .337 .035 9.723 *** par_89e13 .528 .058 9.090 *** par_90e14 .426 .049 8.703 *** par_91e15 .601 .053 11.333 *** par_92e16 .436 .045 9.693 *** par_93e17 .284 .036 7.853 *** par_94e18 .431 .043 10.098 *** par_95e19 .412 .038 10.961 *** par_96e20 .222 .028 8.040 *** par_97e21 .265 .029 9.119 *** par_98e22 .494 .041 12.201 *** par_99e23 .682 .053 12.871 *** par_100e24 .637 .050 12.771 *** par_101
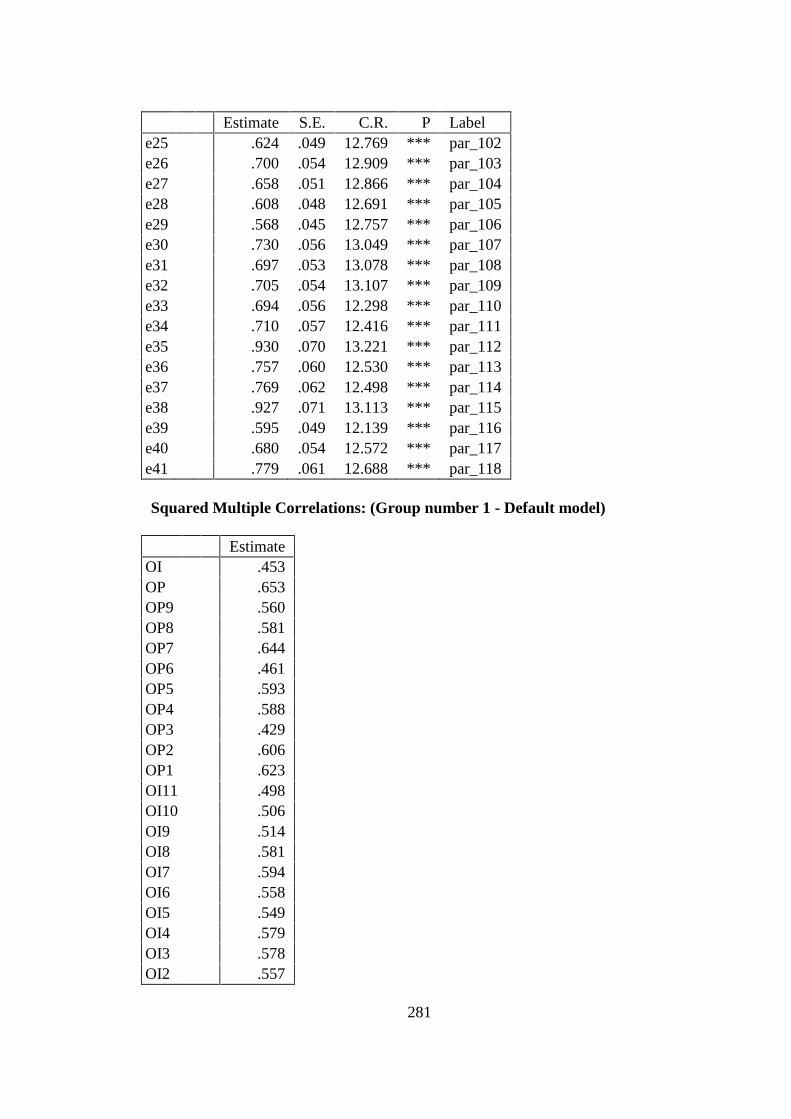
281
Estimate S.E. C.R. P Labele25 .624 .049 12.769 *** par_102e26 .700 .054 12.909 *** par_103e27 .658 .051 12.866 *** par_104e28 .608 .048 12.691 *** par_105e29 .568 .045 12.757 *** par_106e30 .730 .056 13.049 *** par_107e31 .697 .053 13.078 *** par_108e32 .705 .054 13.107 *** par_109e33 .694 .056 12.298 *** par_110e34 .710 .057 12.416 *** par_111e35 .930 .070 13.221 *** par_112e36 .757 .060 12.530 *** par_113e37 .769 .062 12.498 *** par_114e38 .927 .071 13.113 *** par_115e39 .595 .049 12.139 *** par_116e40 .680 .054 12.572 *** par_117e41 .779 .061 12.688 *** par_118
Squared Multiple Correlations: (Group number 1 - Default model)
EstimateOI .453OP .653OP9 .560OP8 .581OP7 .644OP6 .461OP5 .593OP4 .588OP3 .429OP2 .606OP1 .623OI11 .498OI10 .506OI9 .514OI8 .581OI7 .594OI6 .558OI5 .549OI4 .579OI3 .578OI2 .557
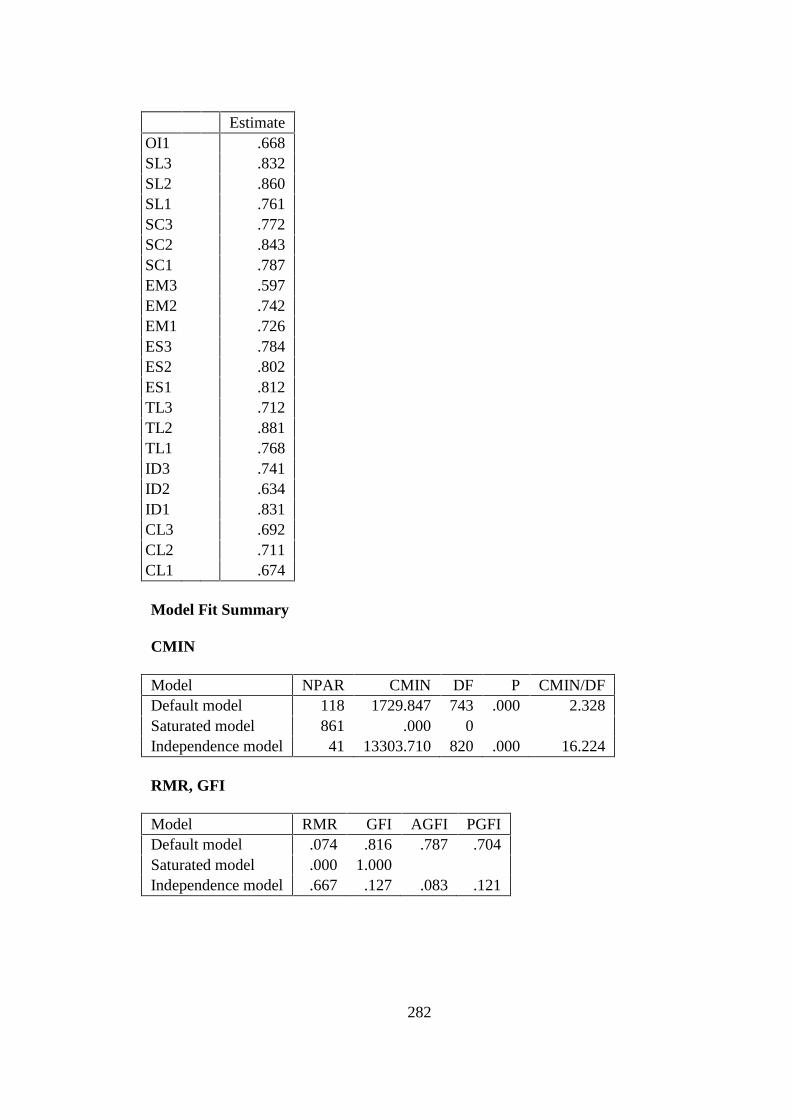
282
EstimateOI1 .668SL3 .832SL2 .860SL1 .761SC3 .772SC2 .843SC1 .787EM3 .597EM2 .742EM1 .726ES3 .784ES2 .802ES1 .812TL3 .712TL2 .881TL1 .768ID3 .741ID2 .634ID1 .831CL3 .692CL2 .711CL1 .674
Model Fit Summary
CMIN
Model NPAR CMIN DF P CMIN/DFDefault model 118 1729.847 743 .000 2.328Saturated model 861 .000 0Independence model 41 13303.710 820 .000 16.224
RMR, GFI
Model RMR GFI AGFI PGFIDefault model .074 .816 .787 .704Saturated model .000 1.000Independence model .667 .127 .083 .121
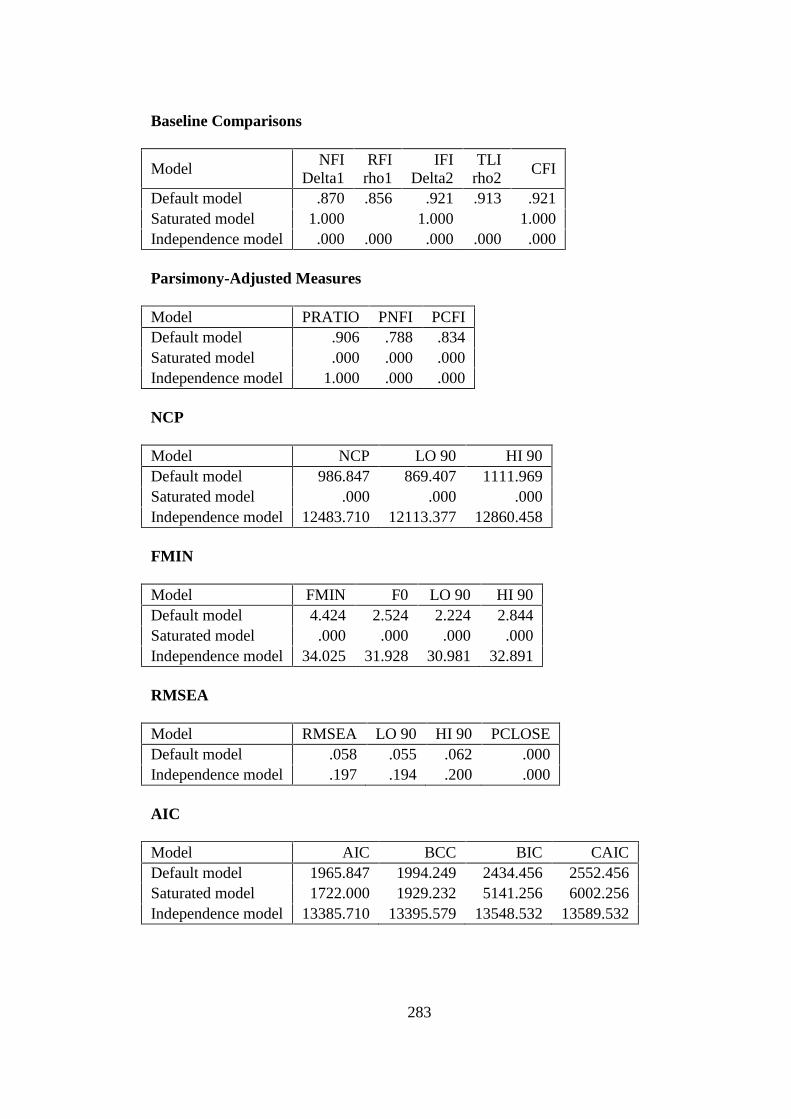
283
Baseline Comparisons
ModelNFI
Delta1RFI
rho1IFI
Delta2TLI
rho2CFI
Default model .870 .856 .921 .913 .921Saturated model 1.000 1.000 1.000Independence model .000 .000 .000 .000 .000
Parsimony-Adjusted Measures
Model PRATIO PNFI PCFIDefault model .906 .788 .834Saturated model .000 .000 .000Independence model 1.000 .000 .000
NCP
Model NCP LO 90 HI 90Default model 986.847 869.407 1111.969Saturated model .000 .000 .000Independence model 12483.710 12113.377 12860.458
FMIN
Model FMIN F0 LO 90 HI 90Default model 4.424 2.524 2.224 2.844Saturated model .000 .000 .000 .000Independence model 34.025 31.928 30.981 32.891
RMSEA
Model RMSEA LO 90 HI 90 PCLOSEDefault model .058 .055 .062 .000Independence model .197 .194 .200 .000
AIC
Model AIC BCC BIC CAICDefault model 1965.847 1994.249 2434.456 2552.456Saturated model 1722.000 1929.232 5141.256 6002.256Independence model 13385.710 13395.579 13548.532 13589.532
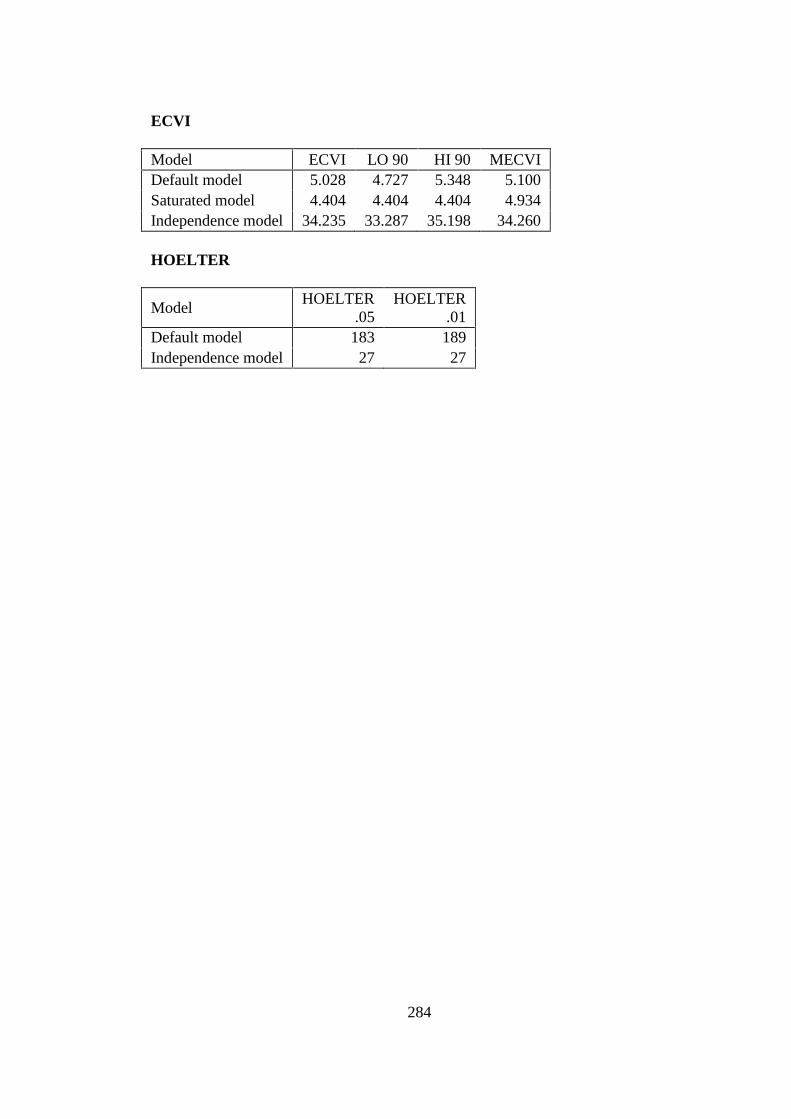
284
ECVI
Model ECVI LO 90 HI 90 MECVIDefault model 5.028 4.727 5.348 5.100Saturated model 4.404 4.404 4.404 4.934Independence model 34.235 33.287 35.198 34.260
HOELTER
ModelHOELTER
.05HOELTER
.01Default model 183 189Independence model 27 27

285
Modified Model
Note. CL=Continuous Learning; ID=Inquiry and Dialogue; TL=Team Learning; ES=EmbeddedSystem; EM=Empowerment; SC=System Connection; SL=Strategic Leadership; OI=OrganizationalInnovativeness; OP=Organizational Performance.
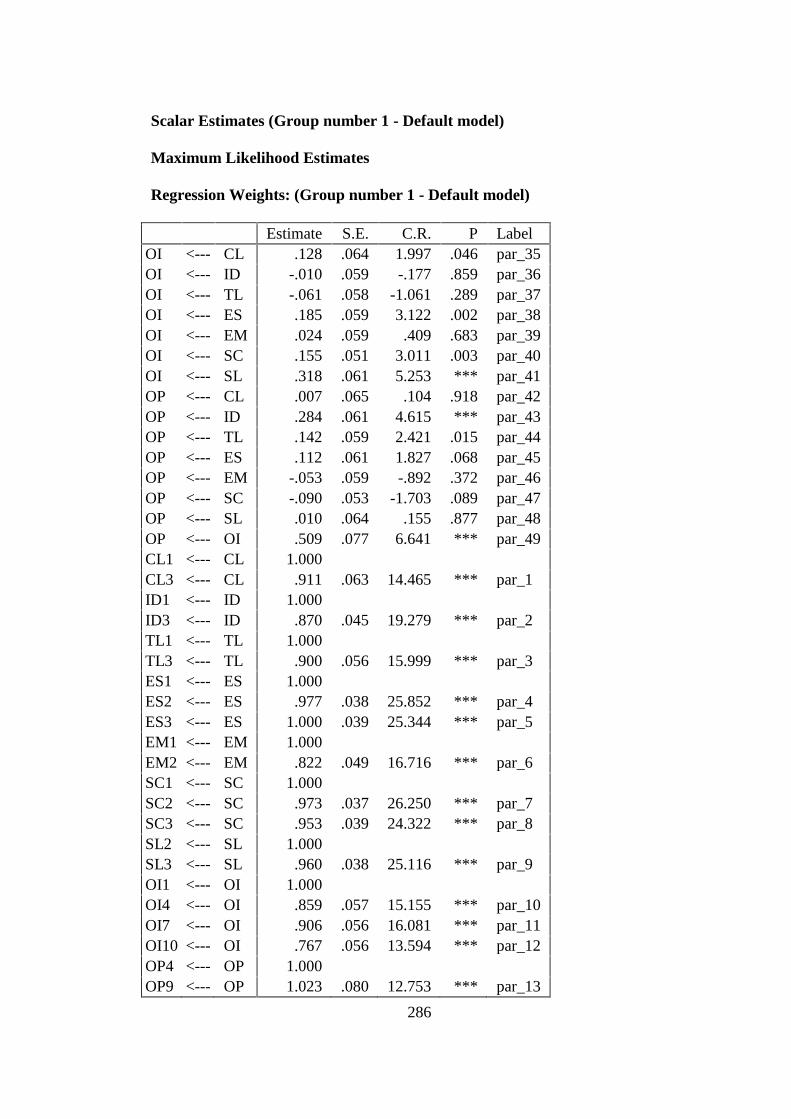
286
Scalar Estimates (Group number 1 - Default model)
Maximum Likelihood Estimates
Regression Weights: (Group number 1 - Default model)
Estimate S.E. C.R. P LabelOI <--- CL .128 .064 1.997 .046 par_35OI <--- ID -.010 .059 -.177 .859 par_36OI <--- TL -.061 .058 -1.061 .289 par_37OI <--- ES .185 .059 3.122 .002 par_38OI <--- EM .024 .059 .409 .683 par_39OI <--- SC .155 .051 3.011 .003 par_40OI <--- SL .318 .061 5.253 *** par_41OP <--- CL .007 .065 .104 .918 par_42OP <--- ID .284 .061 4.615 *** par_43OP <--- TL .142 .059 2.421 .015 par_44OP <--- ES .112 .061 1.827 .068 par_45OP <--- EM -.053 .059 -.892 .372 par_46OP <--- SC -.090 .053 -1.703 .089 par_47OP <--- SL .010 .064 .155 .877 par_48OP <--- OI .509 .077 6.641 *** par_49CL1 <--- CL 1.000CL3 <--- CL .911 .063 14.465 *** par_1ID1 <--- ID 1.000ID3 <--- ID .870 .045 19.279 *** par_2TL1 <--- TL 1.000TL3 <--- TL .900 .056 15.999 *** par_3ES1 <--- ES 1.000ES2 <--- ES .977 .038 25.852 *** par_4ES3 <--- ES 1.000 .039 25.344 *** par_5EM1 <--- EM 1.000EM2 <--- EM .822 .049 16.716 *** par_6SC1 <--- SC 1.000SC2 <--- SC .973 .037 26.250 *** par_7SC3 <--- SC .953 .039 24.322 *** par_8SL2 <--- SL 1.000SL3 <--- SL .960 .038 25.116 *** par_9OI1 <--- OI 1.000OI4 <--- OI .859 .057 15.155 *** par_10OI7 <--- OI .906 .056 16.081 *** par_11OI10 <--- OI .767 .056 13.594 *** par_12OP4 <--- OP 1.000OP9 <--- OP 1.023 .080 12.753 *** par_13

287
Standardized Regression Weights: (Group number 1 - Default model)
EstimateOI <--- CL .147OI <--- ID -.012OI <--- TL -.071OI <--- ES .200OI <--- EM .030OI <--- SC .192OI <--- SL .368OP <--- CL .008OP <--- ID .337OP <--- TL .169OP <--- ES .124OP <--- EM -.067OP <--- SC -.114OP <--- SL .012OP <--- OI .523CL1 <--- CL .862CL3 <--- CL .800ID1 <--- ID .925ID3 <--- ID .853TL1 <--- TL .907TL3 <--- TL .825ES1 <--- ES .900ES2 <--- ES .896ES3 <--- ES .886EM1 <--- EM .914EM2 <--- EM .812SC1 <--- SC .886SC2 <--- SC .919SC3 <--- SC .879SL2 <--- SL .942SL3 <--- SL .907OI1 <--- OI .840OI4 <--- OI .723OI7 <--- OI .759OI10 <--- OI .662OP4 <--- OP .737OP9 <--- OP .768
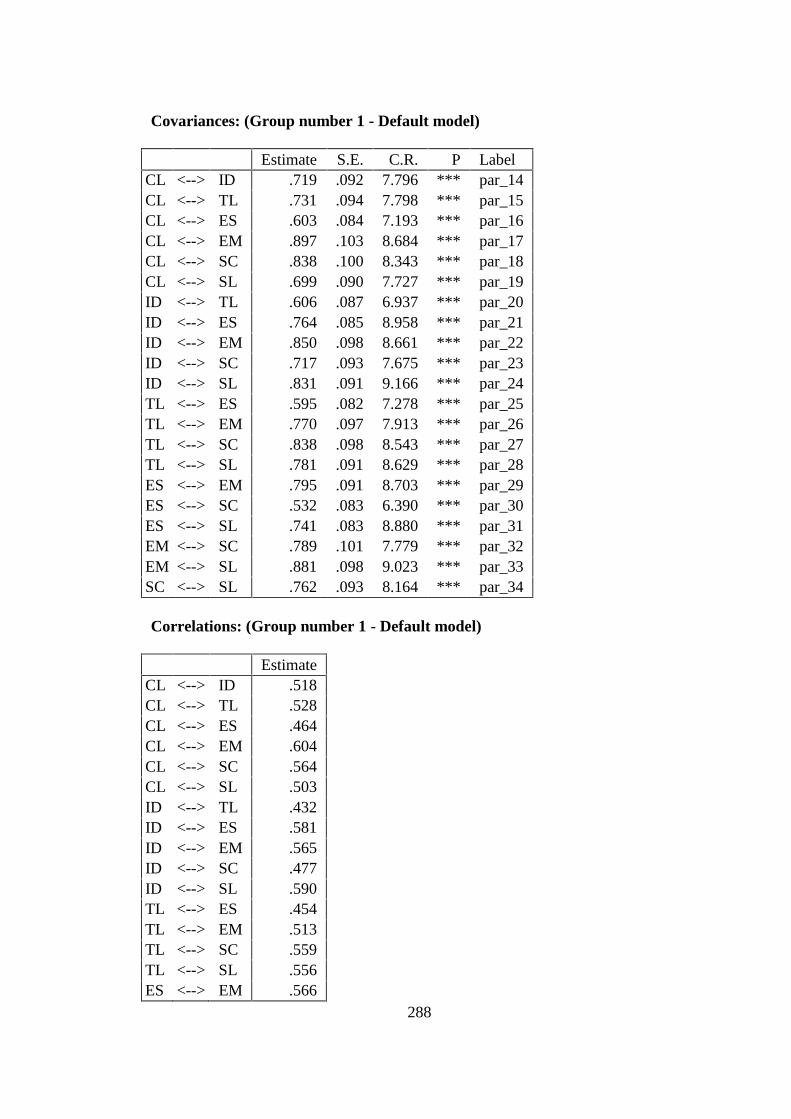
288
Covariances: (Group number 1 - Default model)
Estimate S.E. C.R. P LabelCL <--> ID .719 .092 7.796 *** par_14CL <--> TL .731 .094 7.798 *** par_15CL <--> ES .603 .084 7.193 *** par_16CL <--> EM .897 .103 8.684 *** par_17CL <--> SC .838 .100 8.343 *** par_18CL <--> SL .699 .090 7.727 *** par_19ID <--> TL .606 .087 6.937 *** par_20ID <--> ES .764 .085 8.958 *** par_21ID <--> EM .850 .098 8.661 *** par_22ID <--> SC .717 .093 7.675 *** par_23ID <--> SL .831 .091 9.166 *** par_24TL <--> ES .595 .082 7.278 *** par_25TL <--> EM .770 .097 7.913 *** par_26TL <--> SC .838 .098 8.543 *** par_27TL <--> SL .781 .091 8.629 *** par_28ES <--> EM .795 .091 8.703 *** par_29ES <--> SC .532 .083 6.390 *** par_30ES <--> SL .741 .083 8.880 *** par_31EM <--> SC .789 .101 7.779 *** par_32EM <--> SL .881 .098 9.023 *** par_33SC <--> SL .762 .093 8.164 *** par_34
Correlations: (Group number 1 - Default model)
EstimateCL <--> ID .518CL <--> TL .528CL <--> ES .464CL <--> EM .604CL <--> SC .564CL <--> SL .503ID <--> TL .432ID <--> ES .581ID <--> EM .565ID <--> SC .477ID <--> SL .590TL <--> ES .454TL <--> EM .513TL <--> SC .559TL <--> SL .556ES <--> EM .566

289
EstimateES <--> SC .379ES <--> SL .563EM <--> SC .491EM <--> SL .585SC <--> SL .507
Variances: (Group number 1 - Default model)
Estimate S.E. C.R. P LabelCL 1.372 .148 9.285 *** par_50ID 1.407 .128 10.967 *** par_51TL 1.400 .138 10.130 *** par_52ES 1.229 .109 11.247 *** par_53EM 1.608 .154 10.452 *** par_54SC 1.606 .147 10.958 *** par_55SL 1.409 .120 11.783 *** par_56R01 .540 .064 8.474 *** par_57R02 .307 .065 4.706 *** par_58e1 .473 .082 5.775 *** par_59e3 .639 .077 8.301 *** par_60e4 .239 .056 4.235 *** par_61e6 .398 .050 8.021 *** par_62e7 .304 .072 4.212 *** par_63e9 .532 .067 7.895 *** par_64e10 .287 .032 8.973 *** par_65e11 .289 .031 9.221 *** par_66e12 .335 .035 9.708 *** par_67e13 .319 .076 4.214 *** par_68e14 .563 .063 8.903 *** par_69e16 .441 .045 9.755 *** par_70e17 .280 .036 7.779 *** par_71e18 .430 .043 10.082 *** par_72e20 .180 .041 4.356 *** par_73e21 .279 .041 6.745 *** par_74e22 .440 .049 8.940 *** par_75e25 .707 .061 11.684 *** par_76e28 .634 .057 11.108 *** par_77e31 .793 .064 12.364 *** par_78e36 .839 .085 9.818 *** par_79e41 .727 .082 8.847 *** par_80
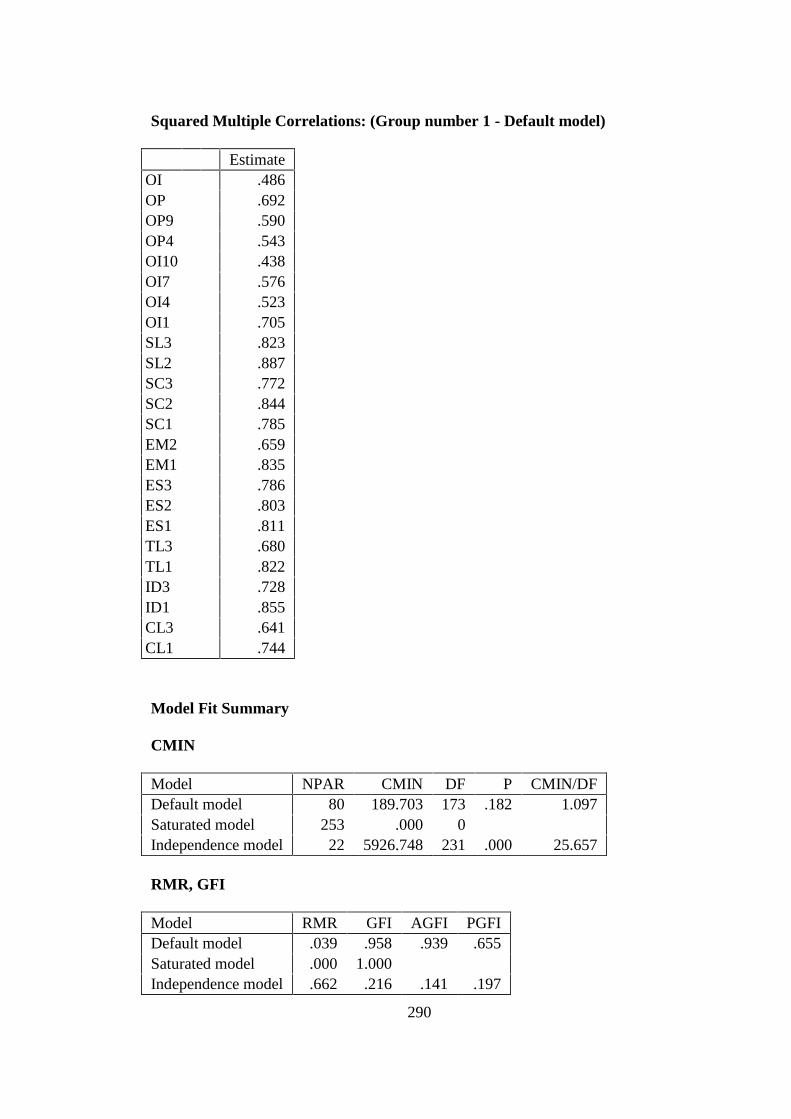
290
Squared Multiple Correlations: (Group number 1 - Default model)
EstimateOI .486OP .692OP9 .590OP4 .543OI10 .438OI7 .576OI4 .523OI1 .705SL3 .823SL2 .887SC3 .772SC2 .844SC1 .785EM2 .659EM1 .835ES3 .786ES2 .803ES1 .811TL3 .680TL1 .822ID3 .728ID1 .855CL3 .641CL1 .744
Model Fit Summary
CMIN
Model NPAR CMIN DF P CMIN/DFDefault model 80 189.703 173 .182 1.097Saturated model 253 .000 0Independence model 22 5926.748 231 .000 25.657
RMR, GFI
Model RMR GFI AGFI PGFIDefault model .039 .958 .939 .655Saturated model .000 1.000Independence model .662 .216 .141 .197
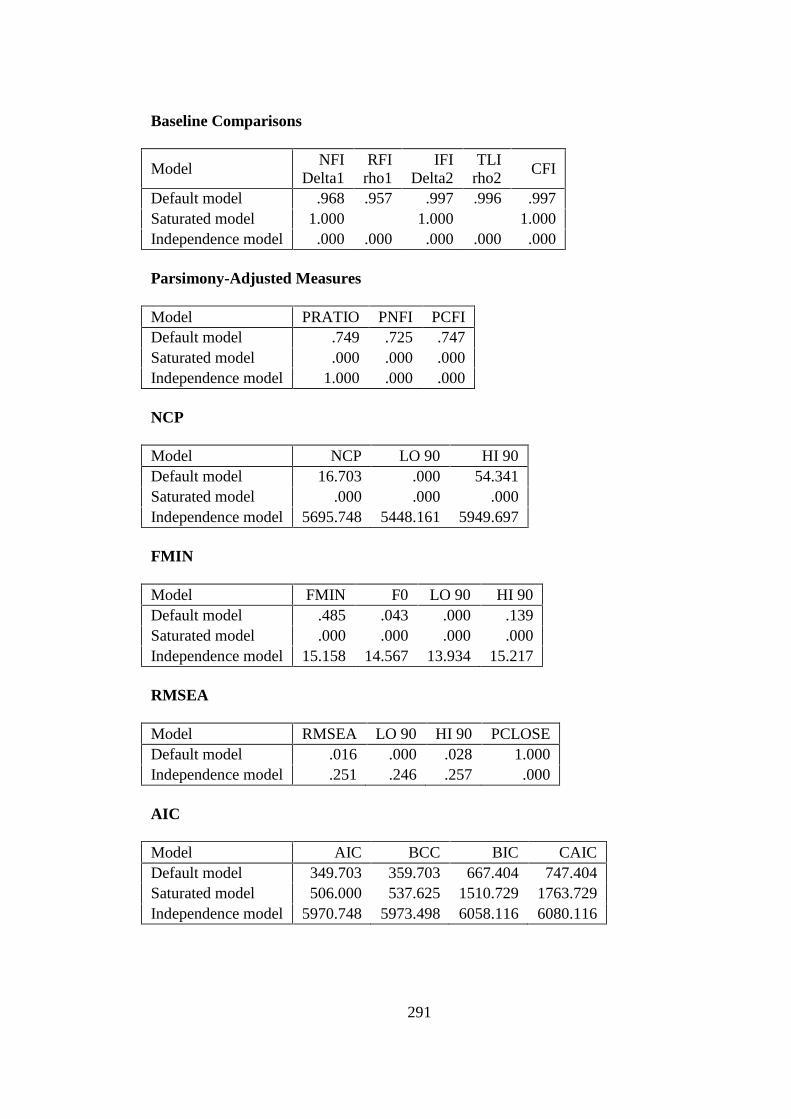
291
Baseline Comparisons
ModelNFI
Delta1RFI
rho1IFI
Delta2TLI
rho2CFI
Default model .968 .957 .997 .996 .997Saturated model 1.000 1.000 1.000Independence model .000 .000 .000 .000 .000
Parsimony-Adjusted Measures
Model PRATIO PNFI PCFIDefault model .749 .725 .747Saturated model .000 .000 .000Independence model 1.000 .000 .000
NCP
Model NCP LO 90 HI 90Default model 16.703 .000 54.341Saturated model .000 .000 .000Independence model 5695.748 5448.161 5949.697
FMIN
Model FMIN F0 LO 90 HI 90Default model .485 .043 .000 .139Saturated model .000 .000 .000 .000Independence model 15.158 14.567 13.934 15.217
RMSEA
Model RMSEA LO 90 HI 90 PCLOSEDefault model .016 .000 .028 1.000Independence model .251 .246 .257 .000
AIC
Model AIC BCC BIC CAICDefault model 349.703 359.703 667.404 747.404Saturated model 506.000 537.625 1510.729 1763.729Independence model 5970.748 5973.498 6058.116 6080.116

292
ECVI
Model ECVI LO 90 HI 90 MECVIDefault model .894 .852 .991 .920Saturated model 1.294 1.294 1.294 1.375Independence model 15.270 14.637 15.920 15.277
HOELTER
ModelHOELTER
.05HOELTER
.01Default model 422 452Independence model 18 19