learning agenda emotions & sales article sutton & rafaeli understanding the phenomenon...
TRANSCRIPT
Learning Agenda Emotions & Sales Article
Sutton & Rafaeli
• Understanding the phenomenon
• Conducting an observational study– qualitative & quantitative info
• Regression Analyses
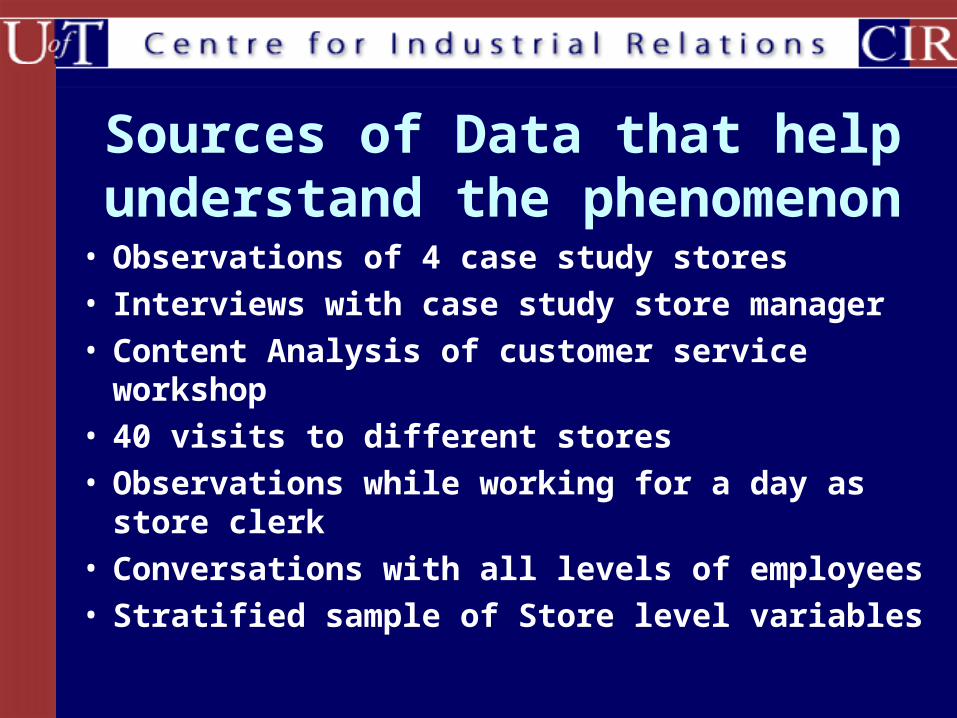
Sources of Data that help understand the phenomenon
• Observations of 4 case study stores • Interviews with case study store manager• Content Analysis of customer service
workshop• 40 visits to different stores• Observations while working for a day as store
clerk• Conversations with all levels of employees• Stratified sample of Store level variables
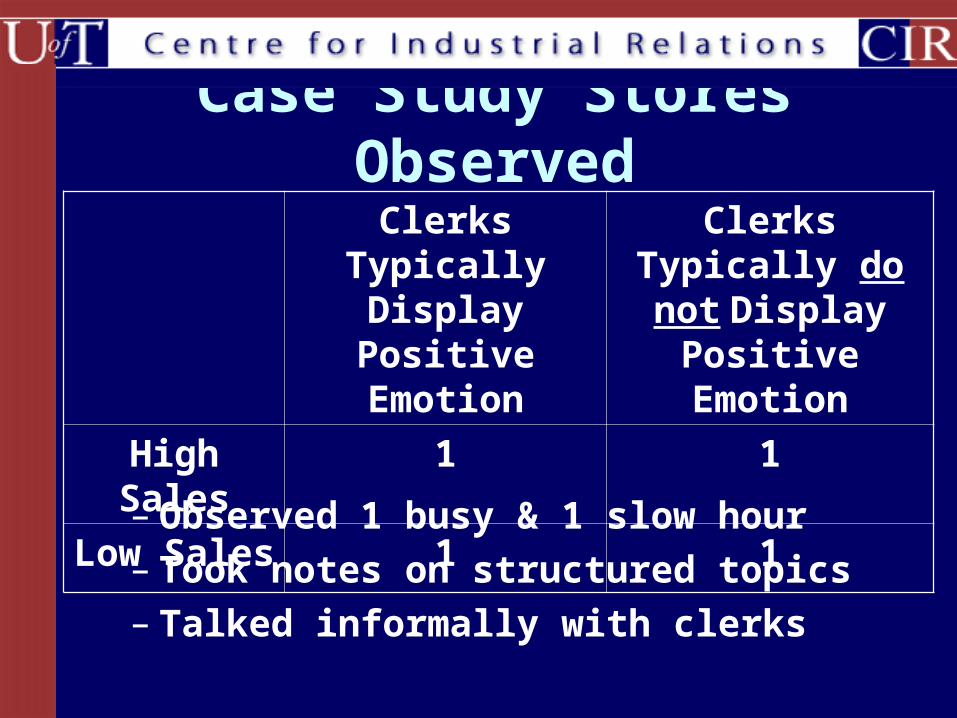
Case Study Stores Observed
Clerks Typically Display Positive
Emotion
Clerks Typically do not Display
Positive Emotion
High Sales 1 1
Low Sales 1 1
– Observed 1 busy & 1 slow hour – Took notes on structured topics– Talked informally with clerks
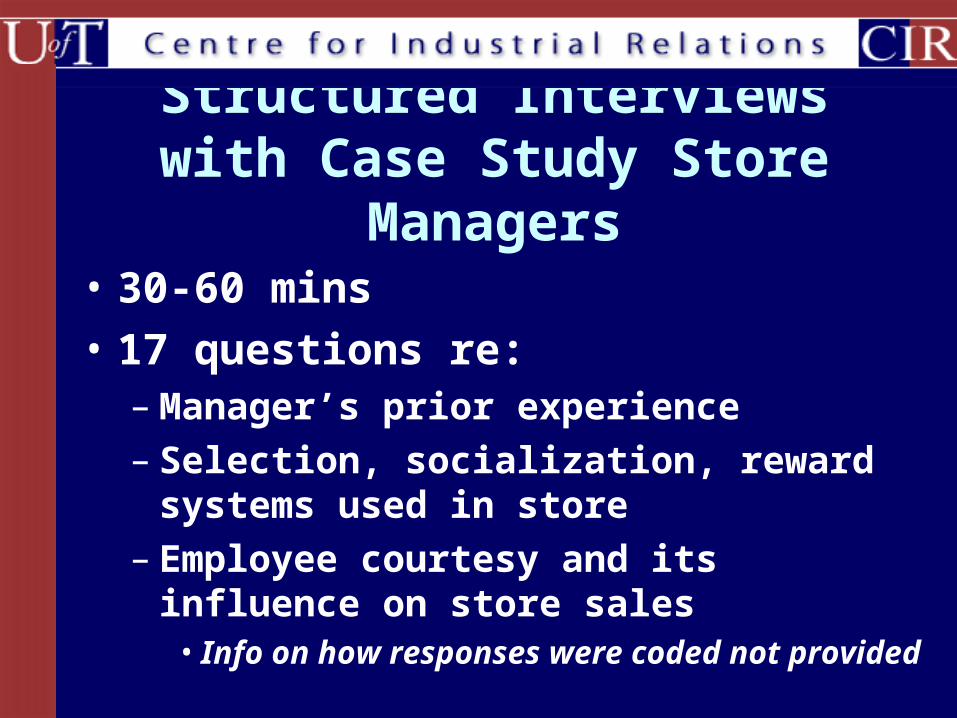
Structured Interviews with Case Study Store Managers
• 30-60 mins
• 17 questions re:– Manager’s prior experience– Selection, socialization, reward systems
used in store– Employee courtesy and its influence on
store sales• Info on how responses were coded not
provided
Content of Customer Service workshop Attended
• 2 hour prg. focusing on methods for coaching and rewarding clerks for courteous behavior
• Discussed role of expressed emotions in the store
Visits to stores• Visited 40 Stores
• Collected qualitative measures of store pace
• Not much detail provided
Working in store for a day
• Viewed 30 min training video on employee courtesy before working
• Store with low sales but frequent display of positive emotions
Conversations with employees at all levels of the organization
• 150 hours of informal conversations with corporate executives, customer service representatives, field supervisors, store managers re: negative relationship b/w positive emotions & sales
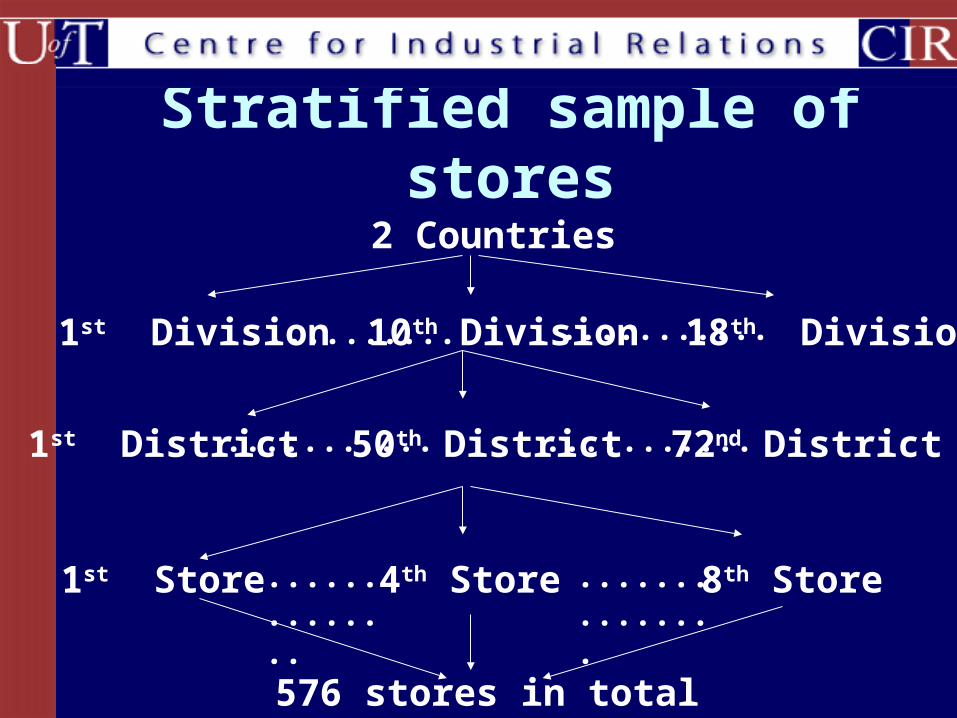
Stratified sample of stores
2 Countries
1st Division
576 stores in total
18th Division10th Division........... ...........
1st District 72nd District50th District........... ...........
1st Store 8th Store4th Store .............. ...............
Who was observed in each store
• 1319 clerks– Mostly urban stores– 44% male clerks
What was observed in each store
• 11805 transactions
• 3 month observation period
• For each of the 576 stores – 1 day + 1 swing shift
• 25% of stores observed during night shift
– 1-20 transactions/visit • Up to 60 transactions/store
• 75% male customers
Who were the observers for each store
• Corporate HR staff volunteers dressed according to the profile of a typical customer– May not be adequately matched for SES of
customers who were working class male customers b/w 18-34 yrs
• Visited store in pairs
Training of store observers• “Mystery shoppers” observed clerks at
pre-test stores w/research director before actual data collection period
• Compared & clarified coding differences in behavior with the director
How transactions were observed• Only observed behavior of clerk at
primary cash register from magazine rack/coffee pots
• Selected small item, stood in line, paid for item
• Spent 4-12 min per store depending on number of customers in store– 3% of observations excluded due to clerks’
suspicions
Reliability of mystery shoppers’ coding
• Compared to firms’ director of field research coding of– 274 stores– Observed with second original observer
• Mean correlation was .82
Measurement of Positive Emotions
• Each transaction rated on 4 features– Greeting, thanking, smiling, eye-contact– Coded as 1 or 0 depending on display
• Transactions aggregated at store level– Score for each of 4 features calculated as
proportion of transactions in which behavior was displayed over total number of transactions
• Store index of emotion was mean of 4 aspects (reliability=.76)
Measurement of Sales
• Total store sales during the year of the observation
• Obtained from company records
• Standardized across stores included in sample to preserve confidentiality
Measurement of Line Length
• Largest number of customers in line at primary cash register during each visit
Measurement of Clerk gender & Customer Gender
• Clerk gender – Proportion of women clerks observed over
total number of store clerks observed at each store
• Customer gender composition– Proportion of female customers over all
customers present during all observations in that store
Measurement of Clerk Image
• 3 items rated by observers on a yes/no scale– Was clerk wearing a smock?– Was smock clean?– Was clerk wearing name tag?
Measurement of Store Stock Level
• Rated on 5-point Likert scales
• Extent to which shelves, snack stands & refrigerators were fully stocked
Measurement of ownership, supervision & region
• Store ownership– Franchise vs. corporation owned
• Store supervision costs– Amount (in dollars) spent on each store
• Region– Location of store in one of four
geographical region
Research Questions
• How are store sales, positive emotions and line length related?
• What predicts store sales?
• What predicts positive emotions– at store level– at clerk level– for clerks at different types of stores
How are store sales, positive emotions and line length
related?
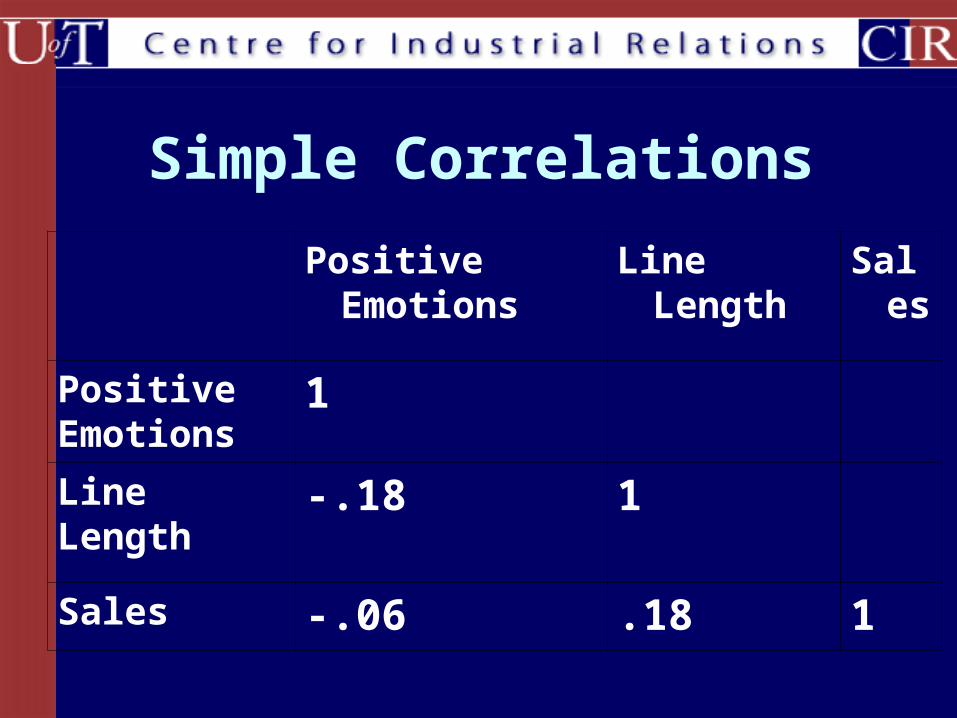
Simple Correlations
Positive Emotions Line Length Sales
Positive Emotions
1
Line Length
-.18 1
Sales -.06 .18 1
What variables predict sales of a store
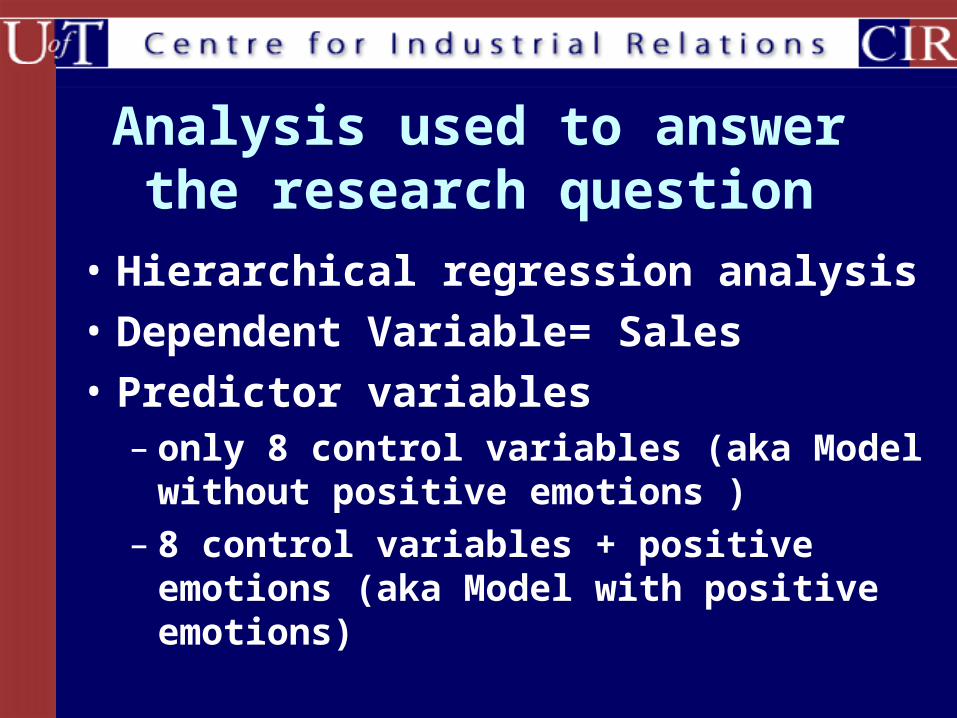
• Hierarchical regression analysis
• Dependent Variable= Sales
• Predictor variables– only 8 control variables (aka Model without
positive emotions )– 8 control variables + positive emotions
(aka Model with positive emotions)
Analysis used to answer the research question
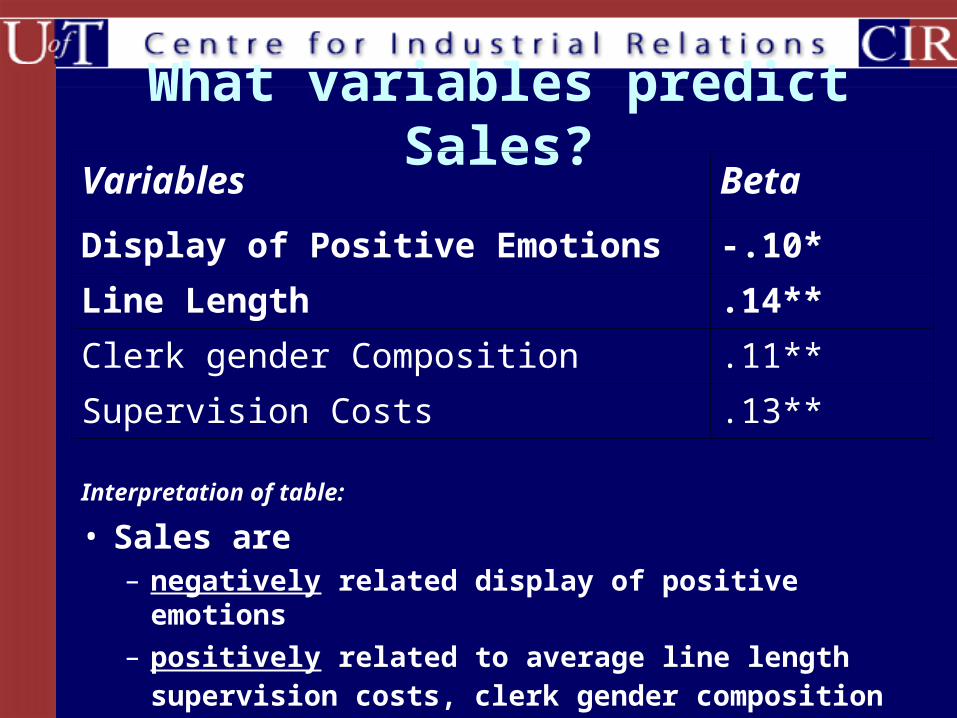
What variables predict Sales?Variables Beta
Display of Positive Emotions -.10*
Line Length .14**
Clerk gender Composition .11**
Supervision Costs .13**
Interpretation of table: • Sales are
– negatively related display of positive emotions
– positively related to average line length supervision costs, clerk gender composition
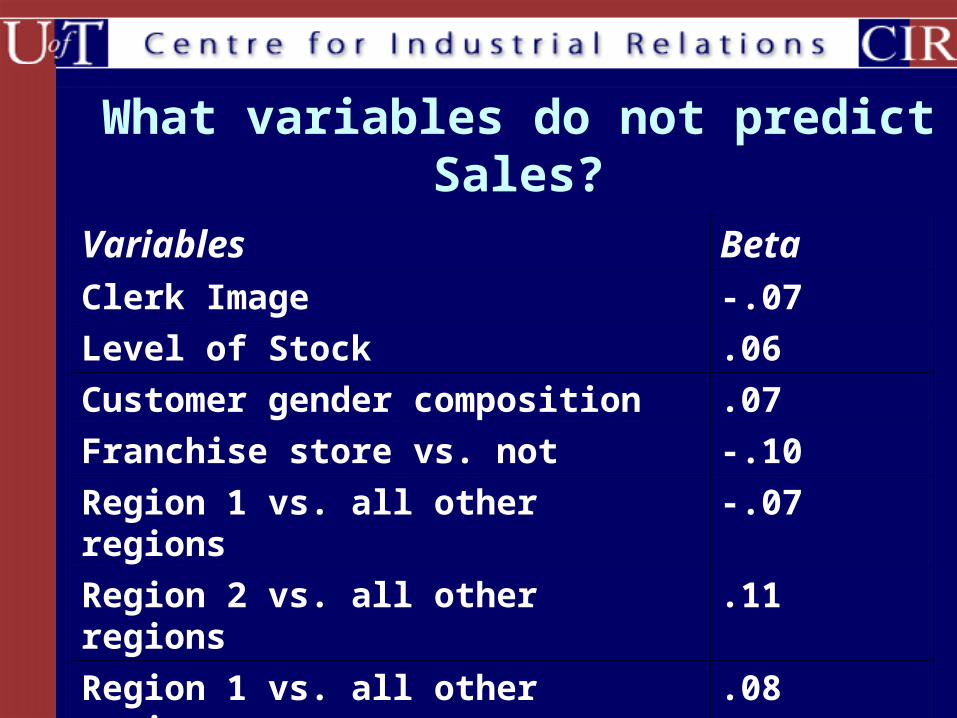
What variables do not predict Sales?
Variables Beta
Clerk Image -.07
Level of Stock .06
Customer gender composition .07
Franchise store vs. not -.10
Region 1 vs. all other regions -.07
Region 2 vs. all other regions .11
Region 1 vs. all other regions .08
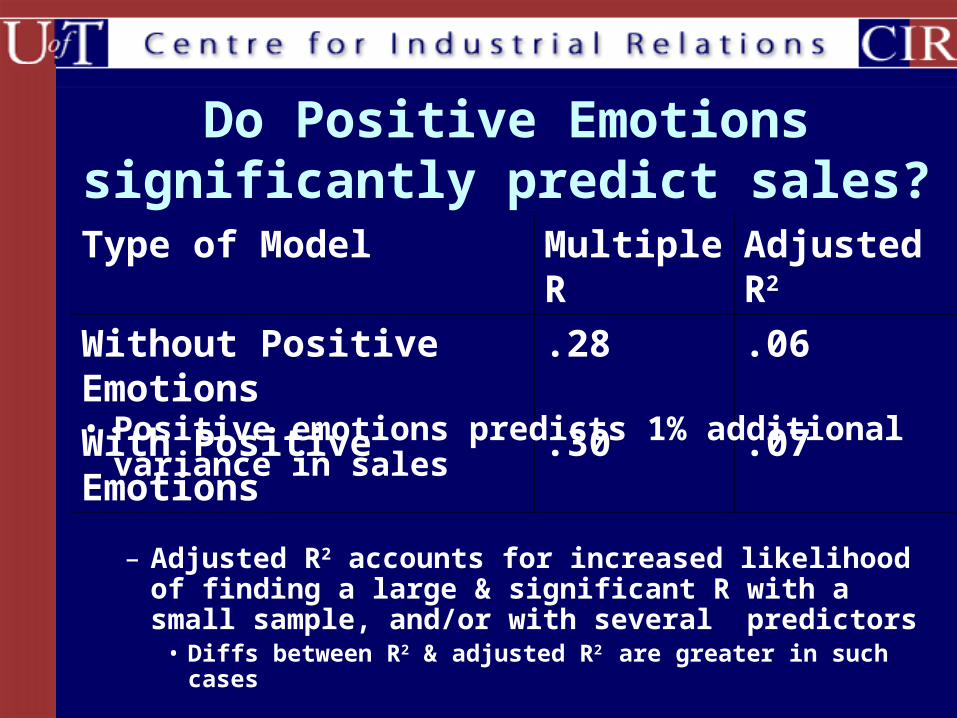
Do Positive Emotions significantly predict sales?
Type of Model Multiple R Adjusted R2
Without Positive Emotions .28 .06
With Positive Emotions .30 .07
• Positive emotions predicts 1% additional variance in sales
– Adjusted R2 accounts for increased likelihood of finding a large & significant R with a small sample, and/or with several predictors
• Diffs between R2 & adjusted R2 are greater in such cases
What variables predict positive emotions within a store
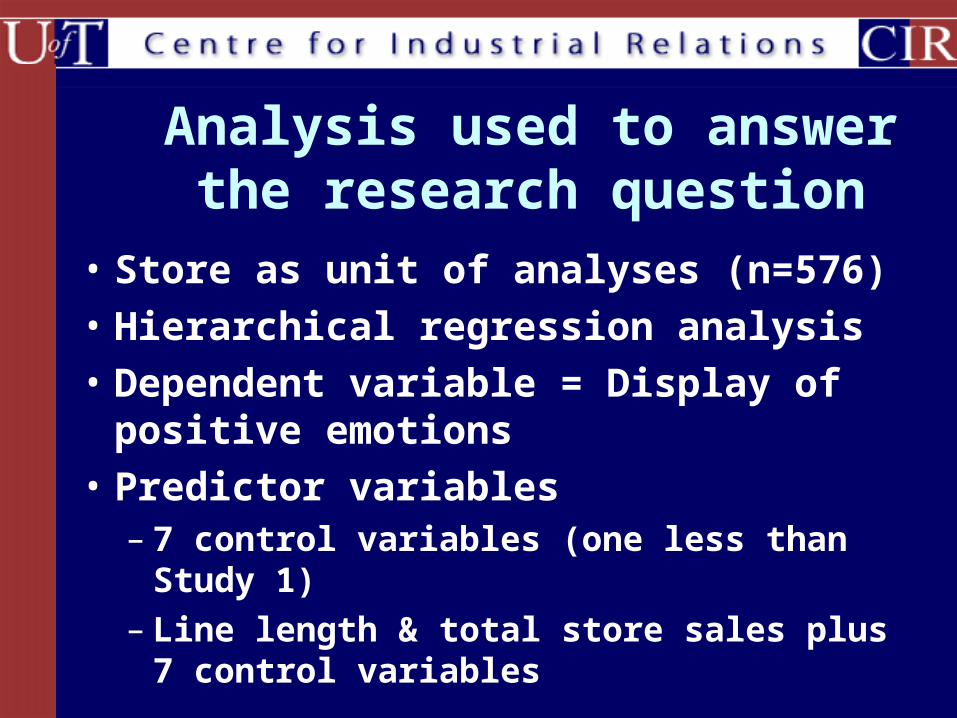
• Store as unit of analyses (n=576)
• Hierarchical regression analysis
• Dependent variable = Display of positive emotions
• Predictor variables– 7 control variables (one less than Study 1)– Line length & total store sales plus 7
control variables
Analysis used to answer the research question
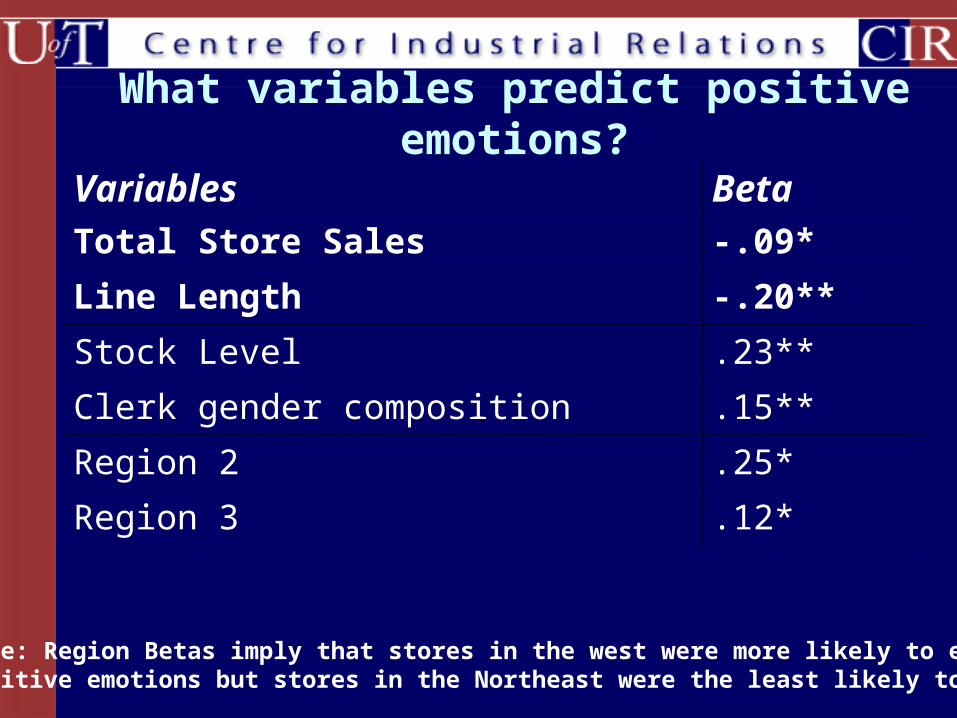
What variables predict positive emotions?
Variables Beta
Total Store Sales -.09*
Line Length -.20**
Stock Level .23**
Clerk gender composition .15**
Region 2 .25*
Region 3 .12*
Note: Region Betas imply that stores in the west were more likely to express positive emotions but stores in the Northeast were the least likely to do so
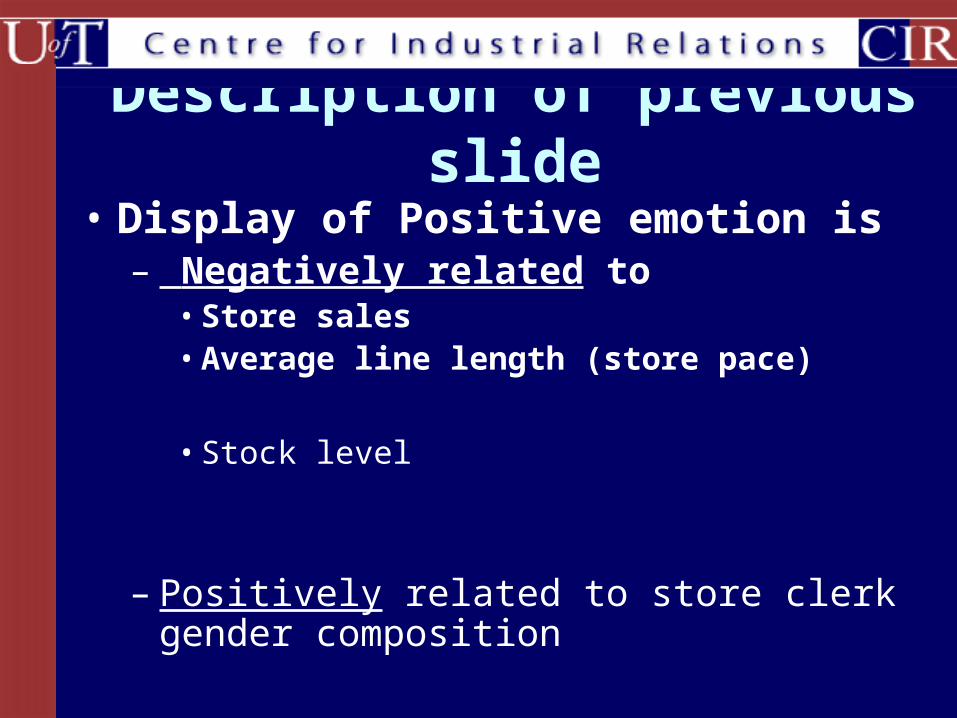
Description of previous slide
• Display of Positive emotion is– Negatively related to
• Store sales • Average line length (store pace)
• Stock level
– Positively related to store clerk gender composition
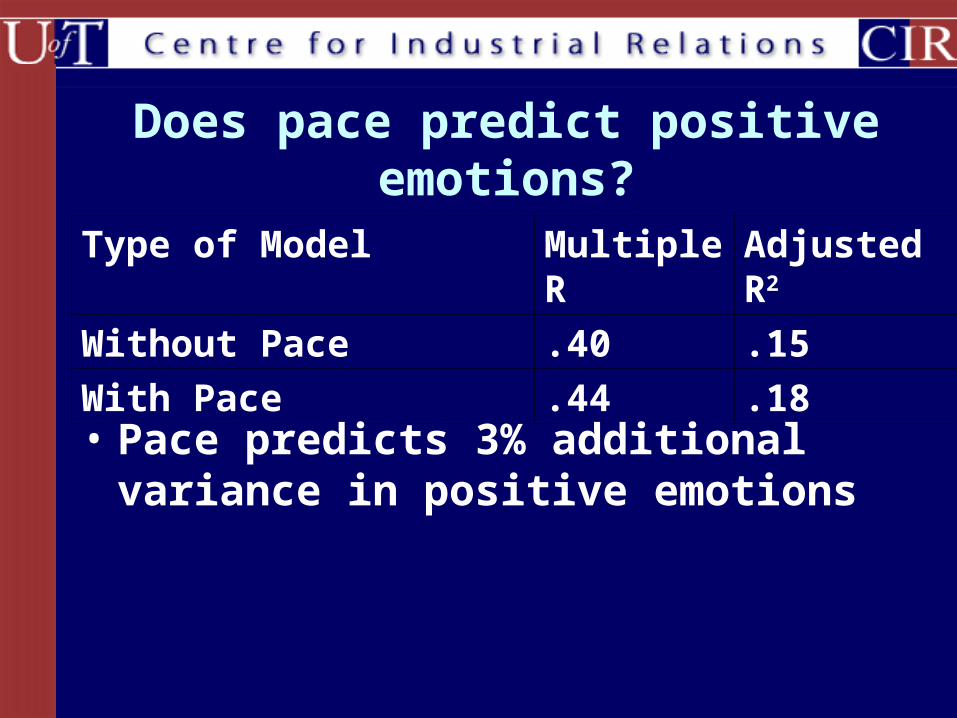
Does pace predict positive emotions?
Type of Model Multiple R Adjusted R2
Without Pace .40 .15
With Pace .44 .18
• Pace predicts 3% additional variance in positive emotions
Does line length predict the positive emotions of a clerk?
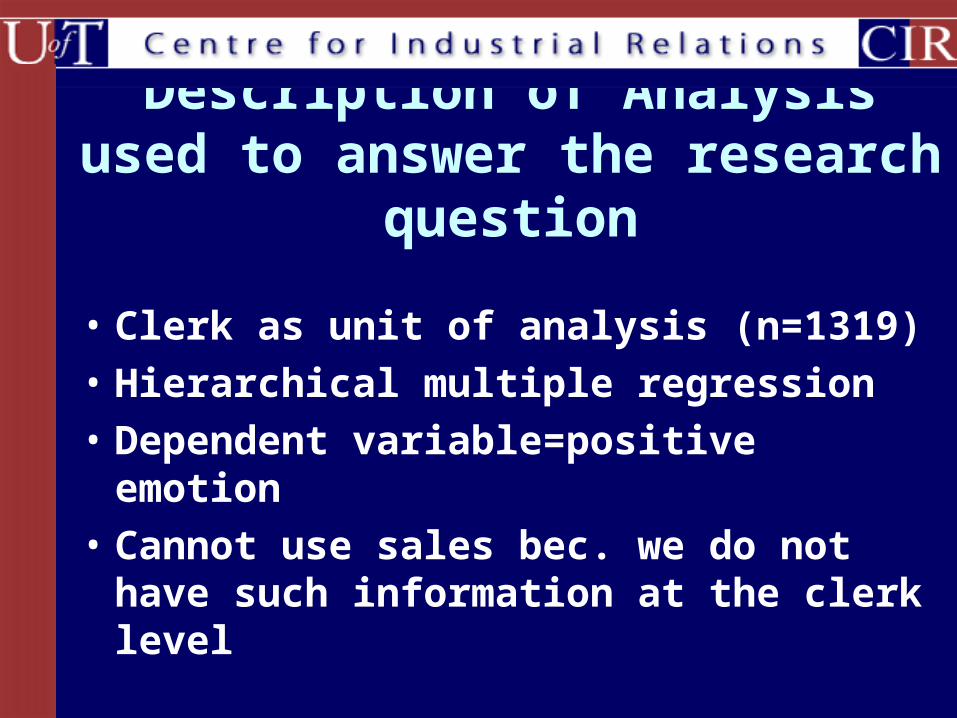
Description of Analysis used to answer the research question
• Clerk as unit of analysis (n=1319)
• Hierarchical multiple regression
• Dependent variable=positive emotion
• Cannot use sales bec. we do not have such information at the clerk level
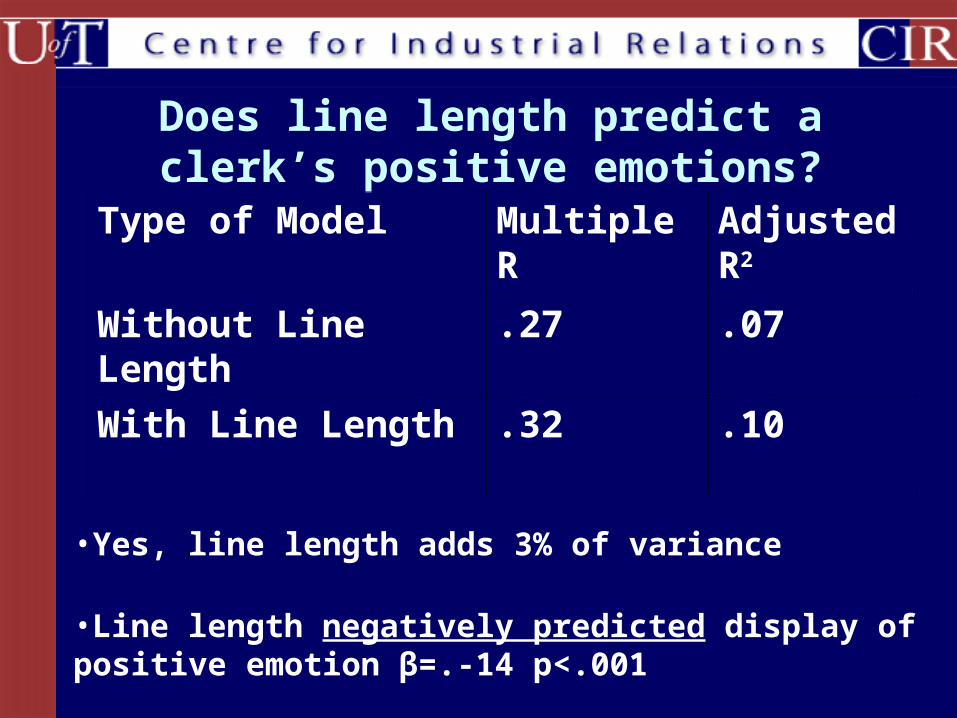
Does line length predict a clerk’s positive emotions?
•Yes, line length adds 3% of variance
•Line length negatively predicted display of positive emotion β=.-14 p<.001
Type of Model Multiple R Adjusted R2
Without Line Length .27 .07
With Line Length .32 .10
Does line length predict the positive emotions of a clerk
in a busy vs. slow store?
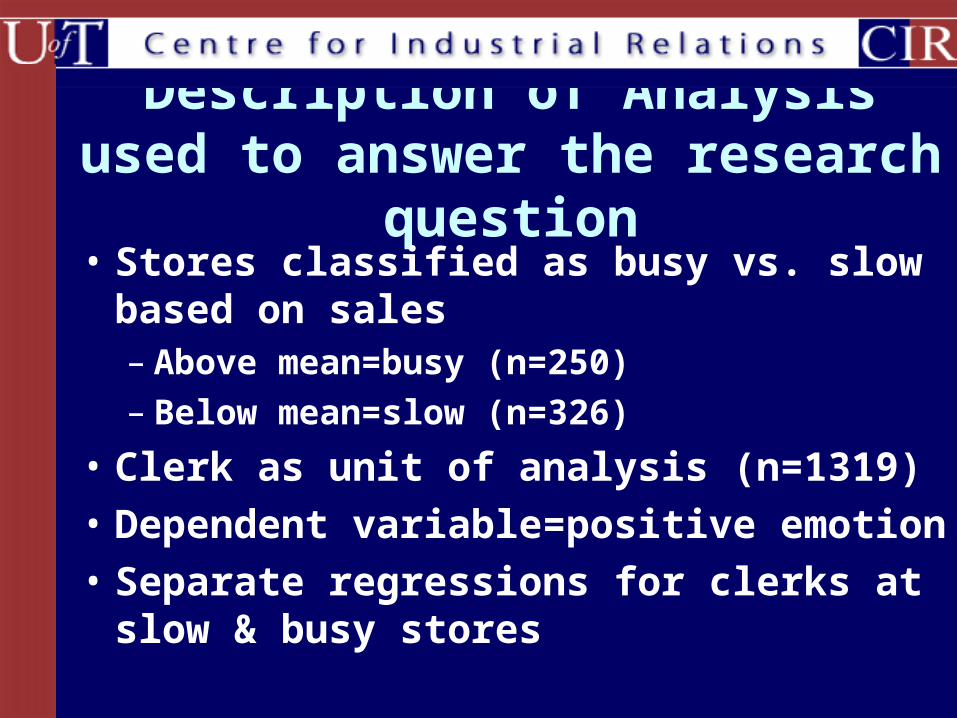
Description of Analysis used to answer the research question
• Stores classified as busy vs. slow based on sales – Above mean=busy (n=250)– Below mean=slow (n=326)
• Clerk as unit of analysis (n=1319)
• Dependent variable=positive emotion
• Separate regressions for clerks at slow & busy stores
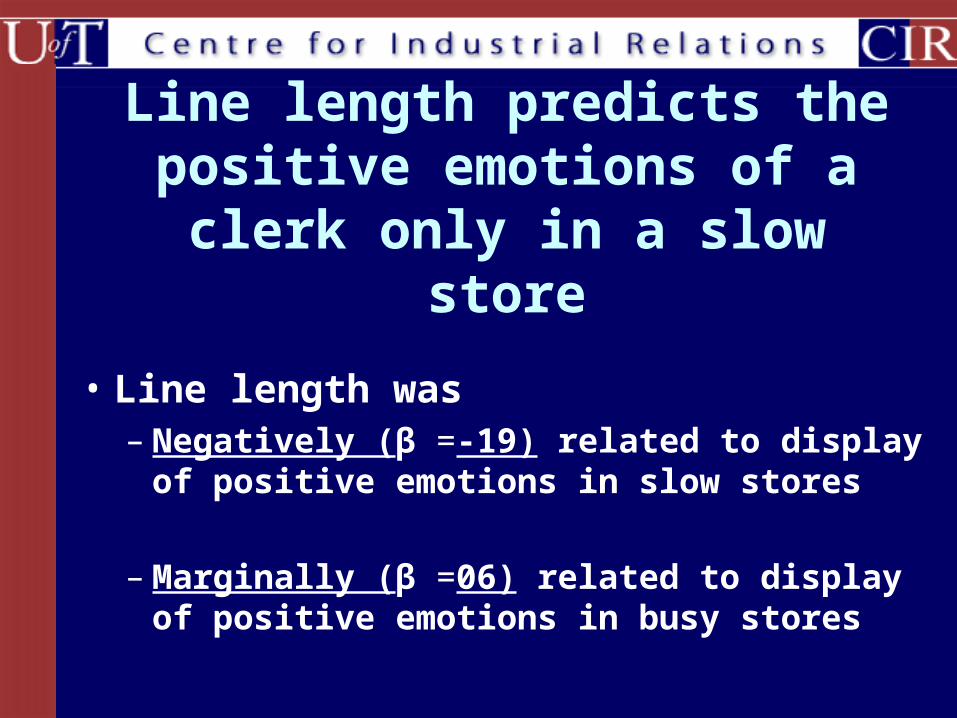
• Line length was– Negatively (β =-19) related to display of
positive emotions in slow stores
– Marginally (β =06) related to display of positive emotions in busy stores
Line length predicts the positive emotions of a clerk
only in a slow store
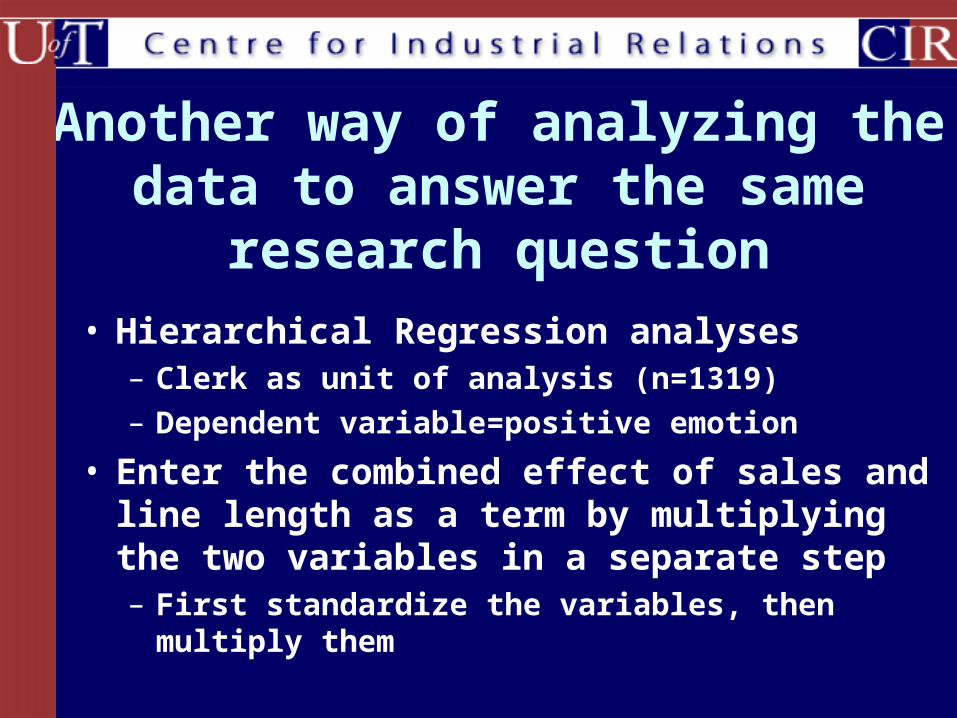
Another way of analyzing the data to answer the same research
question
• Hierarchical Regression analyses– Clerk as unit of analysis (n=1319)– Dependent variable=positive emotion
• Enter the combined effect of sales and line length as a term by multiplying the two variables in a separate step– First standardize the variables, then multiply them
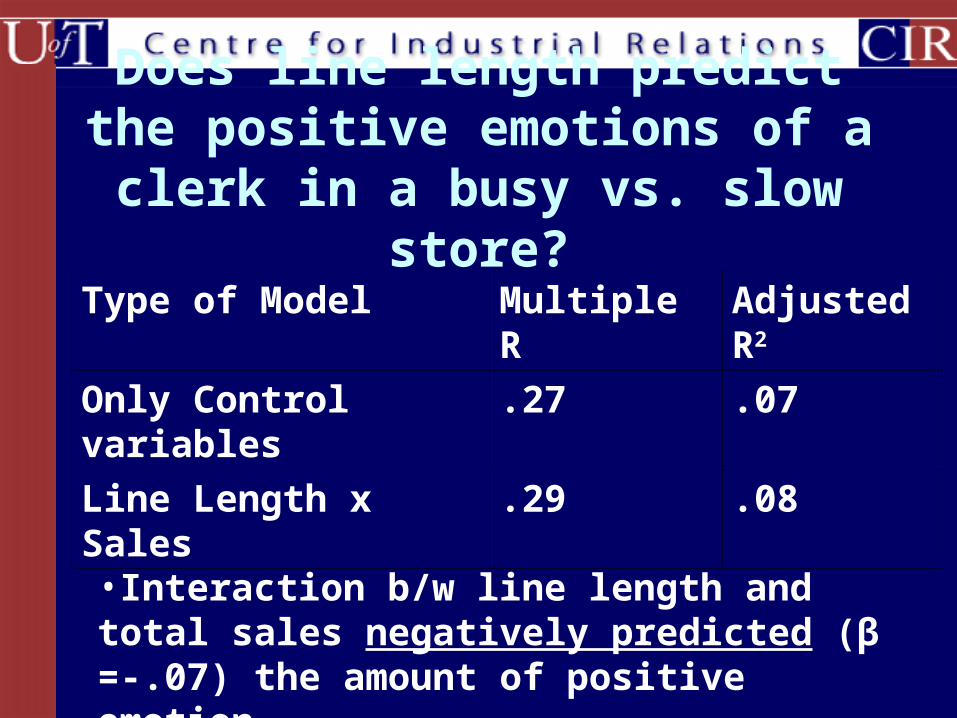
Type of Model Multiple R Adjusted R2
Only Control variables .27 .07
Line Length x Sales .29 .08
•Interaction b/w line length and total sales negatively predicted (β =-.07) the amount of positive emotion
Does line length predict the positive emotions of a clerk in a
busy vs. slow store?
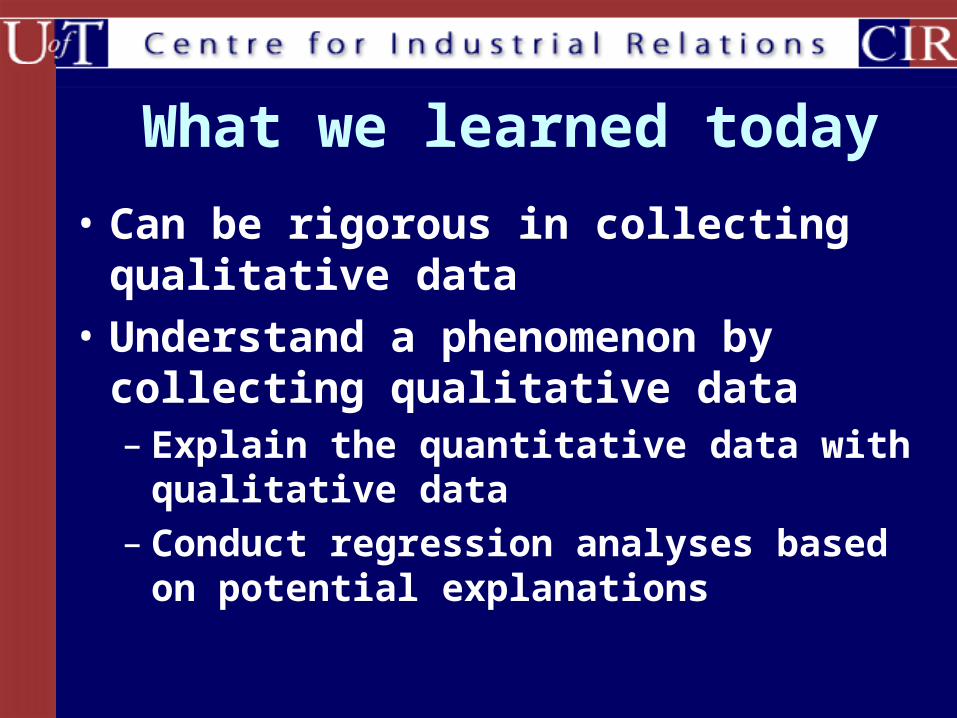
What we learned today
• Can be rigorous in collecting qualitative data
• Understand a phenomenon by collecting qualitative data – Explain the quantitative data with qualitative
data– Conduct regression analyses based on
potential explanations